Article

Experimental Study on Damage Constitutive Model of Rock under Thermo-Confining Pressure Coupling

1
Department of Hydraulic Engineering, College of Civil Engineering, Tongji University, Shanghai 200092, China
2
Department of Bridge Engineering, College of Civil Engineering and Architecture, East China Jiaotong University, Nanchang 330013, China
*
Author to whom correspondence should be addressed.
Appl. Sci. 2024, 14(19), 9122; https://doi.org/10.3390/app14199122
Submission received: 7 August 2024 / Revised: 23 August 2024 / Accepted: 1 October 2024 / Published: 9 October 2024
(This article belongs to the Special Issue Effects of Temperature on Geotechnical Engineering)

Abstract

:
Underground engineering frequently encounters the challenges of high temperatures and high confining pressures. The combined effects of temperature and confining pressure can significantly alter the mechanical properties of rock. Evaluating the impact of these factors on rock is a crucial aspect of engineering. This study investigates the mechanical properties of rocks under various temperature and stress conditions, focusing on the deformation and failure characteristics of four typical rock types: granite, red sandstone, gray sandstone, and shale under temperature-confining pressure coupling. The results indicate that high temperatures cause internal structural damage and crack propagation in rocks, leading to a reduction in compressive strength and elastic modulus. Conversely, high confining pressures can inhibit crack propagation and enhance rock deformation capacity. Additionally, significant differences were observed in the mechanical responses of different rocks; red sandstone and shale predominantly exhibited shear failure under the coupled effects of temperature and confining pressure, whereas granite and gray sandstone exhibited bulging failure. Based on the experimental results, an elastic modulus fitting model considering the temperature-confining pressure coupling effect was proposed, and the parameters of the Drucker–Prager criterion were modified. A constitutive model was constructed to accurately reflect the stress–strain state of rocks under the coupled effects of temperature and confining pressure. The constitutive model results show good agreement with the experimental findings.

1. Introduction

In geological environments, confining stress and temperature are two primary factors. Deep underground engineering often operates under high confining stress and elevated temperatures. The mechanisms of disaster formation in underground engineering are highly complex and differ significantly from the basic properties of rock under normal conditions. On the one hand, high temperatures typically cause damage to microstructures and expansion of fractures within the rock, which reduces the rock’s stiffness, leading to a decrease in compressive strength and elastic modulus [1]. On the other hand, confining pressure alters the pore structure of the rock, induces new cracks, and significantly changes the properties of the rock.
Several scholars have studied the effects of temperature on the physical and mechanical properties of various rocks, summarizing and analyzing the changes in these properties with temperature variation [2,3,4]. Some researchers have used X-ray computed tomography (CT) technology to study the effects of temperature on the heterogeneity and anisotropy of granite. They observed that the porosity of granite increases with temperature after high-temperature treatment, and its heterogeneity and anisotropy also increase with temperature, with initial cracks below 200 °C having the most significant impact [5]. Moreover, as the temperature rises, the mineral particles in rock samples fracture and decompose, causing significant changes in the elastic modulus [1,6,7]. Under low-temperature conditions, the elastic modulus of rocks increases linearly with decreasing temperature, while Poisson’s ratio remains unchanged [8]. Compared to high temperatures, high confining pressures can inhibit crack propagation and damage evolution, causing the failure characteristics of rocks to gradually transition from brittle to ductile failure [9,10]. Triaxial compression tests reveal that different confining pressure conditions significantly affect the mechanical and deformation characteristics of rocks [11]. Compressive strength and elastic modulus increase with confining pressure [12], primarily because increased confining pressure suppresses rock expansion, alters crack propagation paths [13], and thereby affects mechanical parameters, microcrack distribution, and energy evolution laws [14]. Based on these foundations, researchers have used analytical methods to calculate the equivalent elastic modulus of fractured rocks with random discrete fractures and regular fractures under confining pressure, providing a better evaluation of the deformation behavior of fractured rock masses [15]. Considering the combined effects of temperature and confining pressure, triaxial compression tests under different confining pressures and temperatures explore the impacts of these factors on the mechanical and deformation characteristics of rocks [16]. Increased confining pressure significantly enhances the compressive strength and elastic modulus of rocks [17], while the elastic modulus exhibits nonlinear changes with temperature [18]. The effects of temperature and confining pressure on rocks are coupled [19], causing significant changes in the microstructure of rocks [20]. Microcracks develop differently in various rock types [21,22], leading to significant differences in rock properties.
Based on the principles and results of field tests, the relationship between rock elastic modulus and other geotechnical parameters (such as joint distribution, continuity, deformation mode, and stiffness [23]) can be analyzed. By combining the strain energy theory of continuum mechanics and fracture mechanics [24], relevant parametric models can be established to describe changes in the elastic modulus [25], thereby determining the typical range of rock elastic deformation capacity [26]. Using continuum damage theory and introducing a Weibull distribution to describe the evolution of damage variables [27], the rock stress–strain curve can be divided into four stages: undamaged loading, stable damage propagation, intensified damage propagation, and stable damage propagation to saturation. Based on the analysis of the elastic modulus, a thermo-mechanical coupled damage constitutive model for rocks can be developed [28]. Researchers have also established constitutive models for different types of rocks based on this foundation [29,30], which hold significant implications for practical engineering and rock mechanics research.
The aforementioned research has made significant contributions to the analysis of the mechanical properties of rocks under the coupled effects of temperature and confining pressure. However, there are still some limitations. The current studies involve a relatively limited range of rock types, and research on rocks under the coupled effects of temperature and confining pressure often employs high-temperature pretreatment followed by conventional triaxial tests in the laboratory. This approach makes it difficult to accurately reflect the real-time stress–strain response of rocks under high-temperature and high-pressure conditions. Moreover, the failure structure models of rocks under the coupled effects of temperature and confining pressure remain underexplored, and the selected probabilistic microelement strength models and strength criteria are relatively simplistic. In addition, in the existing structural models, the elastic modulus is often fitted using polynomial functions, which hinders a detailed description of the elastic modulus development trend for specific rock masses. Furthermore, the comprehensive effects of temperature and confining pressure on the elastic modulus have not been fully considered.
Therefore, this study employs a combined approach of laboratory experiments and theoretical calculations to investigate the room temperature uniaxial compression tests and conventional triaxial compression tests of four typical rocks under the coupled effects of temperature and confining pressure: granite, red sandstone, gray sandstone, and shale. The research aims to explore the deformation evolution and failure characteristics of these four types of rocks under the combined influence of temperature and confining pressure. A fitting model for the elastic modulus of rocks under these coupled conditions is proposed, and the parameters of the Drucker–Prager criterion are revised to reflect the effects of temperature and confining pressure. Additionally, a constitutive model is constructed to accurately capture the stress–strain state of rocks under these combined effects, providing insights into rock deformation characteristics that align with practical engineering conditions.

2. Experimental Program

2.1. Specimen Preparation

The primary focus of this study is on four typical types of rocks: granite, red sandstone, gray sandstone, and shale. Before conducting triaxial compression experiments, uniaxial compression tests were first performed on these four rock types to obtain their peak strengths and average uniaxial compressive strengths.
For the uniaxial compression experiments, the surface of the rock samples and the instrument joints were cleaned. The rock samples were then encased in FEP heat shrink tubing. Due to its high toughness, temperature resistance, and immunity to chemicals such as oil, this material can effectively prevent hydraulic silicone oil from infiltrating the rock samples during the experiment when heated with a heat gun, as shown in Figure 1a. After placing the rock samples, circumferential and axial strain gauges were sequentially installed on the samples, and loading was applied, as illustrated in Figure 1b.
The compressive strength of rock exhibits dispersion and follows a normal distribution. Therefore, based on the relevant theories of material mechanics, the standard compressive strength values for the four types of rocks were calculated. In order to ensure that the rock samples are within the elastic phase during the loading process under different working conditions, 70% of the standard compressive strength value was chosen as the stress limit for this experiment. The results of the uniaxial compression tests and the selected stress limits for the four types of rocks are shown in Table 1.

2.2. Testing System

The experiment used the GCTS high-temperature and high-pressure true triaxial testing servo apparatus at Tongji University, as depicted in Figure 2. This apparatus comprises an operational control system and a triaxial load application module, equipped with sensors for displacement, load, and temperature. These sensors accurately capture data on axial stress and strain, radial strain, confining pressure, and temperature. The primary parameters are as follows: a maximum confining pressure of 60 MPa, a maximum axial pressure of 500 MPa, a stress accuracy of 0.01 MPa, and a deformation accuracy of 0.001 mm. The apparatus can record various mechanical parameters of rock under temperature-stress coupling in real-time and simultaneously plot stress–strain curves.

2.3. Test Procedure

This experiment involves conventional triaxial tests under various temperature and confining pressure conditions. Based on the studied stratum distribution, the test temperatures are set at five levels: 20 °C, 40 °C, 60 °C, 80 °C, and 120 °C, and the confining pressures are set at six levels: 0 MPa, 5 MPa, 10 MPa, 15 MPa, 20 MPa, and 25 MPa. Relevant studies indicate that thermal cracking in granite within the range of 100 °C to 500 °C does not cause structural damage [31], and the effects of temperature and cyclic loading can reinforce rock samples under certain conditions [32]. This reinforcement phenomenon is present in most rock types [31,33]. Some studies suggest that mild temperatures [31] or cyclic loading [33,34] have a hardening effect on rocks. Triaxial loading and unloading tests on some rocks reveal minimal strain differences during loading and unloading, with a maximum difference of only 6.96% [35]. Moreover, the peak stress (σf′) obtained from the triaxial cyclic loading and unloading tests is similar to the peak stress (σf) obtained from the triaxial compression tests. Before reaching the peak stress, the number of loading and unloading cycles at high-stress levels is relatively low. As a result, cyclic loading before peak stress has minimal impact on the peak stress of the rock [36]. Based on these research results, the following basic steps are used in this experiment:
(1)
The standard granite sample was securely enclosed in a specialized fluoro rubber sleeve to prevent hydraulic oil infiltration, ensuring test accuracy. After clearing debris from the steel block connections, the rock core was placed flat with end blocks at both ends. The axial strain gauge was carefully adjusted to its proper position, and the circumferential strain gauge was installed at the center of the specimen. A slight touch confirmed proper connection by displaying minimal displacement on the computer. Initial values were then set on the computer.
(2)
Using the GCTS high-temperature and high-pressure rock triaxial apparatus, the rock samples were subjected to an initial confining pressure state (σ2 = σ3 of 0 MPa) and maintained consistently. In this experiment, the loading was controlled by a fixed axial displacement rate. The loading rate was set to 0.03 mm/min in the computer software control system, and the stress limit was set to 70% of the standard uniaxial compressive strength of the rock samples at room temperature [37]. When the axial stress reached the preset stress limit, the system automatically stopped loading. Subsequently, the confining pressure and stress were unloaded to 0 MPa. During the loading process, the system continuously collects and records the stress and strain values of the rock sample in real-time. Peak strength, residual strength, axial strain, and circumferential strain are directly obtained from the recorded data. The real-time stress–strain curve is monitored to ensure that the test data meet the requirements of this study.
(3)
Repeat step (2), applying initial confining pressures of σ2 = σ3 at 5 MPa, 10 MPa, 15 MPa, 20 MPa, and 25 MPa. Complete the triaxial compression tests at 20 °C under different confining pressure conditions.
(4)
After unloading the confining pressure and stress to 0 MPa, the hydraulic oil in the pressure chamber was heated to the preset temperature of 40 °C using the temperature control system of the GCTS high-temperature, high-pressure rock triaxial apparatus. The temperature was maintained for a period of time to ensure uniform heating of the specimen. Once the temperature stabilized, steps (2) and (3) were repeated to conduct the triaxial compression test at 40 °C under different confining pressure conditions.
(5)
Repeat step (4), heating the samples to the predetermined temperatures of 60 °C, 80 °C, and 120 °C. When the experiment reaches the condition of 25 MPa confining pressure and 120 °C temperature, the loading continues until the sample fails. Complete the triaxial compression tests at 60 °C, 80 °C, and 120 °C under different confining pressure conditions.
(6)
After the sample failure, turn off the loading system and temperature control system of the triaxial apparatus. Once the temperature of the hydraulic oil in the pressure chamber drops to room temperature, unload the confining pressure, drain the hydraulic oil, and remove the samples. Observe and record the failure characteristics of the samples and organize and analyze the experimental data.

3. Results and Discussion

3.1. Failure Modes

The crack characteristics of the four types of rocks, after conventional triaxial compression failure and uniaxial compression failure under temperature-stress coupling, are shown in Figure 3. It can be observed that the failure modes of red sandstone and shale under uniaxial stress and temperature-stress coupling are primarily characterized by shear failure. Under uniaxial stress, a macroscopic through-crack typically appears on the specimen surface, accompanied by several small micro-cracks. However, under the coupling of temperature and stress, the number of micro-cracks on the specimen surface decreases, with the failure characteristics focusing on a single main crack. Additionally, the angle of the crack relative to the principal stress direction increases. This phenomenon is primarily due to the generation of thermal stress, where temperature changes within the rock induce thermal stress. The action of thermal stress can make the internal stress field of the rock more uniform, reducing stress concentration and, consequently, the number of micro-cracks. Simultaneously, the complex stress state of thermal stress and confining pressure alters the propagation direction of the main crack, increasing its angle relative to the principal stress direction. These findings indicate that the coupling effect of temperature and confining pressure significantly influences the failure modes and characteristics of red sandstone and shale.
Additionally, the failure modes of granite and gray sandstone exhibit bulging failure, with most cracks parallel to the principal stress direction under uniaxial stress. However, under the coupling of temperature and stress, the failure mode transitions to shear failure, and the shear plane of the specimen displays a “Y”-shaped shear surface. The primary reason for this is that uniaxial compression creates stress concentration zones within the rock perpendicular to the direction of the compressive stress. This stress concentration easily leads to bulging failure, characterized by expansion and cracking along the perpendicular direction. Conversely, under the combined effects of temperature and confining pressure, the internal stress field of the rock becomes more complex. Confining pressure inhibits bulging failure, while the changes in the rock at high temperatures make shear failure the primary failure mode. In this scenario, the rock is likelier to experience sliding and failure along weak planes under shear stress.
When subjected to temperature-stress coupling, the fracture surface of the specimen during failure is relatively smooth and flat. In contrast, the fracture surface under uniaxial stress appears rough and uneven. Additionally, around the fracture surface under uniaxial conditions, multiple secondary cracks parallel to the main fracture surface and a few spalled fragments can be observed.

3.2. Analysis of Mechanical Properties of Rocks

3.2.1. Analysis of Stress–Strain Curves for Different Rocks

Figure 4 and 
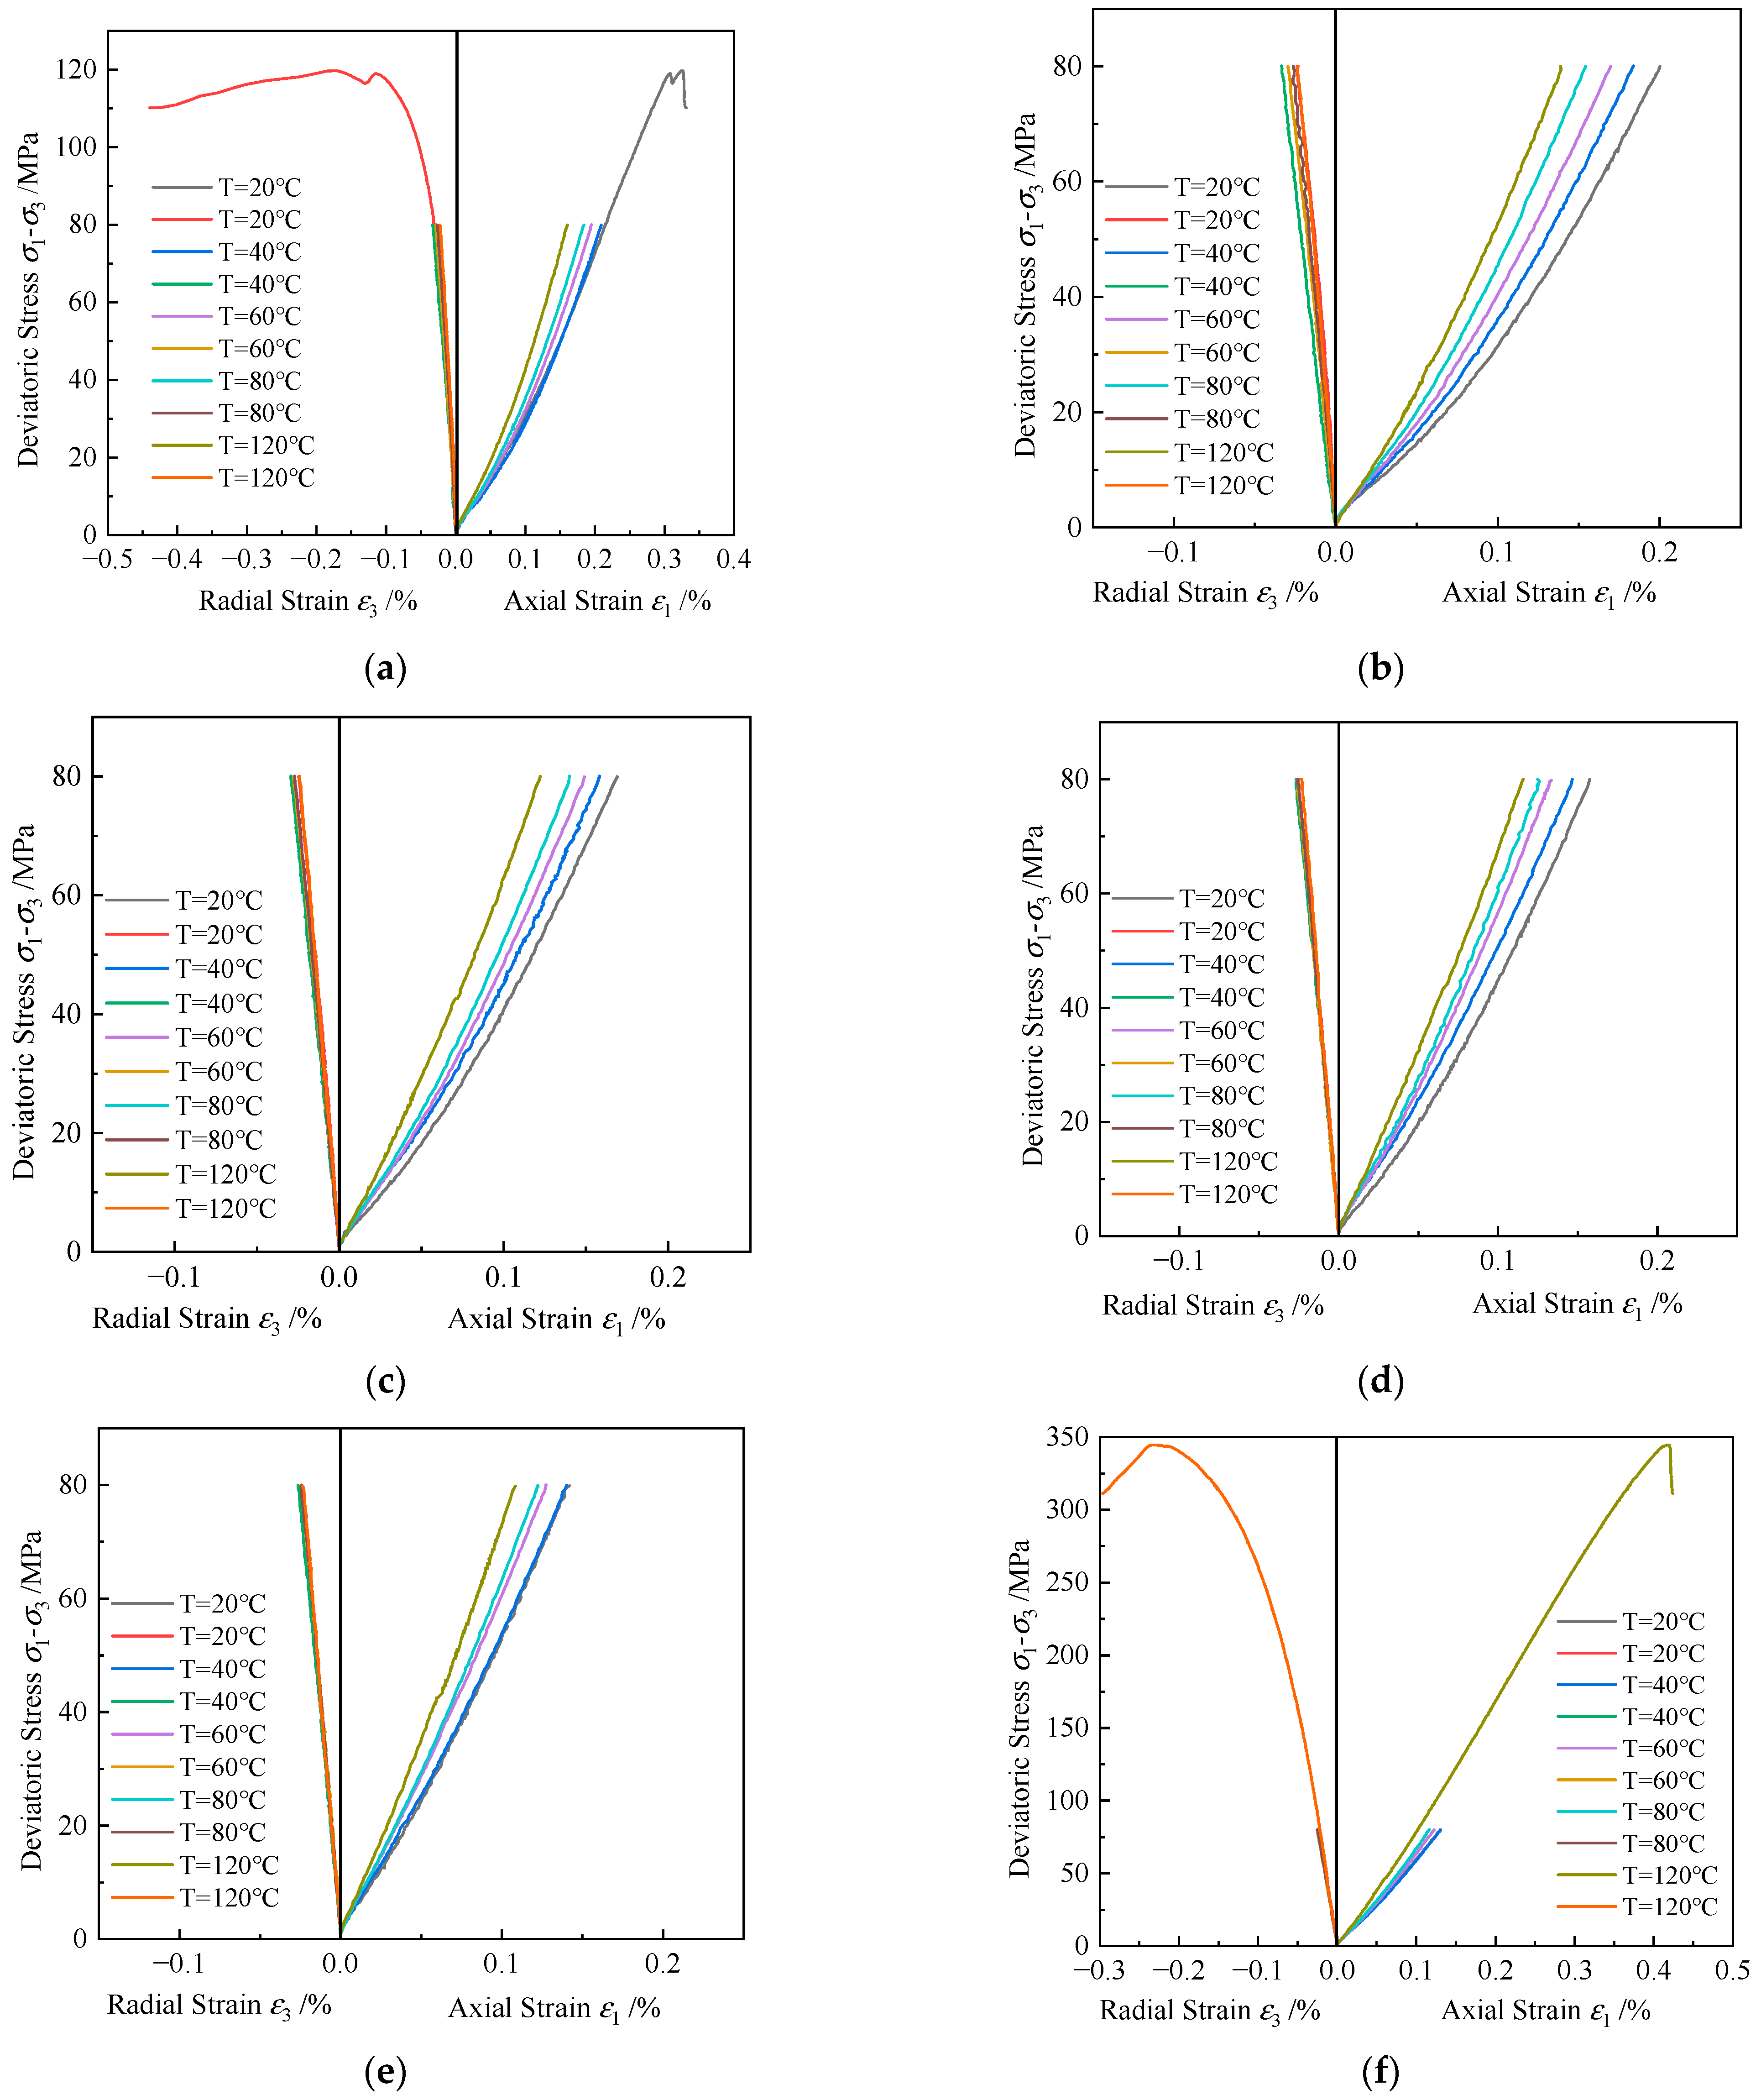
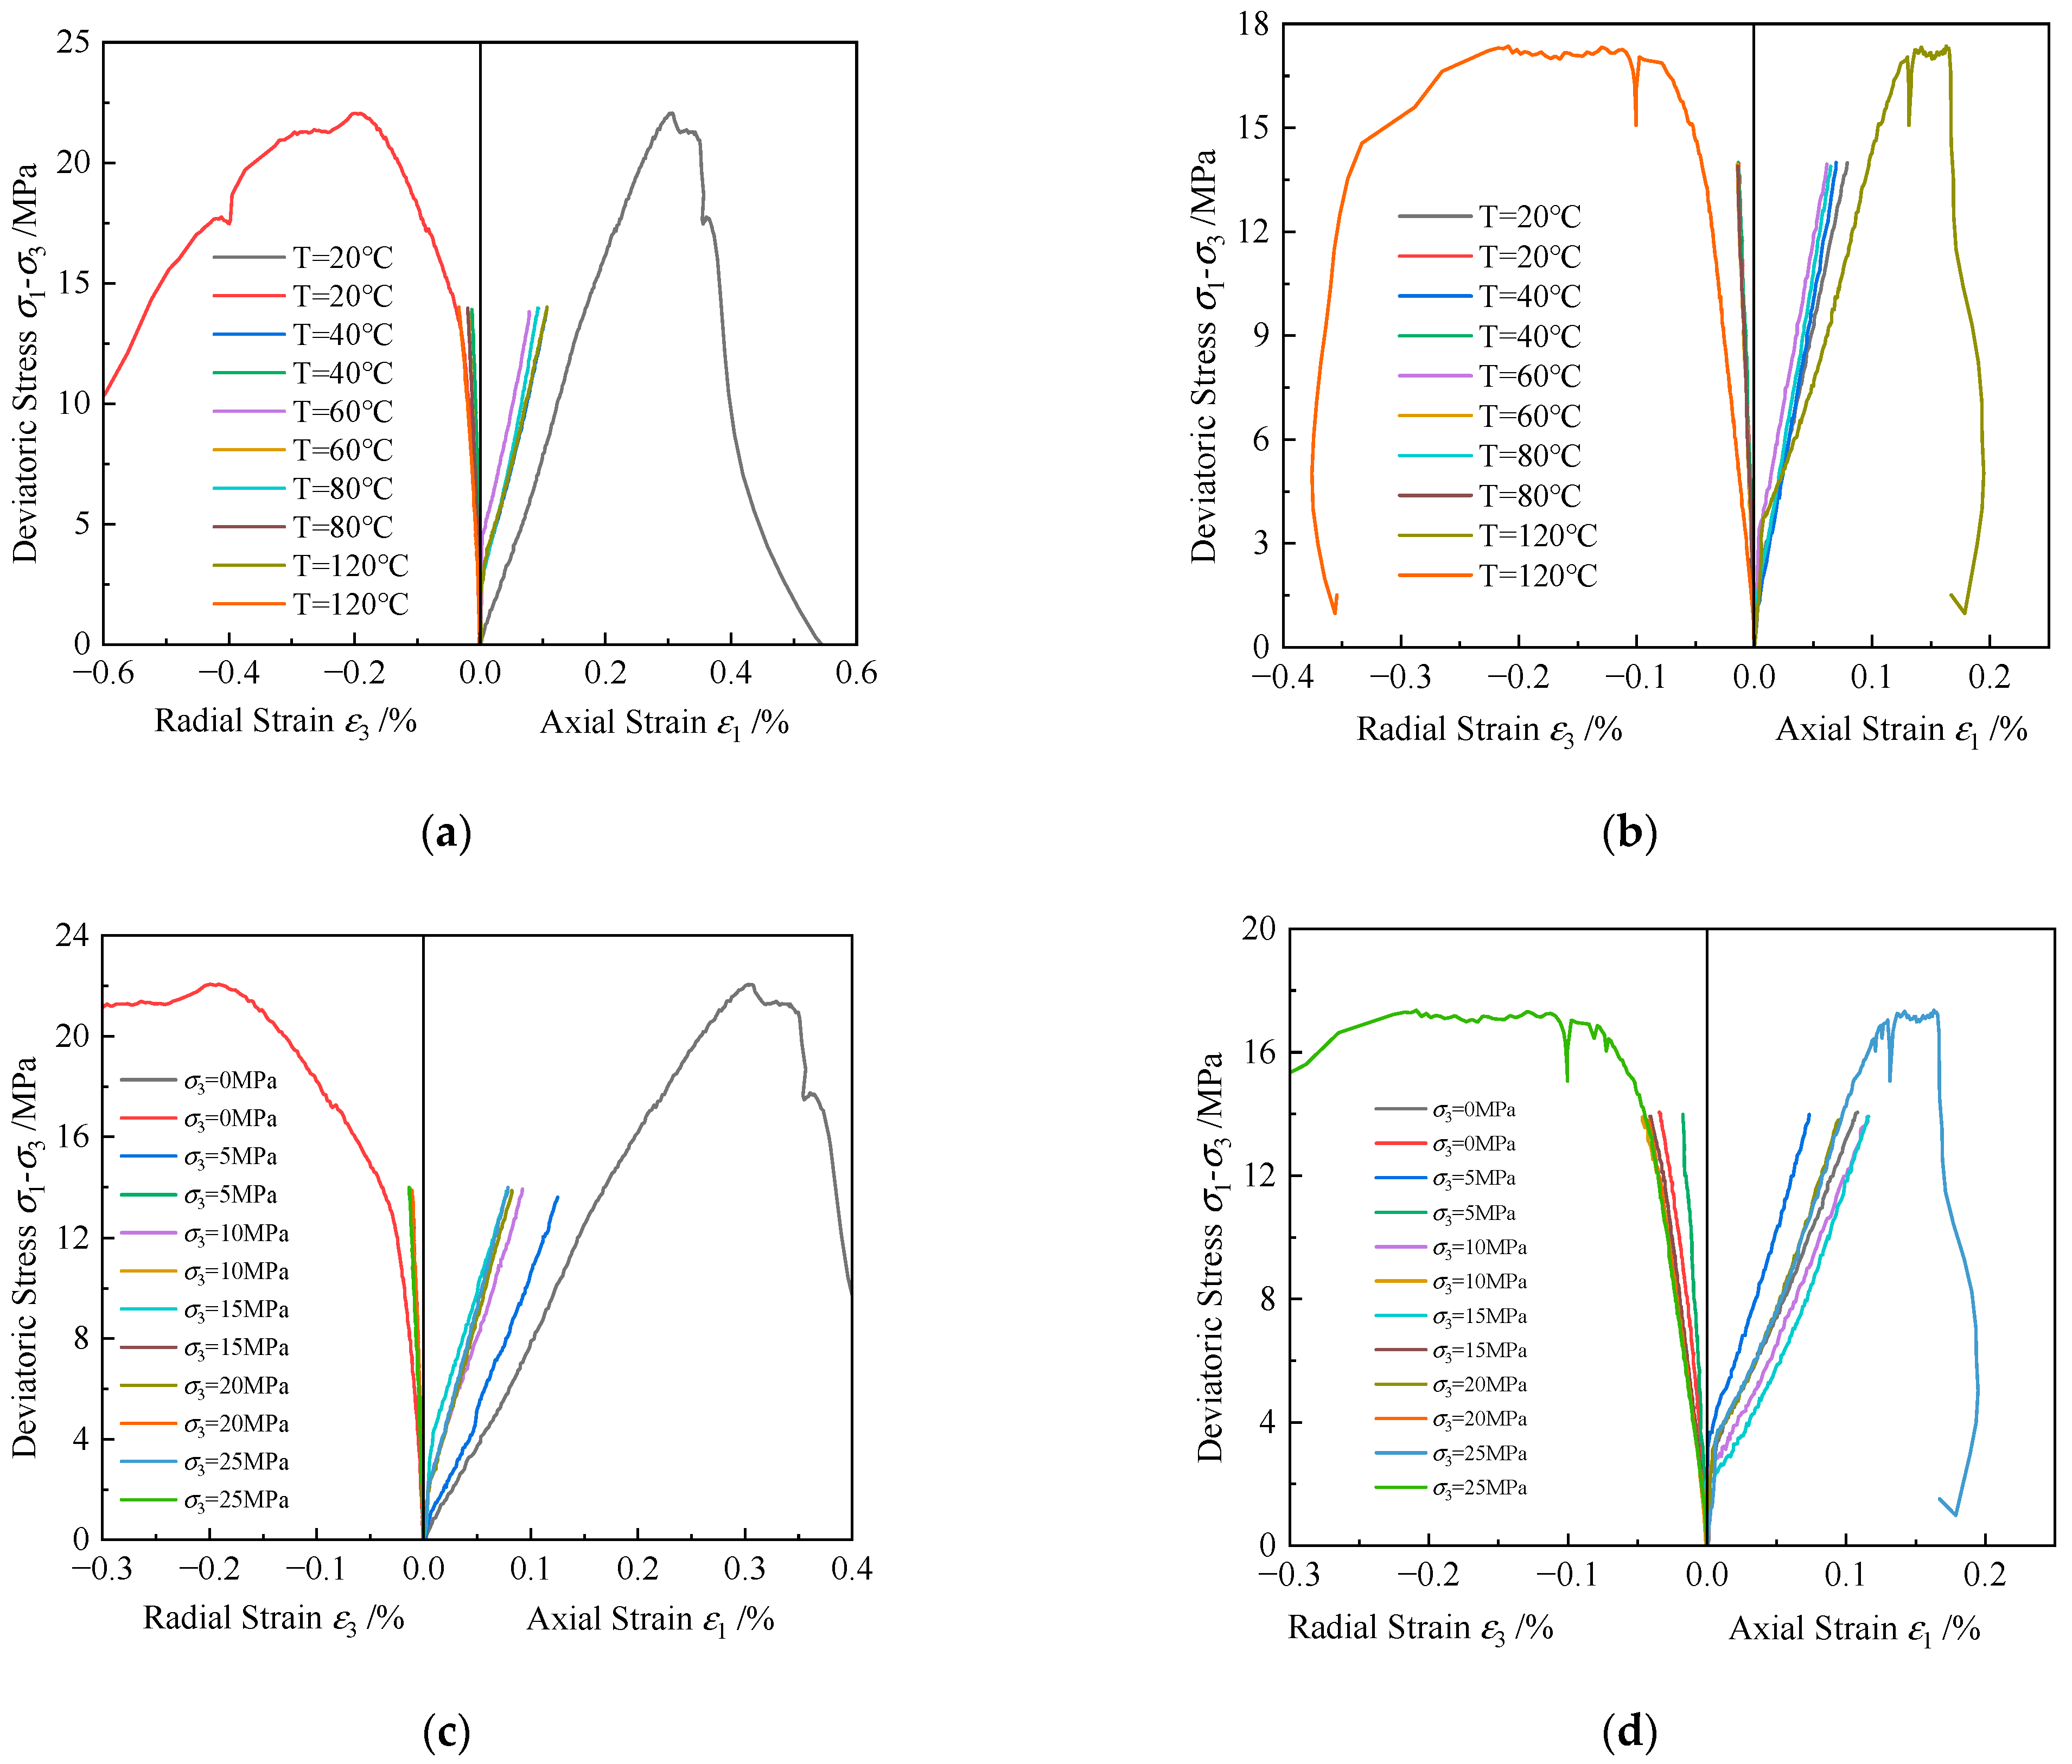
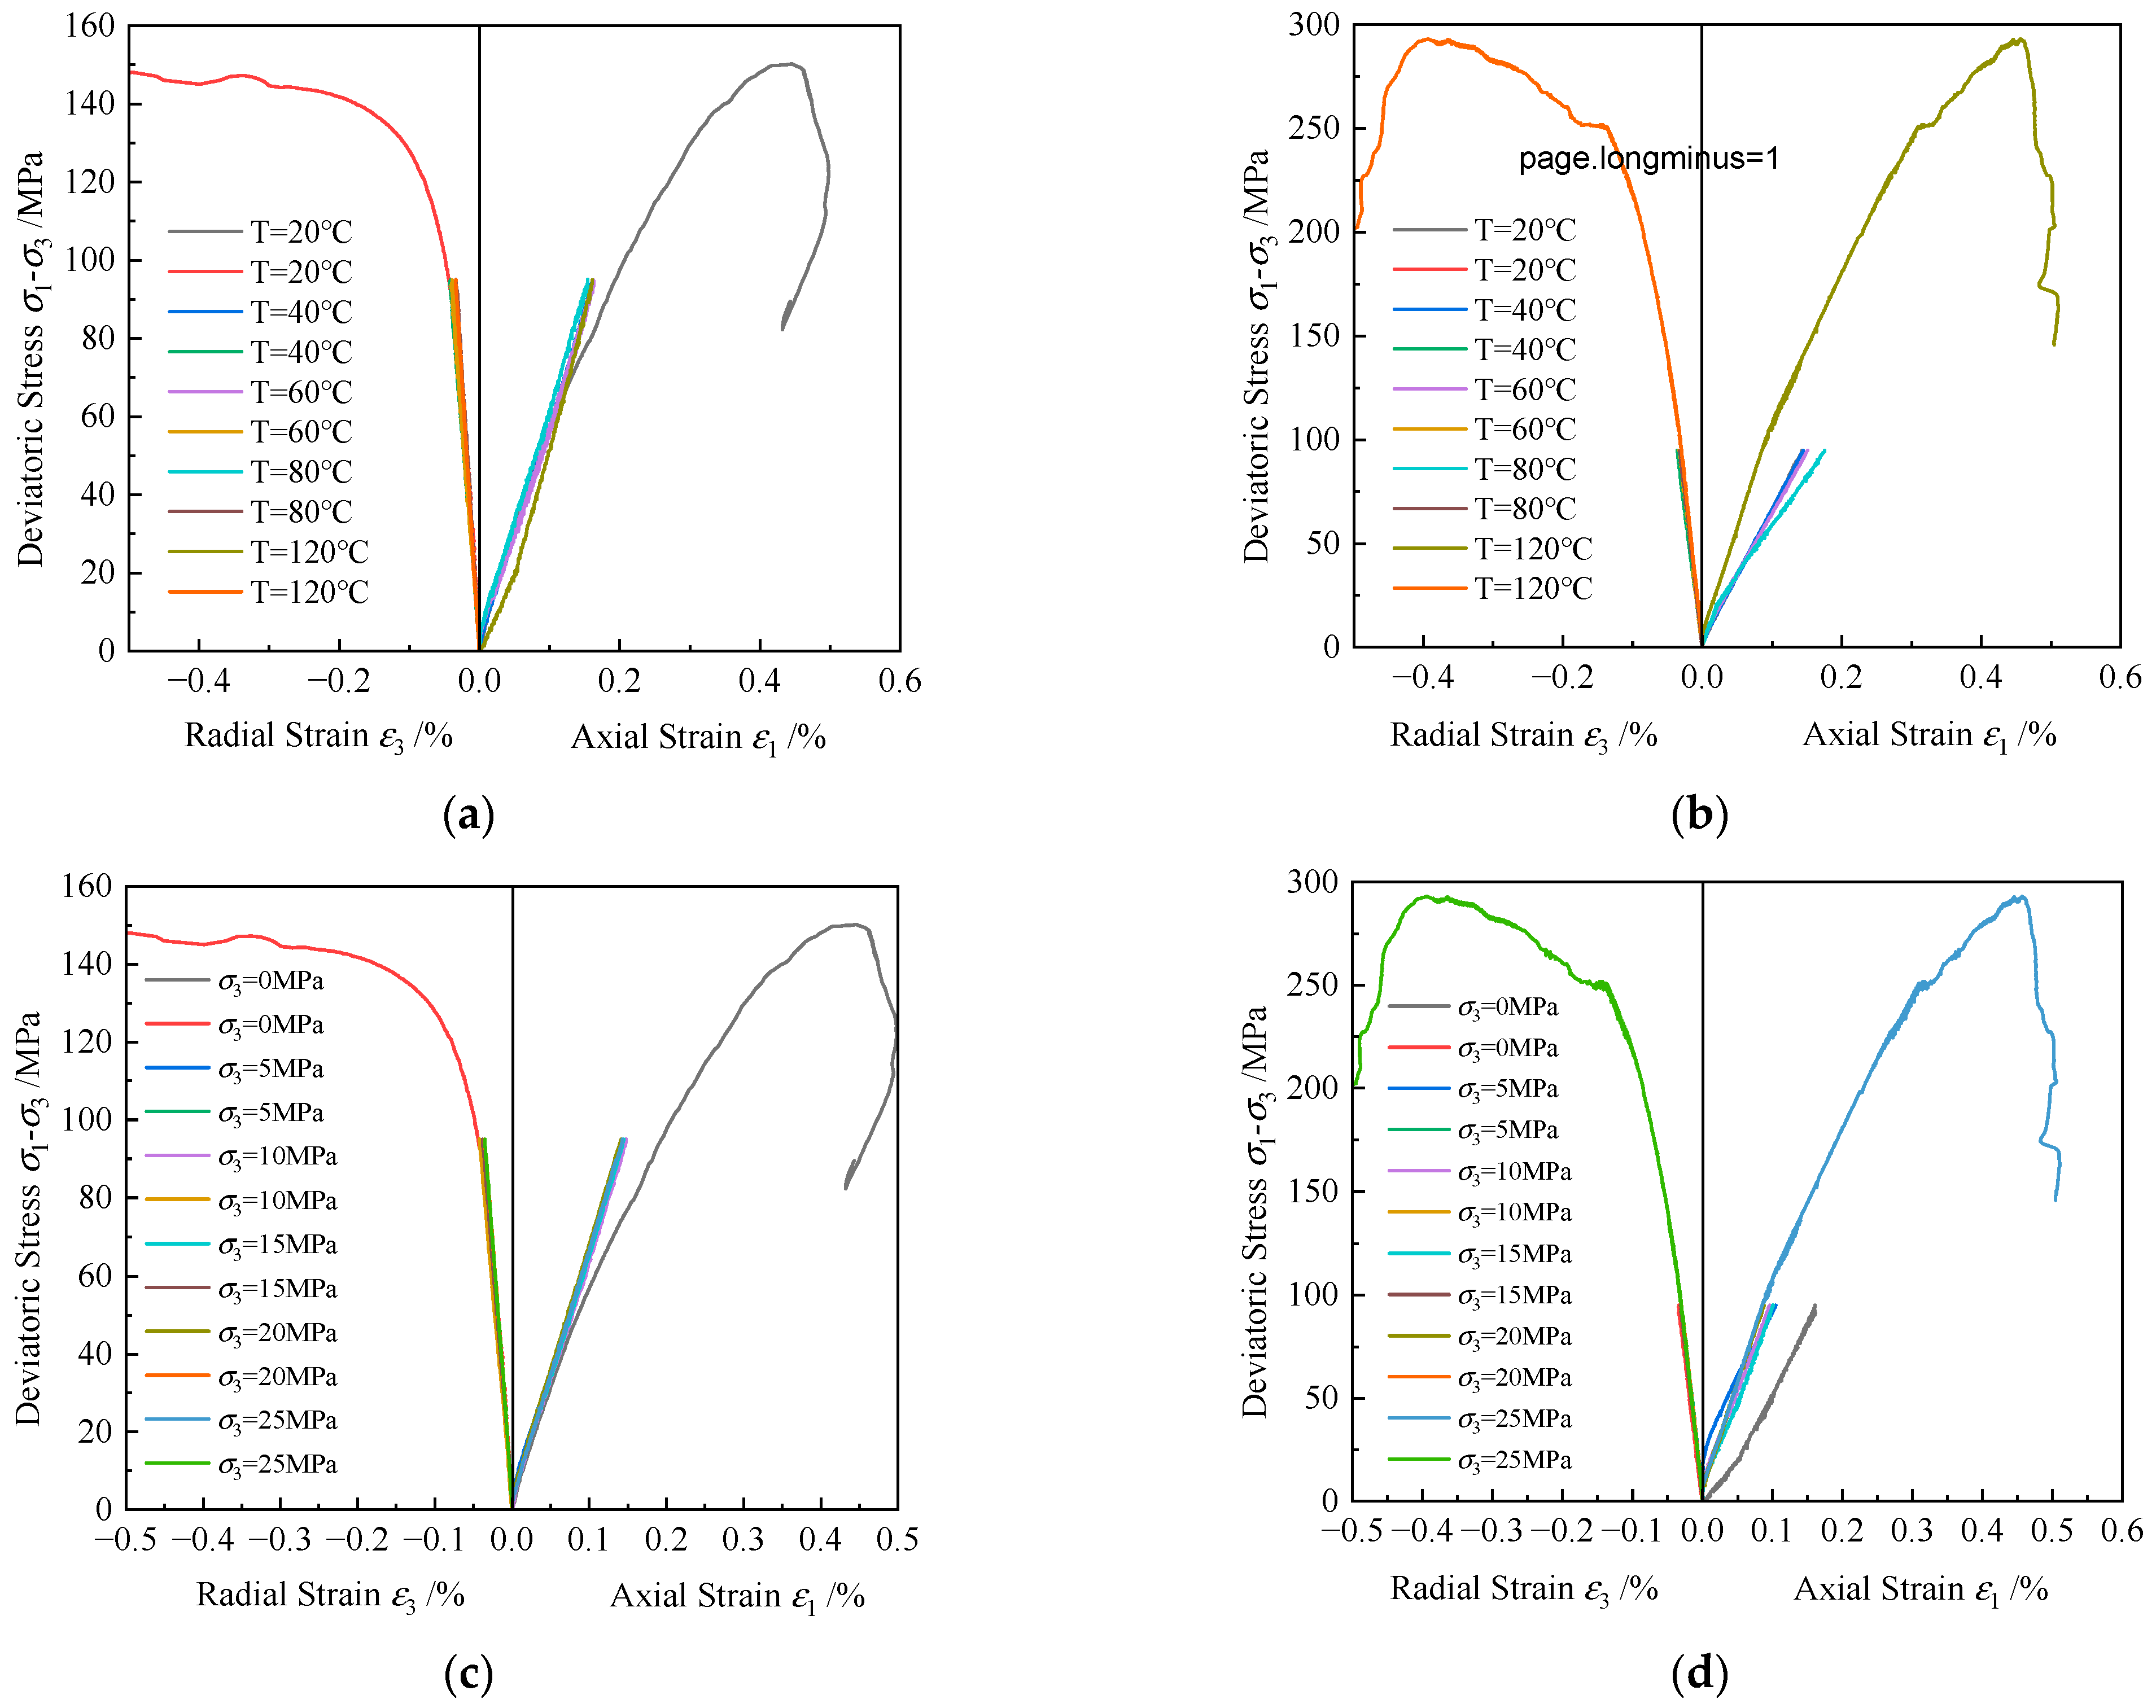
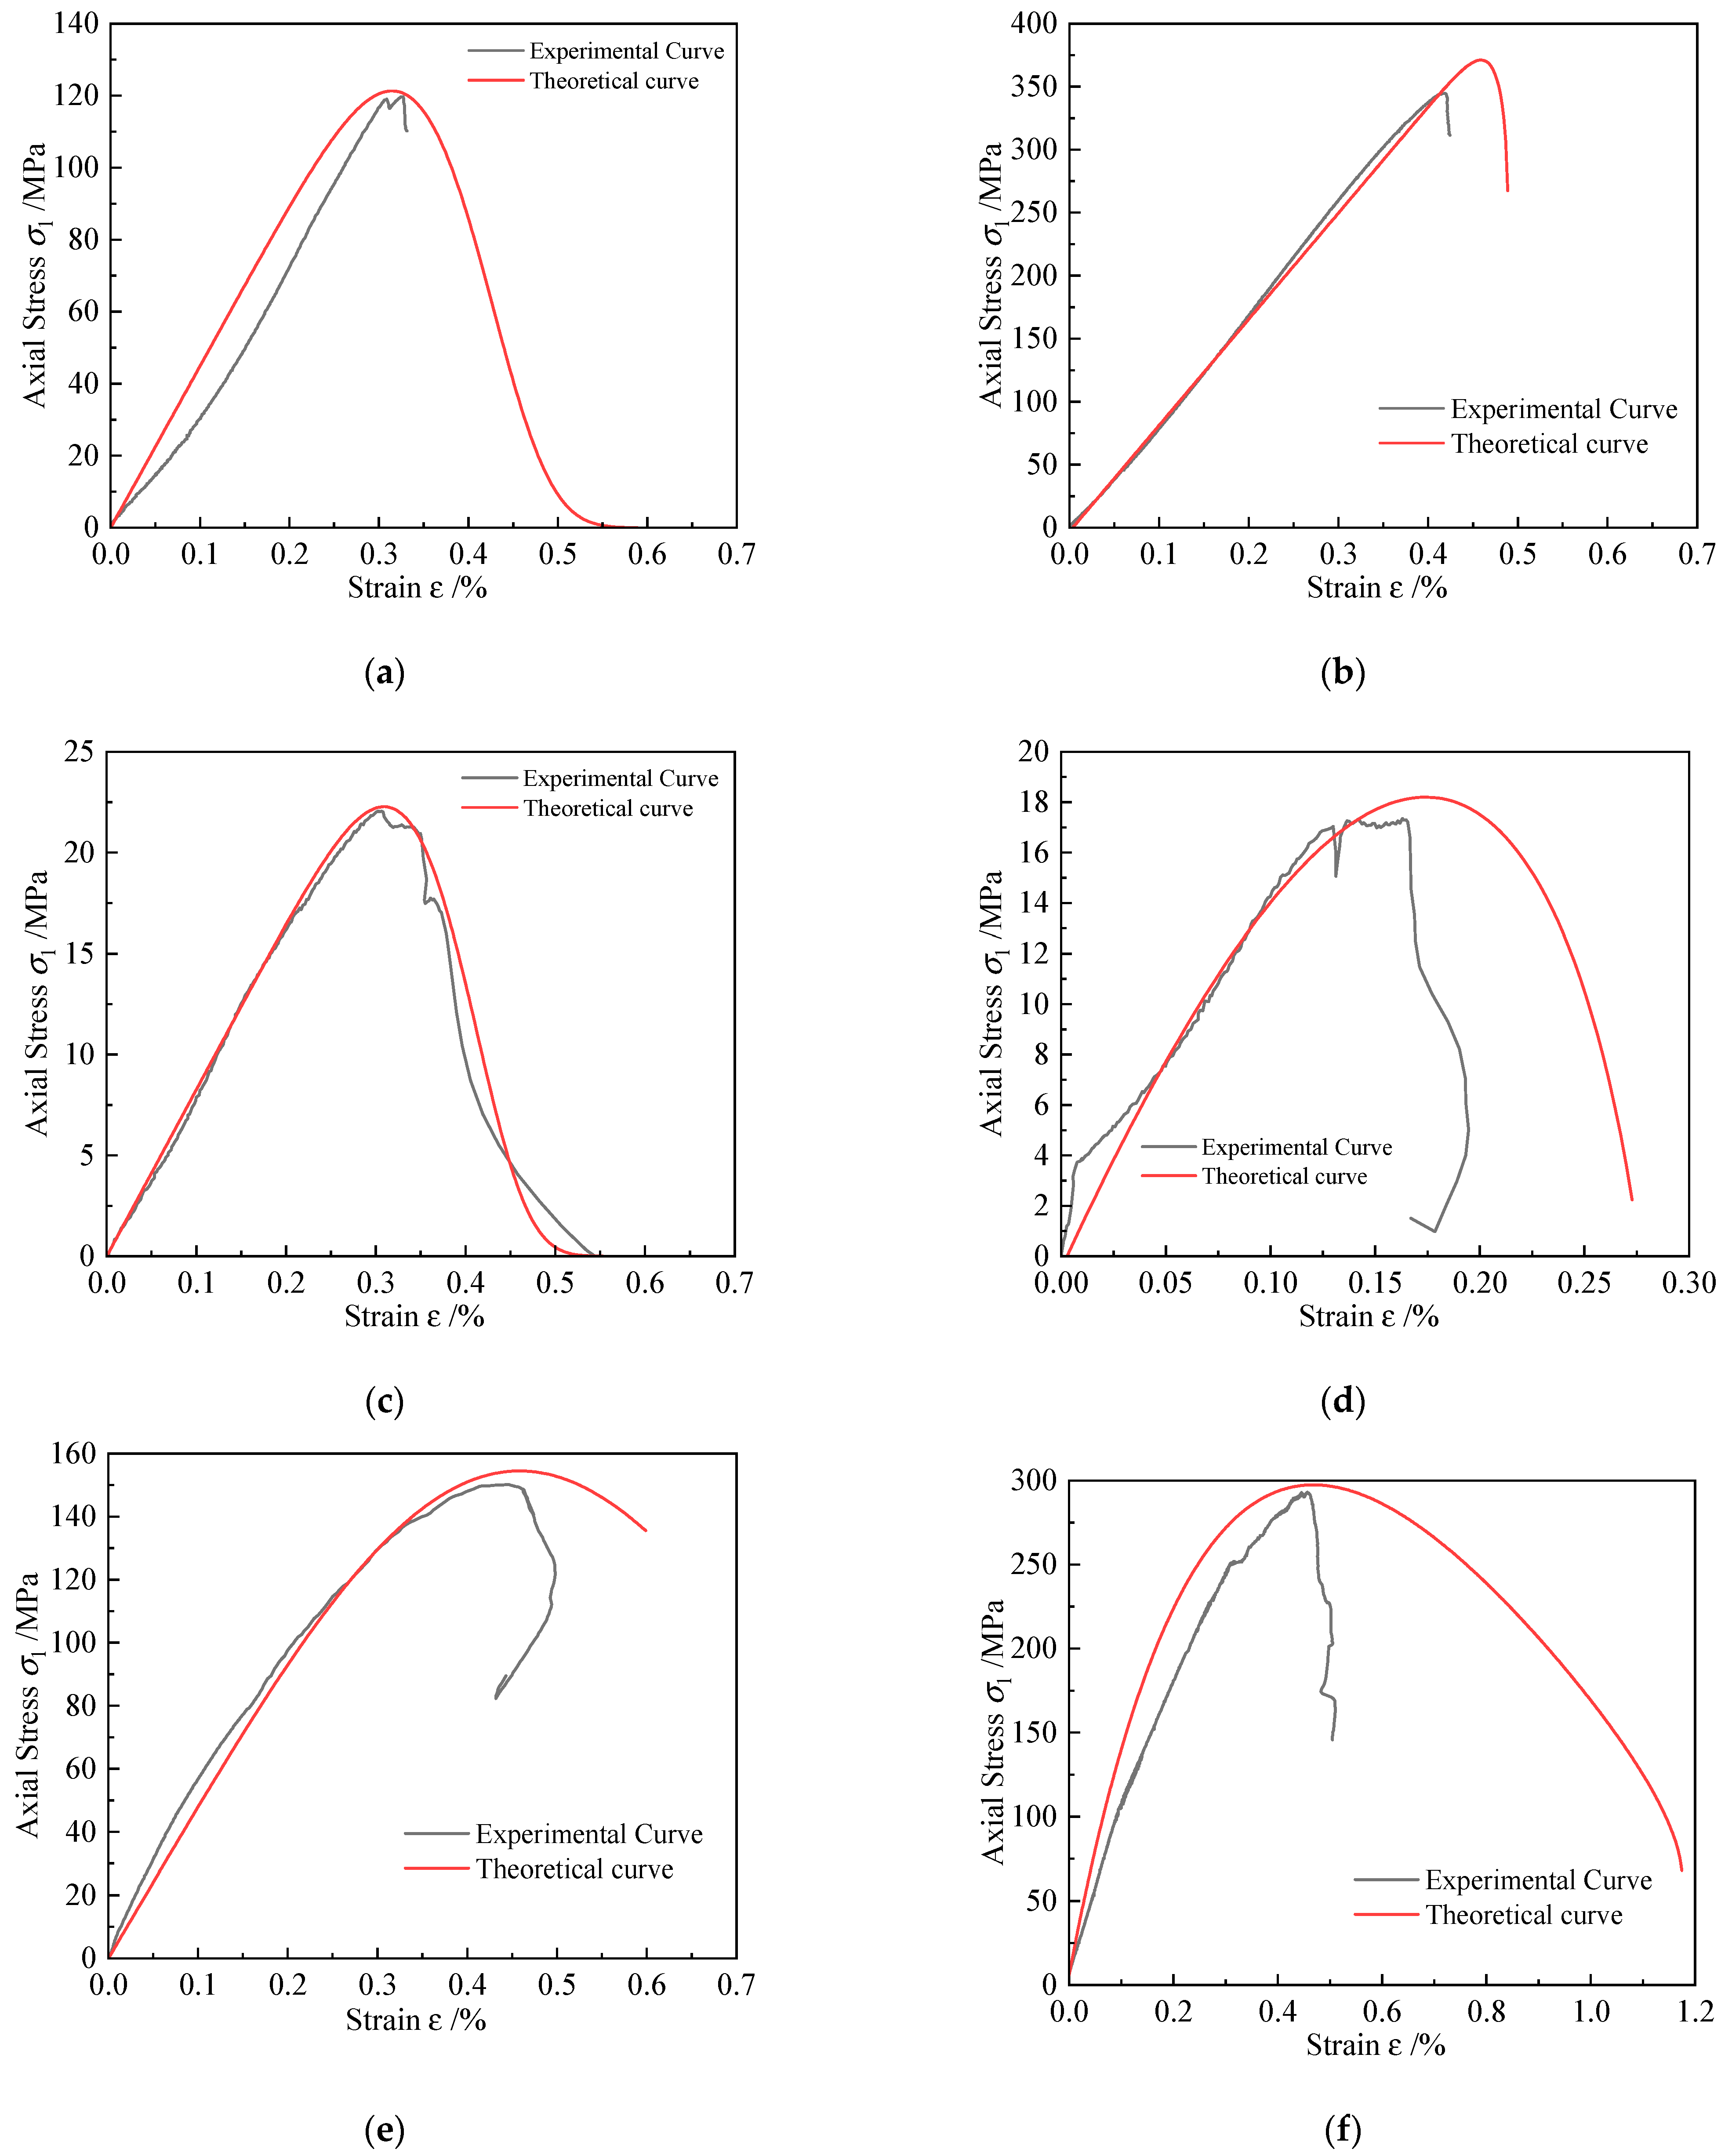
Figure 5 illustrate the stress–strain curves of granite under different temperatures and confining pressures. From Figure 4a,f, it can be observed that the yield stage of granite is not distinct, the crack development stage is short, and the stress immediately drops after reaching the peak, resulting in failure accompanied by a noticeable cracking sound, indicative of brittle failure. When granite samples are loaded to the stress limit, they remain in the elastic stage. Under the same confining pressure conditions, the slope of the curve increases with rising temperature, while the separation between the curves at different temperatures decreases as the confining pressure increases. This is primarily due to the reduction of pores between mineral particles within the microstructure of the rock sample as the confining pressure increases, and the confining effect induced by the increase in confining pressure surpasses the thermal expansion effect caused by the rise in temperature.
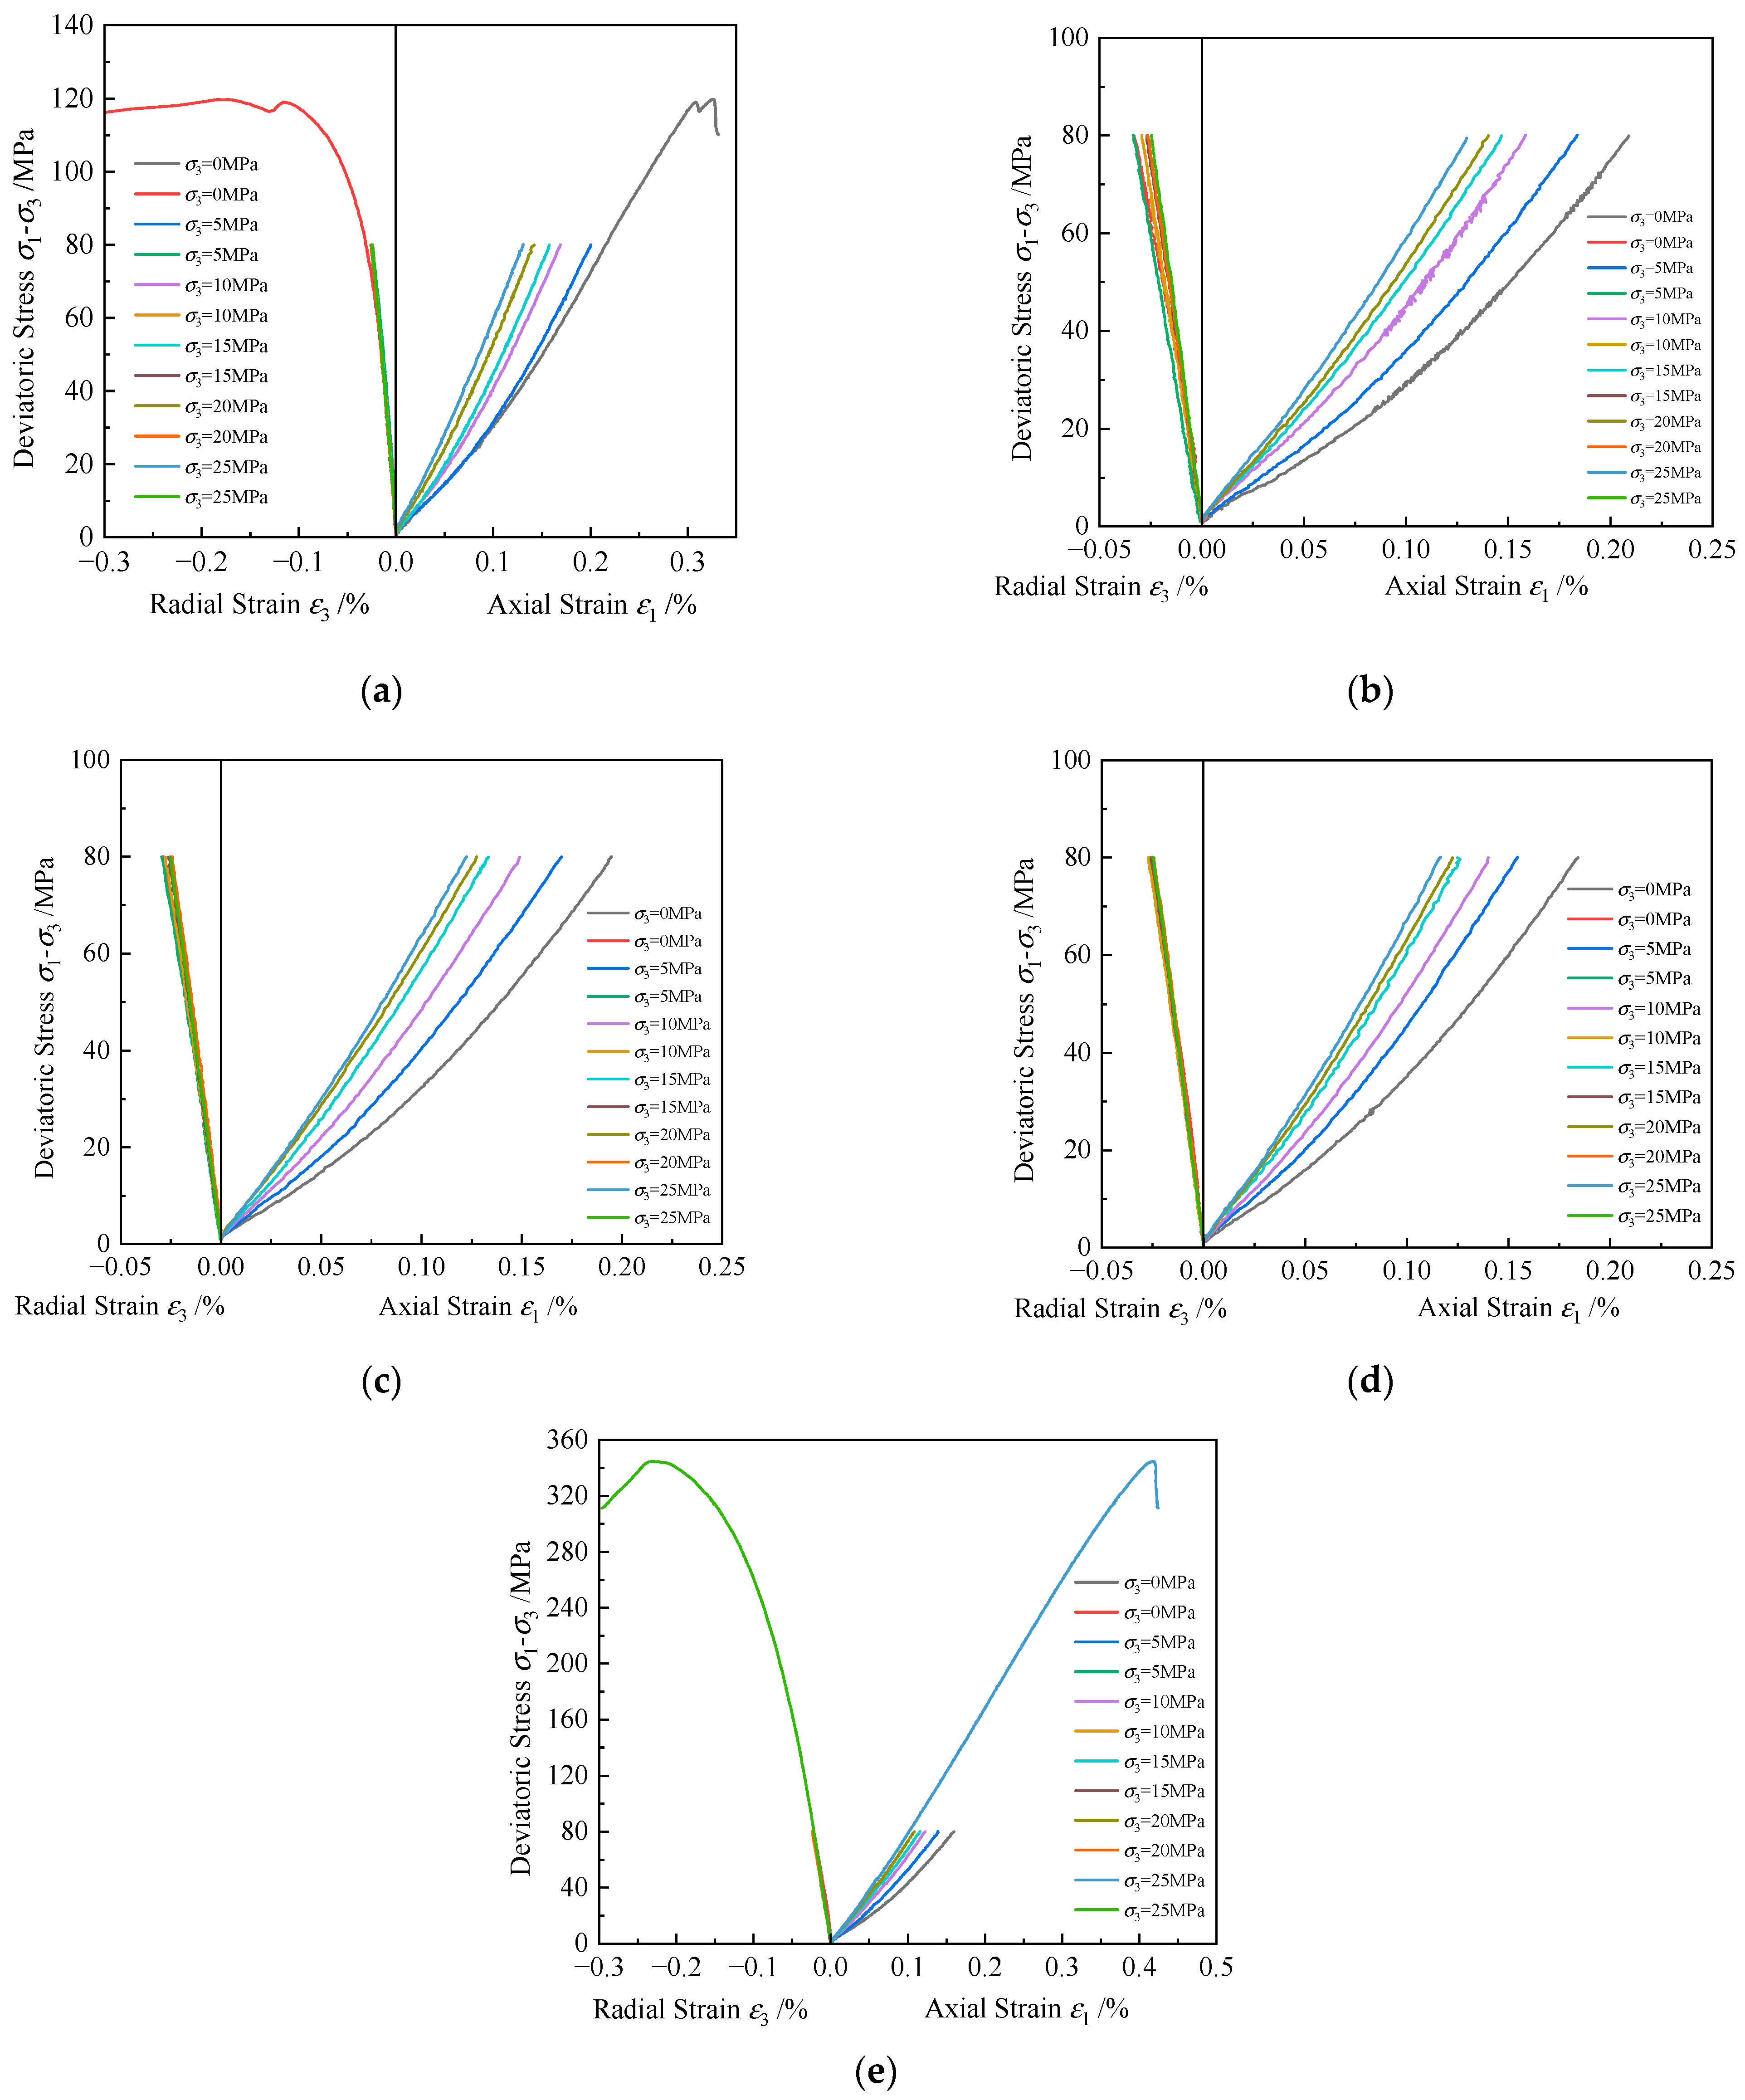
As illustrated in Figure 5, when the temperature remains constant, the stress–strain curves progressively converge with the increase in confining pressure. This indicates that granite is more sensitive to changes in confining pressure under lower confining conditions. However, once a certain confining pressure threshold is reached, the slope of the curve stabilizes, indicating that the deformation behavior of the rock tends to become consistent. Comparing Figure 5a,e, it is evident that, at a confining pressure of 25 MPa and a temperature of 120 °C, the compressive strength and peak strain of granite are both greater than those under normal conditions. It indicates that the coupled effects of temperature and stress can enhance the density of the mineral substructure within the rock sample, thereby increasing its load-bearing capacity and improving its ductility.
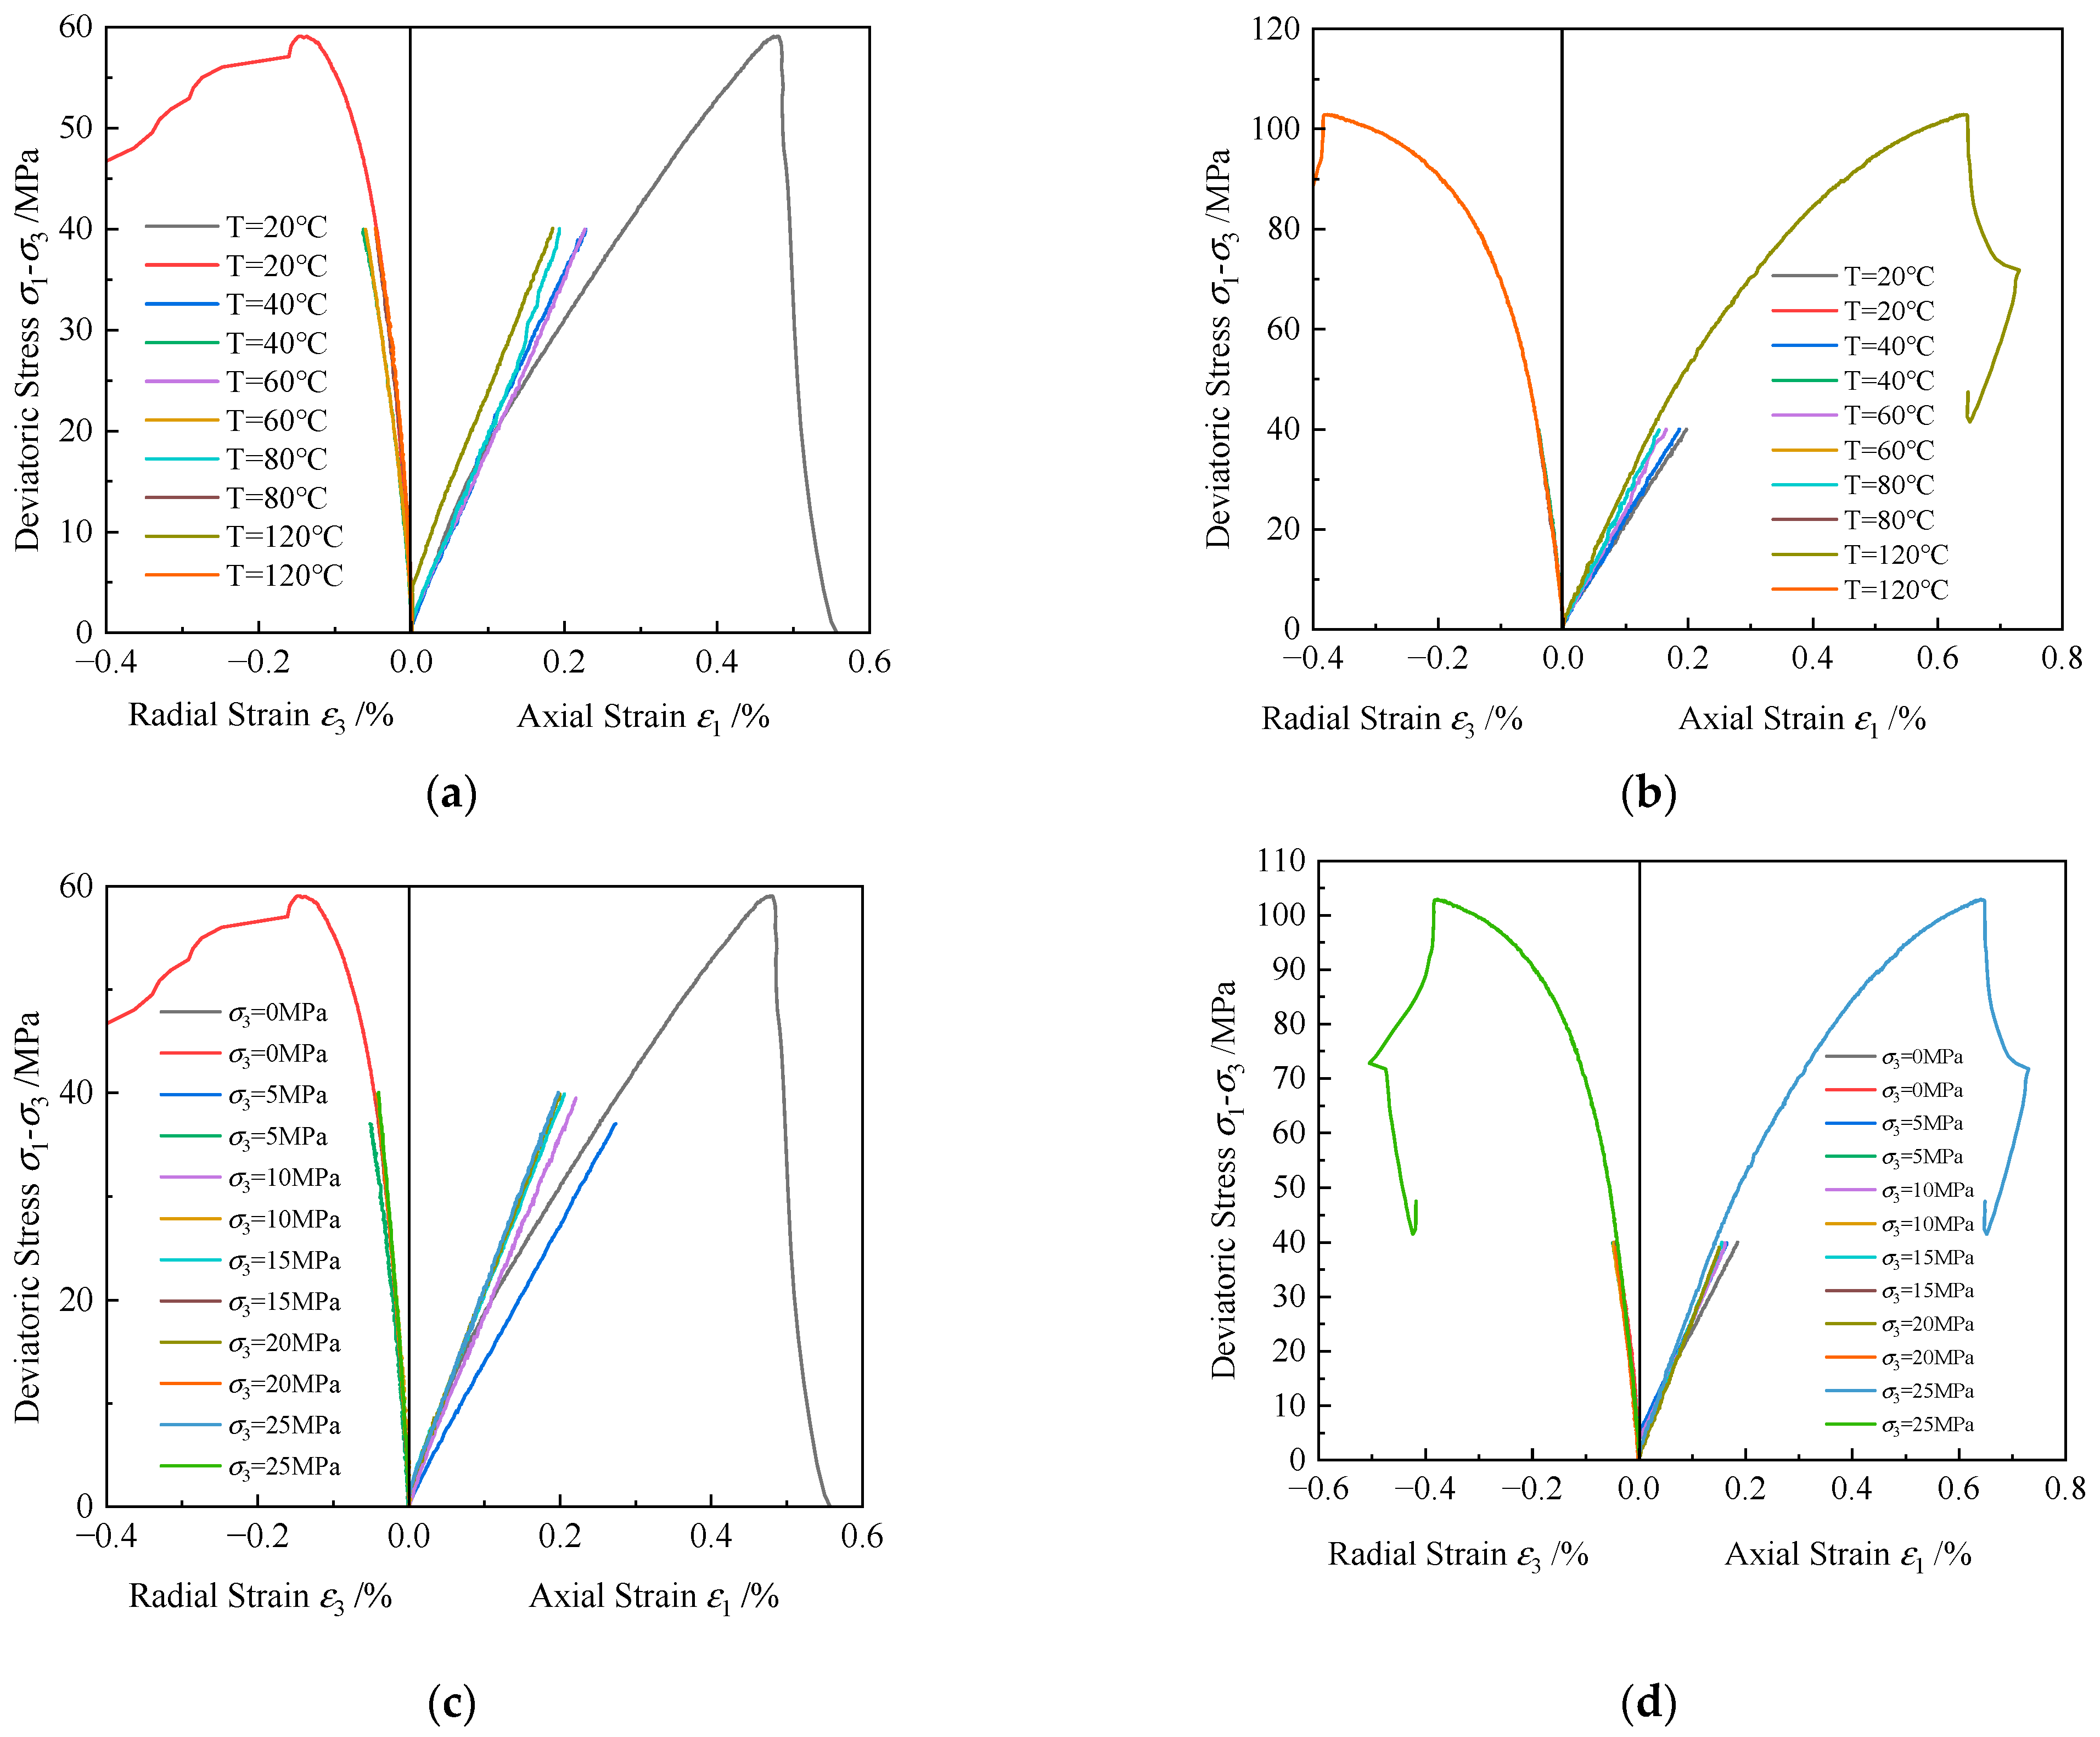
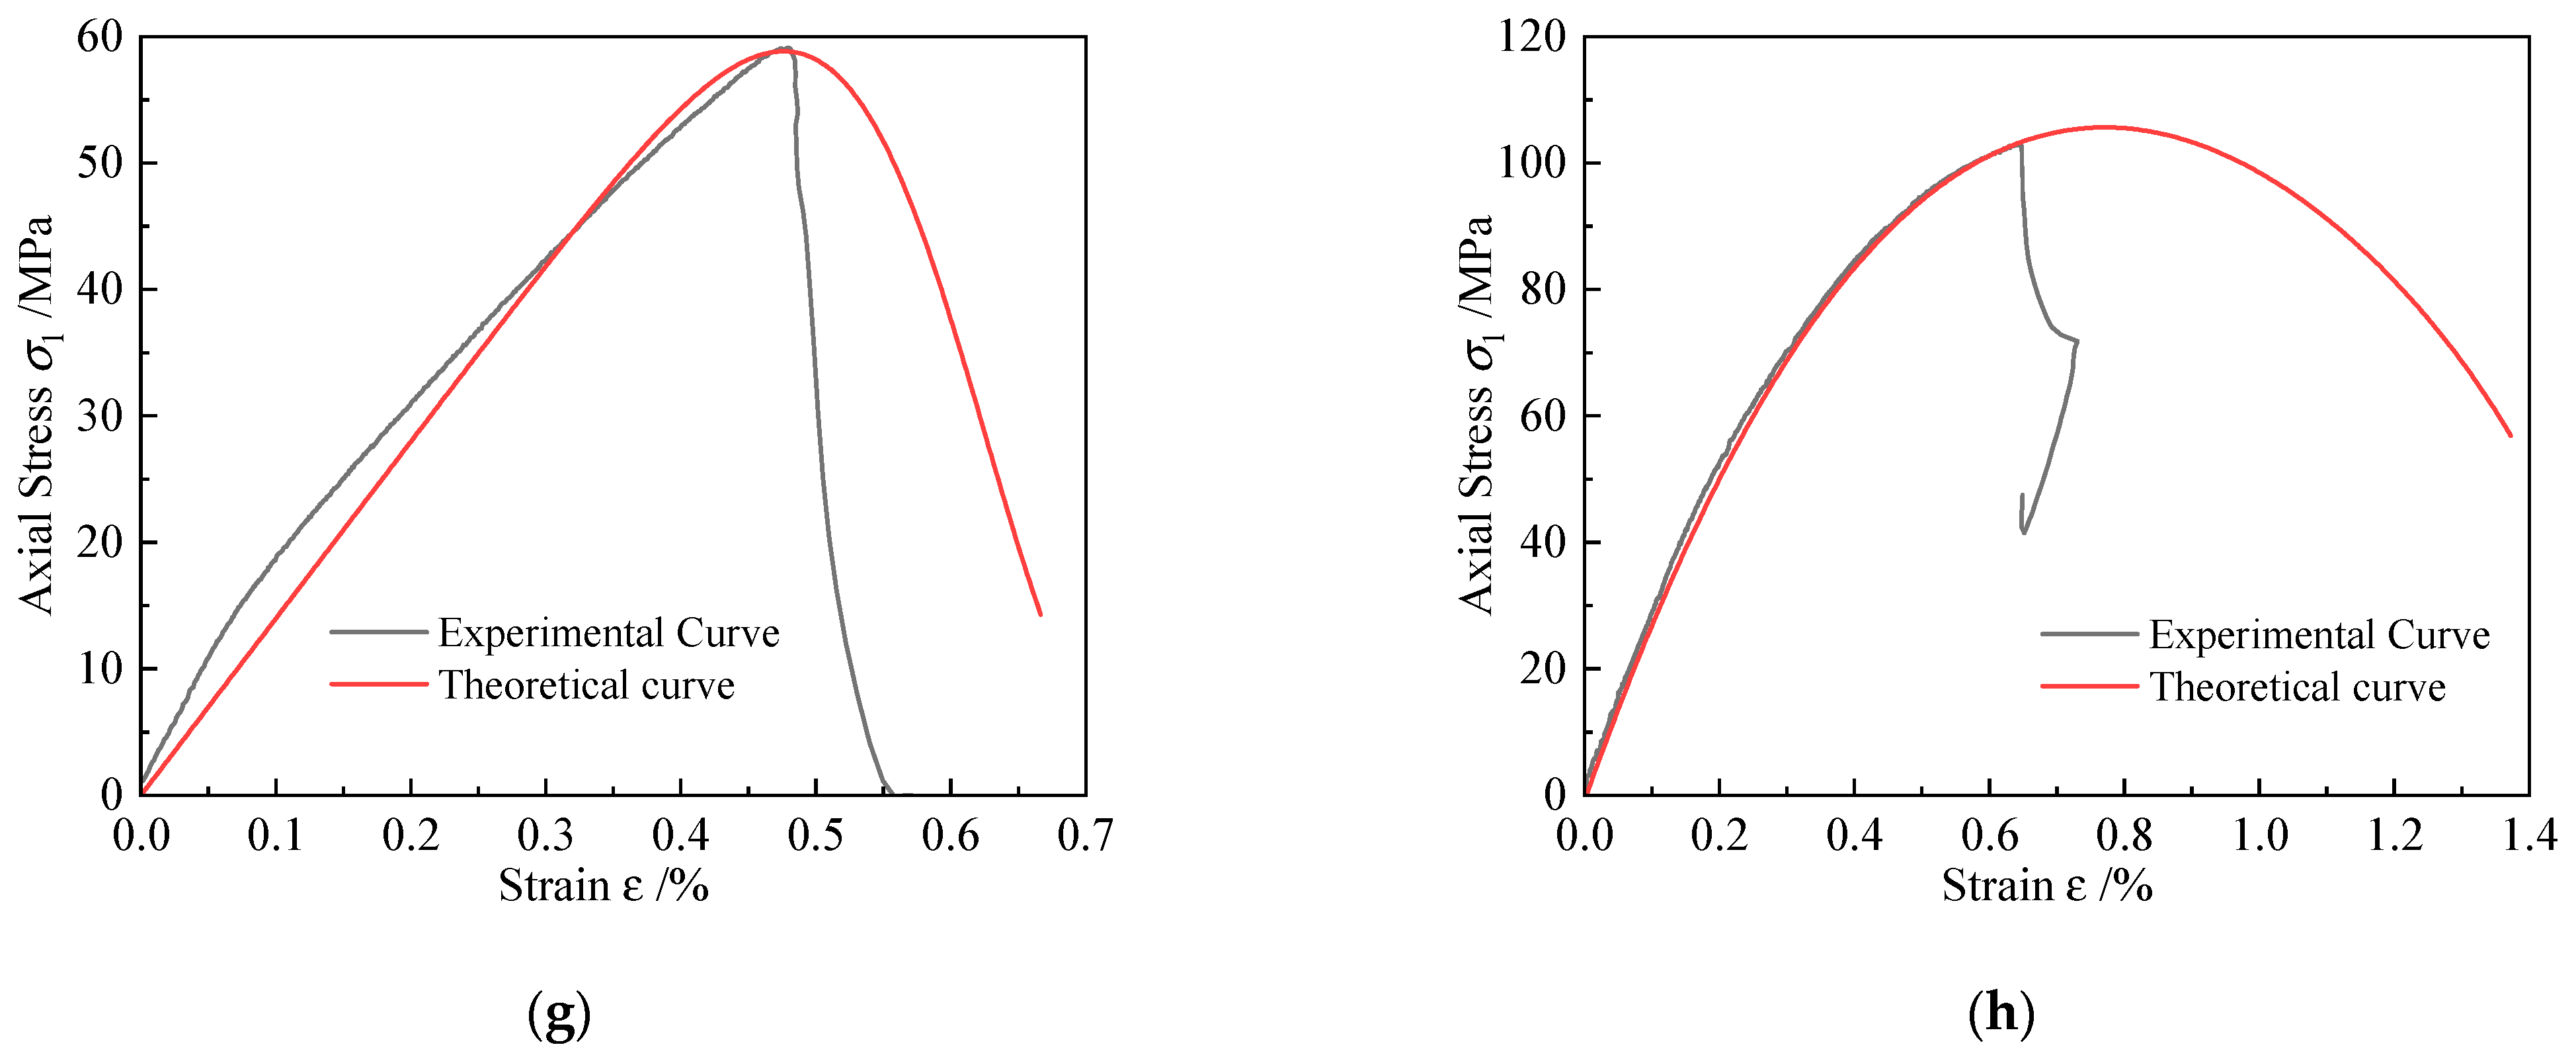
Figure 6 shows the stress–strain curves of red sandstone under different temperature and confining pressure conditions. From Figure 6a,b, it can be observed that the curves of red sandstone mainly exhibit four stages: the pore crack compaction stage, the linear elastic deformation stage, the microcrack development stage, and the post-failure stage. The nonlinear characteristics of the crack closure and compaction stage in red sandstone are not obvious, and the curve quickly enters the elastic deformation stage, showing linear variation characteristics. Comparing Figure 6c,d, it is found that the slope of the curve in the elastic stage gradually increases. The confining pressure restricts the lateral deformation of the rock sample and the expansion of internal cracks, enhancing the closure degree of internal cracks and thus increasing the load-bearing capacity of the sample. Moreover, the compressive strength and peak strain of red sandstone decrease under high-temperature and high-pressure conditions. Higher temperatures cause a crack expansion in red sandstone, reducing its density. The influence of plastic deformation at elevated temperatures outweighs the confining pressure’s restrictive effect, thereby decreasing the sample’s load-bearing capacity. Consequently, temperature becomes the primary factor determining the compressive strength of red sandstone.
Figure 7 illustrates the stress–strain curves of gray sandstone under different temperature and confining pressure conditions. It can be observed that the curves of gray sandstone similarly exhibit the four stages of pore crack compaction, linear elastic deformation, microcrack development, and post-failure. After reaching a certain strain, the curve begins to show nonlinear growth, indicating plastic deformation and the formation of a distinct deformation region, characteristic of ductile failure. Additionally, the compressive strength and peak strain of gray sandstone significantly increases under high-temperature and high-pressure conditions, indicating that the coupled effects of temperature and stress enhance the mineral density within the gray sandstone sample, thereby improving its load-bearing capacity and ductility.
The stress–strain curves of gray sandstone under different temperature and confining pressure conditions are shown in Figure 8. It can be observed that the curve of shale is similar to that of red sandstone and calcareous sandstone, also exhibiting four stages. As the temperature increases, the elastic modulus of the shale increases, the lateral deformation decreases, and the resistance to elastic deformation and the load-bearing capacity are improved. The compressive strength and peak strain of shale also improves under high-temperature and high-pressure conditions.
Therefore, granite demonstrates pronounced brittle failure characteristics under high temperature and pressure, with the effect of confining pressure on its deformation behavior being greater than that of temperature changes. Compared to granite, red sandstone, gray sandstone, and shale exhibit a steeper slope during the elastic phase. The elastic modulus and stiffness of these rocks increase significantly with rising temperature and confining pressure. The nonlinear increase in the curve of gray sandstone is more pronounced, demonstrating characteristics of ductile failure, which is distinctly different from the brittle failure observed in granite.

3.2.2. Analysis of Elastic Modulus for Different Rocks

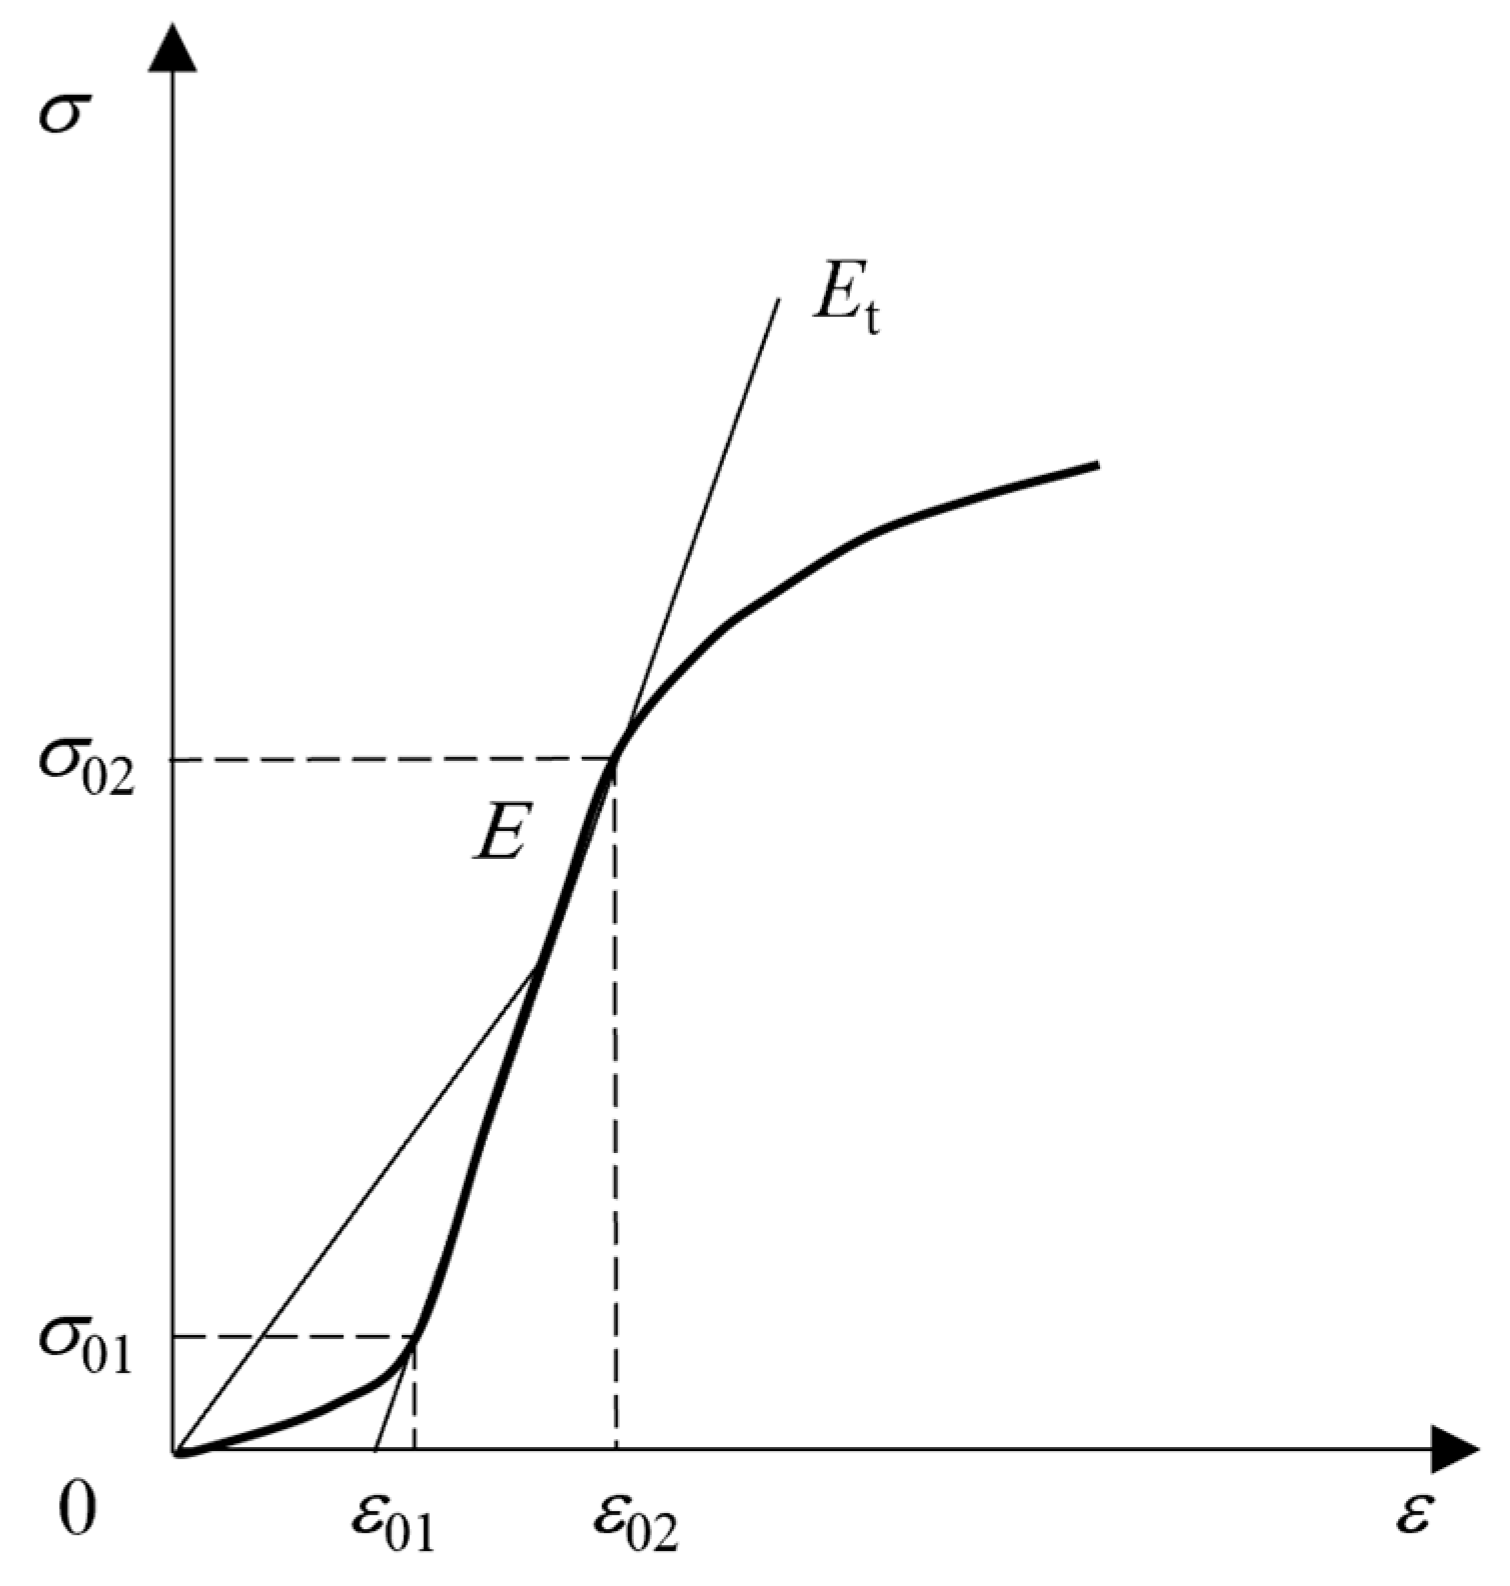
Granite exhibits distinct stages of pore crack compaction and elastic deformation during loading. The transition from a concave upward shape to an approximately linear shape in the stress–strain curve serves as the boundary, allowing a separate discussion of the deformation characteristics of these two stages. The ratio of stress to strain at this boundary point is used as the deformation modulus 
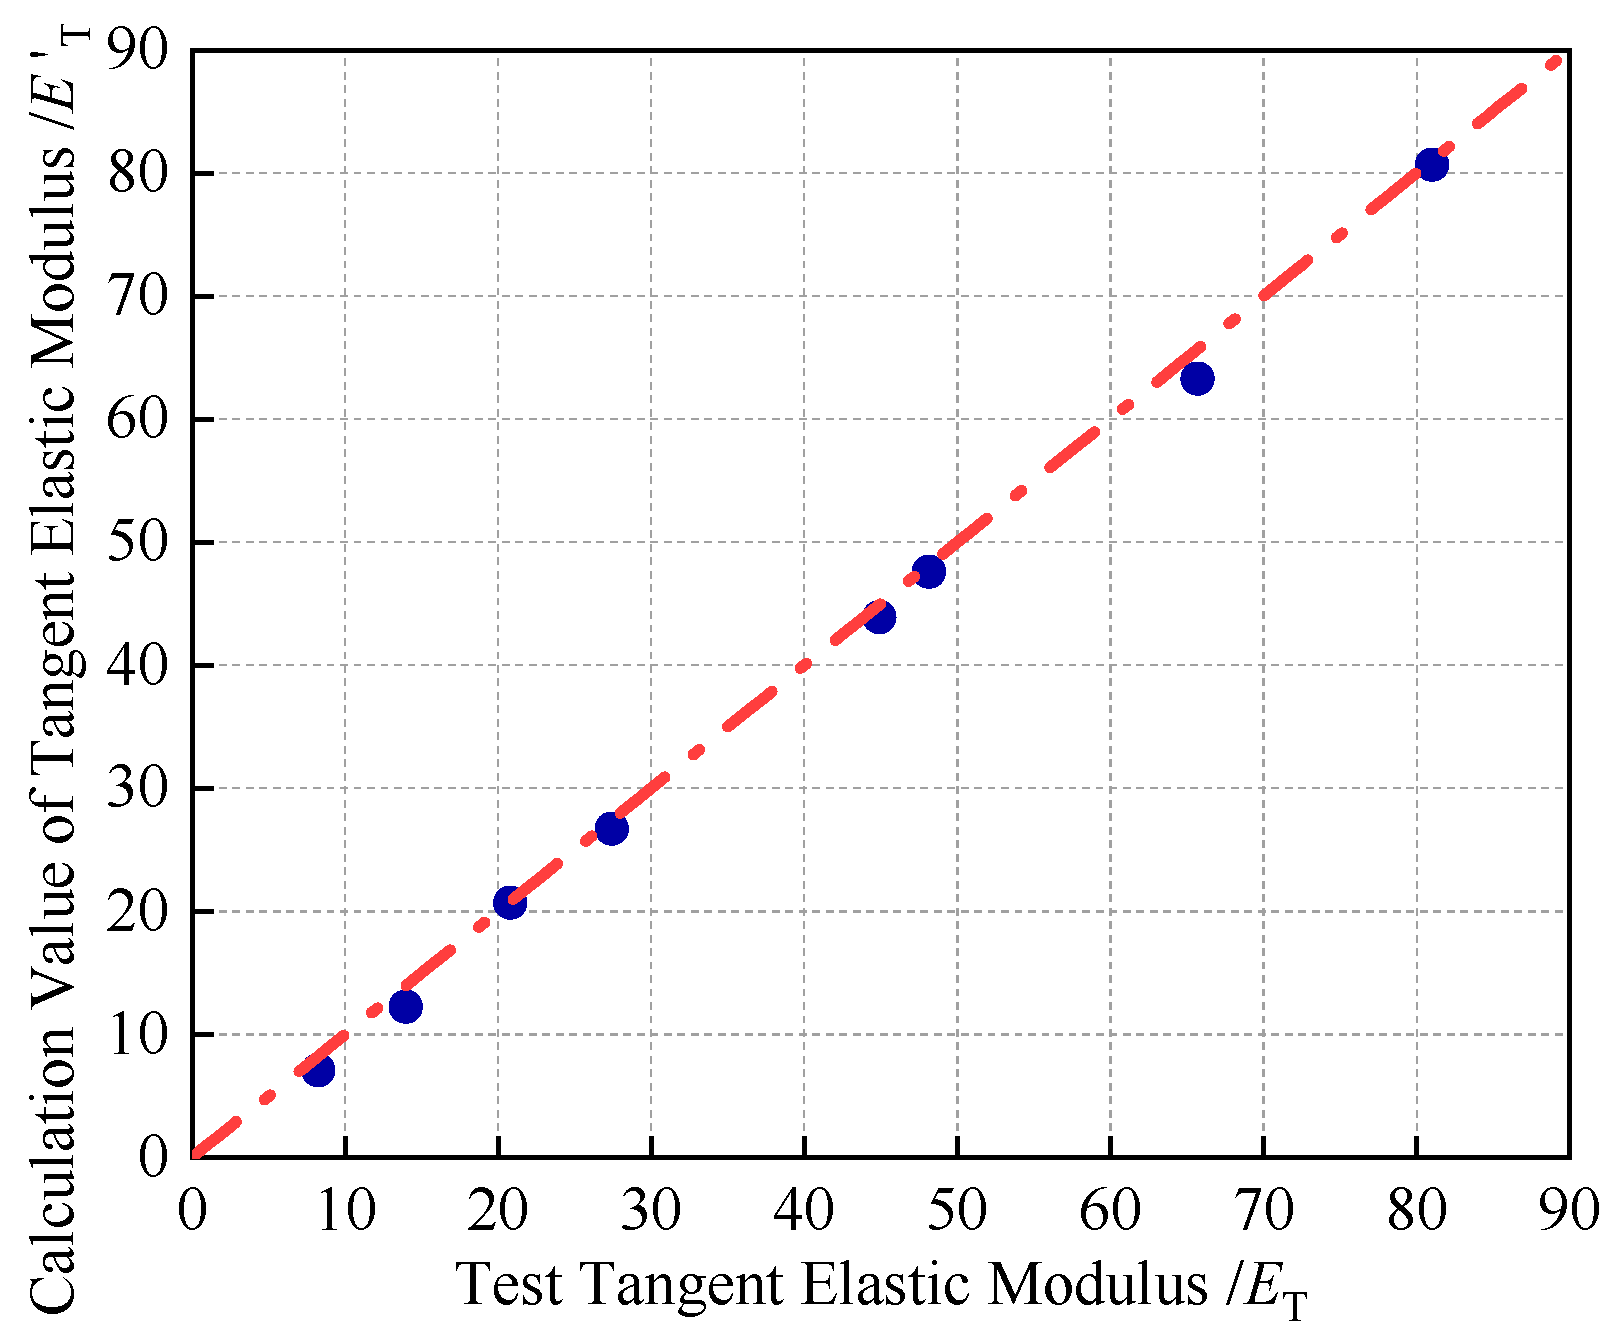
E of the pore crack compaction stage, determined by Equation (1). The tangent elastic modulus Et of the elastic deformation stage is represented by the tangent slope of the linear segment of the stress–strain curve, determined by Equation (2). The determination of E and Et is shown in Figure 9.
E = σ 01 ε 01
E t = σ 02 σ 01 ε 02 ε 01
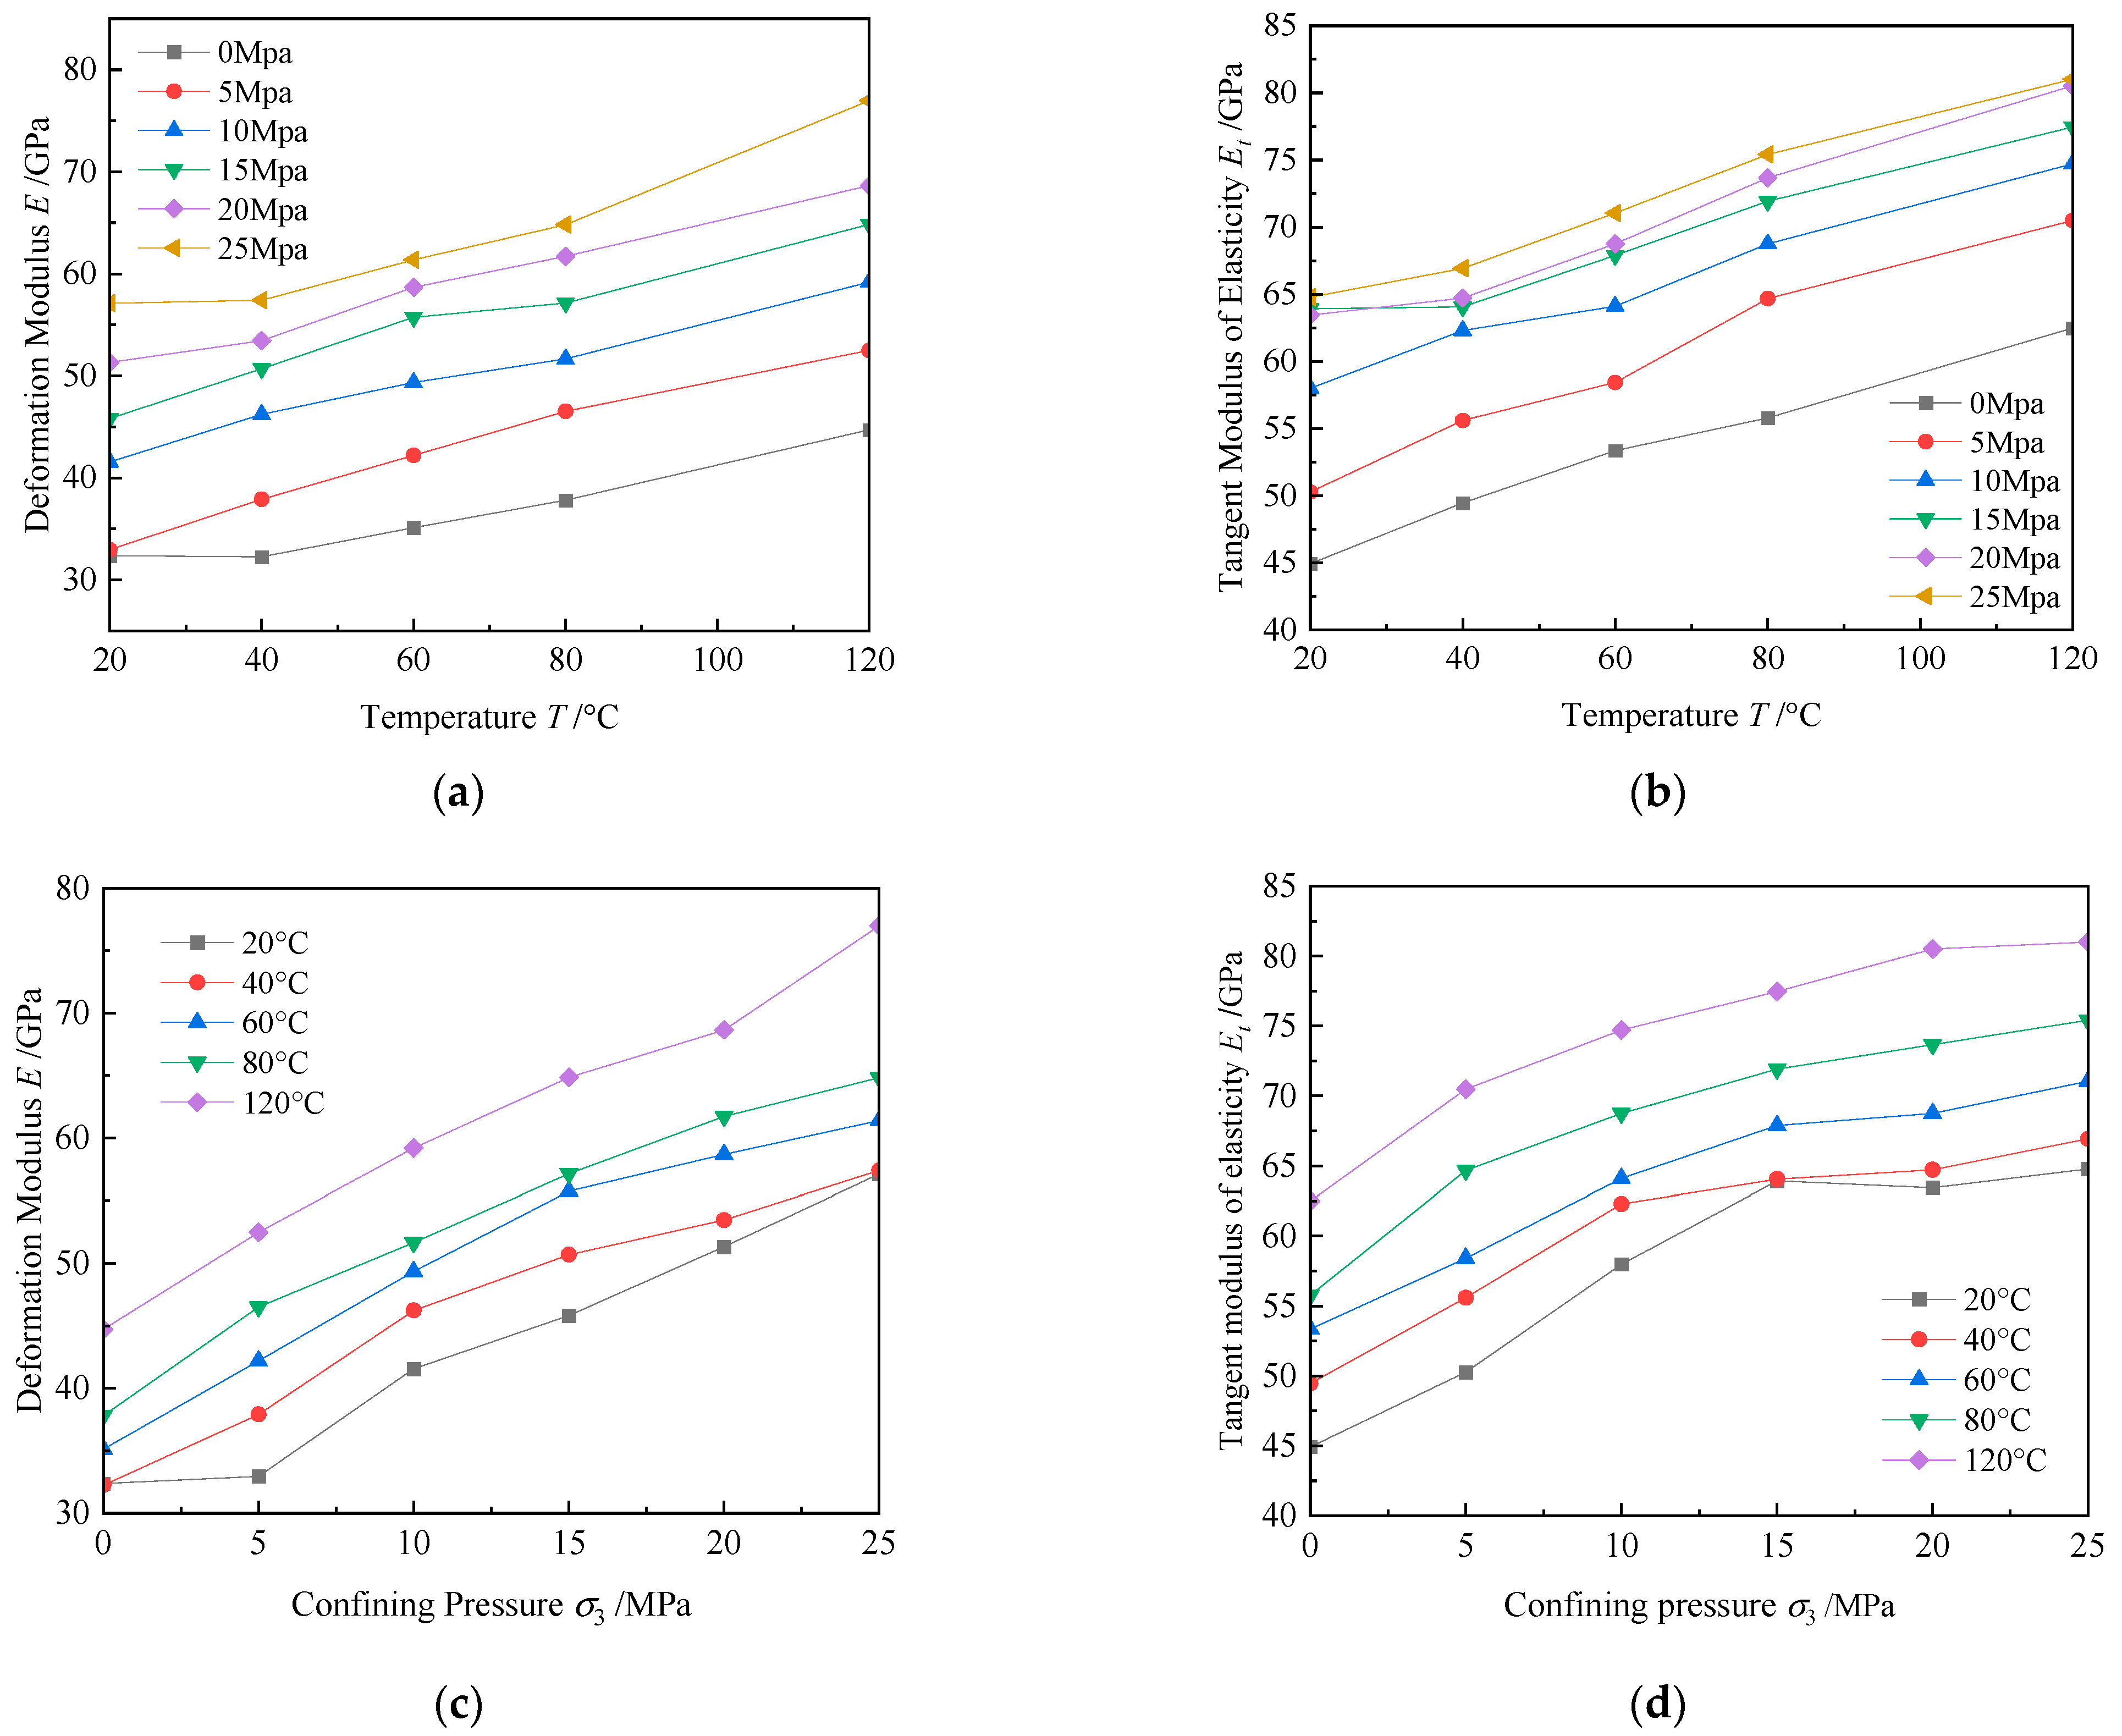
Figure 10a indicates that, as the temperature increases, the deformation modulus E increases. In the temperature range of 40 °C to 80 °C, the slopes of the curves remain relatively low, particularly under lower stress conditions (e.g., 0 MPa and 5 MPa). This suggests that, at lower temperatures, the impact of temperature on the elastic modulus is minimal, and the stiffness of the rock does not increase significantly. Conversely, in the temperature range of 100 °C to 120 °C, the slopes of the curves increase markedly, especially under higher stress conditions (e.g., 25 MPa). During this phase, the elastic modulus exhibits a rapid upward trend as temperature rises. This behavior is primarily attributed to the enhanced interactions between mineral particles, the repair or rearrangement of crystal lattice defects, and the resulting increase in rock density and hardness under high-temperature and high-pressure conditions, leading to a significant increase in the elastic modulus. At confining pressures of 0 MPa, 5 MPa, 10 MPa, 15 MPa, 20 MPa, and 25 MPa, E increases by 38.17%, 59.31%, 42.46%, 41.53%, 33.73%, and 34.76%, respectively, and the increment in rock deformation modulus initially rises and then levels off. At lower confining pressures, the increase in pressure compresses and closes microcracks and pores, enhancing the overall stiffness and load-bearing capacity of the rock sample. However, as confining pressure further increases, the effect of microcrack closure saturates, and the increase in deformation modulus stabilizes. Figure 10b illustrates that the tangent elastic modulus (Et) increases as the temperature rises. At confining pressures of 0 MPa, 5 MPa, 10 MPa, 15 MPa, 20 MPa, and 25 MPa, Et increases by 39.09%, 40.17%, 28.82%, 21.17%, 26.92%, and 25.06%, respectively. The significant rise in Et when the confining pressure increases from 0 MPa to 5 MPa is attributed to the compaction of microcracks and pores during the crack closure phase. As the confining pressure reaches 15 MPa, the rate of increase in Et declines due to the formation of new microcracks or the expansion of existing ones. However, when the confining pressure increases to 25 MPa, the rate of increase in Et stabilizes, indicating that new cracks are rapidly compressed under high confining pressure, with the rock potentially nearing its density limit.
Figure 10c shows a gradual increase in the deformation modulus E as the confining pressure rises from 0 MPa to 25 MPa. The confining pressure causes internal pores and microcracks to gradually close, enhancing the load-bearing capacity of the rock sample and leading to an increase in deformation modulus. At temperatures of 20 °C, 40 °C, 60 °C, 80 °C, and 120 °C, E increases by 76.51%, 78.03%, 74.74%, 71.47%, and 72.15%, respectively. When the temperature increases from 20 °C to 40 °C, E slightly increases due to the thermal expansion effect, where the crack closure effect outweighs the expansion effect. As the temperature rises to 80 °C, the rate of increase in E slightly declines due to the predominant crack expansion effect caused by continuous heating. When the temperature reaches 120 °C, the increase in E stabilizes as the thermal expansion and crack closure effects balance out. Figure 10d demonstrates a gradual rise in Et as the confining pressure increases from 0 MPa to 25 MPa. At temperatures of 20 °C, 40 °C, 60 °C, 80 °C, and 120 °C, the increases of Et are 44.18%, 35.33%, 33.15%, 35.18%, and 29.64%, respectively. As the temperature rises from 20 °C to 40 °C, the increase in Et slightly declines, possibly due to most cracks and pores being compressed and closed during the crack closure phase while, in the elastic deformation phase, new microcracks induced by temperature rise affect structural integrity and reduce the rate of increase in elastic modulus. When the temperature rises to 80 °C, the increase in Et stabilizes due to the balanced effect of thermal expansion on cracks. At 120 °C, high temperature causes the expansion of cracks and pores, influencing the trend of Et changes and potentially altering mineral structures, leading to a decrease in the rate of increase in Et. Obviously, confining pressure has a more significant impact on the deformation modulus during the pore crack compaction phase and on the tangent elastic modulus during the elastic phase of granite. The increase in deformation modulus with rising confining pressure is greater than that caused by temperature rise, indicating that confining pressure plays a major role in the changes in deformation modulus and elastic modulus.
The stress–strain curves of red sandstone, gray sandstone, and shale exhibit a single slope, indicating that the elastic modulus remains constant. The nonlinear characteristics of the crack closure compaction stage are not evident and, after loading, the stress–strain curves quickly transition into the elastic deformation stage, showing linear variation characteristics. Therefore, the tangent elastic modulus Et is used to represent the elastic modulus for the entire deformation stage. This value is defined as the slope of the linear segment in the stress-axial strain relationship.
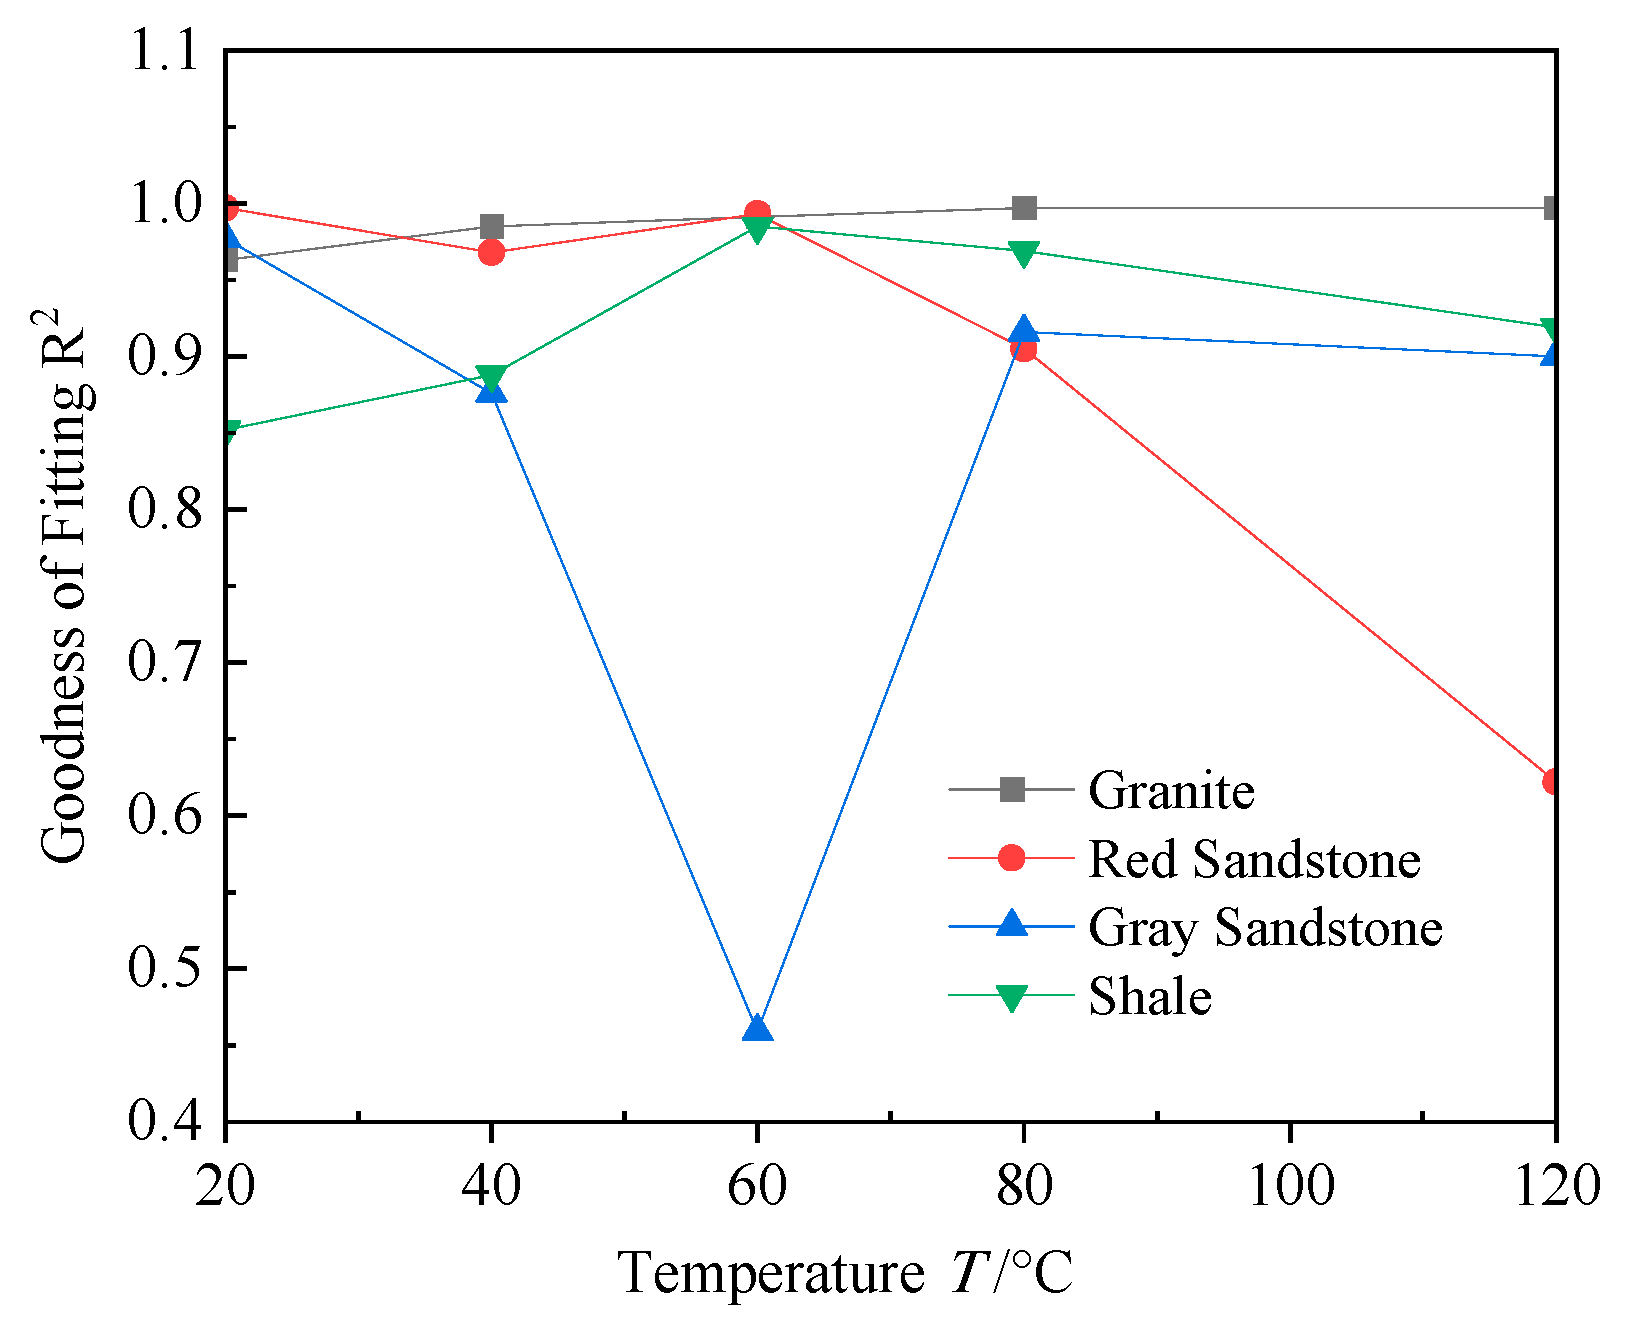
Figure 11 illustrates the relationship between tangent elastic modulus and temperature, confining pressure for different rocks. From Figure 11a,b, it can be observed that the tangent elastic modulus Et of red sandstone exhibits significant trends with changes in temperature and confining pressure. As the temperature rises, Et first increases and then decreases. Between 20 °C and 40 °C, the increase in temperature causes thermal expansion of minerals, which closes cracks and increases the sample’s density, leading to an increase in Et. In the range of 60 °C to 80 °C, at low confining pressures (0–15 MPa), the increase in temperature still causes Et to increase, while at high confining pressures (15–25 MPa), Et remains relatively unchanged and tends to stabilize. When the temperature reaches 120 °C, Et significantly decreases, primarily due to high temperatures causing mineral particle expansion, generating thermal stress, weakening internal bonds, and intensifying crack propagation, which reduces the elastic modulus.
Figure 11c,d indicate that the trend of Et of gray sandstone differs from that of red sandstone. As temperature increases, Et initially decreases and then increases. At room temperature (20 °C), when the confining pressure increases, Et increases from 62.39 GPa to 65.18 GPa, an increase of 4.47%; at 40 °C, the increase is 7.74%; at 60 °C, the increase is 3.29%. The Et of gray sandstone increases with confining pressure, but the rate of increase gradually decreases. This indicates that the effect of confining pressure on the closure of internal cracks in gray sandstone gradually reaches saturation. At 80 °C, Et first decreases and then increases, reflecting the significant thermal expansion effect at high temperatures, leading to pore and crack expansion, but at high confining pressures, the closure effect dominates. At 120 °C, Et increases with confining pressure, indicating that thermal expansion causes mineral particles to contact more closely.
Figure 11e,f illustrate that the tangent elastic modulus Et of shale is significantly affected by temperature and confining pressure. In the range of 20 °C to 60 °C, at low confining pressures (0–5 MPa), Et first rises and then falls, while at high confining pressures (10–25 MPa), Et gradually rises. High temperatures cause the closure effect of internal pores and cracks in shale to exceed the expansion effect, leading to an increase in Et.
The differing trends in the development of elastic modulus for the four rock types under varying temperature and confining pressure conditions primarily stem from differences in their internal structures and mineral compositions. Granite and shale generally exhibit an increase in elastic modulus under high temperature and pressure, reflecting the thermal stability of their structures and the effect of confining pressure on fracture closure. In contrast, red sandstone and gray sandstone show a more complex response, particularly under high-temperature conditions. Their porosity and diverse mineral compositions can lead to a decrease in elastic modulus under certain conditions.

3.3. Model Analysis of Elastic Modulus of Rock

3.3.1. Modeling the Elastic Modulus of Rock under the Influence of Temperature

Clearly, at low temperatures microcracks within the rock tend to close, while at high temperatures these microcracks may expand or new cracks may form, leading to a nonlinear variation in the rock’s elastic modulus. Additionally, the differing thermal expansion coefficients of various minerals cause extra internal stress and strain within the rock, thereby affecting its mechanical properties. Under the influence of temperature, the tangent elastic modulus of some rock masses may also exhibit a decreasing trend. Considering these factors, the relationship between the rock’s elastic modulus and temperature can be well-fitted using a polynomial function:
E ( T ) = A T 3 + B T 2 + C T + E 0
where E0 represents the elastic modulus of the rock under uniaxial compression at room temperature (with room temperature taken as T = 20 °C), and A, B, and C are the fitting parameters to be determined.
Figure 12 shows the fitting results for different types of rocks. By integrating the data from the four rock types, the overall goodness of fit (R2) for the polynomial model is above 0.90, indicating a good fit. It is observed that the gray sandstone has a lower goodness of fit for the temperature model at a confining pressure of 5 MPa. This is likely due to the higher porosity of gray sandstone causing the internal pores to close during the initial stages of confining pressure changes, which leads to abrupt changes in the tangent elastic modulus. This behavior is challenging for the model to accurately describe. However, in other developmental stages, the model effectively fits the trend of the tangent elastic modulus with temperature changes for all four rock types. This demonstrates that the polynomial model can accurately describe the nonlinear changes in the tangent elastic modulus of rocks under varying temperatures.

3.3.2. Modeling the Elastic Modulus of Rock under the Influence of Confining Pressure

Through the mechanical properties of the rock samples, it can be observed that the tangent elastic modulus of the four types of rocks studied in this paper exhibits nonlinear growth with increasing confining pressure. Researchers have proposed many regression formulas or empirical formulas based on experimental results and most models use quadratic curves for fitting [6], which can efficiently fit the data within a limited range. However, these models fail to accurately describe the part where the growth rate of the elastic modulus decreases with increasing confining pressure. The experiments indicate that the rate of increase in the tangent elastic modulus (Et) gradually slows down as the confining pressure increases, suggesting the existence of a limiting value for Et. Based on the micromechanical damage theory, we use a composite exponential formula to represent the relationship between Et and σ3. The formula is expressed as follows:
E ( σ 3 ) = E 0 [ 1 ( A E 0 1 ) ( 1 e ( σ 3 B ) ) ]
where E0 represents the elastic modulus of the rock under uniaxial compression; A and B are the parameters to be determined. The fitting results under different confining pressures are shown in Figure 13.
By integrating the data from the four rock types, the overall R2 value exceeded 0.90, indicating a good fit. This suggests that the model effectively describes the variation of the tangent elastic modulus of rocks under the influence of confining pressure. In particular, it accurately captures the phenomenon where the rate of change in the tangent elastic modulus decreases as the confining pressure reaches a certain value. This behavior is primarily attributed to the closure of internal cracks within the rock mass, leading to an increase in elastic modulus, which ultimately approaches its limit. The composite exponential model successfully reflects this trend. The fitting results for calcareous sandstone at 60 °C were less satisfactory, likely due to the higher porosity of calcareous sandstone compared to the other rock types, as discussed in Section 3.2.2. This higher porosity causes abrupt changes in the tangent elastic modulus within the 10 MPa to 20 MPa range, thereby reducing the effectiveness of the model fitting.

3.3.3. Modeling the Elastic Modulus of Rock under the Influence of Temperature and Confining Pressure

The thermo-mechanical coupling effect is not a simple additive relationship between temperature and confining pressure but rather a complex interaction. Therefore, drawing on the fitting models from Section 3.3.1 and Section 3.3.2, both temperature and confining pressure factors are jointly considered. By referencing the development trend of the elastic modulus of rocks under thermo-mechanical coupling, the following formula is used for nonlinear fitting:
E ( T , σ 3 ) = A T 3 + B T 2 + C T + E 0 [ 1 ( D E 0 1 ) ( 1 e ( σ 3 E ) ) ]
where E0 represents the elastic modulus of the rock under uniaxial compression at room temperature (with room temperature taken as T = 20 °C), and A, B, C, D, E are the fitting parameters to be determined.
Table 2 demonstrates the results of fitting the tangent elastic modulus under temperature-confining pressure coupling. Figure 14 demonstrates the fitting results of the tangent elastic modulus in relation to temperature and confining pressure for the four types of rocks. The results indicate that the nonlinear fitting model effectively describes the development trend of the tangent elastic modulus under thermo-mechanical coupling for all four rock types. The fitting results for granite and shale are particularly accurate, whereas the fitting for red sandstone and gray sandstone is slightly less precise. This discrepancy is mainly due to the higher degree of fracture development and porosity in red sandstone and gray sandstone, which can cause abrupt changes in the tangent elastic modulus under high temperature and pressure conditions. Consequently, the model finds it challenging to accurately fit these abrupt trends. Future research could focus on investigating the specific characteristics of these rock types further.

4. Damage Constitutive Model of Rock

4.1. Rock Damage Theory Based on the Drucker–Prager Criterion

Based on the Drucker–Prager strength criterion, the microelement strength of the rock F* is defined as:
F * = f ( σ * ) = α I 1 + J 2
where α represents the strength parameter of the rock microelement; I1 denotes the first invariant of stress; J2 signifies the second invariant of deviatoric stress.
Expressing the above I1 and J2 in terms of stresses gives:
I 1 = E ε 1 ( σ 1 + 2 σ 3 ) σ 1 2 ν σ 3
J 2 = E ε 1 ( σ 1 + 2 σ 3 ) 3 ( σ 1 2 ν σ 3 )
Substituting Equations (7) and (8) into Equation (6), the microelement strength of the rock under confining pressure can be obtained as:
F * = E ε 1 sin φ ( σ 1 + 2 σ 3 ) + 3 + sin 2 φ ( σ 1 σ 3 ) 9 + 3 sin 2 φ σ 1 2 ν σ 3
Substituting Equation (9) into Equation (14), the rock damage evolution equation under the coupled effect of temperature and confining pressure is obtained as follows:
D s = 1 E T E 0 exp E T ε 1 sin φ ( σ 1 + 2 σ 3 ) + 3 + sin 2 φ ( σ 1 σ 3 ) F 0 9 + 3 sin 2 φ σ 1 2 ν σ 3 m

4.1.1. Rock Damage under Confining Pressure

The damage variable can be defined in various ways. Given that material damage results in alterations to the microstructure and certain macroscopic physical properties, the failure of rock materials can be viewed as a process of damage accumulation. Consequently, the benchmark for measuring damage can be selected from both micro and macro perspectives. The damage to microelements within the rock under load is generally random. The damage variable D can be defined as the ratio of the number of damaged units n at a certain stress level q to the total number of units N in the initial state, as follows:
D = n N
According to the Krajcinovic model [38,39], the damage variable is the probability p of microelement failure. If the probability density of microelement failure is ϕ(x), then p is the cumulative distribution function F, expressed as:
D = p = 0 F ϕ ( x ) d x
Based on the assumption that the strength of rock microelements follows a Weibull distribution, its probability density function can be expressed as:
ϕ ( F ) = m F 0 ( F F 0 ) m 1 exp [ ( F F 0 ) m ]
where F represents the microelement strength; the parameter m represents the shape parameter of the Weibull distribution, indicating the uniformity of the internal strength of the rock material. The parameter F0 is the scale parameter of the Weibull distribution, reflecting the average strength level of the rock material.
Substituting Equation (13) into Equation (12), the damage variable of rock under external load is:
D = 0 F ϕ ( x ) d x = 1 exp [ ( F F 0 ) m ]

4.1.2. Rock Damage under Temperature

Based on the theory of macroscopic damage mechanics, the thermal damage of rock can be characterized using macroscopic mechanical parameters. Therefore, the elastic modulus can be used to define the thermal damage variable, which can be expressed as:
D T = 1 E T E 0
where ET is the elastic modulus of the rock under the temperature T; E0 is the elastic modulus of the rock at room temperature (20 °C).

4.1.3. Total Damage of Rock under Thermo-Confining Pressure Coupling

During triaxial compression tests under high temperature and high confining pressure, the primary causes of rock damage are the destructive effects of temperature and confining pressure on the internal structure of the rock. High temperatures cause thermal expansion of internal materials and cracks within the rock, usually leading to internal damage. Confining pressure compresses and closes the microcracks and pores within the rock, thereby enhancing its overall stiffness and density. Due to the uncertainty in the extent of rock damage caused by the coupling of temperature and stress, certain mathematical methods are needed to quantitatively analyze the total damage.
Assuming that the effective volumes of undamaged rock, thermally damaged rock, and rock damaged are V0, V1, and V2 respectively, then we have:
D T = 1 V 1 V 0
D m = 1 V 2 V 1
By combining the above assumptions, we can establish the following relationship:
D s = D T + D D T D
By substituting Equations (14) and (15) into the overall equation, the total damage variable for rock under the coupled effects of temperature and confining pressure can be obtained as:
D s = 1 E T E 0 exp [ ( F F 0 ) m ]
According to Lemaitre’s strain equivalence hypothesis, the constitutive relationship of the rock damage can be expressed as follows:
σ i = σ i ( 1 D s ) ;       i = 1 , 2 , 3
According to the generalized Hooke’s law, we have:
ε i = σ i v ( σ j + σ k ) E T
where εi′ is the effective strain corresponding to the effective stress σi′.
According to the deformation compatibility conditions, we have:
ε i = ε i
From Equations (20)–(22), the damage constitutive relation of rock can be derived as follows:
σ 1 = E T ε 1 ( 1 D s ) + v ( σ 2 + σ 3 )
The initial axial strain generated under the initial confining pressure is:
σ s = σ 1 σ 3
ε 0 = 1 2 v E T σ 3
ε 1 = ε + ε 0
By substituting Equations (10) and (24)–(26) into Equation (23), the damage constitutive model of rock under thermo-confining pressure coupling can be obtained as follows:
σ 1 = [ E T ε 1 + ( 1 2 v ) σ 3 ] E T E 0 × exp [ [ E T ε 1 + ( 1 2 v ) σ 3 ] [ ( σ 1 + 3 σ 3 ) sin φ + σ 1 3 + sin 2 φ ] F 0 9 + 3 sin 2 φ [ σ 1 + ( 1 2 v ) σ 3 ] m ] + ( 2 v 1 ) σ 3
In summary, the parameters that need to be determined are ET, m and F0. The elastic modulus under the influence of temperature, ET, can be determined using the fitting model discussed in Section 3.3.1. The parameters m and F0 can be determined from the peak points (εp,σp) of the rock stress–strain curves.
The peak stress σp and peak strain εp satisfy the following two geometric conditions:
ε = ε p ,     σ 1 = σ p
ε = ε p ,     d σ 1 d ε 1 = 0
By substituting Equations (28) and (29) into Equation (27), two relationships regarding m and F0 can be obtained, as shown below:
m = 1 ln E T E 0 [ E T ε p + ( 1 2 v ) σ 3 σ p + ( 1 2 v ) σ 3 ]
F 0 = [ E T ε p + ( 1 2 v ) σ 3 ] [ ( σ 1 + 3 σ 3 ) sin φ + σ p 3 + sin 2 φ ] 9 + 3 sin 2 φ [ σ 1 + ( 1 2 v ) σ 3 ] m 1 m
By adjusting the parameters m and F0 based on experimental data and substituting them into Equation (27), a damage constitutive model can be constructed that accurately reflects the stress–strain state of rock under thermo-mechanical coupling.

4.2. Experimental Validation of the Damage Constitutive Model of Rock under Thermo-Confining Pressure Coupling

To validate the rationality and effectiveness of the method proposed in this paper, we evaluated the statistical damage Drucker–Prager constitutive model for granite, red sandstone, gray sandstone, and shale under conditions of 20 °C and 0 MPa, as well as 120 °C and 25 MPa. Based on the experimental results, we extracted mechanical parameters such as peak stress, peak strain, confining pressure, elastic modulus, and Poisson’s ratio. These parameters were substituted into Equations (30) and (31) to calculate the Weibull distribution parameters m and F0 for the four rock types under the conditions of 20 °C, 0 MPa, and 120 °C, 25 MPa. The specific results are shown in Table 3.
By substituting the calculated Weibull distribution parameters m and F0 along with the values of the elastic modulus, internal friction angle, and other parameters into Equation (27), the statistical damage Drucker–Prager constitutive model for various types of rocks under the conditions of 20 °C, 0 MPa and 120 °C, 25 MPa can be obtained. The general form of the Drucker–Prager constitutive model under these conditions can be expressed in Table 4.
Based on the damage constitutive models in Table 4, the theoretical stress–strain curves for granite, red sandstone, gray sandstone, and shale under conditions of 20 °C, 0 MPa and 120 °C, 25 MPa are compared with the experimental stress–strain curves obtained from tests.
Figure 15 compares the theoretical and experimental stress–strain curves, where it can be observed that the theoretical results obtained from the established constitutive model coincide well with the experimental results, indicating that the Drucker–Prager constitutive model for the four types of rocks under conditions of 20 °C, 0 MPa, and 120 °C, 25 MPa is reliable. By comparing the tangent elastic modulus Et’ derived from the theoretical stress–strain curves with the tangent elastic modulus Et obtained from the experimental stress–strain curves, the accuracy and applicability of the proposed models are further validated, as shown in Table 5.
Figure 16 illustrates the comparison between Et′ and Et. The data points primarily cluster around the 45° line, indicating a high degree of correlation between the theoretical and actual values. This suggests that the theoretical model accurately predicts the experimental outcomes. Data analysis reveals that the average ratio of the theoretical to experimental tangent elastic modulus is 0.95, with a standard deviation of 0.003. This indicates that the constitutive model exhibits high precision and reliability, effectively predicting the actual values of the tangent elastic modulus.
The theoretical peak stress σp and peak strain σ′p obtained from the stress–strain curves of different rock types are compared with the experimental peak stress εp and peak strain εp′ as shown in Table 6. Figure 17 shows the theoretical calculated values of peak stress and peak strain compared to the test values. Data analysis indicates that the average ratio of the theoretical peak strain to the experimental peak strain is 1.088, with a standard deviation of 0.0134. Similarly, the average ratio of the theoretical peak stress to the experimental peak stress is 1.03, with a standard deviation of 0.00083. These results demonstrate that the constitutive model exhibits high accuracy and reliability, effectively predicting the actual values of peak stress and peak strain.
In conclusion, the constitutive model for the temperature-confining pressure coupled damage evolution equation presented in this paper successfully represents the stress–strain behavior of rocks. The mechanical parameters derived show strong consistency. A comparison of the theoretical peak points predicted by the damage constitutive model with the experimental peak points demonstrates a high level of correlation. This confirms that the model accurately captures the stress–strain peak characteristics of rocks during triaxial compression, highlighting its important engineering significance.

5. Conclusions

This study utilizes triaxial compression tests to investigate the effects of temperature and confining pressure on the deformation and mechanical properties of four typical rock types: granite, red sandstone, gray sandstone, and shale. The primary conclusions are as follows:
(1)
Temperature influences the elastic modulus of rocks differently. Granite and shale show an increase in elastic modulus with temperature. Red sandstone’s elastic modulus increases initially, then decreases after a threshold, while gray sandstone exhibits the opposite trend. These differences are attributed to variations in internal structure, mineral composition, and the behavior of microcracks. Confining pressure significantly impacts elastic modulus and strain, with more pronounced changes under low confining pressure.
(2)
The combined effects of temperature and confining pressure enhance the peak strength and strain of granite, gray sandstone, and shale at 120 °C and 25 MPa, compared to 20 °C and 0 MPa, indicating increased density, load-bearing capacity, and ductility. Conversely, red sandstone shows reduced strength at higher temperatures, likely due to thermal expansion and internal crack propagation. The coupling also affects rock failure characteristics, with smoother fracture surfaces under triaxial conditions compared to uniaxial conditions.
(3)
A fitting model for the tangent elastic modulus (Et) under temperature and confining pressure was developed. A polynomial model captures temperature-induced changes, particularly the decline in Et, while a composite exponential model fits the confining pressure effects. The combined model accurately predicts Et under dual influences, with a high goodness-of-fit (R2 close to 1), offering a reliable reference for evaluating rock deformation.
(4)
A constitutive model accounting for temperature and confining pressure coupling was formulated based on the Drucker–Prager criterion and Weibull statistical damage theory. Empirical formulas were derived for different rocks under varying conditions, and the model was validated against experimental results, showing strong consistency.

Author Contributions

Conceptualization, Z.Z.; methodology, Z.Z., Y.Z. and C.H.; software, C.H.; validation, T.P., Y.J. and X.L.; formal analysis, Z.Z.; investigation, Z.Z.; resources, Y.Z. and X.L.; data curation, Z.Z.; writing—original draft preparation, Z.Z.; writing—review and editing, Z.Z., Y.Z., C.H. and T.P.; visualization, Z.Z.; supervision, T.P. and Y.J.; project administration, Y.Z. and C.H.; funding acquisition, Y.Z. All authors have read and agreed to the published version of the manuscript.

Funding

This research received no external funding.

Institutional Review Board Statement

Not applicable.

Informed Consent Statement

Not applicable.

Data Availability Statement

The data presented in this study are available upon request from the corresponding author. The data are not publicly available due to privacy.

Acknowledgments

The authors would like to thank Cui Kun for his great help in this article, and his support has made it possible to present the article in a better way. The authors sincerely thank all the anonymous reviewers for their comments that improved the quality of the paper.

Conflicts of Interest

The authors declare no conflicts of interest.

References

  1. Luo, N.; Liang, H.L.; Shen, T.; Yang, W.H. Temperature Dependence of Young’s Modulus of Red Sandstone. Therm. Sci. 2019, 23, 1599–1606. [Google Scholar] [CrossRef]
  2. Tian, H.; Kempka, T.; Xu, N.X.; Ziegler, M. Physical Properties of Sandstones After High Temperature Treatment. Rock Mech. Rock Eng. 2012, 45, 1113–1117. [Google Scholar] [CrossRef]
  3. Zhang, W.Q.; Sun, Q.; Hao, S.Q.; Geng, J.S.; Lv, C. Experimental study on the variation of physical and mechanical properties of rock after high temperature treatment. Appl. Therm. Eng. 2016, 98, 1297–1304. [Google Scholar] [CrossRef]
  4. Zhang, L.Y.; Zhu, H.H. Three-dimensional Hoek-Brown strength criterion for rocks. J. Geotech. Geoenviron. 2007, 133, 1128–1135. [Google Scholar] [CrossRef]
  5. Fan, L.F.; Gao, J.W.; Wu, Z.J.; Yang, S.Q.; Ma, G.W. An investigation of thermal effects on micro-properties of granite by X-ray CT technique. Appl. Therm. Eng. 2018, 140, 505–519. [Google Scholar] [CrossRef]
  6. Yin, T.B.; Chen, Y.J.; Li, X.B.; Li, Q. Effect of high temperature and strain rate on the elastic modulus of rocks: A review. Int. J. Earth Sci. 2021, 110, 2639–2660. [Google Scholar] [CrossRef]
  7. Liu, W.; Zhang, L.; Luo, N. Elastic modulus evolution of rocks under heating-cooling cycles. Sci. Rep. 2020, 10, 13835. [Google Scholar] [CrossRef]
  8. Suknev, S.V. Determination of elastic properties of rocks under varying temperature. J. Min. Sci. 2016, 52, 378–387. [Google Scholar] [CrossRef]
  9. Yang, S.Q.; Jiang, Y.Z.; Xu, W.Y.; Chen, X.Q. Experimental investigation on strength and failure behavior of pre-cracked marble under conventional triaxial compression. Int. J. Solids Struct. 2008, 45, 4796–4819. [Google Scholar] [CrossRef]
  10. Liu, J.-T.; Wang, J.-B.; Ge, H.-K.; Zhou, W.; Chen, B.-B.; Li, X.-D.; Xue, X.-J.; Luo, S.-L. Effect of gravel on rock failure in glutenite reservoirs under different confining pressures. Pet. Sci. 2023, 20, 3022–3036. [Google Scholar] [CrossRef]
  11. Arzúa, J.; Alejano, L.R.; Walton, G. Strength and dilation of jointed granite specimens in servo-controlled triaxial tests. Int. J. Rock Mech. Min. 2014, 69, 93–104. [Google Scholar] [CrossRef]
  12. Chen, M.; Zang, C.-W.; Ding, Z.-W.; Zhou, G.-L.; Jiang, B.-Y.; Zhang, G.-C.; Zhang, C.-P. Effects of confining pressure on deformation failure behavior of jointed rock. J. Cent. South Univ. 2022, 29, 1305–1319. [Google Scholar] [CrossRef]
  13. Yang, H.; Dahlhaus, N.; Renner, J. On the Effect of Lateral Confinement on Rock-Cutting Tool Interactions. Rock Mech. Rock Eng. 2024, 57, 6063–6083. [Google Scholar] [CrossRef]
  14. Meng, Y.; Jing, H.; Liu, X.; Yin, Q. Effects of initial unloading level on the mechanical, micro failure and energy evolution characteristics of stratified rock mass under triaxial unloading confining pressure. Theor. Appl. Fract. Mech. 2023, 128, 104161. [Google Scholar] [CrossRef]
  15. Chen, D.; Chen, H.; Zhang, W.; Lou, J.; Shan, B. An analytical solution of equivalent elastic modulus considering confining stress and its variables sensitivity analysis for fractured rock masses. J. Rock Mech. Geotech. Eng. 2022, 14, 825–836. [Google Scholar] [CrossRef]
  16. Wang, H.W.; Wang, Y.Y.; Fu, X. Experimental Study on Coupling Influence of Temperature and Confining Pressure to Deformation and Strength Characteristics of Rock-like Material with Pre-Existing Crack. Materials 2021, 14, 7572. [Google Scholar] [CrossRef]
  17. Li, M.; Wu, Z.; Weng, L.; Ji, J.; Liu, Q. Numerical Investigation of Coupled Effects of Temperature and Confining Pressure on Rock Mechanical Properties in Fractured Rock Mass Using Thermal-Stress-Aperture Coupled Model. Int. J. Geomech. 2021, 21, 04021195. [Google Scholar] [CrossRef]
  18. Yang, J.; Fu, L.-Y.; Fu, B.-Y.; Wang, Z.; Hou, W. High-temperature effect on the material constants and elastic moduli for solid rocks. J. Geophys. Eng. 2021, 18, 583–593. [Google Scholar] [CrossRef]
  19. Demirci, A.; Görgülü, K.; Durutürk, Y.S. Thermal conductivity of rocks and its variation with uniaxial and triaxial stress. Int. J. Rock Mech. Min. 2004, 41, 1133–1138. [Google Scholar] [CrossRef]
  20. Kumari, W.G.P.; Ranjith, P.G.; Perera, M.S.A.; Shao, S.; Chen, B.K.; Lashin, A.; Al Arifi, N.; Rathnaweera, T.D. Mechanical behaviour of Australian Strathbogie granite under in-situ stress and temperature conditions: An application to geothermal energy extraction. Geothermics 2017, 65, 44–59. [Google Scholar] [CrossRef]
  21. Deng, S.; Zhang, Y.; Yan, X.; Yang, S.; Li, C.; Peng, H. Experimental study on P-wave response characteristics of hot dry rock under high temperature and high confining pressure. Geomech. Energy Environ. 2023, 36, 100514. [Google Scholar] [CrossRef]
  22. Zhou, Q.; Zhu, Z.; Liu, W.; Lu, H.; Fan, Z.; Nie, X.; Li, C.; Wang, J.; Ren, L. Hydraulic fracturing behaviors of shale under coupled stress and temperature conditions simulating different burial depths. Int. J. Min. Sci. Technol. 2024, 34, 783–797. [Google Scholar] [CrossRef]
  23. Yang, J.P.; Chen, W.Z.; Yang, D.S.; Tian, H.M. Estimation of Elastic Moduli of Non-persistent Fractured Rock Masses. Rock Mech. Rock Eng. 2016, 49, 1977–1983. [Google Scholar] [CrossRef]
  24. Wu, F.Q.; Deng, Y.; Wu, J.; Li, B.; Sha, P.; Guan, S.G.; Zhang, K.; He, K.Q.; Liu, H.D.; Qiu, S.H. Stress-strain relationship in elastic stage of fractured rock mass. Eng. Geol. 2020, 268, 105498. [Google Scholar] [CrossRef]
  25. Hua, D.J.; Jiang, Q.H.; Liu, R.Y.; Gao, Y.C.; Yu, M. Rock mass deformation modulus estimation models based on in situ tests. Rock Mech. Rock Eng. 2021, 54, 5683–5702. [Google Scholar] [CrossRef]
  26. Malkowski, P.; Ostrowski, L. The Methodology for the Young Modulus Derivation for Rocks and Its Value. Procedia Eng. 2017, 191, 134–141. [Google Scholar] [CrossRef]
  27. Zhao, H.; Shi, C.; Zhao, M.; Li, X. Statistical Damage Constitutive Model for Rocks Considering Residual Strength. Int. J. Geomech. 2017, 17, 04016033. [Google Scholar] [CrossRef]
  28. Xu, X.L.; Gao, F.; Zhang, Z.Z. Thermo-mechanical coupling damage constitutive model of rock based on the Hoek-Brown strength criterion. Int. J. Damage Mech. 2018, 27, 1213–1230. [Google Scholar] [CrossRef]
  29. Chen, Y.; Xiao, P.; Du, X.; Wang, S.; Wang, Z.; Azzam, R. Study on Damage Statistical Constitutive Model of Triaxial Compression of Acid-Etched Rock under Coupling Effect of Temperature and Confining Pressure. Materials 2021, 14, 7414. [Google Scholar] [CrossRef]
  30. Li, X.; Yin, Z.; Falsone, G. A Time-Dependent Creep Constitutive Model of Deep Surrounding Rock under Temperature-Stress Coupling. Math. Probl. Eng. 2021, 2021, 9938869. [Google Scholar] [CrossRef]
  31. Wong, L.N.Y.; Zhang, Y.; Wu, Z. Rock strengthening or weakening upon heating in the mild temperature range? Eng. Geol. 2020, 272, 105619. [Google Scholar] [CrossRef]
  32. Zhao, G.; Guo, Y.; Chang, X.; Jin, P.; Hu, Y. Effects of temperature and increasing amplitude cyclic loading on the mechanical properties and energy characteristics of granite. Bull. Eng. Geol. Environ. 2022, 81, 155. [Google Scholar] [CrossRef]
  33. Rao, G.M.N.; Murthy, C.R.L. Dual role of microcracks: Toughening and degradation. Can. Geotech. J. 2001, 38, 427–440. [Google Scholar] [CrossRef]
  34. Taheri, A.; Royle, A.; Yang, Z.; Zhao, Y. Study on variations of peak strength of a sandstone during cyclic loading. Geomech. Geophys. Geo-Energy Geo-Resour. 2015, 2, 1–10. [Google Scholar] [CrossRef]
  35. Lin, H.; Liu, J.; Yang, J.; Ran, L.; Ding, G.; Wu, Z.; Lyu, C.; Bian, Y. Analysis of damage characteristics and energy evolution of salt rock under triaxial cyclic loading and unloading. J. Energy Storage 2022, 56, 106145. [Google Scholar] [CrossRef]
  36. Miao, S.; Liu, Z.; Zhao, X.; Ma, L.; Zheng, Y.; Xia, D. Plastic and damage energy dissipation characteristics and damage evolution of Beishan granite under triaxial cyclic loading. Int. J. Rock Mech. Min. 2024, 174, 105644. [Google Scholar] [CrossRef]
  37. Tiang, Y.; Chen, H.; Xiong, L.; Xu, Z. Conventional triaxial loading and unloading test and PFC numerical simulation of rock with single fracture. Arch. Civil. Eng. 2024, 70, 233–254. [Google Scholar] [CrossRef]
  38. Krajcinovic, D.; Fonseka, G.U. The Continuous Damage Theory of Brittle Materials, Part 1: General Theory. J. Appl. Mech. 1981, 48, 809–815. [Google Scholar] [CrossRef]
  39. Fonseka, G.U.; Krajcinovic, D. The Continuous Damage Theory of Brittle Materials, Part 2: Uniaxial and Plane Response Modes. J. Appl. Mech. 1981, 48, 816–824. [Google Scholar] [CrossRef]
Figure 1. Installation of conventional uniaxial test rock samples and sensors: (a) rock sample encased in FEP heat shrink tubing; (b) installation of circumferential and axial strain gauges on the rock sample.
Applsci 14 09122 g001
Figure 2. GCTS high-temperature and high-pressure rock triaxial apparatus.
Applsci 14 09122 g002
Figure 3. Failure patterns of various rock types under triaxial and uniaxial compression: (a) failure patterns of granite under triaxial and uniaxial compression; (b) failure patterns of red sandstone under triaxial and uniaxial compression; (c) failure patterns of gray sandstone under triaxial and uniaxial compression; (d) failure patterns of shale under triaxial and uniaxial compression.
Applsci 14 09122 g003
Figure 4. Stress–strain curves of granite under different temperature conditions: (a) granite σ3 = 0 MPa; (b) granite σ3 = 5 MPa; (c) granite σ3 = 10 MPa; (d) granite σ3 = 15 MPa; (e) granite σ3 = 20 MPa; (f) granite σ3 = 25 MPa.
Applsci 14 09122 g004
Figure 5. Stress–strain curves of granite under different confining pressures: (a) granite T = 20 °C; (b) granite T = 40 °C; (c) granite T = 60 °C; (d) granite T = 80 °C; (e) granite T = 120 °C.
Applsci 14 09122 g005
Figure 6. Stress–strain curves of red sandstone under different temperature and confining pressure conditions: (a) red sandstone σ3 = 0 MPa; (b) red sandstone σ3 = 25 MPa; (c) red sandstone T = 20 °C; (d) red sandstone T = 120 °C.
Applsci 14 09122 g006
Figure 7. Stress–strain curves of gray sandstone under different temperature and confining pressure conditions: (a) gray sandstone σ3 = 0 MPa; (b) gray sandstone σ3 = 25 MPa; (c) gray sandstone T = 20 °C; (d) gray sandstone T = 120 °C.
Applsci 14 09122 g007
Figure 8. Stress–strain curves of shale under different temperature and confining pressure conditions: (a) shale σ3 = 0 MPa; (b) shale σ3 = 25 MPa; (c) shale T = 20 °C; (d) shale T = 120 °C.
Applsci 14 09122 g008
Figure 9. Schematic diagram for determining the E and the Et.
Applsci 14 09122 g009
Figure 10. Relationship diagrams of granite deformation modulus, tangent elastic modulus with temperature, and confining pressure: (a) relationship between granite deformation modulus and temperature; (b) relationship between granite tangent elastic modulus and temperature; (c) relationship between granite deformation modulus and confining pressures; (d) relationship between granite tangent elastic modulus and confining pressures.
Applsci 14 09122 g010
Figure 11. Relationship between tangent elastic modulus and temperature, confining pressure for different rocks: (a) relationship between red sandstone tangent elastic modulus and temperature; (b) relationship between red sandstone tangent elastic modulus and confining pressures; (c) relationship between gray sandstone tangent elastic modulus and temperature; (d) relationship between gray sandstone tangent elastic modulus and confining pressures; (e) relationship between shale tangent elastic mod-ulus and temperature; (f) relationship between shale tangent elastic mod-ulus and confining pressures.
Applsci 14 09122 g011
Figure 12. Comparison of model fitting goodness for four rock types under temperature influence.
Applsci 14 09122 g012
Figure 13. Comparison of model fitting goodness for four rock types under confining pressure influence.
Applsci 14 09122 g013
Figure 14. Fitting results of tangent elastic modulus in relation to temperature and confining pressure for rocks (The red dots in the graph indicate actual test data): (a) granite; (b) red sandstone; (c) gray sandstone; (d) shale.
Applsci 14 09122 g014
Figure 15. Comparison of theoretical and experimental stress–strain curves: (a) granite 20 °C, 0 MPa; (b) granite 120 °C, 25 MPa; (c) red sandstone 20 °C, 0 MPa; (d) red sandstone 120 °C, 25 MPa; (e) gray sandstone 20 °C, 0 MPa; (f) gray sandstone 120 °C, 25 MPa; (g) shale 20 °C, 0 MPa; (h) shale 120 °C, 25 MPa.
Applsci 14 09122 g015aApplsci 14 09122 g015b
Figure 16. Comparison of theoretical and experimental tangent elastic modulus.
Applsci 14 09122 g016
Figure 17. Comparison of theoretical and experimental peak stress and peak strain: (a) comparison of theoretical and experimental peak stress values; (b) comparison of theoretical and experimental peak strain values.
Applsci 14 09122 g017
Table 1. Uniaxial Compression Test Results.
Rock SpecimenPeak Strength/MPaAverage Uniaxial Compressive Strength/MPaStandard Value of Compression Strength/MPaUpper Limit of Stress/MPa
G-JZ-1119.96133.73115.4980.84
G-JZ-2133.72
G-JZ-3147.50
RS-JZ-125.4025.0421.3614.95
RS-JZ-221.98
RS-JZ-327.75
GS-JZ-1148.26158.17138.4796.93
GS-JZ-2151.24
GS-JZ-3175.03
SH-JZ-160.7260.2959.2841.49
SH-JZ-260.74
SH-JZ-359.42
Table 2. Fitting results of tangent elastic modulus under thermo-mechanical coupling.
ABCDER2
G−1.5519 × 10−50.00319−0.0105623.5382111.655260.98819
RS3.6669 × 10−6−0.002450.269882.369258.997860.81258
GS1.7180 × 10−4−0.028911.3526335.5820615.286930.71489
SH−1.5150 × 10⁻⁶−6.6366 × 10−50.110006.3830320.272300.95229
Table 3. Mechanical parameters of rocks under different thermo-mechanical coupling conditions.
Rock TypeT/°Cσ3/MPaσp/MPaεp/%φET/GPaυmF0
G200119.020.314544.930.156.5644.42
12025344.600.425081.020.2135.5993.30
RS20022.060.29458.270.2314.246.92
1202517.040.135311.930.221.0032.90
GS200150.220.454548.160.072.8068.49
12025289.530.4345113.340.350.94124.62
SH20059.090.484513.990.308.0720.98
12025102.630.634527.430.281.2480.31
Where σp is the peak stress; εp is the peak strain; φ is the internal friction angle; υ is the poisson ratio.
Table 4. Constitutive models for various rock types.
Rock TypeT/°Cσ3/MPaConstitutive Model
G200 σ l = 44.93 ε l exp [ ( 44.93 ε l ) ( 2.58 σ l ) 143.94 σ l 6.56 ]
12025 σ l = 105.04 ε l + 18.80 exp [ ( 81.02 ε l + 14.5 ) ( 2.66 σ l + 57.45 ) 306.05 σ l + 4437.78 35.59 ] + 14.5
RS200 σ l = 8.27 ε 1 exp [ ( 8.27 ε l ) ( 2.58 σ l ) 22.42 σ l 14.24 ]
12025 σ l = 11.93 ε l + 10.45 exp [ ( 15.98 ε l + 14 ) ( 2.71 σ l + 59.90 ) 108.69 σ l + 1521.62 1 ] + 14
GS200 σ l = 48.16 ε l exp [ ( 48.16 ε l ) ( 2.58 σ l ) 221.93 σ l 2.8 ]
12025 σ l = ( 114.26 ε l + 13.04 ) exp [ ( 65.17 ε l + 7.5 ) ( 2.58 σ l + 53.03 ) 403.82 σ l + 3028.61 0.94 ] + 7.5
SH200 σ l = 13.99 ε l exp [ ( 13.99 ε l ) ( 2.58 σ l ) 67.98 σ l 8.07 ]
12025 σ l = 38.04 ε l + 15.25 exp [ ( 27.43 ε l + 11 ) ( 2.58 σ l + 53.03 ) 260.23 σ l + 2862.58 1.24 ] + 11
Table 5. Theoretical and experimental tangent elastic modulus for different rock types.
Rock TypeT/°Cσ3/MPaEt/GPaEt’/GPaSpecific Value
G20044.9343.920.98
1202581.0280.681.00
RS2008.277.080.86
1202520.8120.710.99
GS20048.1647.580.99
1202565.7163.290.96
SH20013.9912.250.88
1202527.4326.710.98
Table 6. Theoretical peak strain values for different rock types.
Rock TypeT/°Cσ3/MPaσp/MPaσ‘p/MPaSpecific Valueεpεp’Specific Value
G200119.73121.311.010.320.321.00
12025344.60371.131.080.420.461.10
RS20022.0722.271.010.300.311.03
1202517.0418.201.090.130.171.31
GS200150.22154.481.030.450.461.02
12025293.08297.461.010.460.471.02
SH20059.0958.820.990.480.481.00
12025102.43105.591.030.630.771.00
Disclaimer/Publisher’s Note: The statements, opinions and data contained in all publications are solely those of the individual author(s) and contributor(s) and not of MDPI and/or the editor(s). MDPI and/or the editor(s) disclaim responsibility for any injury to people or property resulting from any ideas, methods, instructions or products referred to in the content.

