Article

Combining Dielectric and Hyperspectral Data for Apple Core Browning Detection

by
Hanchi Liu
1,
Jinrong He
1,2,*,
Yanxin Shi
1 and
Yingzhou Bi
2,*
1
College of Mathematics and Computer Science, Yan’an University, Yan’an 716000, China
2
Guangxi Key Laboratory of Human-Machine Interaction and Intelligent Decision, Nanning Normal University, Nanning 530100, China
*
Authors to whom correspondence should be addressed.
Appl. Sci. 2024, 14(19), 9136; https://doi.org/10.3390/app14199136
Submission received: 8 August 2024 / Revised: 1 October 2024 / Accepted: 2 October 2024 / Published: 9 October 2024
(This article belongs to the Section Agricultural Science and Technology)

Abstract

:
Apple core browning not only affects the nutritional quality of apples, but also poses a health risk to consumers. Therefore, there is an urgent need to develop a fast and reliable non-destructive detection method for apple core browning. To deal with the challenges of the long incubation period, strong infectivity, and difficulty in the prevention and control of apple core browning, a novel non-destructive detection method for apple core browning has been developed through combining hyperspectral imaging and dielectric techniques. To reduce the computational complexity of high-dimensional multi-view data, canonical correlation analysis is employed for feature dimensionality reduction. Then, the two low-dimensional vectors extracted from two different sensors are concatenated into one united feature vector; therefore, the information contained in the hyperspectral and dielectric data is fused to improve the detection accuracy of the non-destructive method. At last, five traditional classifiers, such as k-Nearest Neighbors, a support vector machine with radial basis function kernel and polynomial kernel, Decision Tree, and neural network, are trained on the fused feature vectors to discriminate apple core browning. The experimental results on our own constructed dataset have shown that the sensitivity, specificity, and precision of SVM with RBF kernel based on concatenated 70-dimensional feature vectors extracted via canonical correlation analysis reached 99.98%, 99.70%, and 99.70%, respectively, which achieved better results than other models. This study can provide theoretical assurance and technical support for further development of higher accuracy and lower-cost non-destructive detection devices for apple core browning.

1. Introduction

Shaanxi Province, located in the northwest of China, has become the leading apple production region due to its unique geographical and climatic conditions. Apple core browning is one of the major diseases affecting the internal quality of apples, as shown in Figure 1. Apple core browning, caused by Alternaria alternata [1], is characterized by a dark brown core that does not affect the edible portion. Typically, affected fruits detach prematurely during early growth. The disease originates in the core cavity, extending outward to create a yellow-brown moldy area. Due to the gradual, internal browning, detection is challenging, especially since early stages lack external signs. Consequently, crafting a rapid and non-destructive detection method in the post-harvest apple industry poses a significant difficulty.
Non-destructive detection methods for apple core browning have been a hot research topic in agricultural engineering, including optical, electrical, acoustic, nuclear magnetic resonance, machine vision, and electronic nose technology [2,3,4,5,6,7,8]. Among them, optical and electrical based methods have gained attention due to their relatively high accuracy and low detection cost. The application of hyperspectral technology in non-destructive detection of apple quality is relatively mature [9,10,11]. For example, it has been used for qualitative detection of apple texture quality [12], hardness [12], sugar content [13], acidity [14], and soluble solids [15]. In the detection of apple core browning, Shenderey et al. [16] achieved effective detection of apple core browning through transmission detection using a combination of a tungsten halogen light source and spectrometer. Li et al. [17] used principal component analysis to extract 20 principal components and established a discriminant model for apple core browning using the Fisher discriminant analysis. Due to the correlation between apple fruit size and the incidence of core browning, Zhang et al. [18] constructed a binary classification discriminant model for apple core browning based on the transmission spectral intensity values between 680 and 735 nm and apple diameter. To further assess the severity of apple core browning, Zhou et al. [19] divided the disease severity into four categories. Lei et al. [20] extracted spectral features from the visible/near-infrared spectral data of 140 apples and established an identification model using support vector machines. Another popular detection method is based on dielectric parameters [21,22,23,24,25]. For example, it can be used for freshness detection [26], variety identification detection of impact and static pressure damage [27,28], and prediction of soluble solid content [29]. Li et al. [30] used seven impedance parameters of Fuji apples at frequencies ranging from 100 Hz to 3.98 MHz, with a voltage of 1 V and a constant temperature of (20 ± 1) °C, to build an apple core browning classification model.
Although optical and electrical methods have been widely applied in the detection of apple core browning, a method combining hyperspectral image information and electrical characteristics for the non-destructive detection of apple core browning has not been reported. The combined application of optical and electrical methods in apple core browning detection aims to fully exploit the complementary information they provide. Optical methods, especially hyperspectral image information, offer a detailed description of the surface color, appearance features, and tissue structure of apples [31]. In contrast, electrical methods focus on the dielectric properties and internal moisture content of fruits [32,33]. Tissue changes and moisture distribution variations resulting from apple core browning can be identified through the measurement of electrical characteristics. Conducting research on non-destructive methods that integrate optical and electrical approaches is expected to further improve the accuracy and sensitivity of apple core browning detection. This research provides a theoretical basis and technical guidance for the development of non-destructive detection devices for apple core browning.
The main contributions of our article can be summarized as follows:
(1)
We constructed a dataset for apple core browning, which includes two-view data containing both hyperspectral and dielectric information. The dataset has a total of 265 apple samples and serves as a valuable resource for future research endeavors.
(2)
A non-destructive apple core browning detection method via combining hyperspectral imaging and dielectric parameters was proposed for accurate and efficient discrimination of apple core browning disease.
(3)
Experimental results demonstrated that the proposed non-destructive detection method outperforms traditional discriminant methods based on single detection data in terms of performance.

2. Data

2.1. Sample Preparation

The variety of apples used in the experiment was “Qin Guan”, harvested in October 2015 from an orchard in Baishui County, Shaanxi Province, China. Over 200 apples were selected, ensuring they were uniform in size and free from diseases. During the apple sampling, based on the farmer’s experience with the annual pattern of apple core browning, 265 apples showing signs of potential disease were selected and harvested from the orchard. A total of 265 apples were collected from the orchard and transported back to the laboratory. Upon arrival at the laboratory, the apples were allowed to naturally emit field heat at a room temperature of 20 °C for 24 h. Subsequently, they were placed in a cold storage room for testing. Before each test, the apples were taken out of the cold storage and left at room temperature overnight to reach thermal equilibrium. High-resolution spectral imaging and dielectric feature data collection were conducted once the apples reached temperature equilibrium. Finally, manual fruit dissection was performed to confirm the presence of apple core browning in 17 of the collected apples. Source codes and datasets are available at https://github.com/hejinrong/Apple_HSI_Dielectric (accessed on 1 October 2024).

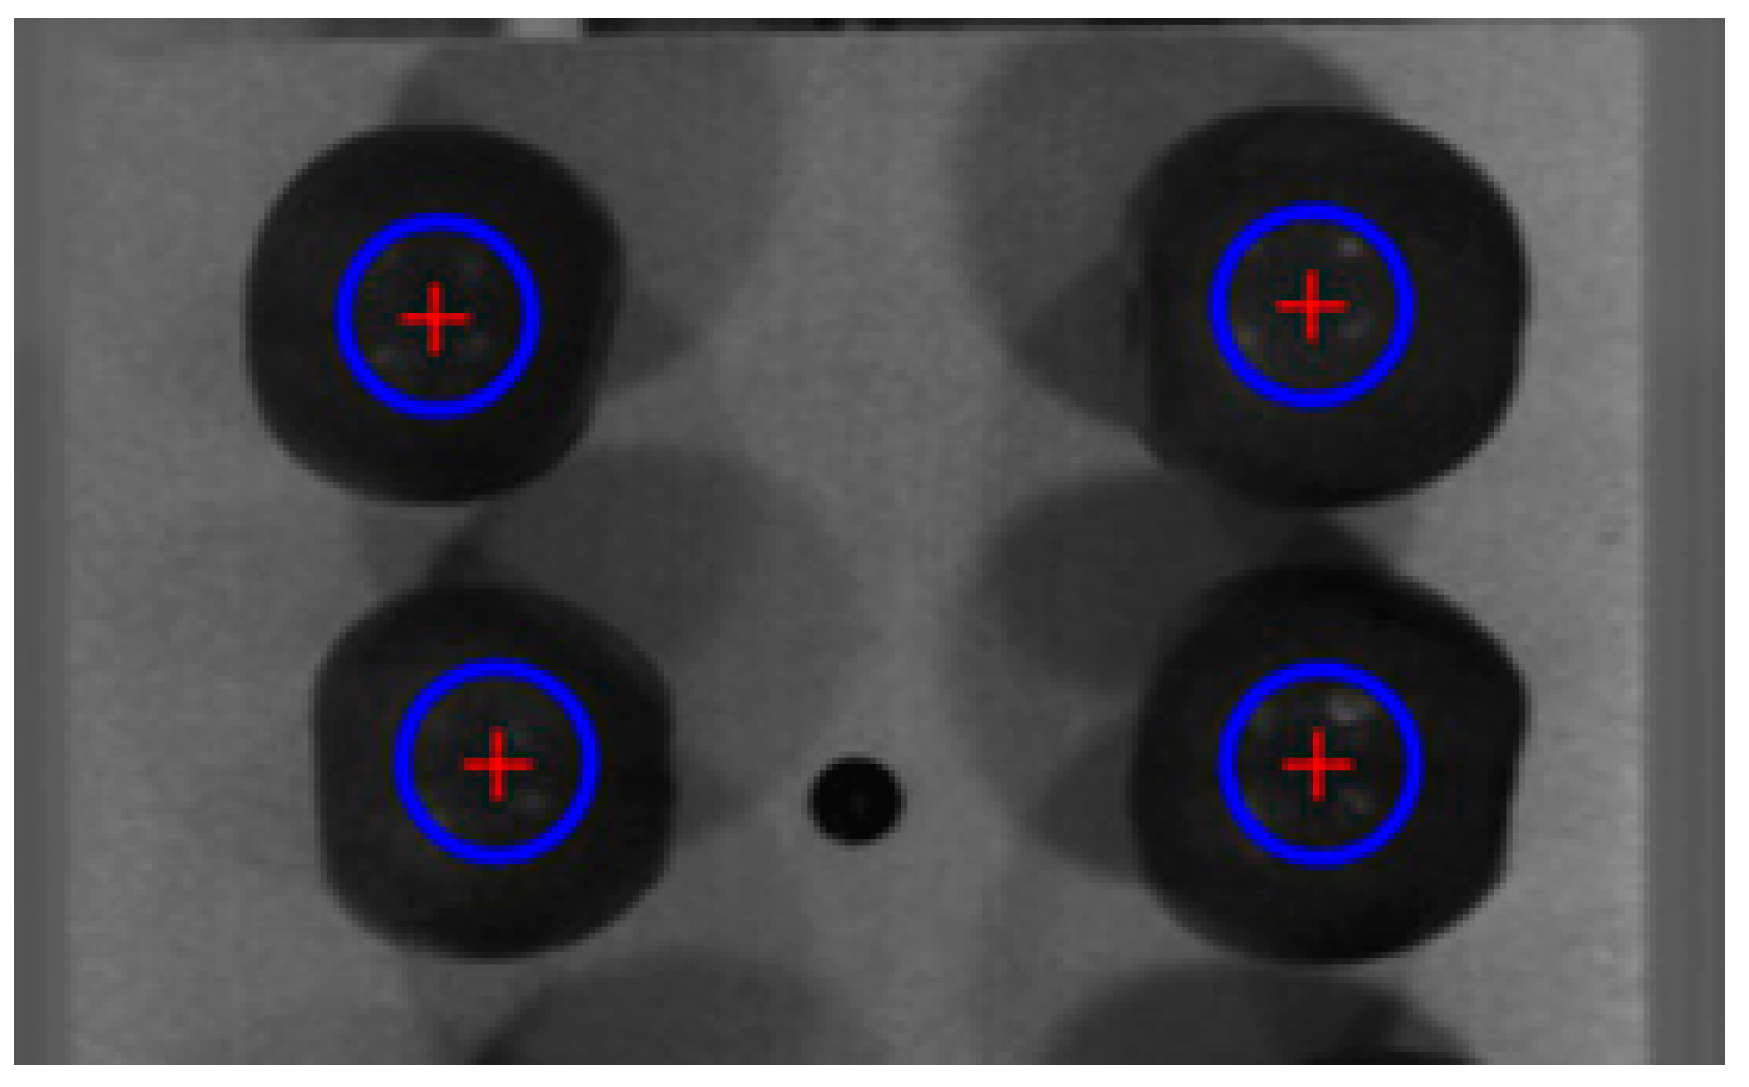
2.2. Acquisition of Hyperspectral Images

After the sample processing was completed, the hyperspectral device model HyperSIS-VNIR-PFH by the ZOLIX brand was used to acquire hyperspectral data from the samples. The data acquisition device is shown in Figure 2. The device is capable of capturing spectral range from 865.11 (nm) to 1711.71 (nm), with a spectral image taken every 3.32 nm, resulting in a total of 256 spectral reflectance images across different wavelengths. Each imaging session involved four apple samples.
The imaging device performed reflectance calibration on the hyperspectral images using a white calibration chart and a black calibration chart. The white calibration chart was made of polytetrafluoroethylene (PTFE) material, which has a reflectance close to 1. The black calibration chart was achieved through blocking the imaging lens to obtain an image with a reflectance close to 0. The reflectance calibration equation is as follows:
P i j = P i j D i j W i j D i j
where P i j represents the value of the pre-calibrated image at the i-th row and j-th column in the specified band. P i j represents the value of the post-calibrated image at the i-th row and j-th column in the specified band. D i j and W i j , respectively, represent the corresponding values of the black calibration image and white calibration image at the i-th row and j-th column. The files generated after imaging by this device include the hyperspectral source file (raw format) and its corresponding header file (hdr format).
After obtaining hyperspectral images, to acquire spectral information from the surface of an apple, the first step involved selecting a region of interest (ROI) to capture the image of the apple portion, as shown in Figure 3. Once the ROI was determined, the average spectrum of the ROI was calculated to represent the spectral information of that area. Subsequently, the obtained spectral vectors underwent data smoothing to eliminate noise, ultimately obtaining usable spectral information.

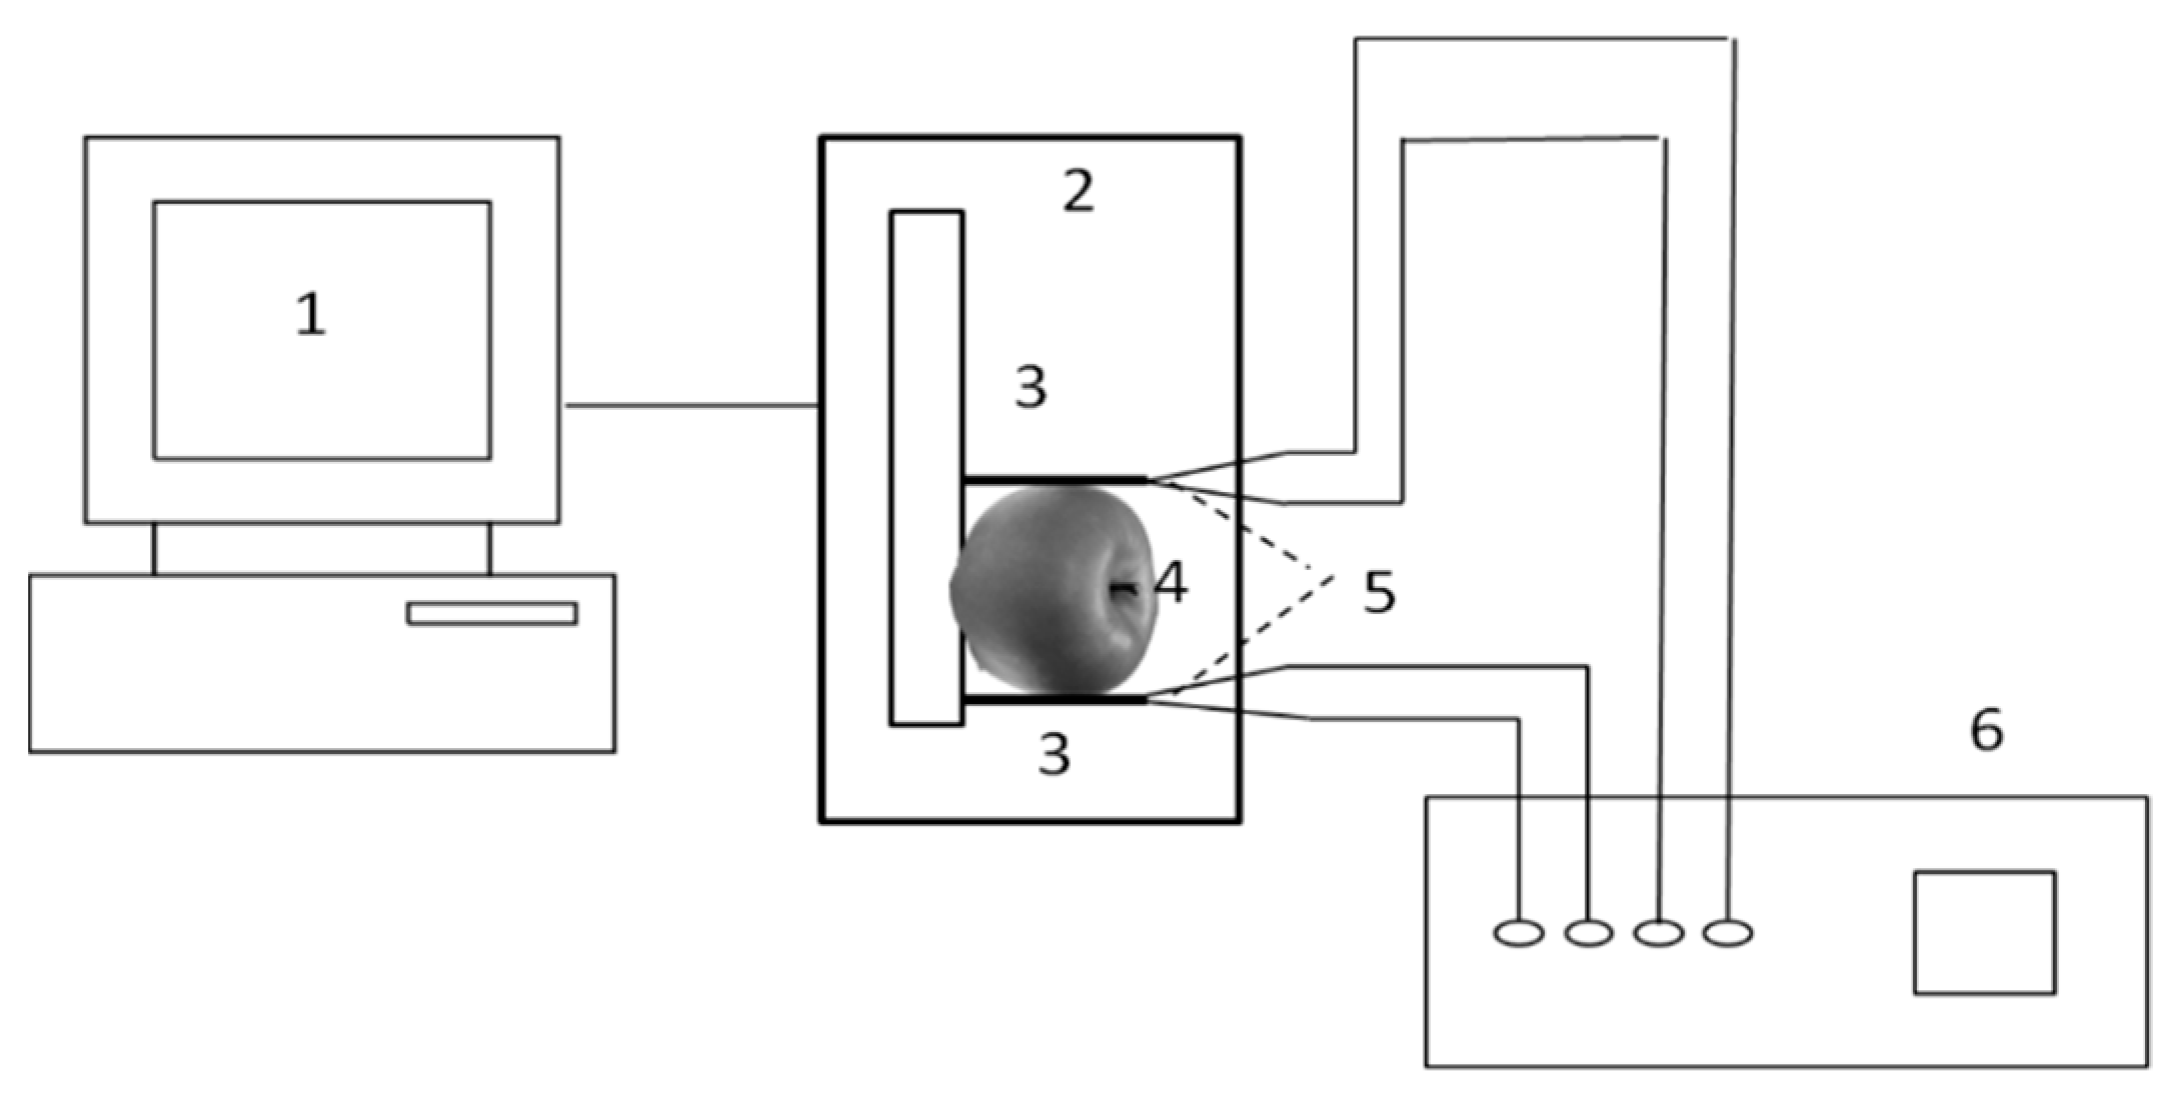
2.3. Dielectric Parameter Measurements

The system for measuring dielectric characteristic values primarily consisted of the Japanese Hioki 3532-50 LCR meter (HIOKI EUROPE GmbH, Eschborn, Germany), parallel plate electrodes, a shielded box, and a computer, as shown in Figure 4. The testing probe (fixture) used was the self-contained 9140 4-terminal testing probe of this instrument. The electrodes were square copper parallel plate electrodes with a side length of 6 cm and adjustable spacing. The testing conditions were as follows: the clamping pressure of the plates was kept constant at 3.5 N, the temperature was (20 ± 1) °C, and the testing voltage was a 1.0 V sinusoidal waveform. The measured results were directly inputted into the computer.
The Japanese Hioki 3532-50 LCR meter and parallel plate electrodes were used for non-destructive testing. Thirteen points were selected within the frequency range of 100 Hz to 3.98 MHz. Each suspected diseased fruit and good fruit were individually numbered and the dielectric parameters were measured one by one, including impedance (Z), dielectric loss factor (D), series equivalent inductance (Ls), conductance (G), impedance phase angle (deg), series equivalent capacitance (Cs), parallel equivalent inductance (Lp), parallel equivalent resistance (Rp), parallel equivalent capacitance (Cp), series equivalent resistance (Rs), and admittance (B), totaling 11 impedance parameters [32]. The measurement values for each fruit were obtained via averaging two repeated measurements taken along two perpendicular directions at its equator.

3. Method

Optical information and dielectric information represent different perspectives in multi-view learning. They can provide distinct features and information. By combining the information from these views, a more comprehensive and accurate feature representation can be obtained. The modeling process for multi-view data in this method is illustrated in Figure 5.

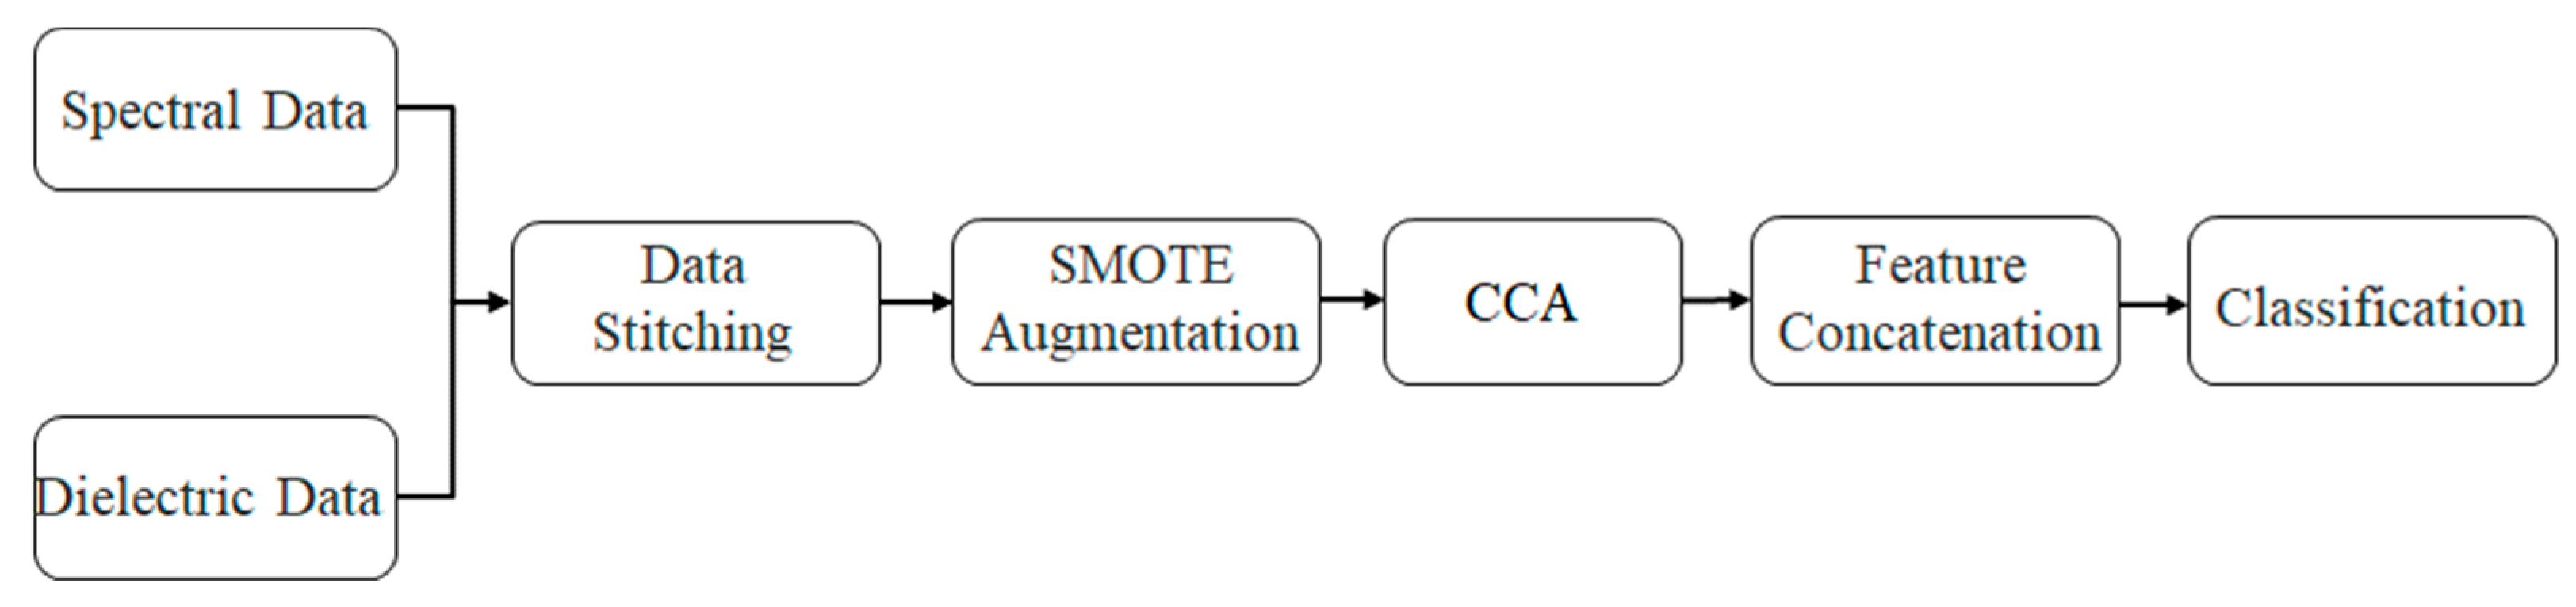
3.1. Data Pre-Processing

To fully utilize the hyperspectral imaging information and dielectric characteristics of apples for non-destructive detection of apple core browning, a multi-view learning approach was adopted to fuse the optoelectronic data of apples. The feature vectors from both views were merged using the concatenation method, and then the samples of core browning in the dataset were augmented using the SMOTE (Synthetic Minority Over-sampling Technique) method [34].
SMOTE is a method used to address data imbalance issues. It can expand the minority class samples in the dataset via generating synthetic samples. Since the number of core browning samples in the apple core browning dataset was small, the SMOTE method was used to generate new synthetic samples, thereby increasing the number of core browning samples in the dataset and improving the classification performance for detecting apple core browning.

3.2. Canonical Correlation Analysis

After concatenating photonic data, high-dimensional data often contain a significant amount of redundant information. This redundant information may not contribute to the performance of the model and can even lead to overfitting. By applying dimensionality reduction techniques, we can eliminate this redundancy and select the most relevant features, thereby improving the model’s performance. Canonical correlation analysis (CCA) is a multivariate statistical method that can be considered as a generalization of principal component analysis (PCA) for multiple views. CCA is commonly used for dimensionality reduction in raw data. Specifically, CCA maps two sets of variables to a lower-dimensional space, maximizing the correlation between the two sets of variables in the new lower-dimensional space.
Assuming we have two sets of variables, X and Y, each containing n samples and p1 and p2 features, respectively, represented as X = [x1, x2, …, xp1] and Y = [y1, y2, …, yp2], the CCA algorithm can be described in the following steps:
(1)
Compute the covariance matrix Cov(X, Y) between the two sets of variables.
(2)
Perform singular value decomposition (SVD) on the covariance matrix to obtain eigenvalues and eigenvectors, i.e., Cov(X, Y) = U × S × VT, where U and V are orthogonal matrices, and S is a diagonal matrix.
(3)
Calculate the projection matrices Wx and Wy for the two sets of variables to maximize the correlation after projection. Specifically, X and Y can be projected onto the subspace spanned by the first k eigenvectors of U and V, resulting in the projected data X’ and Y’, i.e., X’ = X × Wx and Y’ = Y × Wy, where Wx and Wy are orthogonal matrices of dimensions p 1 × p 1 and p 2 × p 2 , respectively.
(4)
Finally, compute the correlation coefficient r between the two sets of variables, given by r = maxi (sqrt( λ _ i )), where λ i represents the i-th eigenvalue.

3.3. Classification Models

3.3.1. K-Nearest Neighbors

The K-Nearest Neighbors (KNN) algorithm classifies based on the similarity between instances via calculating the distance between an unknown sample and each sample in the training set. It selects K samples with the closest distances and assigns their majority class as the predicted class for the unknown sample. The k-NN algorithm relies on the proximity relationship for classification, and it is highly sensitive to the distribution of classes in the dataset [35]. When a class is severely underrepresented in the dataset, the k-NN algorithm tends to exhibit bias, resulting in poorer classification performance for minority classes. Due to the imbalance in the apple rot dataset and the increased dimensionality after concatenating photonic and electronic features, distances between data samples became relatively uniform, causing a loss of differentiation in distance measurement. This weakened the ability of the KNN algorithm to rely on proximity relationships for classification.

3.3.2. Support Vector Machine

The support vector machine (SVM), abbreviated as SVM, is a supervised learning algorithm used for classification and regression analysis. Its main idea is to find a hyperplane that effectively separates data points of different classes and maximizes the margin (i.e., the distance from the points closest to the hyperplane to the hyperplane). The dataset for apple blue mold disease has a relatively small sample size, and SVM is capable of finding a more generalizable classification decision boundary in situations where the sample is limited [36]. In datasets with a small number of samples, the impact of noise and outliers on the model may be more significant. However, since SVM focuses on data points near the support vectors, it is relatively insensitive to noise and outliers far from the support vectors. This characteristic enables SVM to better handle exceptional cases in datasets with a small number of samples [37].

3.3.3. Decision Trees

The Decision Tree is a classification and regression method based on a tree-like structure. It recursively partitions the data through binary (or multi-way) splits, forming a tree structure where each node represents a feature, each branch represents a feature value, and the leaf nodes represent classification results or regression values. During the acquisition of multi-view photonic features for apples, sensors are inevitably affected by environmental factors, resulting in abnormal feature values. However, the Decision Tree constructs the model via partitioning the samples into different regions, and the abnormal values only affect a few leaf nodes. Therefore, the Decision Tree model exhibits robustness to abnormal feature values in multi-view photonic features [38].

3.3.4. Neural Network

A fully connected neural network (NN) is a basic feed-forward neural network model where each neuron is connected to all neurons in the previous layer. It consists of an input layer, hidden layers, and an output layer. The neural network can learn complex nonlinear mappings from the joint photonic and electronic feature data, thereby capturing better correlations between the data and considering information from different views. Additionally, neural networks are effective in handling high-dimensional data from the joint photonic and electronic features. This capability helps the model learn more complex features and relationships.

4. Experiment

4.1. Experimental Setup

We used a Windows 10 operating system, with an Intel I7-8750H CPU, 16 GB of RAM, and an Nvidia GTX 1060 graphics card. We also used the Keras 2.2.4 deep learning framework with Python version 3.7. The batch size was set to 2048. We split the training and testing sets using five-fold cross-validation and ran 20 iterations of five-fold cross-validation in each experiment.
Traditional model hyperparameters were as follows:
(1)
KNN: k = 3. Euclidean distance was used for distance calculation, and all sample points had equal weights.
(2)
Decision Tree: Gini impurity was used as the measure of classification quality. After multiple experiments, it was found that the tree performed best when the maximum depth was set to 30 for the test set.
(3)
SVM: Gaussian kernel and polynomial kernel used default parameters. The polynomial SVM performed best when the degree was set to 3.

4.2. Evaluation Metrics

Assuming that in the evaluation of experimental results, the number of samples that are truly diseased fruits and detected as diseased fruits is TP, the number of samples that are truly diseased fruits and detected as healthy fruits is TN, the number of samples that are truly healthy fruits and detected as diseased fruits is FP, and the number of samples that are truly healthy fruits and detected as healthy fruits is FN, the calculation formulas for evaluation metrics are as follows:
a c c u r a c y = T P + T N T P + T N + F P + F N
p r e c i s i o n = T P T P + F P
s e n s i t i v i t y = T P T P + F N
s p e c i f i c i t y = T N F P + T N
When quantitatively evaluating the core browning disease detection model, comprehensive consideration should be given to four metrics: accuracy, precision, sensitivity, and specificity. Taking into account cost sensitivity, the importance of these four metrics is ranked as follows: precision, sensitivity, specificity, and accuracy.

4.3. Experimental Results

4.3.1. Performance Evaluation of Methods

To validate the reliability of the combined dielectric parameter and hyperspectral data detection method, we conducted comparative experiments with traditional single-view detection methods on the apple core browning disease dataset and performed an Analysis of Variance (ANOVA) on the performance of the classifiers selected for each method. Table 1, Table 2, Table 3 and Table 4, respectively, show the final average and standard deviation results of the experiments using different classifiers for the hyperspectral detection method, dielectric detection method, combined detection method (without CCA), and combined detection method (with CCA). It can be observed that when using SVM (polynomial) as the classifier, the hyperspectral detection method (sensitivity: 0.8781 ± 0.0467, specificity: 0.8839 ± 0.0458, accuracy: 0.8819 ± 0.0554) and the dielectric detection method (sensitivity: 0.9680 ± 0.0220, specificity: 0.8575 ± 0.0364, accuracy: 0.8367 ± 0.0476) achieved the best detection results in terms of significant differences in the three metrics.
The combined detection method without CCA (sensitivity: 0.9909 ± 0.0244, specificity: 0.9227 ± 0.0393, accuracy: 0.9152 ± 0.0469) achieved the most significant results when it used a neural network as the classifier, which is consistent with the findings of Alaloul W S et al. (2023) [39] on the effectiveness of neural networks in handling complex data patterns. Additionally, the combined detection method (without CCA) with different classifiers for classifying the multi-view data outperformed the single-view hyperspectral detection method and the single-view dielectric feature detection method, further supporting the practicality of multi-source data fusion in detection tasks as emphasized by Zhang et al. [40].
The combined detection method (with CCA), compared to the combined detection method (without CCA), incorporated CCA feature dimension reduction. After dimension reduction, the number of hyperspectral features and dielectric signal features was reduced to 35 each. The concatenated 70-dimensional data were then fed into the classifier. Table 1 shows that using SVM (RBF) as the classifier yielded the best results (sensitivity: 0.9998 ± 0.0020, specificity: 0.9970 ± 0.0076, accuracy: 0.9970 ± 0.0077) for the combined detection method (with CCA). Furthermore, the combined detection method (with CCA) showed improved detection performance compared with the combined detection method (without CCA), indicating that CCA maximized the classifier performance without losing important information. The enhancement in detection performance with CCA is attributed to its ability to sift through a vast array of hyperspectral and dielectric property data, extracting key feature information that captured the internal quality changes in apples [41].

4.3.2. Impact of CCA Target Dimension

The target dimension after CCA dimensionality reduction has an impact on the classification performance of the classifier for the reduced data, and Hua et al. [42] have indicated that there is an optimal balance between dimension and classifier performance. To avoid redundant data and information loss, we conducted experiments to determine the optimal number of target dimensions. Figure 6 illustrates the influence of target data dimensions on the sensitivity, specificity, and accuracy of different classification models. From this figure, it can be observed that after the target dimension reached 35, the sensitivity, specificity, and accuracy of the classification models tended to stabilize. Excessive dimensions contained redundant data information that did not contribute to the performance improvement of the classification models. Therefore, we chose to reduce the number of hyperspectral features and dielectric signal features to 35 each, as it provided a good balance between avoiding redundancy and preserving classification model performance.

4.3.3. Impact of Neural Network Architecture

For specific tasks, there is a significant variation in high classification accuracy achieved by different network depths and neuron counts [43]. In the combined detection method (with CCA), using a neural network as the classifier required exploring the number of hidden layers and the number of neurons in each layer to determine the optimal network structure. Table 5 presents the relationship between the hidden layer structure and classification metrics (sensitivity, specificity, accuracy). From this table, it can be observed that using a two-layer hidden layer structure yielded significantly higher specificity and accuracy compared with a single-layer hidden layer structure. Furthermore, the classification performance reached its optimum when the number of neurons in the hidden layers was set to 128 and 64, respectively.

4.4. Discussions

The experimental results demonstrate that the multi-view combined detection method has a significant advantage in improving the diagnostic accuracy of apple core browning. This finding aligns with recent research trends advocating for multi-source data fusion, such as the work of [44,45], who also highlight the benefits of integrating different types of sensor data for enhanced prediction capabilities. The enhancement in the detection performance of our method can be attributed to its ability to capture subtle biological and physical changes associated with apple core rot disease. Specifically, the integration of hyperspectral and dielectric data provided a more comprehensive view of the fruit’s condition, reflecting visual characteristics such as color and texture, as well as subsurface electrical properties like conductivity and dielectric constant, which often indicate internal decay. This comprehensive approach is supported by studies like [46], where the fusion of different data types led to improved detection of internal defects in fruits.
The application of canonical correlation analysis (CCA) for feature dimension reduction plays an important role in enhancing the performance of the optoelectronic fusion detection technique, as suggested by [47] in their work on feature extraction methods for hyperspectral data. By simplifying the feature set to the most representative hyperspectral and dielectric attributes, it minimizes the interference of noise and irrelevant information, thereby highlighting the features that predict browning, which is particularly effective in high-dimensional data environments. This aligns with the findings of [48], who demonstrated that CCA can effectively reduce dimensionality while preserving the most informative features for classification tasks.
The SVM (radial basis function) classifier chosen in our study exhibited superior performance compared with other classifiers we evaluated. Its proficiency in handling complex data patterns made it a contributing factor to its robust classification performance in our dataset, as it effectively navigated decision boundaries in the high-dimensional feature space combined from optical and dielectric data. This is consistent with the observations by [49,50], who reported that a SVM with RBF kernels is effective in classification problems involving complex patterns and high-dimensional data. Furthermore, ref. [51] demonstrated that careful parameter tuning of the SVM can lead to further improvements in classification accuracy.

5. Conclusions

This study fully leveraged the advantages of hyperspectral imaging and dielectric technology, enhancing detection accuracy through data fusion and feature reduction. A method suitable for non-destructive detection of apple core rot disease was developed. Experimental results show that the multi-view optoelectronic fusion detection method (utilizing canonical correlation analysis and a support vector machine with a radial basis function) achieved a sensitivity of 99.98%, specificity of 99.70%, and accuracy of 99.70%, demonstrating reliable and accurate non-destructive detection of apple core rot disease.
This method is not only applicable to non-destructive detection of apple core browning but also holds broad prospects in the agricultural field. Its potential for extension to the quality testing of other agricultural products marks a crucial step towards agricultural production intelligence, providing an innovative solution for improving product quality and reducing agricultural losses. However, the experimental results have certain limitations, such as sample constraints and differences between laboratory conditions and real-world environments. Future research efforts could focus on expanding the sample range, considering environmental factors, optimizing data fusion methods, and developing real-time monitoring systems to enhance model applicability, robustness, and practicality. Integration into intelligent fruit quality management systems could further serve agriculture production and food safety.

Author Contributions

Conceptualization, H.L. and J.H.; methodology, H.L.; software, Y.S.; validation, Y.B., with support from J.H.; formal analysis, H.L.; investigation, H.L. and Y.S.; resources, Y.B.; writing—original draft preparation, H.L.; writing—review and editing, J.H.; supervision, J.H. All authors have read and agreed to the published version of the manuscript.

Funding

This research was funded by the National Natural Science Foundation of China under grant number 62366053, the Open Research Fund of Guangxi Key Lab of Human-machine Interaction and Intelligent Decision under grant number GXHIID2204, and the “Unveiling and Commanding” Special Research Program of Yan’an University under grant number 2023JBZR-021.

Institutional Review Board Statement

Not applicable.

Informed Consent Statement

Not applicable.

Data Availability Statement

The raw data supporting the conclusions of this article can be made available by the authors upon reasonable request.

Acknowledgments

The authors would like to thank all the anonymous reviewers and editors for their valuable comments.

Conflicts of Interest

The authors declare no conflicts of interest.

References

  1. Gao, L.L.; Zhang, Q.; Sun, X.Y.; Jiang, L.; Zhang, R.; Sun, G.Y.; Zha, Y.L.; Biggs, A.R. Etiology of moldy core, core browning, and core rot of Fuji apple in China. Plant Dis. 2013, 97, 510–516. [Google Scholar] [CrossRef] [PubMed]
  2. Moscetti, R.; Monarca, D.; Cecchini, M.; Haff, R.P.; Contini, M.; Massantini, R. Detection of mold-damaged chestnuts by near-infrared spectroscopy. Postharvest Biol. Technol. 2014, 93, 83–90. [Google Scholar] [CrossRef]
  3. Soltani, M.; Alimardani, R.; Omid, M. Evaluating banana ripening status from measuring dielectric properties. J. Food Eng. 2011, 105, 625–631. [Google Scholar] [CrossRef]
  4. Morrison, D.S.; Abeyratne, U.R. Ultrasonic technique for non-destructive quality evaluation of oranges. J. Food Eng. 2014, 141, 107–112. [Google Scholar] [CrossRef]
  5. Wang, S.Y.; Wang, P.C.; Faust, M. Non-destructive detection of watercore in apple with nuclear magnetic resonance imaging. Sci. Hortic. 1988, 35, 227–234. [Google Scholar] [CrossRef]
  6. Blasco, J.; Aleixos, N.; Moltó, E. Machine Vision System for Automatic Quality Grading of Fruit. Biosyst. Eng. 2003, 85, 415–423. [Google Scholar] [CrossRef]
  7. Benedetti, S.; Buratti, S.; Spinardi, A.; Mannino, S.; Mignani, I. Electronic nose as a non-destructive tool to characterise peach cultivars and to monitor their ripening stage during shelf-life. Postharvest Biol. Technol. 2008, 47, 181–188. [Google Scholar] [CrossRef]
  8. Lan, W.; Jaillais, B.; Renard, C.M.; Leca, A.; Chen, S.; Le Bourvellec, C.; Bureau, S. A method using near infrared hyperspectral imaging to highlight the internal quality of apple fruit slices. Postharvest Biol. Technol. 2021, 175, 111497. [Google Scholar] [CrossRef]
  9. Wan, C.; Yue, R.; Li, Z.; Fan, K.; Chen, X.; Li, F. Prediction of Kiwifruit Sweetness with Vis/NIR Spectroscopy Based on Scatter Correction and Feature Selection Techniques. Appl. Sci. 2024, 14, 4145. [Google Scholar] [CrossRef]
  10. Bhattacharyya, C.; Kim, S. Black Ice Classification with Hyperspectral Imaging and Deep Learning. Appl. Sci. 2023, 13, 11977. [Google Scholar] [CrossRef]
  11. Miao, R.; Wu, J.; Yang, H.; Huang, F. Nectarine Disease Identification Based on Color Features and Label Sparse Dictionary Learning with Hyperspectral Images. Appl. Sci. 2023, 13, 11904. [Google Scholar] [CrossRef]
  12. Lu, R. Nondestructive measurement of firmness and soluble solids content for apple fruit using hyperspectral scattering images. Sens. Instrum. Food Qual. Saf. 2007, 1, 19–27. [Google Scholar] [CrossRef]
  13. Ma, X.; Luo, H.; Zhang, F.; Gao, F. Study on the influence of region of interest on the detection of total sugar content in apple using hyperspectral imaging technology. Food Sci. Technol. 2022, 42, e87922. [Google Scholar] [CrossRef]
  14. Zhang, Y.; Chen, Y.; Wu, Y.; Cui, C. Accurate and nondestructive detection of apple brix and acidity based on visible and near-infrared spectroscopy. Appl. Opt. 2021, 60, 4021–4028. [Google Scholar] [CrossRef] [PubMed]
  15. Wang, F.; Zhao, C.; Yang, H.; Jiang, H.; Li, L.; Yang, G. Non-destructive and in-site estimation of apple quality and maturity by hyperspectral imaging. Comput. Electron. Agric. 2022, 195, 106843. [Google Scholar] [CrossRef]
  16. Shenderey, C.; Shmulevich, I.; Alchanatis, V.; Egozi, H.; Hoffman, A.; Ostrovsky, V.; Lurie, S.; Ben Arie, R.; Schmilovitch, Z. NIRS Detection of Moldy Core in Apples. Food Bioprocess Technol. 2010, 3, 79–86. [Google Scholar] [CrossRef]
  17. Li, S.; Zhang, L.; Liu, X.; Li, G. Discriminant analysis of apple moldy core using near infrared diffuse reflectance spectroscopy based on principal component analysis. Trans. Chin. Soc. Agric. Mach. 2011, 42, 158–161. [Google Scholar]
  18. Zhang, H.; Chen, K.; Su, D.; Hu, J.; Zhang, Z. Design of nondestructive detection device for moldy core in apples based on characteristic spectrum. Trans. Chin. Soc. Agric. Eng. 2016, 32, 255–262. [Google Scholar]
  19. Zhou, Z.Y.; He, D.J.; Zhang, H.H.; Lei, Y.; Su, D.; Chen, K.T. Non-destructive detection of moldy core in apple fruit based on deep belief network. Food Sci. 2017, 38, 297–303. [Google Scholar]
  20. Lei, Y.; He, D.J.; Zhou, Z.Y.; Zhang, H.H.; Su, D. Detection of moldy core of apples based on visible/near infrared transmission energy spectroscopy. Trans. Chin. Soc. Agricult. Mach. 2016, 47, 193–200. [Google Scholar]
  21. Guo, W.-C.; Nelson, S.O.; Trabelsi, S.; Kays, S.J. 10–1800-MHz dielectric properties of fresh apples during storage. J. Food Eng. 2007, 83, 562–569. [Google Scholar] [CrossRef]
  22. Guo, W.; Zhu, X.; Zou, Y. Electrical properties of apples during ripening. Trans. Chin. Soc. Agric. Eng. 2007, 23, 264–268. [Google Scholar]
  23. Bian, H.; Tu, P. The simultaneous monitoring of physiological change of apple based on dielectric parameters in static pressure. J. Chin. Inst. Food Sci. Technol 2019, 19, 279–285. [Google Scholar]
  24. Fanrong, K.; Wenchuan, G. Relationship between dielectric properties and physicochemical properties of apples during late developmental period. Food Sci. 2016, 37, 13–17. [Google Scholar]
  25. Cai, C.; Li, Y.; Ma, H.; Li, X. Nondestructive classification of internal quality of apple based on dielectric feature selection. Trans. Chin. Soc. Agric. Eng. 2013, 29, 279–287. [Google Scholar]
  26. Guo, W.; Zhu, X.; Guo, K. Relationship between electrical properties and physiological properties of postharvest apples and its applications. Trans. CSAE 2005, 21, 136–139. [Google Scholar]
  27. Guo, W.C.; Guo, K.Q.; Zhu, X.H. Application of dielectric properties in identifying species of tomatoes and apples. Trans. Chin. Soc. Agric. Mach. 2006, 37, 130–132. [Google Scholar]
  28. Kangquan, G. Influence of damages on electrical parameter values of apples. J. Agric. Mach. 2006, 37, 133–135. [Google Scholar]
  29. Guo, W.C.; Shang, L.; Wang, M.H.; Zhu, X.H. Soluble solids content detection of postharvest apples based on frequency spectrum of dielectric parameters. Trans. Chin. Soc. Agric. Mach. 2013, 44, 132–137. [Google Scholar]
  30. Fang, L.; Cai, C.; Hui-ling, M.A.; Wang, S.L.; Wang, Y. Nondestructive detection of apple mouldy core based on bioimpedance properties. Food Sci 2013, 34, 197–202. [Google Scholar]
  31. Lorente, D.; Aleixos, N.; Gómez-Sanchis, J.; Cubero, S.; García-Navarrete, O.L.; Blasco, J. Recent advances and applications of hyperspectral imaging for fruit and vegetable quality assessment. Food Bioprocess Technol. 2012, 5, 1121–1142. [Google Scholar] [CrossRef]
  32. Bian, H.; Shi, P.; Tu, P. Determination of physicochemical quality of bruised apple using dielectric properties. J. Food Meas. Charact. 2020, 14, 2590–2599. [Google Scholar] [CrossRef]
  33. Birla, S.L.; Wang, S.; Tang, J.; Tiwari, G. Characterization of radio frequency heating of fresh fruits influenced by dielectric properties. J. Food Eng. 2008, 89, 390–398. [Google Scholar] [CrossRef]
  34. Chawla, N.V.; Bowyer, K.W.; Hall, L.O.; Kegelmeyer, W.P. SMOTE: Synthetic minority over-sampling technique. J. Artif. Intell. Res. 2002, 16, 321–357. [Google Scholar] [CrossRef]
  35. García, V.; Mollineda, R.A.; Sánchez, J.S. On the k-NN performance in a challenging scenario of imbalance and overlapping. Pattern Anal. Appl. 2008, 11, 269–280. [Google Scholar] [CrossRef]
  36. Huang, S.; Cai, N.; Pacheco, P.P.; Narandes, S.; Wang, Y.; Xu, W. Applications of support vector machine (SVM) learning in cancer genomics. Cancer Genom. Proteom. 2018, 15, 41–51. [Google Scholar]
  37. Cherkassky, V.; Ma, Y. Practical selection of SVM parameters and noise estimation for SVM regression. Neural Netw. 2004, 17, 113–126. [Google Scholar] [CrossRef] [PubMed]
  38. Ghosh, A.; Manwani, N.; Sastry, P.S. On the robustness of decision tree learning under label noise. In Proceedings of the Advances in Knowledge Discovery and Data Mining: 21st Pacific-Asia Conference, PAKDD 2017, Jeju, Republic of Korea, 23–26 May 2017; Proceedings, Part I 21. Springer International Publishing: Berlin/Heidelberg, Germany, 2017; pp. 685–697. [Google Scholar]
  39. Alaloul, W.S.; Qureshi, A.H. Data processing using artificial neural networks. In Dynamic Data Assimilation-Beating the Uncertainties; Books on Demand GmbH: Norderstedt, Germany, 2020. [Google Scholar]
  40. Zhang, P.; Li, T.; Wang, G.; Wang, D.; Lai, P.; Zhang, F. A multi-source information fusion model for outlier detection. Inf. Fusion 2023, 93, 192–208. [Google Scholar] [CrossRef]
  41. Sakar, C.O.; Kursun, O.; Gurgen, F. A feature selection method based on kernel canonical correlation analysis and the minimum redundancy–maximum relevance filter method. Expert Syst. Appl. 2012, 39, 3432–3437. [Google Scholar] [CrossRef]
  42. Hua, J.; Tembe, W.D.; Dougherty, E.R. Performance of feature-selection methods in the classification of high-dimension data. Pattern Recognit. 2009, 42, 409–424. [Google Scholar] [CrossRef]
  43. Safran, I.; Reichman, D.; Valiant, P. How Many Neurons Does it Take to Approximate the Maximum? In Proceedings of the 2024 Annual ACM-SIAM Symposium on Discrete Algorithms (SODA). Society for Industrial and Applied Mathematics, Alexandria, VA, USA, 7–10 January 2024; pp. 3156–3183. [Google Scholar]
  44. Cvetek, D.; Muštra, M.; Jelušić, N.; Tišljarić, L. A survey of methods and technologies for congestion estimation based on multisource data fusion. Appl. Sci. 2021, 11, 2306. [Google Scholar] [CrossRef]
  45. Lu, M.; Chen, B.; Liao, X.; Yue, T.; Yue, H.; Ren, S.; Li, X.; Nie, Z.; Xu, B. Forest types classification based on multi-source data fusion. Remote Sens. 2017, 9, 1153. [Google Scholar] [CrossRef]
  46. Ping, J.; Ying, Z.; Hao, N.; Miao, P.; Ye, C.; Liu, C.; Li, W. Rapid and non-destructive identification of Panax ginseng origins using hyperspectral imaging, visible light imaging, and X-ray imaging combined with multi-source data fusion strategies. Food Res. Int. 2024, 192, 114758. [Google Scholar] [CrossRef] [PubMed]
  47. Toker, K.G.; Yüksel, S.E. Deep canonical correlation analysis for hyperspectral image classification. In Proceedings of the Remote Sensing of the Ocean, Sea Ice, Coastal Waters, and Large Water Regions 2019, Strasbourg, France, 9–12 September 2019; Volume 11150, pp. 63–69. [Google Scholar]
  48. Tang, Y.; Chen, D.; Li, X. Dimensionality reduction methods for brain imaging data analysis. ACM Comput. Surv. (CSUR) 2021, 54, 1–36. [Google Scholar] [CrossRef]
  49. Hussain, S.F. A novel robust kernel for classifying high-dimensional data using Support Vector Machines. Expert Syst. Appl. 2019, 131, 116–131. [Google Scholar] [CrossRef]
  50. Cervantes, J.; Garcia-Lamont, F.; Rodríguez-Mazahua, L.; Lopez, A. A comprehensive survey on support vector machine classification: Applications, challenges and trends. Neurocomputing 2020, 408, 189–215. [Google Scholar] [CrossRef]
  51. Dioşan, L.; Rogozan, A.; Pecuchet, J.P. Improving classification performance of support vector machine by genetically optimising kernel shape and hyper-parameters. Appl. Intell. 2012, 36, 280–294. [Google Scholar] [CrossRef]
Figure 1. Healthy and core browning apples. (a) Healthy apple. (b) Core browning apple.
Applsci 14 09136 g001
Figure 2. Hyperspectral imaging equipment. 1. CCD camera; 2. CCD array detector; 3. lens; 4. light source; 5. motorized stage; 6. dark box; 7. motor control box; 8. motor; 9. computer.
Applsci 14 09136 g002
Figure 3. Area of spectral information extraction.
Applsci 14 09136 g003
Figure 4. Schematic of experimental apparatus to measure dielectric property. 1. computer; 2. shielding box r; 3. two parallel iron plates; 4. sample; 5. clip test probe; 6. LCR teste.
Applsci 14 09136 g004
Figure 5. The modeling process for combining dielectric and hyperspectral data.
Applsci 14 09136 g005
Figure 6. The effect of the reduced dimensionality on the detection performance. (a) The effect of the reduced dimensionality on the sensitivity. (b) The effect of the reduced dimensionality on the specificity. (c) The effect of the reduced dimensionality on the accuracy.
Applsci 14 09136 g006
Table 1. Comparison of results for five classifiers in hyperspectral detection method.
ClassifierSensitivity (%)Specificity (%)Accuracy (%)Significance
KNN86.73 ± 5.2370.76 ± 4.4362.26 ± 7.94 **
SVM (RBF)76.02 ± 5.2068.00 ± 3.7462.00 ± 6.56*
SVM (Poly)87.81 ± 4.6788.39 ± 4.5888.19 ± 5.54***
Decision Trees85.56 ± 4.7880.92 ± 4.3779.39 ± 5.52**
FCNN84.33 ± 6.4476.80 ± 4.2873.78 ± 6.66**
Note: Statistical significance levels are indicated as follows: * for significant, ** for highly significant, and *** for very highly significant differences. The data are presented in the form of mean ± standard deviation, with bold representing the optimal mean.
Table 2. Comparison of results for five classifiers in dielectric detection method.
ClassifierSensitivity (%)Specificity (%)Accuracy (%)Significance
KNN96.79 ± 2.7076.52 ± 3.4669.77 ± 5.87**
SVM (RBF)86.95 ± 4.7977.39 ± 4.0873.78 ± 6.17*
SVM (Poly)96.80 ± 2.2085.75 ± 3.6483.67 ± 4.76***
Decision Trees90.04 ± 4.5784.50 ± 3.9783.14 ± 5.18**
FCNN96.80 ± 3.3185.03 ± 3.7482.68 ± 5.06***
Note: Statistical significance levels are indicated as follows: * for significant, ** for highly significant, and *** for very highly significant differences. The data are presented in the form of mean ± standard deviation, with bold representing the optimal mean.
Table 3. Comparison of results for five classifiers in combined detection (w/o CCA).
ClassifierSensitivity (%)Specificity (%)Accuracy (%)Significance
KNN97.42 ± 2.7678.64 ± 4.4573.00 ± 7.05*
SVM (RBF)96.57 ± 3.7179.26 ± 3.9374.31 ± 5.83*
SVM (Poly)99.57 ± 0.9190.38 ± 3.6589.21 ± 4.53**
Decision Trees89.86 ± 5.2285.27 ± 4.6884.16 ± 5.77*
FCNN99.09 ± 2.4492.27 ± 3.9391.52 ± 4.69***
Note: Statistical significance levels are indicated as follows: * for significant, ** for highly significant, and *** for very highly significant differences. The data are presented in the form of mean ± standard deviation, with bold representing the optimal mean.
Table 4. Comparison of results for five classifiers in combined detection (w/CCA).
ClassifierSensitivity (%)Specificity (%)Accuracy (%)Significance
KNN100.00 ± 0.0068.45 ± 3.2853.59 ± 6.85*
SVM (RBF)99.98 ± 0.2099.70 ± 0.7699.70 ± 0.77***
SVM (Poly)100.00 ± 0.0090.28 ± 3.1689.09 ± 3.94**
Decision Trees96.19 ± 2.9193.21 ± 3.9792.85 ± 4.38**
FCNN100.00 ± 0.0094.17 ± 2.6993.74 ± 3.03**
Note: Statistical significance levels are indicated as follows: * for significant, ** for highly significant, and *** for very highly significant differences. The data are presented in the form of mean ± standard deviation, with bold representing the optimal mean.
Table 5. The impact of hidden layer results on detection performance.
Hidden Layer ArchitectureSensitivity ± SD (%)Specificity ± SD (%)Accuracy ± SD (%)
512100.00 ± 0.0090.48 ± 3.9289.28 ± 4.74
256–128100.00 ± 0.0093.33 ± 3.4392.73 ± 3.93
128–64100.00 ± 0.0094.17 ± 2.6993.74 ± 3.03
64–32100.00 ± 0.0093.57 ± 3.1493.00 ± 3.65
Note: Data are presented as mean ± standard deviation (SD), with bold representing the optimal mean.
Disclaimer/Publisher’s Note: The statements, opinions and data contained in all publications are solely those of the individual author(s) and contributor(s) and not of MDPI and/or the editor(s). MDPI and/or the editor(s) disclaim responsibility for any injury to people or property resulting from any ideas, methods, instructions or products referred to in the content.

