Article

Influence of the Salt Addition during the Fermentation Process on the Physical and Chemical Properties of Dried Yellow Beetroot

by
Anna Wierzbicka
and
Emilia Janiszewska-Turak
*
Department of Food Engineering and Process Management, Institute of Food Sciences, Warsaw University of Life Sciences—SGGW, 159C Nowoursynowska St., 02-787 Warsaw, Poland
*
Author to whom correspondence should be addressed.
Appl. Sci. 2024, 14(2), 524; https://doi.org/10.3390/app14020524
Submission received: 18 November 2023 / Revised: 23 December 2023 / Accepted: 5 January 2024 / Published: 7 January 2024

Abstract

:
The demand for functional foods is increasing, particularly concerning plant-based probiotic products. These products are becoming a popular alternative to dairy-based options. However, fermented vegetables have a high salt content, which can have negative effects on health if consumed excessively. There has been difficulty in finding the right balance in terms of the salt concentration for the high-quality fermentation of vegetables. To preserve its valuable nutrients and ensure maximum quality, as a vegetable, yellow beetroot was used. The aim of this study was to increase the lactic acid bacteria and preserve the active compounds in fermented yellow beetroot. The research used varying salt levels in brine (0–6%) to examine their impact on the physical, chemical, and microbiological properties, as well as the degradation temperatures and thermal analysis. Moreover, to create a new product, fermented beetroot was freeze-dried. This study found that stable products were obtained after 4 and 8 days due to the development of lactic acid bacteria. The addition of salt did not affect the stability of the products, but it did affect the active ingredients. Higher salt additions resulted in more salt penetrating into the beetroot tissue, impacting the amount of salt consumed. Our study found that a 1% addition of salt led to higher levels of active ingredients and satisfactory amounts of bacteria. Yellow beetroot, with its high content of polyphenols, pigments and lactic acid bacteria, can be used as a healthy ingredient in a diet after undergoing a freeze-drying process. These research findings provide valuable insights into optimizing the salt content to preserve the lactic acid bacteria, nutrients, and desirable color characteristics of fermented yellow beetroot.

1. Introduction

Beetroot (Beta vulgaris L.) is commonly known as a red vegetable, but there are also yellow, white, and red- and white-striped types that have not yet been well-studied for bioactive components. Beetroots are a rich source of betalain pigments, vitamins, minerals, polyphenols, carotenoids, and fiber [1,2,3]. The yellow beetroot variety is a new addition to the consumer market and has the potential to be a novel source of investigation. Yellow beetroot (Beta vulgaris subsp. vulgaris) is known by many names, including the golden beetroots name. Botanically, it is a variant of regular beetroot, and like other cultivated beetroots, it is a foxtail plant (Amaranthaceae). However, it is also often classified in the goosefoot family (Chenopodiaceae) [4,5,6].
The increasing trend toward vegan diets has also contributed to the growing demand for probiotic plant-based foods. Vegetables offer a suitable method for introducing probiotics into the diet, particularly for those following a vegetarian, vegan or lactose-free lifestyle or with allergies [7,8]. Microorganism-produced fermented foods and beverages include bioavailable nutrients and lactic acid bacteria, meeting consumer requirements, as stated by Pimentel et al. [9] and McClements and Grossmann [10].
What is more, currently, consumers favor minimally processed foods that incorporate functional ingredients to promote good health, as illustrated by Casciano et al. [11] and Ogrodowczyk and Drabińska [12]. Fermented foods are increasing in popularity on account of their advantageous nutritional and health-promoting properties. Fermentation allows for the preservation of beneficial ingredients, as it does not require heat treatment that significantly affects the loss of active ingredients [13,14]. Fermented foods are now consumed almost all over the world, and the variety of raw materials fermented depends on the region. Some of the best-known vegetables used for fermentation are cabbage, carrots, beetroots, cucumbers, onions, radishes, garlic, peppers, and olives [15,16].
Lactic acid bacteria during their growth produce metabolites, including lactic acid and bacteriocins. Lactic acid is responsible for the ensiling process, and bacteriocins are natural preservatives [17,18]. According to the Food and Agriculture Organization of the United Nations and the World Health Organization, probiotics are live cultures of one or more strains of microorganisms that benefit health and support the balance of the intestinal microflora. By colonizing the human body, they contribute to better health [19,20,21,22].
Studies have shown that fermented vegetables contain numerous bioactive components that promote good health and possess new structural properties. Furthermore, fermentation metabolites enhance the shelf life of the product. Fermentation adds new components, flavors, aromas, and appearances, resulting in a new product. The bioactive components become more available, which improves the absorption of antioxidants and has other benefits. Fermentation also reduces the “earthy taste” of beetroots, which is caused by geosmin [15,23,24,25].
When engaging in lactic fermentation, it is important to take into account the use of table salt. Adding salt helps regulate the process, which affects the resulting taste and fermentation outcomes. Additionally, salt is a crucial component of our diet as it plays a vital role in maintaining proper body function. However, excessive salt intake can affect blood pressure, cardiovascular disease, stomach cancer, and kidney function. Therefore, it is recommended to limit its consumption. According to the WHO recommendations, the daily salt intake should not exceed 5–6 g. However, it is important to note that adequate salt intake, which is necessary for proper bodily function, should be around 3.8 g per day [26,27]. A slight reduction in the amount of salt in food products can help combat the overall consumption [16,28,29]. Reducing the overall salt intake can be achieved by reducing the amount of salt in fermented vegetable products. During the fermentation process, table salt enhances the stability of vegetables and imparts flavor. Brine solution is the preferred method for introducing salt into the materials, with varying concentrations determined by the type of vegetable and intended outcome. However, an excessive salt concentration (>10%) can have a detrimental effect on the nutritional content and enzyme activity during fermentation. Furthermore, numerous studies, including those by Bautista-Gallego et al. [30], Peréz-Dıaz et al. [31] and Lin et al. [32], have shown that high salt concentrations can trigger osmotic dehydration, wherein water is extracted from cells without undergoing a phase transformation.
To create a snack from fermented beetroot, a freeze-drying process could be used. This process, according to the literature, ensures the maximum quality and preservation of the vegetable’s valuable nutrients. The freeze-drying process allows water to be gently removed from the product, minimizing nutrient loss and, in the case of bacteria, minimizing structural and metabolic damage to the bacteria, which is key to maintaining their functionality, not only in fermented products [16,33,34].
This study aimed to create dried fermented yellow beetroot due to the high demand for functional foods, particularly plant-based probiotic products, and the need to decrease salt intake. Yellow beetroot was chosen for the research because of its high amount of vulgaxanthin, which is more resistant to a lower pH than betanin. This was achieved through the fermentation process of yellow beetroot with varying salt additions in the brine. After the process, the physical and chemical properties were tested to provide information on the parameters that can influence the amount of active compounds and the number of lactic acid bacteria. Subsequently, the fermented samples underwent freeze-drying to create a new product with higher stability.

2. Materials and Methods

All the measurements were performed in three repetitions, unless stated otherwise. Data in the tables and graphs are presented as mean values with standard deviations.

2.1. Materials

The research material was yellow beetroots var Golden (Beta vulgaris L.) cultivated in the Netherlands and purchased in Poland and cold-stored (4 to 6 °C) before use. For the preparation of the samples, 10 kg of beetroot was purchased. The biological material Lactiplantibacillus plantarum ATCC4080 was obtained from the American Type Culture Collection (ATCC, Manassas, VA, USA). The bacterial inoculum was prepared in 0.85% NaCl at a concentration of ~1 × 10⁷ CFU/cm3. The chemical reagents used for analysis were of analytical grade.

2.2. Technological Treatment

2.2.1. Fermentation

Before use, all the beetroots were thoroughly checked for any defects or signs of spoilage before peeling them for sample preparation. After that, the beetroots were subjected to a cleaning process consisting of washing in tap water, peeling and disinfection with 0.5% sodium hypochlorite solution for 5 min. The material was then cut into 1 cm cubes, mixed for the unification of the material and placed in 0.5 L glass jars. The jars were flooded with salt solutions containing different salt concentrations (from 0 to 6%) and bacterial inoculum in a volume of 1% salt solution. Each salt concentration was tested separately, with separate jars prepared for each day of the experiment. The fermentation process took place in a laboratory incubator at 30 °C throughout the experiment. Each sample was analyzed on the following days of fermentation: 0, 4, 6, 8, 11 and after 60 days (2 M) of storage. The experiments were carried out in duplicate.

2.2.2. Freeze-Drying

The freeze-drying process was carried out according to the methodology presented by Janiszewska-Turak et al. [35]. The fermented beetroot cubes were frozen in petri dishes at −40 °C (Shock Freezer HCM 51.20, Irinox, Treviso, Italy) for 5 h. Freeze-drying was carried out in an ALPHA 1–4 freeze dryer (Christ, Osterode, Germany) for 24 h (heating shelf temperature of 30 °C) at a constant pressure of 63 Pa, and the safety pressure was set up at 103 Pa.

2.3. Analytical Methods

To prepare the samples for determination, the material (fresh, fermented and freeze-dried yellow beetroot) was ground in an analytical grinder (IKA A11 basic; IKA-Werke GmbH, Staufen, Germany), unless stated otherwise.

2.3.1. Determination of the Number of Lactic Acid Bacteria

A specific procedure was employed to quantify the lactic acid bacteria content in the beetroot samples. At each stage of the process, 10 g of the sample was taken and deposited into sterile bags containing 90 cm3 of physiological saline solution. Subsequently, the mixture was agitated in a state-of-the-art Stomacher 400 (Circulator, Seward, UK) for 30 s. Afterwards, 1 cm3 of the solution was combined with 9 cm3 of saline, and a sequence of decimal dilutions was performed. These diluted samples were then applied onto plates coated with MRS Agar (Biomaxima, Lublin, Poland) and subjected to incubation at 28 °C for 48 h. Enumeration of the bacterial colonies was conducted using ProtoCOL 3—Automatic colony counting and zone measuring equipment (Synbiosis, Frederick, MD, USA). The results were computed in terms of the CFU/cm3 and subsequently converted into the log CFU/cm3.

2.3.2. Dry Matter

For the dry matter determination, the gravimetric method was used according to methodology of Karwacka et al. [36]. Approximately 1 g of material of the fermented and freeze-dried beetroots was weighed into prepared vessels. The vessels were placed in a drying oven at 70 °C for 24 h.

2.3.3. pH and Total Acidity

The pH value of the saline was measured using a pH meter (SevenCompact S210, Mettler–Toledo GmbH, Greifensee, Switzerland).
The titration with a 0.1 M NaOH solution continued until the pH reached 8.1.

2.3.4. Salt Content

The salt content was determined using Mohr’s method, as outlined in the article by [37]. The determination was performed only for the samples of fermented beetroot. Approximately 5 g of material (m) of fermented beetroots was taken and diluted with distilled water to a volume of 150 mL and boiled. Subsequently, the sample was quantitatively transferred through filter paper. With this method, neutralization of 10 cm3 with 0.1 M NaOH solution took place. Then, 1 cm3 of potassium chromate solution (K2CrO4) was added and titrated with 0.1 M silver nitrate solution (AgNO3) until a solid brick-red color was obtained. The results were calculated using the formula:
N a C l   c o n t e n t = ( V · M · 0.05845 ) / ( 100 · m ) ( % )
where V—volume of AgNO3 solution for titration (cm3), M—molarity of AgNO3 solution (-), and m—mass of the product in the titrated solution (g)

2.3.5. Color Coordinates

The color coordinates of the material were determined using the CR-5 spectrophotometer (Konica Minolta Sensing Inc., Osaka, Japan) in the CIE L*a*b* system. The measurement parameters were: Illuminant D65, angle 2° and calibration with white and black standards, as presented by Rybak et al. [38]. All the measurements were performed only for the samples of fermented beetroot and in ten repetitions.

2.3.6. Betalain Content

For the betalain measurement, the spectrophotometric method was used according to the methodology described by [39,40]. A Helios Gamma spectrophotometer (Thermo Spectronic Evolution 220 UV, Cambridge, UK) was used for the measurements. Approximately 1 g of ground material (fresh, fermented and freeze-dried beetroot) was weighed into a centrifuge tube and stirred for 10 min to extract the pigments with 50 mL of phosphate buffer at pH 6.5. For the betalain content, wavelengths of 476, 538, and 600 nm were used, zeroing at the phosphate buffer.
The betalain content, which consists of red and yellow pigments, was calculated as mg of betanin and vulgaxanthin-I per 100 g of dry matter.

2.3.7. Total Phenolic Content

To prepare the samples, the protocol from Rybak, Wiktor, Kaveh, Dadan, Witrowa-Rajchert and Nowacka’s [38] methodology was used. Approximately 0.3 g of material (fresh fermented and freeze-dried beetroot) was weighed into centrifuge tubes and diluted with 10 mL of extraction reagent (80% ethanol). A shaker was used for the extraction (Multi Reax, Heidolph Instruments, Schwabach, Germany). The extraction was carried out for 12 h at room temperature and under limited lighting. To obtain a clear solution, the sample was centrifuged for 2 min at 3000 rpm in a laboratory centrifuge (Mega-Star 600, VWR, Leuven, Belgium). The supernatant was transferred to 0.2 mL PCR tubes. The extraction was performed in two replicates for each sample. The prepared samples were subjected to spectrophotometric analysis of the polyphenol content.
The spectrophotometric method with the Folin–Ciocalteu reagent according to the methodology described by [38,41] was used for the total content of polyphenolic compounds measurement. This is a quantitative method. On 96-well plates, the following were placed: 10 μL of ethanol extract, 10 μL of distilled water, and 40 μL of 5-fold diluted Folin reagent. The samples were mixed and allowed to rest for 3 min for the reaction to occur. Then, 250 μL of 7% sodium carbonate solution was added. Incubation was carried out for 60 min at room temperature in the dark. A plate reader (Multiskan Sky, Thermo Electron Co., Waltham, MA, USA) was used for the absorbance measurement at a wavelength of 750 nm compared to the blank sample without extract.

2.3.8. Antioxidant Activity ABTS Assay

The antioxidant activity of yellow beetroot was evaluated using the ABTS assay methodology, as outlined in Rybak et al.’s [38] research. The ethanol extracts of beetroot were subjected to colorimetric reactions with the radical cation 2,2-azino-bis(3-ethylbenzothiazoline-6-sulfonate) (ABTS+) to determine their ability to counteract free radicals. The concentration of the sample required to reduce the free radical concentration by 50% was used to express the results. Before analysis, a stock radical solution was prepared 16 h in advance. Following this, 38.4 mg of ABTS and 6.6 mg of potassium persulfate were dissolved in 10 mL of distilled water. Just before the analysis, the radical solution was freshly prepared, and the initial mixture was diluted around 100 times with 80% ethyl alcohol to create a working solution. The absorbance was maintained within the 0.700 ± 0.020 range when the prepared solution was measured at 734 nm. After this, 10, 20, 30 and 40 microliters were added to the reaction test tubes, along with 40 microliters of the sample extract and 3 mL of the radical working solution to each. After 6 min, the absorbance was measured, and the same was performed as in the previous measurement.

2.3.9. Fourier Infrared Spectroscopy (FTIR)

The absorption spectra of the freeze-dried samples were determined using an Agilent Cary 630 FTIR spectrometer (Agilent Technologies Inc., Santa Clara, CA, USA) with a diamond ATR system. The analysis was performed in the range of 650–4000 cm−1, with a resolution of 4 cm−1, with 32 scans per sample [38]. The background spectrum was determined before each sample scan. Data were assessed using MicroLab computer software version 15.7 (Agilent Technologies Inc., Santa Clara, CA, USA).

2.3.10. Thermogravimetric Analysis (TGA)

The analysis of the thermal properties was performed using a TGA thermogravimeter (TGA/DSC 3+, Mettler Toledo, Greifensee, Switzerland) to determine the weight loss upon heating [38] The samples of freeze-dried beetroot (approximately 5–7 mg) were heated at a rate of 5 °C per minute from 30 to 600 °C under a nitrogen atmosphere (50 mL/min). The TGA and DTG curves were determined and analyzed. The STAR software (version 16.10) was used to evaluate the thermograms. The decomposition zones and maximum transition temperatures were determined. Two measurements were taken for each sample.

2.4. Data and Statistical Treatment

The obtained results were subjected to a statistical analysis using Statistica version 13.3 software (StatSoft, Warsaw, Poland). A one-way and multiple analysis of variance with the Tukey HSD test at a significance level of α = 0.05 was performed.

3. Results and Discussion

In the presented results, two samples are missing: samples with 4% and 6% salt addition after storage for 2 months. Both experiments were spoiled and mold appeared in all the repetitions. Analysis of the physical and chemical properties is performed without those two samples.

3.1. Microbiology

The number of lactic acid bacteria is a crucial factor in determining the quality of fermented products. In this study, the number of lactic acid bacteria during fermentation, storage, and freeze-drying was examined. Initially, all the samples had a lactic acid bacteria count of 5.81 ± 0.3 log CFU/cm3 (Table 1). On the fourth day of fermentation, there was a significant increase in the number of bacteria in all the samples.
However, when the beetroots were fermented with a brine containing 0%, 2%, and 6% salt, the growth stopped on the eighth day. The higher bacterial count observed on day four for the salt addition of 1% and 3% to 5% may be related to the logarithmic growth phase of the LAB, indicating that fermentation may be completed after this time. After the fourth day, the bacteria entered the death phase. For the remaining samples, fermentation can be completed after the eighth day. Furthermore, the decrease after the fourth day was fastest for the samples with 1% salt, and after the eighth day, for the samples with 0% and 6% salt. After storage, a decrease in the number of bacteria was observed in all the samples, with the smallest decrease seen for the sample with a 2% (38.8%) addition of salt compared to the highest values on day 8.
Reducing the number of bacteria is related to the use of carbon and the inability to develop further [42]. During the process, the samples with salt addition showed the lowest decrease in the number of bacteria, even after storage. It was found that a salt concentration of 2% was the optimal environment for the bacteria.
Freeze-drying is an effective method to preserve beneficial probiotic bacteria in fermented products for a longer time. It allows for the preservation of a large amount of bioactive compounds and the survival of some bacteria [43,44]. After freeze-drying, a decrease in the number of bacteria was observed in all the samples. However, the sample with 0% (19.3%) salt addition showed the smallest decrease compared to the highest values obtained during fermentation. After freeze-drying, most samples showed a 1–2 log cycle decrease in the probiotic bacteria count, which is a statistically significant decrease from the pre-freeze-drying levels. The drying process reduced the number of bacteria by approximately 24%, and it was found that the salt concentration did not affect the survival of bacteria in the freeze-dried samples.

3.2. Physical Properties

3.2.1. Basic physical properties

Table 2 shows that the fresh yellow beetroot had a dry matter content of 10.21%, the highest among the non-freeze-dried samples. This content is lower than that of red beetroot, which has a dry matter content of about 13%, according to Kale et al. [45]. The difference between these two types of beetroots could be due to factors such as the variety, cultivation, and weather conditions [46].
The dry matter content of the samples decreased during fermentation regardless of the salt concentration. This is because microorganisms use sugars to produce lactic acid, which leads to a decrease in dry matter [47]. Changes in dry matter may also be caused by the osmosis process, whereby water-soluble substances migrate into the brine. This process causes water from the product to be transferred to the osmotic solution (brine), while solutes in the solution are transported to the food product [48,49]. However, a significant increase in dry matter can be observed with the addition of salt during fermentation. This is because salt causes the release of nutrients from cells via osmosis, which is also used by LAB bacteria.
After freeze-drying, the dry matter content in all the samples increased to above 90%. This is because freeze-drying allows for the removal of most of the water [50]. The dry matter content of the fresh beetroot increased from 10.92 ± 0.13 before freeze-drying to 96.75 ± 0.15 after freeze-drying. The lowest values were observed in the samples after storage. The samples with a lower dry matter content before freeze-drying also had a lower dry matter content after freeze-drying, and a higher salt addition during fermentation resulted in greater dry substance after freeze-drying. The fermentation time did not have a significant effect on the changes in dry matter, but the dry substance content ratio was maintained.
It is important to note that yellow beetroot contains naturally occurring salt at a level of 0.25% (Table 2). When the samples without added salt in the brine (0%) were tested, they showed a salt content similar to that of fresh beetroot, which is consistent with the natural salt present in beetroots. However, significant changes in the salt content were observed during fermentation. As the salt concentration increased in subsequent brines, higher salt contents were observed in the samples. On the fourth day, a salt concentration lower than that in the added brine was observed. It is worth noting that ultimately, over 30% of the salt penetrated the beetroot tissue. The highest amount of salt diffused in the lowest concentration (1%). This transport of salt from the brine to the beetroot tissue can be explained by osmosis-related diffusion. The substance from the higher-concentration solution diffuses into the lower-concentration plant tissue. The differences in the salt content during fermentation may result from the attempt to establish a concentration balance [49,51].
The total acidity and pH values are correlated. The higher the acidity, the lower the pH. This correlation is influenced by the lactic acid produced by fermentation bacteria. The pH value of fresh yellow beetroots was 6.28 ± 0.06, which is slightly lower than the pH values of fresh beetroot juices measured by Marszałek et al. [52] and Janiszewska-Turak et al. [39]. However, the differences in pH values depend on the variety and other factors. In a study by Czyżowska et al. [53], differences in the pH were observed in two red beetroot varieties. The results of this study are comparable to the pH measured in the cited study.
After four days of fermentation, the pH of all the samples fell below 3.5, with values ranging from 3.19 to 3.48. The pH values were in a similar range after day eleven, which indicates that the fermentation passed quickly and the process could be completed after the fourth day. This indicates the high activity of the induced acid-producing bacteria. Even after the fourth day, the pH remained below 4.5, ensuring that the products are stable and safe, and they can be stored with these parameters. A low pH, below 4, also limits the growth of undesirable microflora, as noted by [54].
The lowest pH during the process was observed in the samples with the addition of 3% and 4% salt, which may indicate that such concentrations are optimal for the work of bacteria on the tested matrix. The pH value after storage for 60 days ranged from 3.12 to 3.34. The highest pH value was found in the sample without added salt, indicating the positive effect of salt during product storage.
The total acidity showed little change during fermentation, and there were no significant changes between the samples from the last day of fermentation and the samples after storage. The salt content had no effect on the increase in the total acidity, and the values were unstable and fluctuated from day to day. This can be linked to the utilization of lactic acid by the yeast, which can develop in the initial stage of fermentation [53,55]. With the presence of oxygen in the upper part of the jar, yeast can utilize lactic acid and thus deacidify the environment. This may also explain the slight fluctuations in the pH values during fermentation.

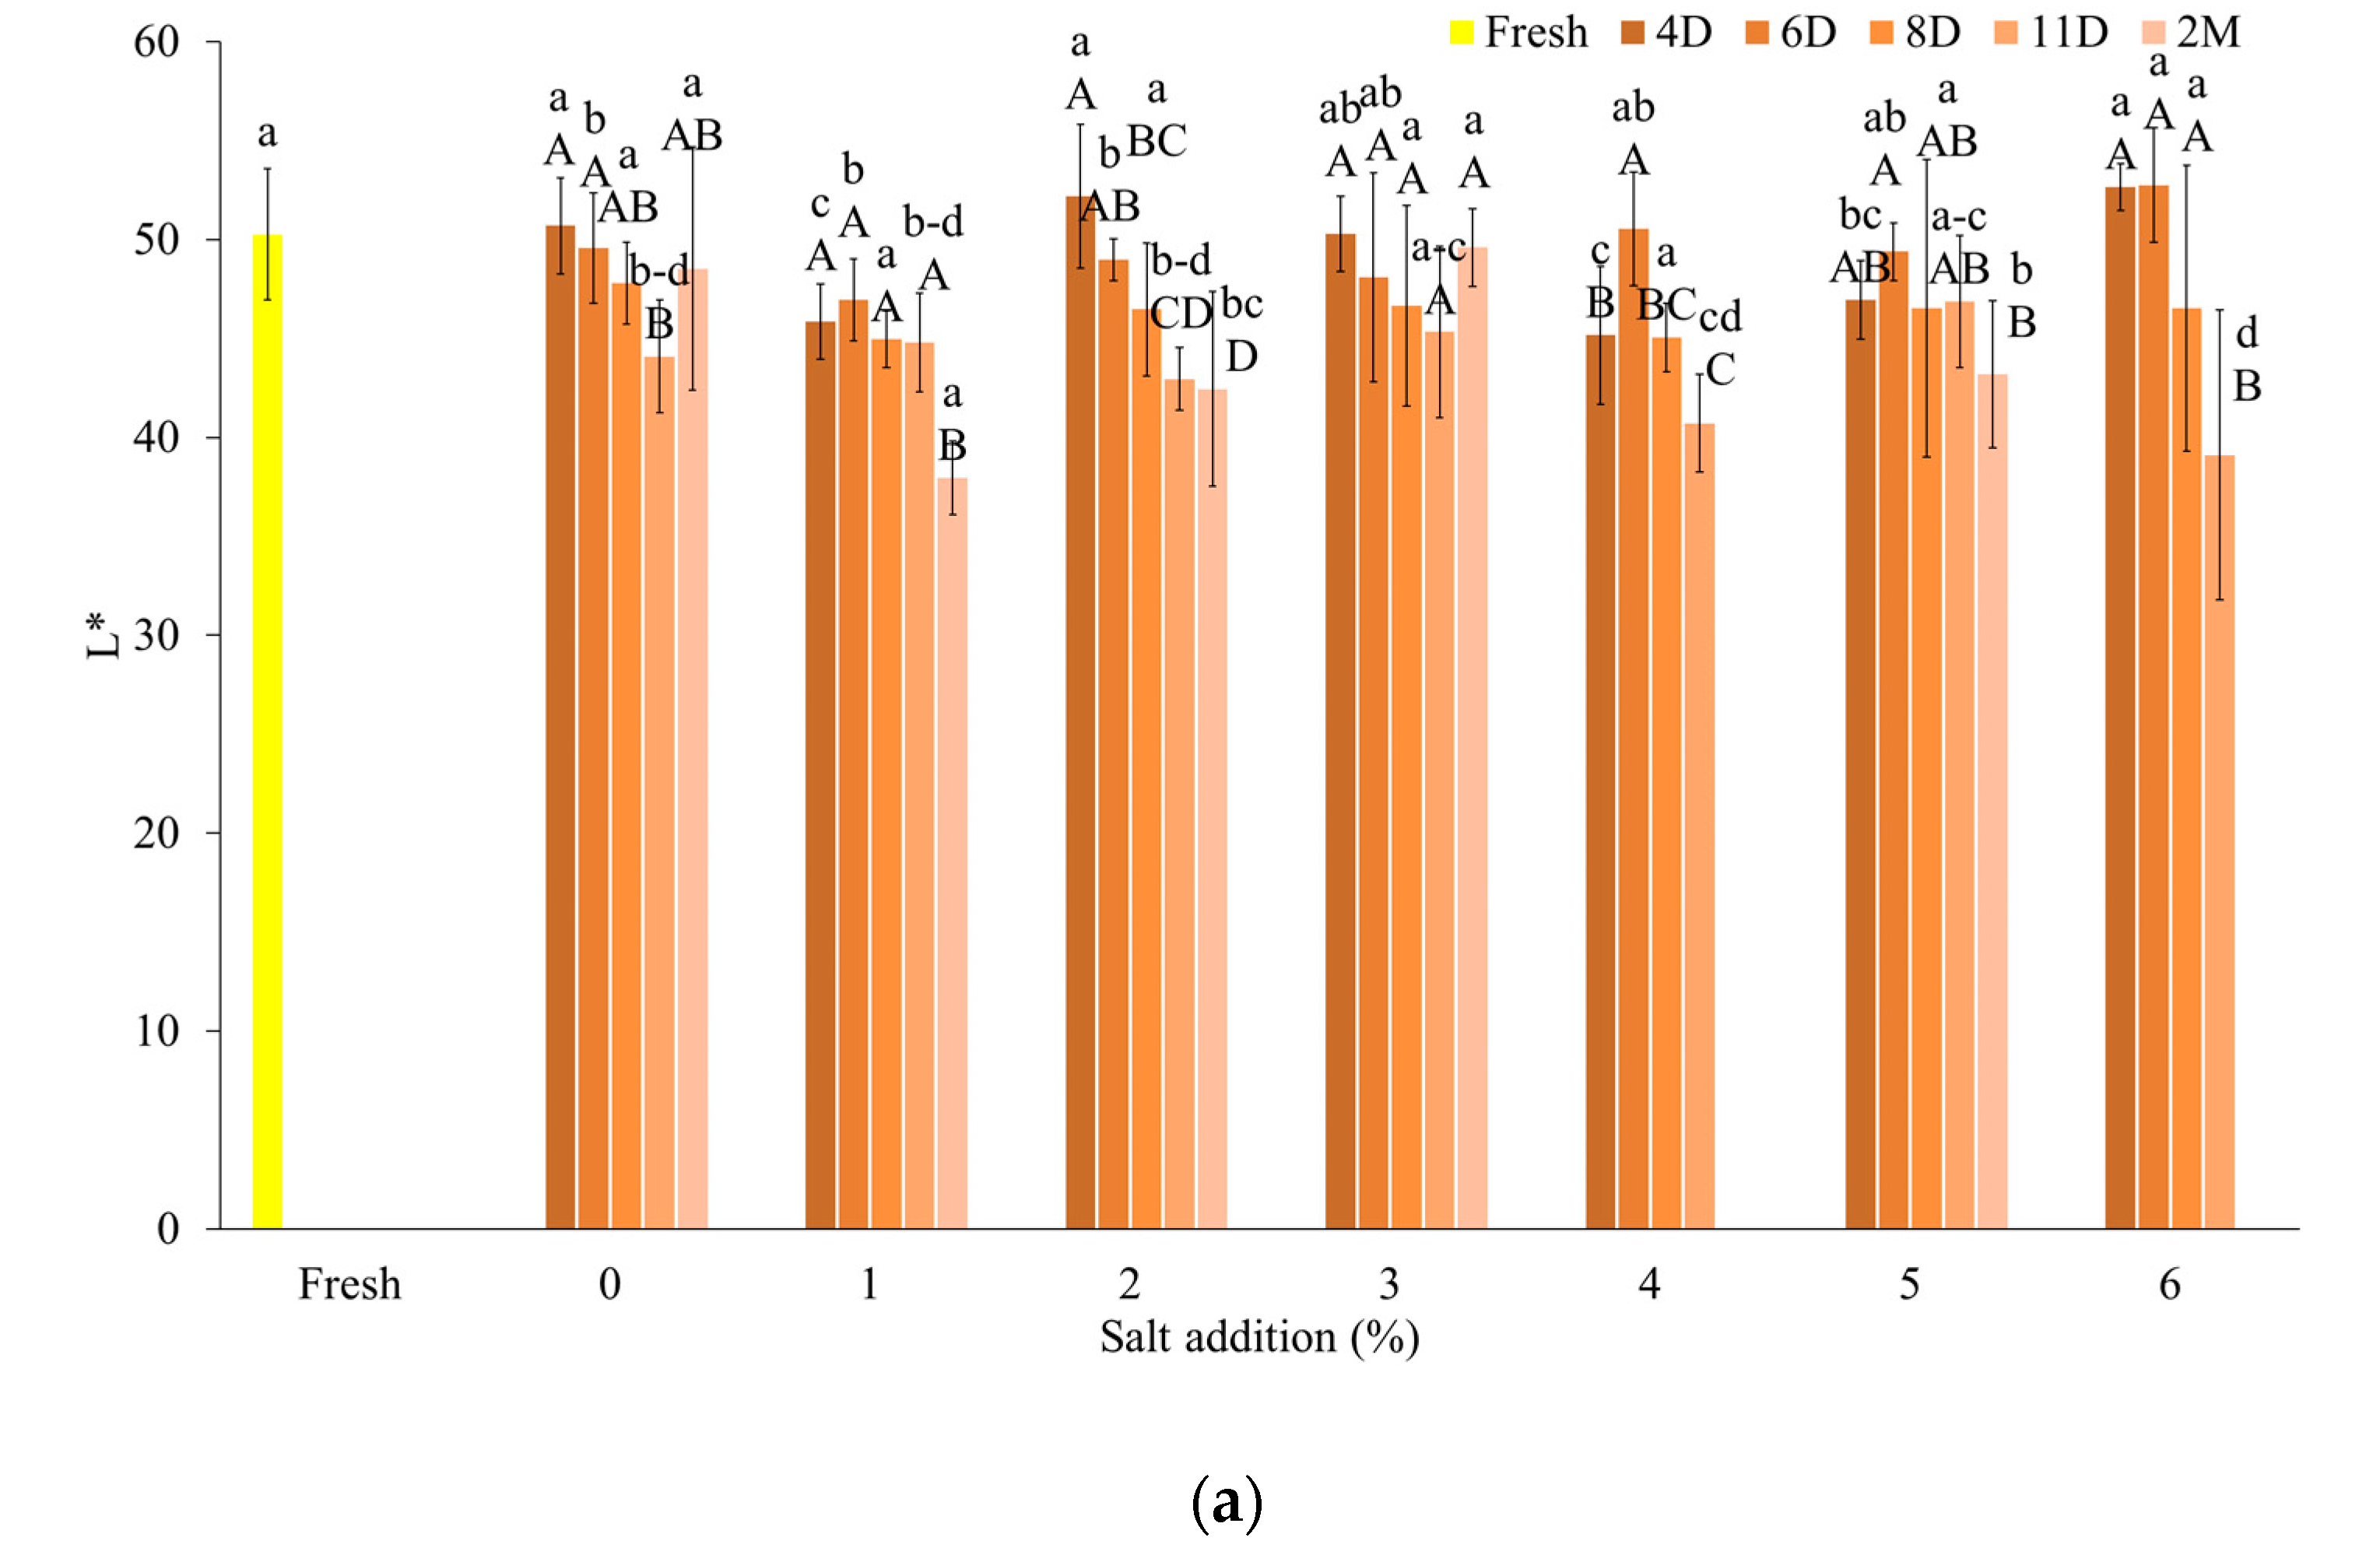
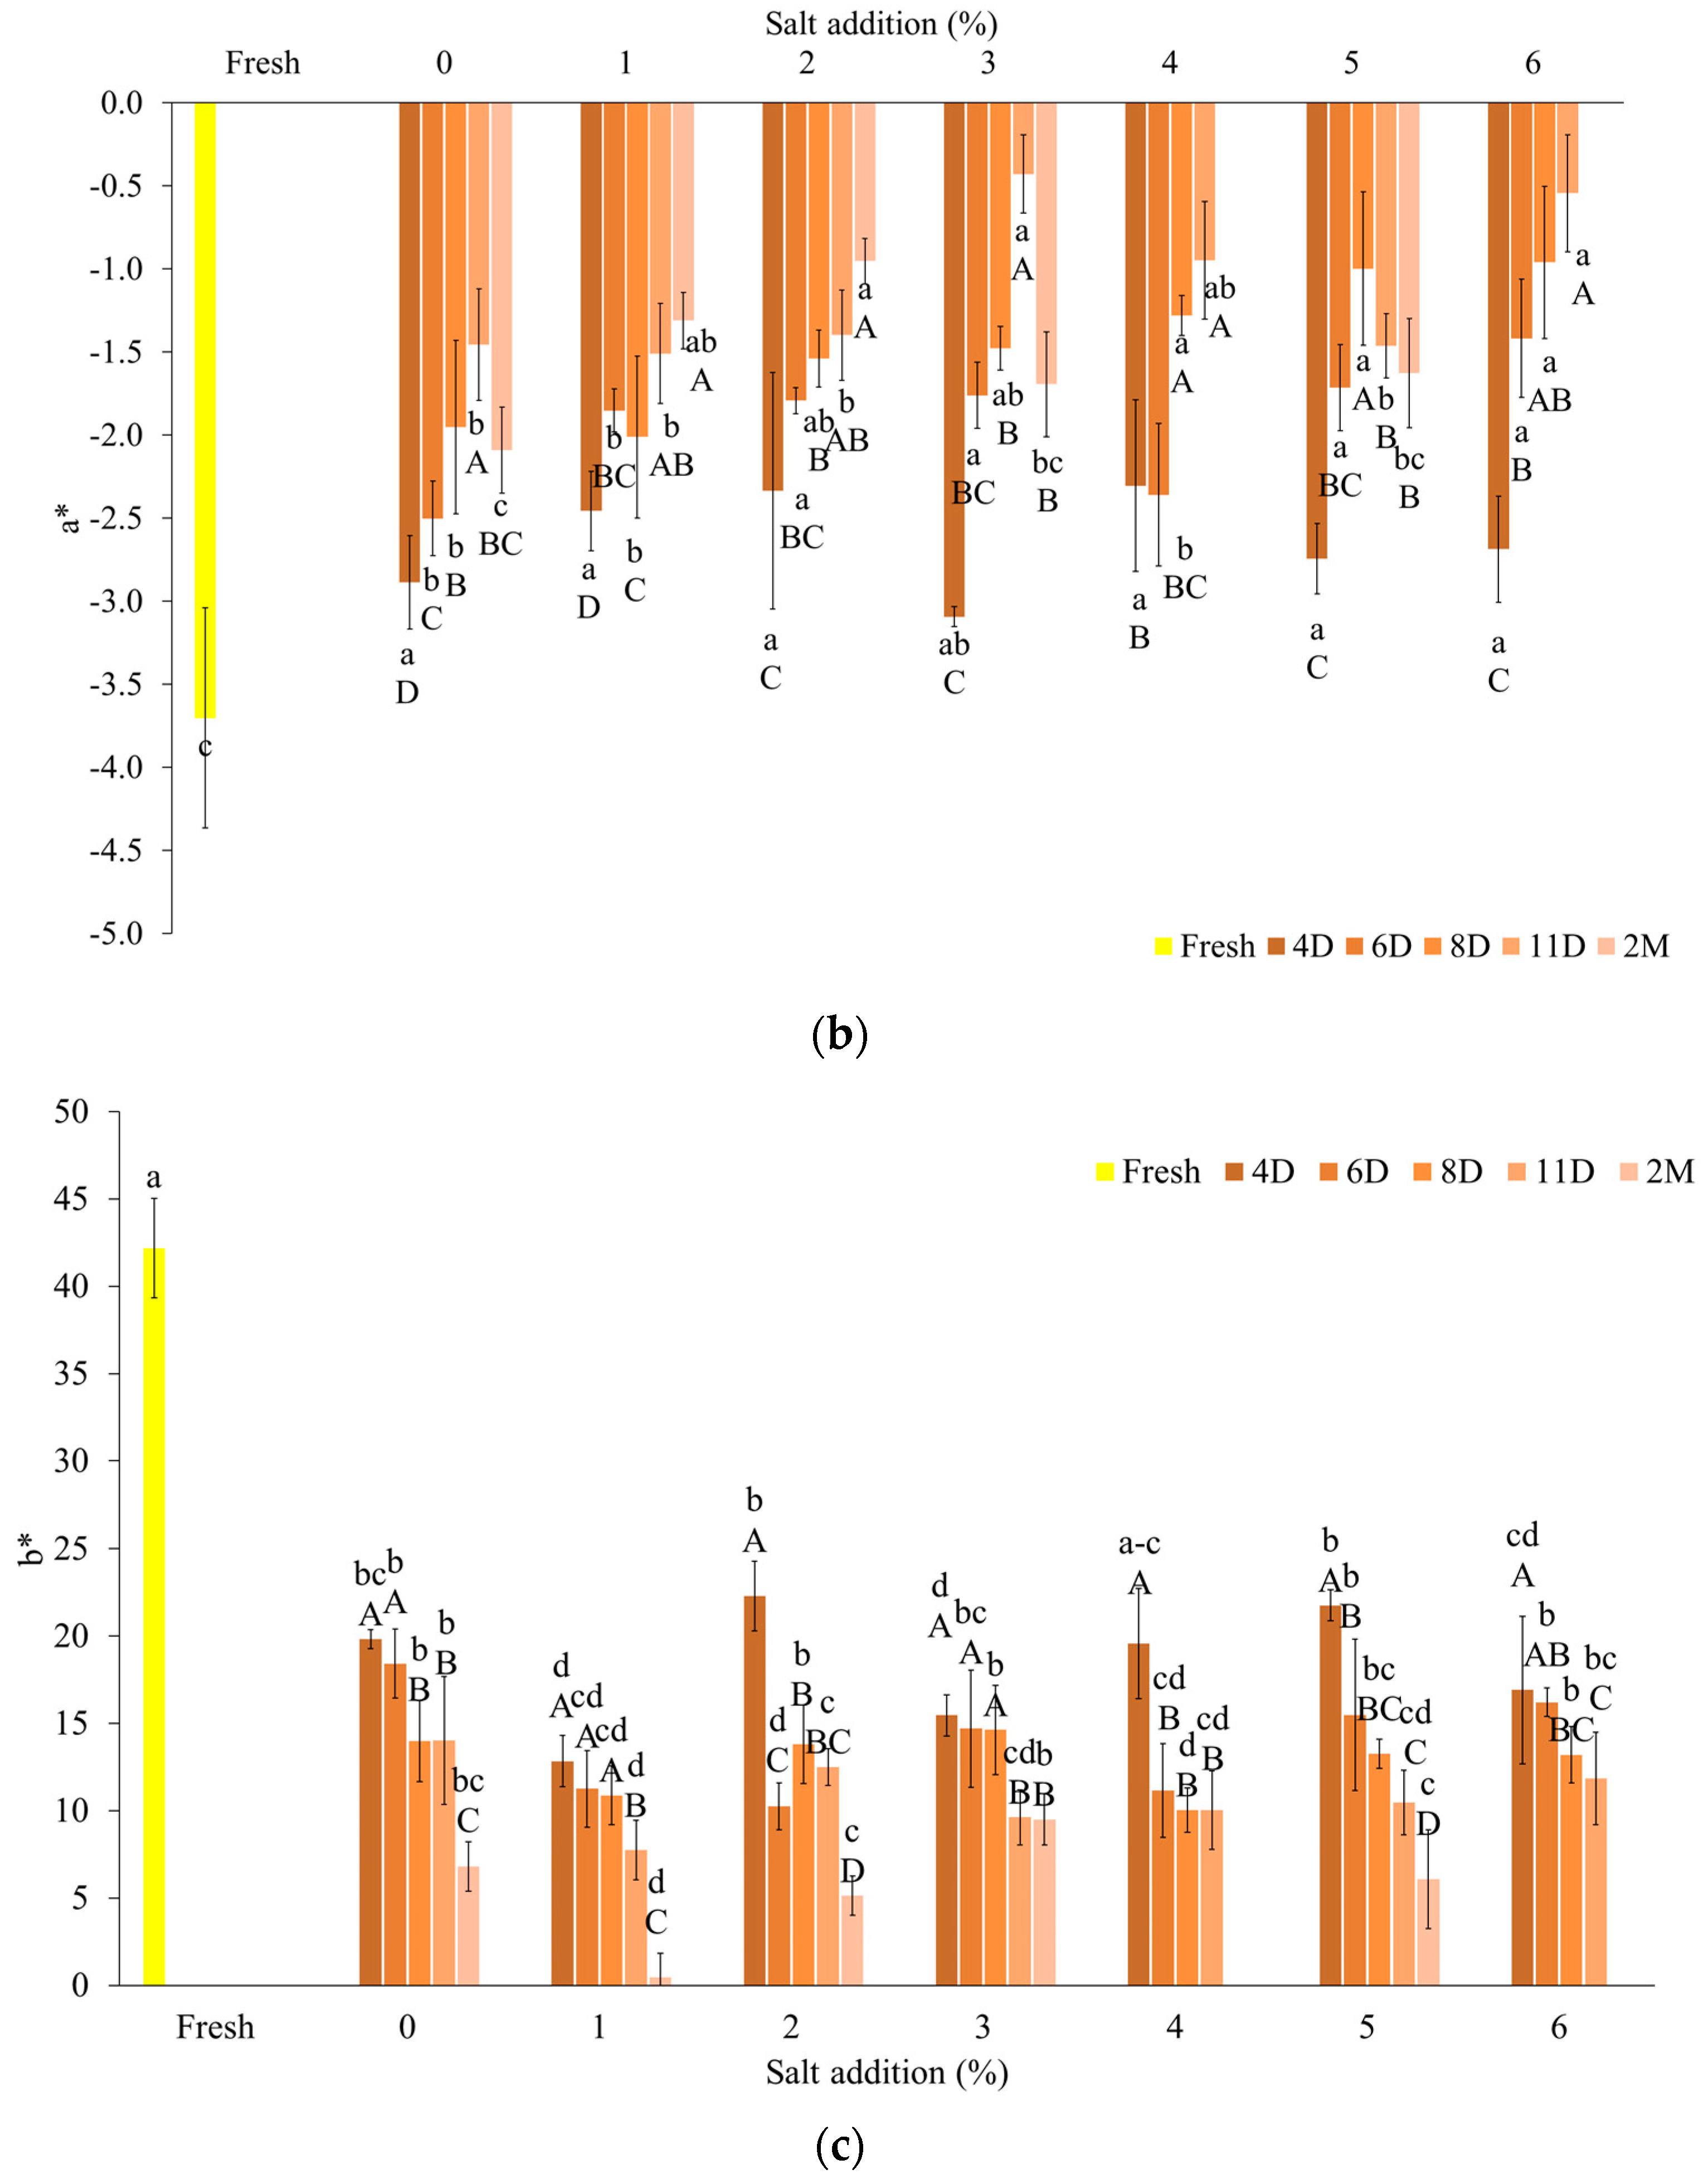
3.2.2. Color Coefficients of Fermented Samples

The color of the yellow beetroot was determined by measuring color coefficients such as the lightness (L*), reddish-green (a*), and yellowish-blue (b*) Figure 1.
The brightness of the samples was found to remain constant during the fermentation process, which could be due to the initial bright yellow–gold color of the beetroot tissue. Moreover, there were no significant changes in the brightness values observed between the various analyzed salt concentrations, except for the samples stored for more than 2 months with over 2% salt added to the brine, which showed a decrease in brightness (Figure 1a).
The color parameter a*, which characterizes the proportion of red or green color, showed a shift toward green (negative values of the a* coefficient) (Figure 1b). The fermentation process influenced the perception of the color shades of the fermented samples, with the proportion of green color shifting toward the transition to red (increase from a value of −3 to a value of −0.5) but remaining within the green color range. This change was evident both in comparison with the raw beetroot (a* = −3.7) used as a reference material and in analyses within a given salt content (e.g., for a salt content of 2–3%, a* = −2.4 to −2.5). The duration of the fermentation process significantly influenced the value of this color factor, causing it to increase toward zero. The longer the process, the higher the value of the a* coefficient.
The proportion of yellow color is the most significant factor for yellow beetroots. In reverse to the red beetroot fermentation study, in this study no change in the brine color was observed during the fermentation process. The analysis of data concerning the color coefficient b* revealed no affect after adding table salt to the brine. However, during the lactic fermentation process, there was a reduction in the b* value, regardless of the salt concentration used. Even in the sample without added salt, there was a 50% decrease in the value of this coefficient after four days of the process (Figure 1c). The samples with added 2% and 3% table salt showed minimal variations in the analyzed concentration. After storage, a further decrease in the color factor b* was observed in the samples, irrespective of the salt concentration used. The yellow pigments in golden yellow beetroot mainly contribute to the amount of color factor b* responsible for the yellowness of the samples.
Similar results for fresh golden beetroot for the color coefficients were observed in [4]. There is no research on the fermentation of yellow beetroot, so we can only state that the fluctuations in the a* and b* color coefficients are related to the pigment content, small amount of betanin (red colorant) and high amount of vulgaxanthin (yellow colorant) and its behavior during the fermentation process. There is well-known information that betalain pigments are stable in a range of pH (3–7) and can at a low pH transform from betaxanthin into betacyjanin [56,57,58].

3.3. Chemical Properties of Beetroot Samples

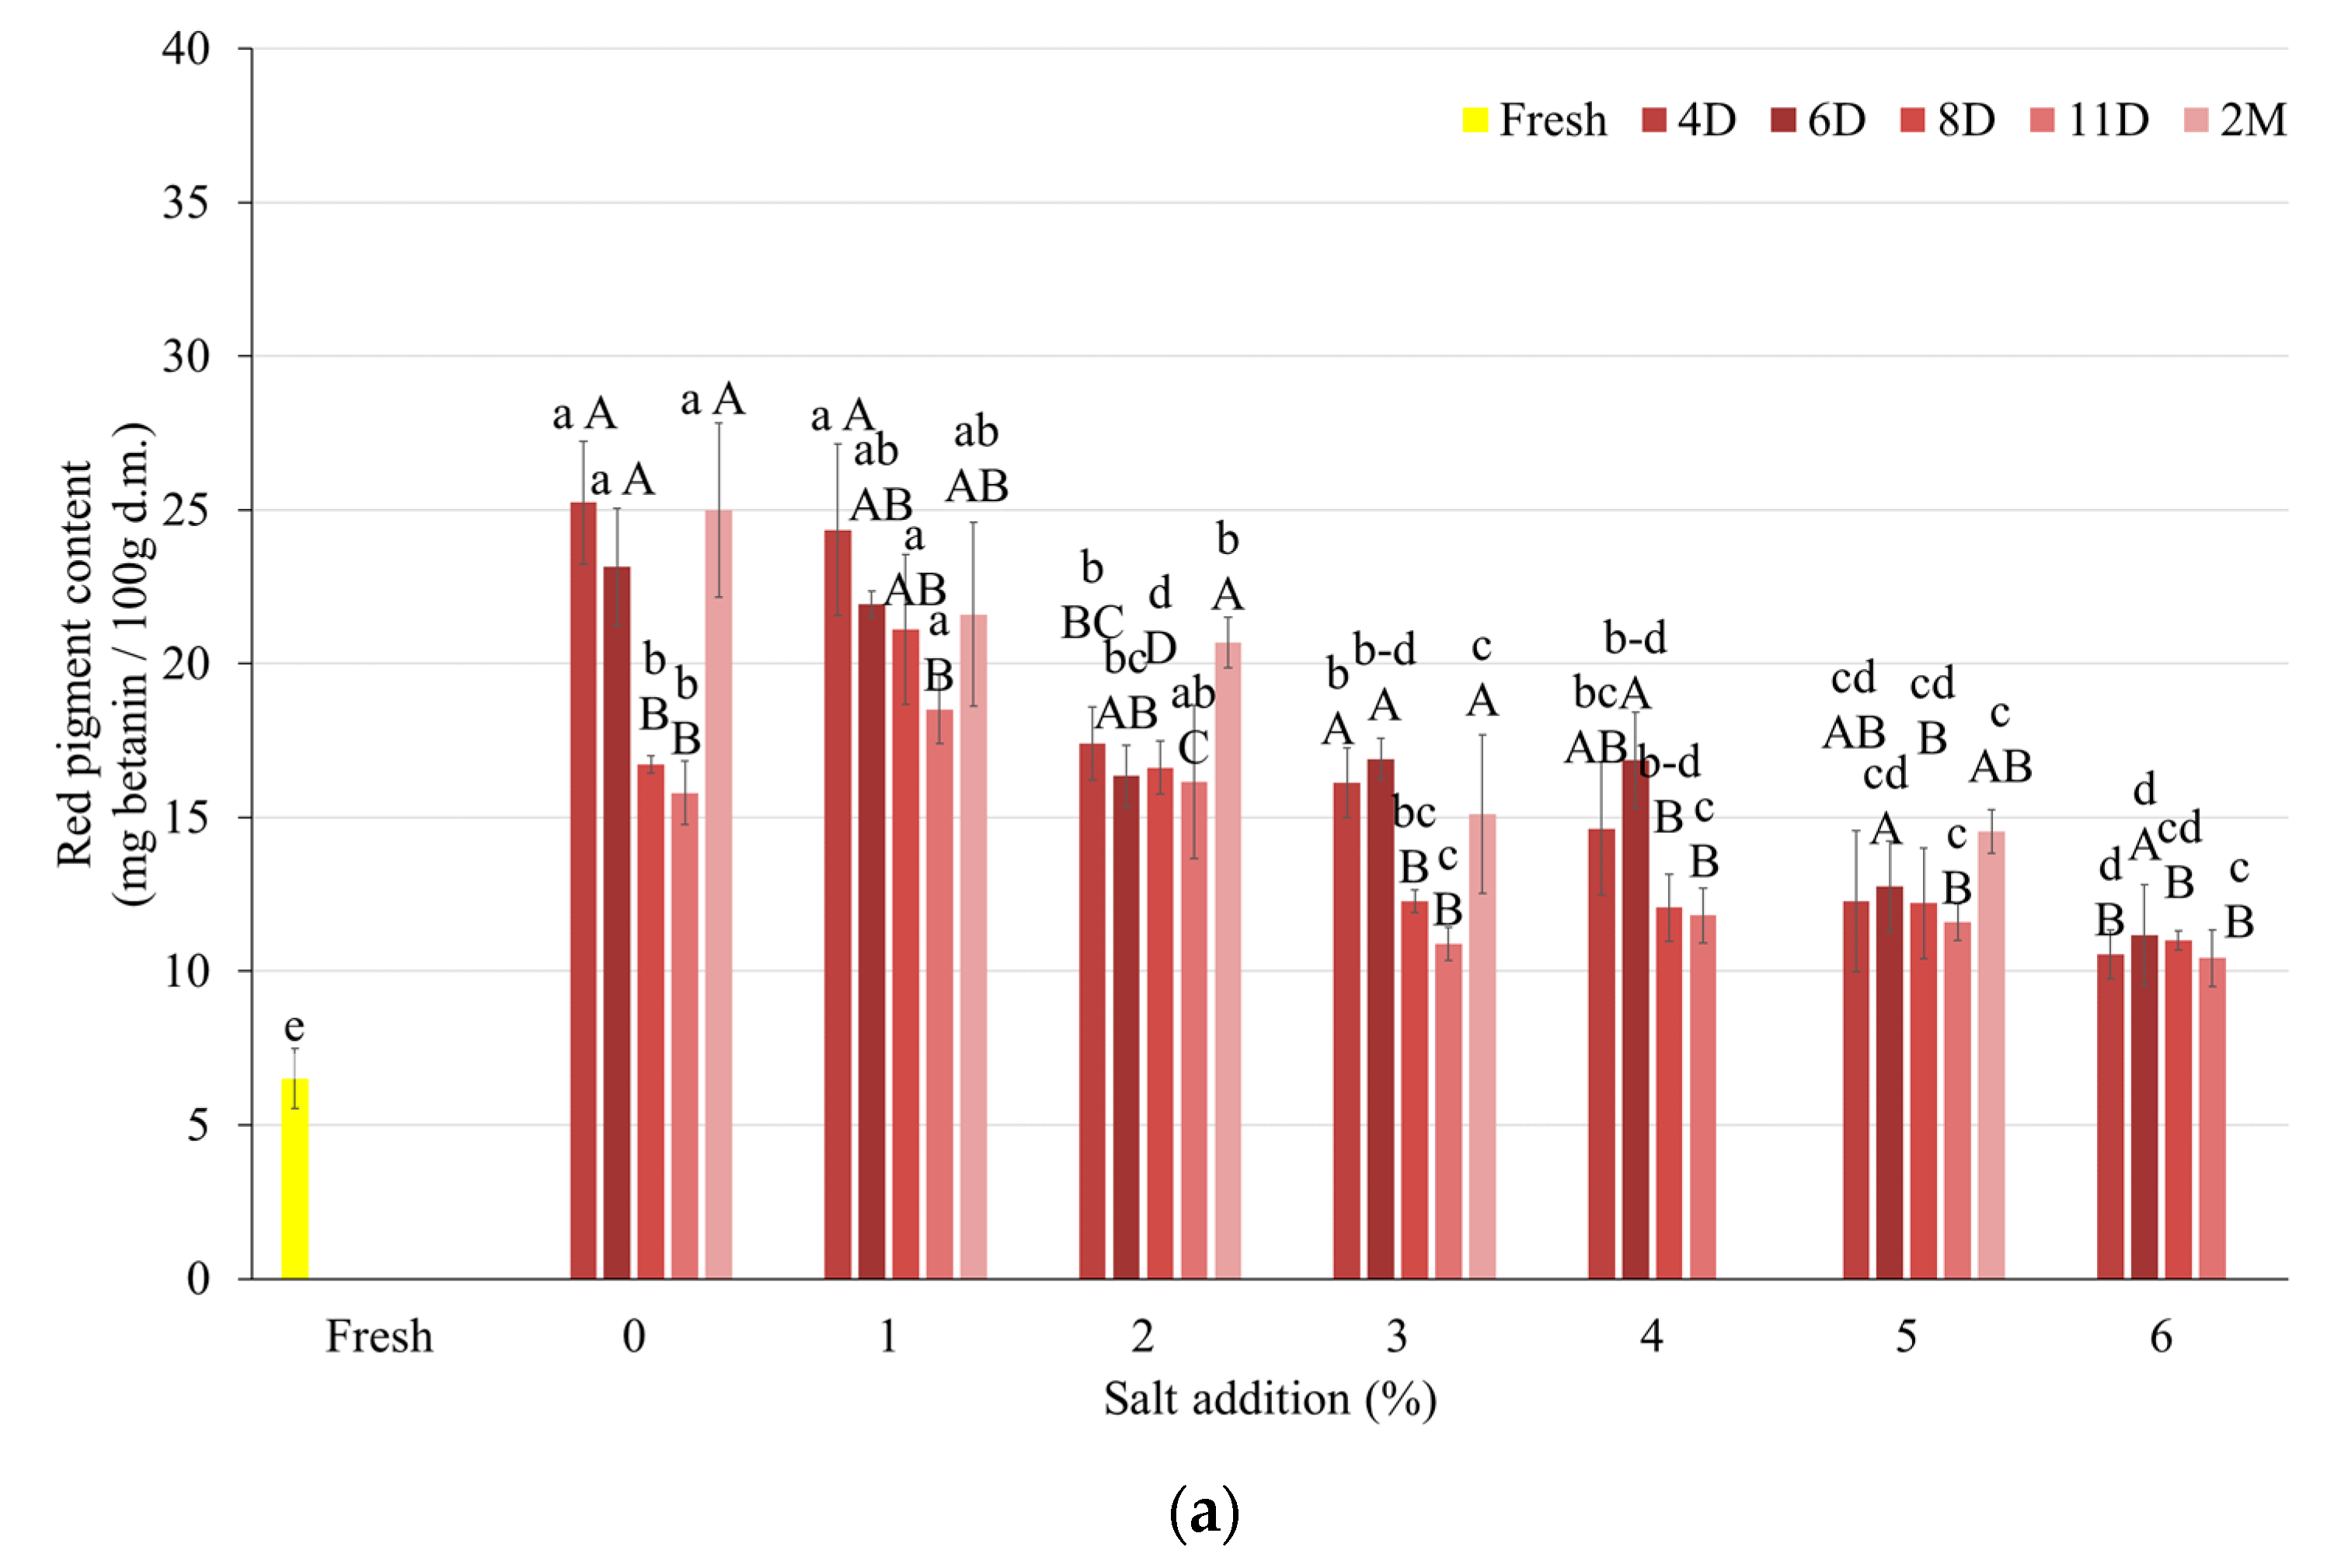
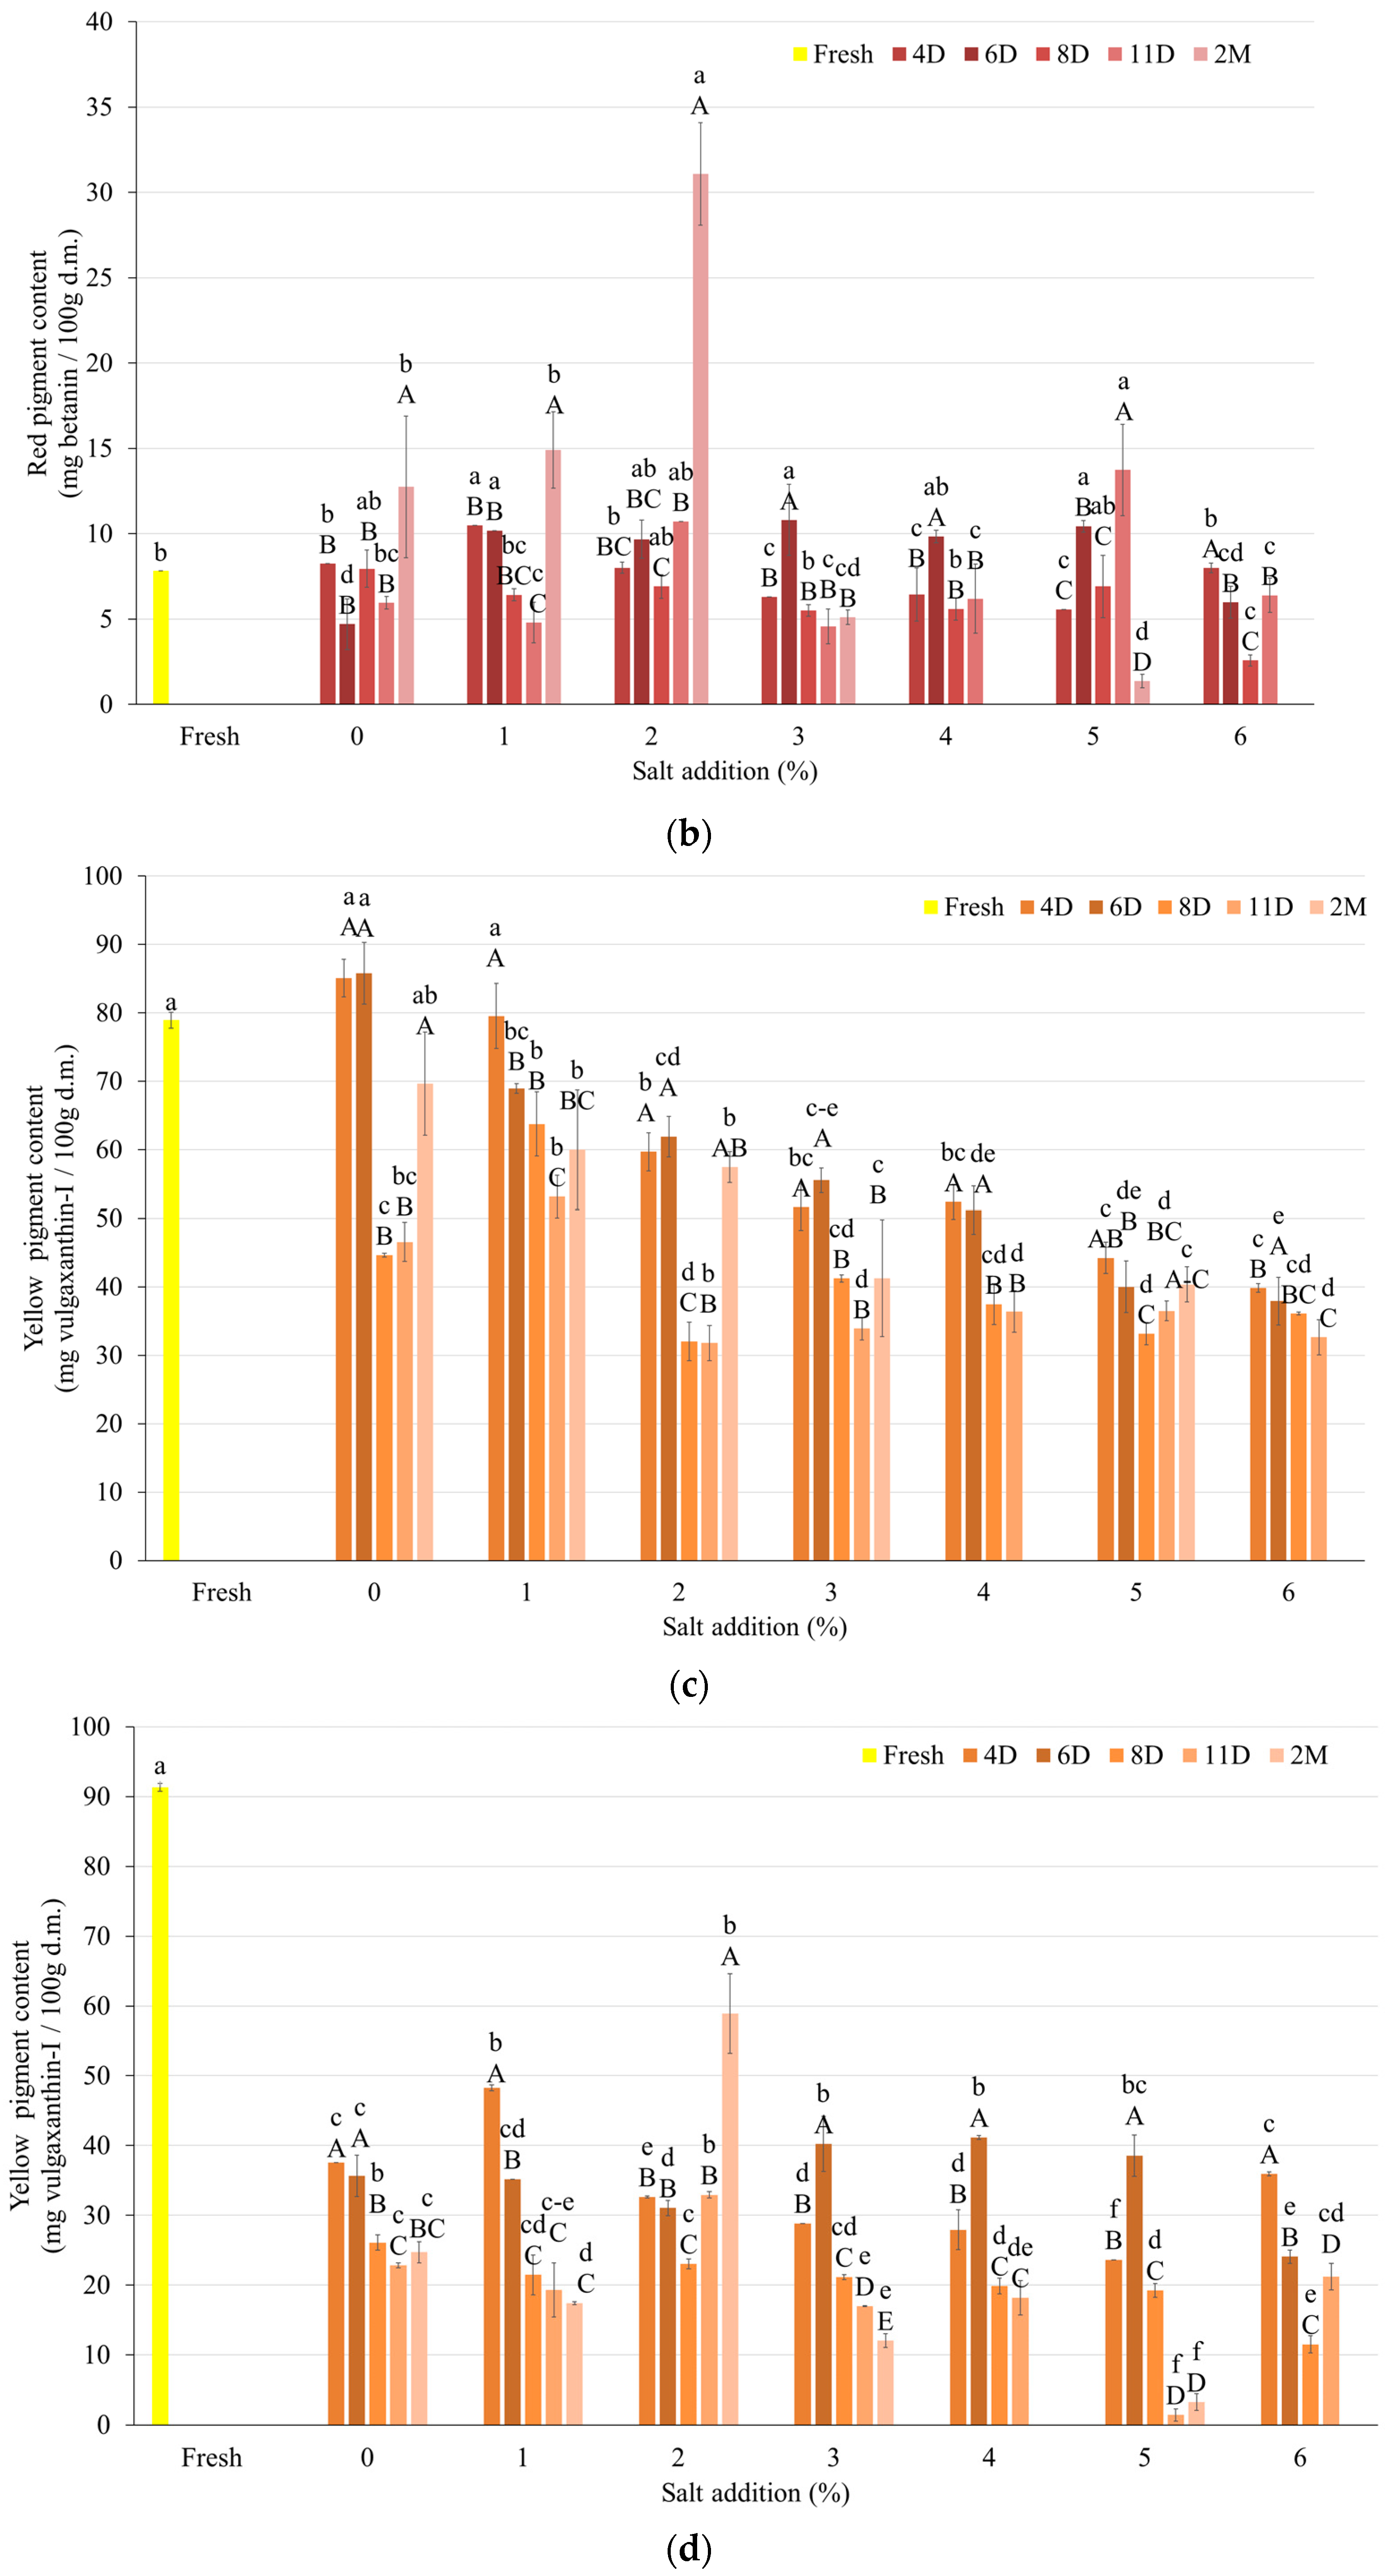
3.3.1. Pigment Content

After fermentation, there was an observed difference in the behavior of the red and yellow pigments. The red pigment values in the samples were higher compared to the raw beetroot sample, while the yellow pigment values remained similar during the initial days of fermentation, then a decrease was observed (Figure 2).
After freeze-drying, there was a decrease in both the red and yellow pigment values by 30–50%. However, there was no significant change in the pigment content in the fresh yellow beetroot. This behavior in the non-fermented sample could be due to the proper cross-linking of the active ingredients present in the tissue matrix [59,60]. What is more, during the fermentation process, beetroot tissue is immersed in an aqueous brine containing sodium chloride and lactic acid bacteria. The whole process results in a decrease in the pH, which can cause changes in the particle structures of both betaxanthins and betacyanins. Additionally, the loosening of the tissue may result in the better extraction of nutrients after the fermentation process but could also result in the greater availability of these released nutrients during freeze-drying, leading to their degradation after the FD process [58,61,62].
There is very little information available in the literature regarding the yellow beetroot pigment content. However, there is information available for the vitamin [4] and saponin [6]. In our previous research on the fermentation of red beetroot, we observed a decrease in both pigment contents [16,35,39]. Interestingly, the yellow pigments showed higher stability at a lower pH. For red beetroot, Czyżowska et al. [53] observed an increase in the content of betalains, while Sawicki and Wiczkowski [63] observed a decrease. It could be concluded that the variety of beetroot is the main reason for these differences.

3.3.2. Antioxidant Activity and Polyphenol Content

In yellow beetroot, the content of vitamins, particularly vitamin C, polyphenols and the beetroot pigments themselves (betalains), flavonoids, and polyphenolic acids are correlated with antioxidant properties. The correlations shown between the pigments and the fermentation time and the salt content in the brine, as well as the condition of the sample (non-drying and freeze-drying), demonstrated an increase in both the red and yellow pigments for the beetroot immediately after fermentation. Similar relationships can be seen for the polyphenolic compounds [64,65].
The ability to reduce free radicals was reduced in the analyzed samples (Figure 3c,d), but an increase in the antioxidant capacity was observed after the log phase in bacterial growth (after day 8 of the process). This may be due to the reduction in the sugars contained in the fermented beetroot tissue and the penetration of salts into the tissue, which may result in greater availability of vitamins and compounds during extraction performed before spectrophotometric analysis. At the same time, a significant reduction (by about 50%) in the antioxidant capacity was found in the samples after freeze-drying. The drying process lasted 24 h, during which degradation of the active ingredients could occur, which was also confirmed in the case of the yellow and red pigment contents of the samples analyzed (see Figure 2).
For the polyphenol content of yellow beetroot, in the samples analyzed after the fermentation process as well as after freeze-drying, an increase in the polyphenol content was observed, as was also found in previous studies on red beetroot juice and pepper samples. For raw yellow beetroots, values similar to those reported in the literature by Park et al. [4] were obtained. However, an inverse relationship was shown by Płatosz et al. [64] in their study on red beetroot, where both the phenolic acid content and the total phenolic content decreased, respectively, from 32 to 17 μg/g d.m. and from 33 to 18 μg/g d.m. They have correlated this decrease in tissues with the activity of phenolic acids decaboxylases and reductases. In our research in the yellow variety, these enzymes are maybe in a lower level of activity.
A different approach using the Folin–Ciocalteu (F–C) reagent was tried out, but it was discovered that it does not just react with phenolic compounds alone. It reacts with other substances that can be oxidized, such as ascorbic acid, aromatic amines, reducing sugars, and aromatic amino acids. Moreover, the presence of proteins in the sample can interfere with the assessment [66]. That is the reason for the possibly incorrect interpretation of the antioxidant properties measured by means of the polyphenol content. Based on our experience, such a high increase could be related to measuring other substances that could react with this F–C reagent.

3.3.3. Thermal Properties

Table 3 presents the findings from the thermogravimetric analysis (TGA) of freeze-dried yellow beetroot samples fermented with varying salt additions.
Thermogravimetric analysis is an advantageous method for evaluating the thermal stability of a substance by monitoring its weight loss as the temperature increases. As a result, this technique allows for assessing different features of food products that undergo high-temperature processes, offering an understanding of phenomena such as drying, dehydration, and dehydroxylation [67,68]. Table 3 provides data on the temperatures and weight losses during the thermal degradation phases. All the dried samples displayed 3 of 4 phases of thermal decomposition. Phase I (30–110 °C) leads to the dehydration of freeze-dried samples [67,69], showing the least mass loss compared to dried material containing a small amount of water 0.63–5.5% (refer to Table 2). Phase II and III are related to the decomposition of carbohydrates, such as glucose (150–200 °C) and sucrose (170–212 °C), and the degradation of organic compounds, such as polysaccharides, like hemicellulose (temperatures of 220–315 °C), cellulose (250–450 °C) and lignin (320–450 °C) [70,71] which are present in freeze-dried fermented beetroot tissue.
During the measurement, it can be observed that there is a similar mass loss in phases II and III (approximately 20–35%). This could be attributed to the reduction in the sugars, specifically glucose and sucrose, during the fermentation process. With that said, it can be summarized that in phase II, mono- and disaccharides were decomposed, while in phase III, the initial degradation of polysaccharides occurred. In phase IV, the degradation of lignocellulosic components also occurred, but the amount of loss was smaller than for II and III phase compounds. It can also said that higher salt addition resulted in lower mass loss in all the tested temperature ranges. The observed temperature values were similar independently of the salt addition or day of fermentation (Table 3).
The analysis of the samples obtained after the storage process revealed different behavior during the TGA thermogravimetric analysis. Three phases were identified, in which the degradation of the sample components occurred. The weight loss was minimal in phase I, which corresponded to the evaporation of water (range 30–90 °C). In phase II, the weight loss was significantly higher, and the temperature range differed from that of the earlier samples (90–380 °C).
The molecular composition and particle structure of freeze-dried fermented yellow beetroot were analyzed using Fourier transform infrared spectroscopy (FT-IR), measuring the vibration energy between atoms in the samples [72,73].
The FTIR spectra in Figure 4 depict samples at various salt percentages throughout the testing period. Notably, 0% (Figure 4a) and 2% (Figure 4b) salt additions are shown continuously, while the figures for 0–6% salt on the 4th (Figure 4c) and 8th (Figure 4d) days represent the start and end of fermentation, respectively, based on the microbiological outcomes. Similar results were observed for the other days and percentages, so we have decided to show those percentages, while 0 is the most different from other samples and 2% is the most similar to the rest of them, while 4th and 8th day were selected as the beginning and end of fermentation (based on the microbiological results).
The graphs show the correlations between the absorbance intensity and energy expressed in wavenumbers (cm−1). Similar functional groups in the samples suggest uniform fermentation products due to the use of the same LAB variety. However, the variations in the peak heights indicate alterations in the composition and structure due to the increased fermentation time and salt addition. The distinct peaks observed in the 3800–3000 cm−1 region (OH group) suggest differences due to the NaCl presence. The samples without salt had higher, less flattened peaks compared to the others, especially noticeable on the 4th day. The minimal salt additions (1–2%) during fermentation exhibited similarities to the fresh beetroot samples in the OH group area, as observed on the 8th day. Similar results were presented by [74] for an aqueous solution with NaCl. Zhang et al. [74] observed that each anion interacts with adjacent water molecules, inducing alterations in the O-H vibration bands characterized by specific peak frequencies and bandwidths in the region of 3500–2500 cm−1. What is more, the stretching vibration frequencies of water molecules in an aqueous NaCl solution exhibit variations with increasing salinity at a constant temperature. The elevation in the O-H stretch frequency of water molecules as the salinity increases is attributed to the formation of larger clusters.
The literature and NIST databases highlighted specific areas on the graphs. The area between 3600 and 3620 cm−1 displays a strong stretching band and vibrations that correspond to the hydroxyl group present in water and phenolic compounds. The region in the range of 2925 to 2855 cm−1 corresponds to the asymmetric stretching and deformations of alkyl groups like -CH, -CH2, and -CH3. The region between 2450 and 2300 cm−1 indicates the strong stretching between the C=O groups in the carbon dioxide molecule. The region within the 1718 cm−1 length range corresponds to the vibrational frequencies of the carbonyl group (C=O), while the range from 1650 to 1415 corresponds to the vibrations of nitrogen-containing groups. These vibrations may be linked to the colored compounds present in beetroot, betaxanthins, and betacyanins. The outlined bands within the 1150–900 cm−1 range may involve stretching vibrations linked to the (C-O) and (C-C) groups present in saccharides, like glucose, fructose, and sucrose, among others [36,38,73,75,76].
Similar observations in beetroot samples were noted by other researchers in studies involving fermented red beetroot, including Aztatzi-Rugerio et al. [76] and Mocanu et al. [77].

4. Conclusions

We conducted a study to investigate the effects of different levels of salt (ranging from 0% to 6%) on the active compound content and the number of lactic acid bacteria in fermented yellow beetroot and its dried form. The study aimed to determine how salt addition affects selected properties of fermented yellow beetroot.
We observed stable products after 4 and 8 days, which was attributed to the development of lactic acid bacteria, a decrease in the pH below 4, and an increase in the total acidity in the samples. We found that the addition of salt did not affect the stability of the products. However, it did affect the active ingredients in fermented and freeze-dried yellow beetroot.
During fermentation, 35–49% of the salt entered the beetroot tissues. This means that higher salt additions in the sink result in more salt penetrating into the beetroot tissue, which can impact the amount of salt consumed in the human diet. In order to comply with EU recommendations to reduce Na+ intake, it is advisable to use lower salt additions. However, our study found that the addition of 2% salt by manufacturers to yellow beetroot resulted in lower amounts of lactic acid bacteria.
On the other hand, a 1% addition led to higher levels of active ingredients, such as polyphenols and pigments, and satisfactory amounts of bacteria, even after the freeze-drying process. The fermentation process had a significant effect on the color components, altering the visual perception of the tested beetroots. It resulted in an increase in the polyphenol and pigment contents due to the loosening of the tissue, particularly at higher salt concentrations.
Yellow beetroot, with its high content of polyphenols, pigments and lactic acid bacteria, can be used as a healthy ingredient in a diet after undergoing a freeze-drying process.
These research findings provide valuable insights into optimizing the salt content to preserve the lactic acid bacteria, nutrients, and desirable color characteristics of fermented yellow beetroot. This could potentially position yellow beetroot as a matrix for healthier and higher-quality fermented vegetable products, or as a new raw material for innovative research.

Author Contributions

Conceptualization, E.J.-T.; methodology, E.J.-T.; software, A.W. and E.J.-T.; validation, A.W. and E.J.-T.; formal analysis, A.W. and E.J.-T.; investigation, A.W.; data curation, A.W. and E.J.-T.; writing—original draft preparation, A.W. and E.J.-T.; writing—review and editing, A.W. and E.J.-T.; visualization, A.W. and E.J.-T.; supervision, E.J.-T. All authors have read and agreed to the published version of the manuscript.

Funding

This research received no external funding.

Institutional Review Board Statement

Not applicable.

Informed Consent Statement

Not applicable.

Data Availability Statement

Data are available from the corresponding author.

Acknowledgments

The research for this publication was carried out with the use of research equipment purchased as part of the “Food and Nutrition Centre—modernisation of the WULS campus to create a Food and Nutrition Research and Development Centre (CŻiŻ)” co-financed by the European Union from the European Regional Development Fund under the Regional Operational Programme of the Mazowieckie Voivodeship for 2014–2020 (Project No. RPMA.01.01.00-14-8276/17).

Conflicts of Interest

The authors declare no conflicts of interest.

References

  1. Šlosár, M.; Kopta, T.; Hegedűs, O.; Hegedűsová, A.; Mezeyová, I.; Timoracká, M.; Mezey, J. Yield parameters, antioxidant activity, polyphenol and total soluble solids content of beetroot cultivars with different flesh colours. Folia Hortic. 2020, 32, 351–362. [Google Scholar] [CrossRef]
  2. Ceclu, L.; Nistor, O.-V. Red Beetroot: Composition and Health Effects—A Review. J. Nutr. Med. Diet Care 2020, 6, 1–9. [Google Scholar] [CrossRef]
  3. Chhikara, N.; Kushwaha, K.; Sharma, P.; Gat, Y.; Panghal, A. Bioactive compounds of beetroot and utilization in food processing industry: A critical review. Food Chem. 2019, 272, 192–200. [Google Scholar] [CrossRef] [PubMed]
  4. Park, S.-Y.; Lee, J.-H.; Kim, B.-M.; Baik, S.-J.; Lee, S.-H.; Nam, J.-S. Comparison of Nutritional Components of Beets from Three Different Beta vulgaris L. Cultivars in Korea. J. Korean Soc. Food Sci. Nutr. 2020, 49, 969–976. [Google Scholar] [CrossRef]
  5. Wruss, J.; Waldenberger, G.; Huemer, S.; Uygun, P.; Lanzerstorfer, P.; Müller, U.; Höglinger, O.; Weghuber, J. Compositional characteristics of commercial beetroot products and beetroot juice prepared from seven beetroot varieties grown in Upper Austria. J. Food Compos. Anal. 2015, 42, 46–55. [Google Scholar] [CrossRef]
  6. Spórna-Kucab, A.; Tekieli, A.; Skalicka-Woźniak, K.; Grzegorczyk, A.; Świergosz, T.; Wybraniec, S. Characterization of triterpene saponin composition of white, yellow and red beetroot (Beta vulgaris L.). Pol. J. Food Nutr. Sci. 2022, 72, 159–170. [Google Scholar] [CrossRef]
  7. Patel, A. Probiotic fruit and vegetable juices-recent advances and future perspective. Int. Food Res. J. 2017, 24, 1850–1857. [Google Scholar]
  8. de Oliveira, P.M.; Leite Júnior, B.R.d.C.; Martins, E.M.F.; Martins, M.L.; Vieira, É.N.R.; de Barros, F.A.R.; Cristianini, M.; de Almeida Costa, N.; Ramos, A.M. Mango and carrot mixed juice: A new matrix for the vehicle of probiotic lactobacilli. J. Food Sci. Technol. 2021, 58, 98–109. [Google Scholar] [CrossRef]
  9. Pimentel, T.C.; da Costa, W.K.A.; Barão, C.E.; Rosset, M.; Magnani, M. Vegan probiotic products: A modern tendency or the newest challenge in functional foods. Food Res. Int. 2021, 140, 110033. [Google Scholar] [CrossRef]
  10. McClements, D.J.; Grossmann, L. The science of plant-based foods: Constructing next-generation meat, fish, milk, and egg analogs. Compr. Rev. Food Sci. Food Saf. 2021, 20, 4049–4100. [Google Scholar] [CrossRef]
  11. Casciano, F.; Mayr, H.; Nissen, L.; Putti, A.; Zoli, F.; Gianotti, A.; Conterno, L. Red Beetroot Fermentation with Different Microbial Consortia to Develop Foods with Improved Aromatic Features. Foods 2022, 11, 3055. [Google Scholar] [CrossRef] [PubMed]
  12. Ogrodowczyk, A.M.; Drabińska, N. Crossroad of Tradition and Innovation—The Application of Lactic Acid Fermentation to Increase the Nutritional and Health-Promoting Potential of Plant-Based Food Products—A Review. Pol. J. Food Nutr. Sci. 2021, 71, 107–134. [Google Scholar] [CrossRef]
  13. Jagannath, A.; Kumar, M.; Raju, P. Fermentative stabilization of betanin content in beetroot and its loss during processing and refrigerated storage. J. Food Process. Preserv. 2015, 39, 606–613. [Google Scholar] [CrossRef]
  14. Ropelewska, E.; Sabanci, K.; Aslan, M.F. The Changes in Bell Pepper Flesh as a Result of Lacto-Fermentation Evaluated Using Image Features and Machine Learning. Foods 2022, 11, 2956. [Google Scholar] [CrossRef] [PubMed]
  15. Kiczorowski, P.; Kiczorowska, B.; Samolińska, W.; Szmigielski, M.; Winiarska-Mieczan, A. Effect of fermentation of chosen vegetables on the nutrient, mineral, and biocomponent profile in human and animal nutrition. Sci. Rep. 2022, 12, 13422. [Google Scholar] [CrossRef] [PubMed]
  16. Janiszewska-Turak, E.; Walczak, M.; Rybak, K.; Pobiega, K.; Gniewosz, M.; Woźniak, Ł.; Witrowa-Rajchert, D. Influence of Fermentation Beetroot Juice Process on the Physico-Chemical Properties of Spray Dried Powder. Molecules 2022, 27, 1008. [Google Scholar] [CrossRef]
  17. Mathur, H.; Beresford, T.P.; Cotter, P.D. Health benefits of lactic acid bacteria (LAB) fermentates. Nutrients 2020, 12, 1679. [Google Scholar] [CrossRef]
  18. de Souza, E.L.; de Oliveira, K.Á.R.; de Oliveira, M.E.G. Influence of lactic acid bacteria metabolites on physical and chemical food properties. Curr. Opin. Food Sci. 2022, 49, 100981. [Google Scholar] [CrossRef]
  19. Food and Agriculture Organization of the United Nations; World Health Organization. Probiotics in Food: Health and Nutritional Properties and Guidelines for Evaluation: Report of a Joint FAO/WHO Expert Consultation on Evaluation of Health and Nutritional Properties of Probiotics in Food including Powder Milk with Live Lactic Acid Bacteria, Cordoba, Argentina, 1–4 October 2001 [and] Report of a Joint FAO/WHO Working Group on Drafting Guidelines for the Evaluation of Probiotics in Food, London, Ontario, Canada, 30 April –1 May 2002; 0254-4725; World Health Organization: Geneva, Switzerland, 2006.
  20. FAO; WHO. Report on Drafting Guidelines for the Evaluation of Probiotics in Food; FAO: Rome, Italy; Geneva, Switzerland, 2002.
  21. Bontsidis, C.; Mallouchos, A.; Terpou, A.; Nikolaou, A.; Batra, G.; Mantzourani, I.; Alexopoulos, A.; Plessas, S. Microbiological and Chemical Properties of Chokeberry Juice Fermented by Novel Lactic Acid Bacteria with Potential Probiotic Properties during Fermentation at 4 degrees C for 4 Weeks. Foods 2021, 10, 768. [Google Scholar] [CrossRef]
  22. Ilango, S.; Antony, U. Probiotic microorganisms from non-dairy traditional fermented foods. Trends Food Sci. Technol. 2021, 118, 617–638. [Google Scholar] [CrossRef]
  23. Janiszewska-Turak, E.; Rybak, K.; Pobiega, K.; Nikodem, A.; Gramza-Michałowska, A. Sustainable Production and Characteristics of Dried Fermented Vegetables. Fermentation 2022, 8, 659. [Google Scholar] [CrossRef]
  24. Neri-Numa, I.A.; Arruda, H.S.; Geraldi, M.V.; Maróstica Júnior, M.R.; Pastore, G.M. Natural prebiotic carbohydrates, carotenoids and flavonoids as ingredients in food systems. Curr. Opin. Food Sci. 2020, 33, 98–107. [Google Scholar] [CrossRef]
  25. Wang, X.; Wang, P. Red beetroot juice fermented by water kefir grains: Physicochemical, antioxidant profile and anticancer activity. Eur. Food Res. Technol. 2023, 249, 939–950. [Google Scholar] [CrossRef]
  26. WHO Europe. Food Based Dietary Guidelines in the WHO European Region; WHO (World Health Organization Regional Office for Europe): Copenhagen, Denmark, 2003.
  27. Commission, E. Dietary Salt/Sodium. Available online: https://knowledge4policy.ec.europa.eu/health-promotion-knowledge-gateway/dietary-saltsodium_en (accessed on 22 December 2023).
  28. He, F.J.; MacGregor, G.A. Reducing population salt intake worldwide: From evidence to implementation. Prog. Cardiovasc. Dis. 2010, 52, 363–382. [Google Scholar] [CrossRef] [PubMed]
  29. Miguel, E.; Marta, L.; Ana Cristina, A.-S.; Maria Eduarda, P. The Role of Salt on Food and Human Health; IntechOpen: London, UK, 2019. [Google Scholar] [CrossRef]
  30. Bautista-Gallego, J.; Rantsiou, K.; Garrido-Fernandez, A.; Cocolin, L.; Arroyo-Lopez, F.N. Salt reduction in vegetable fermentation: Reality or desire? J. Food Sci. 2013, 78, R1095–R1100. [Google Scholar] [CrossRef] [PubMed]
  31. Peréz-Dıaz, I.; Breidt, F.; Buescher, R.; Arroyo-López, F.; Jiménez-Dıaz, R.; Garrido-Fernández, A.; Johanningsmeire, S. Fermented and Acidified Vegetables. In Compendium of Methods for the Microbiological Examination of Foods, 4th ed.; American Public Health Association: Washington, DC, USA, 2013; pp. 521–532. [Google Scholar]
  32. Lin, X.; Tang, Y.; Hu, Y.; Lu, Y.; Sun, Q.; Lv, Y.; Zhang, Q.; Wu, C.; Zhu, M.; He, Q. Sodium reduction in traditional fermented foods: Challenges, strategies, and perspectives. J. Agric. Food Chem. 2021, 69, 8065–8080. [Google Scholar] [CrossRef] [PubMed]
  33. Ma, Y.; Yi, J.; Jin, X.; Li, X.; Feng, S.; Bi, J. Freeze-drying of fruits and vegetables in food industry: Effects on phytochemicals and bioactive properties attributes-a comprehensive review. Food Rev. Int. 2023, 39, 6611–6629. [Google Scholar] [CrossRef]
  34. Michalska, A.; Wojdyło, A.; Lech, K.; Łysiak, G.P.; Figiel, A. Physicochemical properties of whole fruit plum powders obtained using different drying technologies. Food Chem. 2016, 207, 223–232. [Google Scholar] [CrossRef]
  35. Janiszewska-Turak, E.; Tracz, K.; Bielińska, P.; Rybak, K.; Pobiega, K.; Gniewosz, M.; Woźniak, Ł.; Gramza-Michałowska, A. The Impact of the Fermentation Method on the Pigment Content in Pickled Beetroot and Red Bell Pepper Juices and Freeze-Dried Powders. Appl. Sci. 2022, 12, 5766. [Google Scholar] [CrossRef]
  36. Karwacka, M.; Ciurzyńska, A.; Galus, S.; Janowicz, M. Freeze-dried snacks obtained from frozen vegetable by-products and apple pomace–Selected properties, energy consumption and carbon footprint. Innov. Food Sci. Emerg. Technol. 2022, 77, 102949. [Google Scholar] [CrossRef]
  37. Nielsen, S.S.; Nielsen, S.S. Sodium determination using ion-selective electrodes, Mohr titration, and test strips. In Food Analysis Laboratory Manual; Springer: Cham, Switzerland, 2017; pp. 161–170. [Google Scholar]
  38. Rybak, K.; Wiktor, A.; Kaveh, M.; Dadan, M.; Witrowa-Rajchert, D.; Nowacka, M. Effect of Thermal and Non-Thermal Technologies on Kinetics and the Main Quality Parameters of Red Bell Pepper Dried with Convective and Microwave-Convective Methods. Molecules 2022, 27, 2164. [Google Scholar] [CrossRef] [PubMed]
  39. Janiszewska-Turak, E.; Pobiega, K.; Rybak, K.; Synowiec, A.; Woźniak, Ł.; Trych, U.; Gniewosz, M.; Witrowa-Rajchert, D. Changes in Physical and Chemical Parameters of Beetroot and Carrot Juices Obtained by Lactic Fermentation. Appl. Sci. 2023, 13, 6113. [Google Scholar] [CrossRef]
  40. Kruszewski, B.; Domian, E.; Nowacka, M. Influence of High-Pressure Homogenization on the Physicochemical Properties and Betalain Pigments of Red Beetroot (Beta vulgaris L.) Juice. Molecules 2023, 28, 2018. [Google Scholar] [CrossRef] [PubMed]
  41. Van Der Sluis, A.A.; Dekker, M.; Skrede, G.; Jongen, W.M. Activity and concentration of polyphenolic antioxidants in apple juice. 1. Effect of existing production methods. J. Agric. Food Chem. 2002, 50, 7211–7219. [Google Scholar] [CrossRef] [PubMed]
  42. Moayyedi, M.; Eskandari, M.H.; Rad, A.H.E.; Ziaee, E.; Khodaparast, M.H.H.; Golmakani, M.-T. Effect of drying methods (electrospraying, freeze drying and spray drying) on survival and viability of microencapsulated Lactobacillus rhamnosus ATCC 7469. J. Funct. Foods 2018, 40, 391–399. [Google Scholar] [CrossRef]
  43. Ropelewska, E.; Wrzodak, A.; Sabanci, K.; Aslan, M.F. Effect of lacto-fermentation and freeze-drying on the quality of beetroot evaluated using machine vision and sensory analysis. Eur. Food Res. Technol. 2021, 284, 153–161. [Google Scholar] [CrossRef]
  44. Comunian, T.A.; Silva, M.P.; Moraes, I.C.F.; Favaro-Trindade, C.S. Reducing carotenoid loss during storage by co-encapsulation of pequi and buriti oils in oil-in-water emulsions followed by freeze-drying: Use of heated and unheated whey protein isolates as emulsifiers. Food Res. Int. 2020, 130, 108901. [Google Scholar] [CrossRef]
  45. Kale, R.; Sawate, A.; Kshirsagar, R.; Patil, B.; Mane, R. Studies on evaluation of physical and chemical composition of beetroot (Beta vulgaris L.). Int. J. Chem. Stud. 2018, 6, 2977–2979. [Google Scholar]
  46. Carrillo, C.; Wilches-Pérez, D.; Hallmann, E.; Kazimierczak, R.; Rembiałkowska, E. Organic versus conventional beetroot. Bioactive compounds and antioxidant properties. LWT-Food Sci. Technol. 2019, 116, 108552. [Google Scholar] [CrossRef]
  47. Kuria, M.W.; Matofari, J.W.; Nduko, J.M. Physicochemical, antioxidant, and sensory properties of functional mango (Mangifera indica L.) leather fermented by lactic acid bacteria. J. Agric. Food Res. 2021, 6, 100206. [Google Scholar] [CrossRef]
  48. Niakousari, M.; Razmjooei, M.; Nejadmansouri, M.; Barba, F.J.; Marszałek, K.; Koubaa, M. Current Developments in Industrial Fermentation Processes. In Fermentation Processes: Emerging and Conventional Technologies; Koubaa, M., Barba, F.J., Roohinejad, S., Eds.; Wiley: Hoboken, NJ, USA, 2021; pp. 23–96. [Google Scholar]
  49. Dimakopoulou-Papazoglou, D.; Lazaridou, A.; Biliaderis, C.G.; Katsanidis, E. Effect of Process Temperature on the Physical State of Beef Meat Constituents—Implications on Diffusion Kinetics during Osmotic Dehydration. Food Bioprocess Technol. 2022, 15, 706–716. [Google Scholar] [CrossRef]
  50. Kim, M.; Kerr, W.L. Vacuum-belt drying of rabbiteye blueberry (Vaccinium ashei) slurries: Influence of drying conditions on physical and quality properties of blueberry powder. Food Bioprocess Technol. 2013, 6, 3227–3237. [Google Scholar] [CrossRef]
  51. Stoll, D.A.; Müller, A.; Meinhardt, A.-K.; Dötsch, A.; Greiner, R.; Kulling, S.E.; Huch, M. Influence of salt concentration and iodized table salt on the microbiota of fermented cucumbers. Food Microbiol. 2020, 92, 103552. [Google Scholar] [CrossRef] [PubMed]
  52. Marszałek, K.; Krzyżanowska, J.; Woźniak, Ł.; Skąpska, S. Kinetic modelling of polyphenol oxidase, peroxidase, pectin esterase, polygalacturonase, degradation of the main pigments and polyphenols in beetroot juice during high pressure carbon dioxide treatment. LWT-Food Sci. Technol. 2017, 85, 412–417. [Google Scholar] [CrossRef]
  53. Czyżowska, A.; Klewicka, E.; Libudzisz, Z. The influence of lactic acid fermentation process of red beet juice on the stability of biologically active colorants. Eur. Food Res. Technol. 2006, 223, 110–116. [Google Scholar] [CrossRef]
  54. Shaik, L.; Chakraborty, S. Nonthermal pasteurization of pineapple juice: A review on the potential of achieving microbial safety and enzymatic stability. Compr. Rev. Food Sci. Food Saf. 2022, 21, 4716–4737. [Google Scholar] [CrossRef]
  55. Kozielska, E.; Bienia, B. Roślinne produkty fermentacji mlekowej w tradycyjnej kuchni polskiej. In Turystyka wiejska i dziedzictwo wsi w kontekście pandemii SARS-CoV-2; Kimta-Dziasek, E., Szanduła, M., Eds.; Instytut Zootechniki, Państwowy Instytut Badawczy: Kraków, Poland, 2021; pp. 89–94. [Google Scholar]
  56. Flores-Mancha, M.A.; Ruíz-Gutiérrez, M.G.; Sánchez-Vega, R.; Santellano-Estrada, E.; Chávez-Martínez, A. Characterization of Beet Root Extract (Beta vulgaris) Encapsulated with Maltodextrin and Inulin. Molecules 2020, 25, 5498. [Google Scholar] [CrossRef]
  57. Kaderides, K.; Solomakou, N.; Mourtzinos, I.; Goula, A.M. Spray drying encapsulation of natural food colorants. In Spray Drying for the Food Industry: Unit Operations and Processing Equipment in the Food Industry; Jafari, S.M., Samborska, K., Eds.; Elsevier: Amsterdam, The Netherlands, 2023; pp. 303–337. [Google Scholar]
  58. Nowacka, M.; Dadan, M.; Janowicz, M.; Wiktor, A.; Witrowa-Rajchert, D.; Mandal, R.; Pratap-Singh, A.; Janiszewska-Turak, E. Effect of nonthermal treatments on selected natural food pigments and color changes in plant material. Compr. Rev. Food Sci. Food Saf. 2021, 20, 5097–5144. [Google Scholar] [CrossRef]
  59. Liu, Y.; Zhang, Z.; Hu, L. High efficient freeze-drying technology in food industry. Crit. Rev. Food Sci. Nutr. 2021, 62, 3370–3388. [Google Scholar] [CrossRef]
  60. Nowak, D.; Jakubczyk, E. The freeze-drying of foods—The characteristic of the process course and the effect of its parameters on the physical properties of food materials. Foods 2020, 9, 1488. [Google Scholar] [CrossRef]
  61. Lyu, Y.; Bi, J.; Chen, Q.; Wu, X.; Gou, M.; Yang, X. Color enhancement mechanisms analysis of freeze-dried carrots treated by ultrasound-assisted osmosis (ascorbic acid-CaCl2) dehydration. Food Chem. 2022, 381, 132255. [Google Scholar] [CrossRef] [PubMed]
  62. Gokhale, S.; Lele, S. Dehydration of red beet root (Beta vulgaris) by hot air drying: Process optimization and mathematical modeling. Food Sci. Biotechnol. 2011, 20, 955–964. [Google Scholar] [CrossRef]
  63. Sawicki, T.; Wiczkowski, W. The effects of boiling and fermentation on betalain profiles and antioxidant capacities of red beetroot products. Food Chem. 2018, 259, 292–303. [Google Scholar] [CrossRef] [PubMed]
  64. Płatosz, N.; Sawicki, T.; Wiczkowski, W. Profile of Phenolic Acids and Flavonoids of Red Beet and Its Fermentation Products. Does Long-Term Consumption of Fermented Beetroot Juice Affect Phenolics Profile in Human Blood Plasma and Urine? Pol. J. Food Nutr. Sci. 2020, 70, 55–65. [Google Scholar] [CrossRef]
  65. Czyżowska, A.; Siemianowska, K.; Śniadowska, M.; Nowak, A. Bioactive Compounds and Microbial Quality of Stored Fermented Red Beetroots and Red Beetroot Juice. Pol. J. Food Nutr. Sci. 2020, 70, 35–44. [Google Scholar] [CrossRef]
  66. Malta, L.G.; Liu, R.H. Analyses of Total Phenolics, Total Flavonoids, and Total Antioxidant Activities in Foods and Dietary Supplements. In Encyclopedia of Agriculture and Food Systems; Van Alfen, N.K., Ed.; Elsevier, Academic Press: London, UK, 2014; pp. 305–314. [Google Scholar]
  67. Carmo, E.L.D.; Teodoro, R.A.R.; Felix, P.H.C.; Fernandes, R.V.B.; Oliveira, E.R.; Veiga, T.; Borges, S.V.; Botrel, D.A. Stability of spray-dried beetroot extract using oligosaccharides and whey proteins. Food Chem. 2018, 249, 51–59. [Google Scholar] [CrossRef]
  68. Otalora, M.C.; Carriazo, J.G.; Iturriaga, L.; Nazareno, M.A.; Osorio, C. Microencapsulation of betalains obtained from cactus fruit (Opuntia ficus-indica) by spray drying using cactus cladode mucilage and maltodextrin as encapsulating agents. Food Chem. 2015, 187, 174–181. [Google Scholar] [CrossRef]
  69. Zlatanović, S.; Ostojić, S.; Micić, D.; Rankov, S.; Dodevska, M.; Vukosavljević, P.; Gorjanović, S. Thermal behaviour and degradation kinetics of apple pomace flours. Thermochim. Acta 2019, 673, 17–25. [Google Scholar] [CrossRef]
  70. Lam, S.S.; Liew, R.K.; Lim, X.Y.; Ani, F.N.; Jusoh, A. Fruit waste as feedstock for recovery by pyrolysis technique. Int. Biodeterior. Biodegrad. 2016, 113, 325–333. [Google Scholar] [CrossRef]
  71. Cheng, X.-C.; Cui, X.-Y.; Qin, Z.; Liu, H.-M.; Wang, X.-D.; Liu, Y.-L. Effect of drying pretreatment methods on structural features and antioxidant activities of Brauns native lignin extracted from Chinese quince fruit. Process Biochem. 2021, 106, 70–77. [Google Scholar] [CrossRef]
  72. Quijano-Ortega, N.; Fuenmayor, C.A.; Zuluaga-Dominguez, C.; Diaz-Moreno, C.; Ortiz-Grisales, S.; García-Mahecha, M.; Grassi, S. FTIR-ATR Spectroscopy Combined with Multivariate Regression Modeling as a Preliminary Approach for Carotenoids Determination in Cucurbita spp. Appl. Sci. 2020, 10, 3722. [Google Scholar] [CrossRef]
  73. Nesakumar, N.; Baskar, C.; Kesavan, S.; Rayappan, J.B.B.; Alwarappan, S. Analysis of Moisture Content in Beetroot using Fourier Transform Infrared Spectroscopy and by Principal Component Analysis. Sci. Rep. 2018, 8, 7996. [Google Scholar] [CrossRef]
  74. Zhang, X.; Zhang, R.; Hu, S. FT-IR spectra of NaCl–H2O in the region from near to beyond the critical state. Res. Chem. Intermed. 2011, 37, 405–413. [Google Scholar] [CrossRef]
  75. Janković, B.; Marinović-Cincović, M.; Janković, M. TG-DTA-FTIR analysis and isoconversional reaction profiles for thermal and thermo-oxidative degradation processes in black chokeberry (Aroniamelanocarpa). Chem. Pap. 2016, 70, 1094–1105. [Google Scholar] [CrossRef]
  76. Aztatzi-Rugerio, L.; Granados-Balbuena, S.Y.; Zainos-Cuapio, Y.; Ocaranza-Sánchez, E.; Rojas-López, M. Analysis of the degradation of betanin obtained from beetroot using Fourier transform infrared spectroscopy. J. Food Sci. Technol. 2019, 56, 3677–3686. [Google Scholar] [CrossRef]
  77. Mocanu, G.D.; Chirila, A.C.; Vasile, A.M.; Andronoiu, D.G.; Nistor, O.V.; Barbu, V.; Stanciuc, N. Tailoring the Functional Potential of Red Beet Purees by Inoculation with Lactic Acid Bacteria and Drying. Foods 2020, 9, 1611. [Google Scholar] [CrossRef]
Figure 1. Color coefficients: (a) lightness; (b) redness; and (c) yellowness; a, b, c…—mean a statistically significant difference in the selected % through the whole fermentation process (from 0 to 2M); A, B, C…—mean a statistically significant difference for the selected day analyzed for all the tested salt contents (for each series).
Applsci 14 00524 g001aApplsci 14 00524 g001b
Figure 2. Results of the betalain content: (a) red pigments after fermentation; (b) red pigments after fermentation and freeze-drying; (c) yellow pigments after fermentation; (d) yellow pigments after fermentation and freeze-drying; a, b, c…—mean a statistically significant difference in the selected % through the whole fermentation process (from 0 to 2M); A, B, C…—mean a statistically significant difference for the selected day analyzed for all the tested salt contents (for each series).
Applsci 14 00524 g002aApplsci 14 00524 g002b
Figure 3. Results of antioxidant tests for the beetroot samples: (a) total polyphenols after fermentation; (b) total polyphenols after fermentation and freeze-drying; (c) antioxidant activity after fermentation; (d) antioxidant activity after fermentation and freeze-drying; a, b, c…—mean a statistically significant difference in the selected % through the whole fermentation process (from 0 to 2M); A, B, C…—mean a statistically significant difference for the selected day analyzed for all the tested salt contents (for each series).
Applsci 14 00524 g003aApplsci 14 00524 g003b
Figure 4. FTIR results for selected beetroot examples: (a) for 0% salt addition; (b) for 2% salt addition; (c) for 4th day of fermentation; and (d) for 8th day of fermentation.
Applsci 14 00524 g004
Table 1. The number of lactic acid bacteria during fermentation.
Salt
Content (%)
DayAfter
Fermentation
(log CFU/cm3)
After FD
(log CFU/cm3)
Fresh000
048.87 ± 0.24 BC7.36 ± 0.37 I–K
110.07 ± 0.35 A6.45 ± 0.12 LM
28.3 ± 0.02 C–F6.61 ± 0 L
38.68 ± 0.31 B–D6.35 ± 0.03 LM
48.18 ± 0.1 C–F6.46 ± 0.05 LM
58.22 ± 0.01 C–F6.37 ± 0.05 LM
68.03 ± 0.26 D–H6.32 ± 0.03 LM
089.2 ± 0.47 B7.42 ± 0.38 LM
18.14 ± 0.05 D–F6.51 ± 0.12 LM
28.46 ± 0.06 C–F6.67 ± 0 L
37.83 ± 0.02 F–I6.41 ± 0.03 LM
48.06 ± 0.02 D–H6.51 ± 0.05 LM
58.07 ± 0.01 D–H6.43 ± 0.05 LM
68.11 ± 0.04 D–G6.38 ± 0.04 LM
0118.5 ± 0.24 C–E6.75 ± 0.21 KL
18.04 ± 0.01 D–H6.53 ± 0.01 LM
28.45 ± 0 C–F6.8 ± 0.09 J–L
37.47 ± 0.24 G–I5.93 ± 0.23 M
47.9 ± 0.03 E–I6.5 ± 0.07 LM
58.17 ± 0.01 D–F6.65 ± 0.06 L
67.42 ± 0.16 H–J5.94 ± 0.16 M
02M5.2 ± 0.15 N4.65 ± 0.13 N–P
14.92 ± 0.01 NO4.34 ± 0.02 OP
25.17 ± 0 N4.56 ± 0.03 N–P
34.57 ± 0.15 N–P4.17 ± 0.16 P
55 ± 0.01 NO4.44 ± 0.02 OP
Different capital letters (A, B, C…P) indicate significant differences (p < 0.05).
Table 2. Comparison of properties between fermented yellow beetroot before and after freeze-drying.
Salt
Addition (%)
DayDry Matter
after Fermentation [%]
Dry Matter of
after FD [%]
pH of Brine
(-)
Measured Salt Content (%)Total Acidity (g Lactic Acid/
100 g Sample)
Fresh010.92 ± 0.13 A96.75 ± 0.15 ABC6.28 ± 0.06 A0.25 ± 0.01 T4.1 ± 0.0 R
045.7 ± 0.13 L–O95.57 ± 0.45 B–F3.48 ± 0.00 BC0.21 ± 0.01 UW15 ± 0.1 A
16.14 ± 0.02 J–M95.56 ± 1.35 B–F3.45 ± 0.01 C0.67 ± 0.02 PR7.7 ± 0.1 F–K
26.41 ± 0.04 I–L96 ± 0.98 B–E3.26 ± 0.00 H–L1.15 ± 0.02 MN7.2 ± 0.1 I–L
36.18 ± 0.07 J–M96.87 ± 0.74 ABC3.19 ± 0.00 O–S1.84 ± 0.04 I5.4 ± 0.2 OP
47.1 ± 1.04 GHI97.41 ± 0.5 AB3.24 ± 0.00 J–M1.94 ± 0.03 H8.6 ± 0.1 C–G
58.11 ± 0.09 D–F96.83 ± 0.99 ABC3.29 ± 0.01 FGH2.53 ± 0.01 D5.6 ± 0.2 NOP
69.03 ± 0.1 B97.1 ± 0.56 AB3.28 ± 0.00 G–J3.17 ± 0.02 B6.4 ± 0.1 L–O
064.48 ± 0.33 P95.96 ± 0.61 B–E3.51 ± 0.00 B0.56 ± 0.05 ST7.8 ± 0.0 F–J
15.92 ± 0.05 K–M95.87 ± 0.7 B–E3.32 ± 0.01 EF0.62 ± 0.00 RS8.6 ± 0.1 C–F
25.58 ± 0.11 M–O96.44 ± 0.16 A–D3.26 ± 0.00 H–L1.15 ± 0.02 MN8 ± 0.1 E–I
36.78 ± 0.3 HIJ97.42 ± 0.08 AB3.22 ± 0.00 L–O1.5 ± 0.04 J7.4 ± 0.1 H–L
46.46 ± 0.08 IJK97.38 ± 0.25 AB3.21 ± 0.00 M–P1.99 ± 0.03 GH6.9 ± 0.2 J–M
57.47 ± 0.12 FGH98.03 ± 0.15 A3.25 ± 0.00 I–L2.68 ± 0.01 C6.9 ± 0.5 J–M
68.03 ± 0.43 D–F97.3 ± 0.7 AB3.27 ± 0.01 G–K3.29 ± 0.03 A7.4 ± 0 H–L
086.08 ± 0.08 J–M92.35 ± 0.53 GH3.4 ± 0.00 D0.11 ± 0.02 X9.3 ± 0.5 BCD
15.54 ± 0.07 M–O94.47 ± 0.35 D–F3.27 ± 0.01 G–K0.55 ± 0.01 ST9.6 ± 0.8 BC
27.5 ± 0.12 FG95.04 ± 0.76 C–F3.23 ± 0.00 K–N0.98 ± 0.02 O8 ± 0.5 E–I
37.46 ± 0.03 FGH96.27 ± 0.74 A–E3.21 ± 0.00 M–P1.27 ± 0.02 KL7.5 ± 0.6 H–L
48.27 ± 0.12 C–E97.06 ± 0.35 AB3.19 ± 0.00 O–S1.56 ± 0.08 J7.6 ± 0.4 F–K
58.62 ± 0.05 B–D96.81 ± 0.7 ABC3.24 ± 0.00 J–M2.33 ± 0.04 E7.0 ± 0.2 I–M
68.89 ± 0.05 BC96.82 ± 0.99 ABC3.3 ± 0.00 FG2.53 ± 0.04 D4.6 ± 0.4 PR
0115.29 ± 0.09 N–O92.09 ± 0.8 GH3.4 ± 0.00 D0.14 ± 0.01 WX8.4 ± 1.0 D–H
15.88 ± 0.05 K–M94.42 ± 0.71 EF3.25 ± 0.00 H–L0.49 ± 0.01 S7.7 ± 0.2 F–K
26.66 ± 0.05 IJ94.5 ± 0.54 D–F3.21 ± 0.00 M–P0.72 ± 0.01 P7.8 ± 0.1 F–J
37.69 ± 0.03 EFG97.02 ± 0.3 ABC3.19 ± 0.00 OPR1.08 ± 0.04 N7.1 ± 0.1 I–L
48.02 ± 0.06 D–F97.02 ± 0.2 ABC3.2 ± 0.01 NOP1.35 ± 0.02 K7.4 ± 0.2 H–L
58.11 ± 0.11 D–F97.38 ± 0.25 AB3.26 ± 0.00 G–K2.1 ± 0.02 F6.6 ± 0.2 K–N
68.89 ± 0.09 BC96.07 ± 0.72 A–E3.28 ± 0.00 G–J2.24 ± 0.04 E5.9 ± 0.2 MNO
02M5.12 ± 0.04 OP90.88 ± 0.3 H3.34 ± 0.00 D0.17 ± 0.02 UWX9 ± 0.1 B–E
15.88 ± 0.04 K–M90.42 ± 0.35 H3.18 ± 0.00 PRS0.47 ± 0.02 S9.3 ± 0.5 BCD
26.52 ± 0.13 IJK92.19 ± 0.59 GH3.12 ± 0.01 T1.22 ± 0 LM10.1 ± 0.3 B
37.5 ± 0.13 FG93.66 ± 0.4 FG3.16 ± 0.01 RS1.29 ± 0.01 KL8.1 ± 0.3 E–I
58.71 ± 0.06 B–D94.67 ± 0.39 DEF3.15 ± 0.01 ST2.04 ± 0.03 FG7.5 ± 0.6 F–L
Different capital letters (A, B, C…X) indicate significant differences for each column (p < 0.05).
Table 3. Thermal properties of fermented freeze-dried yellow beetroot.
Salt
Content (%)
DayStep 1Step 2Step 3Step 4Sum (%)Decomposition Temperature (°C)
Temp Range (°C)Mass Loss
(%)
Temp Range (°C)Mass Loss
(%)
Temp Range (°C)Mass Loss
(%)
Temp. Range (°C)Mass Loss
(%)
123
Fresh030–1101.98110–23033.73230–38024.67380–6008.0368.4-162.81200.75-303.39
045.5034.9525.7412.8279.0-153.49197.13-303.97
13.4627.5525.577.1763.8-158.41194.75-298.14
22.9023.2824.537.0657.8-159.51191.82252.48302.20
32.4116.7126.936.0252.1-156.29193.28253.53299.53
41.9218.7421.775.7348.2-158.88197.09253.96300.81
51.8116.3321.035.2544.4-160.68197.46251.79298.49
61.4916.1019.844.9442.4-159.07198.32255.82299.23
0630–1101.02110–23025.36230–38035.16380–6007.1168.7-156.07198.49251.75299.71
11.2228.9124.357.7062.2-155.72188.39253.23305.15
20.5028.1922.716.3857.8-154.26196.75- 300.07
30.6424.6422.766.3154.4-154.55193.60253.63301.38
41.2421.3520.985.8149.4-154.85195.12253.11301.09
50.4921.5720.295.6248.0-156.06194.20253.28298.91
60.5220.0619.634.9945.2-156.38194.32253.00298.63
0830–1101.15110–23026.97230–38034.93380–6007.3370.4-154.50198.09250.45300.89
11.3528.4824.957.0161.8-154.85- 249.32297.31
21.2825.4124.537.3958.6-154.51189.31253.17306.48
31.1324.1322.276.0853.6-154.88193.52252.92300.44
40.8623.6820.555.9351.0-153.91194.35252.75300.45
50.8119.0721.435.3246.6-156.74193.85252.69298.28
60.6218.5019.305.0943.5-156.74197.54252.77301.67
01130–1101.07110–23032.70230–38029.64380–6006.9570.4-153.26199.12248.21297.98
11.2429.2224.126.9661.5-154.26190.34252.06298.81
21.4928.8221.586.7658.7-153.76189.48252.86303.90
31.2525.7022.046.3755.4-154.43189.30252.78302.71
41.0424.4420.105.7151.3-153.95195.12252.87303.60
50.7020.2319.973.7844.7-154.77198.66248.91295.55
60.6320.8118.985.1845.6-151.85197.32252.88302.28
02M30–904.5190–38060.15380–36010.54--75.20-149.59204.81292.42-
12.4952.017.65-62.2-152.04-295-
22.7943.898.01-54.7-161.01-301.77-
31.5745.006.97-53.5-153.79190.69298.77-
51.2440.90 6.70-48.8--191.32 300.75 -
Disclaimer/Publisher’s Note: The statements, opinions and data contained in all publications are solely those of the individual author(s) and contributor(s) and not of MDPI and/or the editor(s). MDPI and/or the editor(s) disclaim responsibility for any injury to people or property resulting from any ideas, methods, instructions or products referred to in the content.

