Article

Yeast-Based Magnetic Biocomposite for Efficient Sorption of Organic Pollutants

by
Paweł Staroń
* and
Jarosław Chwastowski
Department of Engineering and Chemical Technology, Cracow University of Technology, 24 Warszawska St., 31-155 Cracow, Poland
*
Author to whom correspondence should be addressed.
Appl. Sci. 2024, 14(2), 655; https://doi.org/10.3390/app14020655
Submission received: 15 December 2023 / Revised: 8 January 2024 / Accepted: 10 January 2024 / Published: 12 January 2024
(This article belongs to the Special Issue Advanced Research in Activated Carbon Adsorption)

Abstract

:
The study aimed to prepare a biocomposite containing Yarrowia lipolytica yeast cells with magnetic properties. The work proposes the use of this biocomposite as a sorbent for the removal of organic pollutants like methylene blue from liquids. The sorption process was conducted in a periodic process through which different parameters were analyzed such as initial concentration (50–250 mg/dm3), time of the process (0.167–24 h), and temperature (25–40 °C). To fit the experimental data to theoretical models, the Langmuir, Freundlich, Temkin, and Dubinin–Radushkevich models were used. In addition, pseudo-first-rate, pseudo-second-rate order, Weber–Morris and Elovich kinetic models were evaluated. The highest fit was the Freundlich isotherm model (R2 = 0.9959 and ARE = 3.41%) and the pseudo-second-rate order model (R2 = 0.9989 and ARE = 1.14%). It has been shown that the process of removing methylene blue using a biocomposite is exothermic and its usefulness decreases with an increase in temperature (from 32.10 mg/g to 23.64 mg/g). To acquire information about the material characteristics, different instrumental methods were applied: FTIR, SEM-EDX, TGA, and VSM. This study provides new information on the possibility of using composites made of biochar, yeast, and magnetic particles in the process of removing dyes from an aqueous environment. The obtained biocomposite is effective in removing contaminants and is easily separated after the performed process.

1. Introduction

Recently, there has been a significant increase in the number of discharges of synthetic dyes into water reservoirs. Different dyes are removed from industries such as textiles, cosmetics, paper, pharmaceuticals, food, and tanning, generating a wide range of colors [1]. They can be used individually or in combination with other ingredients. Recent estimates indicate that about 280 thousand tons of undegraded synthetic dyes accumulate globally in water bodies [2]. Dyes limit light penetration into the water because they can intensely color it. This is a big problem for both households and the water environment. Lack of light transmittance through water may harm the photosynthesis process, as well as animals living in water, e.g., fish. Aquatic microorganisms may have problems adapting to the changed water composition, and, as a result, aquatic animals may run out of food. For humans, the presence of dyes in water can also lead to health problems by causing skin irritation or allergies [3].
Methylthionine chloride is a compound known as methylene blue. It is in the group of cationic dyes and is used in many areas, including the production of medicines, the dye industry, and the paper industry. Typically, the content of dyes, for example MB, is between 10 and 250 mg/dm3, but in the case of wastewater from textile industry it may reach even 1500 mg/dm3. Common international standards set limits for chemical substances hazardous to the environment at approximately 125 mg/dm3 in the case of direct discharge of wastewater containing dyes [4]. However, in developing countries in which there is no adequate regulation of the amounts of these dyes in wastewater, or where regulations exist but are insufficient, the content of those dyes in discharged sewage is often very high [5]. Methylene blue can lead to various negative side effects when consumed by humans, including vomiting, jaundice, cyanosis, increased heart palpitations, limb paresis and tissue necrosis, high blood pressure, abdominal pain, and even mental disorders [6]. Methylene blue is indicated in the treatment of methemoglobinemia, where it accelerates the conversion of methemoglobin to hemoglobin. When higher doses are administered, methylene blue accumulates, making it an oxidizing agent [7]. Additionally, dyes released into the environment cause water turbidity, limit the photosynthetic abilities of aquatic plants, and disturb the ecosystem [8].
Many methods are used to eliminate dyes from the environment. These include different methods. Combined techniques are widely due to the variety of contaminants. These can be specific and a combination of methods will be more effective when trying to remove contaminants. Coagulation, oxidation, and flocculation are examples of chemical methods used [9,10]. Physical methods effective in removing dyes include membrane filtration, reverse osmosis, and adsorption techniques. However, these techniques are energy-intensive and require complex and expensive procedures, and the production of undesirable byproducts (e.g., sludge) is inevitable [2]. Amongst the most popular methods of removing dyes is adsorption on activated carbon. Carbon materials have a porous structure (produced by a system of diffusion channels and pores) and this influences their good adsorption properties. The porous structure of these materials causes diffusion and colored compounds from contaminated water to enter the material. The adsorption space is filled starting from the macropores and moving on to the deeper pores of activated carbon. The disadvantage of adsorption with the use of activated carbon-based methods is the price of the material, which affects the cost of the process. Nowadays, research aims for the use of available, cheap, and efficient substrates for activated carbon. For this purpose, the possibility of using agricultural by-products as a cheap alternative adsorbent, such as malt pomace, cashew nut shells, banana peels, or coconut shells, was investigated [11]. Biological methods are characterized by a diversity of biological materials. Some fungi, bacteria, and algae are used. A biosorption process can also be employed, wherein the microorganisms utilized possess a specific sorption surface area and the capability to absorb dyes without altering the chemical structure. To observe the good effectiveness of dye removal using biological methods and to increase its efficiency, it is necessary to select microorganisms that have a high affinity for the class of dyes being removed [12]. Upendar et al. reported that the removal efficiency of methylene blue using Bacillus subtilis could reach 91.68% [13]. Removing many of the dyes present in water using microorganisms is a cost-effective and environmentally friendly approach. Microbiological processes in free-cell cells are slow, and the use of free cells in the purification of pollutants on an industrial scale is limited [14]. To overcome these drawbacks, microorganisms can be immobilized on biochar enriched with magnetic particles and used to remove complex, hazardous organic substances on an industrial scale.
In this research, the process of removing methylene blue from the liquid phase using a magnetic biocomposite was carried out. The biocomposite was obtained by incorporating magnetite particles into biochar obtained from dried lotus pods and then immobilizing Yarrowia lipolytica yeast on the biochar thus obtained. This yeast has been successfully used in the removal process of bromocresol purple, safranin, bromothymol blue, and phenol red [15]. In addition, this species of yeast is used in the bioremediation of soil pollution, for the disposal of oil and fish residues, and in soil fertilization (due to its ability to stimulate the germination of cereal grains) [16]. Giving magnetic properties to the biocomposite makes the process of removing the sorbent from the liquid phase after the process much easier, because it is enough to use an external source of magnetic field, which eliminates the required complex separation process, such as filtration. The combination of all common advantages of the individual components of the biocomposite reduces the risk of agglomeration of magnetic particles by immobilizing them on the biochar, and the use of yeast cells enhances the effect of the biocomposite through the use of the bioremediation process. Research on the removal of methylene blue with the use of biocomposite was carried out in a periodic system. The impact of various factors, such as temperature, process time, and initial dye concentration, was investigated. The obtained results allowed for the assessment of adsorption capacity, identification of kinetic and equilibrium models, and thermodynamic analysis.

2. Materials and Methods

2.1. Materials

Dried lotus pods (Nelumbo nucifera) a plant belonging to the lotus family were purchased in a local store. The material was washed with demineralized water and then dried to constant weight and additionally ground to 2 mm particles. All reagents used in the research, such as FeCl2, FeCl3, sodium alginate, CaCl2, NaOH, NaCl, HCl, and methylene blue (MB), were of high purity and were purchased from Sigma-Aldrich. Yarrowia lipolytica yeast was purchased from the National Collection of Yeast Cultures (NCYC). The cells were sieved under sterile conditions into 250 cm3 flasks containing yeast common use (YCU) liquid medium. The breeding was carried out for 7 days at 27 °C using a laboratory shaker. After this time, the contents of the flasks turned into a milky mass, and sediment appeared at the bottom, which indicated a significant growth of yeast in the flask.

2.2. Preparation of the Magnetic Biocomposite

2.2.1. Pyrolysis and Biomass Activation

The pyrolysis process was carried out in an electrically heated tube furnace with a tube diameter of 100 mm (Ströhlein Instruments, Ofen 85, Germany). A total of 10 g of homogenized material was introduced into the furnace under argon conditions for 50 min to remove air. The gas flow throughout the entire pyrolysis process was 20 dm3/h. Then, heating was started and the pyrolysis process was carried out for 3 h at a temperature of 500 °C. After this time, CO2 was introduced into the furnace instead of argon and the temperature was raised to 800 °C. The activation process was carried out for 30 min (CO2 flow rate = 30 dm3/h). After completing the activation process, the heating was turned off and the furnace was cooled to a temperature below 80 °C. The mass of the material after the pyrolysis and activation process was approximately 3.5 g. The pyrolysis process was repeated 3 times, thus obtaining approximately 10.5 g of activated biochar (L-AC).

2.2.2. Obtaining Magnetic Active Carbon

At this stage of the research, magnetic particles deposited on L-AC were obtained, thanks to which it was possible to obtain a carbon carrier with magnetic properties (M-L-AC). The process of synthesizing magnetic particles was carried out as follows: 2 g of L-AC was weighed into a Teflon vessel, 10 cm3 of 0.3 mol/dm3 FeCl2 and 10 cm3 of 0.6 mol/dm3 FeCl3 were added. Then the vessel was placed in the ultrasonic reactor and 10 cm3 of 2.4 mol/dm3 NaOH was added in portions. The process time in the ultrasonic reactor was 4 min. Then the vessel was placed in a microwave reactor (Magnum II, Ertec, Wrocław, Poland), where the process was carried out at a temperature of 180 °C for 25 min. After the process was completed, the material was rinsed with deionized water, dried at 60 °C, and left in a container for further tests.

2.2.3. Immobilization of Yarrowia lipolytica on M-L-AC

The preparation of a magnetic biocomposite containing Yarrowia lipolytica yeast cells (YL-M-L-AC) was carried out using the trapping method. The preparation of the biocomposite began with the preparation of a 2% sodium alginate solution and a 2% calcium chloride solution. A total of 2 g of sodium alginate was weighed on a scale, 98 cm3 of deionized water was added and placed on a magnetic stirrer (mixing was conducted at a temperature of 80 °C until the sodium alginate was completely dissolved). In parallel, 2 g of CaCl2 was weighted on an analytical balance and dissolved in 98 cm3 of deionized water. Next, 1.5 g of M-L-AC (the concentration of M-L-AC in sodium alginate was 15 g/dm3) and yeast (obtained from centrifugation of 100 cm3 inoculum) were added to the sodium alginate solution (cooled to 25 °C). The suspension was stirred for 60 min to homogenize the sample. After this time, the obtained suspension was added dropwise to the prepared CaCl2 solution using an injector. The resulting YL-M-L-AC biocomposite beads were conditioned in a calcium chloride solution for 15 min, and then rinsed with deionized water. Figure 1 schematically shows the MB removal process using YL-M-L-AC.

2.3. Physicochemical Characteristics

The thermal properties of the dried lotus pods were assessed through the examination of TGA and derivative thermogravimetry (DTG) curves. The thermal analysis of YL-M-L-AC was conducted using the EXSTAR SII TG/DTA 7300 apparatus (Dallas, TX, USA) in a dynamic argon atmosphere, with a heating rate of 20 °C/min within the temperature range of 30–1000 °C.
The surface morphology and composition of the YL-M-L-AC biocomposite before and after the sorption process were assessed by energy dispersive spectroscopy (EDX) performed on a scanning electron microscope (Hitachi TM-3000, Tokyo, Japan).
Fourier transform infrared spectroscopy (FTIR) was used to characterize the chemical structures of the YL-M-L-AC magnetic biocomposite before and after dye sorption (Thermo Scientific—Nicolet iS5 with the ATR iD7 attachment). Each sample was examined in the attenuated total reflection (ATR) mode in the wavenumber range 400–4000 cm−1, with a resolution of 0.5 cm−1 and the accumulation of 16 scans. The magnetic property studies of YL-M-L-AC were performed at room temperature using a vibrating sample magnetometer instrument (VSM, Lakeshore 7407, Lake Shore Cryotronics, Westerville, OH, USA).
The concentration of the methylene blue present in the solution after the process was measured using a UV–vis spectrometer (Rayleigh UV-1800, Chelmsford, UK).
To test the pHpzc point, NaCl solutions with a concentration of 0.05 mol/dm3 and HCl and NaOH with a concentration of 0.1 mol/dm3 were prepared. Then 50 cm3 of NaCl was measured into 6 propylene containers. A series of NaCl solutions with a pH of 2, 4, 6, 8, and 10 were prepared (pH correction was carried out using the prepared NaOH and HCl solutions). Then, 0.1 g of YL-M-L-AC was weighed into 6 propylene containers and 20 cm3 of NaCl solutions were added at the set pH. The samples were placed on a shaker for 24 h and after that time YL-M-L-AC was separated from the solution using an external magnetic field and their pH was measured. This allowed for determining the dependence of the difference between the final pH (pHf) and the initial pH (pHi) on initial pH. The pHZPC value is the point at which the curve intersects the x-axis [17].

2.4. Equilibrium Studies

An important stage of research when removing pollutants using sorption methods is to determine the time after which the balance between the sorbent and the sorbate is established.
Equilibrium tests were conducted as follows: 0.1 g of YL-M-L-AC was weighed into propylene containers and 20 cm3 of methylene blue solution with concentrations of 50, 100, 150, 200, and 250 mg/dm3 were added. The prepared samples were placed on a laboratory shaker for 24 h at a 25 °C. After the process was completed, YL-M-L-AC was separated from the MB solution using an external magnetic field (neodymium magnet) and the MB content in the solution was examined. All tests were repeated in triplicates and the results were averaged. After analyzing the MB content, the sorption capacity qt and qe were determined using Equation (1) and the degree of MB removal:
q t ( e ) = C 0 C t ( e ) · V w
R e = C 0 C e C 0 · 100 %
where: qt—mass of adsorbed MB at time “t” (mg/g), qe—mass of adsorbed MB at equilibrium (mg/g), C0—initial concentration of MB in the solution (mg/dm3), Ct—concentration of MB after time “t” (mg/dm3), Ce—concentration of MB at equilibrium (mg/dm3), V—volume of solution (dm3), w—mass of YL-M-L-AC used during the sorption process (g), Re—degree of MB removal from the solution in a state of equilibrium (%).
Adsorption isotherms are useful in showing the interaction of adsorbate with the adsorbent and are crucial for optimizing its use. The correlation of equilibrium data using empirical equation is important for the interpretation and prediction of adsorption data [18]. Four mathematical models were used to describe the experimental data:

2.4.1. Langmuir Isotherm

The Langmuir isotherm model assumes that adsorption occurs in specific homogeneous places in the adsorbent and this model has been used in many sorption processes, including monolayer adsorption [19]:
q e = q m K L C e 1 + K L C e
where: qm—maximum sorption capacity (mg/g), KL—Langmuir constant (L/mg).

2.4.2. Freundlich Isotherm

The Freundlich isotherm model is used to describe heterogeneous systems. It does not indicate the finite ability of the adsorbent to absorb and, therefore, can be rationally used only in the range of low and medium adsorbate concentrations [20]:
q e = K F C e 1 n
where: KF—Freundlich constant (mg1−(1/n)(dm3)1/ng−1), n—heterogeneity factor.

2.4.3. Temkin Isotherm

The Temkin isotherm takes into account interactions between adsorbate and adsorbent. Excluding low and high concentration values, the model assumes that the heat of adsorption (a function of temperature) of all molecules in the layer will decrease linearly, [21]:
q e = B l n K T C e
where: KT—the bond equilibrium constant corresponds to the maximum binding energy (dm3/g), B—constant for the heat of sorption (J/mol).

2.4.4. Dubinin–Radushkevich Isotherm

The Dubinin–Radushkevich (D–R) isotherm is usually used to visualize the adsorption with a Gaussian energy distribution on heterogeneous surfaces. This model successfully showed high correlation for high solvent activities and data in the intermediate concentration range [22,23]:
q e = q d e x p ( K a d ε 2 )
ε = R T l n 1 + 1 C e
E p = 1 2 K a d
where: qd—theoretical maximum isotherm saturation capacity (mg/g), Kad—Dubinin–Radushkevich isotherm constant related to the sorption energy (mol2/J2), ε—Polanyi potential, R—gas constant (8.314 J·mol/K), T—temperature (K), Ep—the average adsorption potential energy.

2.5. Kinetic Studies

Kinetic experiments are designed to establish the influence between time, and the course of the sorption process. Kinetic tests were conducted as follows: 0.1 g of YL-M-L-AC was weighed into 9 propyl containers, and 20 cm3 of methylene blue solution with a concentration of 250 mg/dm3 was added. The samples were mixed using a shaker for: 0.167, 0.5, 1, 2, 3, 8, 12, 18, and 24 h at 25 °C. After the specified time, the solution was separated from YL-M-L-AC using an external magnetic field. The obtained solutions were analyzed spectrophotometrically to determine the MB concentration. All tests were repeated three times and the results obtained were averaged.
Four models were used to model the MB sorption rate data on YL-M-L-AC: pseudo-first-order, pseudo-second-order, Elovich, and Weber–Morris (W–M).

2.5.1. Pseudo-First-Order Rate Model

Lagergren proposed a pseudo-first-order equation for the sorption of a liquid/solid system based on the capacity of the solid [24]:
q = q e ( 1 exp k 1 t )
where: k1—the pseudo-first-order rate constant (1/min), t—time (min).

2.5.2. Pseudo-Second-Order Rate Model

In this model, it is the difference between the capacity of the sorbent at equilibrium and the amount of adsorbate adsorbed at a given time that is the driving force. The overall sorption rate is proportional to the square of this driving force [25]:
q t = t ( 1 / k 2 q e 2 ) + ( t / q e )
where: k2—the pseudo-second-order rate constant (g/mg·min).

2.5.3. Elovich Model

The Elovich equation is one of the commonly used equations describing the kinetics of adsorption on heterogeneous solid surfaces. The model assumes multilayer adsorption and an exponential increase in the number of active sites with increasing sorption [26]:
q t = 1 β l n ( 1 + α β t )
where: α—the initial sorption rate (mg/g·min), β—the desorption constant (g/mg).

2.5.4. Weber–Morris Model

The Weber–Morris model (intramolecular diffusion) suggests that adsorbate diffusion is a key step determining the sorption process. Intraparticle diffusion remains constant and its direction is radial [27]:
q t = K i d t + I
where: Kid—the intra-particle diffusion rate constant (mg/g·min0.5), I—the values are proportional to the boundary layer.

2.6. Thermodynamic Studies

The research attempted to determine the influence of the temperature of the sorption process on the obtained sorption capacity. For this purpose, research was conducted at temperatures of 25, 30, 35, and 40 °C. The tests were carried out analogously to the equilibrium tests, i.e., 20 cm3 of MB solution with a concentration of 50–250 mg/dm3 was added to 0.1 g of YL-M-L-AC, then the sorption process was carried out for 24 h under controlled temperature conditions. After completing the sorption process, YL-M-L-AC was separated from the solution using an external magnetic field, and then the concentration of MB in the solution was determined. The modified Langmuir equilibrium coefficient (KML), a dimensionless parameter calculated for the tested temperatures, was applied for the calculation of the thermodynamic parameter from the van’t Hoff equation [28,29,30]:
q e = q m K M L C e ( C s C e ) + K M L C e
G ° = R T l n K M L
l n K M L = H ° R T + S ° R
where: ∆G°—the change in the Gibbs free energy (J/mol), ∆H°—the change in standard enthalpy (J/mol), ∆S°—the change in standard entropy (J/mol·K), KML—the modified Langmuir constant (dimensionless), Cs—the solubility of MB in water (a saturated solution) (mg/dm3), qm—maximum adsorption capacity as a monolayer (mg/g).
The study show the estimation of parameters of equilibrium and kinetic models using the nonlinear regression method. The coefficient of determination (R2) was used to compare the results [31] and average relative error (ARE) [32]:
R 2 = 1 1 n ( q e x p q p r e d ) 2 1 n ( q e x p q e x p ¯ ) 2
A R E = 100 n 1 n | q e x p q p r e d | q e x p

2.7. Desorption Studies

The possibility of reusing the YL-M-L-AC biosorbent for the adsorption of the MB dye in five adsorption–desorption cycles was investigated. Regeneration of the adsorbent is more ecological and contributes to increasing the economics of the process through its reuse.
After MB adsorption, the biocomposite (T = 25 °C, C0 = 250 mg/dm3) was rinsed with deionized water until the dye stopped washing out from the surface. MB desorption experiments with YL-M-L-AC were performed at 25 °C using a laboratory shaker (125 RPM) for 180 min. A total of 0.2 g of the biocomposite was weighed and placed separately in 40 cm3 of a given eluent. Deionized water, HNO3 at a concentration of 0.1 mol/dm3, and C2H5OH at a concentration of 96% were used as eluents. After the desorption process, the biocomposite was used for adsorption and recycled for the next desorption cycle as stated above. The desorption efficiency (DE) was calculated from the following equation:
D E = C d · V d q d · m · 100 %
where: Cd—MB concentration in the desorption solution (mg/dm3), qd—the amount of MB adsorbed onto YL-M-L-AC (mg/g), Vd—desorption solution volume (dm3), m—biocomposite mass used in desorption studies.

3. Result and Discussion

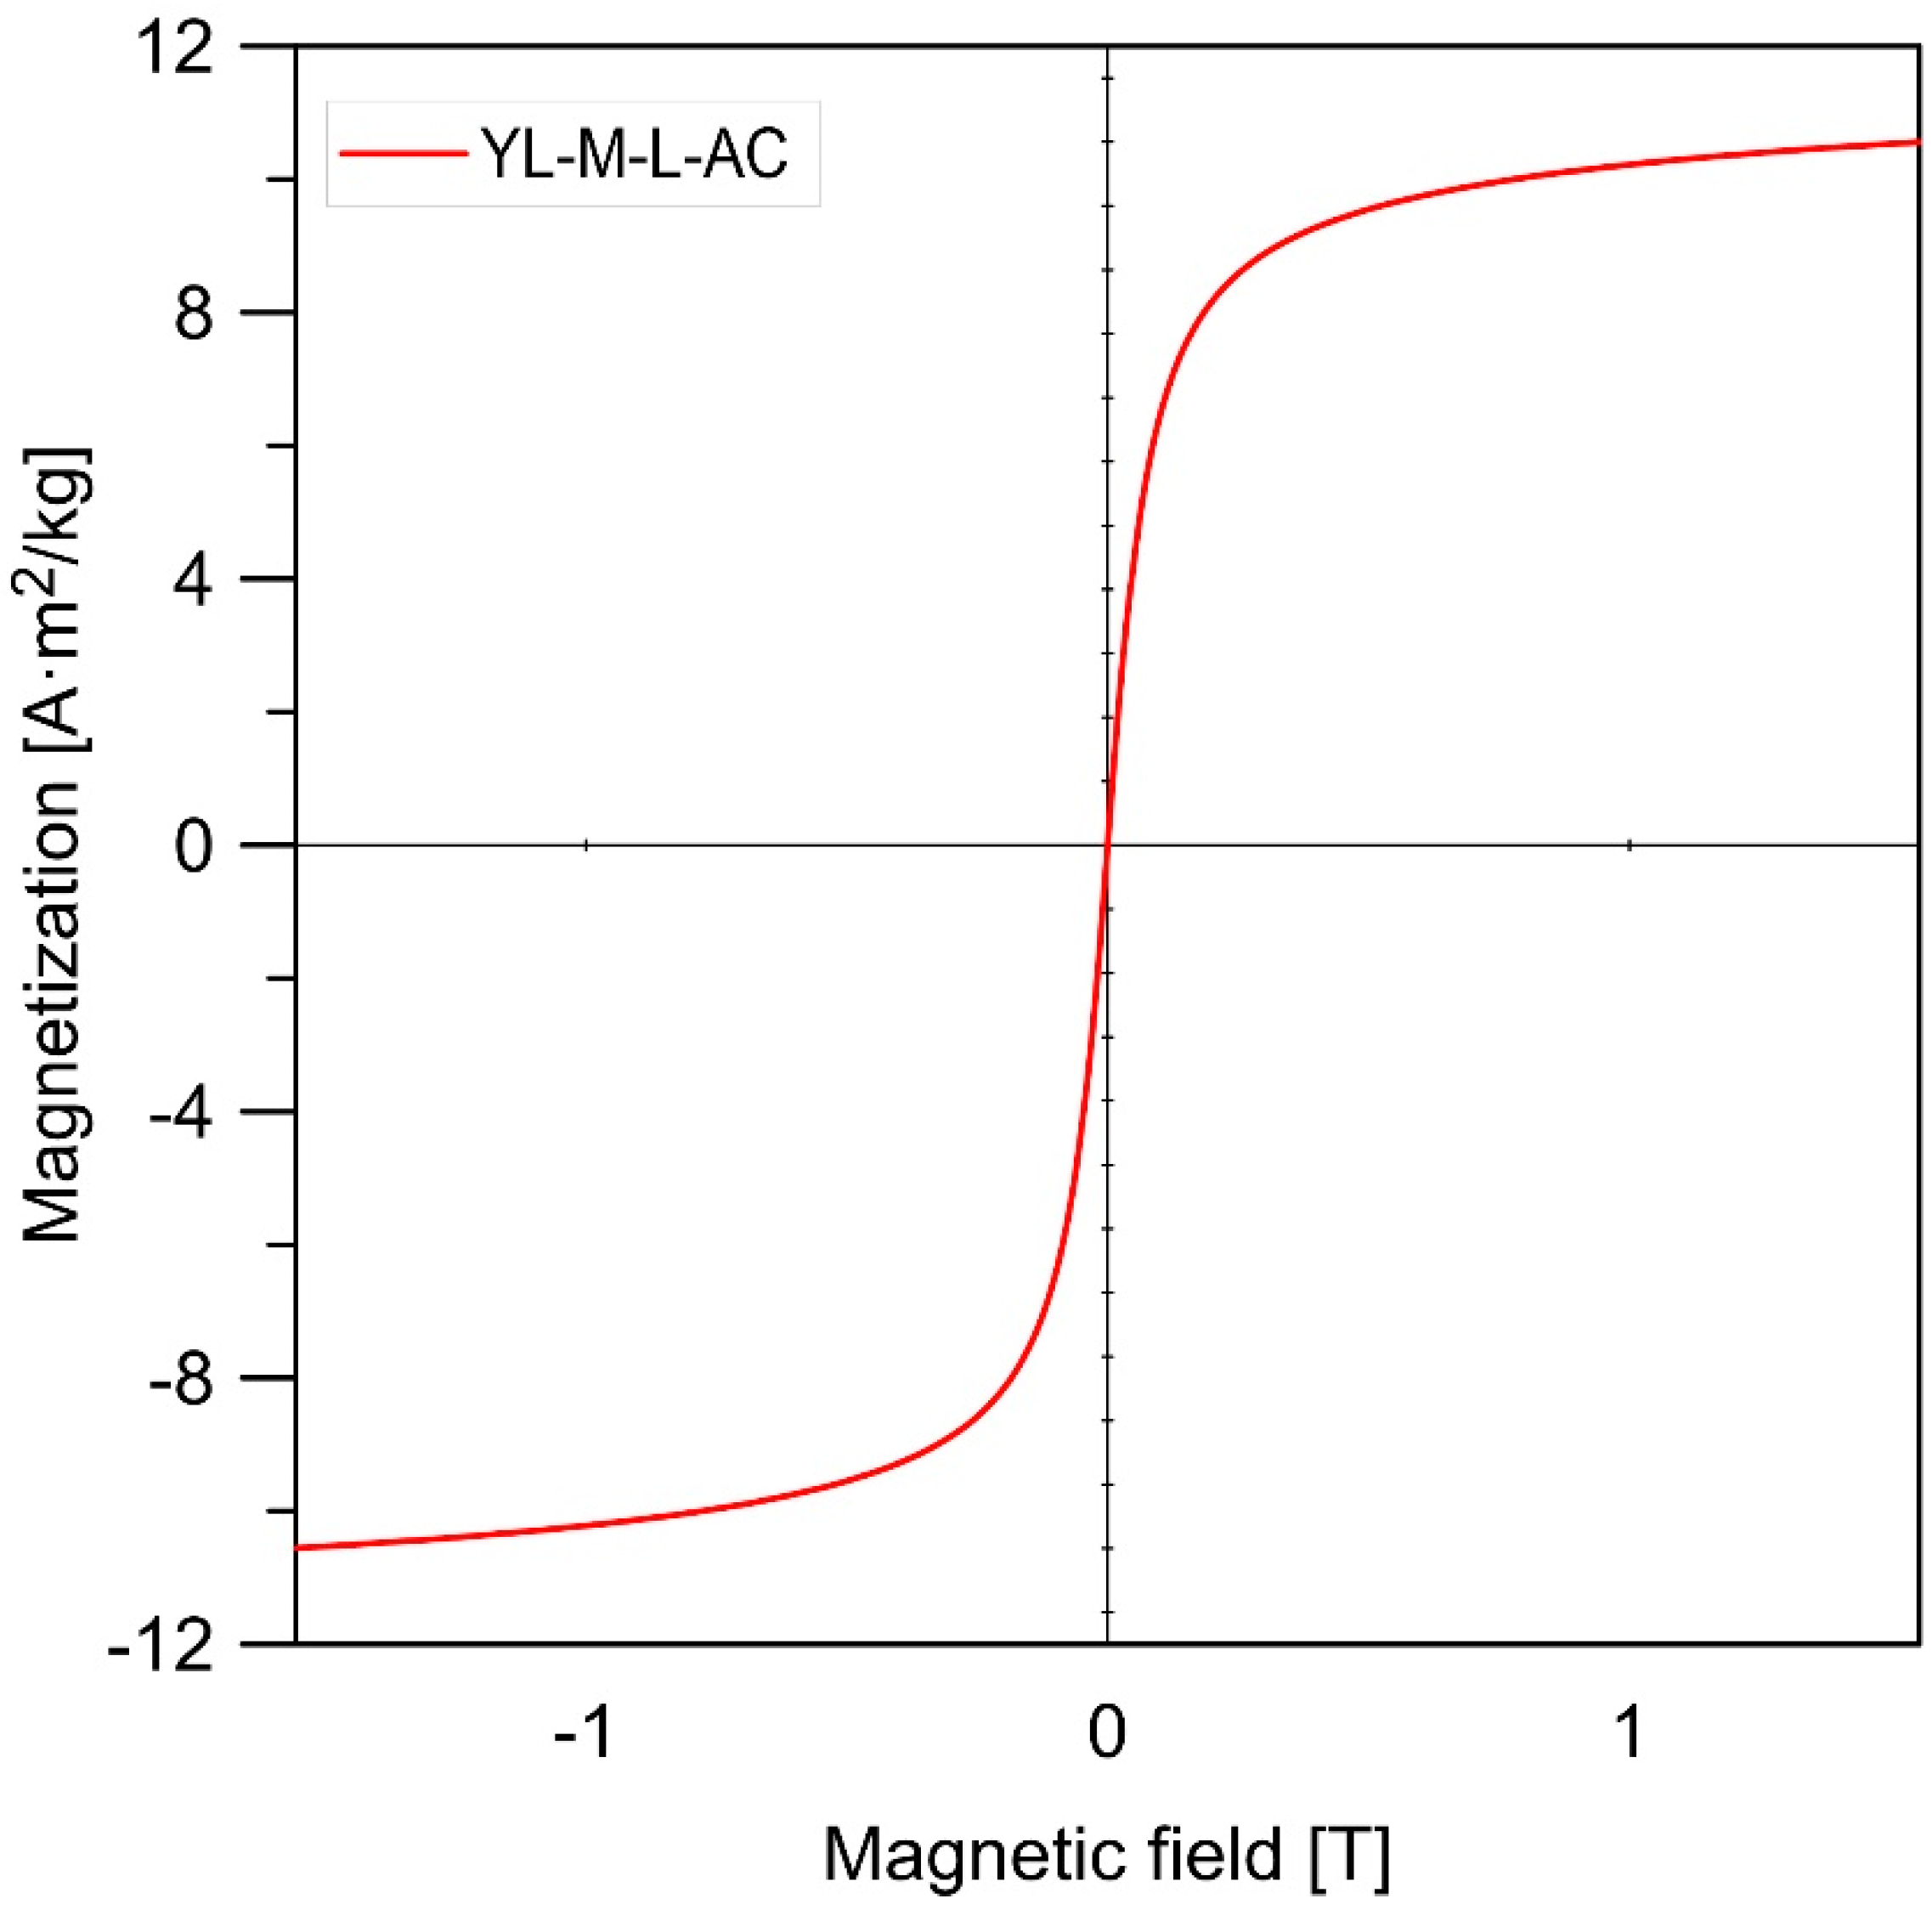
3.1. Characterizations of Materials

The first stage was to conduct a thermal analysis of the material in an atmosphere of an inert gas such as argon. Pyrolysis is a process of thermochemical conversion of biomass through thermal movement into volatile substances, water vapor, and a mixture of liquid compounds in a neutral environment [33]. During the pyrolysis of dried lotus pods, the products are liquid, synthesis gas, and solid. During the pyrolysis process, natural polymer components found in biomass decompose into volatile vapors containing oxygen and hydrogen. These vapors can be condensed to obtain bio-oil, which can be used as an energy source used in the initial stage of pyrolysis, such as material drying or carbonization [34]. Carbonization speeds up the elimination of polar functional groups and reorganizes organic structures with ring or linear configurations into polycondensed aromatic sheets. This process of carbonization necessitates low oxygen levels to minimize the production of CO2 and NOx [35].
Studying the results of the thermal analysis (Figure 2), the temperature for the pyrolysis process was selected. The thermal analysis was carried out in the temperature between 30–1000 °C with a temperature increase of 20 °C/min. Lotus pods and other biomass consist mainly of hemicellulose, cellulose, and lignin, the pyrolytic mass loss of which occurs mainly in the temperature ranges of 220–315 °C, 315–400 °C, and 160–900 °C, respectively [36]. The analysis shows that the lotus pods pyrolysis process includes three stages, the first below 150 °C, the second between 150 and 500 °C, and the third above 500 °C. In the temperature range of up to 150 °C, there was a drying area (weight loss of 7.12%) and the main biomass degradation process took place in the temperature range of about 200 °C to about 500 °C. At this stage, the highest weight loss is observed, amounting to 41.5%, which is caused by the pyrolysis of lignocellulose. Additionally, both hemicellulose and cellulose can be completely degraded, while only part of lignin can undergo this process due to its limited thermal reactivity. In the third stage, a slowdown in the mass loss rate is observed (mass loss 16.35%) and the mass loss effect may be related to lignin pyrolysis, self-gasification, secondary reactions, or something unknown [37,38]. The temperature of 500 °C was chosen as the temperature for the pyrolysis process, which corresponds to the temperature at which the material has already charred and the mass loss that occurs allows for obtaining the appropriate amount of material for testing.
The surface morphology of the obtained YL-M-L-AC biocomposite after drying to dry mass before and after the sorption process was determined using SEM–EDX analysis. Figure 3 shows analysis along with the analysis of the surface composition. YL-M-L-AC itself has rough surfaces that provide high porosity and a large adsorption surface [39]. Mapping of the biocomposite also shows a uniform distribution of Fe3O4 particles, confirming the successful deposition of Fe3O4 particles on its surface. Additionally, the analysis shows that magnetite particles partially agglomerate as a result of magnetic interaction with each other. This arrangement of particles may result in crystallites without pores [40]. Micrographs show fine pores, which indicate that the porosity of the biocomposite is maintained. The SEM image after dye sorption shows morphological changes due to the adsorption of the MB dye by YL-M-L-AC (Figure 3B). The pores were occupied by MB molecules and the initial roughness disappeared. EDX analysis of the YL-M-L-AC biocomposite shows the presence of oxygen (O), carbon (C), calcium (Ca), chlorine (Cl), and iron (Fe), which indicates the presence of organic components (biochar, yeast), alginate, and magnetic particles in the obtained biocomposite. Additionally, the presence of sulfur (S) is detected on the surface of the biocomposite after the sorption process, which is evidence of the presence of the MB dye.
FTIR analysis shows the presence of various characteristic functional groups in both materials (YL-M-L-AC before and after MB sorption) (Figure 4). The range of wave numbers and functional groups obtained from the absorption spectra are presented in Table 1. The tests confirm that after the MB sorption process, there are differences in the intensity of the bands, their frequencies, the nature of the bonds, and the chemical structure.
The magnetic properties of the YL-M-L-AC biocomposite were tested using VSM analysis, and the results are shown in Figure 5. It was found that the magnetization value of YL-M-L-AC in a 1.5 T field is 10.56 A m2/kg and the loop is within the measurement accuracy limits and is closed. The slow saturation process resulting from the high number of fine particles may be caused by intense relaxations of these particles, which makes them less susceptible to the influence of an external field. The magnetization value is lower than Fe3O4 itself, which is obvious because the biocomposite includes alginate, biochar, and yeast. Similar observations related to the decrease in magnetization values were observed by other researchers [55,56]. The results show that the obtained biocomposite has magnetic properties and can be separated from the aqueous solutions with the use of a magnet.
The surface properties of a solid are often influenced by the surface potential. Taking this fact into account, for many processes in industry it is necessary to know under what conditions the charge and surface potential is zero. Such knowledge, under appropriate conditions, allows the surface potential to be changed (within specific limits) and, consequently, the surface properties of a solid body can be changed (sorbent). For many solids (especially oxides), the potential-forming ions are H+ and OH. The point of zero charge PZC (according to the IUPAC definition) is defined as the concentration of potential-forming ions (PDI) at which the surface charge is zero [57]. Figure 6 shows the determined pHZPC. Zero point charge was determined at a pH of 5.82, which allows us to conclude that above this pH, the surface charge becomes negative and below positive. According to the previous studies, cations are removed preferably at a pH greater than pHZPC, while anions are removed more preferably at a pH below pHZPC [58]. Methylene blue is a positive dye, which makes its removal more advantageous when the process is carried out above pH = 5.82.

3.2. Methylene Blue Adsorption

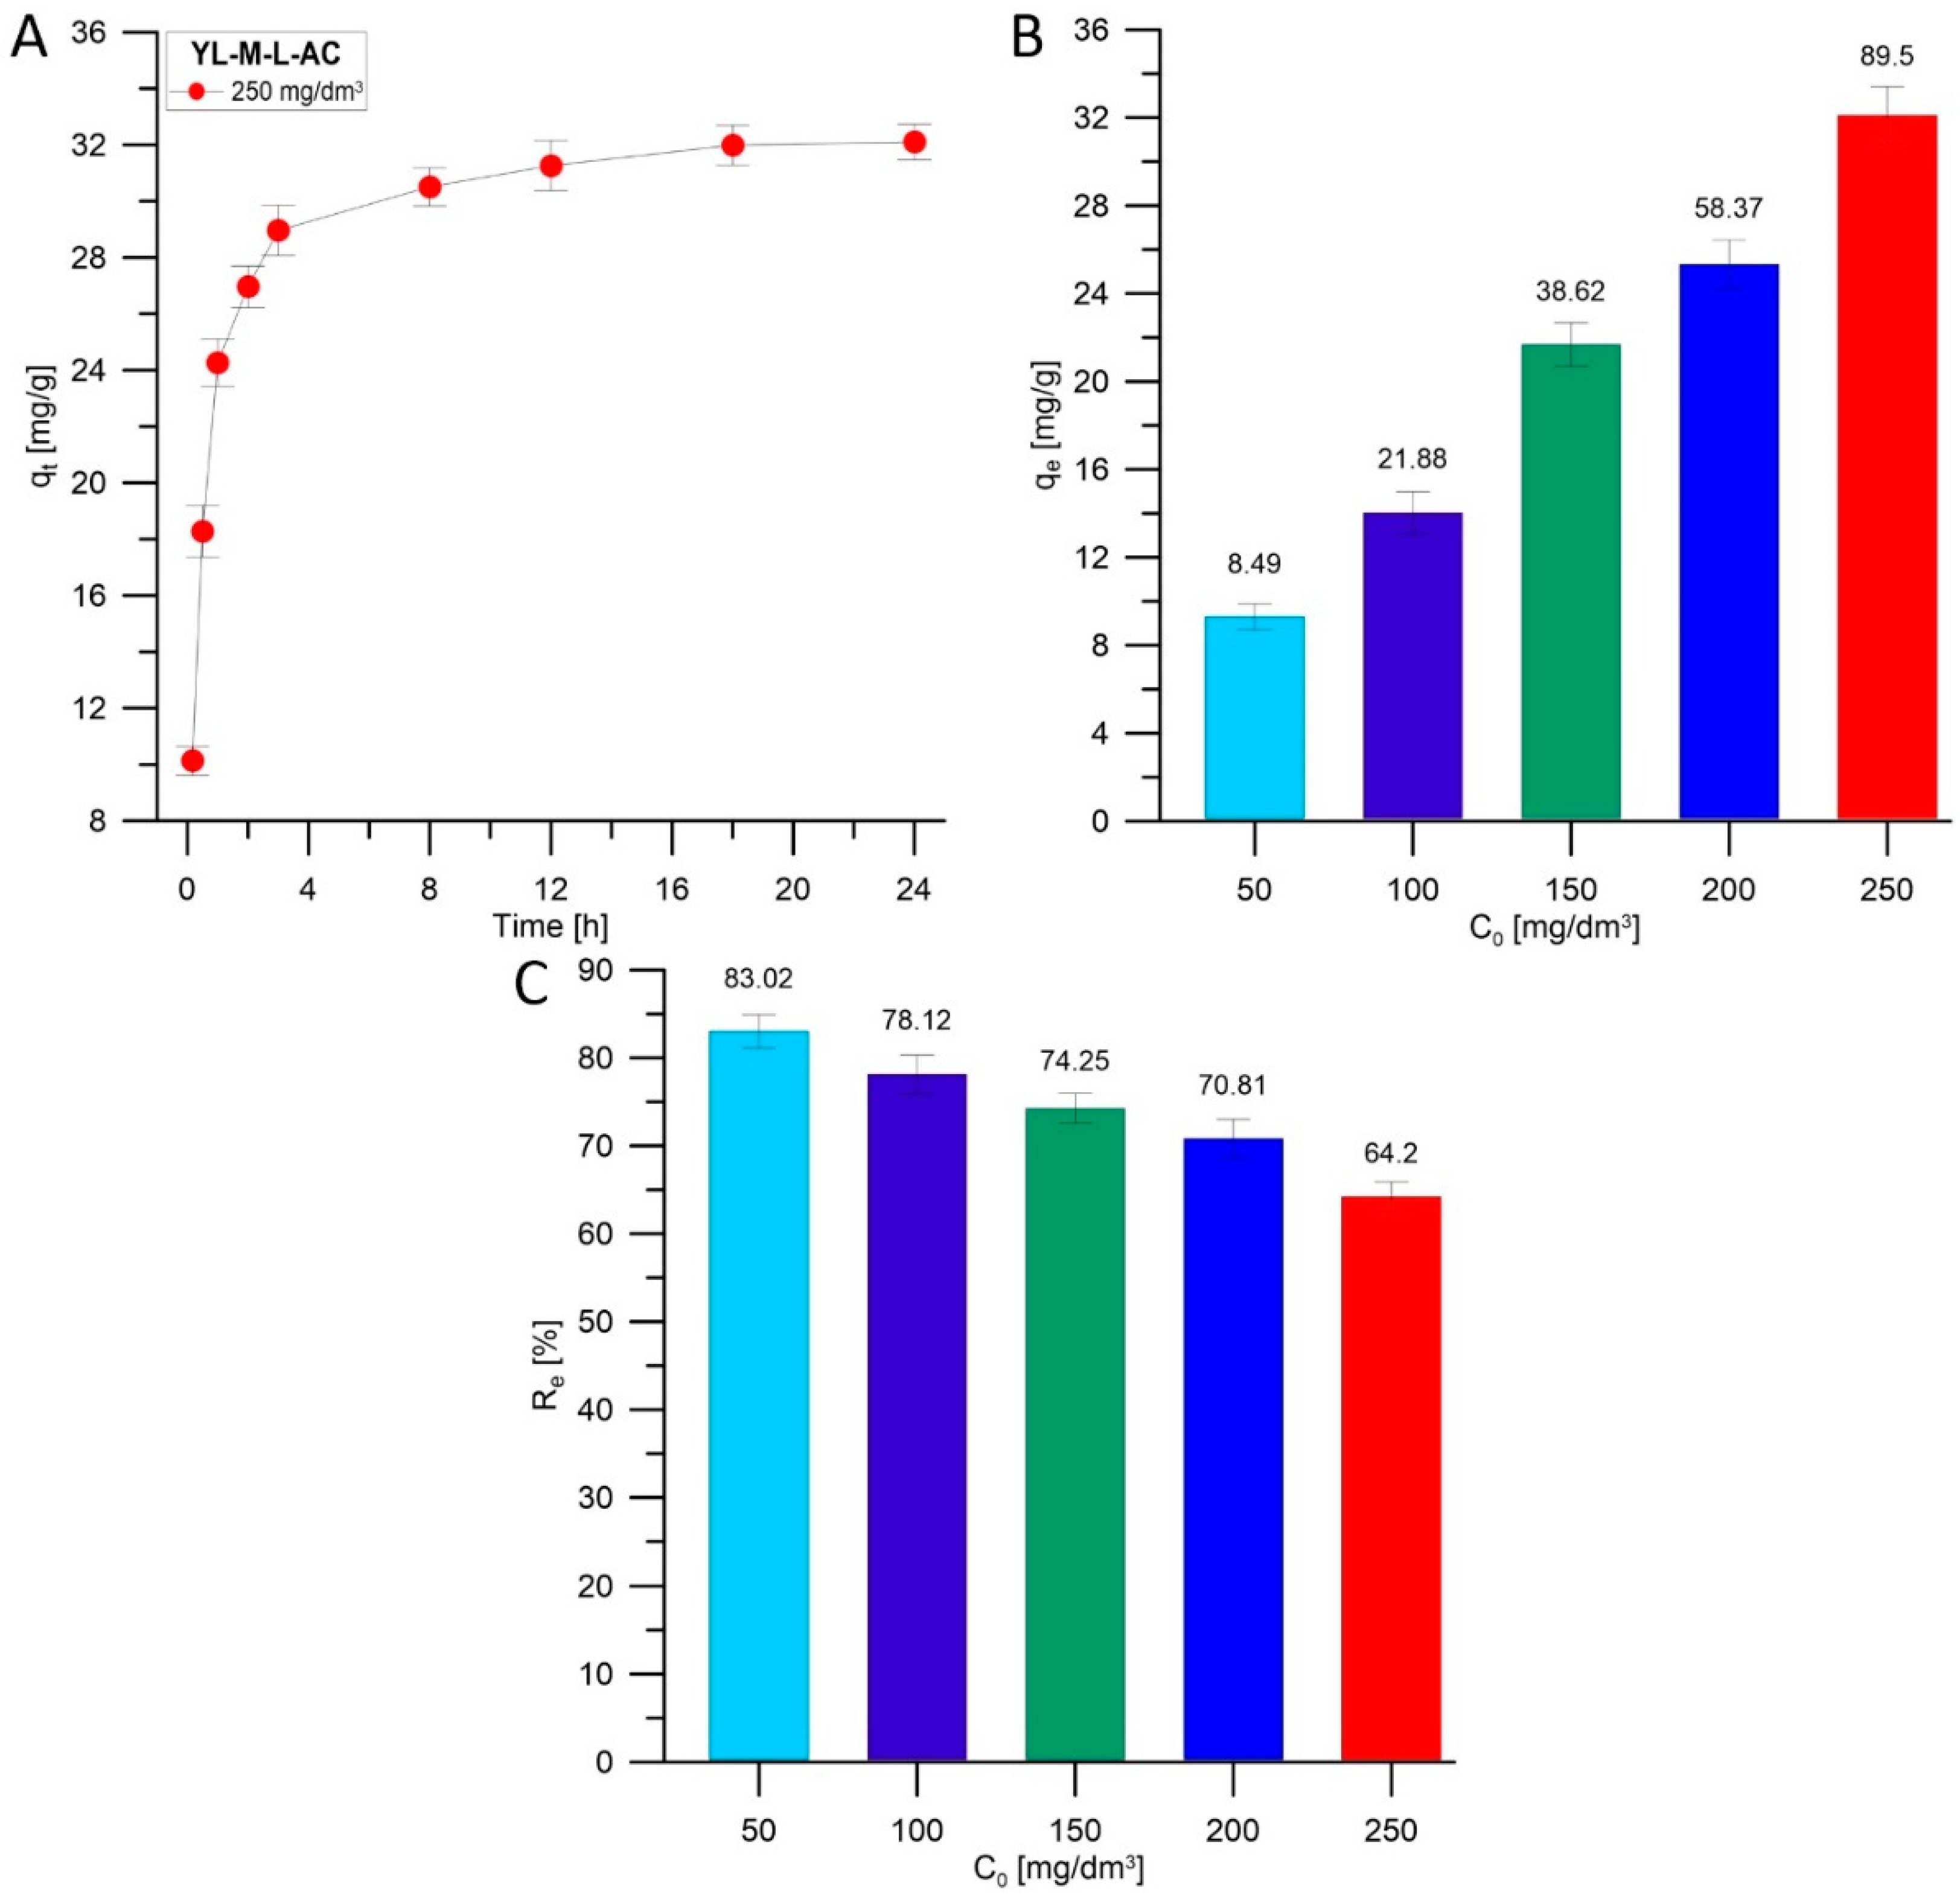
3.2.1. Adsorption of MB onto YL-M-L-AC

The research carried out on the process of removing the MB dye from the liquid phase using the YL-M-L-AC biocomposite allowed for the conclusion that the time after which the process equilibrium is established is 24 h. Figure 7 graphically presents the research results of the dependence of the sorption capacity on the time of operation and sorption process, sorption capacity, and MB removal at different initial MB concentrations. The sorption course (Figure 7A) shows that YL-M-L-AC removes MB in three stages. The first stage (up to 1 h) is responsible for the fastest MB removal due to the largest number of free active sites, including the most easily accessible ones [59]. At this stage, the greatest increase in sorption capacity occurred, from 10.13 mg/g to 26.96 mg/g. The second stage is observed in the range from 2 to 12 h. During this stage, a slowdown in the removal of methylene blue was noticed (qe = 31.26 mg/g) related to the occupation of active sites by MB molecules. After 12 h from the start of the process, a third stage was observed in which the MB removal process began to stabilize, reaching equilibrium after 24 h, resulting in a qe of 32.10 mg/g. After running the process for some time, the adsorption capacity will remain constant due to the active sites saturation. Therefore, the optimal contact time for adsorption equilibrium studies is considered to be the period during which the adsorption capacity remains constant [60]. The effect of the initial MB concentration on the sorption capacity and removal percentage was examined (Figure 7B,C). As can be seen, when the MB concentration in the solution increased from 50 to 250 mg/dm3, the MB adsorption capacity of YL-M-L-AC increased by almost 380% from 8.49 to 32.10 mg/g. The maximum sorption capacity of the YL-M-L-AC biocomposite was determined to be 32.10 mg/g, indicating that the initial MB concentration was the driving force for the dye removal process [61].
A comparison of the experimental adsorption capacity of the YL-M-L-AC biocomposite with various adsorbents is presented in Table 2. To date, various alginate-based materials containing various component materials, including magnetic particles, have been used in MB adsorption, which has led to the defining of different adsorption efficiencies. According to the data in Table 2, YL-M-L-AC shows better performance compared to some other adsorbents, suggesting that it is a promising material for MB removal from aqueous solutions.

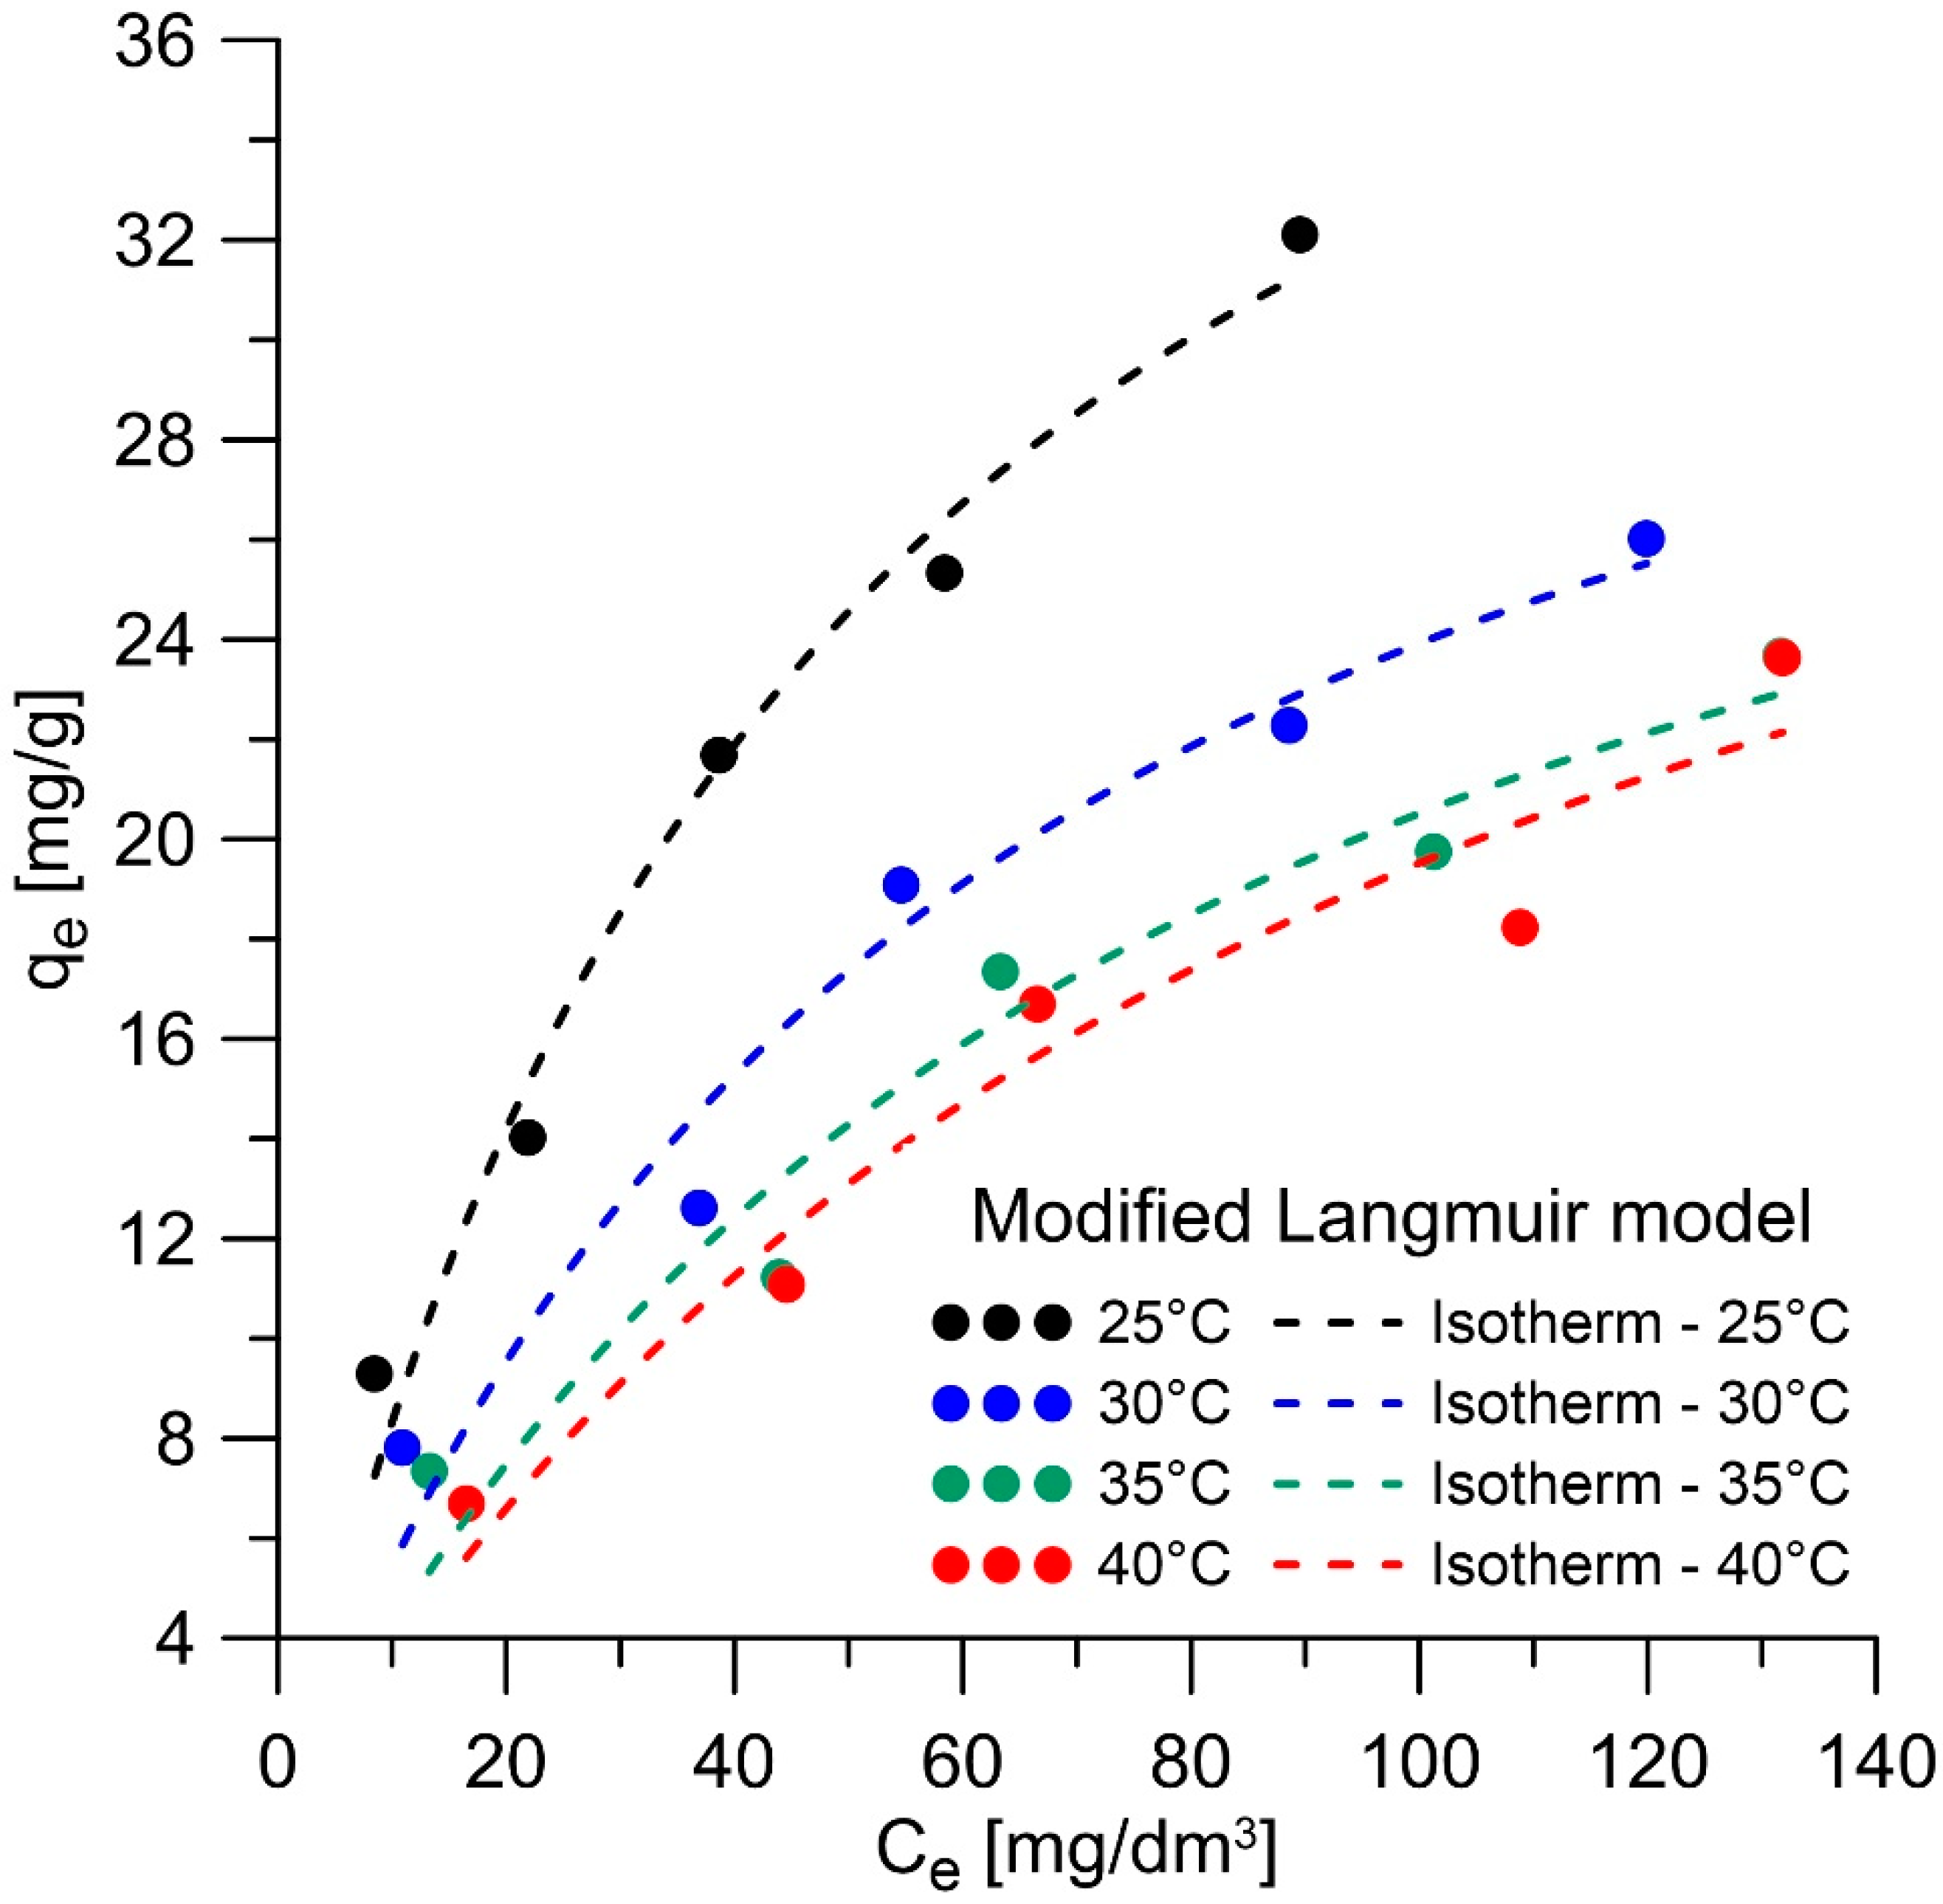
3.2.2. Equilibrium Studies

Equilibrium data are an important factor to prepare the adsorption systems [72]. Equilibrium studies often use multiple isotherms, but for this experiment, the main four were used (Langmuir, Freundlich, Temkin, and Dubinin–Radushkevich). Figure 8 shows the plots of the studied isotherms, and the calculated parameters are shown in Table 2. As noted in Table 3, the three studied isotherms are characterized by a high fit (R2 > 0.978 and ARE < 9.76), while the Freundlich isotherm favors MB uptake by YL-M-L-AC (R2 = 0.996, ARE = 3.41) more than other models. The values of the correlation coefficient and the average relative error show that the experimental data fit the isotherm model.
The Freundlich isotherm is used to investigate the beneficial effects of the adsorption process. The process is called favorable if the value of n is between 1 and 10, otherwise it is unfavorable. It was found that the value of 1/n of 0.538 for dye adsorption on the biocomposite ranges from 0 to 1, which indicates the desired adsorption process and process heterogeneity, and the value of the KF constant is ~2.8 (above 1), suggesting the participation of physical sorption in the examined process [60,73]. The Langmuir adsorption isotherm describes the single-layer adsorption of analytes on a limited number of active sites of sorbents, which can quickly become completely saturated. Additionally, the amount of adsorbed analytes in single-layer adsorption is moderately smaller compared to multilayer adsorption [3]. The high fit to the Langmuir model suggests a uniform distribution of active centers on the YL-M-L-AC surface [74]. The Temkin isotherm model assumes that the heat of adsorption of molecules changes linearly with increasing surface coverage. B represents the constant associated with the heat of adsorption. In exothermic and endothermic adsorption reactions, the value of B is higher or lower than unity [75]. The reported B value of approximately 9.6 kJ/mol indicates that the adsorption of MB onto YL-M-L-AC was an exothermic process. Based on the fitting of the D–R adsorption model, the average adsorption potential (Ep) was calculated for the MB sorption process on YL-M-L-AC. Ep represents the mean potential energy for adsorption at the periphery of the adsorption region, and its magnitude indicates the adsorption mechanism, delineating between physical adsorption (Ep < 8.0 kJ/mol), ion-exchange (8.0 kJ/mol ≤ Ep < 16.0 kJ/mol), and chemical adsorption (Ep ≥ 16.0 kJ/mol) to a certain extent [23,76]. The Ep value is 8.54 kJ/mol and is, therefore, in the range of 8.0–16.0 kJ/mol, so the adsorption of the dye on the biocomposite was dominated by ion exchange.
The performed equilibrium studies suggest that all types of adsorption processes may be involved in the MB removal process on YL-M-L-AC. This observation is identical to other studies using biocomposites consisting of various types of ingredients.

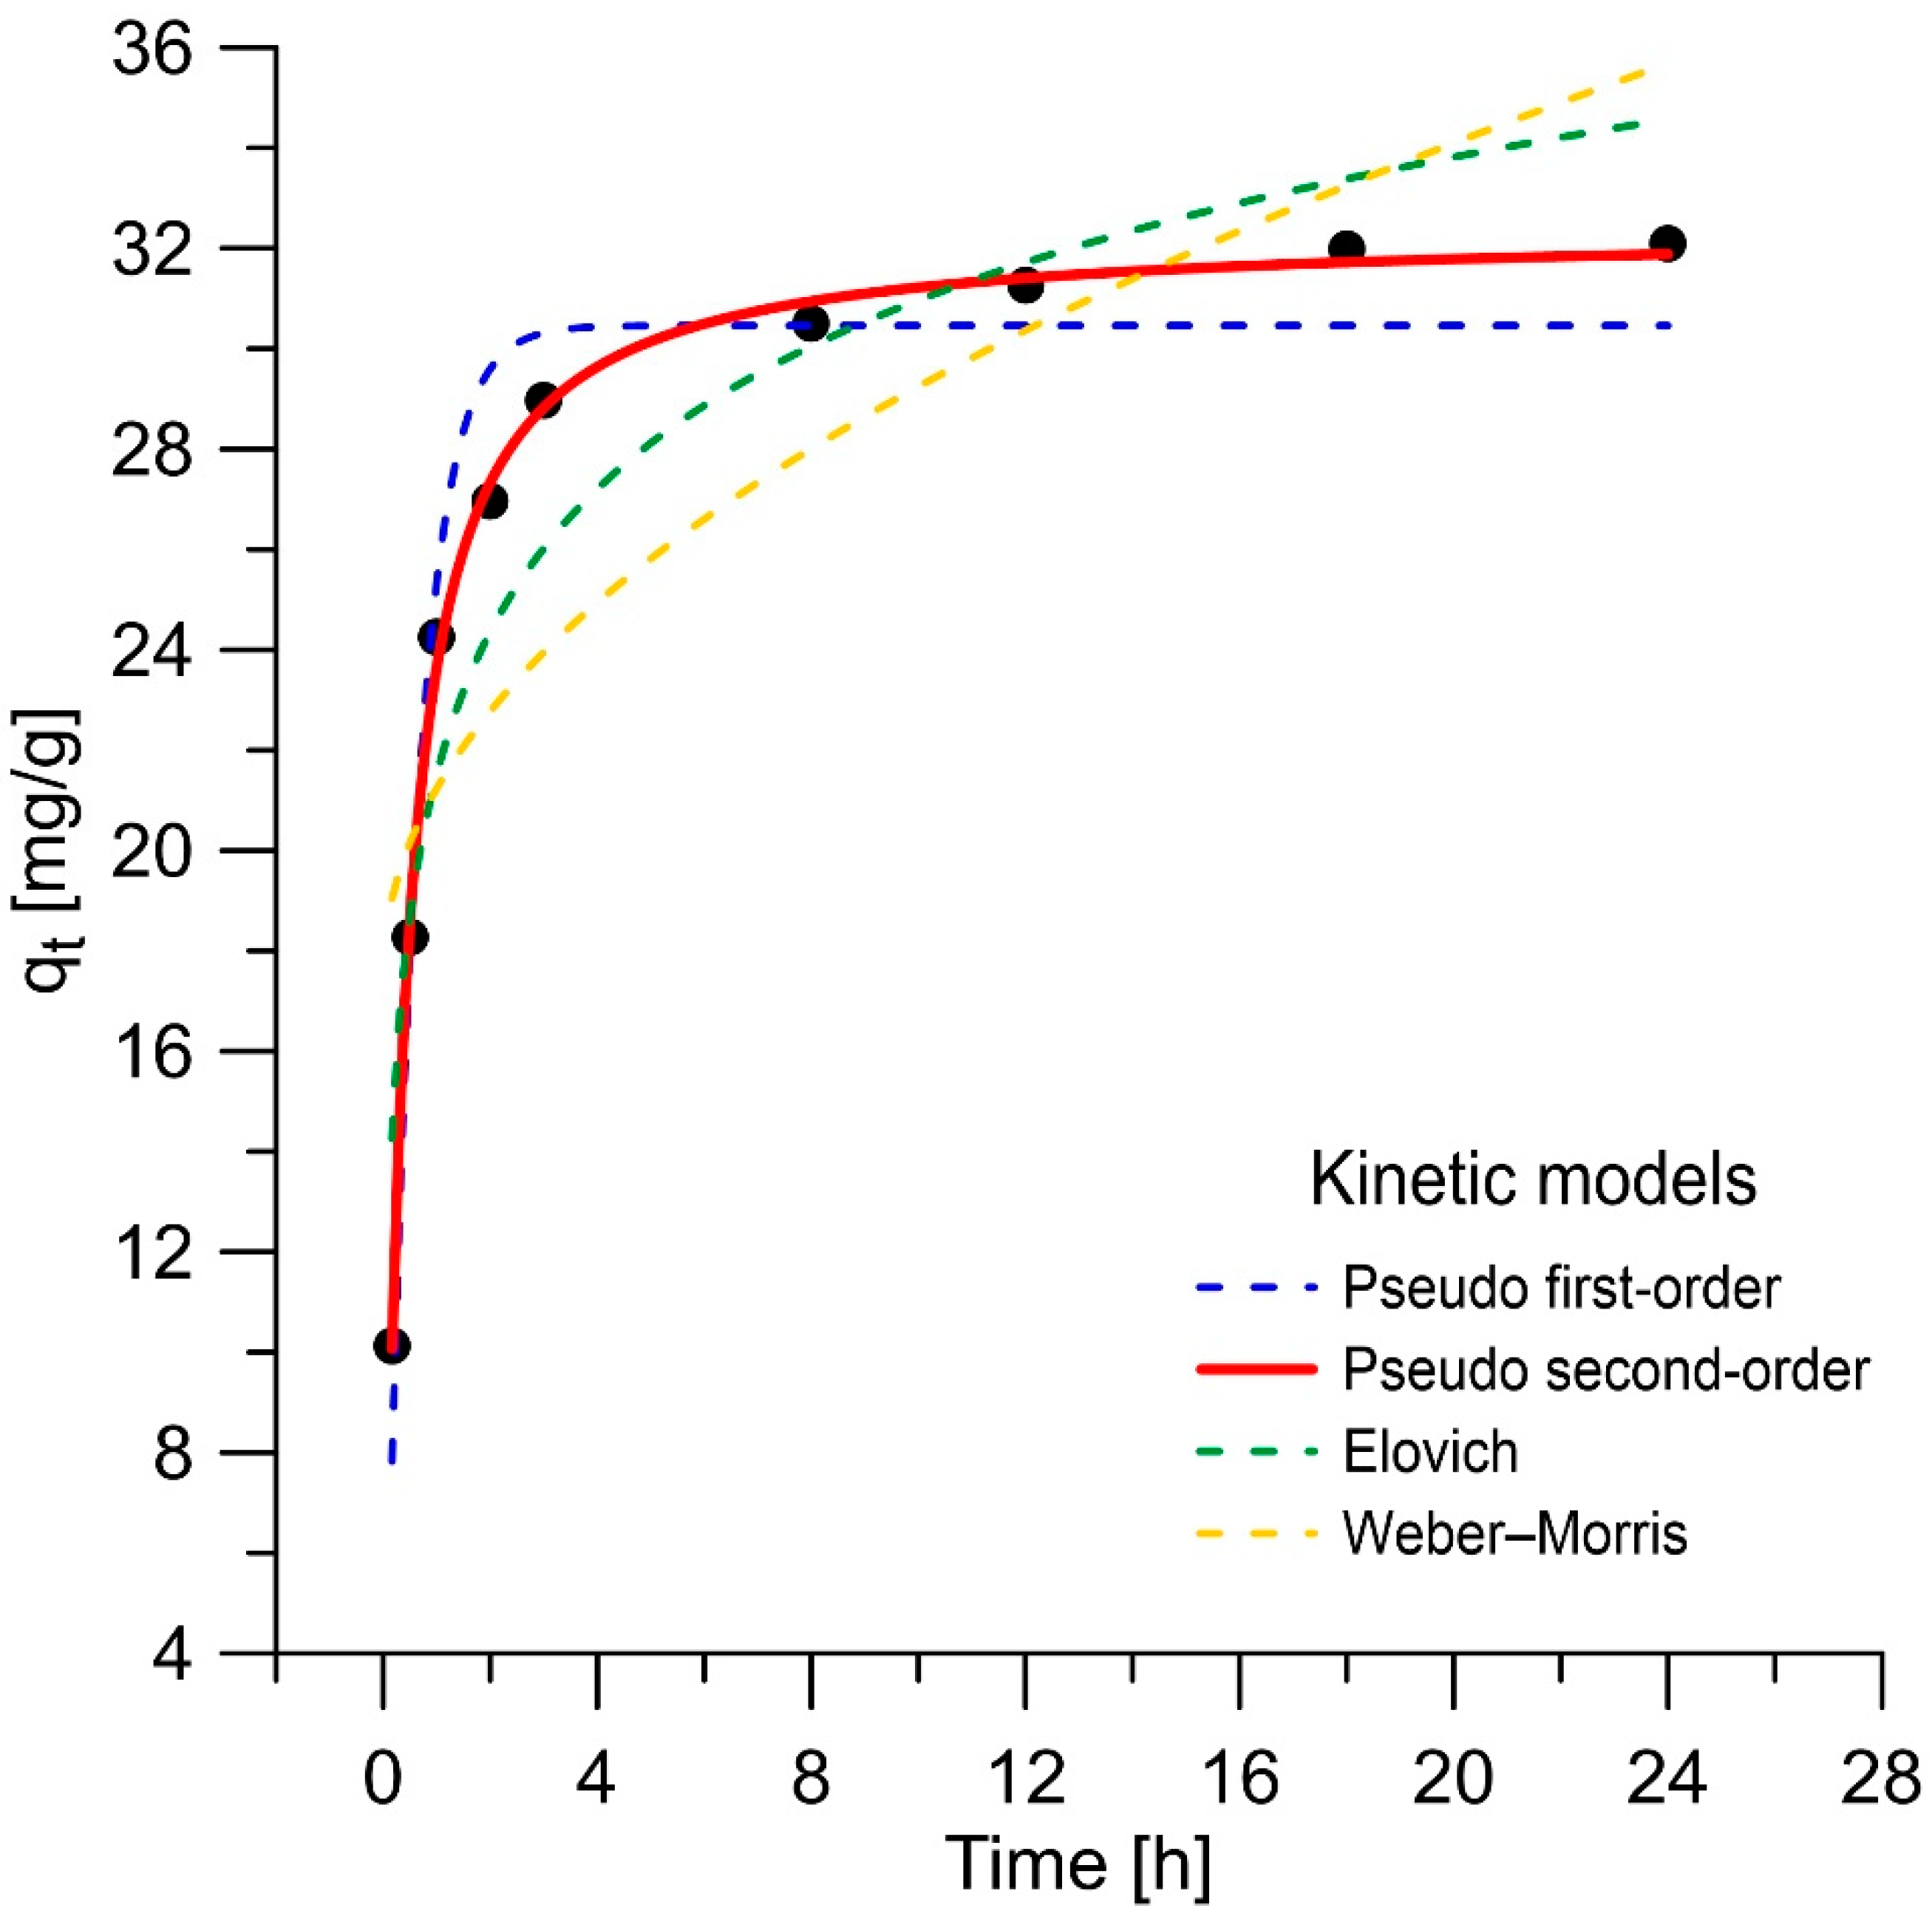
3.2.3. Kinetic Studies

To determine the kinetic mechanism of the removal process, pseudo-first-order and pseudo-second-order, Elovich, and Weber–Morris adsorption kinetic models were used for the adsorption of MB on YL-M-L-AC. The schemes of the kinetic models are presented in Figure 9 and the calculated parameters are listed in Table 4. Taking into account the R2 values and the ARE, it was found that the pseudo-second-order kinetics model (R2 = 0.9989, ARE = 1.14%) is more suitable for MB adsorption on YL-M-L-AC. The rate of the MB removal is controlled by chemical reactions that may involve electron contributions or covalent interactions between the adsorbent and the adsorbate [77,78]. However, the fit values obtained for the pseudo-first-order model (R2 = 0.9761, ARE = 6.22%) are still suitable for describing the sorption kinetics of MB on YL-M-L-AC. These values explain the surface processes including chemisorption and physisorption during the adsorption of the dye onto the biocomposite [79]. The values of q1 and q2 obtained from the pseudo-first- and second-order models are 30.46 mg/g and 32.37 mg/g, respectively, and are very close to the actual value of the sorption capacity obtained during the experiment. The last model with a high fit was the Elovich kinetic model (R2 = 0.9439, ARE = 9.90%), the fit of which was confirmed when examining systems with heterogeneous surfaces [80]. In addition to adsorption on the surface, processes such as chemical sorption, ion exchange, precipitation of substances, and diffusion were also observed. The obtained parameters α and β allowed the conclusion that in the removal of MB on YL-M-L-AC, the adsorption process is the dominant process over the desorption process (α > β) [81].

3.2.4. Thermodynamic Studies

MB removal experiment was performed on YL-M-L-AC at 25–40 °C, at every 5 °C. The obtained experimental data suggest that the dye removal capacity of the biocomposite depends on temperature. As the process temperature increases, the MB removal capacity decreases, which is consistent with the studies of other researchers using alginate beads in MB removal [82]. Figure 10 shows the modified Langmuir isotherms of MB removal on YL-M-L-AC at the tested temperatures. On their basis, KML was calculated and presented in Table 5 along with other thermodynamic parameters. The ∆G° calculation results show that the MB dye adsorption process using YL-M-L-AC is spontaneous and possible. Additionally, the increasing ∆G° value at higher temperatures suggests that the adsorption process is more favorable at lower temperatures [61]. Depending on the value of ∆G°, it can be expected that the process may have a different character. The range from −20 to 0 kJ/mol indicates physical adsorption (−16.9 kJ/mol—−15.9 kJ/mol), while from −400–80 kJ/mol suggests chemical adsorption [83]. The ΔH° value for the MB removal process on YL-M-L-AC is −36.45 kJ/mol, which suggests that the adsorption process is exothermic and physical adsorption (ΔH° < 40 kJ/mol—physical adsorption, >40 kJ/mol—chemical adsorption). The ΔS° value was negative for the biocomposite, suggesting a reduction in random collisions and particle irregularities during the adsorption process and suggesting some structural changes in YL-M-L-AC [84,85,86].
Ultimately, the adsorption of MB onto YL-M-L-AC appears to be a complex process, combining both physical and chemical adsorption.

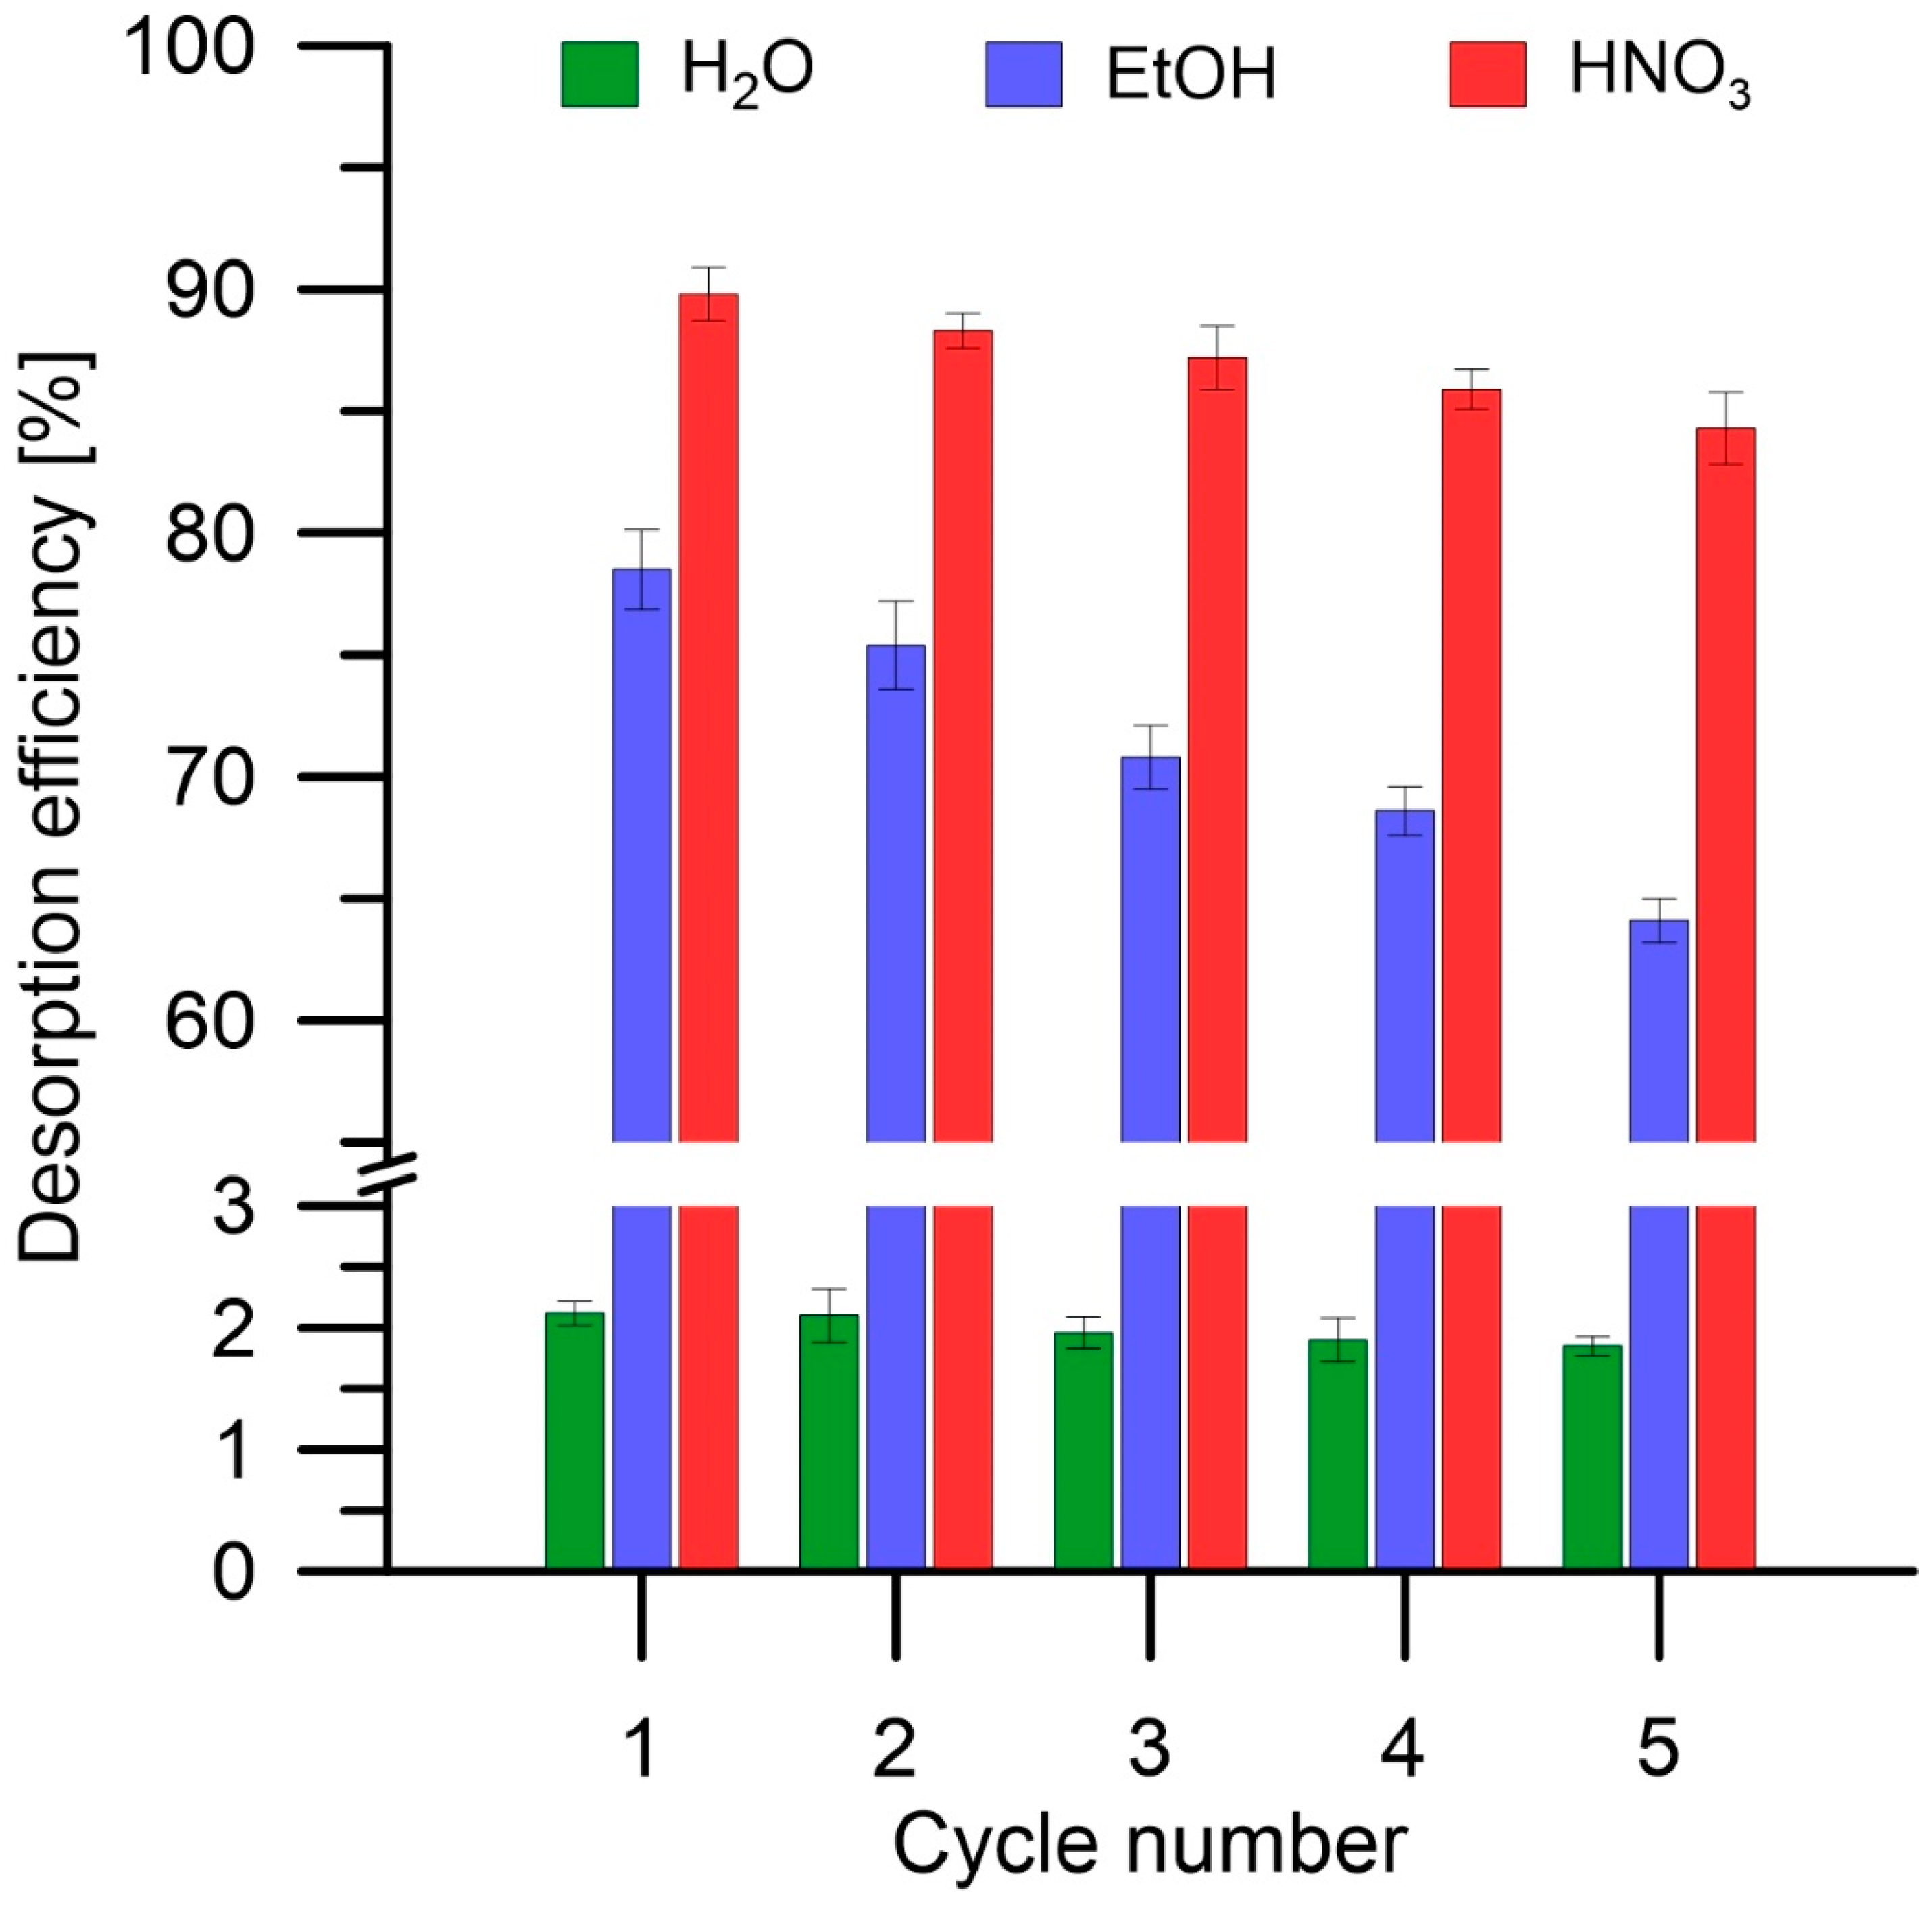
3.2.5. Desorption Studies

pHZPC tests show that the adsorption of MB with YL-M-L-AC at acidic pH is not favorable, therefore, the HNO3 solution was checked as one of the eluents. Moreover, MB is an ethanol-soluble organic dye, which can be a good desorbing agent for the regeneration of the biocomposite. Water as an eluent was tested for its ability to remove MB from YL-M-L-AC due to the various mechanisms of dye binding with the biocomposite. The desorption capacity of MB on YL-M-L-AC in five cycles is shown in Figure 11. The best results for the degree of desorption are shown by the solution of nitric acid (V), achieving desorption in the range of 89.8–84.3%, ethanol, 78.5–64.1%, and deionized water, 2.12–1.85%. The multiple usability can be justified by the physical nature of the interactions between the material and MB. Lowering the pH causes protonation of the adsorbent surface, which leads to a reduction in the electrostatic forces attracting the positively charged MB. This, in turn, facilitates the diffusion of the dye from the adsorption sites into the solution [39]. YL-M-L-AC can be considered an effective adsorbent for methylene blue dye removal because it can be repeatedly regenerated and used for adsorption, slightly losing its adsorption efficiency.

4. Conclusions

A biocomposite with magnetic properties was successfully synthesized by encapsulating biochar containing Fe3O4 particles and Yarrowia lipolytica yeast in calcium alginate beads. The obtained biocomposite can be used as an efficient, cheap, eco-friendly biological adsorbent for purifying the aqueous phase contaminated with organic dyes. Moreover, YL-M-L-AC had superparamagnetic properties and the magnetization in a 1.5 T field is 10.56 A·m2/kg, which makes it easy to separate it from the solution after adsorption. Experimental studies of MB adsorption show that the adsorption isotherm and kinetics data are well-fitted to the Freundlich isotherm model (R2 = 0.996 and ARE = 3.41%) and the pseudo-second-order kinetics model (R2 = 0.9989 and ARE = 1.14%), respectively). The sorption capacity of the biocomposite against MB increased with the contact time (qt = 10.13–32.10 mg/g) and the initial dye concentration (C0 = 50–250 mg/dm3). Studying the thermodynamic studies, it is found that the process is exothermic and the increase in temperature resulted in a decrease in sorption capacity, and that the process is spontaneous. The resulting magnetic biocomposite could be reused five times, exhibiting a desorption rate ranging from approximately 90% to approximately 84%. For this reason, YL-M-L-AC can be considered an environmentally friendly and economically viable bioadsorbent for removing methylene blue from the liquid phase in purification processes. In light of these advantages, the possibility of using this type of adsorbent in the removal of organic pollutants from industrial wastewater should be tested in the future. Only such research would fully demonstrate its potential for application.

Author Contributions

Conceptualization, P.S.; Methodology, J.C.; Validation, P.S.; Investigation, P.S. and J.C.; Writing—original draft, P.S.; Writing—review & editing, J.C.; Supervision, P.S. All authors have read and agreed to the published version of the manuscript.

Funding

This research received no external funding.

Institutional Review Board Statement

Not applicable.

Informed Consent Statement

Not applicable.

Data Availability Statement

The raw data supporting the conclusions of this article will be made available by the authors on request.

Conflicts of Interest

The authors declare no conflict of interest.

References

  1. Jameel Rather, L.; Akhter, S.; Parvaiz Hassan, Q.; Rather, L.J.; Akhter, S.; Hassan, Q.P. Bioremediation: Green and Sustainable Technology for Textile Effluent Treatment. In Sustainable Innovations in Textile Chemistry and Dyes; Springer: Berlin/Heidelberg, Germany, 2018; pp. 75–91. [Google Scholar] [CrossRef]
  2. Abu Talha, M.; Goswami, M.; Giri, B.S.; Sharma, A.; Rai, B.N.; Singh, R.S. Bioremediation of Congo red dye in immobilized batch and continuous packed bed bioreactor by Brevibacillus parabrevis using coconut shell bio-char. Bioresour. Technol. 2018, 252, 37–43. [Google Scholar] [CrossRef] [PubMed]
  3. Vikrant, K.; Giri, B.S.; Raza, N.; Roy, K.; Kim, K.H.; Rai, B.N.; Singh, R.S. Recent advancements in bioremediation of dye: Current status and challenges. Bioresour. Technol. 2018, 253, 355–367. [Google Scholar] [CrossRef] [PubMed]
  4. Yaseen, D.A.; Scholz, M. Treatment of synthetic textile wastewater containing dye mixtures with microcosms. Environ. Sci. Pollut. Res. 2018, 25, 1980–1997. [Google Scholar] [CrossRef]
  5. Güleç, F.; Williams, O.; Samson, A.; Kostas, E.T.; Stevens, L.A.; Lester, E. Exploring the Utilisation of Natural Biosorbents for Effective Methylene Blue Removal. Appl. Sci. 2024, 14, 81. [Google Scholar] [CrossRef]
  6. Elgarahy, A.M.; Elwakeel, K.Z.; Mohammad, S.H.; Elshoubaky, G.A. A critical review of biosorption of dyes, heavy metals and metalloids from wastewater as an efficient and green process. Clean. Eng. Technol. 2021, 4, 100209. [Google Scholar] [CrossRef]
  7. Albert, M.; Lessin, M.S.; Gilchrist, B.F. Methylene blue: Dangerous dye for neonates. J. Pediatr. Surg. 2003, 38, 1244–1245. [Google Scholar] [CrossRef]
  8. Mphuthi, B.R.; Thabede, P.M.; Modise, J.S.; Xaba, T.; Shooto, N.D. Adsorption of Cadmium and Methylene Blue Using Highly Porous Carbon from Hemp Seeds. Appl. Sci. 2023, 13, 9659. [Google Scholar] [CrossRef]
  9. Kandisa, R.V.; Saibaba, K.V.N.; Shaik, K.B.; Gopinath, R. Dye removal by adsorption: A review. J. Bioremediat. Biodegrad. 2016, 7, 371. [Google Scholar] [CrossRef]
  10. Katheresan, V.; Kansedo, J.; Lau, S.Y. Efficiency of various recent wastewater dye removal methods: A review. J. Environ. Chem. Eng. 2018, 6, 4676–4697. [Google Scholar] [CrossRef]
  11. Mousavi, S.A.; Kamarehie, B.; Almasi, A.; Darvishmotevalli, M.; Salari, M.; Moradnia, M.; Azimi, F.; Ghaderpoori, M.; Neyazi, Z.; Karami, M.A. Removal of Rhodamine B from aqueous solution by stalk corn activated carbon: Adsorption and kinetic study. Biomass Convers. Biorefin. 2023, 13, 7927–7936. [Google Scholar] [CrossRef]
  12. Asgher, M. Biosorption of Reactive Dyes: A Review. Water Air Soil Pollut. 2011, 223, 2417–2435. [Google Scholar] [CrossRef]
  13. Upendar, G.; Dutta, S.; Bhattacharya, P.; Dutta, A. Bioremediation of methylene blue dye using Bacillus subtilis MTCC 441. Water Sci. Technol. 2017, 75, 1572–1583. [Google Scholar] [CrossRef] [PubMed]
  14. Ahmad, A.; Singh, A.P.; Khan, N.; Chowdhary, P.; Giri, B.S.; Varjani, S.; Chaturvedi, P. Bio-composite of Fe-sludge biochar immobilized with Bacillus Sp. in packed column for bio-adsorption of Methylene blue in a hybrid treatment system: Isotherm and kinetic evaluation. Environ. Technol. Innov. 2021, 23, 101734. [Google Scholar] [CrossRef]
  15. Darvishi, F.; Moradi, M.; Jolivalt, C.; Madzak, C. Laccase production from sucrose by recombinant Yarrowia lipolytica and its application to decolorization of environmental pollutant dyes. Ecotoxicol. Environ. Saf. 2018, 165, 278–283. [Google Scholar] [CrossRef] [PubMed]
  16. Bankar, A.V.; Kumar, A.R.; Zinjarde, S.S. Environmental and industrial applications of Yarrowia lipolytica. Appl. Microbiol. Biotechnol. 2009, 84, 847–865. [Google Scholar] [CrossRef] [PubMed]
  17. Hidayat, E.; Yonemura, S.; Mitoma, Y.; Harada, H. Methylene Blue Removal by Chitosan Cross-Linked Zeolite from Aqueous Solution and Other Ion Effects: Isotherm, Kinetic, and Desorption Studies. Adsorpt. Sci. Technol. 2022, 2022, 1853758. [Google Scholar] [CrossRef]
  18. Ahmed, M.J.; Dhedan, S.K. Equilibrium isotherms and kinetics modeling of methylene blue adsorption on agricultural wastes-based activated carbons. Fluid Phase Equilib. 2012, 317, 9–14. [Google Scholar] [CrossRef]
  19. Wu, F.C.; Tseng, R.L.; Juang, R.S. A review and experimental verification of using chitosan and its derivatives as adsorbents for selected heavy metals. J. Environ. Manag. 2010, 91, 798–806. [Google Scholar] [CrossRef]
  20. Baláž, P.; Aláčová, A.; Briančin, J. Sensitivity of Freundlich equation constant 1/n for zinc sorption on changes induced in calcite by mechanical activation. Chem. Eng. J. 2005, 114, 115–121. [Google Scholar] [CrossRef]
  21. Mousa, S.M.; Ammar, N.S.; Ibrahim, H.A. Removal of lead ions using hydroxyapatite nano-material prepared from phosphogypsum waste. J. Saudi Chem. Soc. 2016, 20, 357–365. [Google Scholar] [CrossRef]
  22. Dada, A.O.; Olalekan, A.P.; Olatunya, A.M.; Dada, O. Langmuir, Freundlich, Temkin and Dubinin–Radushkevich Isotherms Studies of Equilibrium Sorption of Zn2+ Unto Phosphoric Acid Modified Rice Husk. IOSR J. Appl. Chem. 2012, 3, 38–45. [Google Scholar] [CrossRef]
  23. Bai, C.; Wang, L.; Zhu, Z. Adsorption of Cr(III) and Pb(II) by graphene oxide/alginate hydrogel membrane: Characterization, adsorption kinetics, isotherm and thermodynamics studies. Int. J. Biol. Macromol. 2020, 147, 898–910. [Google Scholar] [CrossRef]
  24. Cheung, C.W.; Porter, J.F.; McKay, G. Sorption kinetics for the removal of copper and zinc from effluents using bone char. Sep. Purif. Technol. 2000, 19, 55–64. [Google Scholar] [CrossRef]
  25. Kumar, K.V. Linear and non-linear regression analysis for the sorption kinetics of methylene blue onto activated carbon. J. Hazard. Mater. 2006, 137, 1538–1544. [Google Scholar] [CrossRef] [PubMed]
  26. López-Luna, J.; Ramírez-Montes, L.E.; Martinez-Vargas, S.; Martínez, A.I.; Mijangos-Ricardez, O.F.; González-Chávez, M.d.C.A.; Carrillo-González, R.; Solís-Domínguez, F.A.; Cuevas-Díaz, M.d.C.; Vázquez-Hipólito, V. Linear and nonlinear kinetic and isotherm adsorption models for arsenic removal by manganese ferrite nanoparticles. SN Appl. Sci. 2019, 1, 950. [Google Scholar] [CrossRef]
  27. Svilović, S.; Rušić, D.; Bašić, A. Investigations of different kinetic models of copper ions sorption on zeolite 13X. Desalination 2010, 259, 71–75. [Google Scholar] [CrossRef]
  28. Lima, E.C.; Gomes, A.A.; Tran, H.N. Comparison of the nonlinear and linear forms of the van’t Hoff equation for calculation of adsorption thermodynamic parameters (∆S° and ∆H°). J. Mol. Liq. 2020, 311, 113315. [Google Scholar] [CrossRef]
  29. Azizian, S.; Eris, S.; Wilson, L.D. Re-evaluation of the century-old Langmuir isotherm for modeling adsorption phenomena in solution. Chem. Phys. 2018, 513, 99–104. [Google Scholar] [CrossRef]
  30. Enache, A.C.; Cojocaru, C.; Samoila, P.; Ciornea, V.; Apolzan, R.; Predeanu, G.; Harabagiu, V. Adsorption of Brilliant Green Dye onto a Mercerized Biosorbent: Kinetic, Thermodynamic, and Molecular Docking Studies. Molecules 2023, 28, 4129. [Google Scholar] [CrossRef]
  31. Marques, B.S.; Frantz, T.S.; Sant’Anna Cadaval Junior, T.R.; de Almeida Pinto, L.A.; Dotto, G.L. Adsorption of a textile dye onto piaçava fibers: Kinetic, equilibrium, thermodynamics, and application in simulated effluents. Environ. Sci. Pollut. Res. 2019, 26, 28584–28592. [Google Scholar] [CrossRef]
  32. Marques, J.L.; Lütke, S.F.; Frantz, T.S.; Espinelli, J.B.S.; Carapelli, R.; Pinto, L.A.A.; Cadaval, T.R.S. Removal of Al (III) and Fe (III) from binary system and industrial effluent using chitosan films. Int. J. Biol. Macromol. 2018, 120, 1667–1673. [Google Scholar] [CrossRef] [PubMed]
  33. Collard, F.X.; Blin, J. A review on pyrolysis of biomass constituents: Mechanisms and composition of the products obtained from the conversion of cellulose, hemicelluloses and lignin. Renew. Sustain. Energy Rev. 2014, 38, 594–608. [Google Scholar] [CrossRef]
  34. Teh, J.S.; Teoh, Y.H.; How, H.G.; Sher, F. Thermal Analysis Technologies for Biomass Feedstocks: A State-of-the-Art Review. Processes 2021, 9, 1610. [Google Scholar] [CrossRef]
  35. Novak, J.M.; Johnson, M.G. Elemental and Spectroscopic Characterization of Low-Temperature (350 °C) Lignocellulosic- and Manure-Based Designer Biochars and Their Use as Soil Amendments. In Biochar from Biomass and Waste Fundamentals and Applications; Elsevier: Amsterdam, The Netherlands, 2019; pp. 37–58. [Google Scholar] [CrossRef]
  36. Yang, H.; Yan, R.; Chen, H.; Lee, D.H.; Zheng, C. Characteristics of hemicellulose, cellulose and lignin pyrolysis. Fuel 2007, 86, 1781–1788. [Google Scholar] [CrossRef]
  37. Huang, Y.F.; Kuan, W.H.; Chiueh, P.T.; Lo, S.L. Pyrolysis of biomass by thermal analysis–mass spectrometry (TA–MS). Bioresour. Technol. 2011, 102, 3527–3534. [Google Scholar] [CrossRef] [PubMed]
  38. Idris, S.S.; Rahman, N.A.; Ismail, K.; Alias, A.B.; Rashid, Z.A.; Aris, M.J. Investigation on thermochemical behaviour of low rank Malaysian coal, oil palm biomass and their blends during pyrolysis via thermogravimetric analysis (TGA). Bioresour. Technol. 2010, 101, 4584–4592. [Google Scholar] [CrossRef]
  39. Boukhalfa, N.; Boutahala, M.; Djebri, N.; Idris, A. Maghemite/alginate/functionalized multiwalled carbon nanotubes beads for methylene blue removal: Adsorption and desorption studies. J. Mol. Liq. 2019, 275, 431–440. [Google Scholar] [CrossRef]
  40. Kamakshi, T.; Sundari, G.S.; Erothu, H.; Singh, R.S. Effect of nickel dopant on structural, morphological and optical characteristics of Fe3O4 nanoparticles. Rasayan J. Chem. 2019, 12, 531–536. [Google Scholar] [CrossRef]
  41. Evora, M.C.; Gonçalez, O.L.; Dutra, R.C.L.; Diniz, M.F.; Wiebeck, H.; de Andrade e Silva, L.G. Comparação de Técnicas FTIR de Transmissão, Reflexão e Fotoacústica na Análise de Poliamida-6, Reciclada e Irradiada. Polímeros 2002, 12, 60–68. [Google Scholar] [CrossRef]
  42. Cavagna, M.; Dell’Anna, R.; Monti, F.; Rossi, F.; Torriani, S. Use of ATR-FTIR Microspectroscopy to Monitor Autolysis of Saccharomyces cerevisiae Cells in a Base Wine. J. Agric. Food Chem. 2009, 58, 39–45. [Google Scholar] [CrossRef]
  43. Bhaduri, D.; Saha, A.; Desai, D.; Meena, H.N. Restoration of carbon and microbial activity in salt-induced soil by application of peanut shell biochar during short-term incubation study. Chemosphere 2016, 148, 86–98. [Google Scholar] [CrossRef]
  44. Mitter, E.K.; Corso, C.R. FT-IR analysis of acid black dye biodegradation using saccharomyces cerevisiae immobilized with treated sugarcane bagasse. Water. Air. Soil Pollut. 2013, 224, 1–9. [Google Scholar] [CrossRef]
  45. El-Kabbany, F.; Taha, S.; Hafez, M. Infrared spectroscopic anaylsis of polymorphism in diphenyl carbazide. Spectrochim. Acta A Mol. Biomol. Spectrosc. 2010, 78, 981–988. [Google Scholar] [CrossRef]
  46. Pistorius, A.M.A.; DeGrip, W.J.; Egorova-Zachernyuk, T.A. Monitoring of biomass composition from microbiological sources by means of FT-IR spectroscopy. Biotechnol. Bioeng. 2009, 103, 123–129. [Google Scholar] [CrossRef] [PubMed]
  47. Kamaruzzaman, A.N.A.; Mulok, T.E.T.Z.; Nor, N.H.M.; Yahya, M.F.Z.R. Ftir Spectral Changes in Candida albicans Biofilm Following Exposure to Antifungals. Malays. Appl. Biol. 2022, 51, 57–66. [Google Scholar] [CrossRef]
  48. Olatunji, O.O.; Akinlabi, S.; Madushele, N.; Adedeji, P.A.; Ndolomingo, M.J.; Meshack, T. Blended tropical almond residue for fuel production: Characteristics, energy benefits, and emission reduction potential. J. Clean. Prod. 2020, 267, 122013. [Google Scholar] [CrossRef]
  49. Dong, X.; Guo, S.; Wang, H.; Wang, Z.; Gao, X. Physicochemical characteristics and FTIR-derived structural parameters of hydrochar produced by hydrothermal carbonisation of pea pod (Pisum sativum Linn.) waste. Biomass Convers. Biorefin. 2019, 9, 531–540. [Google Scholar] [CrossRef]
  50. Wahab, M.A.; Boubakri, H.; Jellali, S.; Jedidi, N. Characterization of ammonium retention processes onto Cactus leaves fibers using FTIR, EDX and SEM analysis. J. Hazard. Mater. 2012, 241–242, 101–109. [Google Scholar] [CrossRef]
  51. Abbas, O.; Rebufa, C.; Dupuy, N.; Kister, J. FTIR—Multivariate curve resolution monitoring of photo-Fenton degradation of phenolic aqueous solutions: Comparison with HPLC as a reference method. Talanta 2008, 77, 200–209. [Google Scholar] [CrossRef]
  52. Cherdoud-Chihani, A.; Mouzali, M.; Abadie, M.J.M. Study of crosslinking acid copolymer/DGEBA systems by FTIR. J. Appl. Polym. Sci. 2003, 87, 2033–2051. [Google Scholar] [CrossRef]
  53. Joyce Hellen Sathya, D.; Manohar Turakhia, A.; Anil Kumar, M.; Balaji, N.; Selvanaveen, S.; Vinodhini, G.; Seenuvasan, M. Energy Sources, Part A: Recovery, Utilization, and Environmental Effects Bioethanol from saccharificed lignocellulosic rich Aloe vera rinds using Saccharomyces cerevisiae MTCC 4779 Bioethanol from saccharificed lignocellulosic rich Aloe vera rinds using Saccharomyces cerevisiae MTCC 4779. Energy Sources Part A Recovery Util. Environ. Eff. 2017, 39, 1347–1352. [Google Scholar] [CrossRef]
  54. Gunasekaran, S.; Natarajan, R.K.; Renganayaki, V.; Natarajan, S. Vibrational spectra and thermodynamic analysis of metformin. Indian J. Pure Appl. Phys. 2006, 44, 495–500. [Google Scholar]
  55. Zhou, W.; He, W.; Zhong, S.; Wang, Y.; Zhao, H.; Li, Z.; Yan, S. Biosynthesis and magnetic properties of mesoporous Fe3O4 composites. J. Magn. Magn. Mater. 2009, 321, 1025–1028. [Google Scholar] [CrossRef]
  56. Kefeni, K.K.; Mamba, B.B. Photocatalytic application of spinel ferrite nanoparticles and nanocomposites in wastewater treatment: Review. Sustain. Mater. Technol. 2020, 23, e00140. [Google Scholar] [CrossRef]
  57. Alvarez-Silva, M.; Uribe-Salas, A.; Mirnezami, M.; Finch, J.A. The point of zero charge of phyllosilicate minerals using the Mular–Roberts titration technique. Miner. Eng. 2010, 23, 383–389. [Google Scholar] [CrossRef]
  58. Haq, A.u.; Saeed, M.; Usman, M.; Zahoor, A.F.; Anjum, M.N.; Maqbool, T.; Naheed, S.; Kashif, M. Mechanisms of halosulfuron methyl pesticide biosorption onto neem seeds powder. Sci. Rep. 2021, 11, 9960. [Google Scholar] [CrossRef]
  59. Maqbool, M.; Bhatti, H.N.; Sadaf, S.; Mana AL-Anazy, M.; Iqbal, M. Biocomposite of polyaniline and sodium alginate with Oscillatoria biomass: A potential adsorbent for the removal of basic blue 41. J. Mater. Res. Technol. 2020, 9, 14729–14741. [Google Scholar] [CrossRef]
  60. Heybet, E.N.; Ugraskan, V.; Isik, B.; Yazici, O. Adsorption of methylene blue dye on sodium alginate/polypyrrole nanotube composites. Int. J. Biol. Macromol. 2021, 193, 88–99. [Google Scholar] [CrossRef]
  61. Alver, E.; Metin, A.Ü.; Brouers, F. Methylene blue adsorption on magnetic alginate/rice husk bio-composite. Int. J. Biol. Macromol. 2020, 154, 104–113. [Google Scholar] [CrossRef]
  62. Abd El-Latif, M.M.; El-Kady, M.F.; Ibrahim, A.M.; Ossman, M.E. Alginate/Polyvinyl Alcohol - Kaolin Composite for Removal of Methylene Blue from Aqueous Solution in a Batch Stirred Tank Reactor. J. Am. Sci. 2010, 6, 280–292. [Google Scholar]
  63. Liu, F.; Li, W.; Zhou, Y. Preparation and characterization of magnetic sodium alginate-modified zeolite for the efficient removal of methylene blue. Colloids Surfaces A Physicochem. Eng. Asp. 2021, 629, 127403. [Google Scholar] [CrossRef]
  64. Biswas, S.; Mohapatra, S.S.; Kumari, U.; Meikap, B.C.; Sen, T.K. Batch and continuous closed circuit semi-fluidized bed operation: Removal of MB dye using sugarcane bagasse biochar and alginate composite adsorbents. J. Environ. Chem. Eng. 2020, 8, 103637. [Google Scholar] [CrossRef]
  65. Chen, R.; Zhang, Y.; Shen, L.; Wang, X.; Chen, J.; Ma, A.; Jiang, W. Lead(II) and methylene blue removal using a fully biodegradable hydrogel based on starch immobilized humic acid. Chem. Eng. J. 2015, 268, 348–355. [Google Scholar] [CrossRef]
  66. Munagapati, V.S.; Wen, H.Y.; Gollakota, A.R.K.; Wen, J.C.; Lin, K.Y.A.; Shu, C.M.; Yarramuthi, V.; Basivi, P.K.; Reddy, G.M.; Zyryanov, G.V. Magnetic Fe3O4 nanoparticles loaded guava leaves powder impregnated into calcium alginate hydrogel beads (Fe3O4-GLP@CAB) for efficient removal of methylene blue dye from aqueous environment: Synthesis, characterization, and its adsorption performance. Int. J. Biol. Macromol. 2023, 246, 125675. [Google Scholar] [CrossRef]
  67. Noori, M.; Tahmasebpoor, M.; Foroutan, R. Enhanced adsorption capacity of low-cost magnetic clinoptilolite powders/beads for the effective removal of methylene blue: Adsorption and desorption studies. Mater. Chem. Phys. 2022, 278, 125655. [Google Scholar] [CrossRef]
  68. Erfani, M.; Javanbakht, V. Methylene Blue removal from aqueous solution by a biocomposite synthesized from sodium alginate and wastes of oil extraction from almond peanut. Int. J. Biol. Macromol. 2018, 114, 244–255. [Google Scholar] [CrossRef] [PubMed]
  69. Rezaei, H.; Haghshenasfard, M.; Moheb, A. Optimization of dye adsorption using Fe3O4 nanoparticles encapsulated with alginate beads by Taguchi method. Adsorpt. Sci. Technol. 2017, 35, 55–71. [Google Scholar] [CrossRef]
  70. E, T.; Ma, D.; Yang, S.; Hao, X. Graphene oxide-montmorillonite/sodium alginate aerogel beads for selective adsorption of methylene blue in wastewater. J. Alloys Compd. 2020, 832, 154833. [Google Scholar] [CrossRef]
  71. Zhang, Z.H.; Xu, J.Y.; Yang, X.L. MXene/sodium alginate gel beads for adsorption of methylene blue. Mater. Chem. Phys. 2021, 260, 124123. [Google Scholar] [CrossRef]
  72. Igwegbe, C.A.; Mohmmadi, L.; Ahmadi, S.; Rahdar, A.; Khadkhodaiy, D.; Dehghani, R.; Rahdar, S. Modeling of adsorption of Methylene Blue dye on Ho-CaWO4 nanoparticles using Response Surface Methodology (RSM) and Artificial Neural Network (ANN) techniques. MethodsX 2019, 6, 1779–1797. [Google Scholar] [CrossRef]
  73. Mu, T.-H.; Sun, H.-N. Sweet Potato Leaf Polyphenols: Preparation, Individual Phenolic Compound Composition and Antioxidant Activity. In Polyphenols in Plants; Elsevier: Amsterdam, The Netherlands, 2019; pp. 365–380. [Google Scholar]
  74. Özacar, M.; Şengil, I.A. Adsorption of metal complex dyes from aqueous solutions by pine sawdust. Bioresour. Technol. 2005, 96, 791–795. [Google Scholar] [CrossRef] [PubMed]
  75. Kongsune, P.; Rattanapan, S.; Chanajaree, R. The removal of Pb2+ from aqueous solution using mangosteen peel activated carbon: Isotherm, kinetic, thermodynamic and binding energy calculation. Groundw. Sustain. Dev. 2021, 12, 100524. [Google Scholar] [CrossRef]
  76. Ünlü, N.; Ersoz, M. Removal of heavy metal ions by using dithiocarbamated-sporopollenin. Sep. Purif. Technol. 2007, 52, 461–469. [Google Scholar] [CrossRef]
  77. Chen, H.; Zhao, J.; Dai, G. Silkworm exuviae—A new non-conventional and low-cost adsorbent for removal of methylene blue from aqueous solutions. J. Hazard. Mater. 2011, 186, 1320–1327. [Google Scholar] [CrossRef] [PubMed]
  78. Işık, B.; Uğraşkan, V. Adsorption of methylene blue on sodium alginate–flax seed ash beads: Isotherm, kinetic and thermodynamic studies. Int. J. Biol. Macromol. 2021, 167, 1156–1167. [Google Scholar] [CrossRef] [PubMed]
  79. Tohamy, H.A.S.; El-Sakhawy, M.; Kamel, S. Microwave-assisted synthesis of amphoteric fluorescence carbon quantum dots and their chromium adsorption from aqueous solution. Sci. Rep. 2023, 13, 11306. [Google Scholar] [CrossRef] [PubMed]
  80. Juang, R.S.; Chen, M.L. Application of the Elovich Equation to the Kinetics of Metal Sorption with Solvent-Impregnated Resins. Ind. Eng. Chem. Res. 1997, 36, 813–820. [Google Scholar] [CrossRef]
  81. Khan, T.A.; Chaudhry, S.A.; Ali, I. Equilibrium uptake, isotherm and kinetic studies of Cd(II) adsorption onto iron oxide activated red mud from aqueous solution. J. Mol. Liq. 2015, 202, 165–175. [Google Scholar] [CrossRef]
  82. Ravi; Pandey, L.M. Enhanced adsorption capacity of designed bentonite and alginate beads for the effective removal of methylene blue. Appl. Clay Sci. 2019, 169, 102–111. [Google Scholar] [CrossRef]
  83. Somsesta, N.; Sricharoenchaikul, V.; Aht-Ong, D. Adsorption removal of methylene blue onto activated carbon/cellulose biocomposite films: Equilibrium and kinetic studies. Mater. Chem. Phys. 2020, 240, 122221. [Google Scholar] [CrossRef]
  84. Esmaeili, H.; Foroutan, R. Adsorptive Behavior of Methylene Blue onto Sawdust of Sour Lemon, Date Palm, and Eucalyptus as Agricultural Wastes. J. Dispers. Sci. Technol. 2019, 40, 990–999. [Google Scholar] [CrossRef]
  85. Igwegbe, C.A.; Al-Rawajfeh, A.E.; Al-Itawi, H.I.; Sharadqah, S.; Al-Qazaqi, S.; Abu Hashish, E.; Al-Qatatsheh, M.; Sillanpaa, M. Utilization of Calcined Gypsum in Water and Wastewater Treatment: Removal of Phenol. J. Ecol. Eng. 2019, 20, 1–10. [Google Scholar] [CrossRef]
  86. Vilela, P.B.; Matias, C.A.; Dalalibera, A.; Becegato, V.A.; Paulino, A.T. Polyacrylic acid-based and chitosan-based hydrogels for adsorption of cadmium: Equilibrium isotherm, kinetic and thermodynamic studies. J. Environ. Chem. Eng. 2019, 7, 103327. [Google Scholar] [CrossRef]
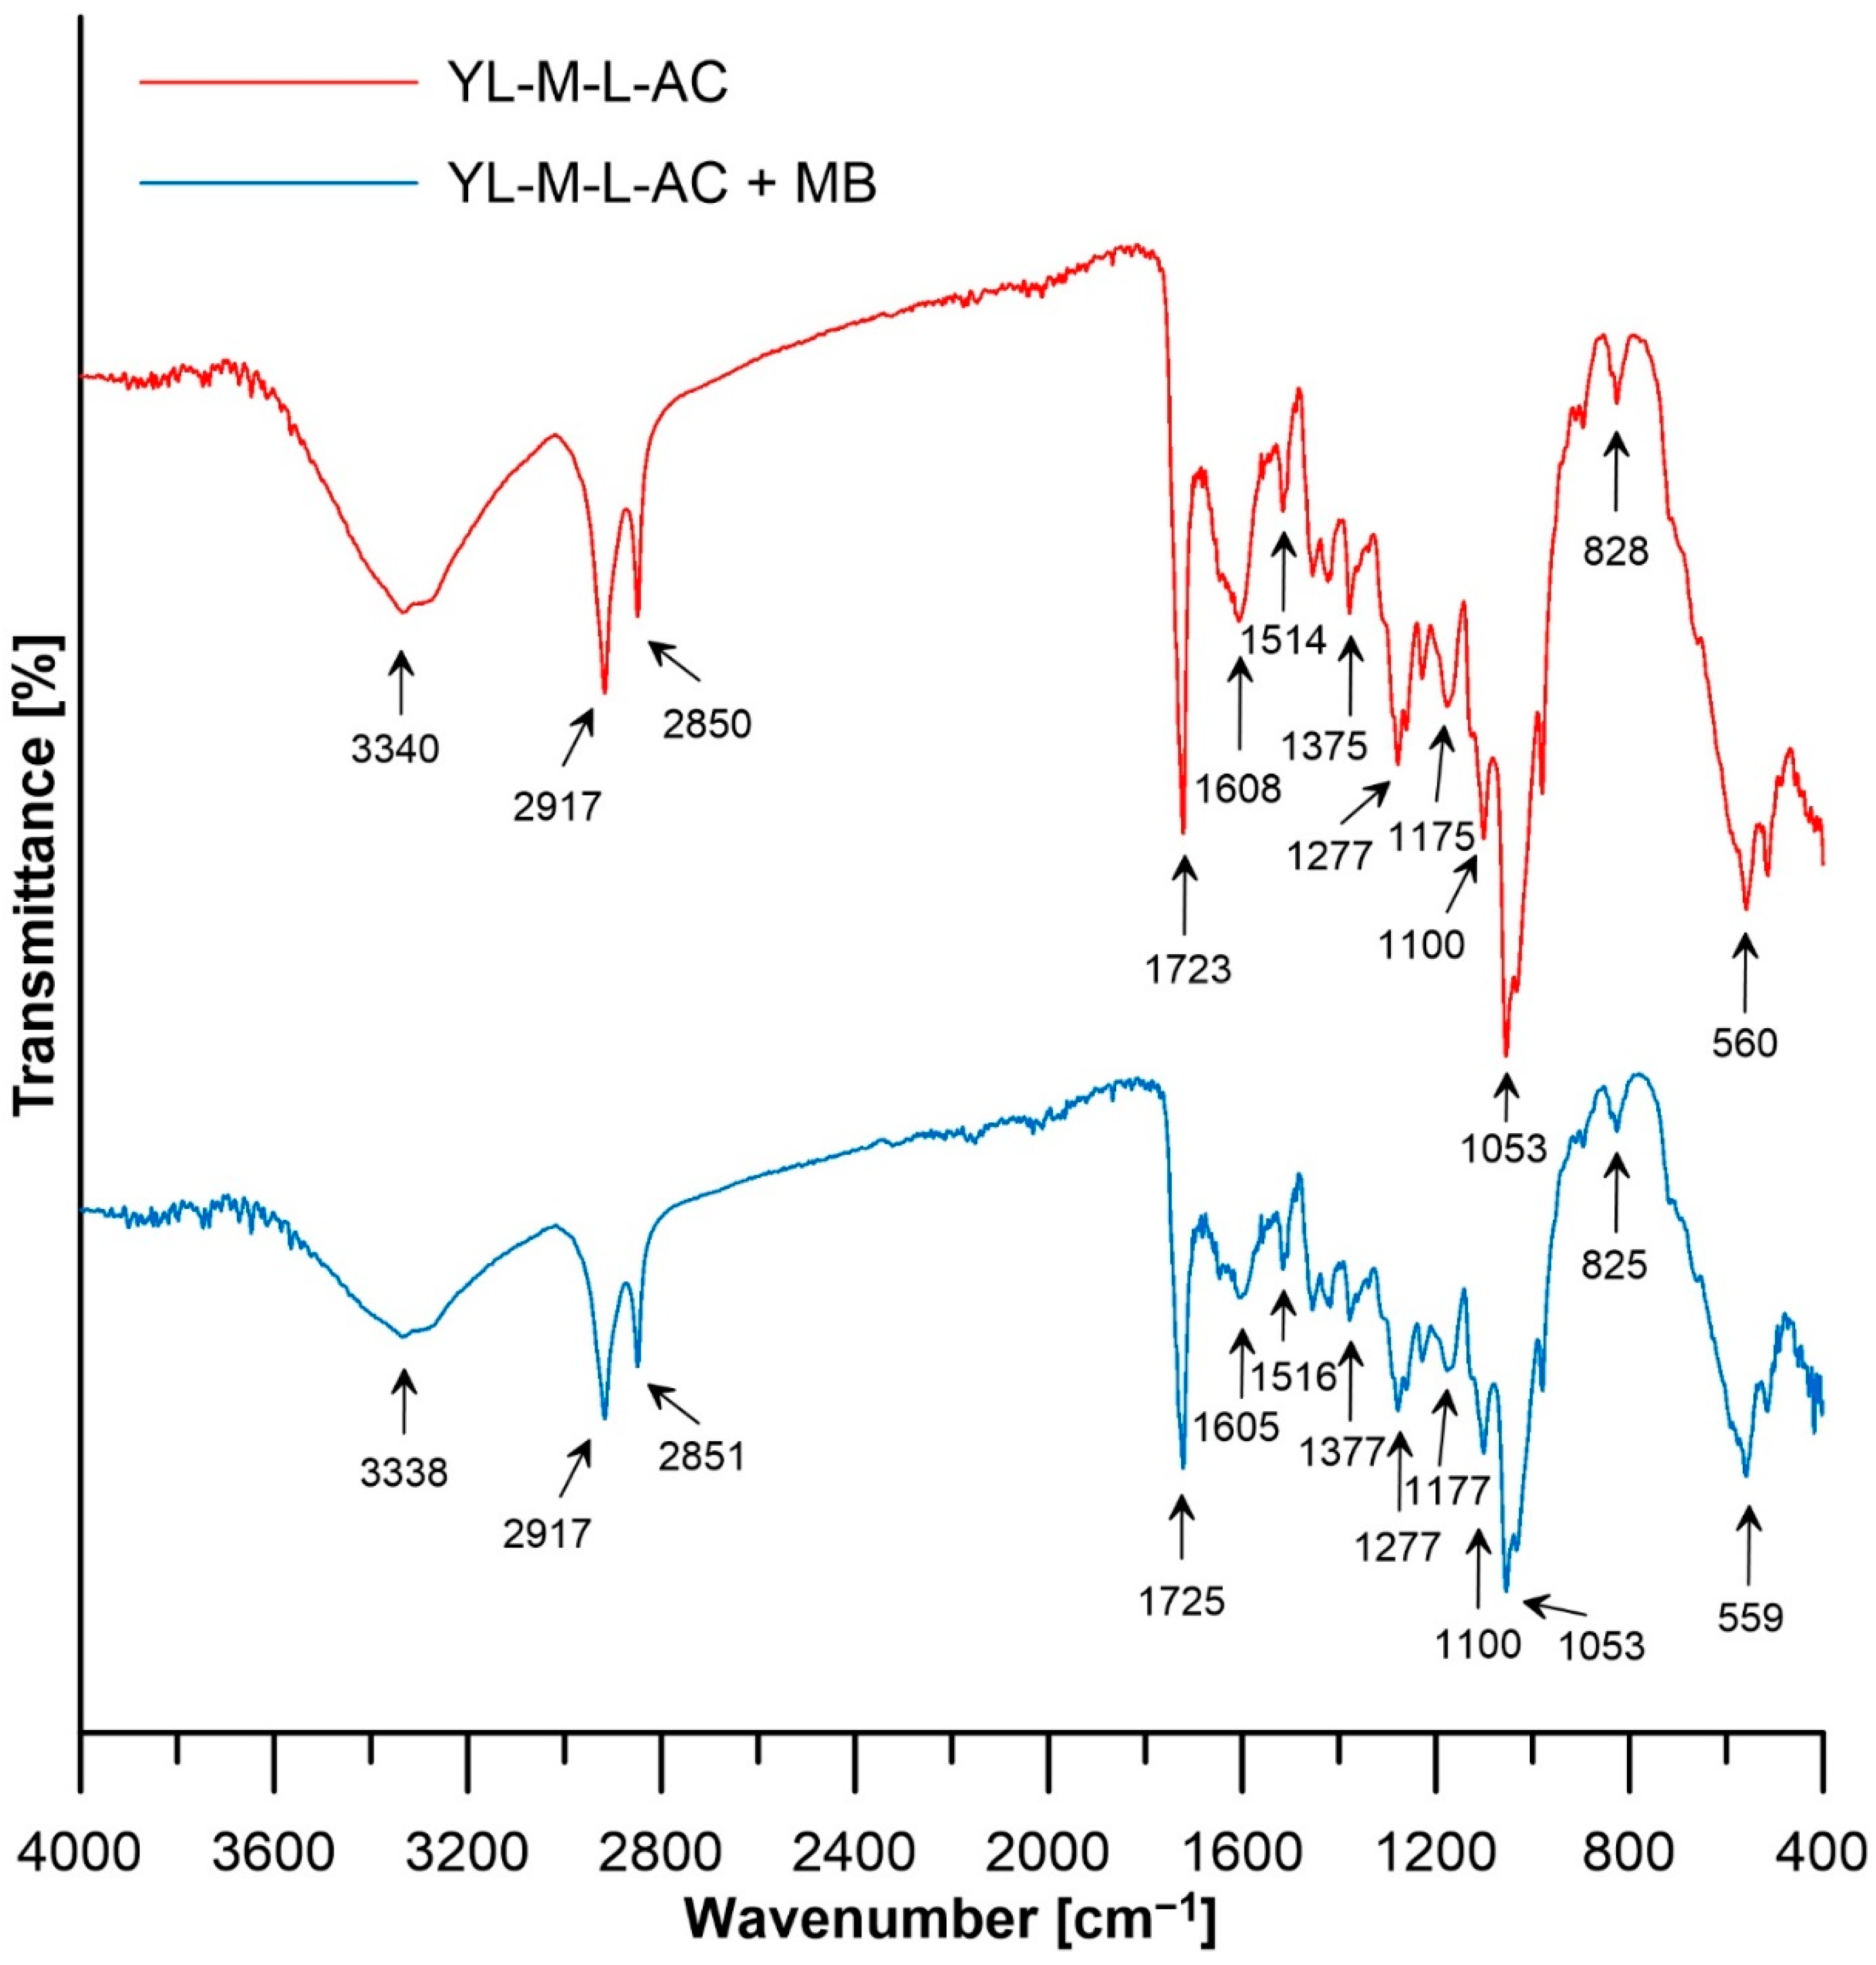
Figure 1. MB removal process by YL-M-L-AC: (A) beginning of the adsorption, (B) end of the adsorption.
Applsci 14 00655 g001
Figure 2. Thermal analysis of dried lotus pods (argon).
Applsci 14 00655 g002
Figure 3. SEM–EDX analysis of YL-M-L-AC: (A,B) before sorption, (C,D) after MB sorption.
Applsci 14 00655 g003
Figure 4. FTIR analysis of YL-M-L-AC before and after MB sorption.
Applsci 14 00655 g004
Figure 5. VSM analysis of YL-M-L-AC.
Applsci 14 00655 g005
Figure 6. Zero point charge (pHZPC) of YL-M-L-AC.
Applsci 14 00655 g006
Figure 7. Adsorption of MB on YL-M-L-AC: (A) C0 = 250 mg/dm3, T = 25 °C (adsorption process), (B) t = 24 h (C0 impact studies), T = 25 °C, (C) t = 24 h, T = 25 °C (degree of MB removal).
Applsci 14 00655 g007
Figure 8. Nonlinear fitting plots of isotherm models, t = 24 h, T = 25 °C.
Applsci 14 00655 g008
Figure 9. Kinetic models for MB adsorption on YL-M-L-AC, C0 = 250 mg/dm3, T = 25 °C.
Applsci 14 00655 g009
Figure 10. Nonlinear fitting plots of the modified Langmuir model, t = 24 h, C0 = 50–250 mg/dm3.
Applsci 14 00655 g010
Figure 11. Desorption MB from YL-M-L-AC, C0 = 250 mg/dm3, T = 25 °C.
Applsci 14 00655 g011
Table 1. FTIR spectra of YL-M-L-AC before and after MB sorption.
Wavenumber (cm−1)Functional GroupReference
3000–3675Stretching vibrations of –OH groups[41]
2916νasym CH2[42]
2850–2851νsym CH2[43]
1723–1725Stretching C=O[44]
1648C–N axial deformation and C–O bonding[44]
1605–1608C=O vibrations[45]
1514–1516C=C[46]
1375–1378C-N stretching vibration/N-H bending vibration[47]
1277Aromatic ring vibration and aromatic C-O stretching[48]
1175–1177Alcohol C–O stretches, ethers, and carboxylic acids[48]
1100The stretching of the C–O–C bond[49]
1053The stretching vibrations of C–O[49]
1053–1025OH groups in sugars or C–O–C stretching vibrations in lignin or hemicellulose, δ C–H bonding of aromatic ring, S=O stretching[50,51,52]
828–825Represent the presence of sugars, mainly monosaccharides and deformation band δ(C–H)[53]
600–400Deforming vibrations from C-N-C[54]
Table 2. Comparison of investigations involving alginate and its composites in the removal of MB.
Adsorbentqe [mg/g]Reference
Alginate/polyvinyl alcohol–kaolin composite30.8[62]
SA/zeolite/Fe3O4 composite181.8[63]
Sugarcane bagasse biochar and alginate composite30.1[64]
Starch–humic acid composite hydrogel beads110.0[65]
Magnetic Fe3O4-nanoparticle-loaded guava leaves powder impregnated into calcium alginate hydrogel beads136.7[66]
Alginate/Clin/Fe3O4 nanocomposite bead12.5[67]
Alginate/almond peanut biocomposite22.8[68]
Magnetic alginate beads106.4[69]
Graphene oxide–montmorillonite/sodium alginate (GO–MMT/SA) aerogel beads150.7[70]
MXene/sodium alginate gel beads92.2[71]
YL-M-L-AC32.1This study
Table 3. Adsorption isotherm parameters for the adsorption of MB onto YL-M-L-AC, t = 24 h, T = 25 °C.
Isotherm ModelParameters
LangmuirARE [%]R2qm [mg/g]KL [dm3/mg]
7.470.988947.940.021
FreundlichARE [%]R2KF (mg1−(1/n)(dm3)1/ng−1)1/n
3.410.99592.8650.538
TemkinARE [%]R2KT [dm3/g]B [kJ/mol]
9.760.97770.2569.643
D–RARE [%]R2Kad [mol2/kJ2]qd [mg/g]
15.910.94820.006935.18
Table 4. Parameters of kinetic models for MB adsorption on YL-M-L-AC, C0 = 250 mg/dm3, T = 25 °C.
Kinetic ModelParameters
Pseudo-first order rateARE [%]R2q1 [mg/g]k1 [1/min]
6.220.976130.461.783
Pseudo-second order rateARE [%]R2q2 [mg/g]k2 [g/(mg·min)]
1.140.998932.370.0837
ElovichARE [%]R2α [mg/(g·min)]β [g/mg]
9.900.9439765.80.243
Weber–MorrisARE [%]R2IKid
18.860.805717.53.70
Table 5. Parameters of thermodynamics for MB adsorption on YL-M-L-AC, C0 = 50–250 mg/dm3, t = 24 h.
T [°C]qe [mg/g]
(C0 = 250 mg/dm3)
KMLΔG° [kJ/mol]ΔH° [kJ/mol]ΔS° [J/molK]
2532.10914.63−16.894−36.447−65.616
3026.02719.04−16.566
3523.67564.12−16.238
4023.64453.15−15.910
Disclaimer/Publisher’s Note: The statements, opinions and data contained in all publications are solely those of the individual author(s) and contributor(s) and not of MDPI and/or the editor(s). MDPI and/or the editor(s) disclaim responsibility for any injury to people or property resulting from any ideas, methods, instructions or products referred to in the content.

