Article

Integrating Root Morphology Based on Whole-Pullout Test of Model Roots: A Case Study

1
School of Civil Engineering, Southwest Jiaotong University, Chengdu 610031, China
2
Sichuan Highway Planning, Survey, Design and Research Institute, Ltd., Chengdu 610041, China
*
Author to whom correspondence should be addressed.
Appl. Sci. 2024, 14(2), 764; https://doi.org/10.3390/app14020764
Submission received: 7 December 2023 / Revised: 12 January 2024 / Accepted: 16 January 2024 / Published: 16 January 2024

Abstract

:
To investigate the sensitivity and significance of different morphological characteristics of plant root systems on vertical pullout resistance, this study considered four main influencing factors: the number of lateral roots, taproot length, the branching angle of the lateral root, and the unit weight of the soil around the root. PC plastic model roots were employed to conduct a vertical pullout orthogonal experiment. A comprehensive μ X theoretical analysis method based on the whole root system pullout test was applied for a stress analysis on root segments. Based on the results, the factors affected the vertical pullout resistance of plant root systems in the order of number of lateral roots > taproot length > unit weight of soil around the root > branching angle of the lateral root. When the number of lateral roots increased from 2 to 3, the vertical pullout resistance increased by 64%. Also, when the taproot length increased from 50 to 60 cm, the vertical pullout resistance increased by up to 46%. Furthermore, the unit weight of soil around the roots had a positive linear correlation with vertical pullout resistance. Based on the results, the number of lateral roots and the taproot length were the primary factors affecting the magnitude of the root system’s vertical pullout resistance. When selecting plants for slope protection, plant types with a larger number of lateral roots and longer taproots should be considered as the two most significant factors for achieving a better slope protection methodology.

1. Introduction

As the construction of infrastructure such as highways, railways, and hydropower stations in western China becomes increasingly sophisticated, a considerable number of embankments and excavated road cuts will require protection from slope instability, collapses, rockfall, and other disasters [1]. Traditional slope protection methods such as shotcrete, rubble masonry-retaining walls, and shotcrete–soil nail/anchor support, are safe and effective slope reinforcement techniques. However, these techniques often result in “gray” structures that stand independent of the surrounding natural landscape. This not only leads to environmental discord but also exerts an influence on the underlying soil structure. Additionally, their construction generates a significant amount of carbon emission, adversely impacting the environment [2,3]. This contradicts current trends toward sustainable development in ecological landscaping [4]. Moreover, in the long run, the effectiveness of slope protection will be closely related to the durability of the used materials [5], which often results in poor sustainability. Vegetative slope protection, as an ecological slope protection technique, not only increases slope stability but also reduces soil erosion and carbon emissions, effectively restores the engineering surface, and offers shorter construction periods and lower costs. This approach allows the slope to form an ecological community that harmonizes with the surrounding landscape [6,7]. Consequently, it is widely applied in slope protection for embankments, roadbeds, and other engineering projects.
Vegetative slope protection methods primarily achieve stabilization through the mechanical soil reinforcement effects of root systems and the hydrological soil reinforcement effects of vegetation. The former mainly includes deep root anchoring and shallow root reinforcement, while the latter primarily involves reducing pore pressure, mitigating splash erosion, and controlling runoff [7,8,9]. There has been considerable research on the mechanical soil reinforcement effects of root systems. Wang et al. [10] suggested that an increase in the number of roots significantly enhances the shear strength of a root–soil composite. Kong et al. [11], Lian et al. [12], and Zhou et al. [13] considered that the distribution pattern of roots notably affects the shear strength of a root–soil composite, with the most pronounced enhancement observed when roots are intermixed or intersected. Xu et al. [14], Wang et al. [10], and Ajedegba et al. [15] discovered a positive correlation between the development of lateral roots and a root–soil composite’s resistance to shear deformation. Wang et al. [16] argued that in combined root systems, front lateral roots, taproots, and rear lateral roots contribute to soil shear strength, in that order, and they quantified the impact of root inclination angles on soil shear strength. Cardoza et al. [17] conducted direct shear tests on three types of soil with different unit weights to study the influence of root systems on soil cohesion, internal friction angle, and shear strength. However, direct shear tests can only measure the local root systems at the shear plane and do not fully demonstrate the overall mechanical soil reinforcement effects of root systems. Pullout tests of root–soil composites effectively measure the frictional interaction at the root–soil interface and the tensile resistance of plant roots themselves, serving as an effective method for studying the mechanical soil reinforcement effects of plant root systems [18].
Research on the vertical pullout resistance characteristics of plant root systems has yielded significant results to date. Bransby et al. [19] considered that the branching angles of lateral roots and the taproot length significantly influence the maximum pullout resistance, with deeper taproots yielding better pullout resistance. Ali et al. [20] suggested that the pullout resistance of plant root systems increases with the number of lateral roots and the angle between roots. Yang et al. [21] and Capilleri et al. [22] demonstrated, through pullout tests, a strong positive correlation between the pullout-bearing capacity of plant root systems and root diameter. Through vertical and 45°-inclined pullout tests, Yang et al. [23] discovered that the pullout resistance of root systems is related to morphological indicators such as root diameter, root length, and root surface area in a power function relationship. Among these, the root surface area has the most significant impact on pullout resistance. Additionally, the direction of pullout is another factor to consider. Zhou et al. [24] noted that in root–soil composites, the pullout resistance of plant root systems is linearly correlated with the root crown width, the taproot length, and the number of lateral roots, with the primary influencing factors for vertical pullout resistance being the taproot length and the number of lateral roots. Ennos et al. [25] and Mickovski et al. [26] considered that in root–soil composites, the pullout resistance of root systems increases in a power function relationship with the increase in root diameter and burial depth.
The aforementioned studies demonstrate that the morphological characteristics of plant root systems such as the number of lateral roots, the taproot length, the root diameter, and the branching angle of the lateral root, all influence the pullout resistance of the root system. Contemporary research methodologies suggest that mathematical models can be established by employing machine learning techniques, multiple regression analyses, and 3D response surface analyses [27,28,29,30]. In these models, different morphological characteristics of the plant root system are used as independent variables and the vertical pullout resistance of the root system is used as the output response. Continuous training and optimization of these models allow for the identification of the most sensitive factors and the best combination of these factors. This approach enables the prediction of the vertical pullout resistance of the root system under different combinations of factors. To establish these models, extensive experimental research is required to first understand the relationship between the morphological characteristics of the plant root system and vertical pullout resistance, thereby providing input samples for the model. The number of lateral roots, the taproot length, the branching angle of the lateral roots, and the unit weight of the soil around the root are representative factors that significantly affect this resistance. Existing studies predominantly employed real plant root systems obtained through field sampling when conducting laboratory experiments. However, the plant roots’ properties decreased with the decrease in water content in the roots after excavation, leaving the soil [21]. Additionally, individual variations due to site conditions and human factors cause uncertainties, leading to poor experimental controllability. Consequently, this results in issues of high experiment variability and low precision.
To address these challenges, this paper employs PC plastic model roots to simulate plant roots. An L16(45) indoor pullout orthogonal experiment was conducted by considering the number of lateral roots, taproot length, the branching angle of the lateral roots, and the unit weight of soil around the root as four influencing factors. This study aims to investigate the sensitivity and significance of factors influencing the vertical pullout resistance of plant root systems, to analyze the effects of each factor, and to discuss the experimental results using a sensitivity index and a comprehensive μ X theoretical analysis method based on the whole root system pullout test in hopes of providing reliable samples for establishing models using machine learning techniques. The findings of this research can also guide the selection of root morphologies in vegetation slope protection projects.

2. Materials and Methods

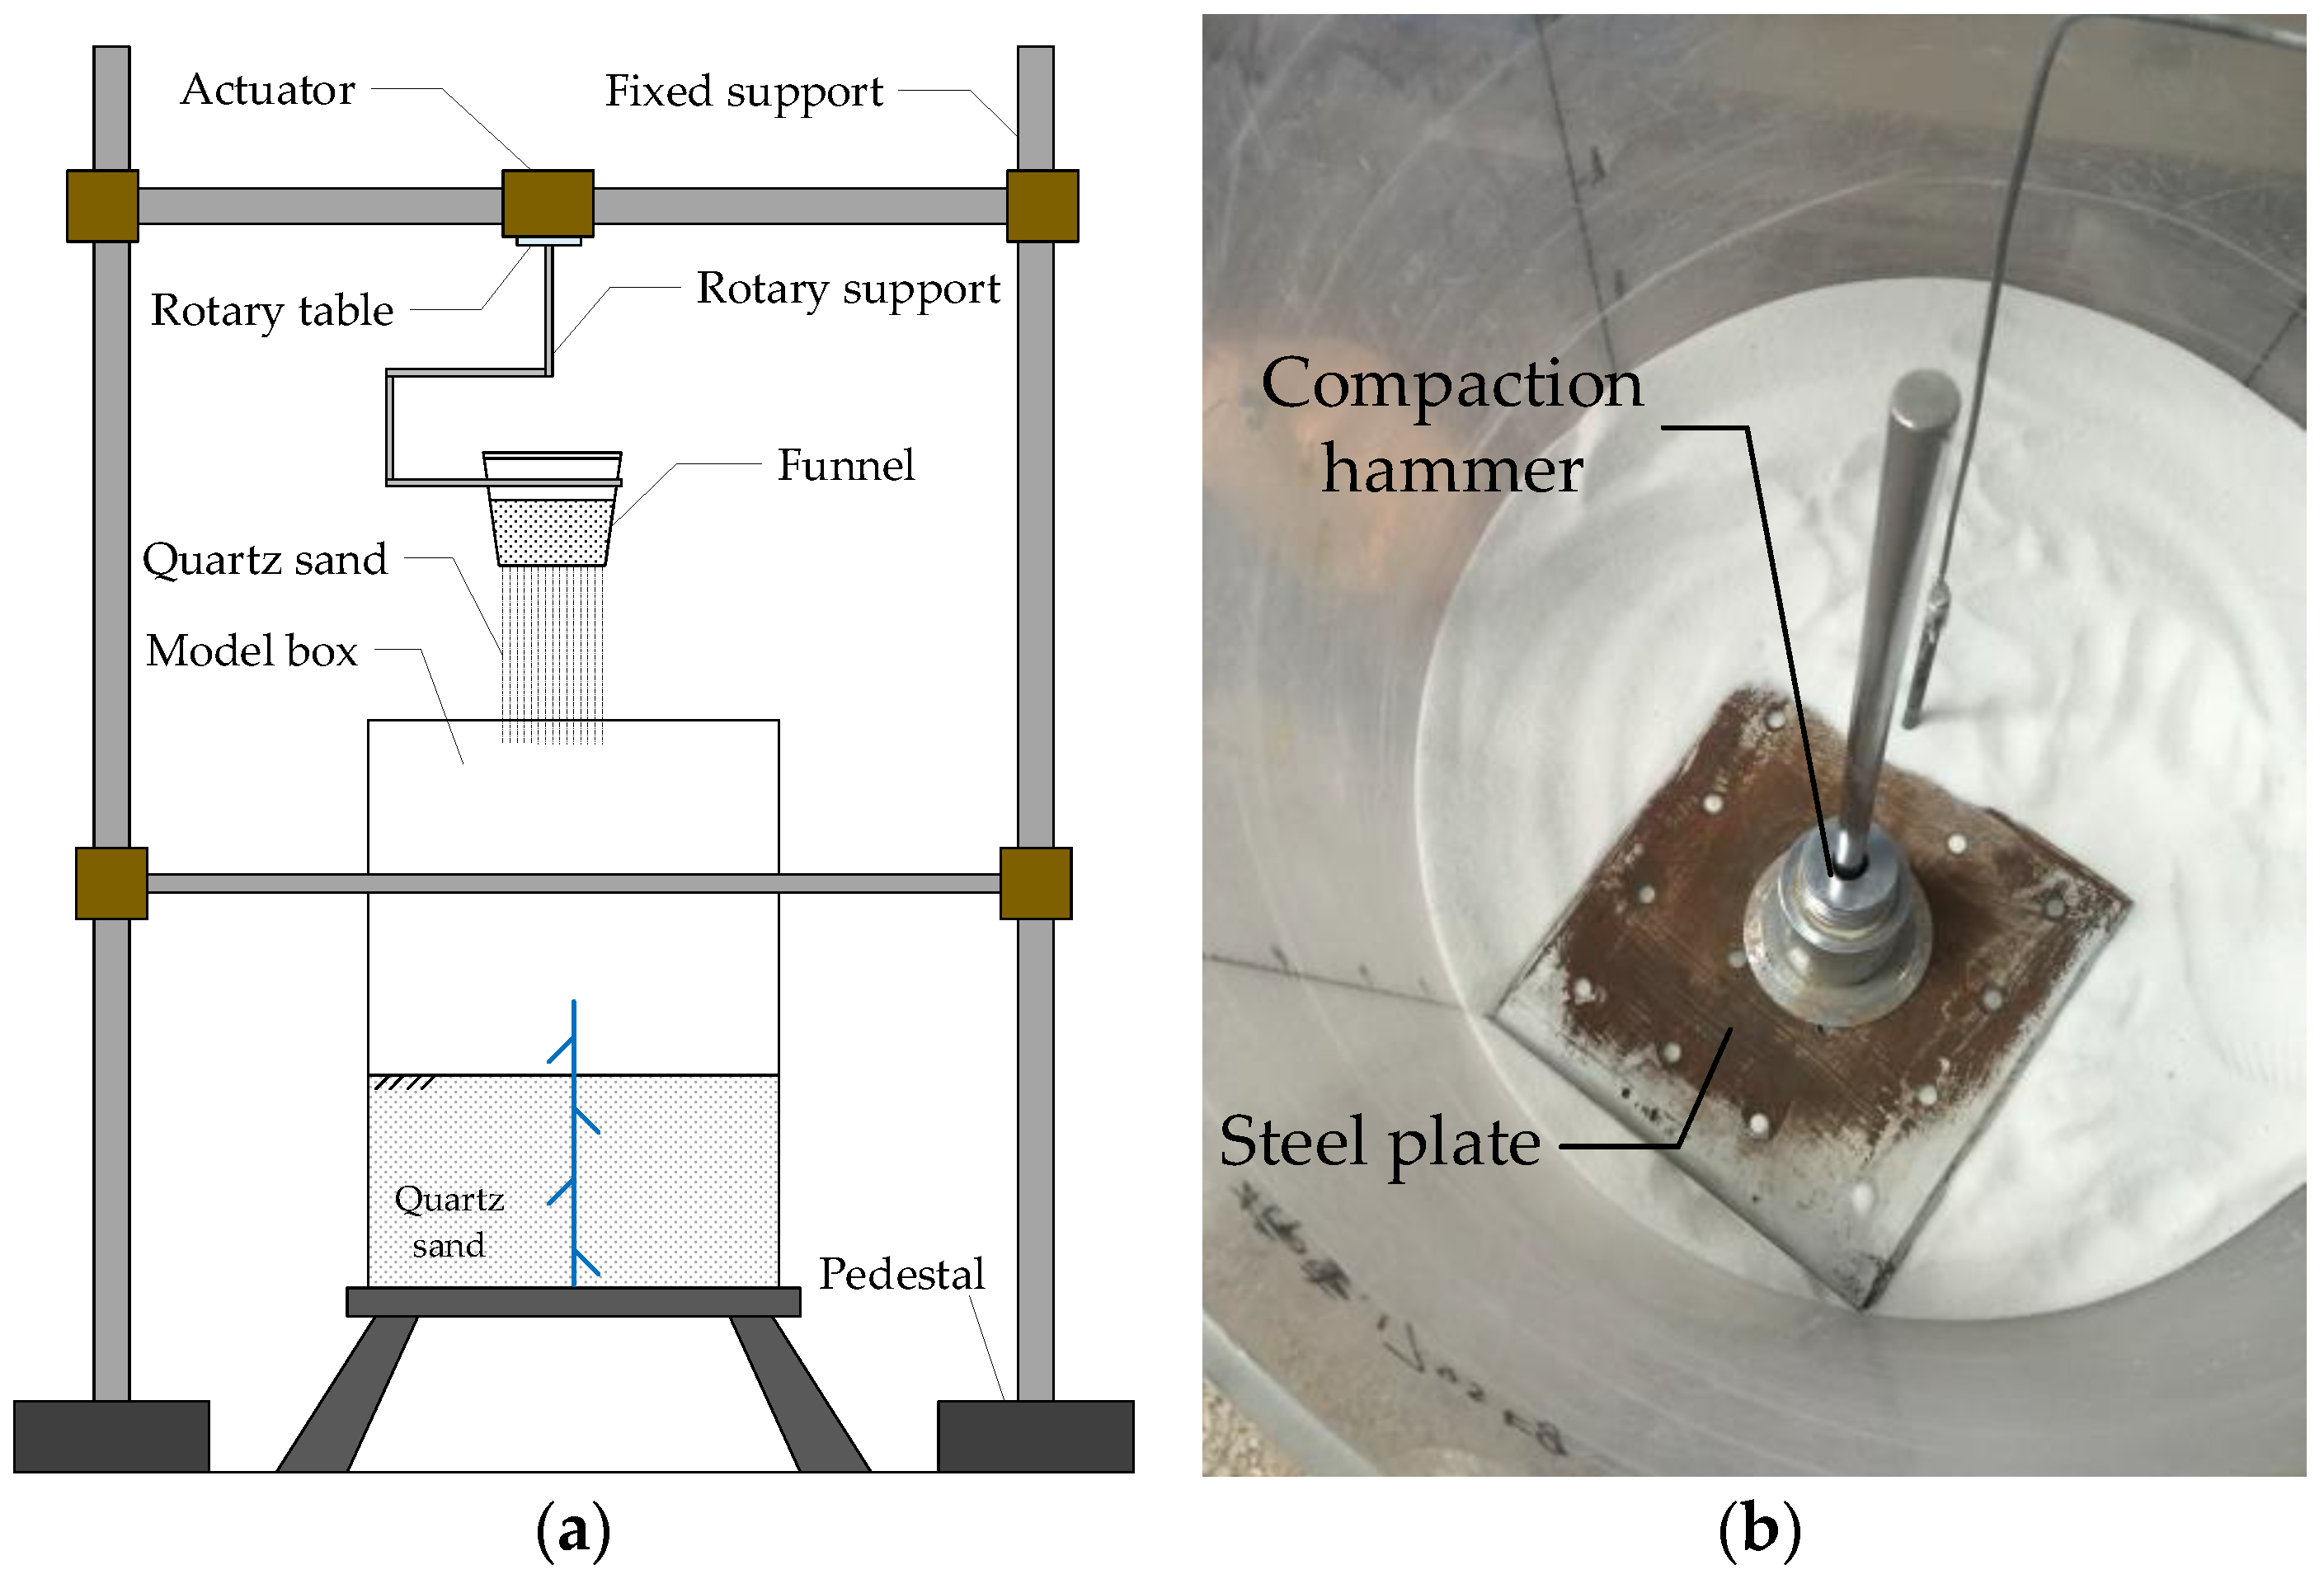
2.1. Experimental Materials and Apparatus

The materials used in this experiment mainly included two types: quartz sand and PC plastic tubes. Forty-mesh quartz sand was employed to simulate the slope soil, and its uniform and pure characteristics helped to reduce experimental variability. The internal friction angle (φ) of the quartz sand was determined to be 33.48° through indoor direct shear tests. PC plastic tubes were used to simulate plant root systems, with an outer diameter of 8 mm and a wall thickness of 1 mm. The elastic modulus (E) of the PC plastic tube was measured as 2.26 GPa using a DH3816 static strain tester (Donghua Zhuoyue Technology Co., Ltd., Chengdu, China), and was comparable with the elastic modulus of commonly used slope protection plants such as Lolium perenne L., Cynodon dactylon (L.) Persoon, and Asian Palmyra palm. According to the experimental plan, the length of the taproot of the PC plastic model was trimmed, and then the lateral roots were arranged sequentially, starting from 5 cm away from the upper end of the taproot. The length of the lateral roots was 5 cm, and the spacing between two lateral roots was 10 cm. An example of the root model is shown in Figure 1a. The experimental model box had a cylindrical barrel shape, considering the boundary effects, with dimensions of 80 cm × 58 cm × 1 cm (barrel height × outer diameter × wall thickness). It was made of high-strength organic glass, facilitating real-time monitoring during the experiment. The fixed support was made of steel, ensuring the firmness and stability of the model box during loading. The loading device consisted of steel wire ropes, pulley sets, hooks, and weights. The displacement measurement device included two dial gauges, connected to the model root through wires, and was used to measure the displacement at both the upper and lower ends of the model root. The difference in displacement between the two ends represents the deformation of the model root under load. Taking an example with a taproot length of 40 cm, 4 lateral roots, and a lateral root branching angle of 45°, the experimental setup and model roots are shown in Figure 1b.

2.2. Experimental Design

2.2.1. Levels of Experimental Factors

This experiment considered three morphological features: taproot length, number of lateral roots, and branching angle of the lateral root. These three morphological features and the unit weight of soil around the root were considered the four main influencing factors in this study. The unit weight of soil around the root was determined at different compaction frequencies every 10 cm during the quartz sand filling process. According to reference [31], the typical depth of plant root systems ranges from 0 to 60 cm. In the depth range of 0 to 20 cm below the quartz sand surface, the root–soil interface friction resistance was minimal. From depths of 20 to 60 cm, the root–soil interface friction resistance was significant, and it decreased again from depths of 60 to 80 cm. References [32,33] suggested that the branching angle of the lateral root generally ranges from 15° to 60°. To simplify the analysis, each factor was considered at four levels: taproot lengths of 40 cm, 50 cm, 60 cm, and 70 cm; 1, 2, 3, and 4 lateral roots; soil compaction frequencies of 10, 20, 30, and 40; and lateral root branching angles of 15°, 30°, 45°, and 60°. Conducting 256 experiments using a method wherein the variables are controlled would be cost-intensive, laborious, and challenging for quick and effective analyses, therefore, representative combinations were selected based on orthogonality from the aforementioned experimental plan. The rational design of an orthogonal experiment allowed for understanding of the sensitivity and significance of the plant root morphology and the unit weight of soil around the root on the overall vertical pullout resistance of the root system. An L16(45) orthogonal table was employed, with one column left blank for the error. Factors A, B, C, and D are the compaction frequency, the number of lateral roots, the taproot length, and the branching angle of the lateral root, respectively. The levels of each factor in the orthogonal experiment are shown in Table 1.

2.2.2. Orthogonal Experimental Design

The orthogonal experimental design is presented in Table 2. Within the 16 test groups, three parallel experiments were conducted for each group, totalling 48 trials. The sequence of experiments was determined by drawing lots in order to minimize errors. The experiments adopted equally spaced incremental loading without unloading throughout the process. In reference to the regulations for shallow plate load testing in the “Code for Design of Building Foundation” (GB 50007-2011 [34]) and the regulations for testing of anchors in the “Technical Code for Building Slope Engineering” (GB 50330-2013 [35]), the following test regulations were established: (1) The loading was classified into increments of 10 or more. The initial load for each increment was tentatively set at 0.1 times the estimated ultimate pullout force. (2) Each load increment was held for 3 min, with displacement data from the dial gauges read every minute. (3) The reading was considered stable when the displacement readings from three consecutive readings did not show any sustained changes. Then, the next level of loading was applied. (4) A root–soil system was considered to have failed if the displacement readings continuously increase over three consecutive readings and the rate of increase is significant, or if the model root completely pulled out despite the above conditions. After system failure, the test was terminated.

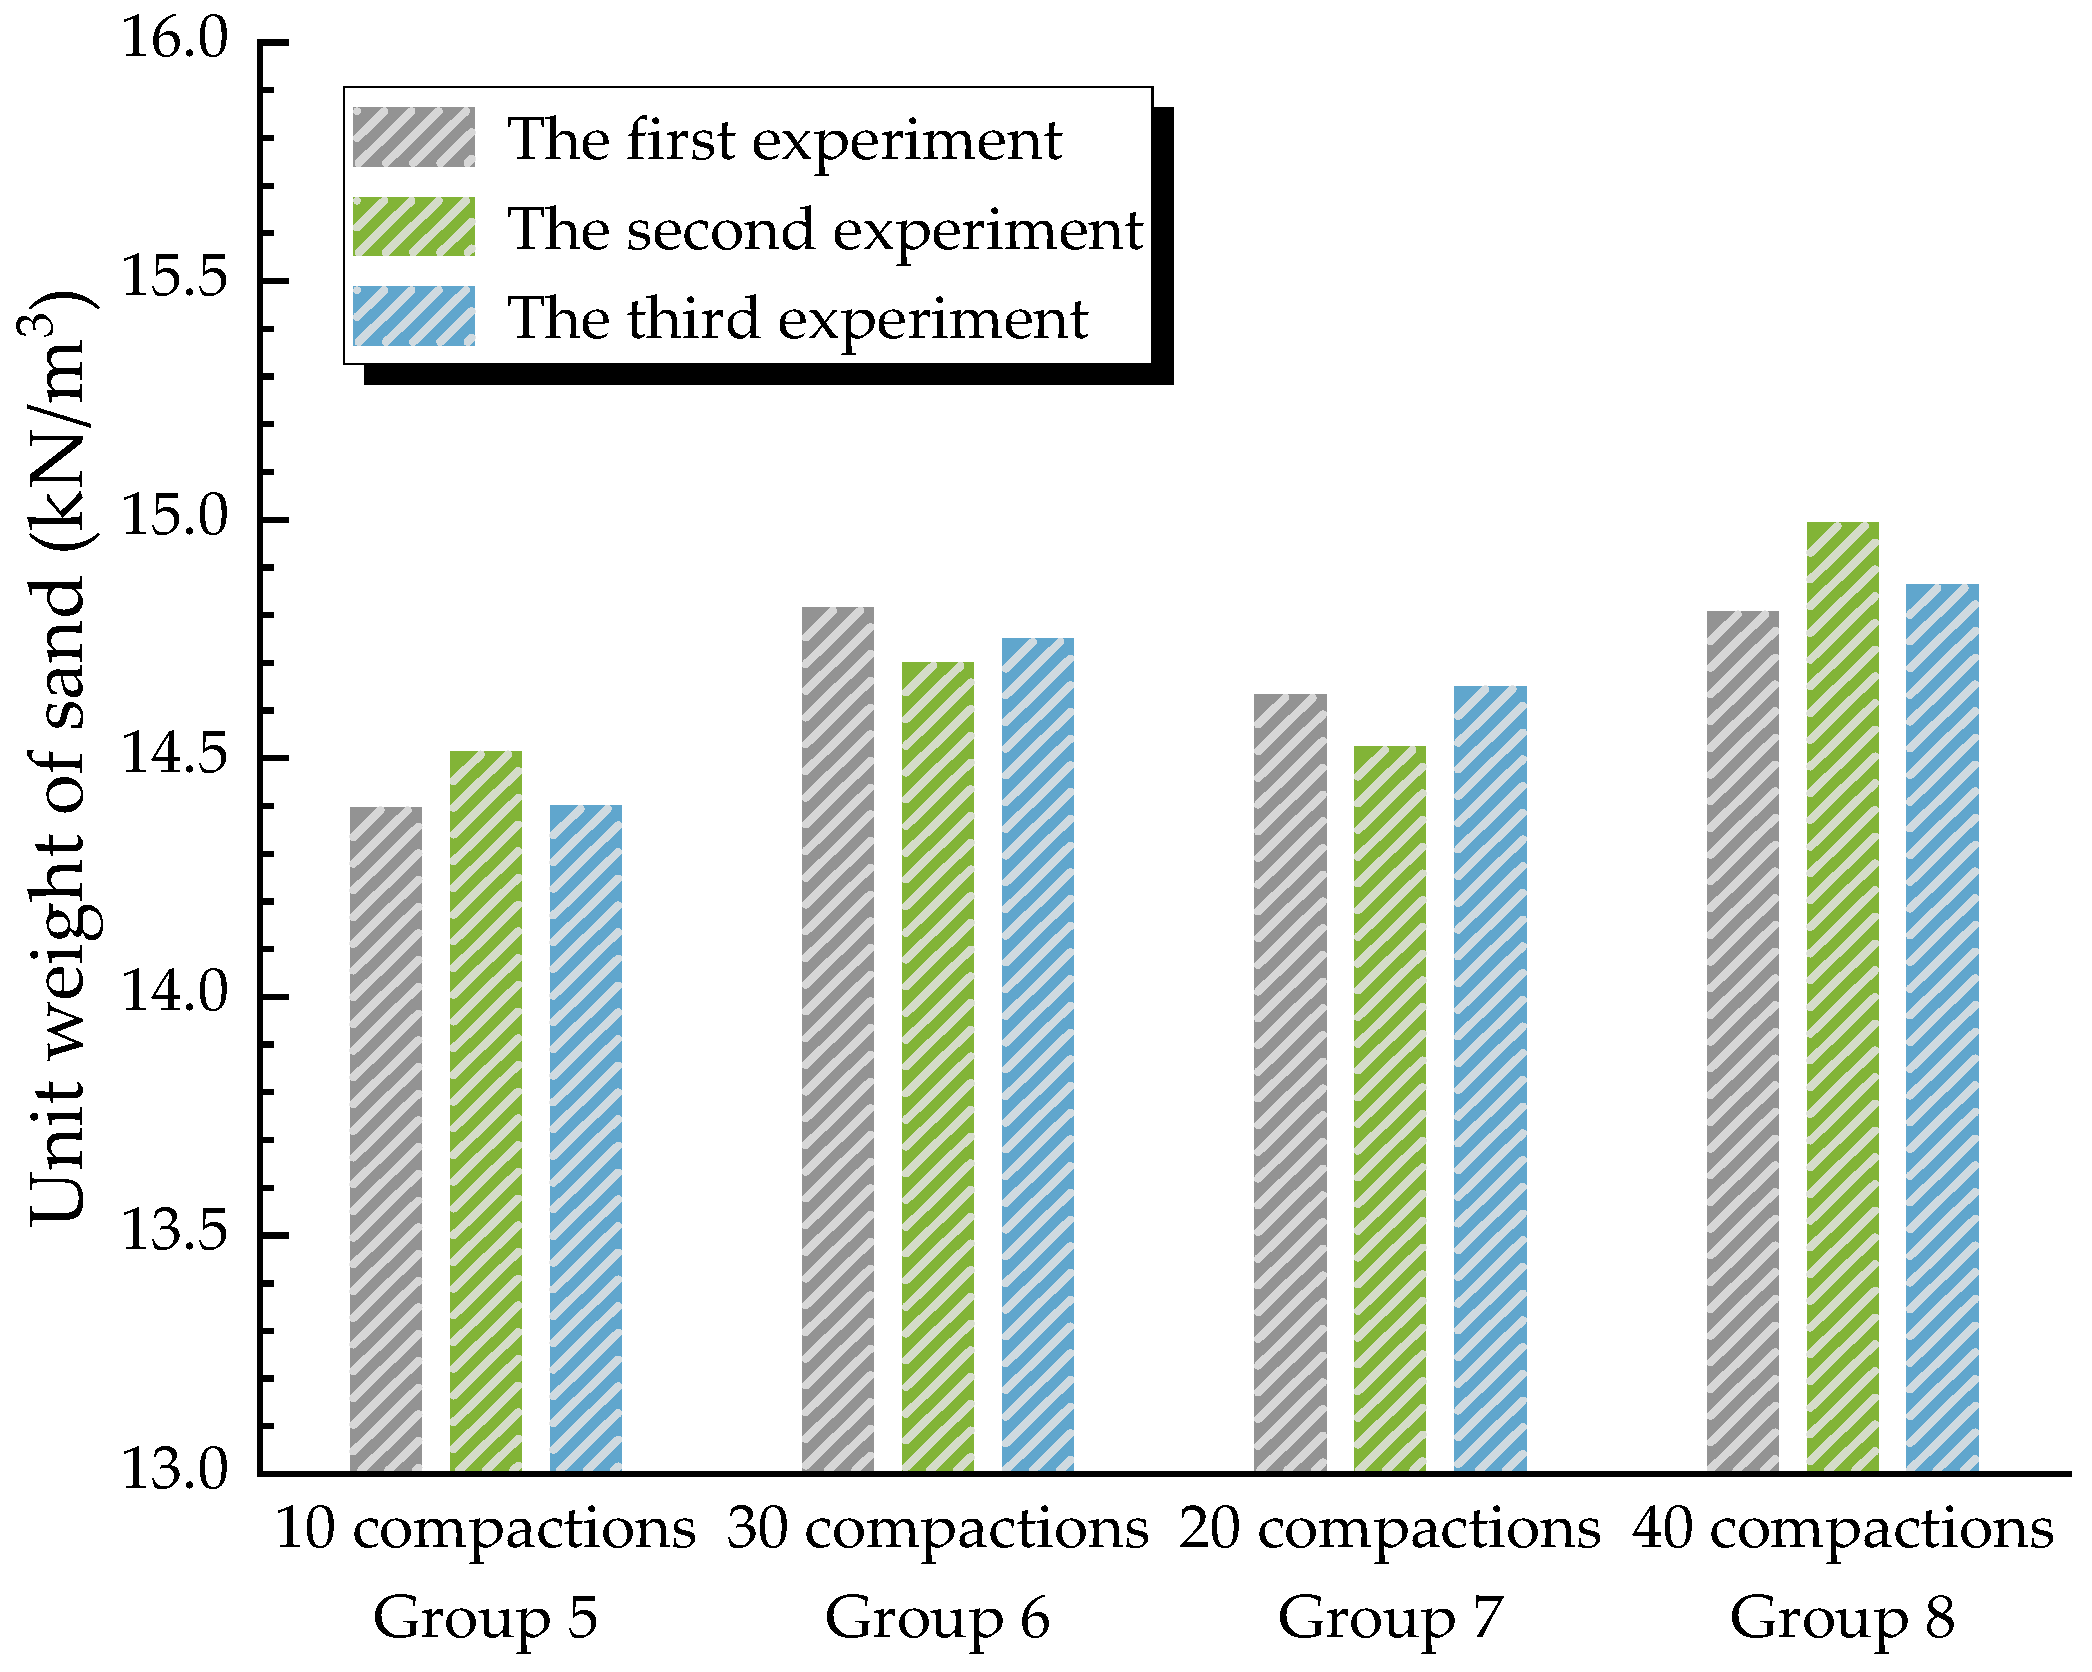
2.2.3. Experimental Procedure

(1) Experimental Preparation. Prepare the materials used in the experiment, including the steel wire rope, the pulleys, and the dial gauges. Check the dial gauges and the operational status of the pulley system.
(2) Fabrication of the Model Root. The fabrication of the model root is the focal point of this experiment. According to the experimental scheme, measure the taproot length of the model root, mark the locations for the lateral roots, with each lateral root being 5 cm in length. The first lateral root emerges at a distance of 5 cm from the upper end of the taproot. Subsequently, each lateral root is spaced at intervals of 10 cm, and all lateral roots are positioned in the same plane as the taproot. To better simulate the changes in the branching angle of a lateral root in soil under tensile conditions, flexible elastic ropes are used to bind and fix the lateral roots in place.
(3) Securing the Model Root System. Place the fabricated model root in the center of the model box, tying the lower end with lead wire passing through the bottom of the model box. Use a homemade L-shaped wire to secure the model root, ensuring it remains upright and does not shift during sand filling. Connect the lower dial gauge.
(4) Filling and Compacting the Sand. The filling of sand in the model box was a critical step in the experiment, requiring each test to maintain the same initial density of sand (before compaction). In this experiment, the ‘sand pourer’ method was employed to layer the sand to the required depth. Previous studies indicate that when the falling distance exceeds 40 cm, alterations in the flow rate have minimal impact on the relative density [36,37,38,39]. With a constant sand output flow rate, the relative density of the sand increases with the falling distance. However, the rate of increase gradually diminishes. When the falling distance reaches 60 to 90 cm, the relative density essentially remains unchanged. During the experiments, a custom-made sieve barrel was used to fill the sand, consistently maintaining a falling distance of over 60 cm. The schematic diagram of the sand pourer method is shown in Figure 2a. To simplify the illustration, the dial gauges at the top and bottom of the model root and the fixed steel strands were omitted.
After every 10 cm of sand filled, the surface was gently leveled. Compaction was performed using a 2.5 kg compaction hammer with a falling distance of 35 cm, and a steel plate was placed under the hammer during compaction, as illustrated in Figure 2b. Taking the fifth to eighth groups of experiments as examples, the unit weight of sand after filling and compaction is presented in Figure 3.
(5) Installation of the Loading Device. Connect the upper dial gauge, and after installing the loading device, zero both the upper and lower dial gauges.
(6) Loading and Reading. Once all experimental apparatuses are properly installed, follow the experimental scheme to slowly pour the pre-weighed quartz sand into the loading bucket and record the displacement values of the model root at specified time intervals, observing and documenting the experimental process.
(7) Experiment Conclusion. After the experiment is completed, remove the test load, shovel out the quartz sand from the model box, take out the model root, dismantle the dial gauges, and prepare for the next experiment.

3. Results

3.1. Experimental Data Processing

After completing the experiments, load–displacement curves (Q-S curves) were plotted based on the experimental data. If the load–displacement curve showed a steep upward trend, the load (Q) at the point of abrupt displacement change was selected as the vertical pullout resistance (T) of the root system. Taking Figure 4a as an example, the Q-S curve for the A1B2C3D2 scheme exhibited a steep ascending trend in all three trials. The first two trials showed a first inflexion point at Q = 60 N, and the curve for the third trial had an inflection point at Q = 65 N. Therefore, the three measured T values for the A1B2C3D2 scheme (the first experiment group) were 60 N, 60 N, and 65 N, respectively. Similarly, for the scheme A1B3C1D4 shown in Figure 4b, the three measured T values were 65 N, 70 N, and 65 N.
If the Q-S curve rose slowly and the displacement (S) readings continued to increase for three consecutive readings within 3 min at a certain load, the next load was applied. The corresponding change in S readings was observed, and if the rate of increase became significant, the current Q value was taken as T. Using Figure 4c as an example, the Q-S curve for the A2B4C3D3 scheme showed a gradual upward trend with no apparent inflection points. However, the S readings for all three trials at Q = 140 N within 3 min continuously increased, and the rate of increase became significant. Therefore, the three measured values for the A2B4C3D3 scheme (the third experiment group) were all T = 140 N. Similarly, for the scheme A3B3C2D3 shown in Figure 4d, the three measured T values were 90 N, 90 N, and 100 N.
For each set of experiments, the range and the mean of the three measured T values were compared. If the range was less than 30% of the mean value, in accordance with the regulations from the section on shallow plate load testing specified in the “Code for Design of Building Foundation”, the mean value was taken as the characteristic value of the vertical pullout resistance. Any significantly unreasonable values were considered due to error factors and were discarded. Thus, for the first experiment group, the range of measured values (5 N) was less than 30% of the mean (19 N), and the characteristic value of vertical pullout resistance was the mean of the measured T values, which was 61.7 N. Similarly, for the third experiment group, the range of measured values (0) was less than 30% of the mean (42 N), and the characteristic value of vertical pullout resistance was the mean of the measured T values, which was 140 N. Similarly, the characteristic value of vertical pullout resistance for the fifth experiment group was 66.7 N, and for the tenth experiment group, it was 93.3 N. The results of the remaining experimental groups are presented in Table 3.

3.2. Range Analysis

The results of the orthogonal experimental range analysis are presented in Table 4. In this table, K1, K2, K3, and K4 represent the sum of the experimental results corresponding to each level (1, 2, 3, and 4) of the respective factors in any given column. Similarly, k1, k2, k3, and k4 denote the arithmetic average of the experimental results obtained when the factors are at levels 1, 2, 3, and 4, respectively. Specifically, k i = K i / 4 i = 1,2 , 3,4 . R represents the range, calculated as R j = m a x K i m i n K i . The sensitivity of each influencing factor can be inferred from the magnitude of the range, with the order being number of lateral roots > taproot length > unit weight of soil around the root > branching angle of the lateral root. The optimal solution corresponds to the B4C4A4D4 level.

3.3. Analysis of Variance

The range analysis results do not reveal the significance of the influencing factors. However, a variance analysis can assess the significance of each influencing factor on the pullout resistance of roots. The calculated results of the pullout resistance experiments are presented, showing the deviation sum of squares, degrees of freedom, mean squares, and F-values for each factor in Table 5. It is observed that the mean square for factor D is 162.48, which is less than the mean square of the error column (442.64), indicating that the branching angle of the lateral root has a relatively small impact on the experimental results and is considered a secondary factor. It is therefore categorized as part of the error term, and the sum of squares, degrees of freedom, and mean square for the error are recalculated.
Setting the significance level at α = 0.01 , the critical value F 0.01 3,6 = 9.78 is obtained from the table. Since F B = 17.36 is greater than F 0.01 3,6 = 9.78 , it can be concluded that the influence of the number of lateral roots on the results is highly significant. Setting the significance level at α = 0.05 , the critical value F 0.05 3,6 = 4.76 is obtained, and since F 0.05 3,6 = 4.76 is less than F C = 6.38 but greater than F 0.01 3,6 = 9.78 , it can be concluded that the influence of the main root length on the results is significant. Setting the significance level at α = 0.1 , the critical value F 0.1 3,6 = 3.29 is obtained, and since F 0.1 3,6 = 3.29 is less than F A = 3.60 but greater than F 0.05 3,6 = 4.76 , it can be concluded that the unit weight of soil around the root has a certain impact on the results.
In summary, consistent with the range analysis results, the significance levels of the influencing factors in the experiment are in the following order: number of lateral roots > taproot length > unit weight of soil around the root > branching angle of the lateral root. Therefore, in vegetation slope protection projects considering the mechanical soil-anchoring effects of roots, the primary factor should be the number of lateral roots, followed by taproot length and unit weight of soil around roots, while the branching angle of the lateral root can be considered a secondary factor.

3.4. Trend Analysis of Various Factors in Resistance to Pulling

In this orthogonal model experiment, each factor was set at four levels, allowing for an analysis of the trend in vertical pullout resistance of the roots with respect to individual factors. The levels of each factor correspond to the pullout resistance, represented by the experimental indicator’s average value (ki) as shown in Figure 5.
From Figure 5a, it can be observed that as the frequency of soil compactions around the roots increases, the average vertical pullout resistance (T) also increases. Taking 10 compactions as the initial value, an increase of 10 compactions leads to a 25% growth in the average vertical pullout resistance. When the compaction frequency reaches 40, the vertical pullout resistance of the roots reaches its maximum value. Additionally, there is a significant linear correlation between the average vertical pullout resistance of the roots and the unit weight of soil around the root.
Figure 5b indicates that as the number of lateral roots increases, the average vertical pullout resistance of the roots also increases. The average pullout resistance grows by 10% when going from one to two lateral roots and then rapidly rises as the number of lateral roots increases further. When the number of lateral roots reaches four, the average vertical pullout resistance of the roots reaches the maximum value.
From Figure 5c, it can be seen that longer taproot lengths result in larger average vertical pullout resistance. The greatest increase in average pullout resistance occurs when the taproot length increases from 50 cm to 60 cm, reaching 46% growth. This suggests that within the depth range of 50 to 60 cm, the lateral frictional resistance plays a significant role in root pullout. The maximum average vertical pullout resistance of the roots is achieved when the taproot length is 70 cm.
In Figure 5d, the change in average vertical pullout resistance with increasing lateral root branching angles is not significant, and fluctuates around 85 N. This indicates that the branching angle of the lateral root has no prominent effect on vertical pullout force.
Therefore, the optimal solution is B4C4A4D4, which is consistent with the results obtained from the range analysis. The trend chart also suggests that the average vertical pullout resistance of the roots gradually increases with an increase in the number of lateral roots, taproot length, and the unit weight of soil around the root. Therefore, further increasing the number of lateral roots, taproot length, and the unit weight of soil around the root would lead to higher pullout resistance.

4. Discussion

The aforementioned study utilized orthogonal experiments and a range analysis to determine the sensitivity levels of various factors affecting the vertical pullout resistance of plant root systems. Obtained from references [29,40], the sensitivity index ( I S ) was employed to validate and calculate the sensitivity of each factor. The formula for calculating the sensitivity index is as follows:
I S = p m a x p m i n p m a x
where p m a x and p m i n represent the maximum and minimum pullout resistance, respectively, corresponding to the levels of each factor. The pullout resistance is determined by taking the experimental indicator’s average value (ki). The results of the calculations are presented in Table 6.
According to Table 6, the sensitivity index for the number of lateral roots was 0.612, making it the most sensitive factor affecting the vertical pullout resistance of plant root systems. This was followed by the taproot length and the unit weight of soil around the root, with sensitivity indices of 0.410 and 0.372, respectively. Lastly, the branching angle of the lateral root had the lowest sensitivity index, at 0.162. The order of sensitivity for each factor, as determined by the sensitivity index calculation, was consistent with the conclusions drawn from the range analysis results in Section 3.2.
This study utilized PC plastic model roots to simulate plant root systems and investigated the impact of various morphological characteristics on the vertical pullout resistance of roots. Through a variance analysis, it was found that the number of lateral roots and the taproot length had significant effects on vertical pullout resistance. These findings were similar to those obtained by Zhou et al. [24], Luo et al. [41], Li Hui et al. [42], and Wang et al. [10], who conducted in situ pullout and shear tests on actual plant root systems. This indicates that the employed method was feasible.
The experimental results indicate that the branching angle of the lateral root had the least impact on the vertical pullout resistance of plant roots and exhibited the lowest level of significance. To explore the underlying reason for this phenomenon, reference [43] conducted a comprehensive μ X theoretical analysis method based on the whole root system pullout test to study the forces acting on root segments.
In Figure 6, an arbitrary root segment dl at depth z beneath the soil surface was selected for a force analysis. Assuming that the soil density and the static friction coefficient of the root–soil interface are represented by γ and μ, respectively, the normal pressure per unit area and the maximum static frictional force on the root segment are γz and μγz, respectively. Consequently, the resultant static frictional force df on the root segment dl can be developed as follows:
d f = A z μ γ z = 2 π μ γ R z z d l
where R represents the radius of the root segment, which is a variable denoted as a function of depth z: R(z). A z = 2 π R z d l denotes the surface area of the root segment dl. The component of df in the vertical (z-direction) is projected as follows:
d f z = d f cos θ = 2 π μ γ R z z d l cos θ = 2 π μ γ R z z d z
where it is evident that the component of the static frictional force experienced by any root segment within a soil layer of thickness dz in the vertical direction is independent of the inclination angle θ of root extension. Therefore, the vertical pullout force of the plant root is not related to the branching angle of the lateral root, which matches the conclusions drawn from the experiments.

5. Conclusions

This study conducted vertical pullout orthogonal experiments on model roots with different morphologies and aimed to determine the sensitivity and significance of various root morphological factors on the vertical pullout resistance of plant roots. This study also aimed to provide a reference for vegetation selection in vegetative slope protection. Based on the results, the following key conclusions were drawn:
(1)
The results of the range analysis indicate that the factors influencing the vertical pullout resistance of a plant root system can be ordered in terms of sensitivity, from highest to lowest, as follows: number of lateral roots, taproot length, unit weight of soil around the root, and branching angle of the lateral root. A variance analysis further confirmed that the number of lateral roots and taproot length were the primary factors affecting the magnitude of the root system’s vertical pullout resistance.
(2)
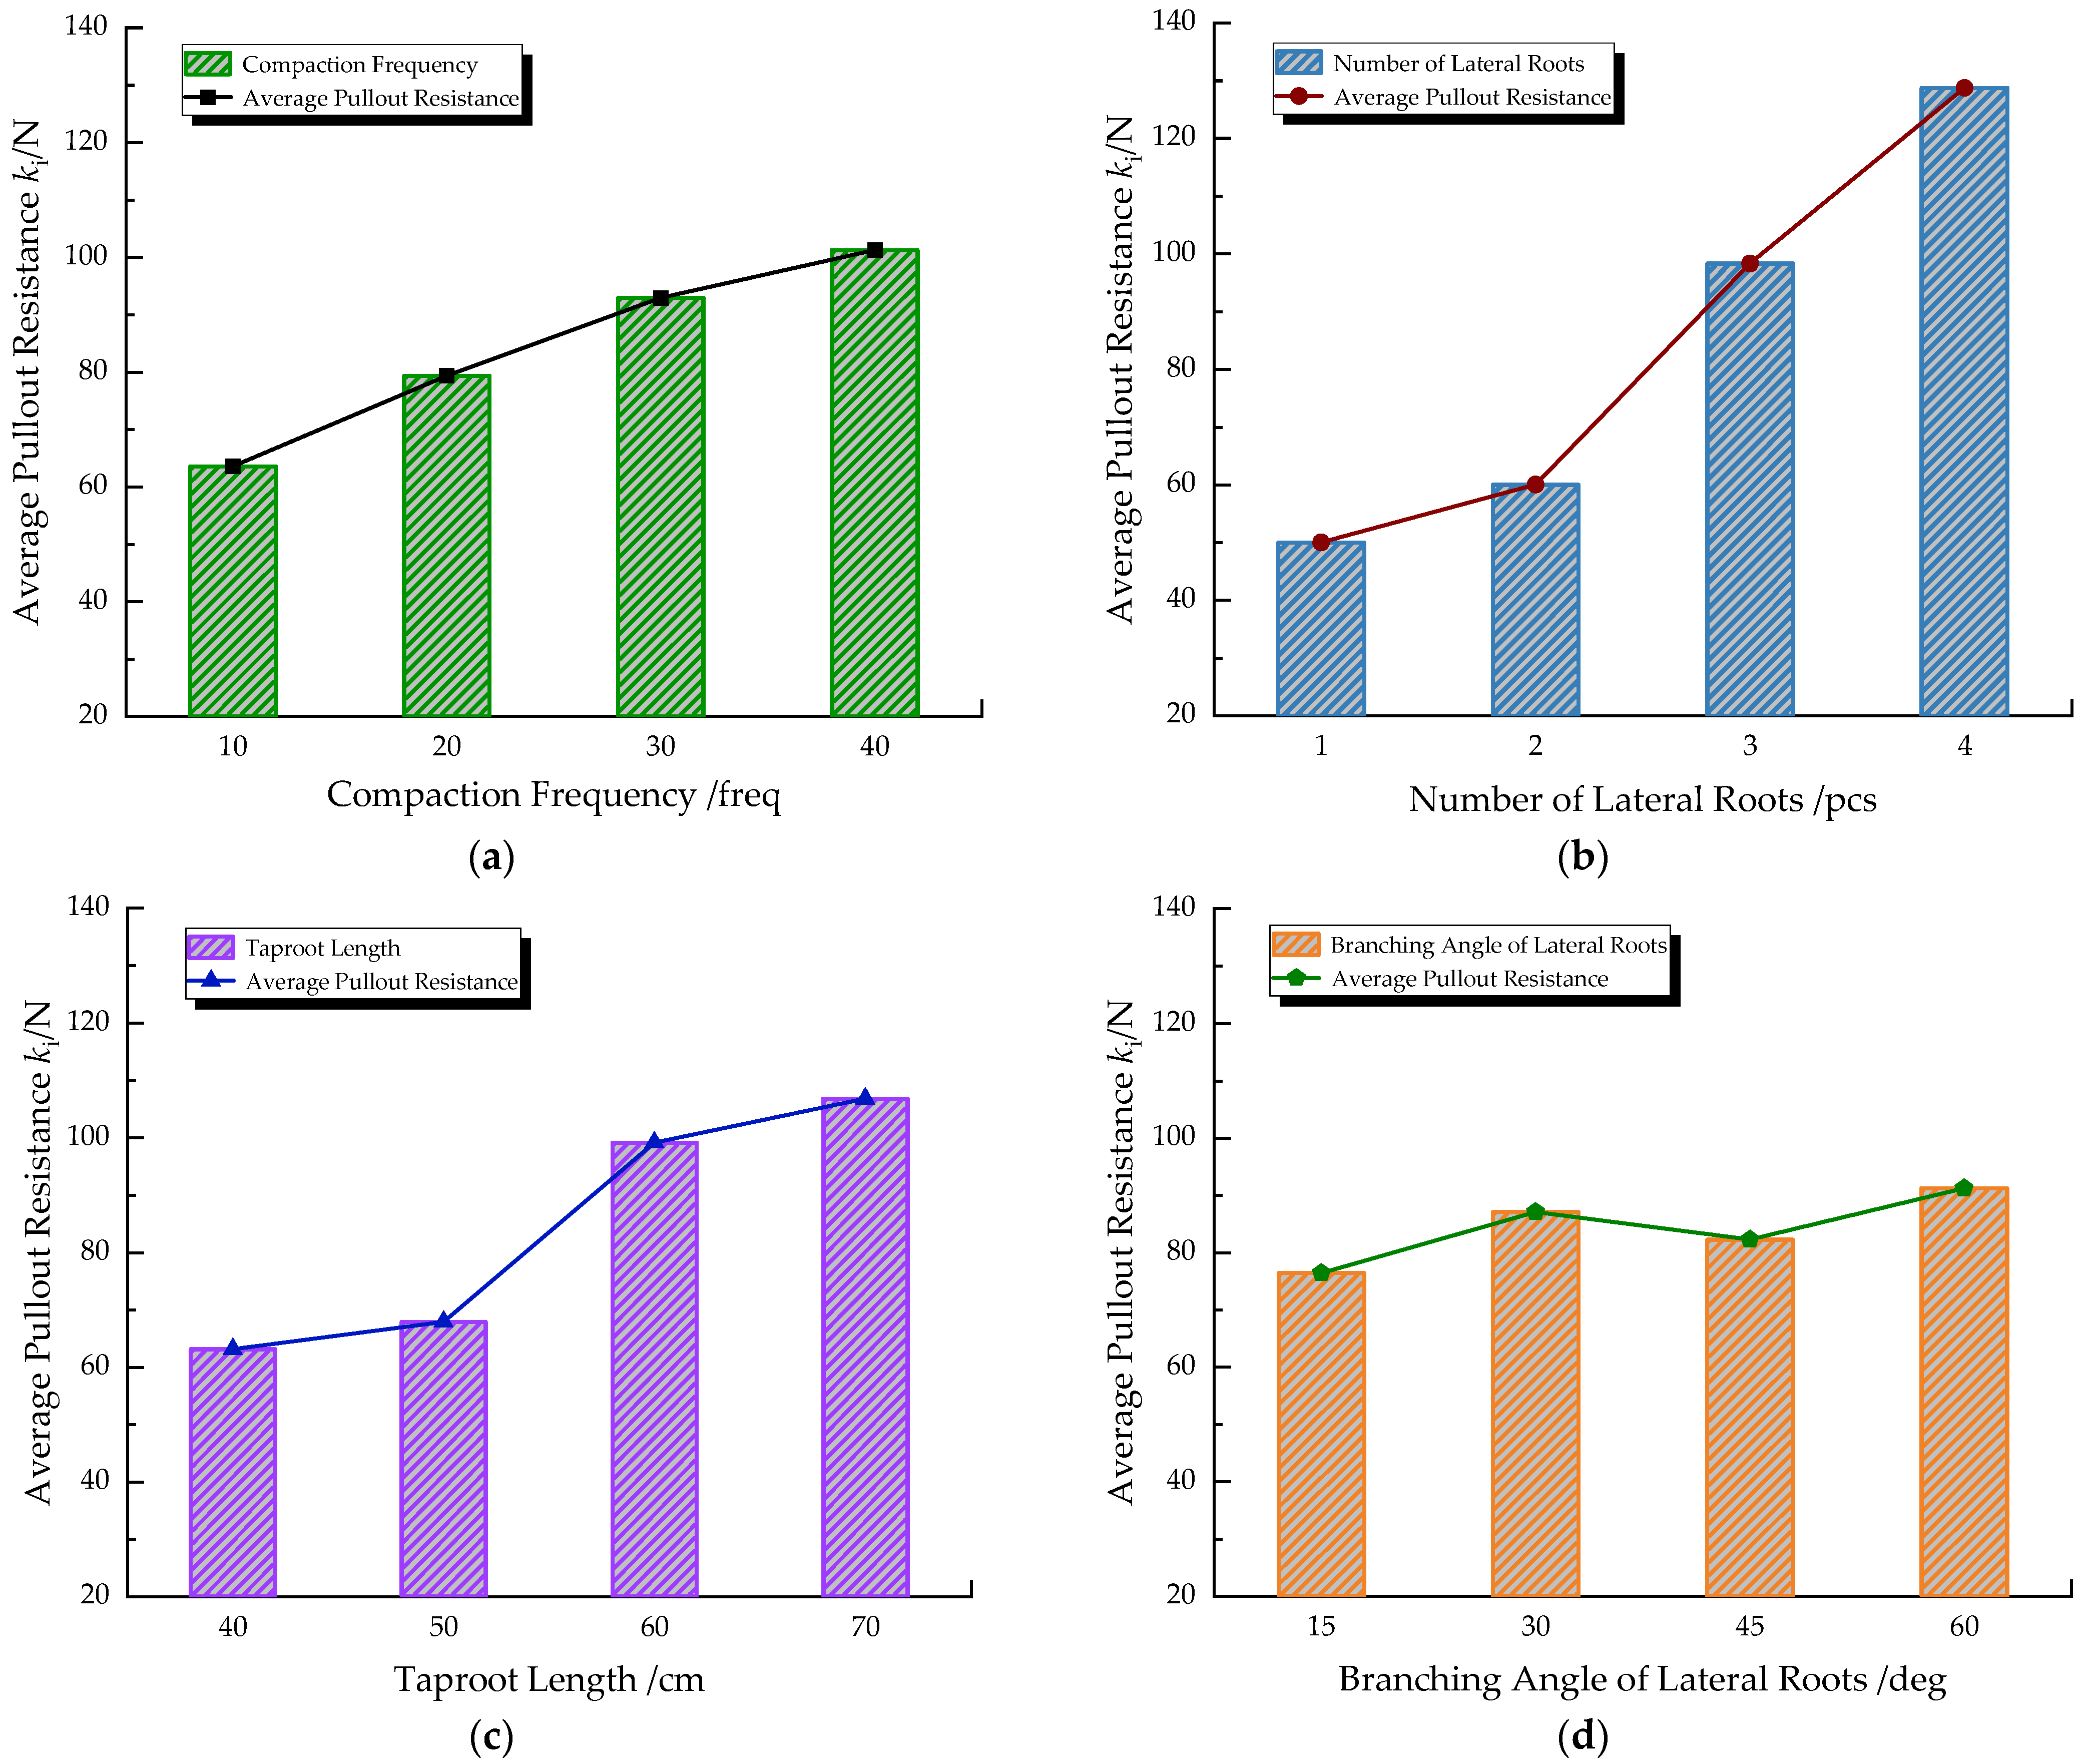
An analysis of the trend for the vertical pullout resistance of a root system with changes in various factors showed that an increase in the number of lateral roots from two to three leads to a 64% increase in the average vertical pullout resistance. An increase in the taproot length from 50 cm to 60 cm results in a 46% increase in average vertical pullout resistance. Additionally, for every 10 additional compaction hits, the average vertical pullout resistance increases by 25%. The average vertical pullout resistance is positively correlated with the number of lateral roots, taproot length, and the unit weight of soil around the root, reaching its maximum at the highest levels for these factors. Therefore, further enhancing these factors’ levels can lead to greater vertical pullout resistance and better combinations of these factors.
(3)
Incorporating the sensitivity index ( I S ) into the calculations further confirmed the order of sensitivity for the four factors—lateral root number, main root length, soil weight around the root periphery, and lateral root branching angle—on the vertical pullout resistance of plant root systems. The obtained results were consistent with Conclusion (1).
(4)
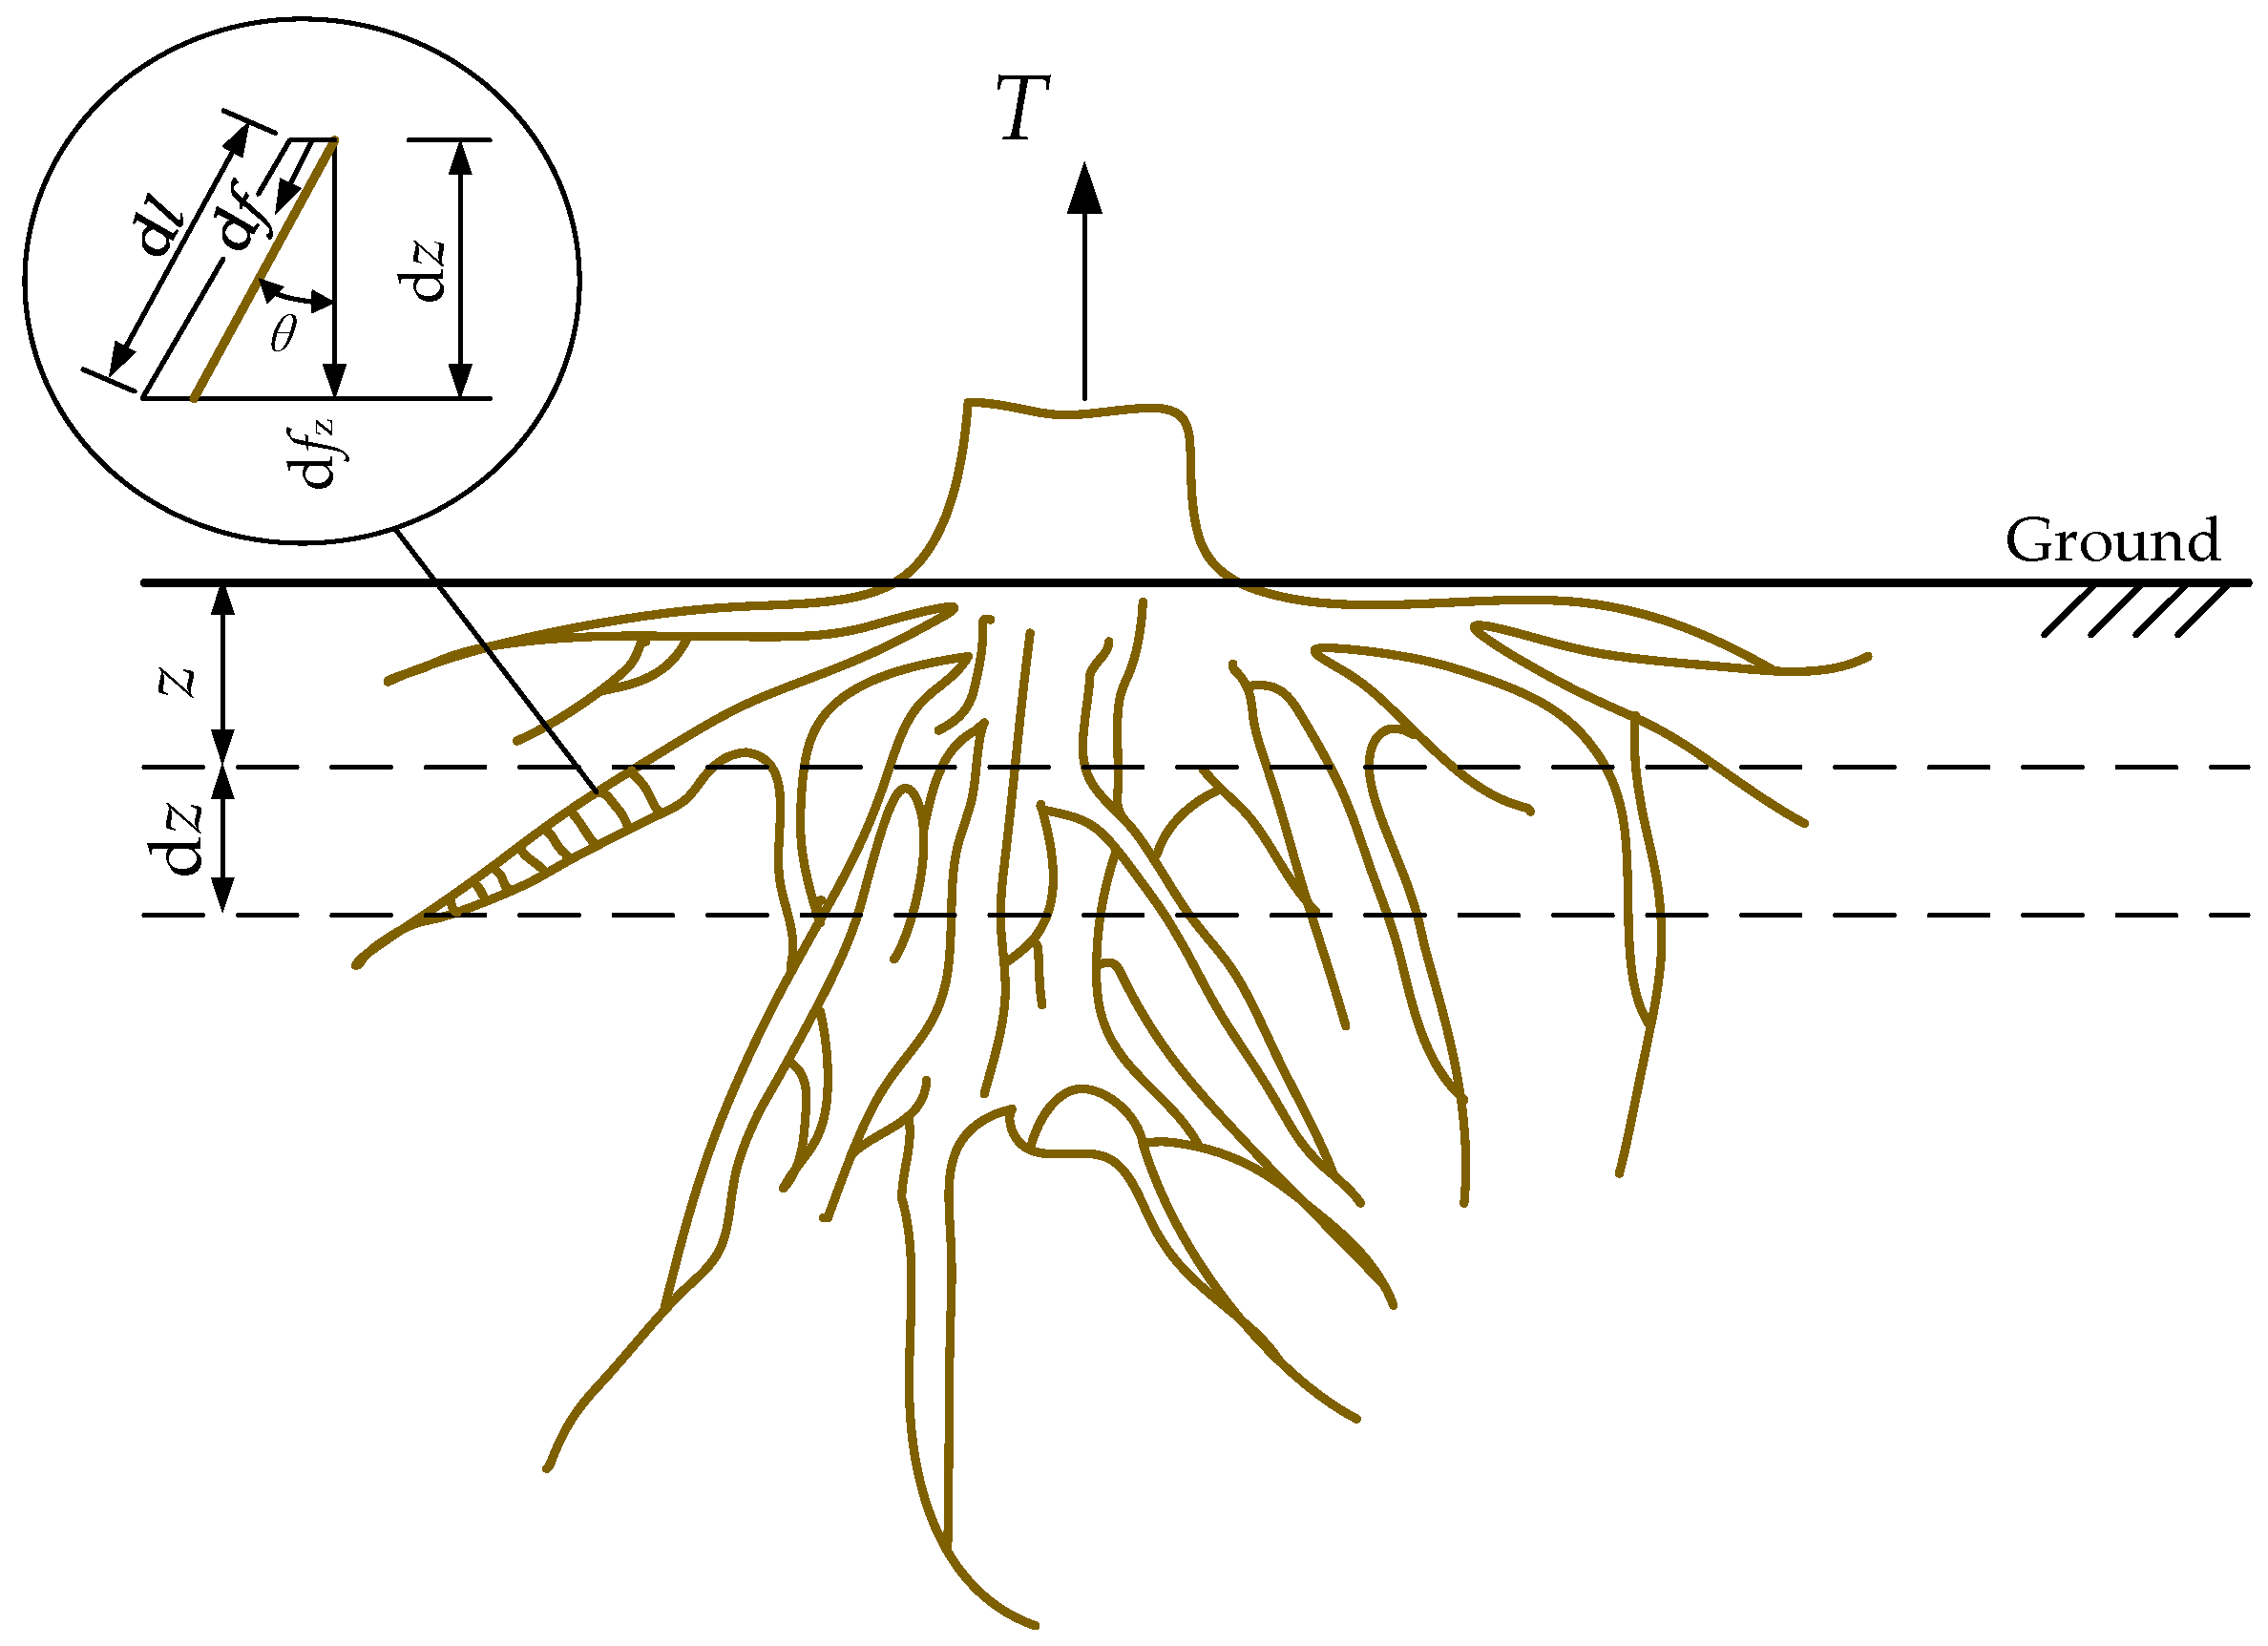
Through the results of the vertical pullout orthogonal experiments on model roots and a comprehensive μ X theoretical analysis method, it was concluded that the branching angle of the lateral roots had no significant effect on the vertical pullout resistance of the root system. In vegetative slope protection projects, preference should be given to plants with well-developed lateral roots, longer taproot lengths, and stronger root systems for slope reinforcement.
This study aimed to explore the impact of plant root morphological characteristics on vertical pullout resistance, considering only the unit weight of soil around the root and assuming other soil conditions around the root to be constant. It is important to note that the soil conditions around roots, such as soil type, particle size, and moisture content, significantly affect the root’s pullout resistance. Employing real plant root systems with numerous lateral roots and long taproots for indoor and field in situ experiments and using methods such as machine learning, multiple regression analysis, and response surface analysis to establish predictive models represent one approach for further studying on the effects of plant root systems on vertical pullout resistance. The results of such studies will have great scientific significance and engineering value.

Author Contributions

Conceptualization, K.Z. and J.Z.; methodology, K.Z.; validation, J.Z. and L.Z.; formal analysis, K.Z. and X.L.; investigation, K.Z. and K.W.; resources, J.Z. and L.Z.; data curation, J.Z.; writing—original draft preparation, K.Z.; writing—review and editing, K.Z. and L.Z.; visualization, K.Z.; supervision, J.Z.; project administration, J.Z.; funding acquisition, J.Z. All authors have read and agreed to the published version of the manuscript.

Funding

This research was funded by the National Natural Science Foundation of China, grant number 41877269 and by Technology Plan Project of Department of Transportation of Sichuan Province, grant number 2021-A-02.

Institutional Review Board Statement

Not applicable.

Informed Consent Statement

Not applicable.

Data Availability Statement

The data are contained within the article.

Acknowledgments

The authors sincerely thank the School of Civil Engineering, Southwest Jiaotong University, for providing the test equipment to ensure subsequent data collection.

Conflicts of Interest

Le Zhang was employed by Sichuan Highway Planning, Survey, Design and Research Institute Ltd. The remaining authors declare that the research was conducted in the absence of any commercial or financial relationships that could be construed as a potential conflict of interest.

References

  1. Zhao, H.; Tian, W.P.; Li, J.C.; Ma, B.C. Hazard zoning of trunk highway slope disasters: A case study in northern Shaanxi, China. Bull. Eng. Geol. Environ. 2018, 77, 1355–1364. [Google Scholar] [CrossRef]
  2. Ashfaq, M.; Moghal, A.A.B. Cost and carbon footprint analysis of flyash utilization in earthworks. Int. J. Geosynth. Ground Eng. 2022, 8, 21. [Google Scholar] [CrossRef]
  3. Varsha, B.; Moghal, A.A.B.; Rehman, A.U.; Chittoori, B.C.S. Shear, consolidation characteristics and carbon footprint analysis of clayey soil blended with calcium lignosulphonate and granite sand for earthen dam application. Sustainability 2023, 15, 6117. [Google Scholar] [CrossRef]
  4. Wu, X.P.; Yi, C.; Cui, W.W.; Zhang, Z.; Yan, C.; Xie, X.C. Analysis of Human Disturbance Features in Natural Reserves and Empirical Research on Their Restoration: A Case Study of the Huangchulin Nature Reserve in Fujian Province. Sustainability 2023, 15, 2017. [Google Scholar] [CrossRef]
  5. Ahlström, J.; Tidblad, J.; Sederholm, B.; Wadsö, L. Influence of chloride and moisture content on steel rebar corrosion in concrete. Mater. Corros. 2016, 67, 1049–1058. [Google Scholar] [CrossRef]
  6. Shen, Y.F.; Li, Q.; Pei, X.J.; Wei, R.J.; Yang, B.M.; Lei, N.F.; Zhang, X.C.; Yin, D.Q.; Wang, S.J.; Tao, Q.Z. Ecological Restoration of Engineering Slopes in China—A Review. Sustainability 2023, 15, 5354. [Google Scholar] [CrossRef]
  7. Masi, E.B.; Segoni, S.; Tofani, V. Root Reinforcement in Slope Stability Models: A Review. Geosciences 2021, 11, 212. [Google Scholar] [CrossRef]
  8. Capilleri, P.P.; Cuomo, M.; Motta, E.; Todaro, M. Experimental Investigation of Root Tensile Strength for Slope Stabilization. Indian Geotech. J. 2019, 49, 687–697. [Google Scholar] [CrossRef]
  9. Reubens, B.; Poesen, J.; Danjon, F.; Geudens, G.; Muys, B. The role of fine and coarse roots in shallow slope stability and soil erosion control with a focus on root system architecture: A review. Trees 2007, 21, 385–402. [Google Scholar] [CrossRef]
  10. Wang, B.Y.; Wang, S.J. Shear Strength Analysis and Slope Stability Study of Straight Root Herbaceous Root Soil Composite. Appl. Sci. 2023, 13, 12632. [Google Scholar] [CrossRef]
  11. Kong, G.Q.; Wen, L.; Liu, H.L.; Wang, C.Q. Strength properties of root compound soil and morphological observation of plant root. Rock Soil Mech. 2019, 40, 3717–3723. [Google Scholar]
  12. Lian, B.Q.; Peng, J.B.; Zhan, H.B.; Wang, X.G. Mechanical response of root-reinforced loess with various water contents. Soil Tillage Res. 2019, 193, 85–94. [Google Scholar] [CrossRef]
  13. Zhou, X.L.; Fu, D.S.; Wan, J.; Xiao, H.L.; He, X.Y.; Li, Z.X.; Deng, Q.X. The Shear Strength of Root–Soil Composites in Different Growth Periods and Their Effects on Slope Stability. Appl. Sci. 2023, 13, 11116. [Google Scholar] [CrossRef]
  14. Xu, H.; Yuan, H.L.; Wang, X.Y.; Wang, D.; Chen, J.X.; Rong, C.Q. Study on influence of morphology and hierarchy of root on mechanical characteristics of root soil comp. Chin. J. Geotech. Eng. 2022, 44, 926–935. [Google Scholar]
  15. Ajedegba, J.O.; Choi, J.W.; Jones, K.D. Analytical modeling of coastal dune erosion at South Padre Island: A consideration of the effects of vegetation roots and shear strength. Ecol. Eng. 2019, 127, 187–194. [Google Scholar] [CrossRef]
  16. Wang, Y.B.; Wu, M.S.; Zhou, C. Direct shear tests and numerical simulation on slope soils reinforced by composite roots. Chin. J. Geotech. Eng. 2020, 42, 177–182. [Google Scholar]
  17. Cardoza, R.; Oka, L. Measuring the effect of grass roots on shear strength parameters of sandy soils. In Proceedings of the Geo-Congress 2020, Minneapolis, MN, USA, 25–28 February 2020; American Society of Civil Engineers: Reston, VA, USA, 2020; pp. 214–223. [Google Scholar]
  18. Mao, Z.J.; Bi, Y.L.; Geng, M.M.; An, N. Pull-out characteristics of herbaceous roots of alfalfa on the loess in different growth stages and their impacts on slope stability. Soil Tillage Res. 2023, 225, 105542. [Google Scholar] [CrossRef]
  19. Bransby, F.; Davies, M.C.R.; Mickovski, S.; Sonnenberg, R.; Bengough, A.; Hallett, P. Stabilisation of slopes by vegetation reinforcement. In Physical Modelling in Geotechnics, Two Volume Set, Proceedings of the Sixth International Conference on Physical Modelling in Geotechnics, 6th ICPMG’06, Hong Kong, China, 4–6 August 2006; Taylor and Francis: London, UK, 2006; p. 317. [Google Scholar]
  20. Ali, F.; Osman, R.; Kamil, S.S.S.M. The influences of root branching patterns on pullout resistance. Electron. J. Geotech. Eng. 2013, 18, 3967–3977. [Google Scholar]
  21. Yang, Y.J.; Chen, L.H.; Li, N.; Zhang, Q.F. Effect of Root Moisture Content and Diameter on Root Tensile Properties. PLoS ONE 2016, 11, e0151791. [Google Scholar] [CrossRef]
  22. Capilleri, P.P.; Motta, E.; Raciti, E. Experimental Study on Native Plant Root Tensile Strength for Slope Stabilization. Procedia Eng. 2016, 158, 116–121. [Google Scholar] [CrossRef]
  23. Yang, Q.H.; Zhang, C.B.; Liu, P.C.; Jiang, J. The Role of Root Morphology and Pulling Direction in Pullout Resistance of Alfalfa Roots. Front. Plant Sci. 2021, 12, 580825. [Google Scholar] [CrossRef]
  24. Zhou, L.H.; Hu, X.S.; Liu, C.Y.; Xu, Z.W.; Xu, T.; Shen, Z.Y. In-Situ Pull-out Test of Four Shrub Plants in Xining Basin of the Loess Plateau. Res. Soil Water Conserv. 2019, 26, 236–242. [Google Scholar]
  25. Ennos, A.R. The Anchorage of Leek Seedlings: The Effect of Root Length and Soil Strength. Ann. Bot. 1990, 65, 409–416. [Google Scholar] [CrossRef]
  26. Mickovski, S.B.; Bransby, F.; Bengough, A.G.; Davies, M.C.R.; Hallett, P.D. Resistance of simple plant root systems to uplift loads. Can. Geotech. J. 2010, 47, 78–95. [Google Scholar] [CrossRef]
  27. Khalid, U.; ur Rehman, Z.; Mujtaba, H.; Farooq, K. 3D response surface modeling based in-situ assessment of physico-mechanical characteristics of alluvial soils using dynamic cone penetrometer. Transp. Geotech. 2022, 36, 100781. [Google Scholar] [CrossRef]
  28. Farooq, K.; ur Rehman, Z.; Shahzadi, M.; Mujtaba, H.; Khalid, U. Optimization of Sand-Bentonite mixture for the stable engineered barriers using desirability optimization methodology: A Macro-Micro-Evaluation. KSCE J. Civ. Eng. 2023, 27, 40–52. [Google Scholar] [CrossRef]
  29. Mujtaba, H.; Shimobe, S.; Farooq, K.; ur Rehman, Z.; Khalid, U. Relating gradational parameters with hydraulic conductivity of sandy soils: A renewed attempt. Arab. J. Geosci. 2021, 14, 1–17. [Google Scholar] [CrossRef]
  30. ur Rehman, Z.; Khalid, U.; Ijaz, N.; Mujtaba, H.; Haider, A.; Farooq, K.; Ijaz, Z. Machine learning-based intelligent modeling of hydraulic conductivity of sandy soils considering a wide range of grain sizes. Eng. Geol. 2022, 311, 106899. [Google Scholar] [CrossRef]
  31. Pan, T.H.; Du, F.; Wang, Y. Analysis of Root Distributions and Shear Strengths of Slope Protection Plants in the Loess Region of Northern Shaanxi. Res. Soil Water Conserv. 2020, 27, 357–363+371. [Google Scholar]
  32. Ji, X.L.; Yang, P. The effects of roots angles of nerium indicum on the stability of slopes. Ecol. Environ. Sci. 2012, 21, 1966–1970. [Google Scholar]
  33. Bai, X.; Zhao, C.Z.; Kang, M.P. Relationship between root forks and branch angle of Tamarix ramosissima at different stand ages in oasis of Jinta County. Acta Ecol. Sin. 2021, 41, 1878–1884. [Google Scholar]
  34. GB 50007-2011; Code for Design of Building Foundation. China Architecture & Building Press: Beijing, China, 2011; pp. 124–125.
  35. GB 50330-2013; Technical Code for Building Slope Engineering. China Architecture & Building Press: Beijing, China, 2013; pp. 110–113.
  36. Khari, M.; Kassim, K.A.; Adnan, A. Sand samples’ preparation using mobile pluviator. Arab. J. Sci. Eng. 2014, 39, 6825–6834. [Google Scholar] [CrossRef]
  37. Hakhamaneshi, M.; Black, J.A.; Cargill, A.; Cox, C.M.; Elmrom, T. Development and calibration of a sand pluviation device for preparation of model sand bed for centrifuge tests. In Proceedings of the 3rd Conference on Physical Modelling in Geotechnics, IFSTTAR Nantes Centre, France, 1–3 June 2016. [Google Scholar]
  38. Ma, X.F.; Kong, L.G.; Fang, W.; Gong, B.W.; Li, H.; Xu, G.M.; Zhao, W.; Zhang, X.D.; Chen, Y.M. Parallel tests on preparation of samples with sand pourer. Chin. J. Geotech. Eng. 2014, 36, 1791–1801. [Google Scholar] [CrossRef]
  39. Fang, H.; Duan, X.F.; Wang, Y.Z.; Wang, H.; Yuan, X.M.; Wang, T.Q. Research and prospect of preparation technique for centrifugal pluviation model. World Earthq. Eng. 2018, 34, 60–66. [Google Scholar]
  40. Bauer, L.R.; Hamby, D.M. Relative Sensitivities of Existing and Novel Model Parameters in Atmospheric Tritium Dose Estimates. Radiat. Prot. Dosim. 1991, 37, 253–260. [Google Scholar]
  41. Luo, C.Y.; Wu, C.; Lu, G.X.; De, K.J.; Zhang, M.; Wang, J.B. Tensile resistance characteristics of root-soil composite system and influence factor analysis in Sanjiangyuan regions of Qinghai-Tibet plateau. Res. Soil Water Conserv. 2014, 21, 260–266+271. [Google Scholar]
  42. Li, H.; Huang, Y.H.; Jiang, F.S.; Lin, J.S.; Li, S.S.; Li, F.; Zheng, Z. Effects of two herbal plants’ roots on soil shear strength in a collapsing gully alluvial fan. J. Soil Water Conserv. 2017, 31, 96–101. [Google Scholar] [CrossRef]
  43. Xie, M.S. A study on the soil mechanical role of tree roots in the stability of slopes. J. Soil Water Conserv. 1990, 7–14+50. [Google Scholar] [CrossRef]
Figure 1. Materials and apparatus setup: (a) model root physical diagram; (b) experimental setup and schematic diagram of the model root.
Applsci 14 00764 g001
Figure 2. Sand filling and compaction: (a) sand pourer method of filling; (b) sand compaction.
Applsci 14 00764 g002
Figure 3. The compaction unit weight of sand in experimental groups 5–8.
Applsci 14 00764 g003
Figure 4. Q-S curve for vertical pullout experiment of model root systems: (a) Q-S curve for experiment set 1 (A1B2C3D2); (b) Q-S curve for experiment set 5 (A1B3C1D4); (c) Q-S curve for experiment set 3 (A2B4C3D3); (d) Q-S curve for experiment set 10 (A3B3C2D3).
Applsci 14 00764 g004
Figure 5. Trend chart of average pullout resistance across factors: (a) average pullout resistance vs. the unit weight of soil around the root; (b) average pullout resistance vs. the number of lateral roots; (c) average pullout resistance vs. taproot length; (d) average pullout resistance vs. branching angle of the lateral root.
Applsci 14 00764 g005
Figure 6. Root system force analysis.
Applsci 14 00764 g006
Table 1. Levels of experimental factors.
Factor LevelsA
(Compaction Frequency/freq)
B
(Number of Lateral Roots/pcs)
C
(Taproot Length/cm)
D
(Branching Angle of the Lateral Roots/deg)
11014015
22025030
33036045
44047060
Table 2. Orthogonal experimental design and results.
Group NumberColumn NumberExperimental Design
A
(Compaction Frequency/freq)
B
(Number of Lateral Roots/pcs)
C
(Taproot Length/cm)
D
(Branching Angle of the Lateral Roots/deg)
Blank Column
112323A1B2C3D2
234122A3B4C1D2
324334A2B4C3D3
442131A4B2C1D3
513144A1B3C1D4
631341A3B1C3D4
721113A2B1C1D1
843312A4B3C3D1
911432A1B1C4D3
1033233A3B3C2D3
1123421A2B3C4D2
1241224A4B1C2D2
1314211A1B4C2D1
1432414A3B2C4D1
1522242A2B2C2D4
1644443A4B4C4D4
Table 3. The experimental results of vertical pullout resistance.
Group NumberMeasured Value/NMean Value/N30% of the Mean Value/NRange/NPullout Resistance Characteristic Value/N
160606561.718.5561.7
2120120140126.73820126.7
3140140140140420140
440354038.311.5538.3
565657066.720566.7
65570706519.51565
7202022.520.86.22.520.8
8701301301103360130
960557563.3192057.5
10909010093.3281093.3
11100110100103.33110103.3
1250606056.7171056.7
1365707068.320.5568.3
1490908086.7261086.7
1550555553.316553.3
16180180180180540180
Note: Data marked with ‘ ’ in the table were outliers.
Table 4. Summary of the range analysis.
FactorsA
(Compaction Frequency/freq)
B
(Number of Lateral Roots/pcs)
C
(Taproot Length/cm)
D
(Branching Angle of the Lateral Roots/deg)
Error Column
KiK1254.2200.0252.5305.8274.9
K2317.4240.0271.6348.4367.5
K3371.7393.3396.7329.1355.8
K4405.0515.0427.5365.0350.1
kik163.650.063.176.568.7
k279.460.067.987.191.9
k392.998.399.282.389.0
k4101.3128.8106.991.387.5
R j = m a x K i m i n K i 150.8315.0175.059.292.6
Factor PriorityB → C → A → D
Optimal SolutionB4C4A4D4
Table 5. Variance analysis results.
Sources of VarianceSum of Squared DeviationsDegrees of FreedomMean SquareF-ValueCritical ValueSignificance
A3267.0231089.013.60F0.1(3,6) = 3.29o
B15,757.9235252.6417.36F0.01(3,6) = 9.78**
C5792.9331930.986.38F0.05(3,6) = 4.76*
D487.453162.48Compare the F-values of each factor with their critical values.
Error Column1327.923442.64
The mean square value of factor D, 162.48, is lower than the mean square value of the error term, 442.64. Consequently, factor D is incorporated into a new error term, and a recalibration of the sums of squares, degrees of freedom, and mean squares is performed.
New Error Term1815.376302.56
Note: The notation ‘**’ denotes high significance, ‘*’ denotes significance, and ‘o’ denotes some level of influence.
Table 6. Sensitivity index calculation.
Factors p m a x p m i n I S
A (Compaction Frequency/freq)101.363.60.372
B (Number of Lateral Roots/pcs)128.850.00.612
C (Taproot Length/cm)106.963.10.410
D (Branching Angle of the Lateral Roots/deg)91.376.50.162
Disclaimer/Publisher’s Note: The statements, opinions and data contained in all publications are solely those of the individual author(s) and contributor(s) and not of MDPI and/or the editor(s). MDPI and/or the editor(s) disclaim responsibility for any injury to people or property resulting from any ideas, methods, instructions or products referred to in the content.

