Article

The Difference between the Responses of Gross Primary Production and Sun-Induced Chlorophyll Fluorescence to the Environment Based on Tower-Based and TROPOMI SIF Data

1
State Key Laboratory of Remote Sensing Science, Faculty of Geographical Science, Beijing Normal University, Beijing 100875, China
2
Beijing Engineering Research Center for Global Land Remote Sensing Products, Faculty of Geographical Science, Beijing Normal University, Beijing 100875, China
3
Key Laboratory of Digital Earth Science, Aerospace Information Research Institute, Chinese Academy of Sciences, Beijing 100094, China
4
University of Chinese Academy of Sciences, Beijing 100049, China
*
Author to whom correspondence should be addressed.
Appl. Sci. 2024, 14(2), 771; https://doi.org/10.3390/app14020771
Submission received: 7 December 2023 / Revised: 14 January 2024 / Accepted: 15 January 2024 / Published: 16 January 2024
(This article belongs to the Special Issue New Advances of Remote Sensing in Agriculture)

Abstract

:
The strong correlation between gross primary production (GPP) and sun-induced chlorophyll fluorescence (SIF) has been reported in many studies and is the basis of the SIF-based GPP estimation. However, GPP and SIF are not fully synchronous under various environmental conditions, which may destroy a stable GPP–SIF relationship. Therefore, exploring the difference between responses of GPP and SIF to the environment is essential to correctly understand the GPP–SIF relationship. As the common driver of GPP and SIF, the incident radiation could cause GPP and SIF to have similar responses to the environment, which may obscure the discrepancies in the responses of GPP and SIF to the other environmental variables, and further result in the ambiguity of the GPP–SIF relationship and uncertainties in the application of SIF. Therefore, we tried to exclude the dominant role of radiation in the responses of GPP and SIF to the environment based on the binning method, in which continuous tower-based SIF, satellite SIF, and eddy covariance GPP data from two growing seasons were used to investigate the differences in the responses of GPP and SIF to radiation, air temperature (Ta), and evaporation fraction (EF). We found that the following: (1) At both the site and satellite scales, there were divergences in the light response speeds between GPP and SIF which were affected by Ta and EF. (2) SIF and its light response curves were insensitive to EF and Ta compared to GPP, and the consistency in GPP and SIF light responses was gradually improved with the improvement of Ta and EF. (3) The dynamic slope values of the GPP–SIF relationship were mostly caused by the different sensitivities of GPP and SIF to EF and Ta. Our results highlighted that GPP and SIF were not highly consistent, having differences in environmental responses that further confused the GPP–SIF relationship, leading to complex SIF application.

1. Introduction

Vegetation, as an important component of terrestrial ecosystem, assimilates carbon dioxide into carbohydrate and releases oxygen through photosynthesis, which drives the global carbon cycle [1,2,3,4]. The gross primary production (GPP) is defined as the total carbon absorbed by vegetation through photosynthesis, which is an indicator of the carbon fixation capacity of vegetation and constitutes the largest carbon flux between the terrestrial biosphere and atmosphere [5,6,7,8]. Therefore, the quantification of GPP is key to the global carbon cycle and assessment of vegetation functions. Thus far, many models have been developed to estimate GPP based on remote sensing data [9,10,11,12,13]. However, due to different model theories and methods, large uncertainties in the GPP estimation still exist [1,14].
Sun-induced chlorophyll fluorescence (SIF) is the irradiance re-emitted from chlorophyll molecules in the 650–800 nm range during light reactions under excitation by solar radiation, which is directly linked with photosynthesis [15]. Compared with traditional vegetation indices, the physiological information included in SIF has great potential and advantages in GPP estimation [4]. In the light use efficiency (LUE) model, GPP and SIF can be expressed as similar expressions:
G P P = F P A R × P A R × Φ P
S I F = F P A R × P A R × Φ F × f e s c  
where FPAR is the fraction of absorbed photosynthetically active radiation (APAR), PAR is photosynthetically active radiation, and Φ P is the efficiency of the light used for photosynthesis [12,16]. Φ F is the chlorophyll fluorescence emission yield and f e s c is the fraction of SIF photons escaping the canopy [17]. Based on Equations (1) and (2), APAR ( F P A R × P A R ), as the common driver of GPP and SIF, could lead to similar trends of GPP and SIF, which are the basis of the linear GPP–SIF relationship to some degree. However, vegetation has unique survival strategies that try to regulate the efficiency of photosynthesis under various environmental conditions [18,19]. Chlorophyll fluorescence is one of the byproducts of this strategy to avoid light damage of photosynthetic system, which means that SIF is the result of photosynthesis (GPP) adapting to the environment [20]. Therefore, an incomplete synchronization between GPP and SIF theoretically exists. Indeed, an increasing number of studies have highlighted the fact that GPP and SIF are not fully synchronous. For example, Yang et al. [21] found that GPP and red SIF exhibited different responses to radiation under different environmental conditions in an evergreen forest. Paul-Limoges et al. [22] indicated that the sensitivities of SIF and GPP to the environment are different. Pierrat et al. [23] found a seasonal dependency on GPP–SIF relationship, which indicated that the responses of GPP and SIF to the environment had seasonal variations. Several studies found the spatio-temporal variations in the GPP–SIF ratio, which also indicated the asynchronous environmental responses of GPP and SIF [24,25,26,27]. Additionally, diverse responses of GPP and SIF to the environment were found under environmental stress [28,29,30,31]. Some studies also extracted physiological information from SIF signals using NIRv (the product of NIR reflectance and NDVI) to explore the relationship between photosynthesis and chlorophyll fluorescence, leading to inconsistent conclusions about the GPP–SIF relationship [32,33,34,35]. Although many existing studies tried to investigate the responses of GPP and SIF to various environmental conditions based on multiple methods, uncertainties and inconsistencies still persist, causing bias in SIF application.
Photosynthesis is influenced by three primary factors: radiation, temperature, and water availability. Meanwhile, incident radiation, as the common driver of GPP and SIF, could cause similarities in the environmental responses of GPP and SIF, which may obscure the tiny discrepancies in the responses of GPP and SIF to other environmental variables, leading to ambiguity in the GPP–SIF relationship. In this study, we used continuous data from a corn flux tower site during two growing seasons, satellite SIF data, and AmeriFlux data to analyze the differences in the responses of GPP and SIF to the environment based on the binning method. For this, we split all environmental variables into several bins in order to exclude the dominant role of radiation on the environmental responses of GPP and SIF. We aimed to investigate the difference in the sensitivities of GPP and SIF to the environment and the impact of this difference on the GPP–SIF relationship.

2. Data and Methods

2.1. Data Collection

2.1.1. SIF Data at DM Site

The SIF data used in this study were collected through continuous half-hourly observations in an irrigated corn field at the Daman (DM) site (100.372° E, 38.856° N), which is located in south of Zhangye, Gansu Province, China [17], as displayed in Figure 1. We obtained SIF data from two growing seasons: 2018 (1 June to 29 September) and 2019 (1 June to 30 September). The spectrometer was installed on a 25-m flux tower to detect SIF signals and far-red SIF signals in the 740 to 780 nm range by fitting windows using singular vector decomposition (SVD) method. We excluded negative SIF values and converted all half-hourly data into a daily scale. More details about the retrievals and instrument specifications can be found in Liu, X. et al. [17].

2.1.2. Eddy Covariance GPP and Environmental Variables at DM Site

Data were measured at different flux tower heights with a 10 HZ sampling rate, including net ecosystem exchange (NEE) of CO2, PAR, air temperature (Ta), sensible heat flux (H), latent heat flux (LE), etc. The raw data were converted to 10 min averages using Eddypro post-processing software (https://data.tpdc.ac.cn/en/, accessed on 22 May 2022) [36,37]. To match the 30 min averaged step of SIF, we aggregated 10 min averaged flux data into 30 min averaged flux data. Before partitioning NEE, we preprocessed the 30 min averaged data to reduce the uncertainties of the measurements under unfavorable weather conditions, including marking the data one hour before and after precipitation and negative NEE values at night as data gaps. Then, we used the online Eddy covariance data processing tool Reddyproc (https://www.bgc-jena.mpg.de/REddyProc/brew/REddyProc.rhtml), developed by Max Planck Institute for Biogeochemistry, to identify conditions with insufficient turbulence, marked those conditions as data gaps based on the Moving Point Test (MPT) method, and then filled these data gaps [38,39,40]. Finally, the NEE was partitioned into GPP and ecosystem respiration ( R e c o ) based on the night-time flux partitioning method through the ReddyProc tool [40,41]. In this study, we chose parameters including GPP, Ta, H, LE, and PAR for analysis. Meanwhile, we removed negative GPP values and converted the half-hourly data into a daily scale.

2.1.3. AmeriFlux Data

We selected AmeriFlux data to analyze the responses of GPP and satellite SIF to the environment since AmeriFlux provides the latest GPP and meteorological data (https://ameriflux.lbl.gov/, accessed on 22 October 2022). We selected all sites that had GPP and meteorological data after 2018, and chose daily variables including GPP based on the night-time partitioning method, Ta, incoming shortwave radiation (SW), LE, and H, as well as screening out negative GPP values. Finally, we obtained 64 flux sites that had flux data after 2018.

2.1.4. TROPOMI SIF

The payload mounted on the Sentinal-5 Precursor, TROPOMI (TROPOspheric Monitoring Instrument), was launched on 13 October 2017. The wide swath width (~2600 km) makes the TROPOMI achieve a daily global coverage of almost 7 km × 3.5 km spatial resolution at the nadir [42,43]. The TROPOMI SIF (TROPOSIF) product has two versions: L2 and L2B. In the L2B TROPOSIF product, the far-red SIF was retrieved from two fitting windows, 743–758 nm and 735–758 nm, based on a data-driven method [44]. The 743–758 nm fitting window corresponds to an overcast sky which is derived using the observations with a cloud fraction below 0.8, and the 735–758 nm fitting window corresponds to a clear sky, which is derived using observations with a cloud fraction below 0.2. In this study, we chose the L2B TROPOSIF in the 743–758 nm fitting windows for data from 2018 to 2021 to extract the daily TROPOSIF values corresponding to flux sites in Section 2.1.3 (https://s5p-troposif.noveltis.fr/data-access/, accessed on 10 November 2022). We took the central longitude and latitude of TROPOSIF pixel as the center, and took the spatial buffer 0.01° × 0.01° to extract the TROPOSIF values where flux tower sites resided in the buffer (0.01° × 0.01°). Then, we eliminated negative SIF values, and screened out data with a cloud fraction of less than 0.2 for these extracted SIF data points.

2.2. Methods

2.2.1. EF Calculation

In this study, we used an evaporative fraction (EF) to characterize the water availability of the environment. The EF can be calculated as the follows:
E F = L E L E + H          
where L E (W/m2) is latent heat flux and H (W/m2) is sensible heat flux.

2.2.2. Standardize Variables

To make all variables comparable, we standardized all variables based on the following formula:
S t a n d a r d i z e = X x ¯ S t d x  
where X is the original value of each variable, x ¯ is the mean value of each variable, and S t d ( x ) is the standard deviation of each variable.

2.2.3. Binning

To reduce the dominant role of radiation on the responses of GPP and SIF to the environment, we used the binning method to exclude the interaction of multiple environmental variables to some degree. This method aims to spilt an environmental variable into several bins and assumes that there is no large variation in this variable in each bin. Then the responses of GPP and SIF to other environmental variables in each bin for the above variables are analyzed [45,46]. In this study, we investigated the responses of GPP and SIF to radiation (PAR/SW) under different EF and Ta bins, and to EF and Ta under different radiation (PAR/SW) bins, respectively.
For the responses of GPP and SIF to radiation under different EF and Ta bins, the process was as follows: Based on the standardized environmental variables, we first sorted PAR(SW), Ta, and EF into 8 bins with a 0.5 interval without changing the temporal match of all data. Next, within each EF or Ta bin (i = 1, 2, 3, …, 8), data were further ranked according to PAR(SW) bins from minimum bin to maximum bin. Finally, the averages of GPP and SIF in the corresponding PAR(SW) bins in each Ta or EF bin were used to quantify the responses of GPP and SIF to the radiation in each Ta or EF bin. For the responses of GPP and SIF to EF and Ta under different radiation bins, the process was similar to the above-mentioned method, which is just needed to replace the parameter EF or Ta with PAR(SW) and replace PAR(SW) with EF or Ta in the second step, respectively. We aimed to explore the response of SIF to PAR under different EF bins, and so we carried out the following based on the standardized data:
(i)
Dividing EF into 8 bins (i = 1, 2, 3, …, 8) and ranking the bins of EF from minimum to maximum;
(ii)
In each EF bin, further dividing PAR into 8 bins (j = 1, 2, 3, …, 8) and ranking the bins of PAR from minimum to maximum;
(iii)
Calculating the mean values of SIF within each PAR bin under different EF bins to characterize the responses of SIF to PAR under different EF intervals. The response of SIF to PAR under different EF intervals can be described as follows:
S I F P A R i j | E F i = 1 n × 1 n S I F n
where i is the index number of ith EF bins, j is the index number of jth PAR bins in ith EF bins. n is the number of SIF within jth PAR bins.

2.2.4. The Calculation of Importance Based on the Random Forest Method

The random forest method (RF) can accurately predict high-dimensional data. More importantly, the RF method can assess the importance of the predictors in the outcome variable that needs to be predicted [47]. In this study, one of the analyses was about the responses of GPP and SIF to radiation under different Ta and EF conditions. To explore the influence of environmental variables and photosynthesis on the SIF light response curves, we calculated the importance of the GPP/PAR(SW) ratio (slopes of GPP light response curves), EF, and Ta in SIF/PAR(SW) ratio (slopes of SIF light response curves) for both TROPOSIF and tower-based data at the DM site based on the RF. Meanwhile, the importance of Ta, EF, and the SIF/PAR(SW) ratio in the GPP/PAR(SW) ratio was also calculated.

3. Results

3.1. The Responses of GPP and SIF to the Environment

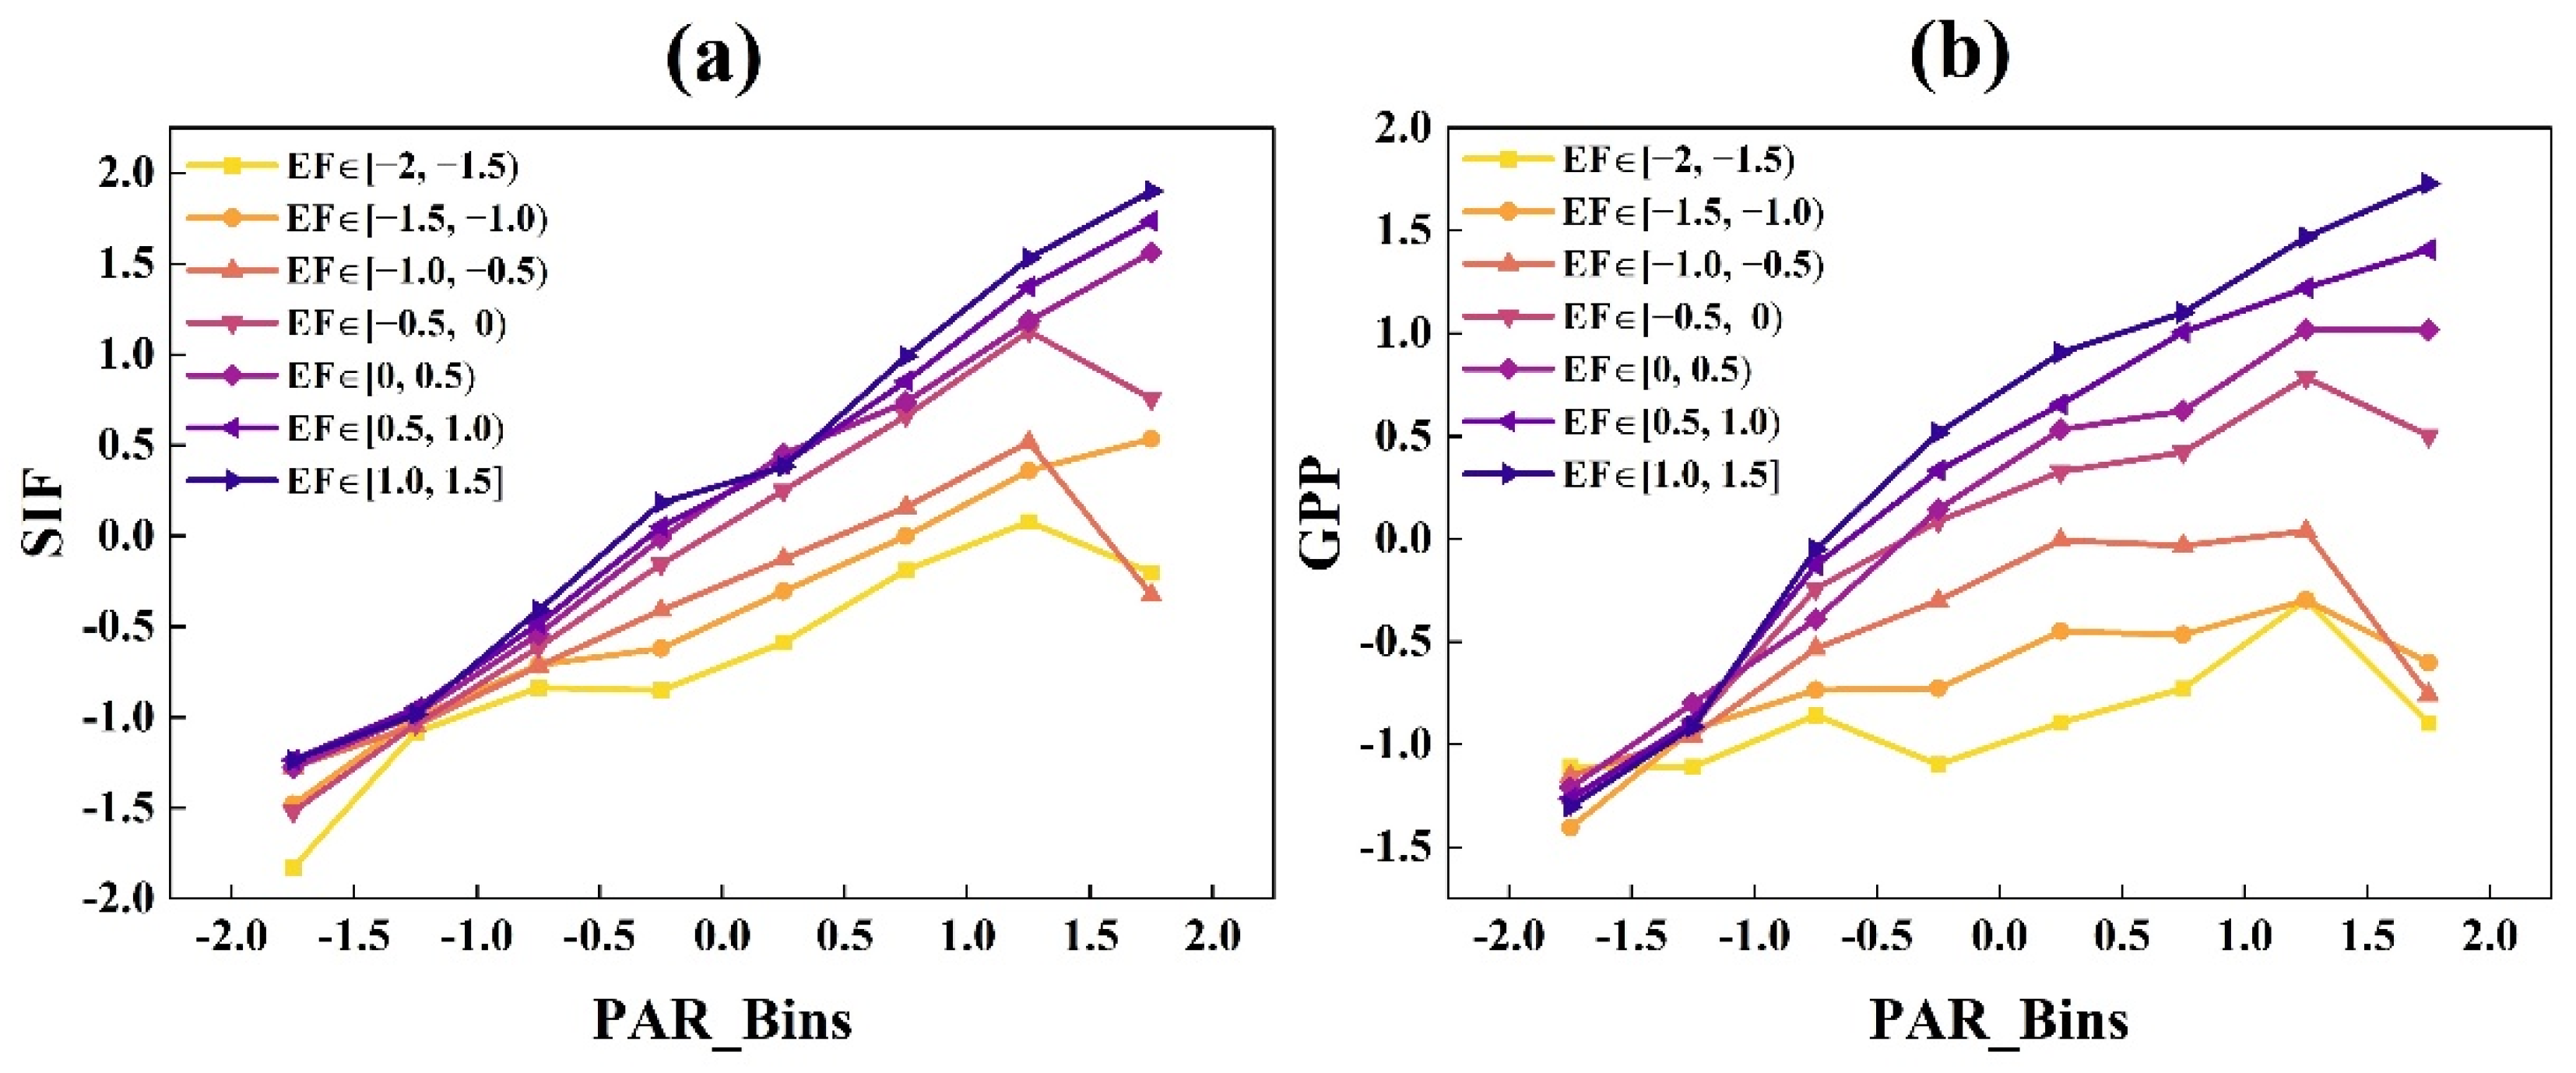
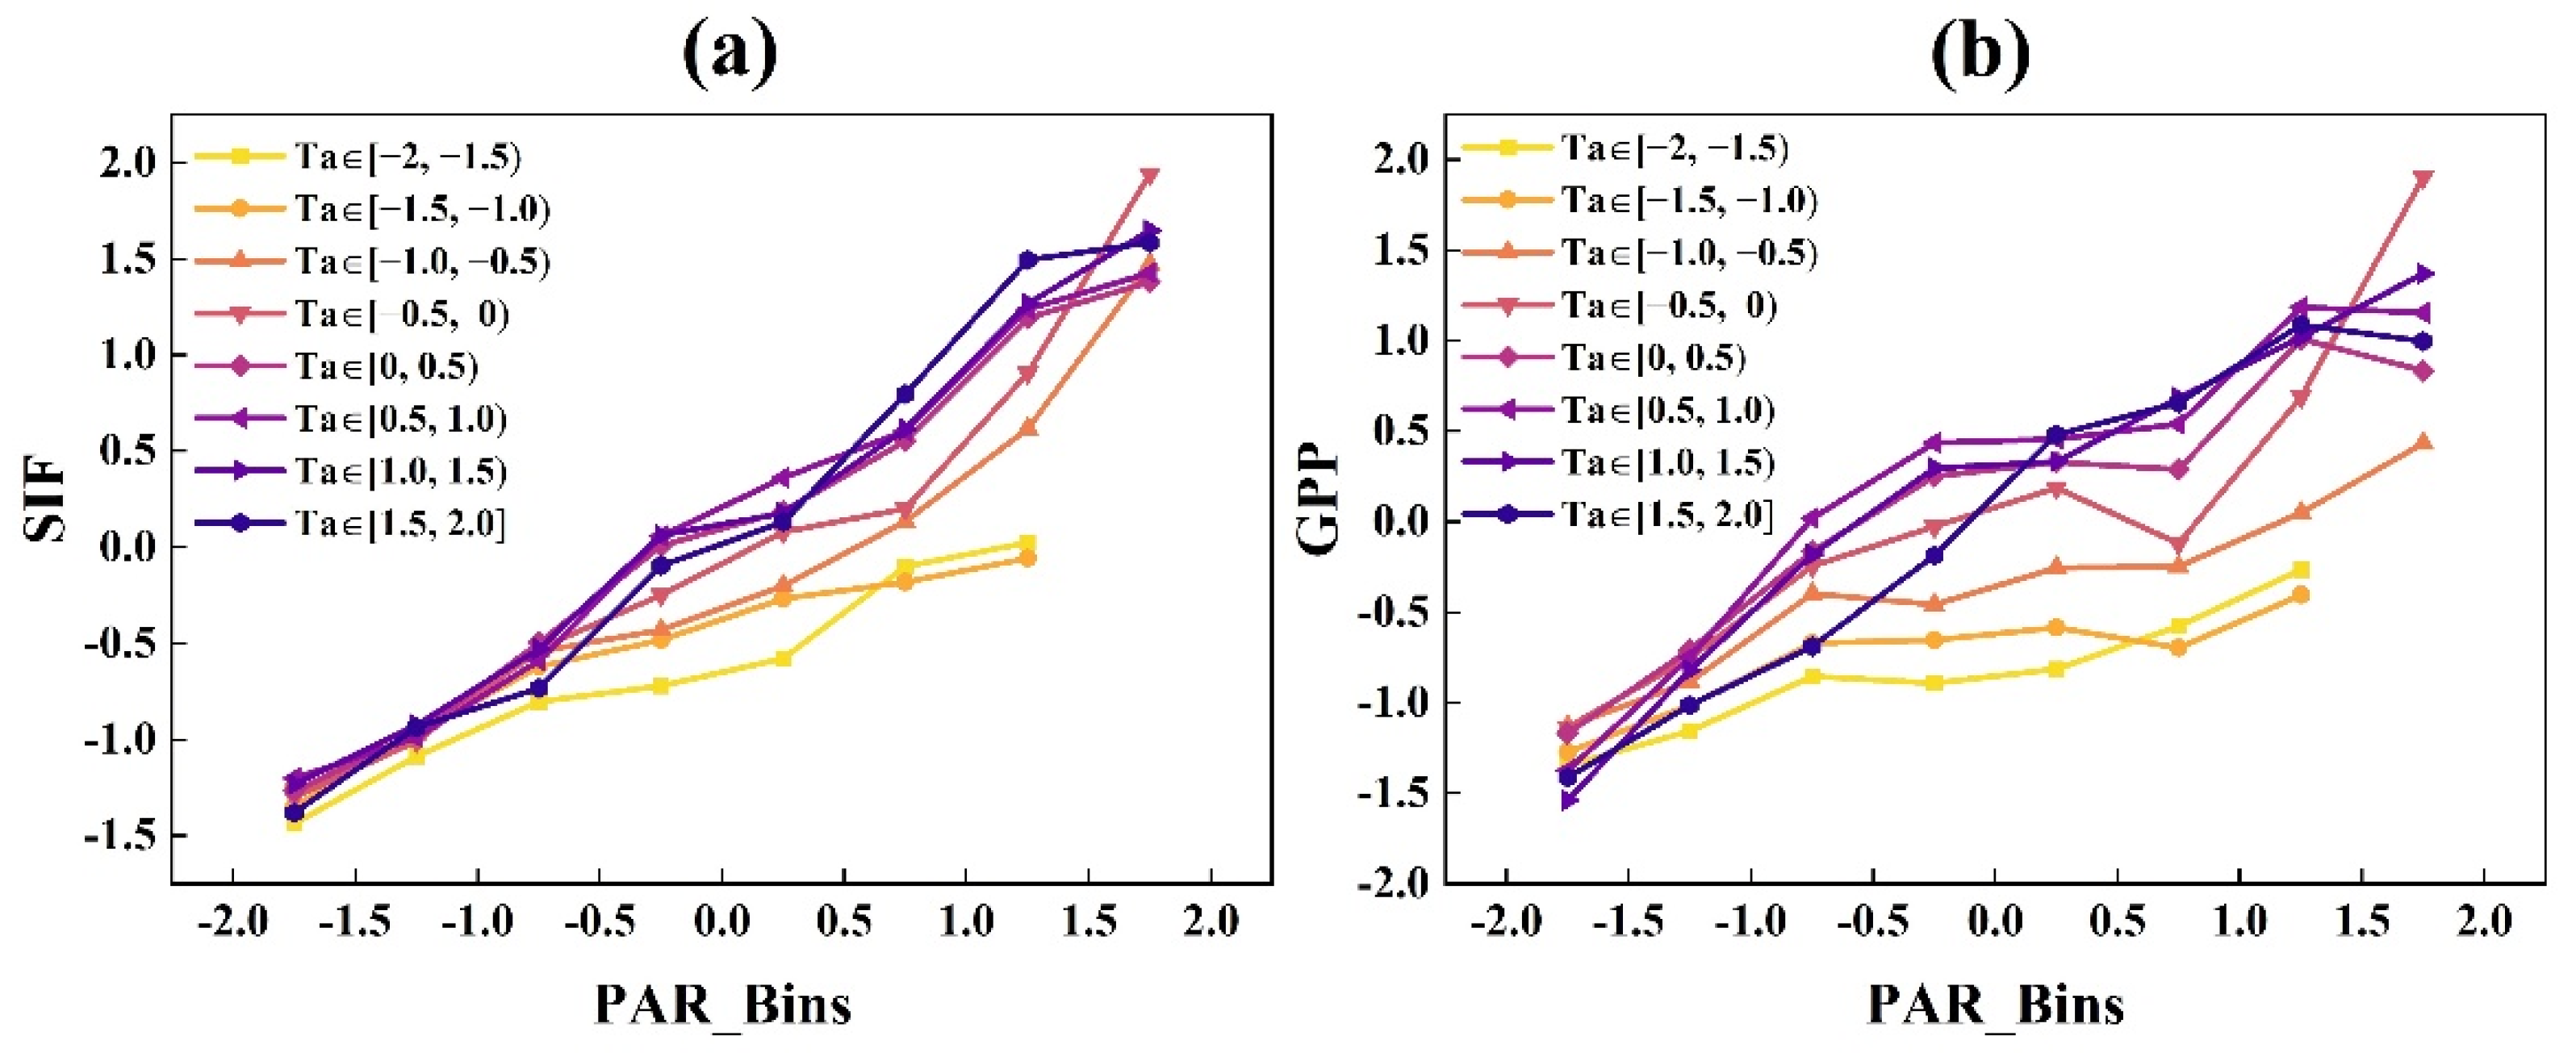
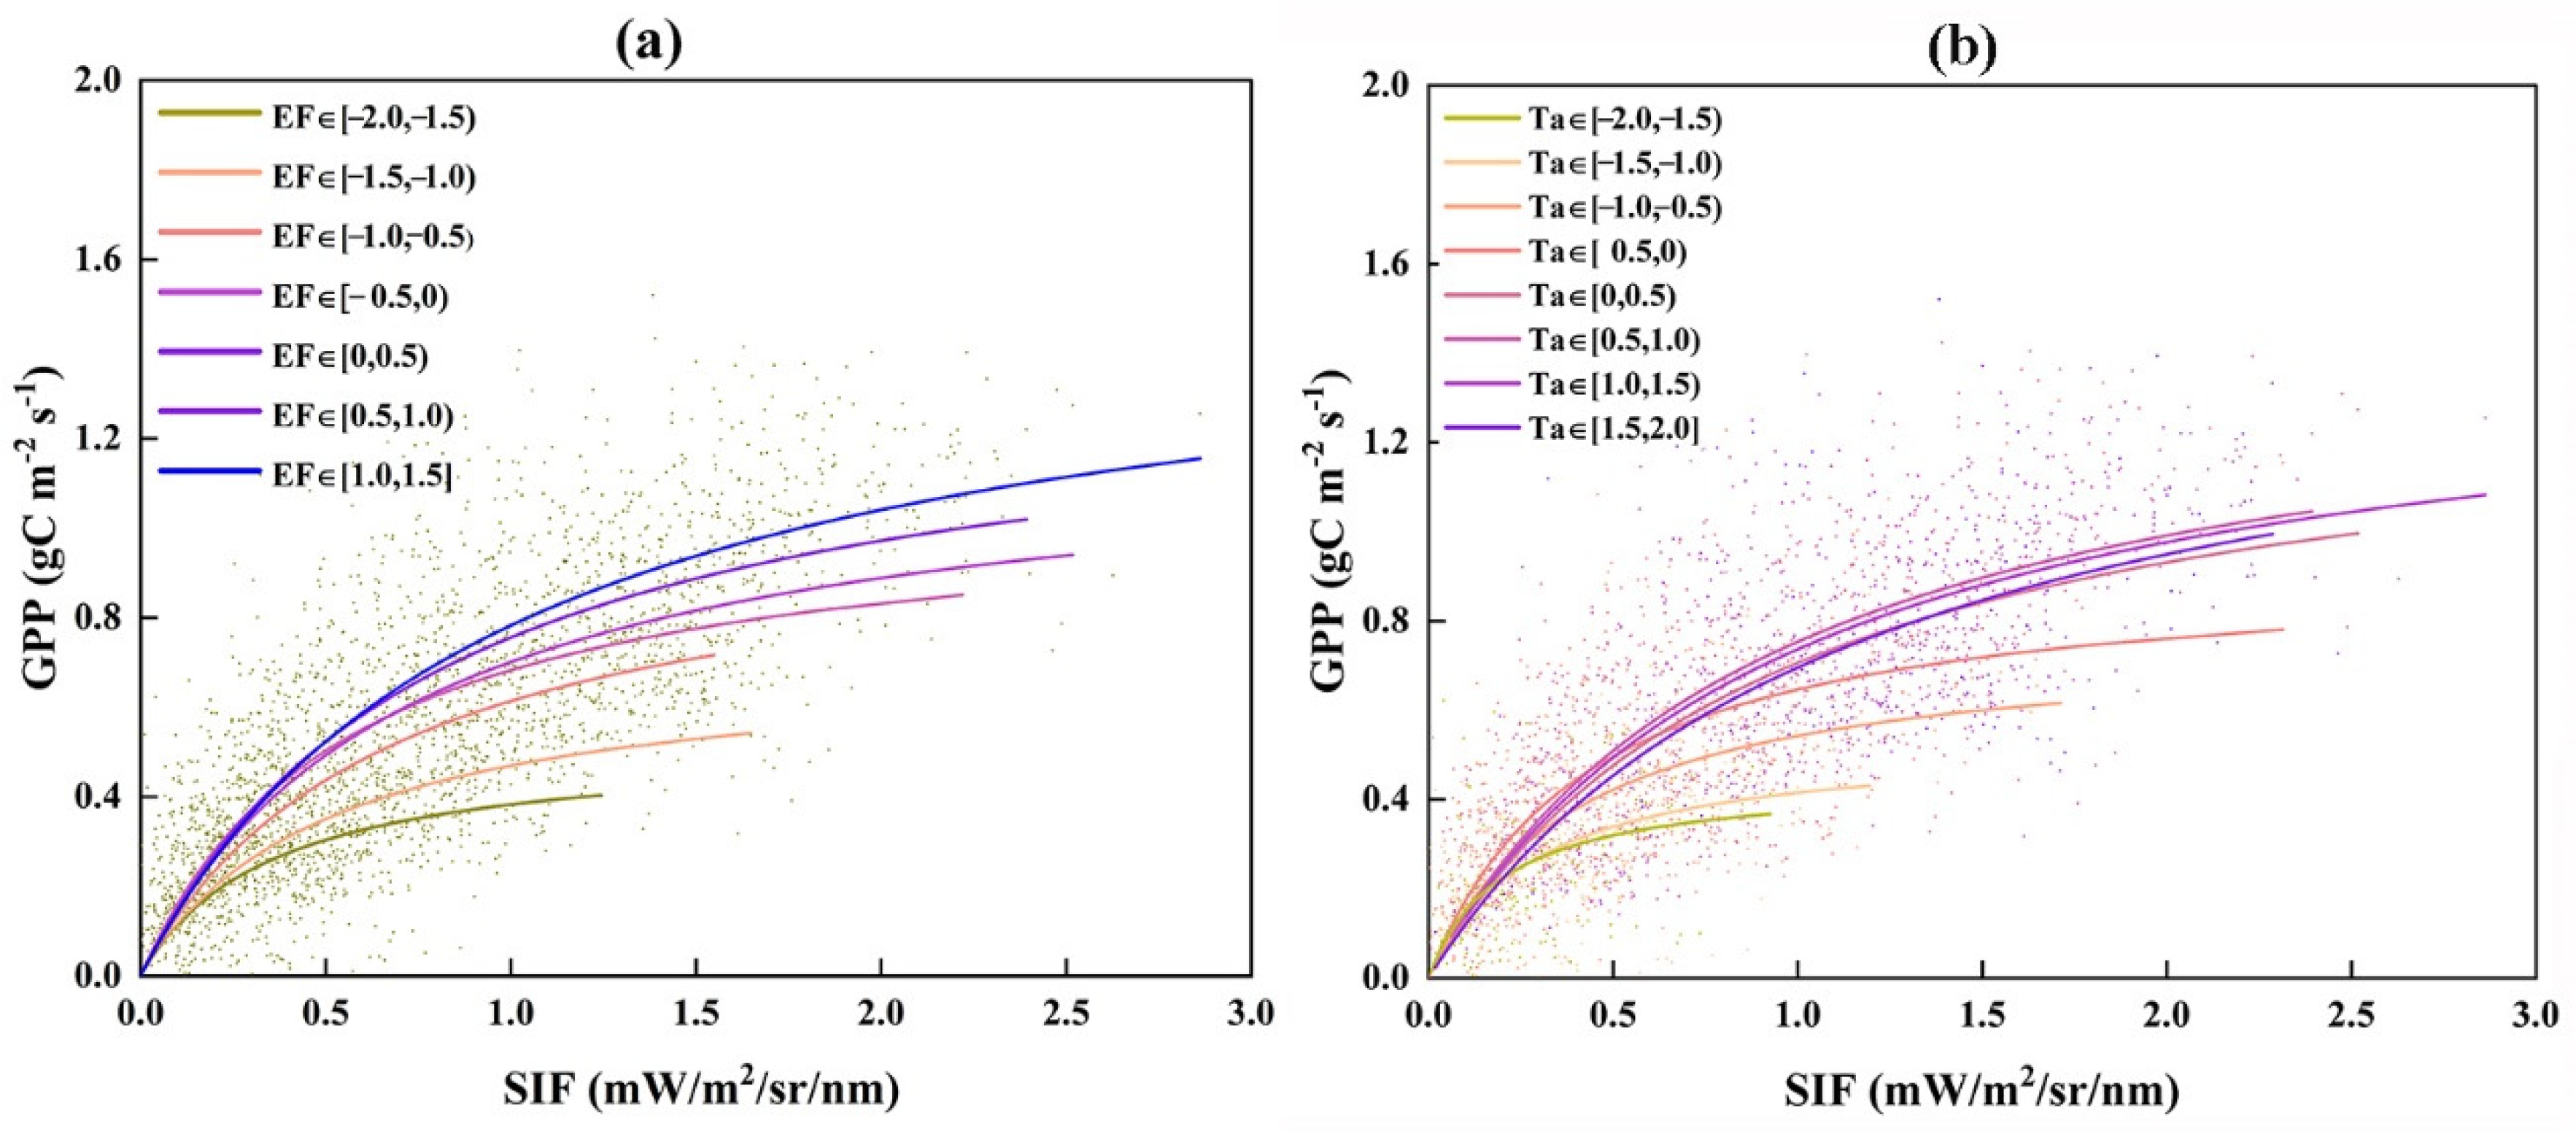
3.1.1. The Responses of GPP and SIF to Radiation under Different EF and Ta Conditions at the DM Site

We analyzed the responses of GPP and SIF to the environment based on half-hourly and daily data at the DM site using a binning method (all variables were standardized). Figure 2 shows the half-hourly light response curves of GPP and SIF under different EF bins. In general, GPP and SIF had similar light responses which increased with increasing PAR in each EF bin. However, SIF increased faster than GPP especially in lower EF bins, and the difference between the increase speeds of GPP and SIF was gradually reduced with increasing EF. As shown in Figure S1, there were divergences in the slopes of the SIF and GPP light response curves within each EF bin. The slopes of the SIF light response curves were higher than those of GPP at the lower EF bins (EF [−2, −1.5), EF [−1.5, −1.0)) which indicated that SIF increased faster than GPP when the water availability was not high. With the increase in EF, the difference between the slopes of SIF and GPP light response curves gradually weakened (EF [−1, 0.5)); until EF was higher (EF [0.5, 1.5]), the slopes of GPP light response curves were higher than that of SIF before the light saturation point. Figure S2 showed the daily GPP and SIF light responses at DM site under different EF bins which was similar to the half-hourly GPP and SIF light responses. SIF increased faster than GPP in lower EF bins and the difference between the response speeds of GPP and SIF gradually reduced with increasing EF. In addition, EF had more influence on the GPP light response than on SIF at both half-hourly and daily scales.
Figure 3 showed the half-hourly GPP and SIF light responses under different Ta bins at DM site. The overall trends of GPP and SIF were similar which both increased with increasing PAR. While the response speeds of SIF and GPP to the light energy also had difference. As shown in Figure S3, when temperature was lower, the slopes of SIF light response curves were higher than that of GPP which indicated that SIF increased faster than GPP (Ta [−2, −0.5)). With increase in temperature, the difference between the slope values of SIF and GPP light response curves gradually reduced until temperature was higher in which GPP increased faster than SIF before light saturation point. Figure S4 showed the daily GPP and SIF light responses at DM site under different Ta bins which were similar to the half-hourly GPP and SIF light responses. Similar to EF, the GPP light response was more dependent on Ta than on SIF at both half-hourly and daily scales.

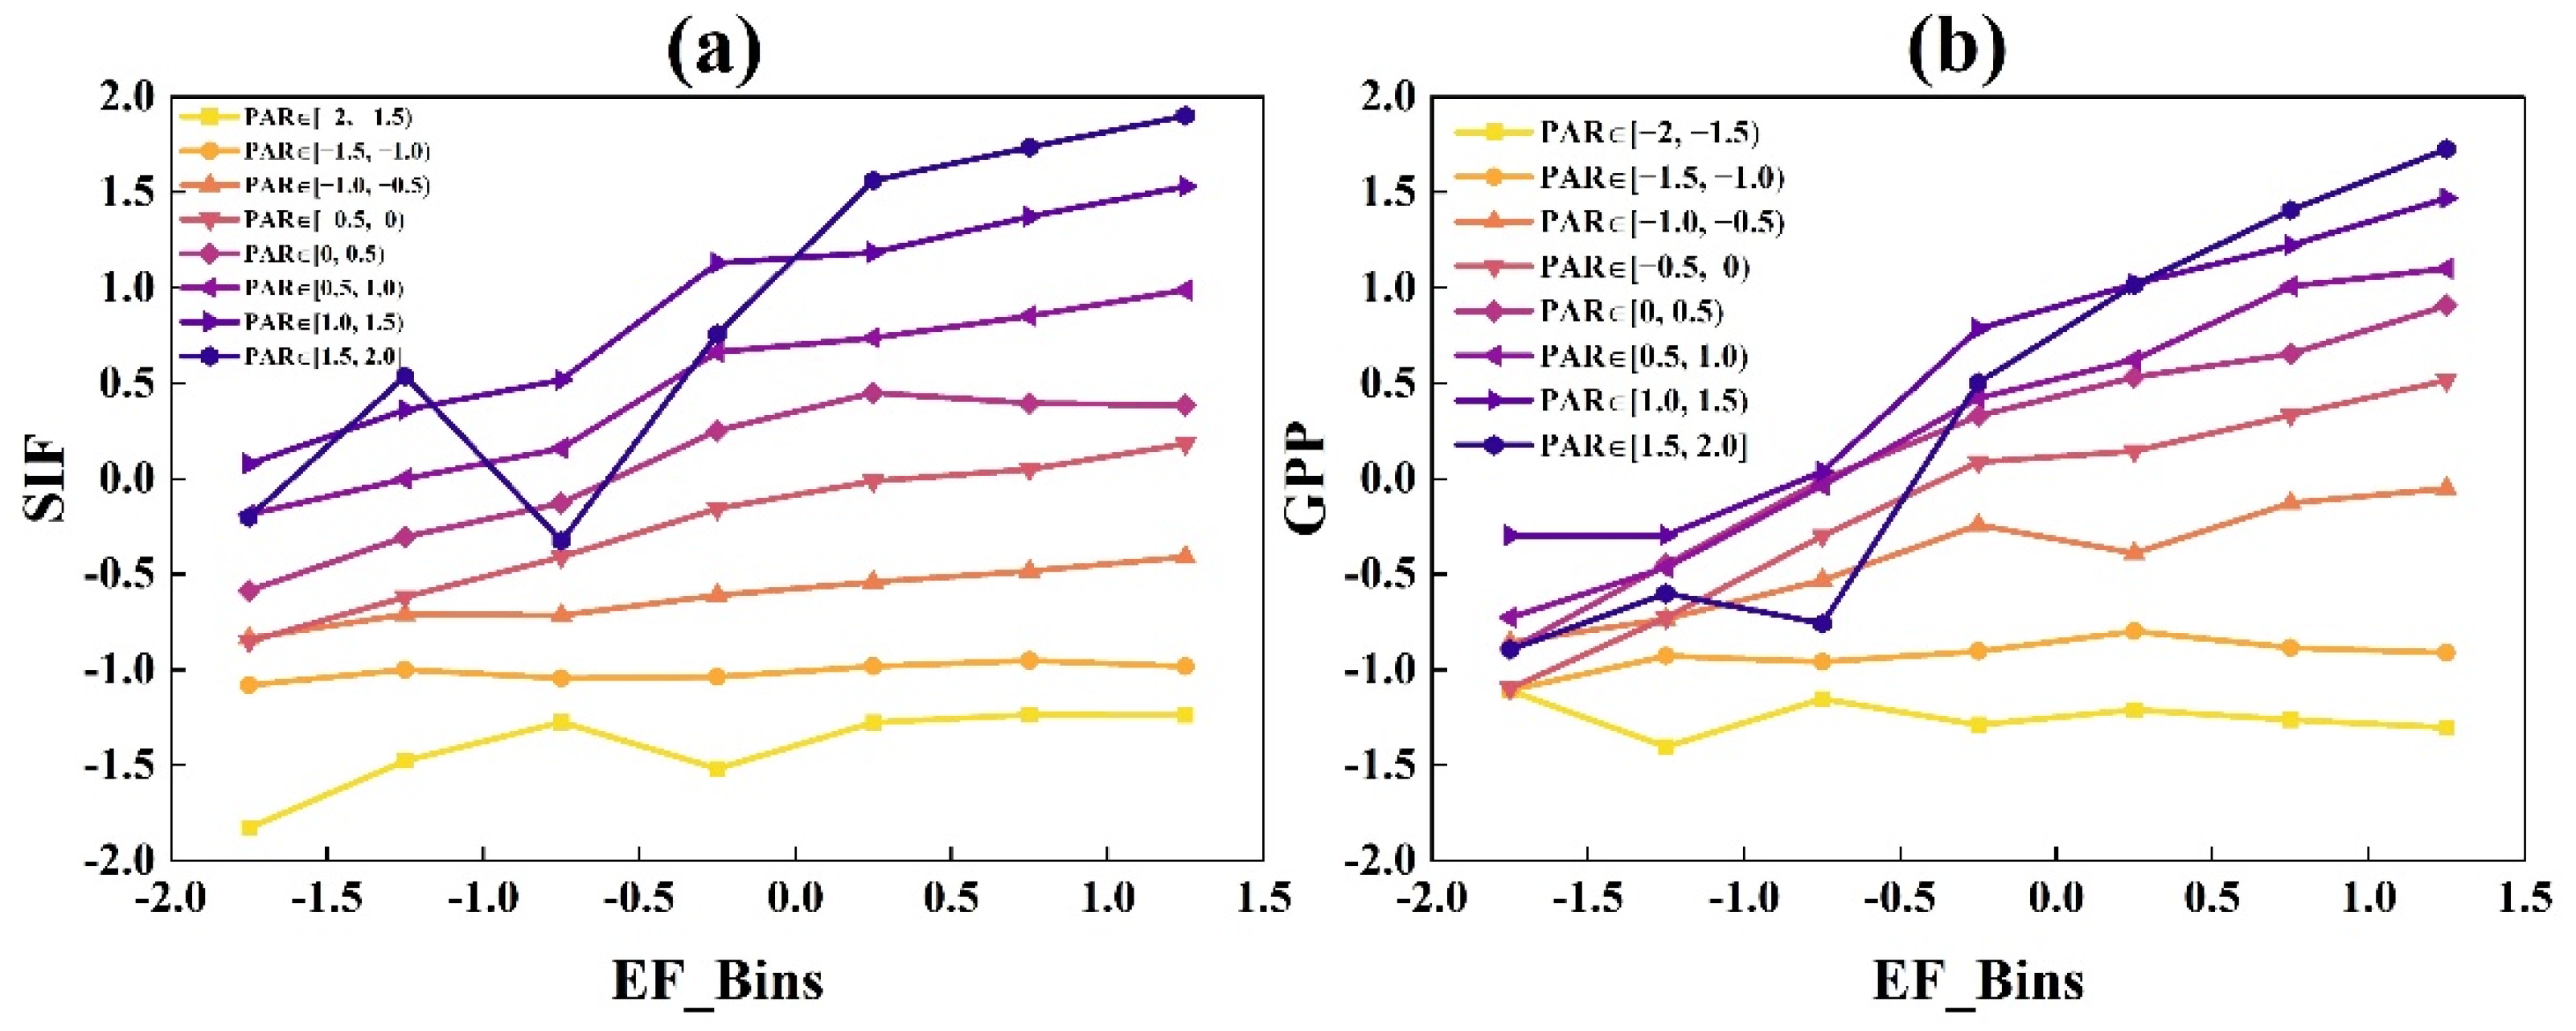
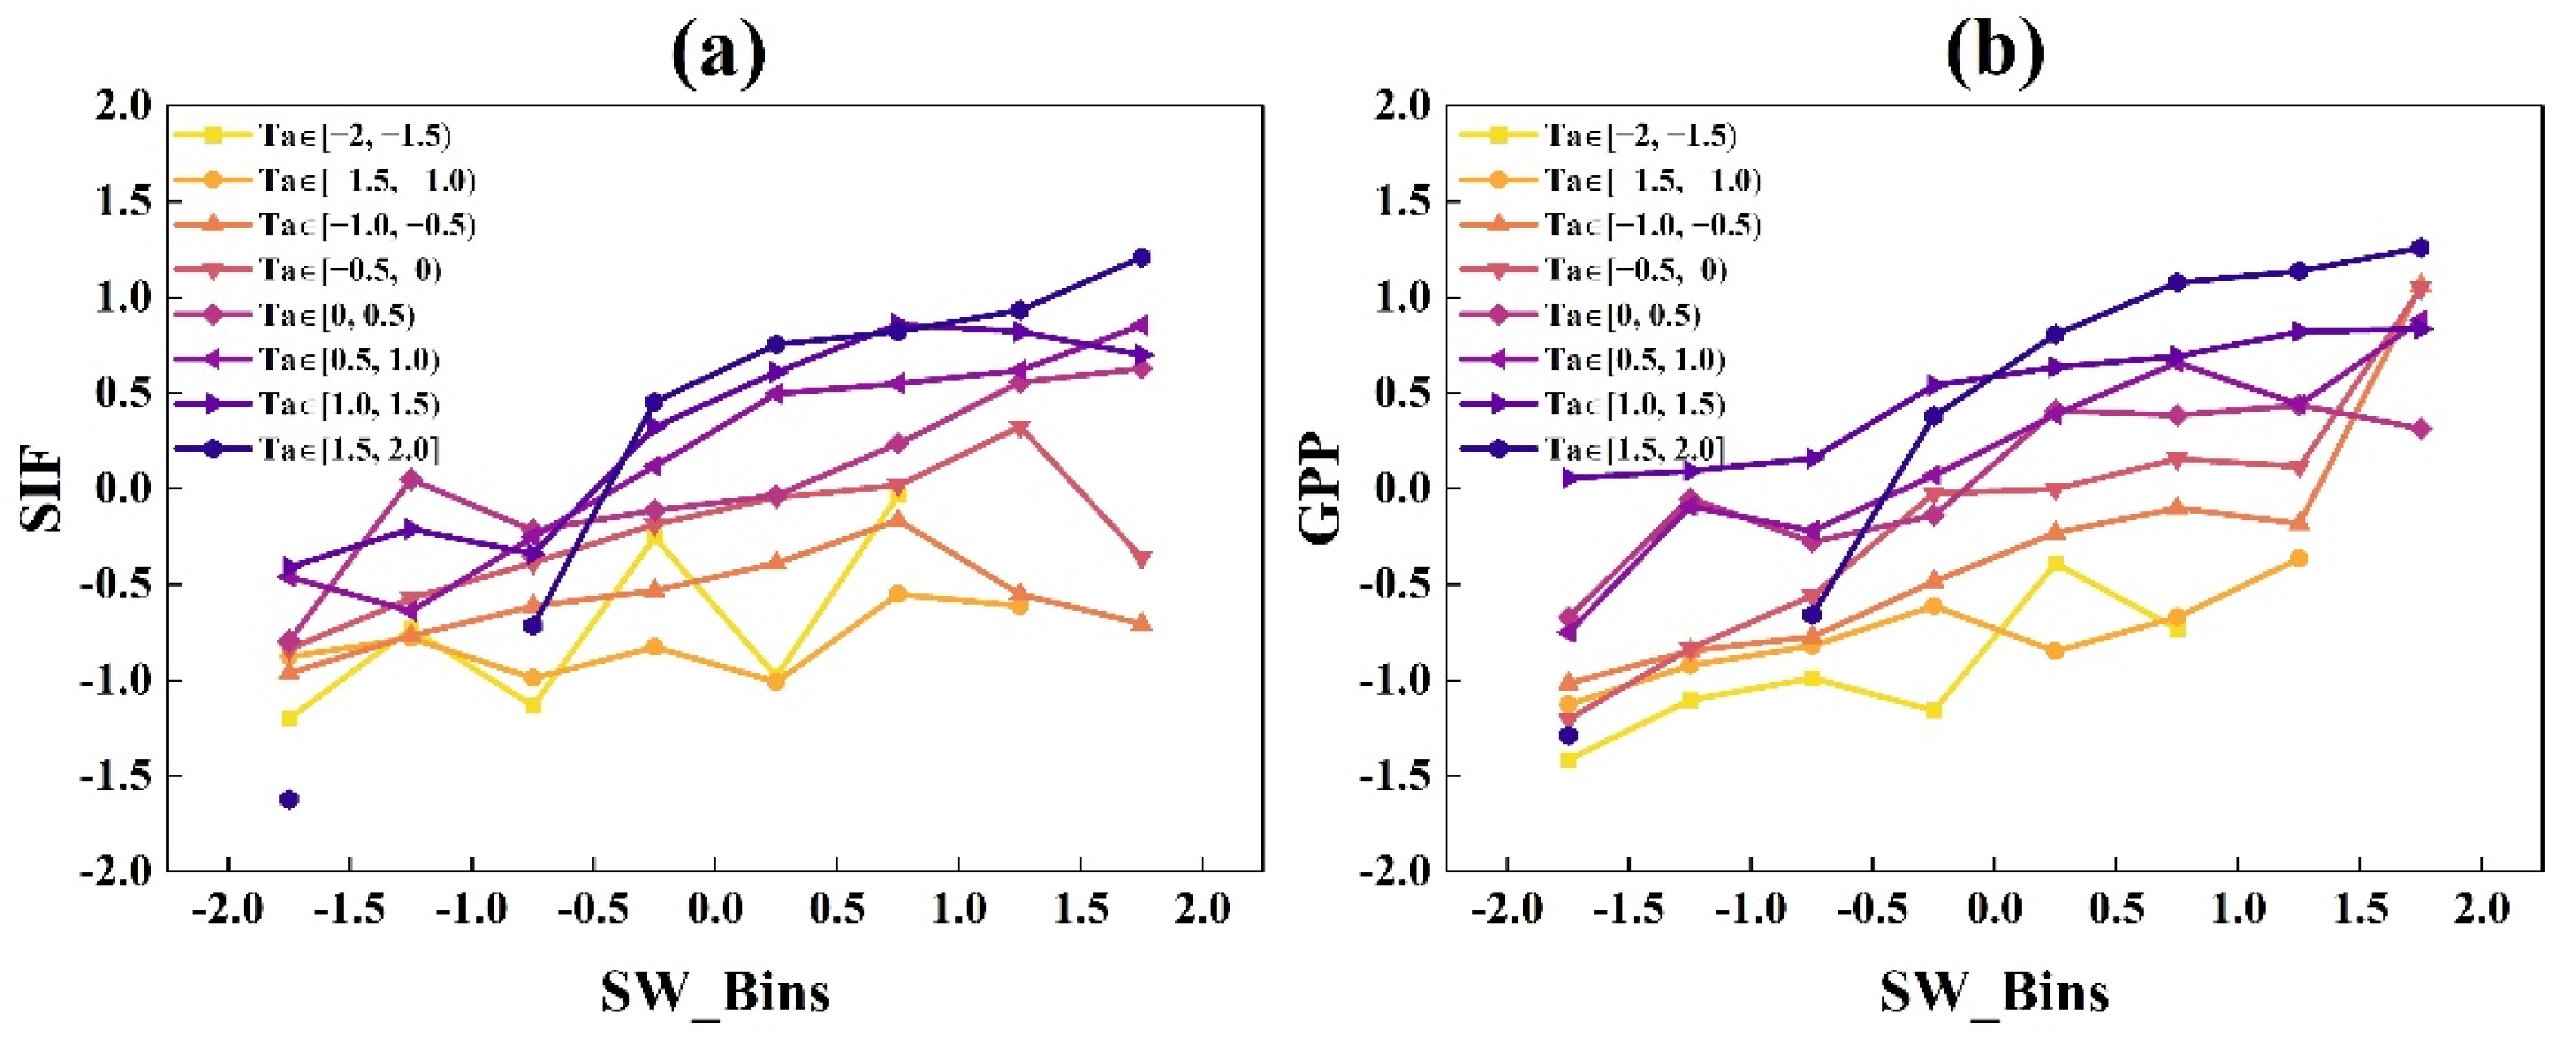
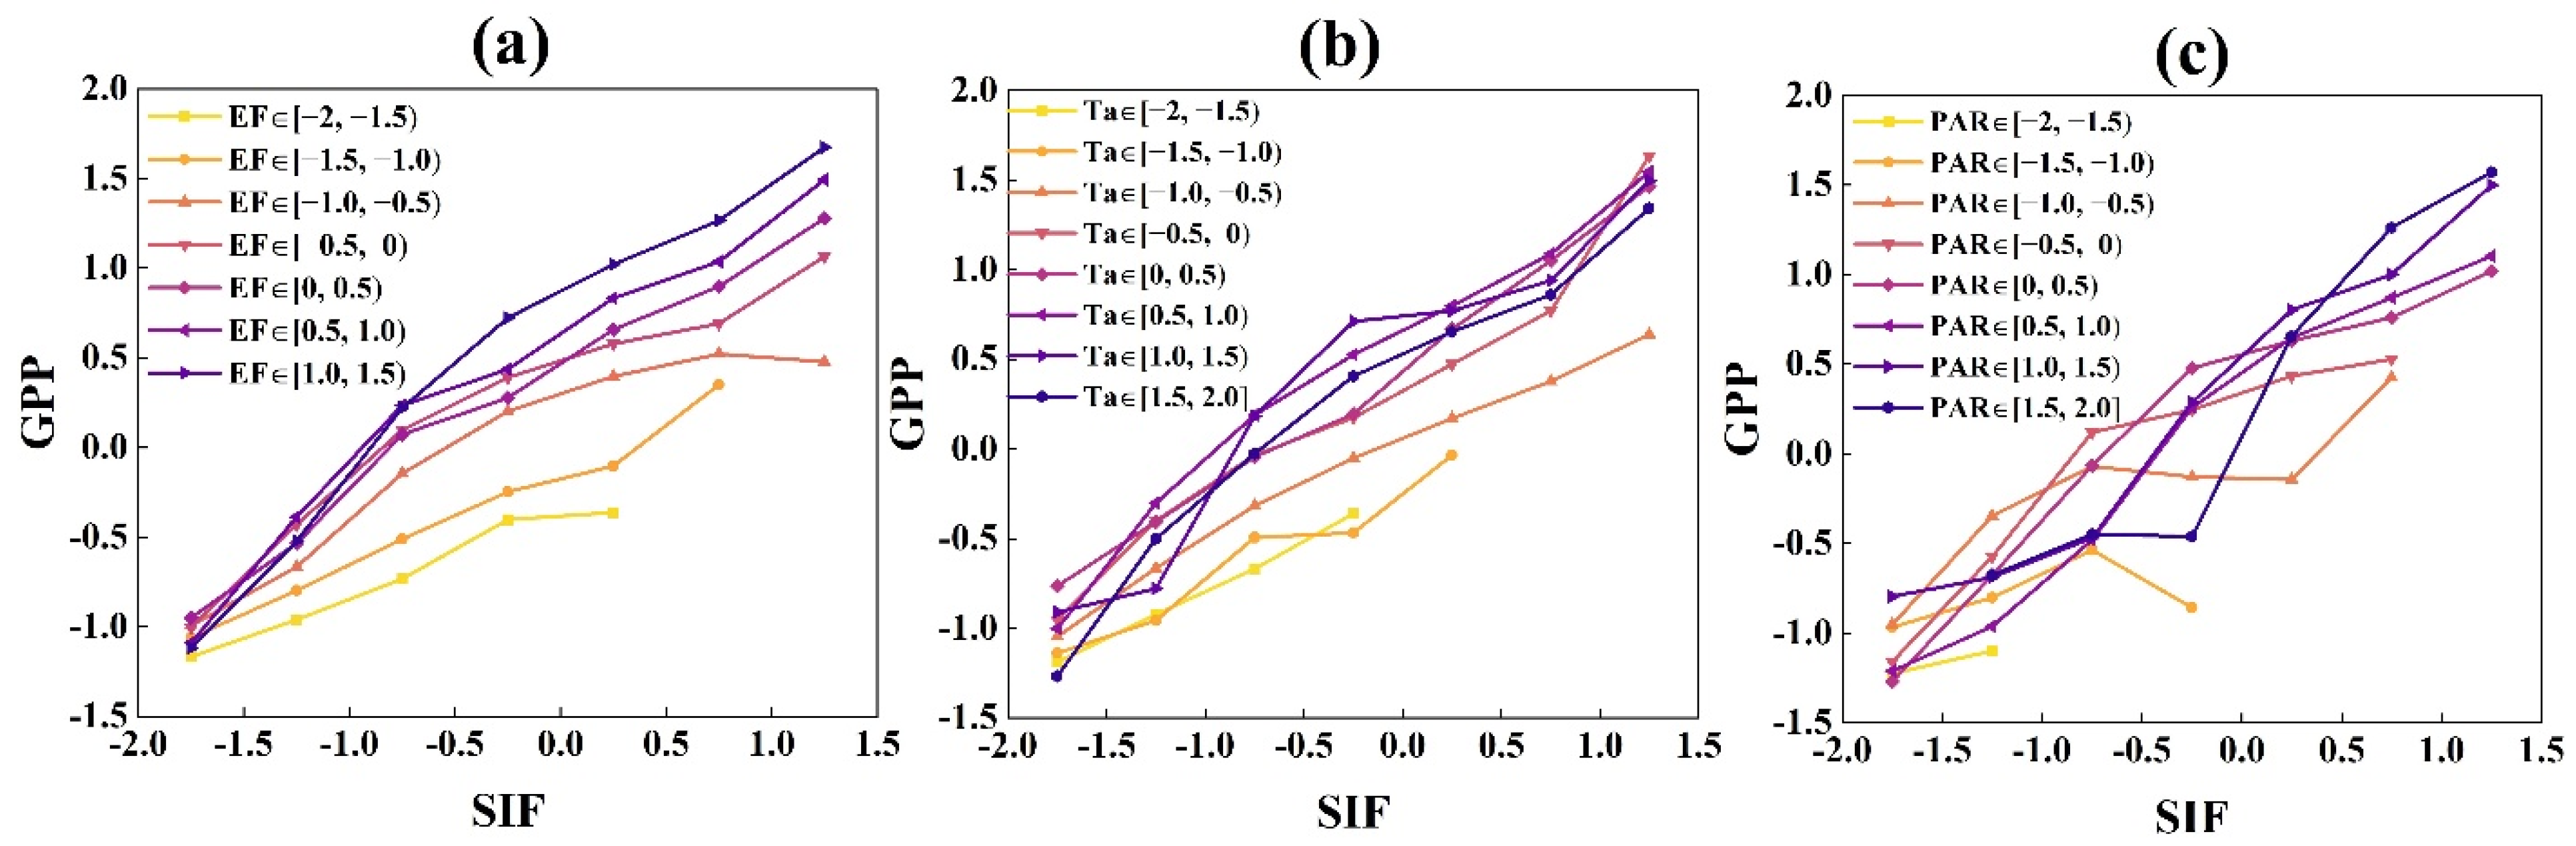
3.1.2. The Responses of GPP and SIF to EF and Ta under Different Radiation Bins

Section 3.1.1 found that the radiation drove the increase in GPP and SIF simultaneously. However, the increasing Ta and EF also could drive the increase in GPP and SIF. To understand the impact of Ta and EF on GPP and SIF, we investigated the half-hourly responses of GPP and SIF to the Ta and EF under different PAR bins, respectively. Figure 4 and Figure 5 showed the responses of GPP and SIF to EF and Ta in different PAR bins, respectively. Obviously, the impacts of EF and Ta on GPP and SIF were smaller than that of PAR though GPP and SIF both increased with increasing EF and Ta. The responses of GPP and SIF to EF and Ta also had difference. For the GPP and SIF EF responses, GPP increased faster than SIF in each PAR bin which indicated that EF had more influence on GPP than on SIF. Similarly, for the GPP and SIF Ta responses, GPP and SIF both increased first then decreased with increasing Ta bins, while GPP increased and decreased faster than SIF which indicated that GPP was more sensitive to Ta. In general, PAR was the main factor driving the increase in GPP and SIF, and EF and Ta had less influence on GPP and SIF than PAR especially on SIF.

3.1.3. The Light Responses of GPP and TROPOSIF

Figure 6 showed the responses of TROPOSIF and GPP to SW in different EF bins. GPP and SIF exhibited similar responses to SW which both increased with increasing SW. While in the lower EF bins, SIF increased faster than GPP, and the increase speeds of GPP were gradually higher than that of SIF with increasing EF which indicated that SIF was more sensitive to SW than GPP when the water status was not well. Moreover, both SIF and GPP showed positive correlation with EF, and the GPP increased larger than SIF and EF had more influence on GPP than on SIF. Figure 7 showed the light responses of GPP and TROPOSIF under different Ta bins. In general, GPP and SIF had similar responses to the SW which both increased with increasing SW bins. However, the difference between the responses of GPP and SIF to SW in different Ta bins was not as significant as that in different EF bins.

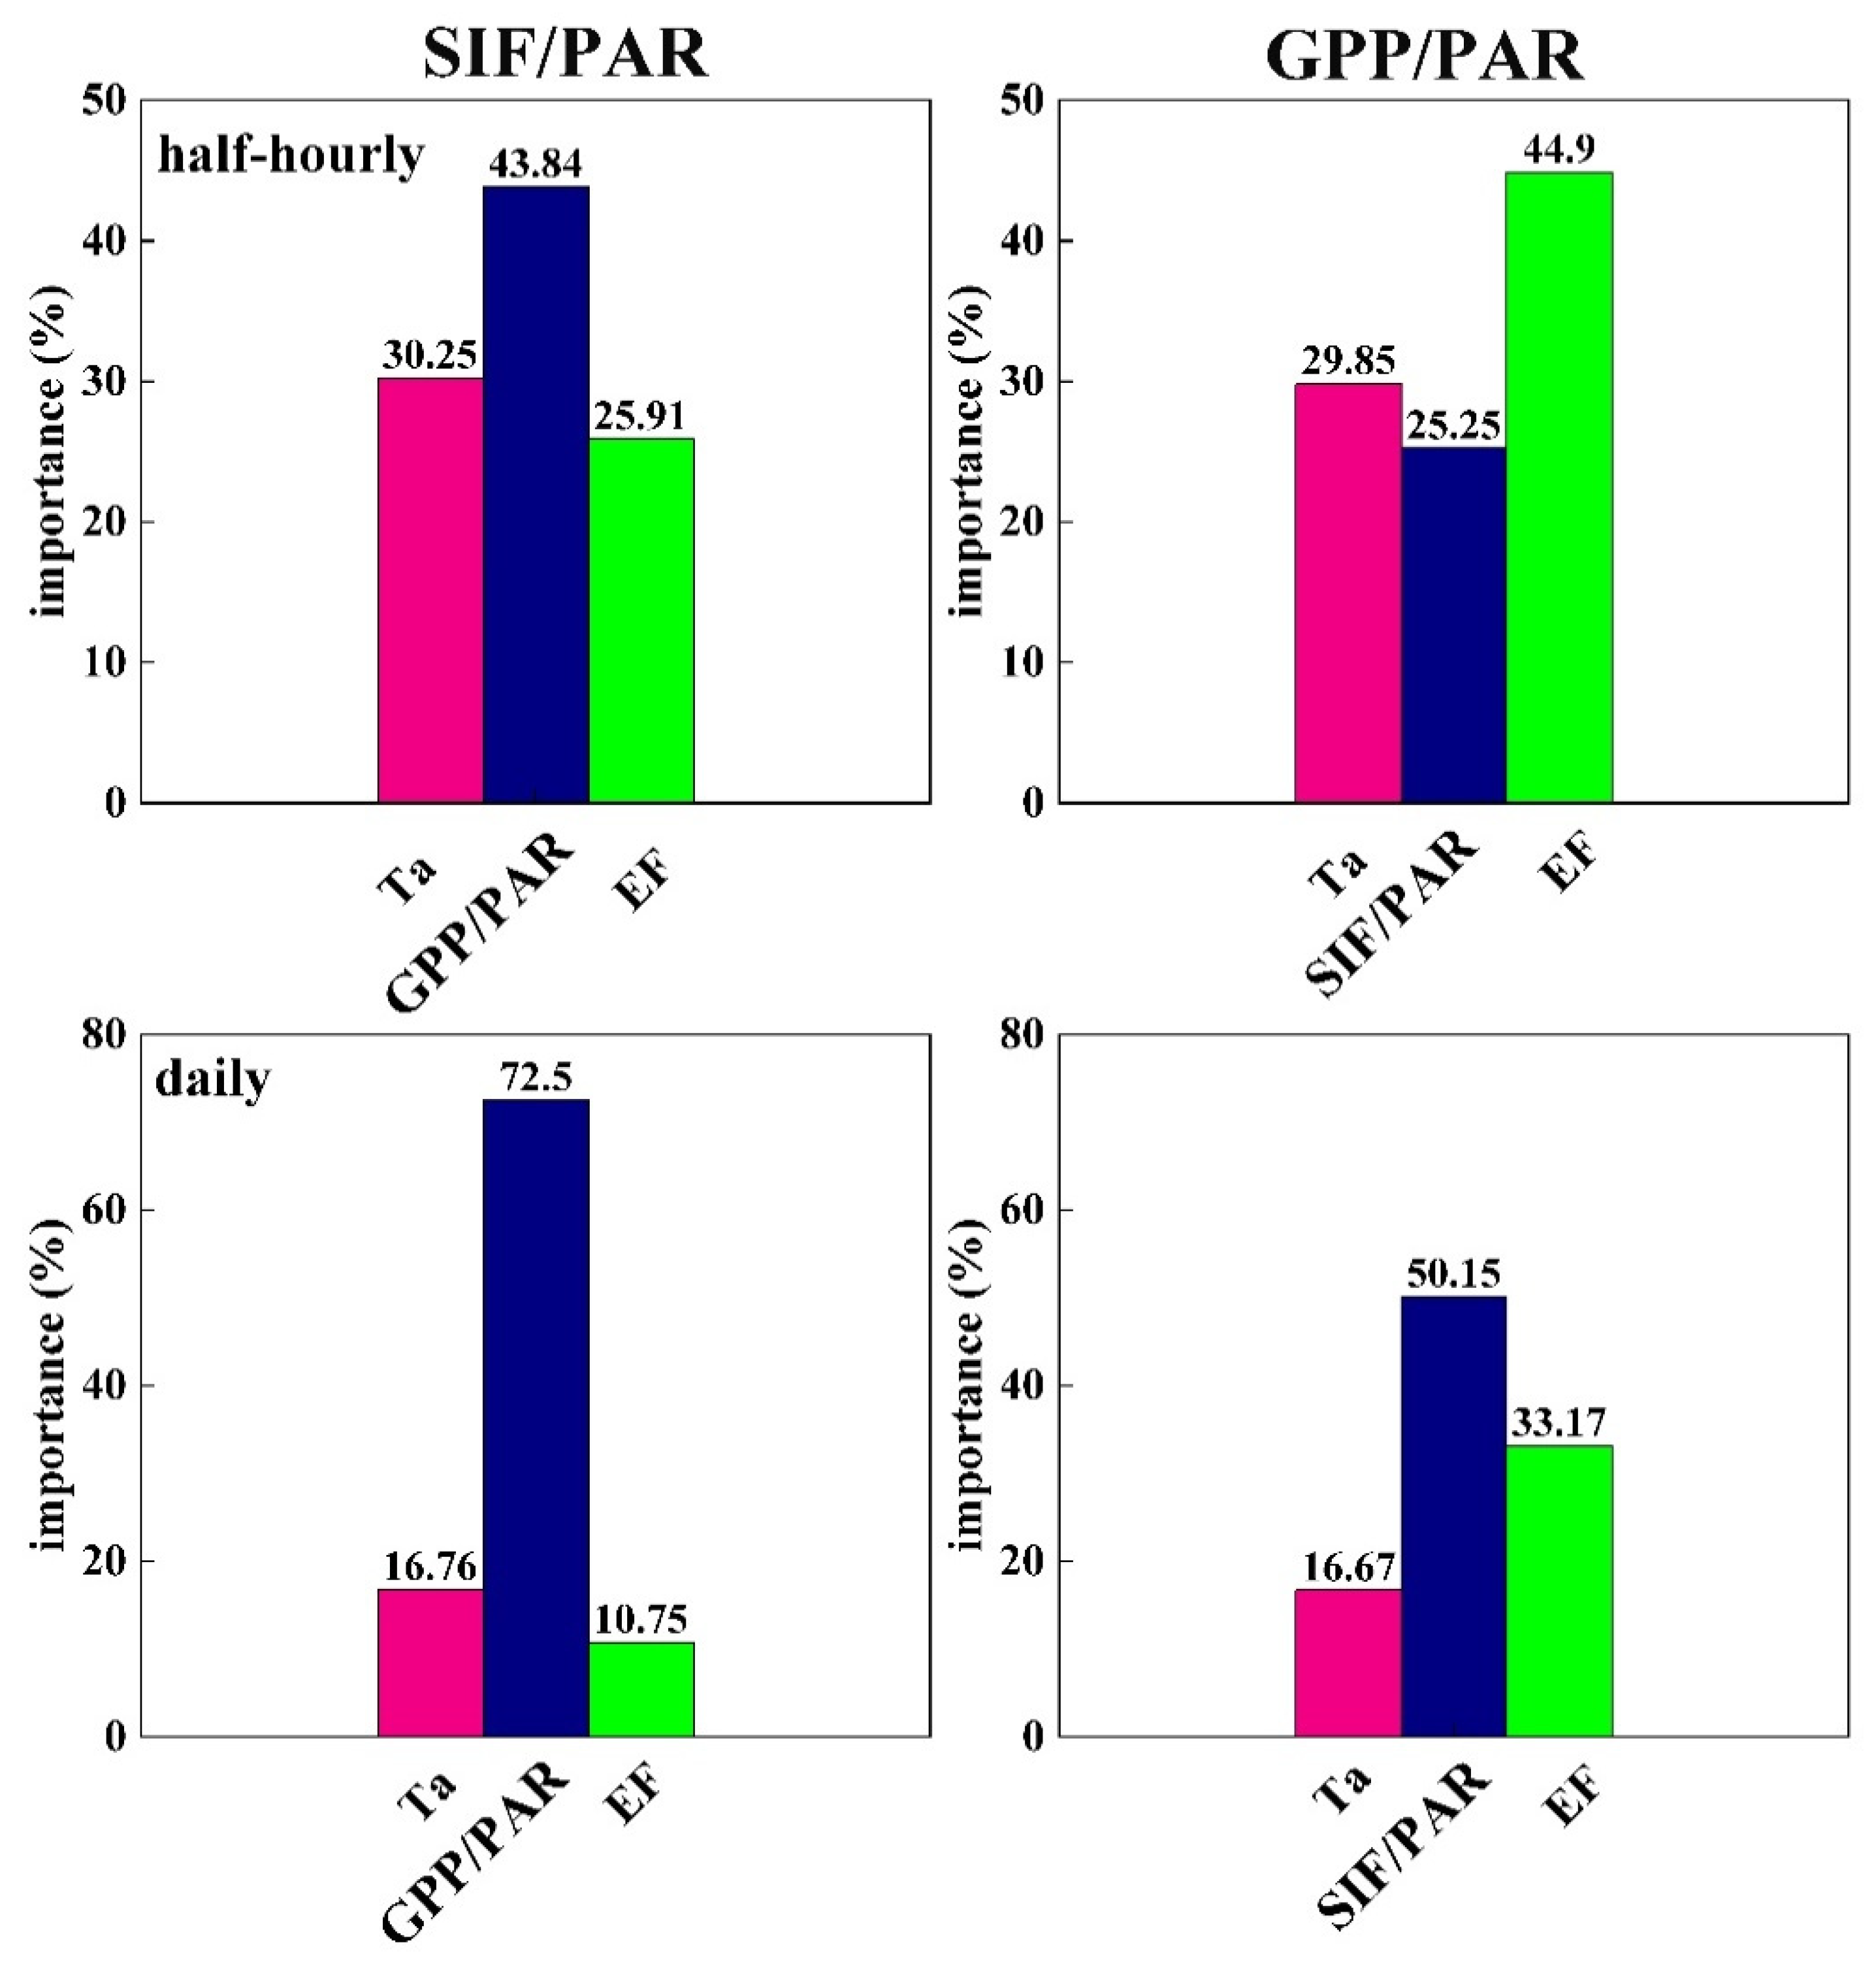
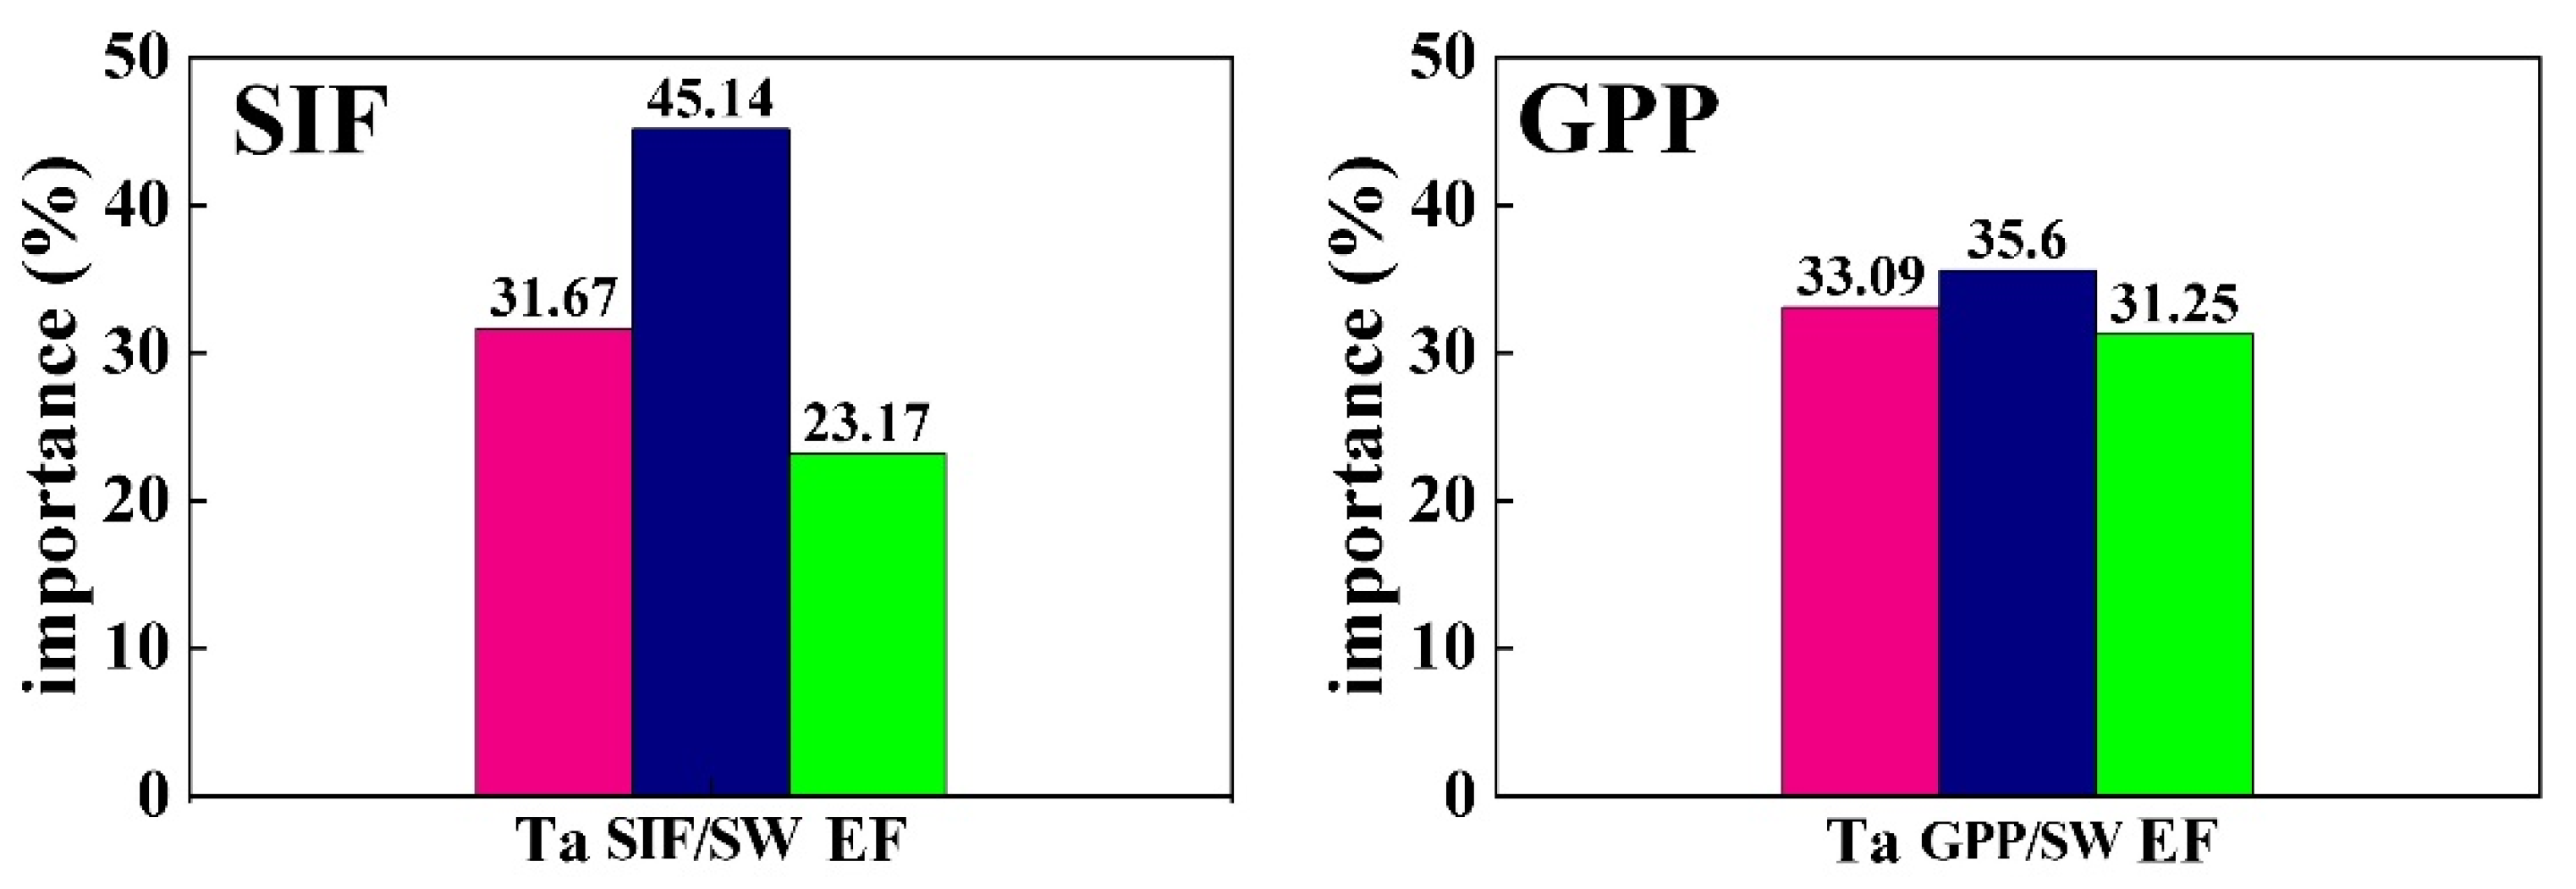
3.2. The Factors Influenced the Slopes of SIF and GPP Light Response Curves

Section 3.1 illustrated that the slopes of SIF light response curves were less influenced by EF and Ta than that of GPP, and were always related to the slopes of GPP light response curves which were more sensitive to EF and Ta. Therefore, to explore whether the dynamics of the slopes of SIF light response curves were regulated by the environmental variables (EF and Ta) or induced by the changes of GPP light response curves related to EF and Ta, we calculated the importance of GPP/PAR(SW) ratio (slopes of GPP light response curves), EF and Ta in SIF/PAR(SW) ratio (slopes of SIF light response curves) for both TROPOSIF and site-observed data at DM site based on RF. The importance of SIF/PAR(SW) ratio, Ta and EF in GPP/PAR(SW) ratio were also calculated. The calculation of the importance (Figure 8 and Figure 9) illustrated whether the dynamics in slopes of SIF light response curves were induced by GPP/PAR(SW) ratio related to EF and Ta or directly by EF and Ta, or which controlled it more. Figure 8 showed that at DM site, the GPP/PAR ratio had the highest importance in SIF/PAR at both half-hourly (43.84%) and daily (72.5%) scales, and the importance of Ta and EF were lower than that of GPP/PAR ratio (half-hourly: 30.25%, 25.91%; daily: 16.76%, 10.75%). While the environmental variables (EF and Ta) had the higher importance in GPP/PAR ratio at half-hourly scale which demonstrated that the slopes of GPP light response curves were more influenced by the environmental parameters. For the daily scale at DM site, though the importance of SIF/PAR ratio was higher than EF and Ta, the importance of Ta and EF was higher than that in SIF/PAR ratio. For the daily TROPOSIF and GPP, the results of importance calculation were similar to that of the DM site (Figure 9). The importance of GPP/SW ratio was higher than that of Ta and EF in SIF/SW. For the GPP/SW ratio, the EF had the most importance, followed by Ta, the SIF/SW ratio had the lowest importance.

3.3. Effects of Different Responses of GPP and SIF to Environment on the GPP–SIF Relationship

We analyzed the variations in the GPP–SIF relationship under different environmental conditions. Since the responses of the site-observed SIF and TROPOSIF to the environment were similar, so we just showed the GPP–SIF relationship under different environmental conditions at DM site here. Figure 10 and Figure 11 showed the half-hourly and daily GPP–SIF relationship at DM site in different EF, Ta and PAR bins, respectively. For both temporal scales, the GPP–SIF relationship showed similar patterns. In different EF, Ta and PAR bins, GPP and SIF exhibited positive correlation. The difference in the GPP–SIF relationship under these three environmental parameters was the dynamics in the slope values of the GPP–SIF relationship. The GPP–SIF relationship appeared non-linear in each EF bin and the slope values of the GPP–SIF relationship improved with increasing EF bins. Under different Ta bins, GPP and SIF also had non-linear relationship in each Ta bins and the slope values of GPP–SIF relationship increased with increasing Ta except for the highest Ta bin (Ta [1.5, 2.0]). For the GPP–SIF relationship in different PAR bins, there were no much difference in the slope values of GPP–SIF relationship especially at the daily scales.
Figure 12 showed the half-hourly GPP–SIF relationship at DM site in different EF and Ta bins, respectively. Table 1 was the corresponding fitted equations and parameters for Figure 12. The correlation between GPP and SIF was gradually improved with increasing EF (R2 values increased from 0.18 to 0.76). With increasing in EF, the slope values of the regression line (a values in Table 1) were also improved (a values increased from 0.52 to 1.55). For the GPP–SIF relationship in different Ta bins, the R2 values were from 0.23 to 0.50 and the correlation between GPP and SIF first increased then decreased with increasing Ta. The slope values of the fitted lines (a values in Table 1) increased with increasing Ta bins (a values increased from 0.45 to 1.49). In general, GPP and SIF showed a various relationship influenced by the environment related to EF and Ta.

4. Discussion

4.1. The Different Responses of GPP and SIF to the Environment

In this study, we investigated the responses of GPP and SIF to the different environmental variables from a corn tower-based SIF and TROPOSIF based on the binning method. The difference between GPP and SIF light responses had been reported in previous studies [21,23]. Our results also found that at both site and satellite scales, there were divergencies in the light response speeds between GPP and SIF which was affected by Ta and EF though their light response curves were similar. When Ta and EF were lower, SIF increased faster than GPP. With the increase in Ta and EF, the difference between increase speeds of GPP and SIF was gradually reduced. Additionally, the sensitivities of GPP and SIF to radiation, temperature, and water availability were different. SIF was more sensitive to radiation than to Ta and EF, and the sensitivity of GPP to radiation was more regulated by the Ta and EF, which was consistent with studies by Yang, Magney, Albert, Richardson, Frankenberg, Stutz, Grossmann, Burns, Seyednasrollah, Blanken, and Bowling [21]. The above results highlighted the fact that, although light energy is the common driver for both GPP and SIF, the sensitivities of GPP and SIF to radiation were different and relied on the environmental conditions related to temperature and water availability.
Kolari et al. [48] found that the regulation mechanisms of light and dark reactions were different. Light reactions are more sensitive to radiation but relatively less sensitive to temperature and water availability. In contrast, dark reactions are totally determined by plenty of biochemical reactions, which are more sensitive to the parameters that influence the enzyme activity with related to temperature. In addition, carbon fixation is also influenced by intercellular CO2 concentration, which is affected by stomatal conductance related to water availability. GPP is the result of light and dark reactions, while chlorophyll fluorescence is more involved in light reactions. Therefore, GPP light response curves were more influenced by temperature and EF than SIF light response curves, as our results show in Section 3.1, indicating that SIF was more sensitive to radiation and less sensitive to EF and Ta than GPP. Additionally, the lower sensitivity of SIF to Ta and EF may result in the decoupling of GPP and SIF, especially in the lower EF and Ta, which provides important evidence that SIF is no longer a strong proxy of GPP when the temperature and water status were not suitable for the vegetation growth.
In the aspect of light energy utilization, SIF is one of the energy excitation pathways used to balance the absorbed and utilized energy in photosynthesis and to avoid light damage in the photosystem (e.g., high light intensity but in cold or dry environments) [4,20,49,50,51]. When environmental conditions are not suitable for vegetation growth (low temperature or drought), the vegetation adjusts its strategy of light energy utilization by adjusting light energy partitioning to avoid light damage in the photosystem, which could lead to the relative changes in the efficiency of converting per unit photon into GPP and SIF [4,51]. Consistent with our results, the slopes of SIF light response curves were higher than those of GPP in lower EF and Ta bins (SIF increased faster than GPP in lower EF and Ta), which indicated that the efficiency of converting per unit photon into SIF was higher than that of GPP, in order to dissipate light energy quickly. With the improvement of EF and Ta, temperature and water status became increasingly suitable for vegetation growth. As shown in our results, the slopes of GPP light response curves were close to or higher than those of SIF, which indicated that vegetation may try to seek the maximum photosynthesis efficiency under suitable conditions. The above-mentioned points illustrate that the dynamics in the slopes of SIF light response curves may be induced by the regulation of photosynthesis, related to EF and Ta to some degree. Consistent with our hypothesis, we found that the importance of GPP/PAR (SW) ratio was higher than that of Ta and EF in the SIF/PAR (SW) ratio (Figure 8 and Figure 9), which indicated that the response of SIF to incident radiation was more regulated by photosynthesis, rather than directly influenced by environmental parameters (EF and Ta). The divergent and unstable relationship between the light use efficiency of GPP and SIF has been reported in many studies [35,52,53,54,55,56], largely because SIF is not the only pathway of energy excitation regulated by photosynthesis [18,19,20]. Non-photochemical quenching (NPQ) is another important energy excitation pathway regulated by photosynthesis, which may be the reason why the importance of the predicator-SIF/PAR (SW) ratio in the GPP/PAR(SW) ratio prediction was lower. The byproducts of photosynthesis regulation include not only SIF but also NPQ, which further implies that only using SIF to characterize the light use efficiency of photosynthesis may not be a better option.

4.2. The Influence of Different Responses of GPP and SIF to the Environment on the GPP–SIF Relationship

We have found that the consistency of GPP and SIF light responses was influenced by EF and Ta (Section 3.1). When temperature and water status were not suitable for the vegetation growth (lower EF and Ta), the consistency between GPP and SIF was destroyed and the correlation between GPP and SIF was lower, as shown in Table 1. With the improvement in Ta and EF, the correlation between GPP and SIF was improved because the consistency of the SIF and GPP light responses gradually improved. The dynamics in the GPP–SIF correlation further indicated that, when the environmental conditions are not suitable for the vegetation growth, directly using SIF to quantify GPP causes greater uncertainty.
The strong linear and non-linear GPP–SIF relationship has been reported in many studies. Here, we found that the half-hourly and daily GPP–SIF relationship at the DM site was non-linear. For the non-linear GPP–SIF relationship at the DM site, the slope values of the fitted GPP–SIF relationship curves increased with increasing Ta and EF, mostly caused by the different sensitivities of GPP and SIF to temperature and water status. As shown in Section 3.1, GPP was more sensitive to EF and Ta than SIF, and in any radiation bins, GPP varied with EF and Ta faster than SIF.

4.3. Limitations

In this study, we investigated the responses of GPP and SIF to different environmental conditions based on the binning method and found that the responses of GPP and SIF to different environmental parameters had fundamental differences, which further resulted in a dynamic GPP–SIF relationship under different environmental conditions. Though these results were consistent with some previous studies, we had to highlight some limitations in this study. Firstly, the SIF derived from remote sensing was different from the traditional measurements of the chlorophyll fluorescence at a leaf scale [4]. Therefore, when we interpret and apply the conclusions of our study, we must recognize that these conclusions are applicable to remote sensing SIF and not necessarily to laboratory data. Moreover, we did not quantify NPQ to explain the dynamic GPP–SIF relationship in this study. Though we discussed the potential impact of NPQ on the difference in the GPP and SIF light response curves in Section 4.1, we cannot find a suitable indicator characterizing NPQ to explore and validate the exact role of NPQ on the GPP–SIF relationship, which is mostly caused by the difficulties in the quantification of NPQ through remote sensing. Although many studies had shown that PRI (photochemical reflectance index) may be an effective indicator of NPQ, there were still many controversies and uncertainties [57,58]. The photoprotective mechanisms of the photosynthetic apparatus consist of not only SIF, but also NPQ [49,50,59,60]. Therefore, considering NPQ is very important to correctly understand the GPP–SIF relationship. Future research should be dedicated to determining an appropriate method to measure NPQ and apply it in the GPP–SIF relationship. Finally, the site-observed dataset we used in this study was from a corn site: the C4 plant. Therefore, the conclusions obtained in this study may not be applicable in the C3 plant. We need to investigate the relationship between GPP and SIF further for other plant function types (PFTs).

5. Conclusions

In this study, we used tower-based SIF, satellite-derived SIF and eddy covariance GPP data from two continuous growing seasons to investigate the difference between the responses of GPP and SIF to the environmental variables, including radiation, air temperature, and EF, based on the binning method. The conclusions are as follows:
(1)
GPP and SIF had similar light response trends, which both increased with increasing radiation, while the rates of increases in GPP and SIF exhibited divergence related to air temperature and water availability. When Ta and EF values were lower, SIF increased faster than GPP. With the increase in Ta and EF, the difference between the increase rates of GPP and SIF gradually reduced.
(2)
The GPP–SIF relationship was decoupled when the environment was not suitable for vegetation growth, and the correlation between GPP and SIF was gradually improved with increasing Ta and EF.
(3)
The slope of the GPP–SIF relationship was mainly affected by Ta and EF, which increased with increasing EF and Ta.

Supplementary Materials

The following supporting information can be downloaded at: https://www.mdpi.com/article/10.3390/app14020771/s1, Figure S1: The comparison of the half-hourly responses of GPP and SIF to PAR under different EF bins.; Figure S2: The responses of daily SIF (a) and GPP (b) to the PAR under different EF bins.; Figure S3: The comparison of half-hourly responses of GPP and SIF to PAR under different Ta bins.; Figure S4: The responses of daily SIF (a) and GPP (b) to the PAR under different Ta bins.

Author Contributions

Conceptualization, J.B. and R.S.; methodology, J.B., H.Z. and R.S.; software, J.B. and H.Z.; validation, J.B., H.Z. and R.S.; formal analysis, J.B. and H.Z.; investigation, J.B. and H.Z.; resources, J.B.; data curation, X.L. and L.L.; writing—original draft preparation, J.B.; writing—review and editing, J.B., R.S., X.L. and L.L.; visualization, J.B.; supervision, R.S.; project administration, R.S.; funding acquisition, R.S. All authors have read and agreed to the published version of the manuscript.

Funding

This research was funded by the National Natural Science Foundation of China, grant number: 42271330.

Institutional Review Board Statement

Not applicable.

Informed Consent Statement

Not applicable.

Data Availability Statement

Dataset available on request from the authors.

Acknowledgments

We thank Shaomin Liu et al. for sharing eddy covariance data at DM site (data accessed on 22 May 2022) (https://data.tpdc.ac.cn/en/). We also thank the hard work of Luis Guanter et al. for producing the TROPOMI SIF and sharing this dataset (https://s5p-troposif.noveltis.fr/data-access/). This study also used the eddy covariance data acquired by the AmeriFlux, we sincerely thank all AmeriFlux communities of the eddy covariance data (https://ameriflux.lbl.gov/).

Conflicts of Interest

The authors declare no conflict of interest.

References

  1. Anav, A.; Friedlingstein, P.; Beer, C.; Ciais, P.; Harper, A.; Jones, C.; Murray-Tortarolo, G.; Papale, D.; Parazoo, N.C.; Peylin, P.; et al. Spatiotemporal patterns of terrestrial gross primary production: A review. Rev. Geophys. 2015, 53, 785–818. [Google Scholar] [CrossRef]
  2. Janssens, I.A.; Freibauer, A.; Ciais, P.; Smith, P.; Nabuurs, G.-J.; Folberth, G.; Schlamadinger, B.; Hutjes, R.W.A.; Ceulemans, R.; Schulze, E.D.; et al. Europe’s Terrestrial Biosphere Absorbs 7 to 12% of European Anthropogenic CO2 Emissions. Science 2003, 300, 1538–1542. [Google Scholar] [CrossRef] [PubMed]
  3. Battin, T.J.; Luyssaert, S.; Kaplan, L.A.; Aufdenkampe, A.K.; Richter, A.; Tranvik, L.J. The boundless carbon cycle. Nat. Geosci. 2009, 2, 598–600. [Google Scholar] [CrossRef]
  4. Porcar-Castell, A.; Tyystjärvi, E.; Atherton, J.; van der Tol, C.; Flexas, J.; Pfündel, E.E.; Moreno, J.; Frankenberg, C.; Berry, J.A. Linking chlorophyll a fluorescence to photosynthesis for remote sensing applications: Mechanisms and challenges. J. Exp. Bot. 2014, 65, 4065–4095. [Google Scholar] [CrossRef]
  5. Beer, C.; Reichstein, M.; Tomelleri, E.; Ciais, P.; Jung, M.; Carvalhais, N.; Rödenbeck, C.; Arain, M.A.; Baldocchi, D.; Bonan, G.B.; et al. Terrestrial Gross Carbon Dioxide Uptake: Global Distribution and Covariation with Climate. Science 2010, 329, 834–838. [Google Scholar] [CrossRef]
  6. Frankenberg, C.; Fisher, J.B.; Worden, J.; Badgley, G.; Saatchi, S.S.; Lee, J.-E.; Toon, G.C.; Butz, A.; Jung, M.; Kuze, A.; et al. New global observations of the terrestrial carbon cycle from GOSAT: Patterns of plant fluorescence with gross primary productivity. Geophys. Res. Lett. 2011, 38, L17706. [Google Scholar] [CrossRef]
  7. Fu, Z.; Stoy, P.C.; Poulter, B.; Gerken, T.; Zhang, Z.; Wakbulcho, G.; Niu, S. Maximum carbon uptake rate dominates the interannual variability of global net ecosystem exchange. Glob. Chang. Biol. 2019, 25, 3381–3394. [Google Scholar] [CrossRef]
  8. Ač, A.; Malenovský, Z.; Olejníčková, J.; Gallé, A.; Rascher, U.; Mohammed, G. Meta-analysis assessing potential of steady-state chlorophyll fluorescence for remote sensing detection of plant water, temperature and nitrogen stress. Remote Sens. Environ. 2015, 168, 420–436. [Google Scholar] [CrossRef]
  9. Ryu, Y.; Baldocchi, D.D.; Kobayashi, H.; van Ingen, C.; Li, J.; Black, T.A.; Beringer, J.; van Gorsel, E.; Knohl, A.; Law, B.E.; et al. Integration of MODIS land and atmosphere products with a coupled-process model to estimate gross primary productivity and evapotranspiration from 1 km to global scales. Glob. Biogeochem. Cycles 2011, 25, GB4017. [Google Scholar] [CrossRef]
  10. Jung, M.; Reichstein, M.; Bondeau, A. Towards global empirical upscaling of FLUXNET eddy covariance observations: Validation of a model tree ensemble approach using a biosphere model. Biogeosciences 2009, 6, 2001–2013. [Google Scholar] [CrossRef]
  11. Jung, M.; Reichstein, M.; Margolis, H.A.; Cescatti, A.; Richardson, A.D.; Arain, M.A.; Arneth, A.; Bernhofer, C.; Bonal, D.; Chen, J.; et al. Global patterns of land-atmosphere fluxes of carbon dioxide, latent heat, and sensible heat derived from eddy covariance, satellite, and meteorological observations. J. Geophys. Res. Biogeosci. 2011, 116, G00J07. [Google Scholar] [CrossRef]
  12. Zhang, H.; Sun, R.; Peng, D.; Yang, X.; Wang, Y.; Hu, Y.; Zheng, S.; Zhang, J.; Bai, J.; Li, Q. Spatiotemporal Dynamics of Net Primary Productivity in China’s Urban Lands during 1982–2015. Remote Sens. 2021, 13, 400. [Google Scholar] [CrossRef]
  13. Zhang, H.; Sun, R.; Xiao, Z.; Wang, J.; Wang, M. Global 500 M Spatial Resolution Gross and Net Primary Productivity Products Based on an Improved Light Use Efficiency Model from 2000–2019. In Proceedings of the IGARSS 2022—2022 IEEE International Geoscience and Remote Sensing Symposium, Kuala Lumpur, Malaysia, 17–22 July 2022; pp. 5762–5765. [Google Scholar]
  14. Ryu, Y.; Berry, J.A.; Baldocchi, D.D. What is global photosynthesis? History, uncertainties and opportunities. Remote Sens. Environ. 2019, 223, 95–114. [Google Scholar] [CrossRef]
  15. Frankenberg, C.; Berry, J. 3.10—Solar Induced Chlorophyll Fluorescence: Origins, Relation to Photosynthesis and Retrieval. In Comprehensive Remote Sensing; Liang, S., Ed.; Elsevier: Oxford, UK, 2018; pp. 143–162. [Google Scholar]
  16. Monteith, J.L. Solar Radiation and Productivity in Tropical Ecosystems. J. Appl. Ecol. 1972, 9, 747–766. [Google Scholar] [CrossRef]
  17. Liu, X.; Liu, Z.; Liu, L.; Lu, X.; Chen, J.; Du, S.; Zou, C. Modelling the influence of incident radiation on the SIF-based GPP estimation for maize. Agric. For. Meteorol. 2021, 307, 108522. [Google Scholar] [CrossRef]
  18. Renger, G. Chapter 1 Overview of Primary Processes of Photosynthesis. In Primary Processes of Photosynthesis, Part 1: Principles and Apparatus; The Royal Society of Chemistry: London, UK, 2008; Volume 8, pp. 5–35. [Google Scholar]
  19. Verma, M.; Schimel, D.; Evans, B.; Frankenberg, C.; Beringer, J.; Drewry, D.T.; Magney, T.; Marang, I.; Hutley, L.; Moore, C.; et al. Effect of environmental conditions on the relationship between solar-induced fluorescence and gross primary productivity at an OzFlux grassland site. J. Geophys. Res. Biogeosci. 2017, 122, 716–733. [Google Scholar] [CrossRef]
  20. Butler, W.L. Energy Distribution in the Photochemical Apparatus of Photosynthesis. Annu. Rev. Plant Physiol. 1978, 29, 345–378. [Google Scholar] [CrossRef]
  21. Yang, J.C.; Magney, T.S.; Albert, L.P.; Richardson, A.D.; Frankenberg, C.; Stutz, J.; Grossmann, K.; Burns, S.P.; Seyednasrollah, B.; Blanken, P.D.; et al. Gross primary production (GPP) and red solar induced fluorescence (SIF) respond differently to light and seasonal environmental conditions in a subalpine conifer forest. Agric. For. Meteorol. 2022, 317, 108904. [Google Scholar] [CrossRef]
  22. Paul-Limoges, E.; Damm, A.; Hueni, A.; Liebisch, F.; Eugster, W.; Schaepman, M.E.; Buchmann, N. Effect of environmental conditions on sun-induced fluorescence in a mixed forest and a cropland. Remote Sens. Environ. 2018, 219, 310–323. [Google Scholar] [CrossRef]
  23. Pierrat, Z.; Magney, T.; Parazoo, N.C.; Grossmann, K.; Bowling, D.R.; Seibt, U.; Johnson, B.; Helgason, W.; Barr, A.; Bortnik, J.; et al. Diurnal and Seasonal Dynamics of Solar-Induced Chlorophyll Fluorescence, Vegetation Indices, and Gross Primary Productivity in the Boreal Forest. J. Geophys. Res. Biogeosci. 2022, 127, e2021JG006588. [Google Scholar] [CrossRef]
  24. Bai, J.; Zhang, H.; Sun, R.; Li, X.; Xiao, J.; Wang, Y. Estimation of global GPP from GOME-2 and OCO-2 SIF by considering the dynamic variations of GPP-SIF relationship. Agric. For. Meteorol. 2022, 326, 109180. [Google Scholar] [CrossRef]
  25. Chen, A.; Mao, J.; Ricciuto, D.; Lu, D.; Xiao, J.; Li, X.; Thornton, P.E.; Knapp, A.K. Seasonal changes in GPP/SIF ratios and their climatic determinants across the Northern Hemisphere. Glob. Chang. Biol. 2021, 27, 5186–5197. [Google Scholar] [CrossRef] [PubMed]
  26. Chen, A.; Mao, J.; Ricciuto, D.; Xiao, J.; Frankenberg, C.; Li, X.; Thornton, P.E.; Gu, L.; Knapp, A.K. Moisture availability mediates the relationship between terrestrial gross primary production and solar-induced chlorophyll fluorescence: Insights from global-scale variations. Glob. Chang. Biol. 2021, 27, 1144–1156. [Google Scholar] [CrossRef] [PubMed]
  27. Chen, R.; Liu, L.; Liu, X. Leaf chlorophyll contents dominates the seasonal dynamics of SIF/GPP ratio: Evidence from continuous measurements in a maize field. Agric. For. Meteorol. 2022, 323, 109070. [Google Scholar] [CrossRef]
  28. Helm, L.T.; Shi, H.; Lerdau, M.T.; Yang, X. Solar-induced chlorophyll fluorescence and short-term photosynthetic response to drought. Ecol. Appl. 2020, 30, e02101. [Google Scholar] [CrossRef]
  29. Marrs, J.K.; Reblin, J.S.; Logan, B.A.; Allen, D.W.; Reinmann, A.B.; Bombard, D.M.; Tabachnik, D.; Hutyra, L.R. Solar-Induced Fluorescence Does Not Track Photosynthetic Carbon Assimilation Following Induced Stomatal Closure. Geophys. Res. Lett. 2020, 47, e2020GL087956. [Google Scholar] [CrossRef]
  30. Martini, D.; Sakowska, K.; Wohlfahrt, G.; Pacheco-Labrador, J.; van der Tol, C.; Porcar-Castell, A.; Magney, T.S.; Carrara, A.; Colombo, R.; El-Madany, T.S.; et al. Heatwave breaks down the linearity between sun-induced fluorescence and gross primary production. New Phytol. 2022, 233, 2415–2428. [Google Scholar] [CrossRef]
  31. van der Tol, C.; Verhoef, W.; Rosema, A. A model for chlorophyll fluorescence and photosynthesis at leaf scale. Agric. For. Meteorol. 2009, 149, 96–105. [Google Scholar] [CrossRef]
  32. Kimm, H.; Guan, K.; Jiang, C.; Miao, G.; Wu, G.; Suyker, A.E.; Ainsworth, E.A.; Bernacchi, C.J.; Montes, C.M.; Berry, J.A.; et al. A physiological signal derived from sun-induced chlorophyll fluorescence quantifies crop physiological response to environmental stresses in the U.S. Corn Belt. Environ. Res. Lett. 2021, 16, 124051. [Google Scholar] [CrossRef]
  33. Zeng, Y.; Badgley, G.; Dechant, B.; Ryu, Y.; Chen, M.; Berry, J.A. A practical approach for estimating the escape ratio of near-infrared solar-induced chlorophyll fluorescence. Remote Sens. Environ. 2019, 232, 111209. [Google Scholar] [CrossRef]
  34. Zeng, Y.; Chen, M.; Hao, D.; Damm, A.; Badgley, G.; Rascher, U.; Johnson, J.E.; Dechant, B.; Siegmann, B.; Ryu, Y.; et al. Combining near-infrared radiance of vegetation and fluorescence spectroscopy to detect effects of abiotic changes and stresses. Remote Sens. Environ. 2022, 270, 112856. [Google Scholar] [CrossRef]
  35. Dechant, B.; Ryu, Y.; Badgley, G.; Zeng, Y.; Berry, J.A.; Zhang, Y.; Goulas, Y.; Li, Z.; Zhang, Q.; Kang, M.; et al. Canopy structure explains the relationship between photosynthesis and sun-induced chlorophyll fluorescence in crops. Remote Sens. Environ. 2020, 241, 111733. [Google Scholar] [CrossRef]
  36. Liu, S.; Che, T.; Xu, Z.; Ren, Z.; Tan, J.; Zhang, Y. Qilian Mountains Integrated Observatory Network: Dataset of Heihe Integrated Observatory Network (An Observation System of Meteorological Elements Gradient of Daman Superstation, 2019); National Tibetan Plateau Third Pole Environment Data Center: Beijing, China, 2020. [Google Scholar] [CrossRef]
  37. Li, X.; Che, T.; Xu, Z.; Ren, Z.; Tan, J. Qilian Mountains Integrated Observatory Network: Dataset of Heihe Integrated Observatory Network (An Observation System of Meteorological Elements Gradient of Daman Superstation, 2018); A Big Earth Data Platform for Three Poles: Beijing, China, 2019. [Google Scholar] [CrossRef]
  38. Papale, D.; Reichstein, M.; Aubinet, M.; Canfora, E.; Bernhofer, C.; Kutsch, W.; Longdoz, B.; Rambal, S.; Valentini, R.; Vesala, T.; et al. Towards a standardized processing of Net Ecosystem Exchange measured with eddy covariance technique: Algorithms and uncertainty estimation. Biogeosciences 2006, 3, 571–583. [Google Scholar] [CrossRef]
  39. Barr, A.G.; Richardson, A.D.; Hollinger, D.Y.; Papale, D.; Arain, M.A.; Black, T.A.; Bohrer, G.; Dragoni, D.; Fischer, M.L.; Gu, L.; et al. Use of change-point detection for friction–velocity threshold evaluation in eddy-covariance studies. Agric. For. Meteorol. 2013, 171–172, 31–45. [Google Scholar] [CrossRef]
  40. Reichstein, M.; Falge, E.; Baldocchi, D.; Papale, D.; Aubinet, M.; Berbigier, P.; Bernhofer, C.; Buchmann, N.; Gilmanov, T.; Granier, A.; et al. On the separation of net ecosystem exchange into assimilation and ecosystem respiration: Review and improved algorithm. Glob. Chang. Biol. 2005, 11, 1424–1439. [Google Scholar] [CrossRef]
  41. Wutzler, T.; Lucas-Moffat, A.; Migliavacca, M.; Knauer, J.; Sickel, K.; Šigut, L.; Menzer, O.; Reichstein, M. Basic and extensible post-processing of eddy covariance flux data with REddyProc. Biogeosciences 2018, 15, 5015–5030. [Google Scholar] [CrossRef]
  42. Köhler, P.; Behrenfeld, M.J.; Landgraf, J.; Joiner, J.; Magney, T.S.; Frankenberg, C. Global Retrievals of Solar-Induced Chlorophyll Fluorescence at Red Wavelengths with TROPOMI. Geophys. Res. Lett. 2020, 47, e2020GL087541. [Google Scholar] [CrossRef]
  43. Köhler, P.; Frankenberg, C.; Magney, T.S.; Guanter, L.; Joiner, J.; Landgraf, J. Global Retrievals of Solar-Induced Chlorophyll Fluorescence with TROPOMI: First Results and Intersensor Comparison to OCO-2. Geophys. Res. Lett. 2018, 45, 10,456–10,463. [Google Scholar] [CrossRef]
  44. Guanter, L.; Bacour, C.; Schneider, A.; Aben, I.; van Kempen, T.A.; Maignan, F.; Retscher, C.; Köhler, P.; Frankenberg, C.; Joiner, J.; et al. The TROPOSIF global sun-induced fluorescence dataset from the Sentinel-5P TROPOMI mission. Earth Syst. Sci. Data 2021, 13, 5423–5440. [Google Scholar] [CrossRef]
  45. Dang, C.; Shao, Z.; Huang, X.; Qian, J.; Cheng, G.; Ding, Q.; Fan, Y. Assessment of the importance of increasing temperature and decreasing soil moisture on global ecosystem productivity using solar-induced chlorophyll fluorescence. Glob. Chang. Biol. 2022, 28, 2066–2080. [Google Scholar] [CrossRef]
  46. Liu, L.; Gudmundsson, L.; Hauser, M.; Qin, D.; Li, S.; Seneviratne, S.I. Soil moisture dominates dryness stress on ecosystem production globally. Nat. Commun. 2020, 11, 4892. [Google Scholar] [CrossRef]
  47. Gregorutti, B.; Michel, B.; Saint-Pierre, P. Correlation and variable importance in random forests. Stat. Comput. 2017, 27, 659–678. [Google Scholar] [CrossRef]
  48. Kolari, P.; Chan, T.; Porcar-Castell, A.; Bäck, J.; Nikinmaa, E.; Juurola, E. Field and controlled environment measurements show strong seasonal acclimation in photosynthesis and respiration potential in boreal Scots pine. Front. Plant Sci. 2014, 5, 717. [Google Scholar] [CrossRef]
  49. Goss, R.; Lepetit, B. Biodiversity of NPQ. J. Plant Physiol. 2015, 172, 13–32. [Google Scholar] [CrossRef]
  50. Niyogi, K.K.; Truong, T.B. Evolution of flexible non-photochemical quenching mechanisms that regulate light harvesting in oxygenic photosynthesis. Curr. Opin. Plant Biol. 2013, 16, 307–314. [Google Scholar] [CrossRef] [PubMed]
  51. Barber, J.; Andersson, B. Too much of a good thing: Light can be bad for photosynthesis. Trends Biochem. Sci. 1992, 17, 61–66. [Google Scholar] [CrossRef] [PubMed]
  52. Miao, G.; Guan, K.; Suyker, A.E.; Yang, X.; Arkebauer, T.J.; Walter-Shea, E.A.; Kimm, H.; Hmimina, G.Y.; Gamon, J.A.; Franz, T.E.; et al. Varying Contributions of Drivers to the Relationship Between Canopy Photosynthesis and Far-Red Sun-Induced Fluorescence for Two Maize Sites at Different Temporal Scales. J. Geophys. Res. Biogeosci. 2020, 125, e2019JG005051. [Google Scholar] [CrossRef]
  53. Damm, A.; Elbers, J.A.N.; Erler, A.; Gioli, B.; Hamdi, K.; Hutjes, R.; Kosvancova, M.; Meroni, M.; Miglietta, F.; Moersch, A.; et al. Remote sensing of sun-induced fluorescence to improve modeling of diurnal courses of gross primary production (GPP). Glob. Chang. Biol. 2010, 16, 171–186. [Google Scholar] [CrossRef]
  54. Miao, G.; Guan, K.; Yang, X.; Bernacchi, C.J.; Berry, J.A.; DeLucia, E.H.; Wu, J.; Moore, C.E.; Meacham, K.; Cai, Y.; et al. Sun-Induced Chlorophyll Fluorescence, Photosynthesis, and Light Use Efficiency of a Soybean Field from Seasonally Continuous Measurements. J. Geophys. Res. Biogeosci. 2018, 123, 610–623. [Google Scholar] [CrossRef]
  55. Wieneke, S.; Burkart, A.; Cendrero-Mateo, M.P.; Julitta, T.; Rossini, M.; Schickling, A.; Schmidt, M.; Rascher, U. Linking photosynthesis and sun-induced fluorescence at sub-daily to seasonal scales. Remote Sens. Environ. 2018, 219, 247–258. [Google Scholar] [CrossRef]
  56. Cendrero-Mateo, M.P.; Carmo-Silva, A.E.; Porcar-Castell, A.; Hamerlynck, E.P.; Papuga, S.A.; Moran, M.S. Dynamic response of plant chlorophyll fluorescence to light, water and nutrient availability. Funct. Plant Biol. 2015, 42, 746–757. [Google Scholar] [CrossRef] [PubMed]
  57. Maguire, A.J.; Eitel, J.U.H.; Griffin, K.L.; Magney, T.S.; Long, R.A.; Vierling, L.A.; Schmiege, S.C.; Jennewein, J.S.; Weygint, W.A.; Boelman, N.T.; et al. On the Functional Relationship Between Fluorescence and Photochemical Yields in Complex Evergreen Needleleaf Canopies. Geophys. Res. Lett. 2020, 47, e2020GL087858. [Google Scholar] [CrossRef]
  58. Wang, X.; Chen, J.M.; Ju, W. Photochemical reflectance index (PRI) can be used to improve the relationship between gross primary productivity (GPP) and sun-induced chlorophyll fluorescence (SIF). Remote Sens. Environ. 2020, 246, 111888. [Google Scholar] [CrossRef]
  59. Jahns, P.; Holzwarth, A.R. The role of the xanthophyll cycle and of lutein in photoprotection of photosystem II. Biochim. Biophys. Acta (BBA) Bioenerg. 2012, 1817, 182–193. [Google Scholar] [CrossRef]
  60. Demmig-Adams, B.; Adams, W.W. Harvesting sunlight safely. Nature 2000, 403, 371–373. [Google Scholar] [CrossRef]
Figure 1. The location of the DM site. The red circle denotes the DM site.
Applsci 14 00771 g001
Figure 2. The responses of half-hourly SIF (a) and GPP (b) to PAR under different EF bins.
Applsci 14 00771 g002
Figure 3. The responses of half-hourly SIF (a) and GPP (b) to PAR in different Ta bins.
Applsci 14 00771 g003
Figure 4. The responses of half-hourly SIF (a) and GPP (b) to EF under different PAR bins.
Applsci 14 00771 g004
Figure 5. The responses of half-hourly SIF (a) and GPP (b) to Ta under different PAR bins.
Applsci 14 00771 g005
Figure 6. The responses of SIF (a) and GPP (b) to SW in different EF bins.
Applsci 14 00771 g006
Figure 7. The responses of SIF (a) and GPP (b) to SW in different Ta bins.
Applsci 14 00771 g007
Figure 8. The importance of several explanatory variables in SIF/PAR ratio and GPP/PAR ratio based on the tower-based data at DM site.
Applsci 14 00771 g008
Figure 9. The importance of several explanatory variables in SIF/SW ratio and GPP/SW ratio for the daily TROPOSIF.
Applsci 14 00771 g009
Figure 10. The half-hourly GPP–SIF relationship at different EF (a), Ta (b) and PAR (c) bins at DM site.
Applsci 14 00771 g010
Figure 11. The daily GPP–SIF relationship at different EF (a), Ta (b) and PAR (c) bins at DM site.
Applsci 14 00771 g011
Figure 12. The half-hourly GPP–SIF relationship at DM site in different EF (a) and Ta (b) bins.
Applsci 14 00771 g012
Table 1. The fitted equations and parameters for Figure 12.
GPP–SIF (EF Bins)
G P P = a × S I F b + S I F
GPP–SIF (Ta Bins)
G P P = a × S I F b + S I F
[−2, −1.5)a = 0.52, b = 0.35, R2 = 0.18a = 0.45, b = 0.2, R2 = 0.23
[−1.5, −1.0)a = 0.71, b = 0.51, R2 = 0.38a = 0.54, b = 0.29, R2 = 0.26
[−1.0, −0.5)a = 1.03, b = 0.68, R2 = 0.42a = 0.76, b = 0.40, R2 = 0.39
[−0.5, 0)a = 1.065, b = 0.56, R2 = 0.56a = 0.93, b = 0.44, R2 = 0.40
[0, 0.5)a = 1.21, b = 0.73, R2 = 0.58a = 1.37, b = 0.94, R2 = 0.48
[0.5, 1.0)a = 1.36, b = 0.80, R2 = 0.63a = 1.45, b = 0.92, R2 = 0.50
[1.0,1.5)a = 1.55, b = 0.98, R2 = 0.76a = 1.45, b = 0.97, R2 = 0.47
[1.5, 2.0] a = 1.49, b = 1.15, R2 = 0.44
Disclaimer/Publisher’s Note: The statements, opinions and data contained in all publications are solely those of the individual author(s) and contributor(s) and not of MDPI and/or the editor(s). MDPI and/or the editor(s) disclaim responsibility for any injury to people or property resulting from any ideas, methods, instructions or products referred to in the content.

