Article

Effect of Pressure and Holding Time during Compression Molding on Mechanical Properties and Microstructure of Coke-Pitch Carbon Blocks

School of Materials Science and Engineering, Kumoh National Institute of Technology, Daehak-Ro 61, Gumi 39177, Republic of Korea
*
Author to whom correspondence should be addressed.
Appl. Sci. 2024, 14(2), 772; https://doi.org/10.3390/app14020772
Submission received: 7 December 2023 / Revised: 9 January 2024 / Accepted: 13 January 2024 / Published: 16 January 2024

Abstract

:
In this study, isotropic coke and coal tar pitch were subjected to compression molding while varying the compression pressure and holding time. As a result, carbon blocks were fabricated, and their mechanical properties and microstructure were analyzed, with respect to applied pressure and holding time. The compression pressure was set to 70, 100 and 130 MPa, while the holding time was set to 1, 2 and 3 min. Overall, with an increase in compression pressure, bulk density increased while porosity decreased. Increased compression pressure also led to enhanced mechanical and electrical properties. Microstructural analysis confirmed that, after compression molding granules that were larger than existing kneaded particles appeared. The formation of granules is attributed to the tendency of kneaded particles to connect and coalesce with each other under applied pressure during the compression molding process. As the compression pressure increased, the proportion of granules in the microstructure increased while the size of pores decreased. This phenomenon can be attributed to kneaded particles coming closer to each other under applied pressure. At a compression pressure of 130 MPa, both bulk density and porosity increased with a longer holding time. Some pores existed within granules, while others protruded out of granules, thereby forming long channels of connected pores around them. This microstructural change was considered to result in degraded mechanical and electrical properties.

1. Introduction

Graphite blocks are widely used in various industrial applications, including heating devices, crucibles, and aircraft components, thanks to their remarkable mechanical and electrical properties, as well as their excellent thermal and chemical resistance. The fabrication of graphite blocks involves a series of sequential processes, including mixing, kneading, forming, carbonization, impregnation, and graphitization, with fillers and binders used as raw materials. Each of these processes is built on a set of elementary technologies, and changes in the applied process conditions impact the overall quality of the final products [1,2,3,4,5].
Various types of fillers and binders are used as raw materials for graphite blocks, with those deemed most suitable for a given purpose being considered for use. Coke, natural graphite, and carbon black are among the most commonly used fillers. In general, ceramics exhibit self-sintering ability, and the degree of sinterability varies depending on the powder particle size and sintering temperature [4,6]. However, fillers commonly used for fabricating graphite blocks lack a self-sintering property, and thus they should be mixed with binders to be used as raw materials for graphite blocks [7,8].
There are various forming methods available for use in this application, including extrusion molding, compression molding, and cold isostatic pressing (CIP). The choice of method depends on the intended purpose and usage [9]. Compression molding is a process in which the target material is injected into a mold with a specific shape, and pressure is applied in a uniaxial direction for forming. This forming process is relatively simple and quick, but the friction between the material and the mold, induced by the applied pressure, may result in less uniform density across the matrix [1,10]. With compression molding, the applied pressure, holding time, and temperature are varied to suit the expected properties of the resulting products. With an increase in the compression pressure, the density also increases; however, as the pressure exceeds a certain threshold, the rate of increase in density slows down [11]. As such, both the pressure and holding time applied during compression molding significantly affect the ultimate properties of the final products. Consequently, it is critical to find optimal process conditions tailored to target materials.
There are a few studies about the manufacturing conditions for producing graphite blocks. Zhao et al. [12] reported the effect of the average particle size of coke on the microstructure and properties of graphite blocks; An et al. [13] reported the relationship between kneading and carbonization temperature and properties during the manufacture of carbon blocks. In previous studies by the authors of the present study, the porosity of bulk graphite fabricated using compression molding, along with the mechanical properties of graphite blocks fabricated with CIP, were examined [14,15]. However, it is difficult to find studies about holding time and pressure during uniaxial pressurization for manufacturing graphite blocks.
In this study, carbon blocks were fabricated via compression molding, using coal-based isotropic coke as a filler and coal tar pitch as a binder. The study then analyzed the effects of the applied pressure and holding time during compression molding on the mechanical properties and microstructure of the resulting carbon blocks.

2. Experimental Procedure

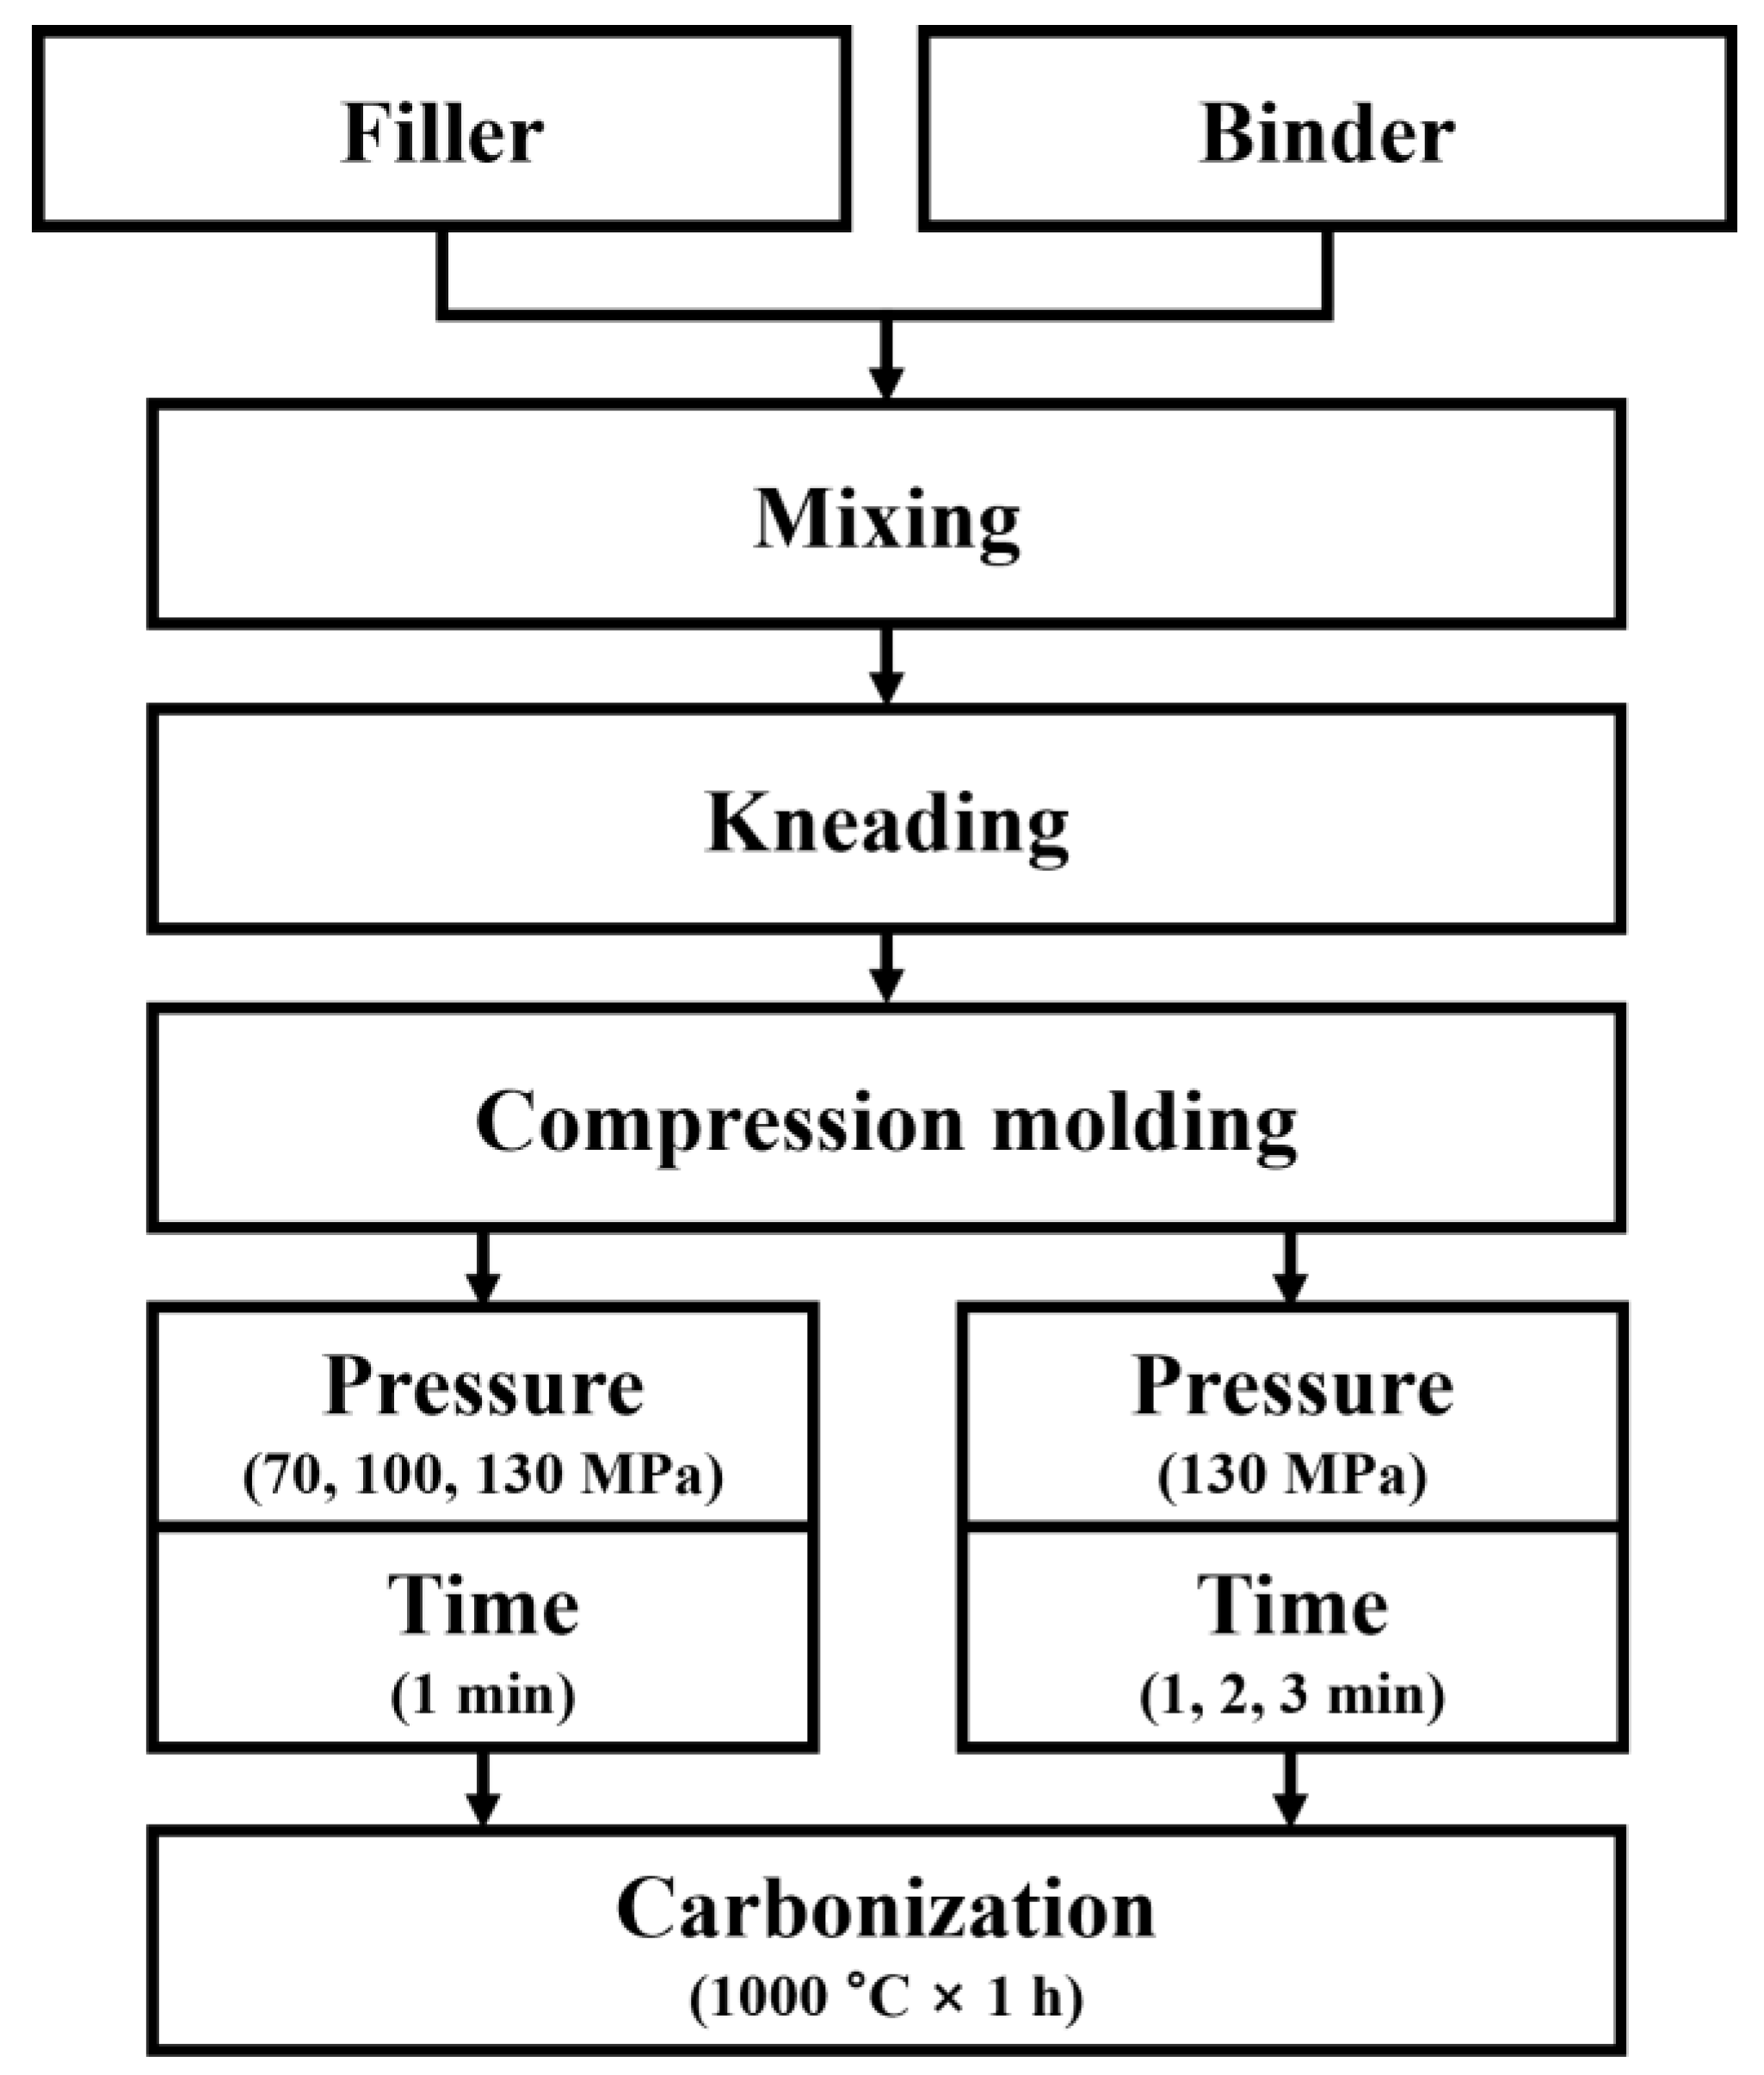
2.1. Raw Materials and Preparation

In this study, commercial coal-based isotropic coke (POSCO MC MATERIALS, Jeonnam, Republic of Korea) was used as a filler, while commercial coal tar pitch (Rain Carbon, Stamford, CT, USA) was employed as a binder. The average powder particle size (D50) of the filler was 6.57 µm; the properties of the selected binder are summarized in Table 1.
The mixing ratio of filler and binder is related to the properties of the graphite block. For the particle size of the filler used in this study, a weight ratio of 75:25 was found to be the most appropriate ratio [16]. The filler and binder were mixed via ball milling at a weight ratio of 75:25, and the mixture was then subjected to kneading.
The kneading process was conducted for 30 min at 170 °C, which was higher than 110 °C, the softening point of the binder pitch. The kneaded mixture underwent a milling process before use.
After the milling process, the kneaded powder was injected into a mold with dimensions of 10 mm × 10 mm × 50 mm and compression molding was then conducted. The obtained green bodies were carbonized in a tube furnace, where they were heated at a rate of 2 °C/min from room temperature to 1000 °C and then maintained at that temperature for 1 h. During the process, an inert atmosphere was maintained using N₂ to prevent oxidation. In this study, the same conditions as described above were applied to all specimens during carbonization.
More specifically, to determine the effect of compression pressure, specimens were subjected to compression molding for 1 min under varying compression pressures of 70, 100, and 130 MPa. As a result, green bodies fabricated under different compression pressures were prepared for the subsequent carbonization process. The maximum possible pressure of the compressor employed in this study was 150 MPa. However, to avoid any instability during the forming process, the maximum pressure was set to 130 MPa. A previous study by our research team reported the fabrication of carbon blocks under a pressure of 100 MPa [17]. In general, during low-pressure forming, it is challenging to achieve sufficient pressure-induced binding between coke and pitch. Consequently, the resulting green bodies are less likely to maintain their shape. As such, in this study 100 MPa was defined as the reference pressure level, and two other conditions were set by adding or deducting 30 MPa. Overall, the compression pressures were set to 70, 100, and 130 MPa.
Additionally, to analyze the effect of holding time during compression molding, the holding time was varied between 1, 2, and 3 min at a compression pressure of 130 MPa. The resulting green bodies were subjected to carbonization to obtain carbon blocks with varying holding times. Generally, the holding time ranges from a few seconds to a few minutes, depending on the type and amount of powder and the shape of molds applied [18]. If the holding time is too short during carbonization, it is less likely that the original shape of green bodies will be maintained after they transform into carbon blocks. In this study, it was observed that the green bodies were able to maintain their shape when the holding time was set to 1 min, regardless of the compression pressure. At a compression pressure of 130 MPa, the holding time was varied between 1, 2, and 3 min. As the holding time increased to 2 or 3 min, the bulk density and porosity of the carbon blocks remained almost unchanged. However, there was a degradation in their mechanical and electrical properties with increased holding time. This result was then combined with findings from microstructural analysis for further interpretation. The overall experimental procedure is outlined in Figure 1.

2.2. Bulk Density and Porosity

The bulk density and porosity of the carbon blocks were measured using Archimedes’ method (ISO 18754:2020) [19]. Specifically, the carbon blocks fabricated under varying experimental conditions, as described above, were dried in an oven at 60 °C for 24 h and then cooled at room temperature before being measured for their dry weight. They were then boiled for three hours in distilled water and then cooled at room temperature before their underwater weight was measured. Afterwards, the carbon blocks were removed from the distilled water and the remaining water on the surface was removed to measure their saturated weight. Based on these three weight measurements, the bulk density and porosity were calculated.
Bulk density (g/cm3) = Dry weight/(Saturated weight − Underwater weight)
Porosity (%) = (Saturated weight − Dry weight)/(Saturated weight − Underwater weight) × 100

2.3. Electrical Resistivity

Electrical resistivity measurements were conducted in accordance with the voltage drop method provided in ASTM C 611 [20]. The voltage drop between the voltage terminals, the cross-sectional area of each carbon block specimen, and the distance between the voltage terminals, along with the applied current, was measured and used to calculate the corresponding electrical resistivity.
⍴ = eS/il
where ⍴ is the electrical resistivity (Ωcm), e is the voltage drop between voltage terminals (V), S is the cross-sectional area of the sample (cm2), i is the current (A), and l is the distance between voltage terminals (cm).

2.4. Flexural Strength

The flexural strength of the carbon blocks was measured using a universal testing machine (UTM, QUASAR 100, GALDABIN, Cardano Al Campo, Italy). The loading point on the upper surface was placed at the midspan of the carbon block specimen, and each of the two loading points on the lower surface was placed 20 mm away from the midspan.
Sb = 3WI/2bt2
where Sb is the flexural strength (N/cm2), W is the maximum load, I is the distance between the two points (cm), b is the specimen width (cm), and t is the specimen thickness (cm).

2.5. Shore Hardness

Shore hardness was measured using a D-type Shore hardness tester (GS-702N, Teclock, Nagano, Japan) provided in ASTM C 886 [21]. The indenter shape is a round-ball type with a radius of 0.1 mm. Measurements were taken five times at 5 mm intervals on the plane of each carbon block and the average value was calculated.

2.6. Microstructural Analysis

For microstructural analysis, each carbon block specimen was cut at the midspan in a direction perpendicular to the applied pressure. The cut surface was polished using sandpaper with varying grit sizes (#1200–#3000), followed by fine polishing using 1 µm diamond paste. The polished surface of each specimen was observed using an optical microscope (ECLIPSE LV150, Nikon, Tokyo, Japan) at a magnification of 100×. Additionally, the polished surface of the carbon blocks was observed at higher magnifications using a scanning electron microscope (MAIA 3, TESCAN, Brno, Czech Republic).

3. Results and Discussion

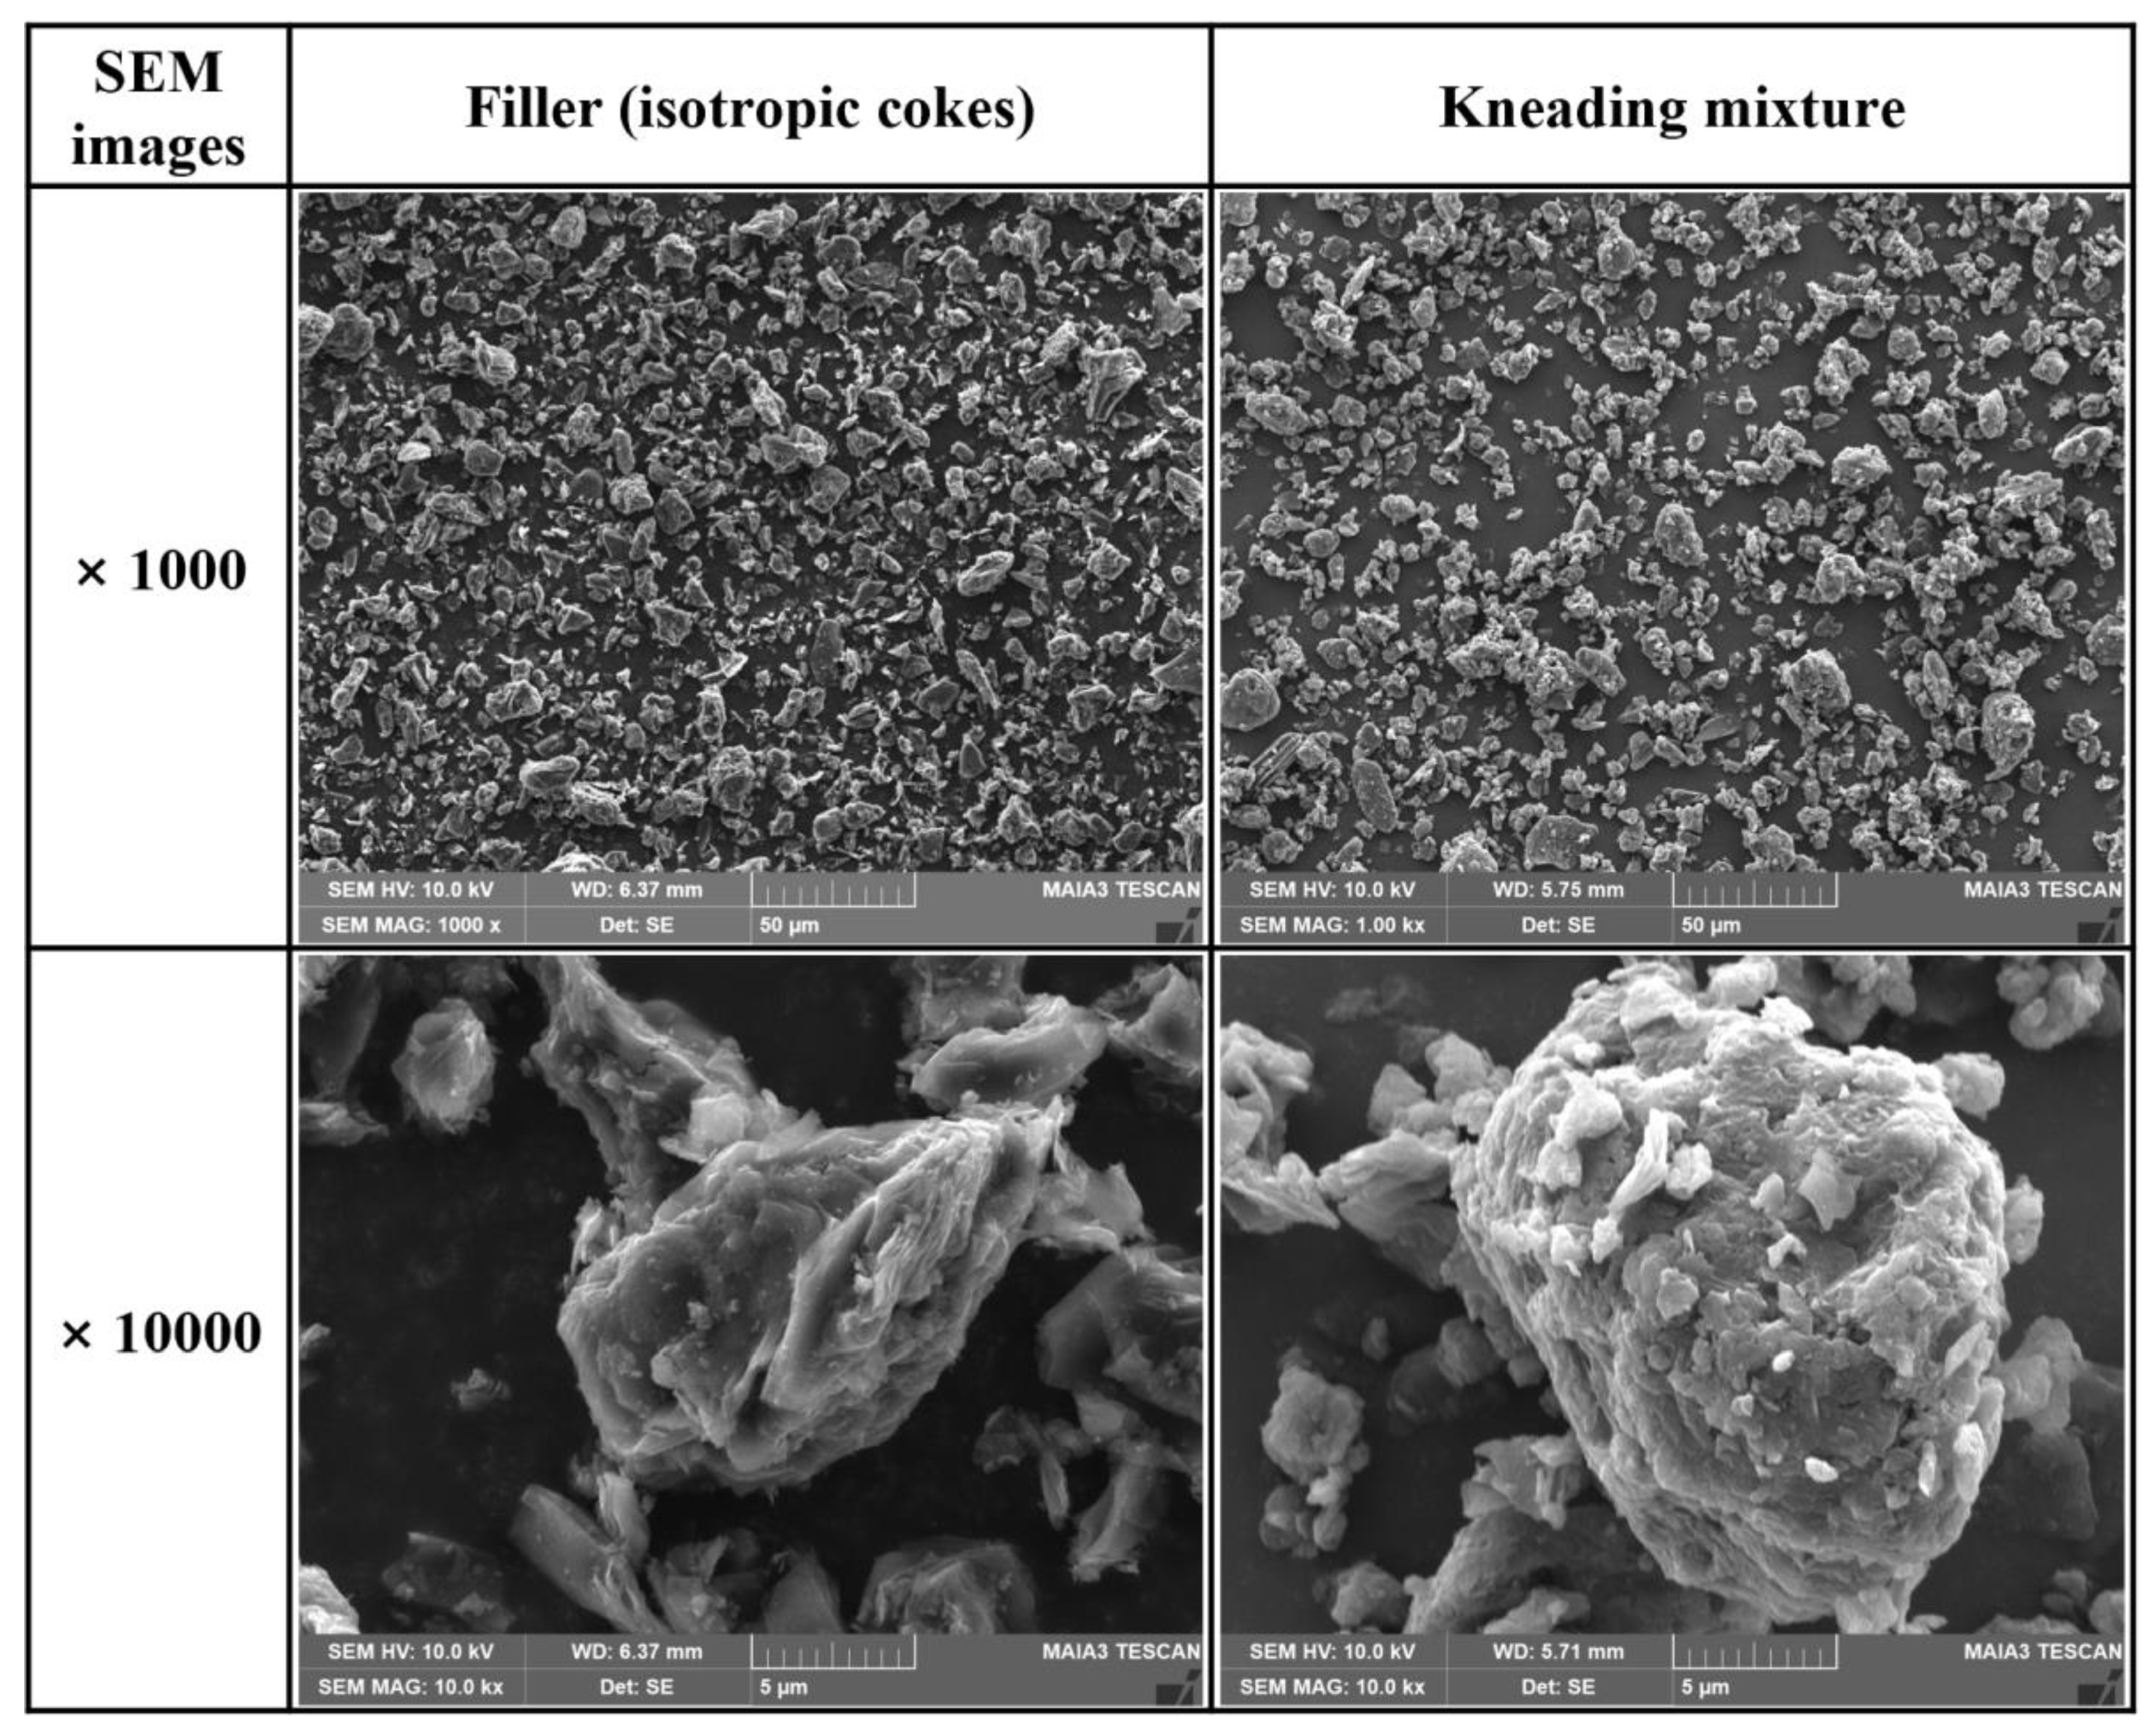
3.1. Isotropic Coke and Kneaded Particles

Figure 2 shows SEM images of isotropic coke and kneaded particles. Isotropic coke exhibited a faceted surface with non-smooth edges, whereas kneaded particles were relatively round with a smooth surface. This surface difference is attributed to the surface of isotropic coke after being covered with pitch during the kneading process. The size of the milled kneaded particles was 20 µm or lower.

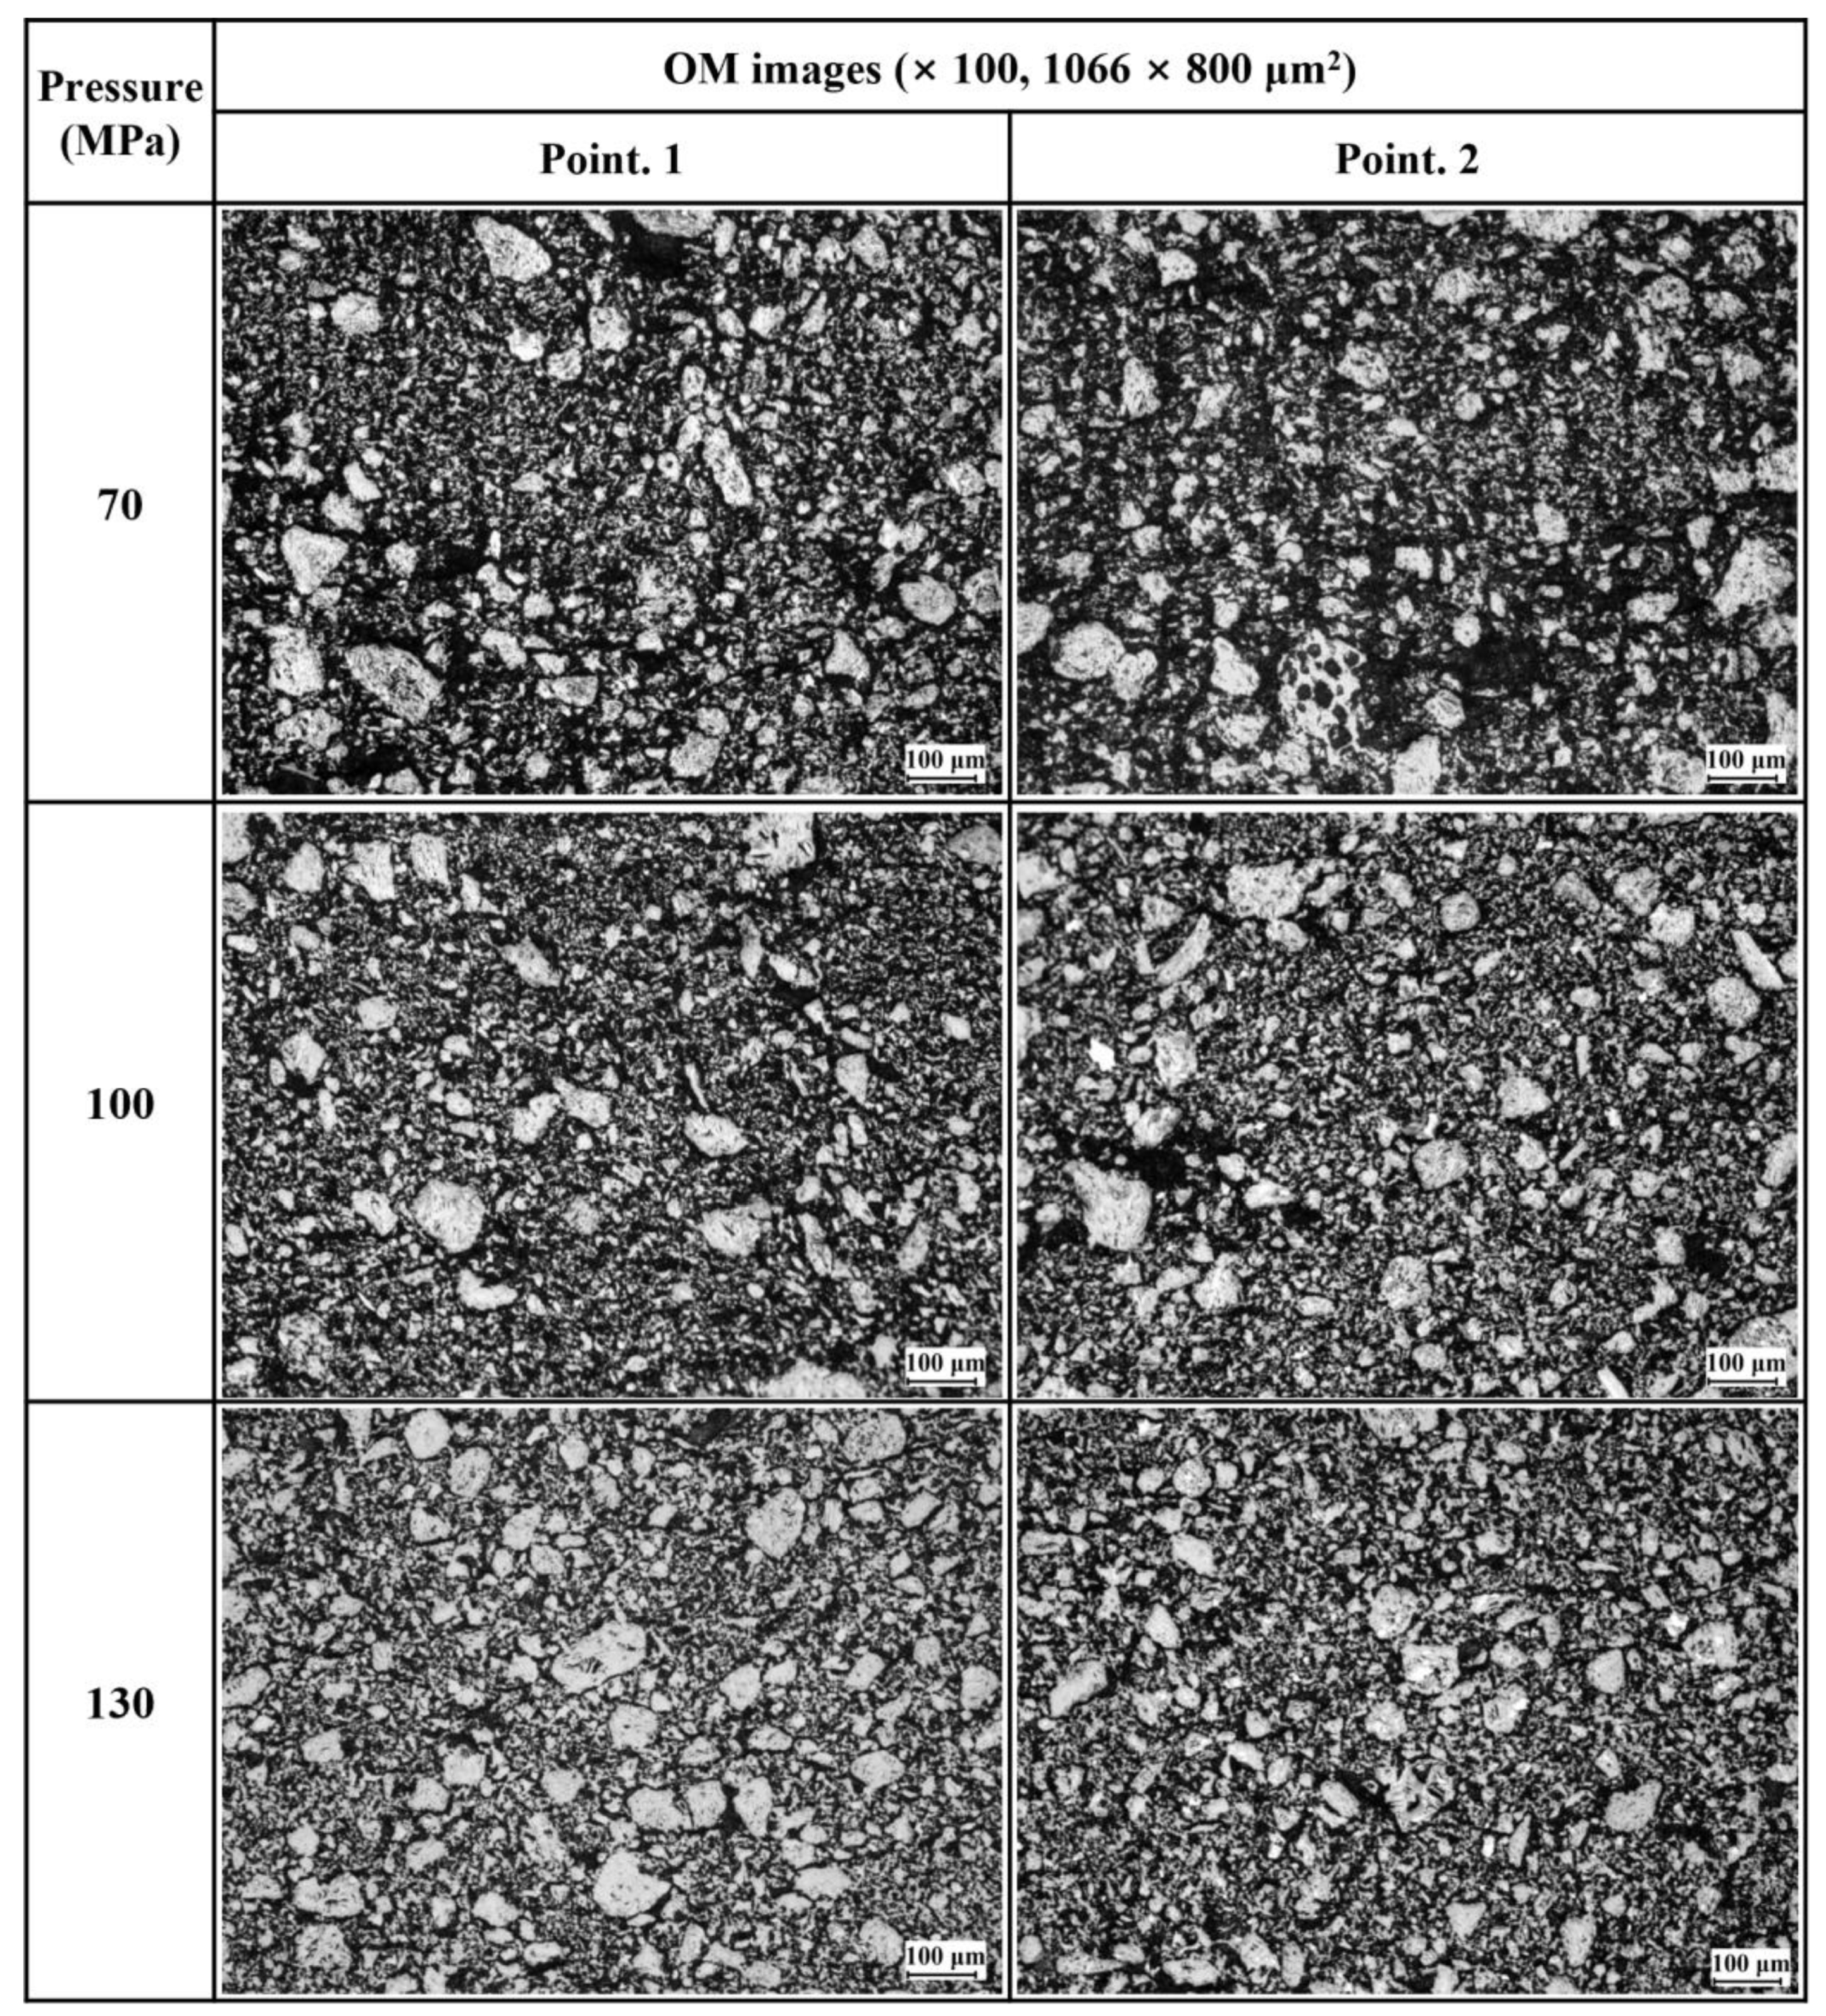
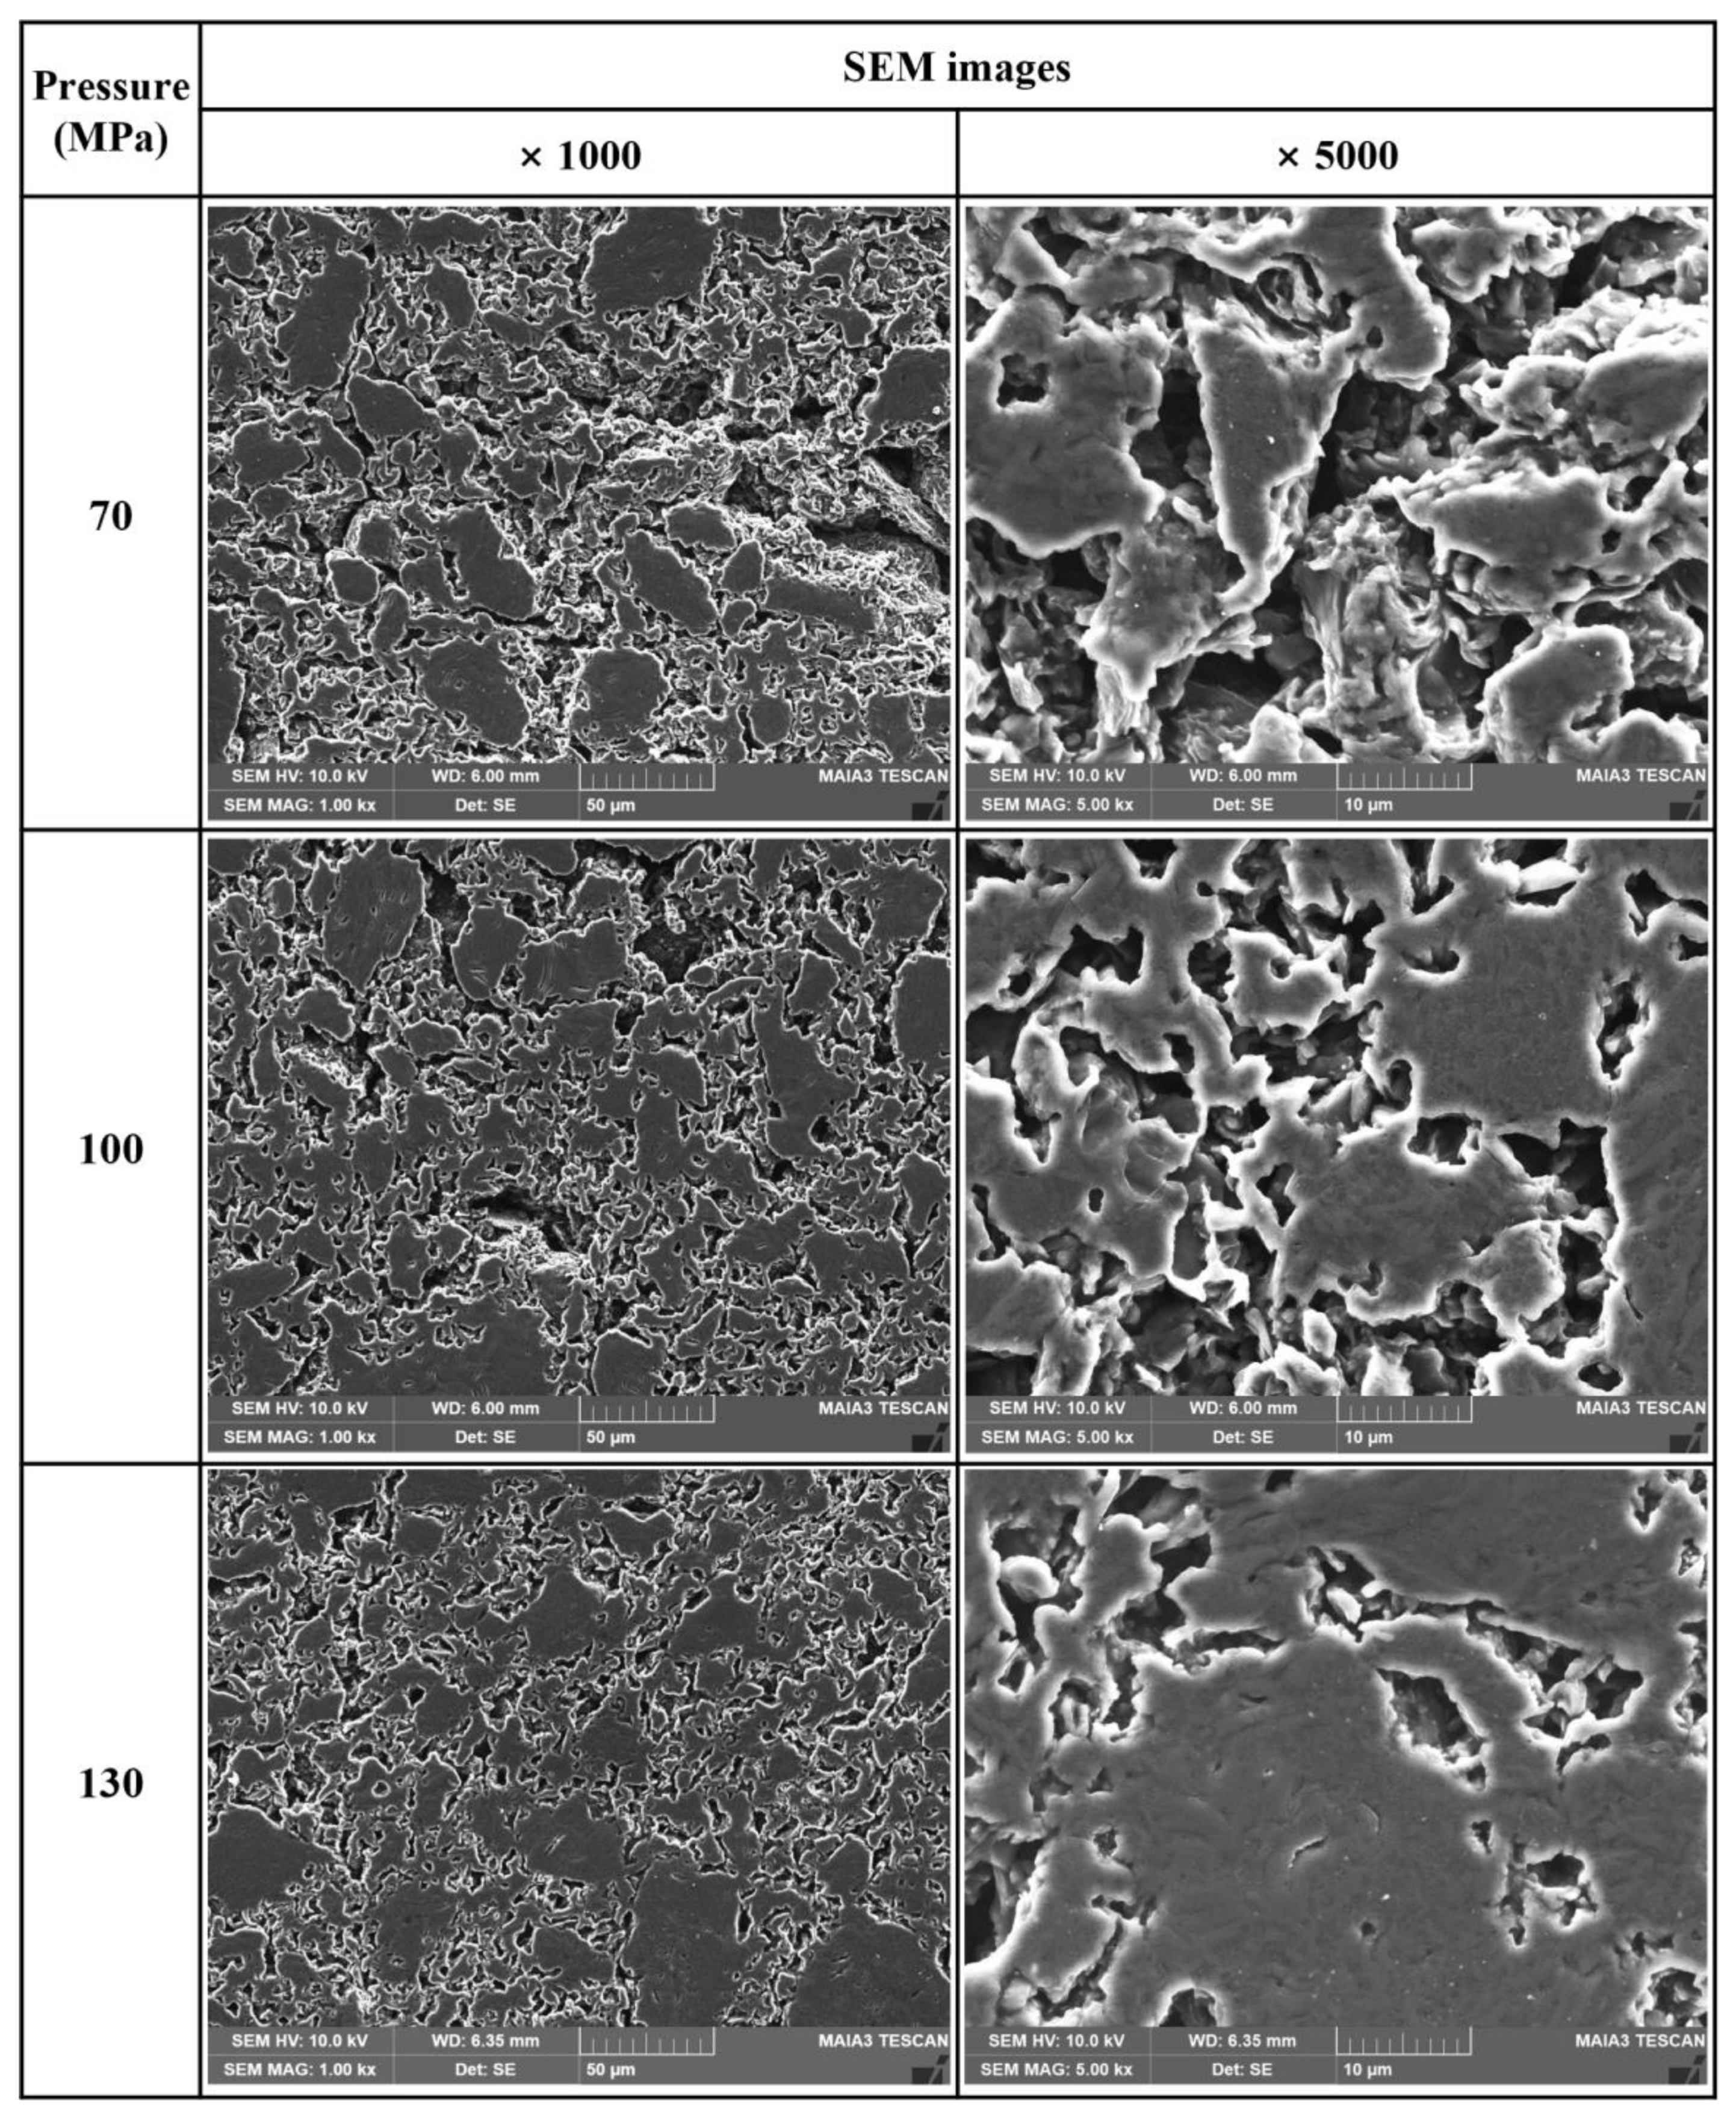
3.2. Effect of Compression Pressure

To analyze the effects of compression pressure, green bodies were fabricated at a kneading temperature of 170 °C under varying compression pressures of 70, 100 and 130 MPa for 1 min. These green bodies were then carbonized, and the bulk density, porosity, flexural strength, Shore hardness, electrical resistivity, and microstructure of the resulting carbon blocks were analyzed.
Figure 3a shows changes in the bulk density and porosity of the carbon blocks with respect to compression pressure. As the compression pressure increased, the bulk density increased, and the porosity decreased. At a compression pressure of 130 MPa, the highest bulk density was achieved at 1.391 g/cm3, along with the lowest porosity at 27.9%.
Pérez, J.M. [22] reported that, in ceramics, elevating the pressure applied during compression molding induced the rearrangement of powder particles, leading to increased packing rates. This structural change, in turn, resulted in increased bulk density and decreased porosity in the resulting molded bodies. The observation in Figure 3, indicating an increase in bulk density and a decrease in porosity with increasing compression pressure, can be attributed to the rearrangement of the filler and binder. This interpretation aligns with the findings of the previous study mentioned above.
Figure 3b shows the effects of compression pressure on the flexural strength and Shore hardness of the carbon blocks. At a compression pressure of 70 MPa, both the flexural strength and Shore hardness were the lowest. The flexural strength at 100 MPa was comparable to that at 130 MPa. Many previous studies have reported a correlation between pores and flexural strength.
The flexural strength of carbon blocks depends on pore type and size. When subjected to compression pressure, carbon blocks undergo stress concentration within their pores, which ultimately act as defects [23,24,25]. An increase in compression pressure induces the rearrangement of fillers and binders, resulting in variations in the shapes and sizes of pores. This microstructural change, in turn, affects the flexural strength of the resulting carbon blocks. The microstructural observations in Figure 4 and Figure 5 support this mechanism.
It is known that the Shore hardness of carbon blocks is affected by porosity but it is difficult to find papers that clearly interpret the correlation. Additionally, in some papers, it was found that there was no correlation between Shore hardness and porosity [25]. The Shore hardness of carbon blocks needs to consider the size of the indenter. Shore hardness was highest at 100 MPa and decreased again at 130 MPa. This phenomenon can be explained by the microstructure in Figure 5. Shore hardness is a principle that measures the height at which a specimen rises after restitution. At 70 MPa, the Shore hardness is low because there are large pores inside the carbon block, and at 100 MPa, the size of the pores decreases and the Shore hardness increases. As the Shore hardness decreases again at 130 MPa, the area where the kneaded particles are connected is thought to have low Shore hardness.
Figure 3c shows changes in the electrical resistivity of the carbon blocks with respect to compression pressure. Overall, as the compression pressure increased, the electrical resistivity decreased. At a 130 MPa compression pressure, the electrical resistivity was the lowest at 61.2 μΩm.
This trend of decreasing electrical resistivity with higher compression pressure aligns with that observed in the porosity measurements, as shown in Figure 3a. The electrical resistivity of carbon blocks is known to be significantly affected by their porosity. Pierson, H.O. [26] explained that pores within carbon blocks inhibited the movement of electrons, thereby resulting in increased electrical resistivity. Additionally, Wei, W. et al. [27] reported that electrons within carbon blocks moved along the solid regions, composed of fillers and binders, but their movement was disrupted when they collided with pores. The observations made in this study can also be interpreted similarly.
Figure 4 presents OM images of the carbon blocks fabricated under different compression pressures. In the images, white particles and black pores are visible. The white particles are kneaded particles after carbonization, which are larger than the kneaded particles observed in Figure 2. The increase in size is attributed to the pressure applied to the kneaded particles during compression molding, which causes them to connect and coalesce, forming large granules.
Most granules are 100 µm or smaller, despite a few larger exceptions. In the carbon block fabricated under a compression pressure of 70 MPa, the proportion of granules was the smallest. As the compression pressure increased, the proportion of granules in the microstructure increased.
At a compression pressure of 70 MPa, pores were the largest both in terms of size and quantity. These pores exhibited significant variations in both shape and size; some were about 100 µm, while others were 200 µm or larger. As the compression pressure increased, both the size and quantity of pores decreased.
In general, the shapes of pores and granules are affected by the compression pressure applied. An increase in compression pressure causes kneaded powder particles to come closer to each other, resulting in the protrusion of pores from the kneaded powder. The observed decrease in pore size can be explained by this mechanism. This explains the observation that, at the highest compression pressure of 130 MPa, pores were the smallest in size and the distance between granules was smaller.
Figure 5 shows SEM images of the carbon blocks fabricated under different compression pressures. The size of granules and pores varied depending on the applied pressure, with the distinction becoming more pronounced at a magnification of 5000×. At a compression pressure of 70 MPa, the number of pores was the largest and they existed separately without being connected to others. At 130 MPa, the number of pores was smallest, with granules being connected to each other. These variations in the size of pores and the connectedness of granules were considered to have affected the mechanical and electrical properties of the resulting carbon blocks.

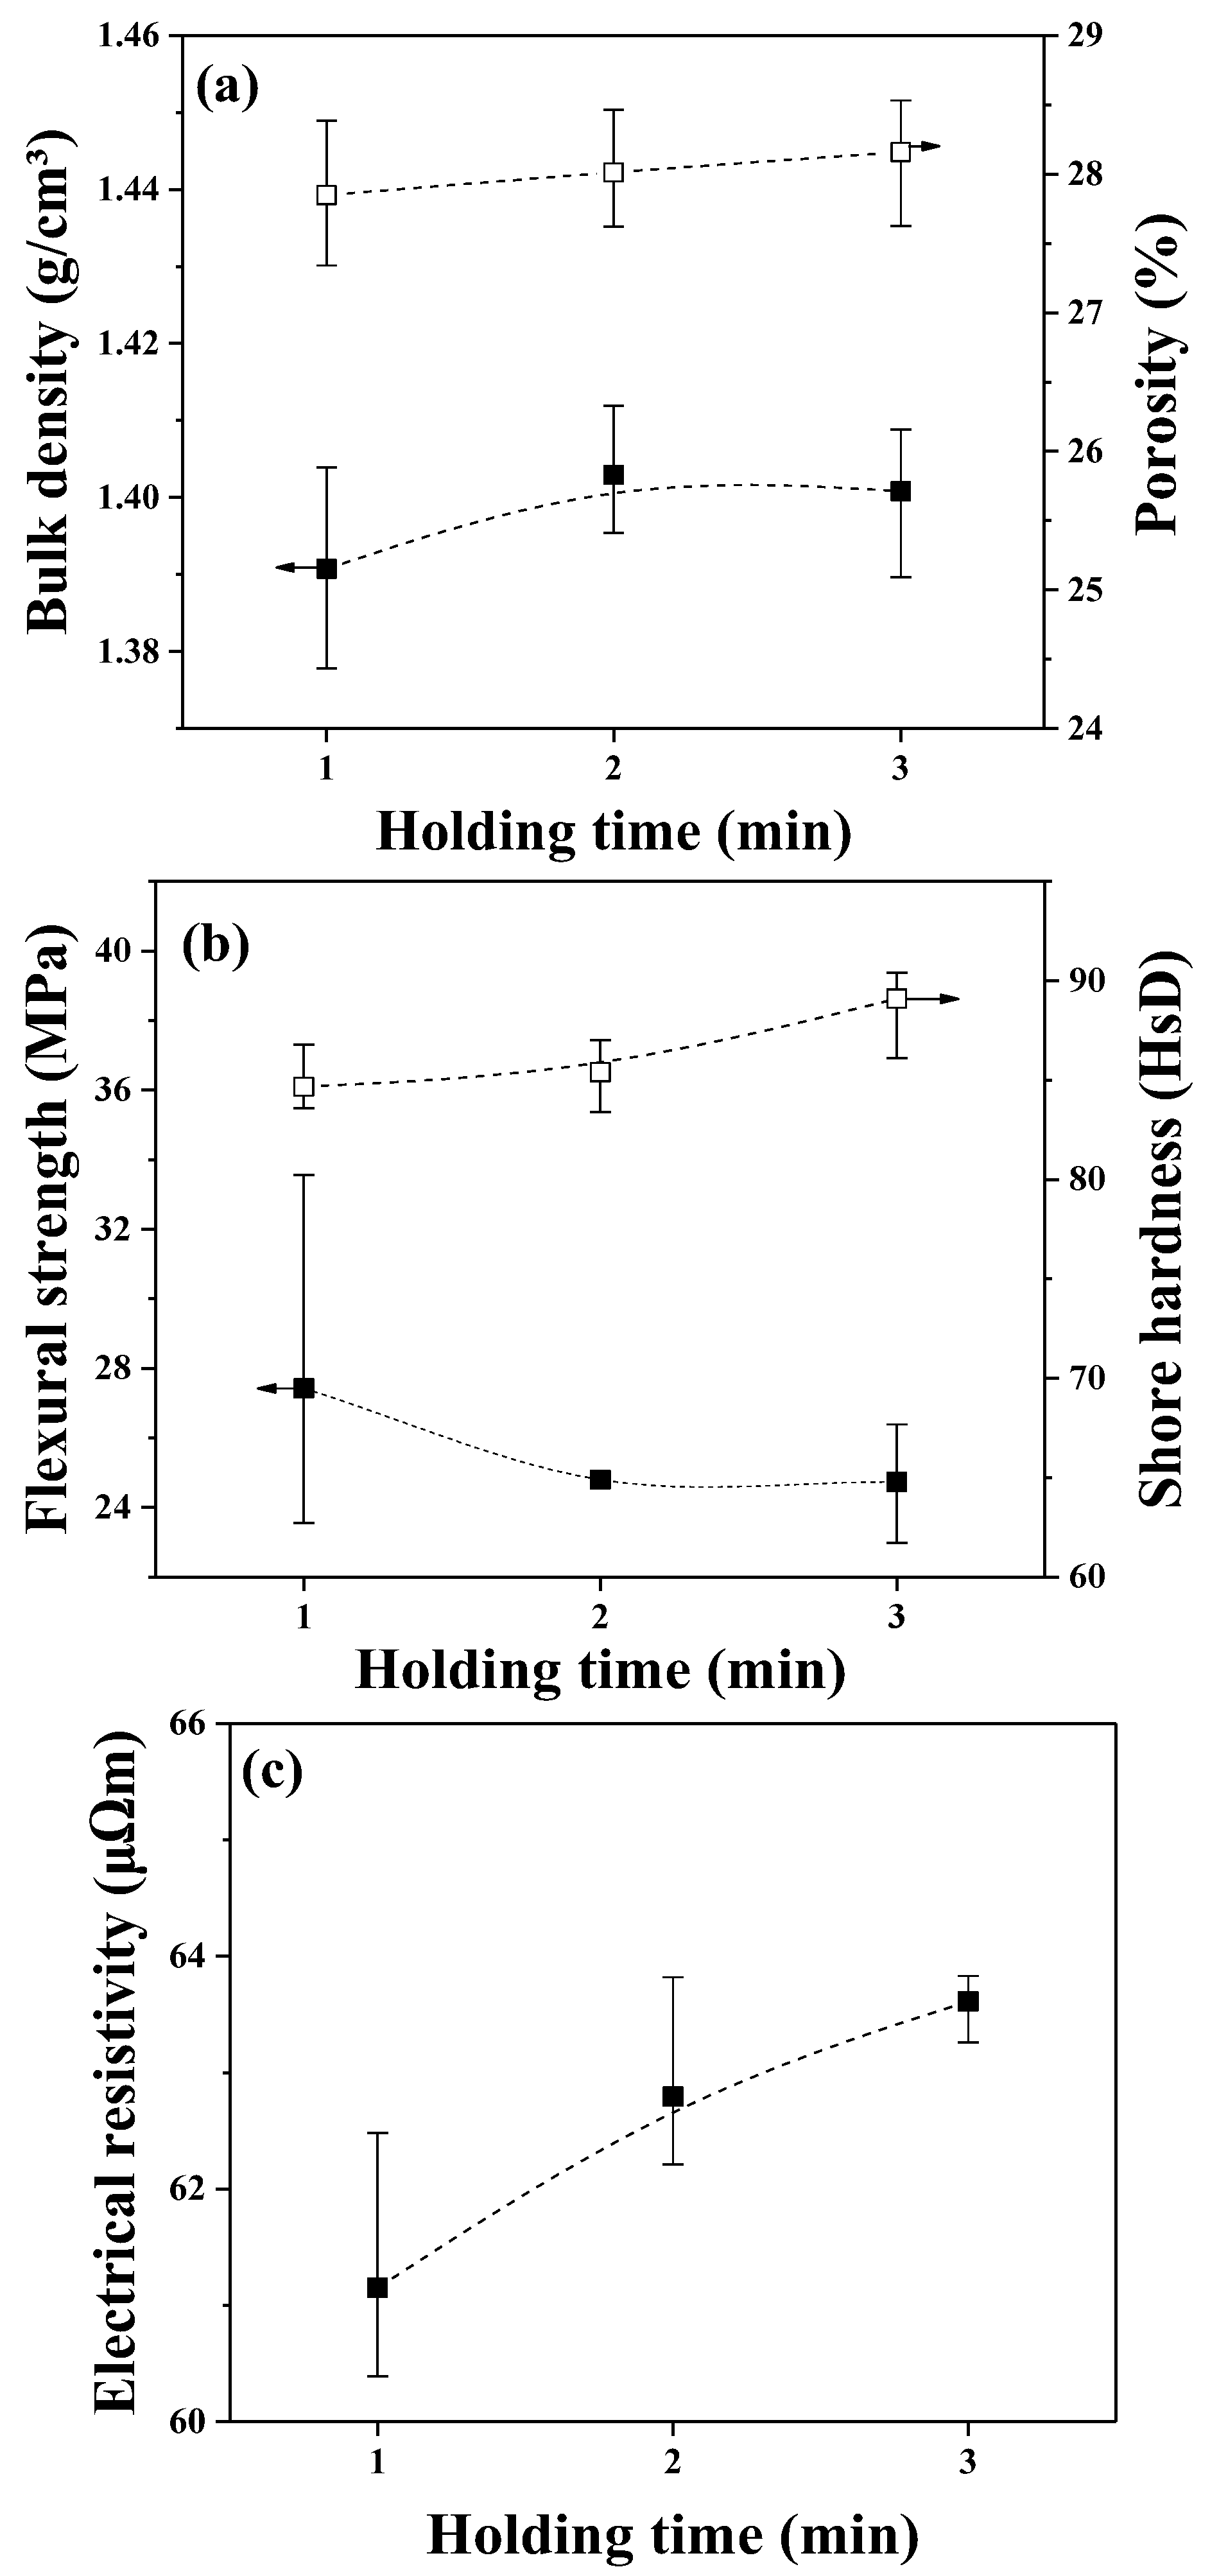
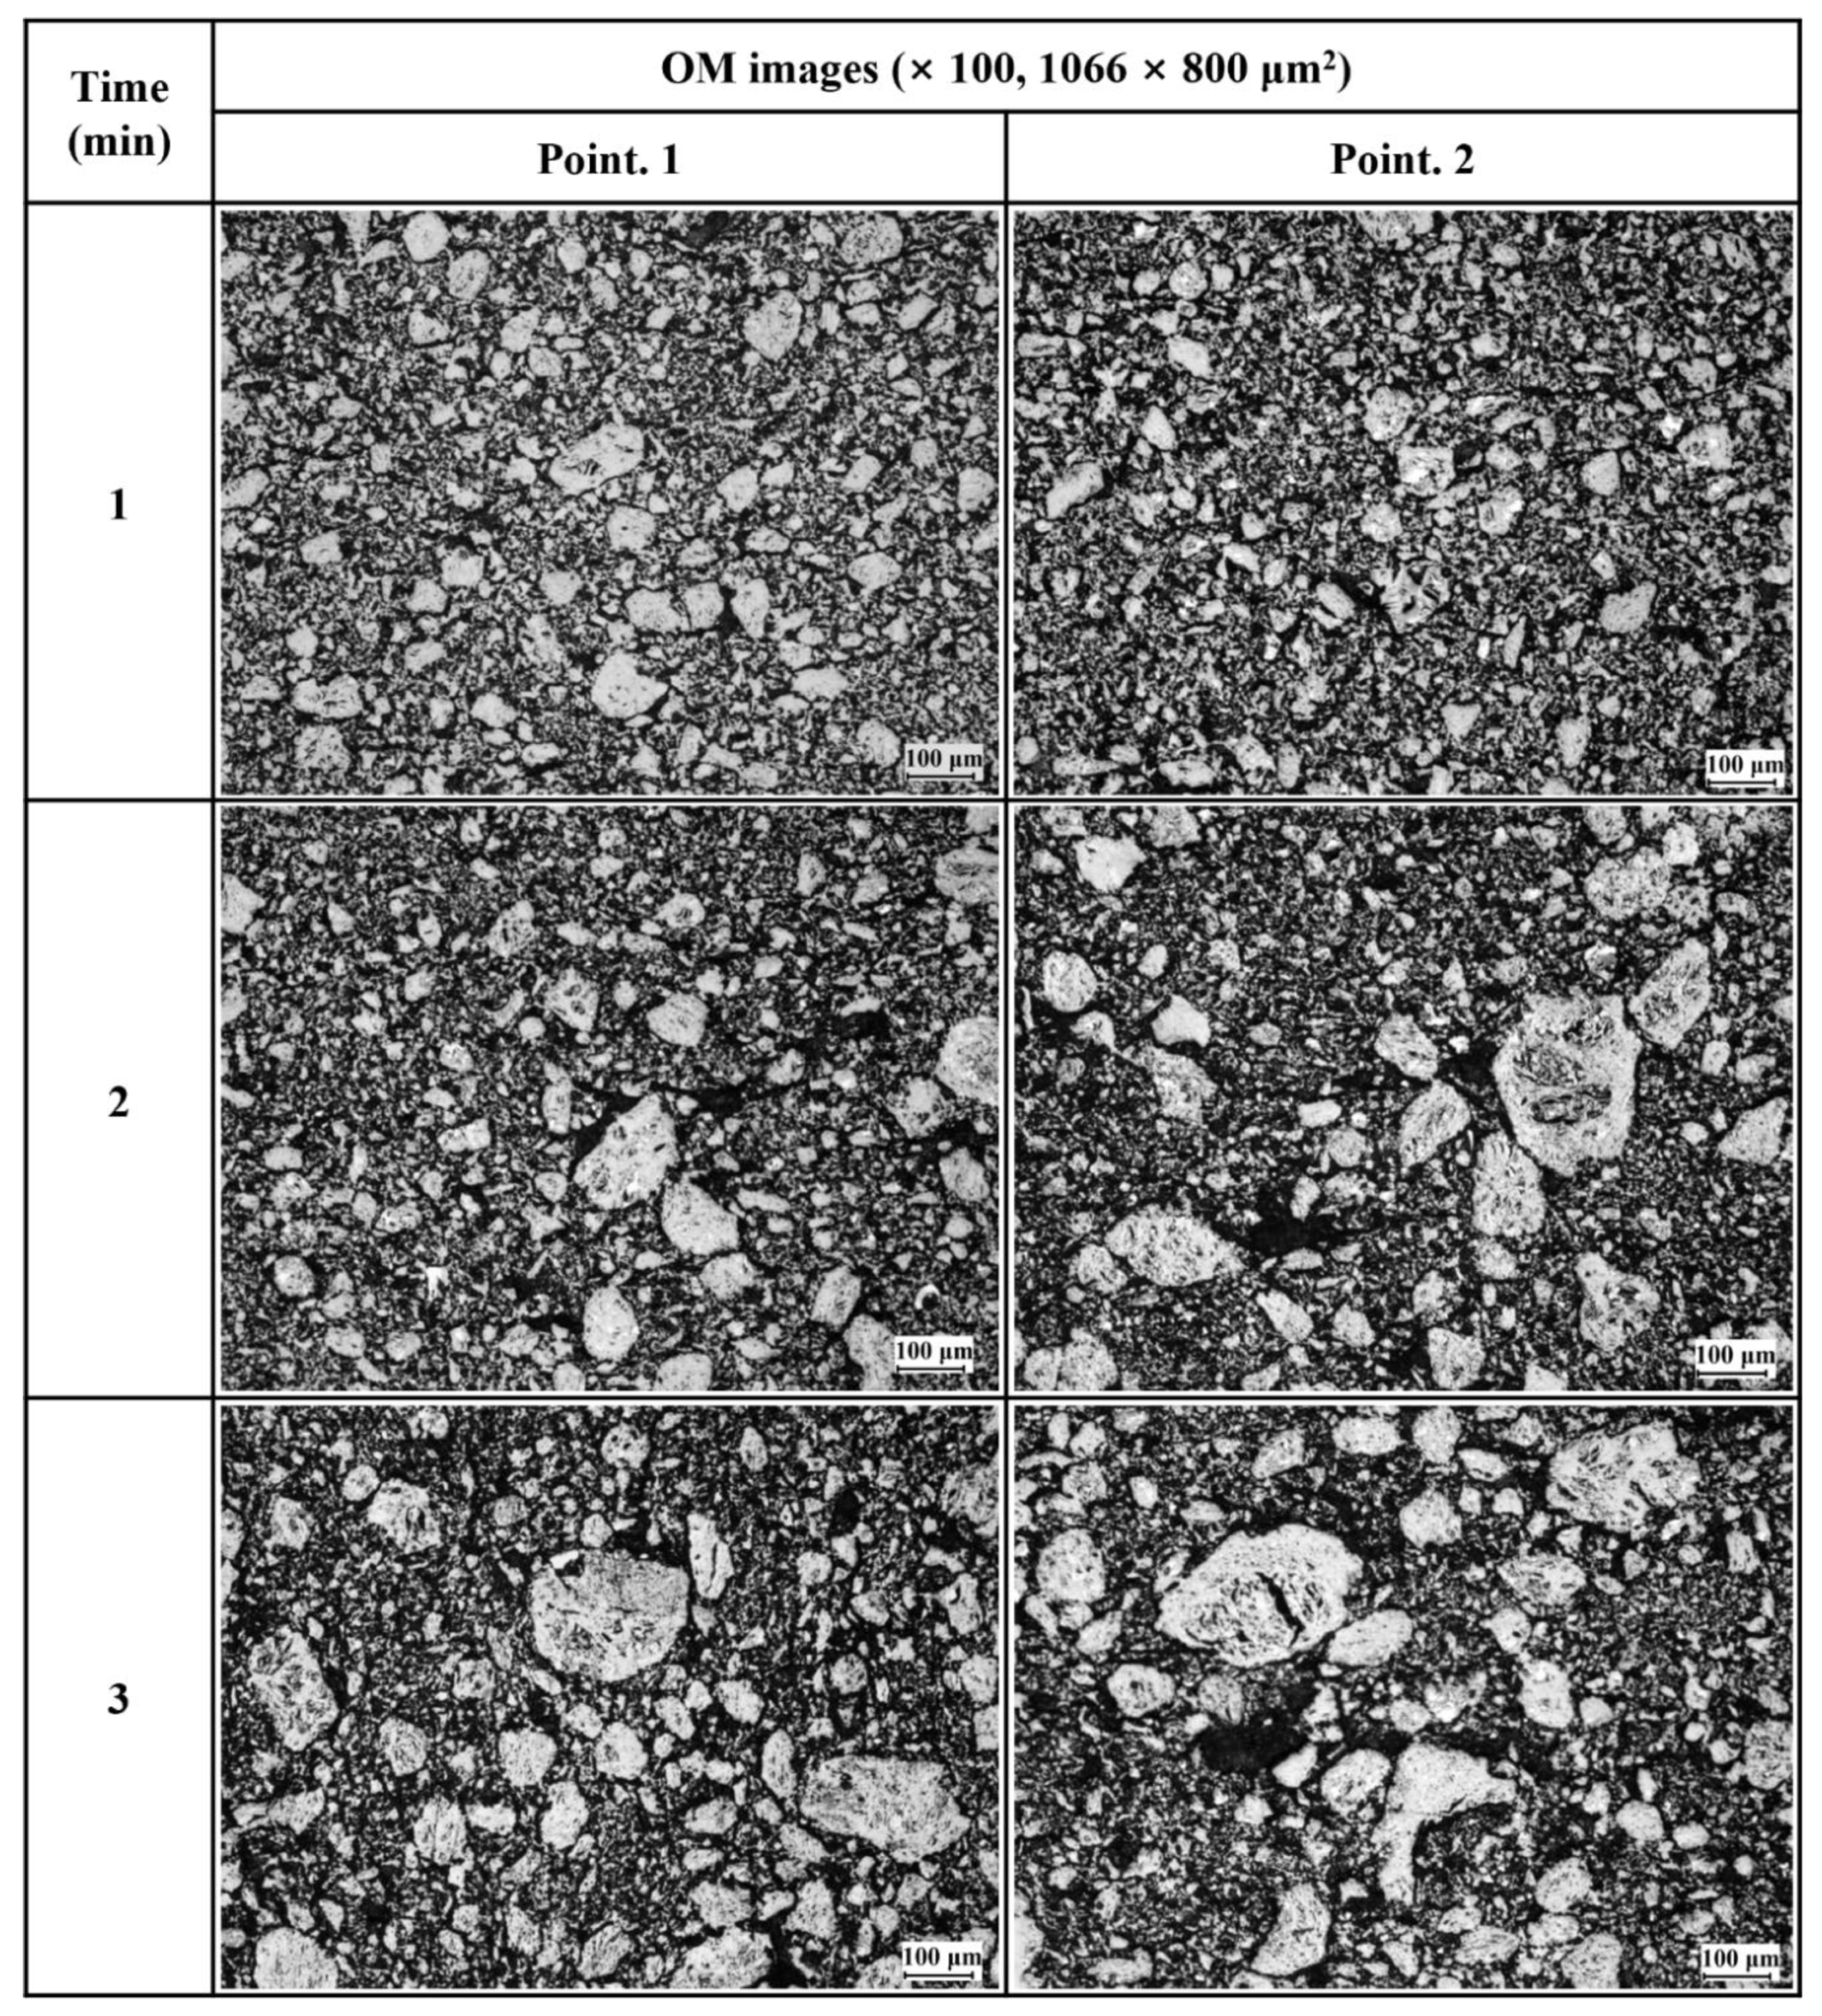
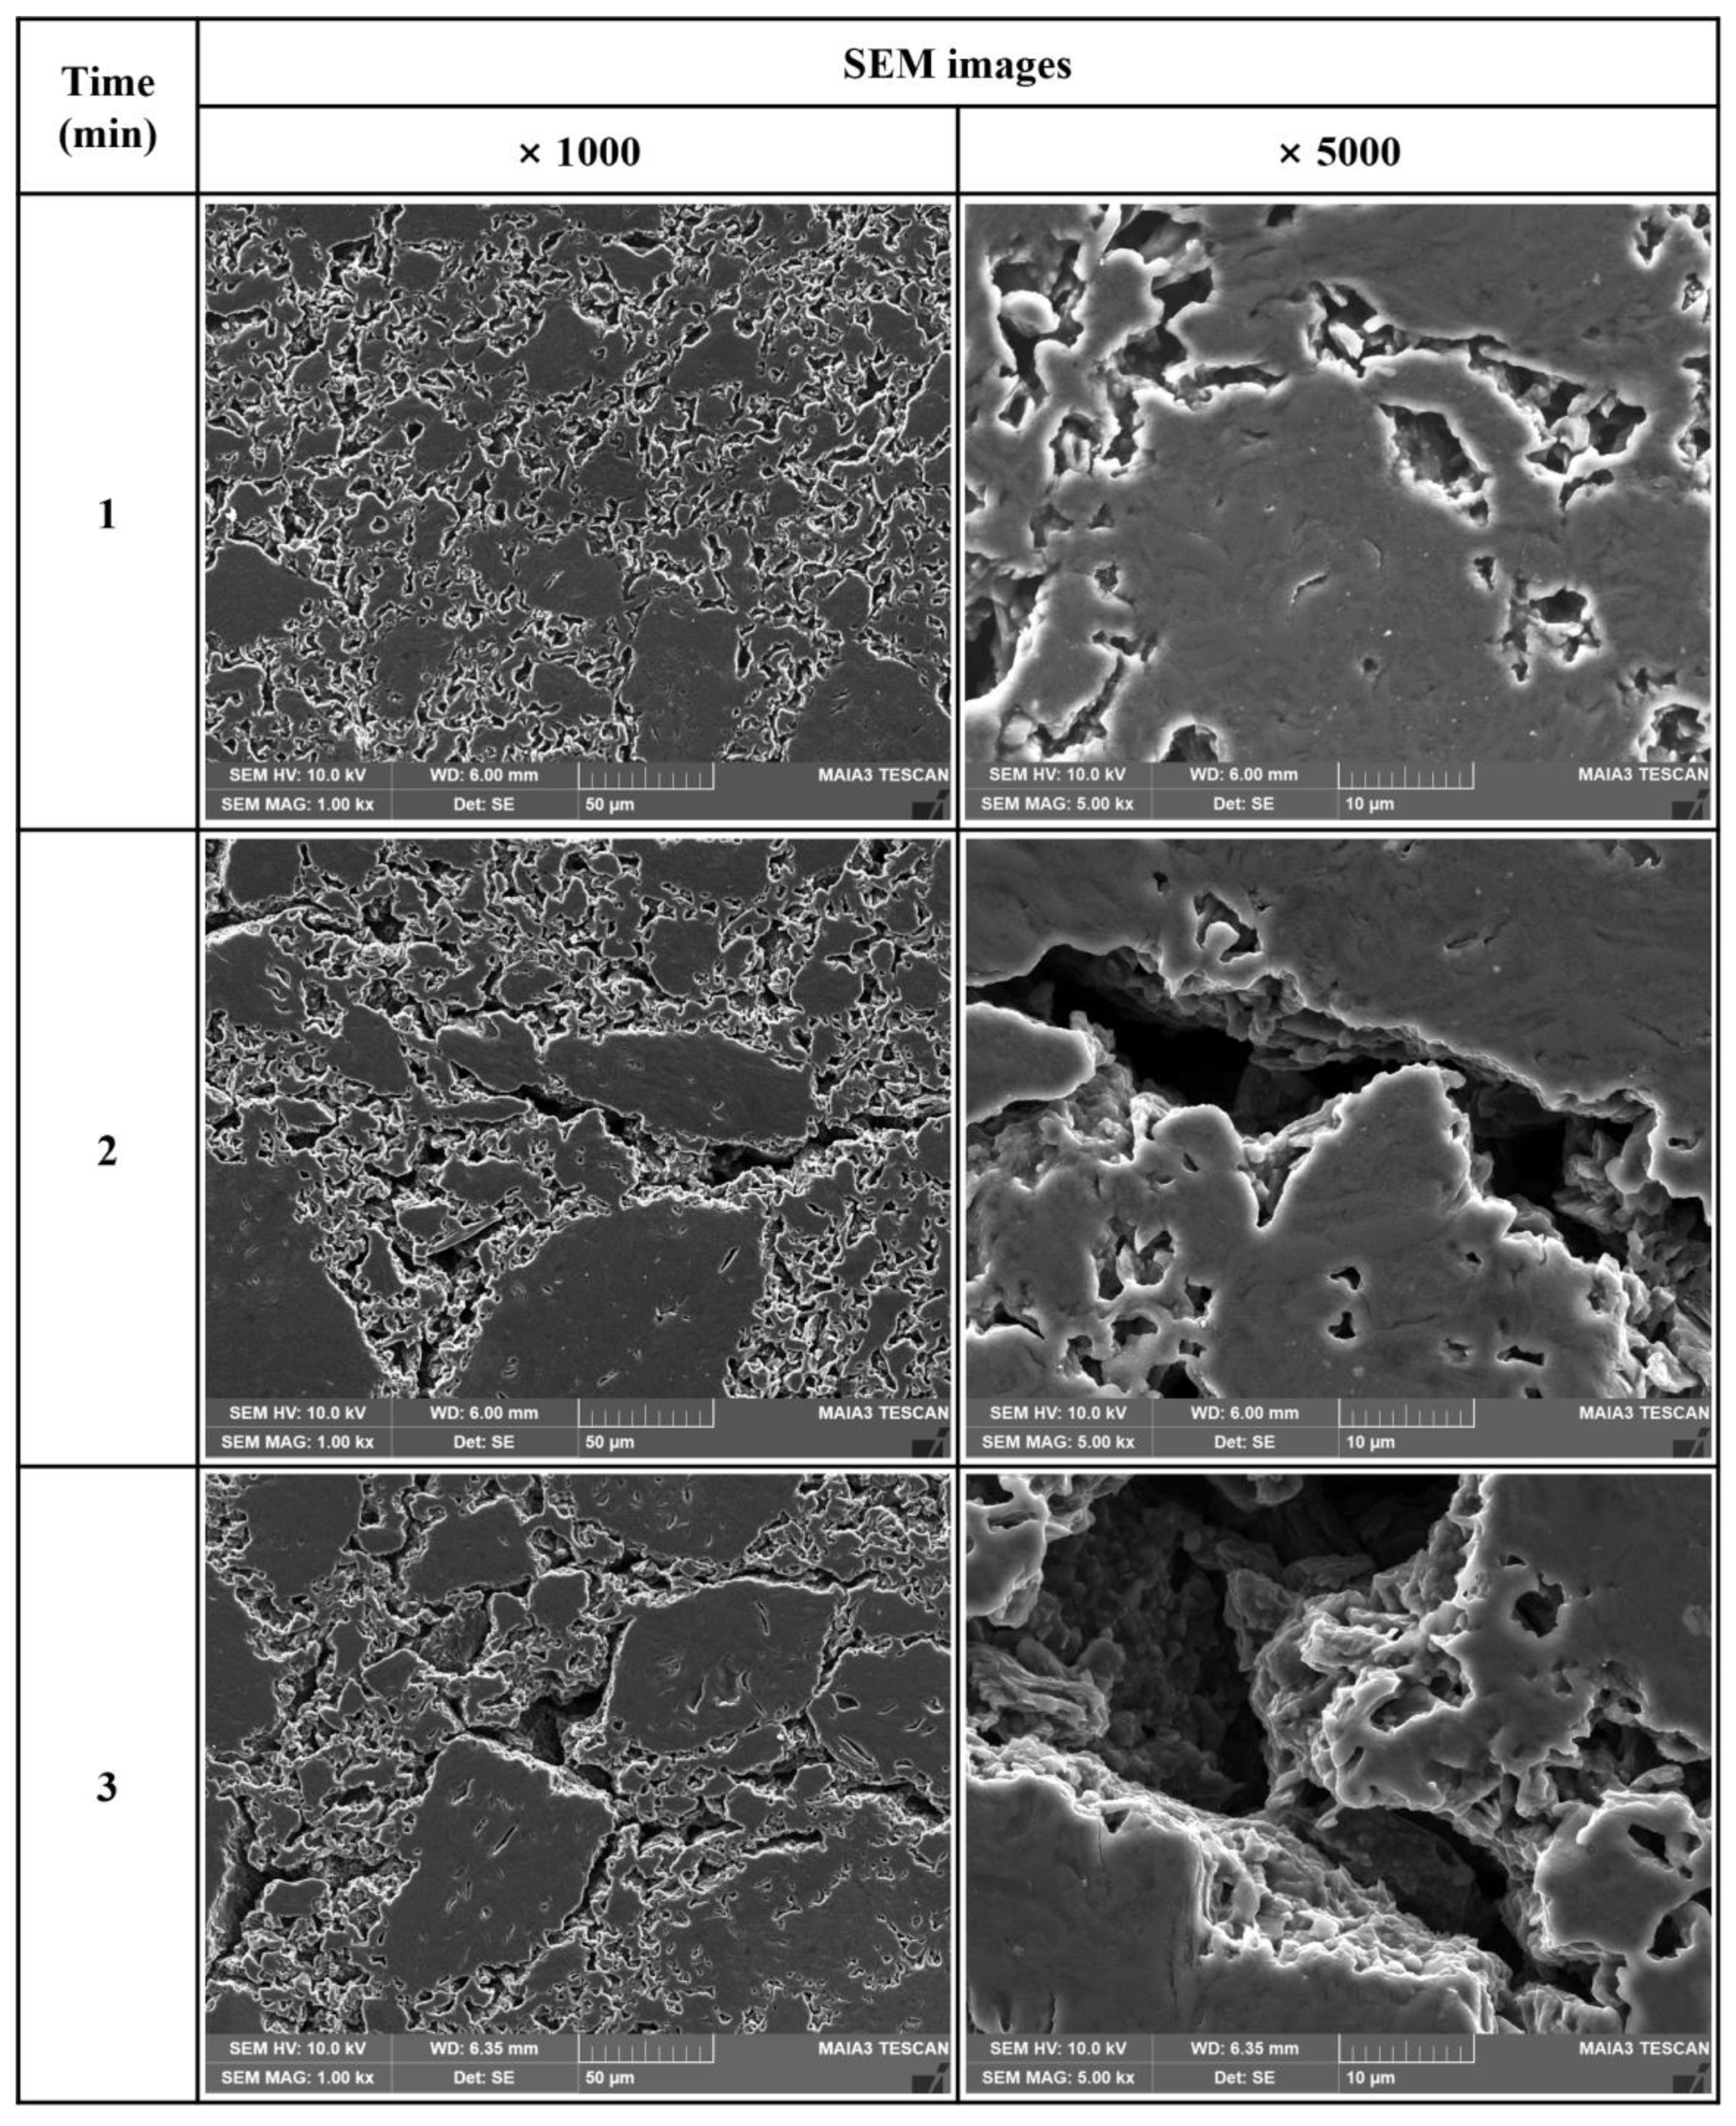
3.3. Effect of Holding Time under Compression Pressure

To analyze the effect of holding time under compression pressure, green bodies were fabricated at a compression pressure of 130 MPa for varying holding times of 1, 2, and 3 min. The green bodies then underwent carbonization and the bulk density, porosity, flexural strength, Shore hardness, electrical resistivity, and microstructure of the obtained carbon blocks were analyzed.
Figure 6a shows changes in the bulk density and porosity of the carbon blocks with respect to holding time under compression pressure. As the holding time increased, the bulk density tended to increase as follows: 1.391 g/cm3 at 1 min, 1.403 g/cm3 at 2 min, and 1.401 g/cm3 at 3 min.
At a compression pressure of 130 MPa, the volume reduction after carbonization (i.e., the volume difference between the green body and the corresponding carbon block) was 3.83%, 5.08% and 4.40% for holding times of 1, 2, and 3 min, respectively. The reduction was the smallest at a holding time of 1 min. This trend is consistent with that observed in the bulk density measurements, as shown in Figure 6a.
Figure 6b shows changes in the flexural strength and Shore hardness of the carbon blocks as a function of holding time under compression pressure. As the holding time increased, the flexural strength decreased, while the Shore hardness tended to increase slightly. At a holding time of 1 min, the largest flexural strength was achieved at 27.4 MPa, and it was lowest at 24.7 MPa when the holding time was 3 min.
Figure 6c includes a curve that represents changes in the electrical resistivity of the carbon blocks with respect to holding time under compression pressure. The electrical resistivity was the lowest at 61.2 μΩm at a holding time of 1 min. It increased to 62.8 μΩm and 63.6 μΩm when the holding times were 2 and 3 min, respectively. This trend of increasing electrical resistivity with a longer holding time is not consistent with the patterns observed in the porosity and electrical resistivity measurements, as shown in Figure 3a.
As previously shown in Figure 3a, while the porosity decreased by 8.2% from 30.4% to 27.9%, the electrical resistivity decreased by 9.2% from 67.3 μΩm to 61.2 μΩm. Here, an arithmetical relationship between the porosity reduction and the electrical resistivity reduction was estimated to be 0.89. In Figure 6a, however, while the porosity increased by 1.1% from 27.9% to 28.2%, the electrical resistivity increased by 3.9% from 61.2 μΩm to 63.6 μΩm. This can be translated into an arithmetical relationship of 0.28. The degree of correlation is 3.2 times smaller. Consequently, it can be reasoned that the observed increase in porosity, accompanied by an increase in electrical resistivity, with a longer holding time can be attributed to a factor other than their mutual relationship. The following microstructural analysis provides insights into this interpretation.
Figure 7 shows OM images of the carbon blocks fabricated with different holding times under compression pressure. In the images, the size of granules varied, depending on the holding time under compression pressure. Granules were larger at a holding time of 2 or 3 min compared with 1 min. At holding times of 2 and 3 min, granules larger than 200 µm were observed, and smaller granules with a size of about 100 µm surrounded the larger ones. When the holding time was 1 min, pores were the smallest; at holding times of 2 and 3 min, those larger than 100 µm appeared. These pores were primarily located around large granules in the form of ellipses or elongated shapes.
The trend of increasing bulk density and porosity with increasing holding time in Figure 6a can be explained by the microstructure. The formation of granules increases the bulk density of the block; however, the elongated pores formed around them by granulation are thought to have also increased the porosity of the block.
Figure 8 shows SEM images of the carbon blocks fabricated with different holding times under compression pressure. The size and shape of granules and pores differed depending on the holding time; they were the smallest at a holding time of 1 min. There was no significant difference in the size of both granules and pores between the holding times of 2 and 3 min. Pores were situated around granules in elongated shapes. Some pores were located within granules, and their size was 20 µm or less.
As the pressure holding times increased, granules grew in size, with pores connecting to each other and thus forming elongated shapes around the granules. The observed increase in the size of the granules is attributed to the pressure applied to kneaded particles during compression molding, causing them to connect and coalesce. Concurrently, some pores protruded out of the kneaded particles, thereby surrounding the granules, while others that failed to escape ended up within the granules. As the size of the granules increased, the distance between granules became smaller, leading to the connection of surrounding pores. The large, elongated pores observed in Figure 7 and Figure 8 are considered to be the products of this mechanism. The degradation in both mechanical and electrical properties observed at holding times of 2 and 3 min can be attributed to these variations in the size and shape of granules and pores.
Indeed, when subjected to compression pressure during molding, granules tended to connect and coalesce, leading to the formation of large pores around them. These large pores were expected to serve as a channel facilitating the release of volatiles from the binder pitch during carbonization. This mechanism was considered to contribute to a larger volume reduction in carbon blocks after carbonization.

4. Conclusions

In this study, carbon blocks were fabricated using coal-based isotropic coke and coal tar pitch while varying compression pressure and holding time during compression molding. The study then analyzed the bulk density, porosity, mechanical and electrical properties, and microstructure of the resulting carbon blocks. The major findings of this study are as follows.
Overall, as the compression pressure increased, the bulk density increased and the porosity decreased. The decreased porosity resulted in improved mechanical and electrical properties. Indeed, the carbon block fabricated at a compression pressure of 130 MPa exhibited the best performance. Microstructural analysis indicated variations in the connectedness of granules, with the size of pores decreasing as the compression pressure increased.
With an increase in holding time under compression pressure, bulk density and electrical resistivity increased, but the flexural strength decreased. In the microstructure, pores connected in elongated shapes were located along the interfaces of large granules. Some pores were observed within granules and their size was 20 µm or less. This microstructure is attributed to the coalescence of kneaded particles, affecting the properties of carbon blocks.
The major findings of this study confirm that variations in compression pressure affect the connectedness of granules, along with the size of pores. Additionally, variations in holding time under compression pressure are closely associated with the size and shape of both granules and pores.

Author Contributions

Conceptualization, S.-U.G. and U.-S.Y.; Methodology, S.-U.G. and S.-H.L.; Validation, S.-U.G.; Data curation, S.-U.G.; Writing, original draft, S.-U.G.; Writing, Review and editing, S.-H.L. and J.-S.R.; Supervision, J.-S.R.; Funding acquisition, J.-S.R. All authors have read and agreed to the published version of the manuscript.

Funding

This research was supported by a National Research Foundation of Korea grant funded by the Korea Government (MSIP) (NRF-2018R1A6A1A03025761). This work was supported by the project for Industry-University-Research Institute platform cooperation R&D funded Korea Ministry of SMEs and Startups in 2022 (S3310863). This research was supported by the Demonstration Program (C210301001) funded by the Korea Carbon Industry Promotion Agency (KCarbon, Korea).

Institutional Review Board Statement

Not applicable.

Informed Consent Statement

Not applicable.

Data Availability Statement

Data are contained within the article.

Conflicts of Interest

The authors declare no conflicts of interest.

References

  1. Kim, J.H. Control of the properties of a binder pitch to enhance the density and strength of graphite blocks. Carbon Lett. 2023, 33, 1757–1766. [Google Scholar] [CrossRef]
  2. Xiaowei, L.; Jean-Charles, R.; Suyuan, Y. Effect of temperature on graphite oxidation behavior. Nucl. Eng. Des. 2004, 227, 273–280. [Google Scholar] [CrossRef]
  3. Cunningham, N.; Lefèvre, M.; Dodelet, J.P.; Thomas, Y.; Pelletier, S. Structural and mechanical characterization of as-compacted powder mixtures of graphite and phenolic resin. Carbon 2005, 43, 3054–3066. [Google Scholar] [CrossRef]
  4. Qian, C.; Hu, K.; Wang, H.; Nie, L.; Feng, Q.; Lu, Z.; Li, P.; Lu, K. The effect of particle size distribution on the microstructure and properties of Al2O3 ceramics formed by stereolithography. Ceram. Int. 2022, 48, 21600–21609. [Google Scholar] [CrossRef]
  5. Hsu, J.Y.; Su, C.J.; Yen, Y.L.; Lee, C.Y. Effects of chemical composition of carbonaceous powder on morphology and thermal properties of graphite blocks. Carbon Lett. 2022, 32, 797–805. [Google Scholar] [CrossRef]
  6. Fan, D.; Chen, L.Q. Computer Simulation of Grain Growth and Ostwald Ripening in Alumina—Zirconia Two-Phase Composites. J. Am. Ceram. 1997, 80, 1773–1780. [Google Scholar] [CrossRef]
  7. Edwards, I.A.S.; Marsh, H.; Menendez, R. Introduction to Carbon Science; Butterworth-Heinemann: Oxford, England, 2013. [Google Scholar]
  8. Lee, N.; Seo, S.W.; Kwak, C.H.; Kim, M.I.; Im, J.S. Effects of Oxidation Process on Thermal Properties of Petroleum-Based Isotropic Pitch. Appl. Chem. Eng. 2020, 31, 36–42. [Google Scholar]
  9. Mora, E.; Santamaría, R.; Blanco, C.; Granda, M.; Menéndez, R. Mesophase development in petroleum and coal-tar pitches and their blends. J. Anal. Appl. Pyrolysis 2003, 68–69, 409–424. [Google Scholar] [CrossRef]
  10. Cosculluela, A.; Farre, J. Uniaxial compressive behaviour of an isotropic graphite. J. De Phys. IV Proc. 1997, 7, 471–476. [Google Scholar] [CrossRef]
  11. Dixit, M.; Srivastava, R.K. Effect of compaction pressure on microstructure, density and hardness of copper prepared by powder metallurgy route. IOP Conf. Ser Mater. Sci. Eng. 2017, 377, 012209. [Google Scholar] [CrossRef]
  12. Zhao, H.C.; He, Z.; Guo, X.H.; Lian, P.F.; Liu, Z.J. Effect of the average grain size of green pitch coke on the microstructure and properties of self-sintered graphite blocks. New Carbon Mater. 2020, 35, 184–192. [Google Scholar] [CrossRef]
  13. An, D.; Kim, K.H.; Lim, C.; Lee, Y.S. Effect of kneading and carbonization temperature on the structure of the carbon block for thermally conductive bulk graphites. Carbon Lett. 2021, 31, 1357–1364. [Google Scholar] [CrossRef]
  14. Lee, S.M.; Lee, S.H.; Roh, J.S. Effect of change in open porosity as a function of uniaxial molding pressure on density improvement after impregnation. J. Powder Mater. 2021, 28, 7–12. [Google Scholar] [CrossRef]
  15. Byun, T.S.; Jeon, D.P.; Lee, S.H.; Lee, S.W.; Roh, J.S. Changes in mechanical and electrical properties as a function of unidirectional pressure changes in preforming while isostatic pressing for graphite block fabrication. J. Korean Powder Metall. Inst. 2023, 30, 35–40. [Google Scholar] [CrossRef]
  16. Lee, S.H.; Hwang, Y.M.; Byun, T.S.; Ko, J.H.; Roh, J.S. Effect of heating rate, temperature, and residence time during graphitization on the mechanical and electrical properties of isotropic graphite blocks. Carbon. 2023, 208, 443–451. [Google Scholar] [CrossRef]
  17. Ko, J.H.; Lee, S.H.; Roh, J.S. Improved oxidation resistance of graphite block by introducing curing process of phenolic resin. Materials 2023, 16, 3543. [Google Scholar] [CrossRef] [PubMed]
  18. Toghyani, A.; Matthews, S.; Varis, J. Effect of dwell time and press speed on the forming quality of the press formed wood plastic composite product. Procedia CIRP 2019, 81, 524–528. [Google Scholar] [CrossRef]
  19. ISO 18754:2020(E); Fine ceramics (advanced ceramics, advanced technical ceramic)—Determination of density and apparent porosity. ISO: Geneva, Switzerland, 2020.
  20. ASTM C 611-98; Standard test method for electrical resistivity of manufactured carbon and graphite articles at room temperature. ASTM: West Conshohocken, PA, USA, 2010.
  21. ASTM C886-98; Standard test method for scleroscope hardness testing of carbon and graphite materials. ASTM: West Conshohocken, PA, USA, 2015.
  22. Pérez, J.M.; Rincón, J.M.; Romero, M. Effect of moulding pressure on microstructure and technological properties of porcelain stoneware. Ceram. Int. 2012, 38, 317–325. [Google Scholar] [CrossRef]
  23. Rice, R.W. Comparison of stress concentration versus minimum solid area based mechanical property-porosity relations. J. Mater. Sci. 1993, 28, 2187–2190. [Google Scholar] [CrossRef]
  24. Oshida, K.; Ekinaga, N.; Endo, M.; Inagaki, M. Pore analysis of isotropic graphite using image processing of optical micrographs. TANSO 1996, 173, 142–147. [Google Scholar] [CrossRef]
  25. Liu, B.; Zhao, H.; Li, X.; Yang, Z.; Zhang, D.; Liu, Z. Effect of pore structure on the thermophysical and frictional properties of high-density graphite. Microporous Mesoporous Mater. 2022, 330, 111613. [Google Scholar] [CrossRef]
  26. Pierson, H.O. Handbook of Carbon, Graphite, Diamonds and Fullerenes: Processing, Properties and Applications; Noyes Publications: Norwich, NJ, USA, 1993. [Google Scholar]
  27. Wei, W.; Song, Y.; Yang, Z.; Gao, G.; Xu, P.; Lu, M.; Tu, C.; Chen, M.; Wu, G. Investigation of the impacts of thermal shock on carbon composite materials. Materials 2019, 12, 435. [Google Scholar] [CrossRef] [PubMed]
Figure 1. Experimental procedure.
Applsci 14 00772 g001
Figure 2. Images of isotropic coke and kneaded particles.
Applsci 14 00772 g002
Figure 3. Curves representing mechanical properties as a function of compression pressure (a) bulk density and porosity, (b) flexural strength and Shore hardness, and (c) electrical resistivity.
Applsci 14 00772 g003
Figure 4. OM images of carbon blocks with respect to compression pressure at a magnification of 100×.
Applsci 14 00772 g004
Figure 5. SEM images of carbon blocks with respect to compression pressure at magnifications of 1000× and 5000×.
Applsci 14 00772 g005
Figure 6. Changes in mechanical properties as a function of holding time under compression pressure (a) bulk density and porosity, (b) flexural strength and Shore hardness, and (c) electrical resistivity.
Applsci 14 00772 g006
Figure 7. OM images of carbon blocks fabricated with different holding times under compression pressure at a magnification of 100×.
Applsci 14 00772 g007
Figure 8. SEM images of carbon blocks fabricated with different holding times under compression pressure at magnifications of 1000× and 5000×.
Applsci 14 00772 g008
Table 1. Properties of binder pitch.
Properties of Binder Pitch
Softening point (°C)110–120
Toluene insoluble (%)22–28
Quinoline insoluble (%)4–8
Ash content (%)<0.3
Fixed Carbon (%)>54
Disclaimer/Publisher’s Note: The statements, opinions and data contained in all publications are solely those of the individual author(s) and contributor(s) and not of MDPI and/or the editor(s). MDPI and/or the editor(s) disclaim responsibility for any injury to people or property resulting from any ideas, methods, instructions or products referred to in the content.

