Article

Analysis of Bridge Tests on Sandy Overburden Site with Fault Dislocating

1
School of Geological Engineering, Institute of Disaster Prevention, Beijing 101601, China
2
Key Laboratory of Building Collapse Mechanism and Disaster Prevention, China Earthquake Administration, Beijing 101601, China
3
Hebei Key Laboratory of Earthquake Disaster Prevention and Risk Assessment, Sanhe 065201, China
4
Key Laboratory of Earthquake Engineering and Engineering Vibration, Institute of Engineering Mechanics, China Earthquake Administration, Harbin 150080, China
5
School of Civil Engineering, Institute of Disaster Prevention, Beijing 101601, China
*
Author to whom correspondence should be addressed.
Appl. Sci. 2024, 14(2), 852; https://doi.org/10.3390/app14020852
Submission received: 20 December 2023 / Revised: 15 January 2024 / Accepted: 17 January 2024 / Published: 19 January 2024
(This article belongs to the Section Civil Engineering)

Abstract

:
Performance-based seismic design methods for bridges are advancing, yet limited research has explored the damage mechanisms of bridges subjected to extreme seismic effects, such as those near or across faults. To investigate the damage mechanisms under bedrock dislocation and bridge rupture resistance, providing essential insights for the standardized design and construction of bridges in close proximity to seismic rupture sites, we developed a large-scale device to model bridges in the immediate vicinity of tilted-slip strong seismic rupture sites. This included a synchronous bedrock dislocation loading system. Four sets of typical sandy soil modeling tests were concurrently conducted. The results indicate: (1) The overall shear deformation zone of the foundation and surface uneven deformation primarily concentrate the overburdened soil body along the fault dip. The damaged area under the low-dip reverse fault is lighter on the surface and inside the soil body compared to the high-dip-positive fault. (2) The presence of bridges reduces the width of the main rupture zone and avoidance distance to some extent. However, this reduction is not as significant as anticipated. The damage to the bridge pile foundation along the fault dislocation tendency notably leads to the bending damage of the bridge deck. (3) Input parameters for fracture-resistant bridge design (surface rupture zone location, extent, maximum deformation, etc.) can be deduced from the free site. Within the rupture zone, a “fuse” design can be implemented using simply supported girders. Additionally, combining the “fuse” design with simple supported girders on both sides and utilizing simple support beams for “fuse” design within the rupture zone, along with structural “disconnection”, allows for reinforcing measures on the bridge structure’s foundation platform and pile in the soil body.

1. Introduction

During a strong earthquake, the displacement of bedrock can rupture the overlying soil layer, causing the destruction of buildings and rendering bridge structures nonfunctional. This phenomenon is referred to as the surface rupture effect in strong earthquakes [1,2,3,4]. The surface rupture resulting from the primary fault during a strong earthquake is highly destructive, and current seismic fortification measures struggle to mitigate the direct damage caused to buildings and critical lifeline infrastructure [5]. The Northridge earthquake of 1994, with a magnitude of Mw6.7, induced the displacement of an elevated bridge over the Sacramento River, leading to the collapse of the bridge deck. The damage was further intensified by the strong earthquake on the normal fault [6]. During the 1999 Mw7.4 earthquake in Turkey, a diagonally intersecting U-type simply supported girder bridge with four spans was impacted by a fault, leading to the total collapse of the northernmost section and the descent of girders on the remaining three spans [7,8]. During the 2008 Wenchuan earthquake in China, with a magnitude of Ms8.0, the Xiaoyudong Bridge and the Yingxiu Shunhe Bridge near the fault zone collapsed due to fault displacement during the earthquake. The bottom of the pier of Baihua Bridge [9] has crushing failure, and the bottom of the pier and the tie beam have severe shear failure [10]. The 2010 Chilean earthquake, measuring M8.8, inflicted severe damage on several bridges, among them the San Antonio Bridge and the Loncomilla Bridge, situated on the normal fault [11]. During the 2011 Christchurch earthquake in New Zealand, with a magnitude of M6.3, the Lyttelton Port Bridge, traversing a fault, experienced extensive damage to its primary structure due to surface rupture induced by the powerful earthquake [12]. Regulations governing bridges in different countries, including “Canada’s Canadian Highway Bridge Design Code [13]”, the United States “Handbook for Seismic Reinforcement and Renovation of Highway Structures [14]”, China’s “Guidelines for Seismic Design of Highway Bridges [15]”, “Railway Engineering Seismic Design Code [16]”, and “Highway Bridge Seismic Design Code [17]”, generally emphasize the prohibition or avoidance of active faults and their associated seismic fracture zones. Nevertheless, for critical infrastructure like bridges with extensive longitudinal spans, challenges arise from constraints like terrain, topography, construction expenses, active fault detection technology, and calculation theories. Prohibiting or avoiding them alone cannot entirely mitigate the risk of damage to bridges spanning or adjacent to the surface rupture zone of seismic faults [18,19]. Hence, conducting proactive research on the damage mechanisms and seismic design of bridges near strong earthquake surface rupture zones, along with devising measures to enhance fracture resistance, holds significant practical importance and engineering application value. This will serve as a challenging yet pivotal aspect in the seismic design of bridge beams within intricate engineering geological conditions, particularly in regions prone to strong earthquake-induced fractures.
Numerous scholars have conducted model tests to study the damage to bridge structures and their foundation soils in surface rupture zones due to bedrock fault dislocation. For instance, Wang Yanpeng, Li Bixiong [20], and their colleagues conducted geomechanics similarity model tests on the Plateau bridge. They simulated the influence of site deformation near the fault on the failure of a simply supported beam bridge under horizontal load with a fault inclination of 70°. Ling Xianchang [21], A.S. HOKMABADI [22], Xing Fan [23], Li Pei Zhen [24,25], and others conducted shaking table modeling tests and numerical simulations to investigate the behavior of pile-soil-structures subjected to ground vibration. Their findings concluded that the sand soil layer amplifies the effect, while the clay layer induces a damping effect [26]. Xiang and Yi [27] and colleagues conducted a shaking table array test on a bridge spanning a strike-slip fault, using the approach bridge of Pufan Bridge as a prototype with a 1:10 similarity ratio. The results demonstrated the effective protection of the main girder and bridge pier by lead-core rubber bearings and transverse blocking blocks. Additionally, the lead-core rubber bearings were found to protect the main girders and abutments, while the transverse block effectively restricted large deformations in the bearings. Yuanzheng Li [28] conducted a seismic performance study on a steel-concrete composite rigid-frame bridge with double-layer steel-tube-concrete abutments (SCCRFB) under the influence of seismic surface rupture from a reverse strike fault. SAIIDI et al. [29], employing the linear static analysis method proposed by GOEL and CHOPR [30], conducted a vibration test on a two-span concrete bridge with a 1:10 similarity ratio. Shaking table tests revealed that the fault rupture zone significantly influenced the location and type of damage to the foundation of the bridge row piers [31].
Physical modeling of bridges facing substantial bedrock dislocations is currently limited in both domestic and international contexts. While existing studies utilize shaker seismic simulation equipment, they struggle to accurately replicate the movement of underground faults and their impact on bridge structures, particularly through the rupture of foundation soil. Additionally, available loading equipment for simulating bedrock dislocation lacks the capacity needed to meet the size requirements of both the box device and the bridge model with overburdened site soil. The control of the loading process under bedrock dislocation poses a significant challenge. This paper addresses these limitations by introducing a self-developed “bridge foundation-foundation-superstructure” physical model for large-scale bedrock fault simulation testing. This model not only successfully simulates bedrock dislocation but also employs high-precision synchronous hydraulic loading. The research outcomes contribute to addressing the scarcity in the physical modeling of bridges affected by bedrock dislocations. Furthermore, the study explores the impact of bedrock dislocation on bridge engineering, considering the overburden. The findings enhance our understanding of the seismic mechanisms influencing bridge engineering under bedrock dislocations, the rupture-resistant capacity of bridges when facing overburden soil rupture and provide essential information for the standardized design and construction of bridge engineering sites near seismic fractures.

2. Experimental Plan Design

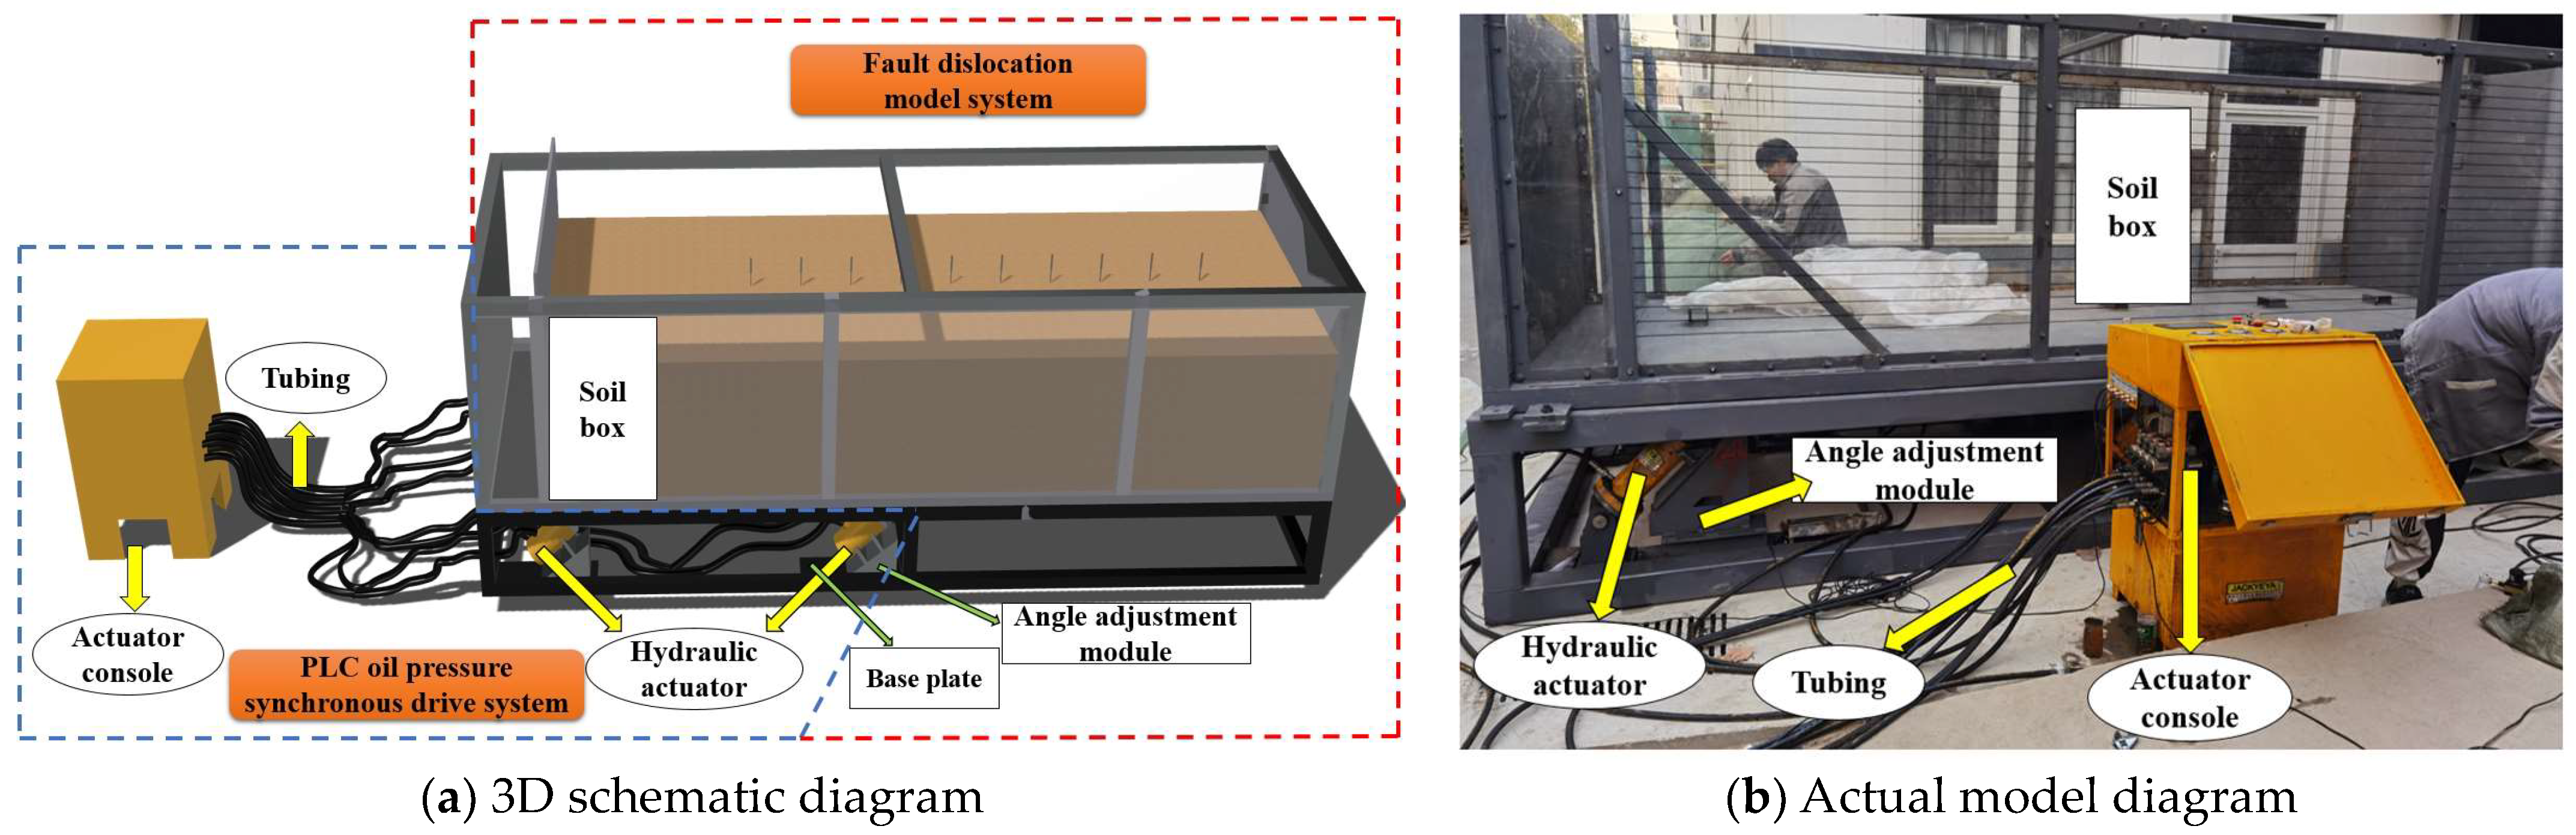
2.1. Bedrock Dislocation Loading Test System

The self-developed large-scale model test system for simulating surface rupture during strong earthquakes is illustrated in Figure 1a. The system comprises a PLC hydraulic synchronous drive system, including hydraulic actuators, an actuator console, and tubing, as well as a fault bedrock misalignment system consisting of a soil rigid body box, an angle adjuster, and a simulated bedrock steel plate base. The soil rigid body box measures 4.96 m in length, 1.85 m in width, and 1.4 m in height. The front and rear surfaces of the soil box are equipped with 0.025 m thick transparent high-strength Plexiglas. The base of the simulated bedrock steel plate comprises two movable high-strength double-layered steel plates with support ribs, imitating the upper and lower fault disks (active and passive disks). The complete test setup is depicted in Figure 1b. To gather data, the system utilizes a top bar displacement meter, a high-precision dynamic earth pressure sensor, and an acceleration sensor. These instruments collect information on surface displacement, deformation, soil pressure within the cover layer, acceleration of the soil layer, and acceleration data of the bridge. Both the software and hardware for data collection and recording are part of the collection system provided by China Jiangsu Province Donghua Company.

2.2. Similarity Relationship

Following similarity theory [32], control parameters such as geometric dimensions, density, and gravitational acceleration are established. The geometric dimensional similarity ratio is set at 40, based on the Π theorem proposed by Buckingham for designing the similarity system. The derived similarity constants for other physical quantities are outlined in Table 1.

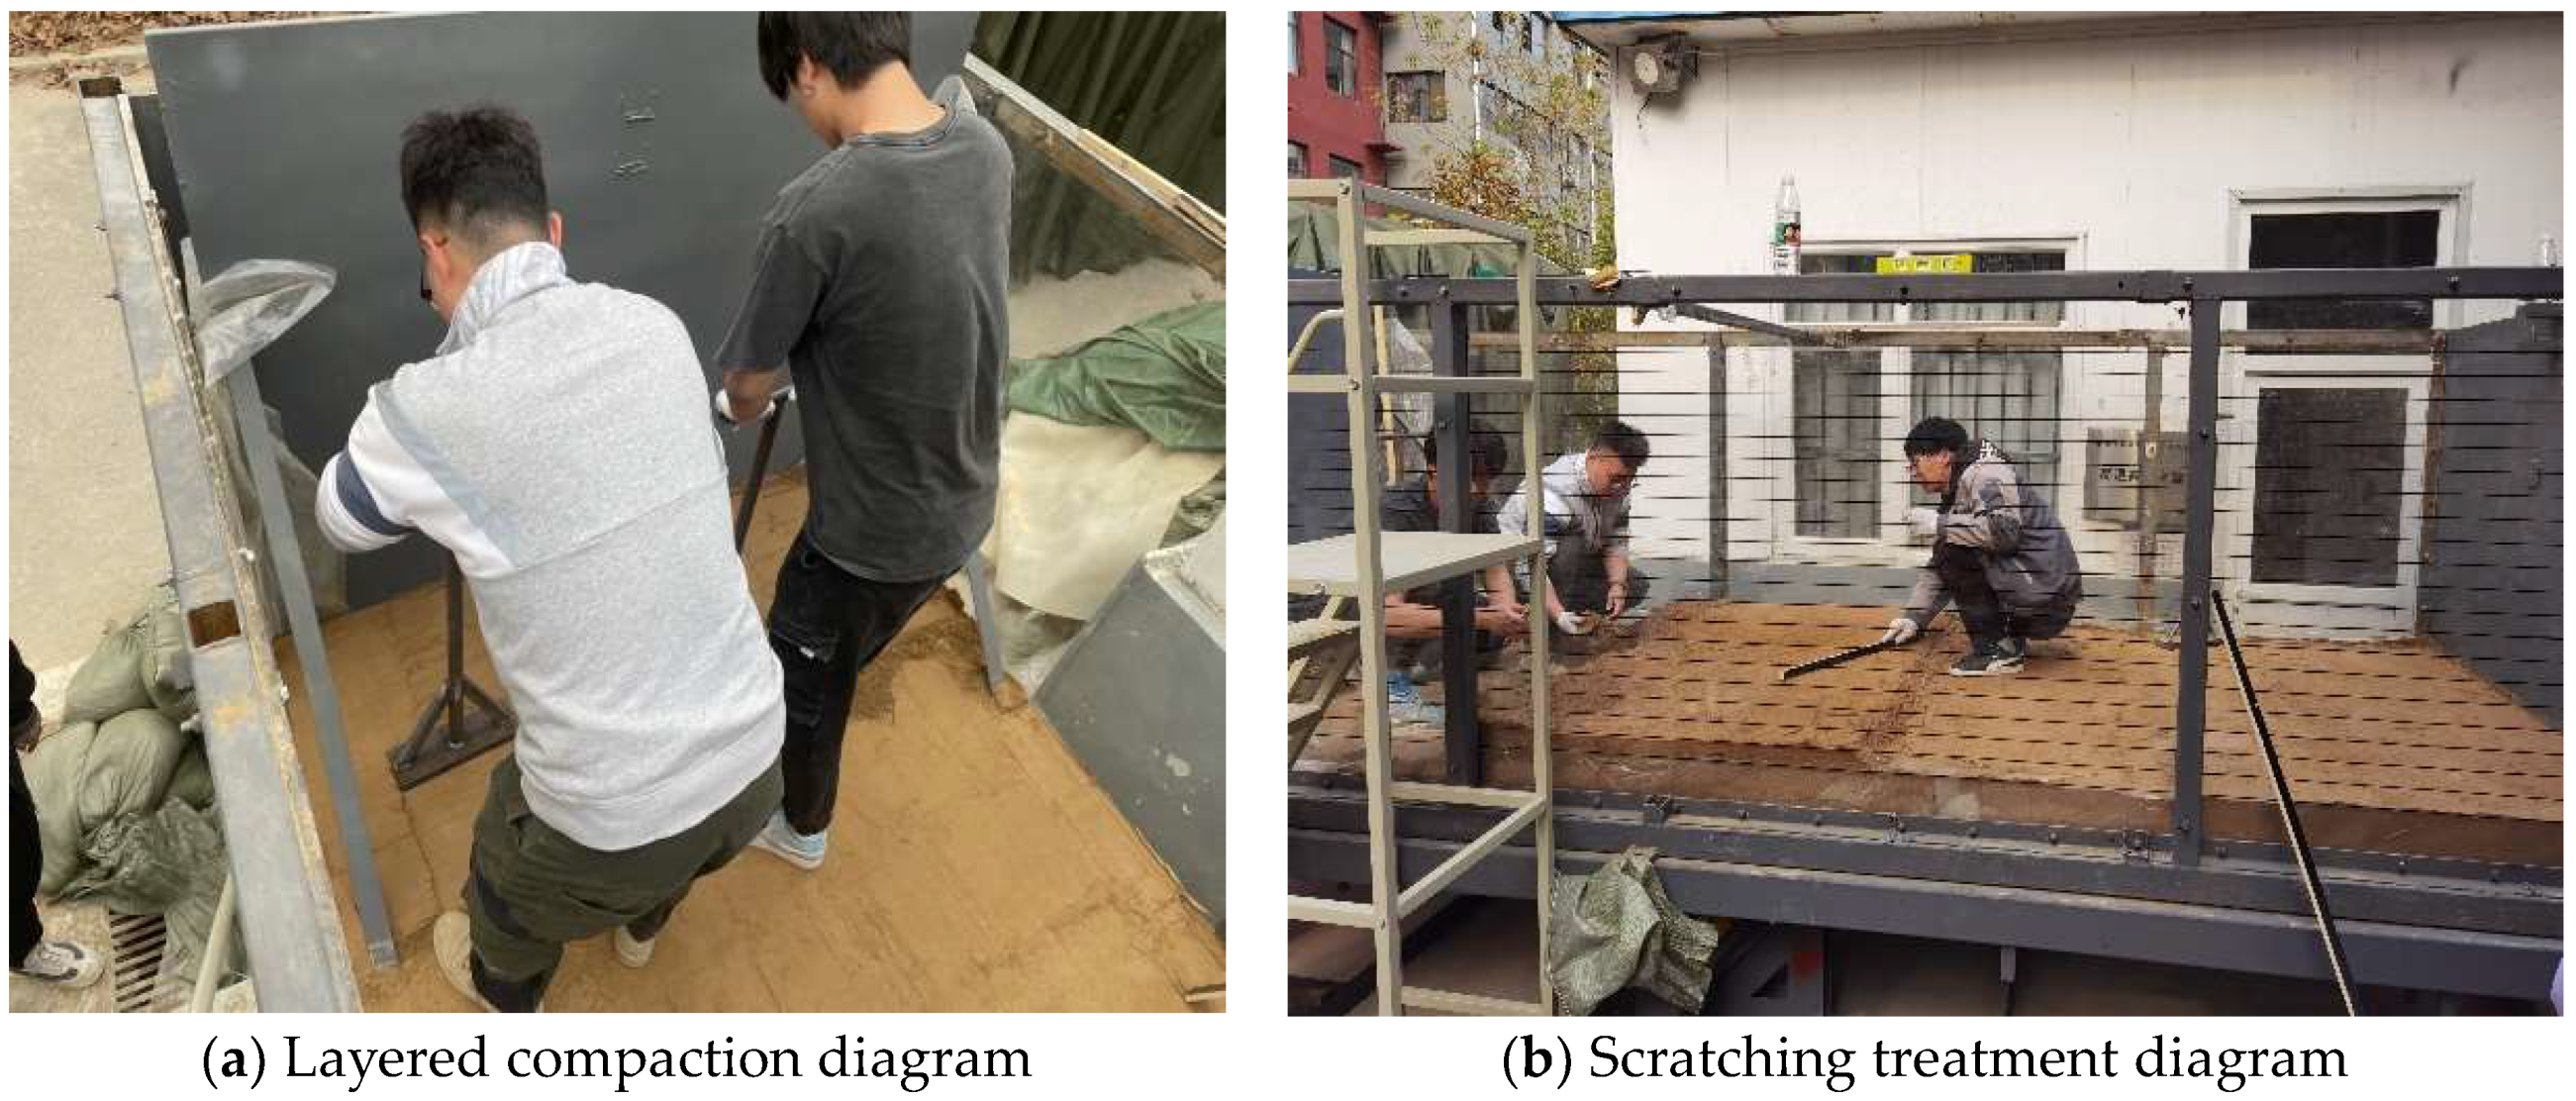
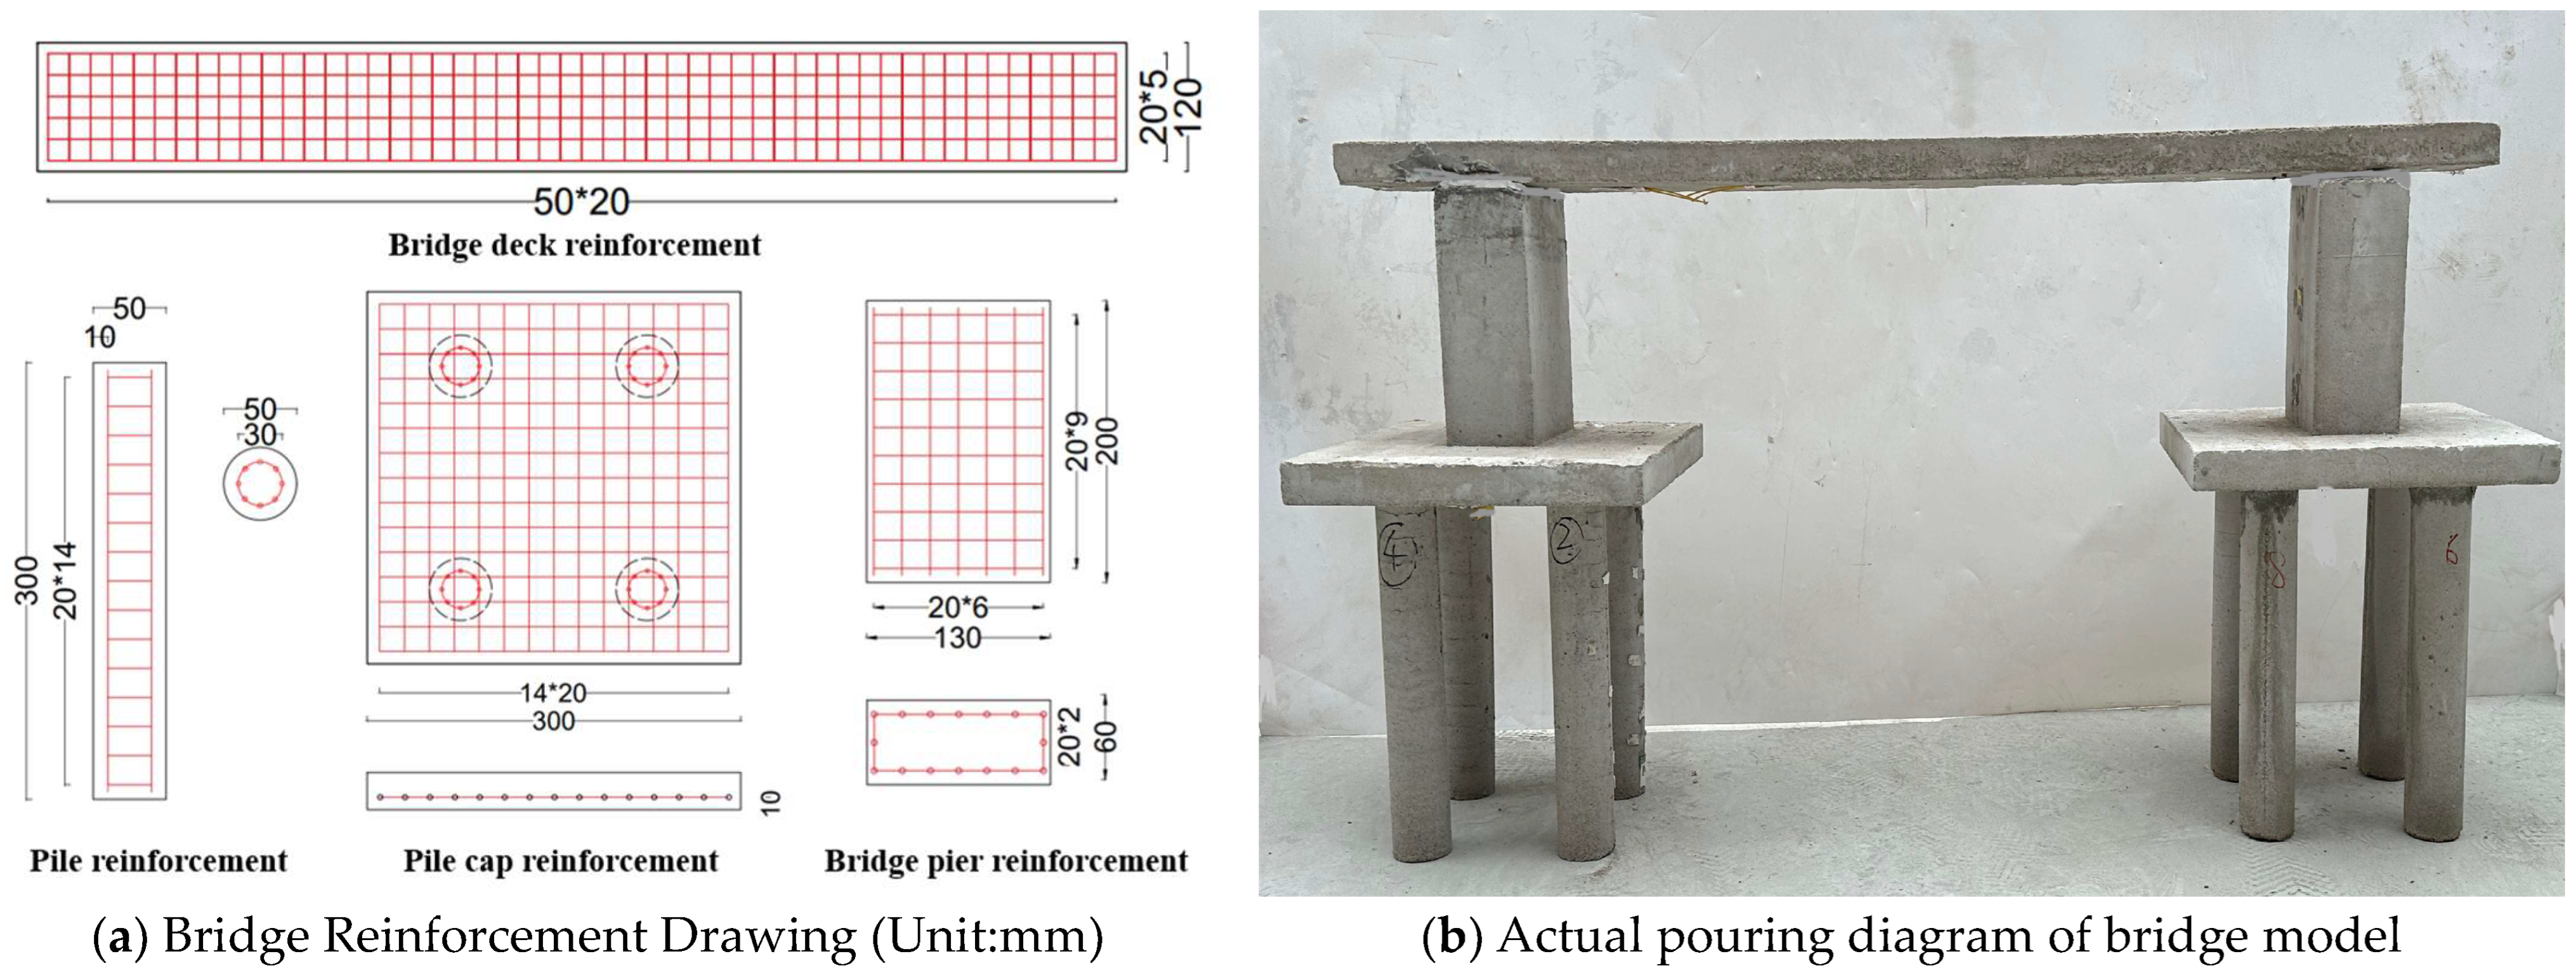
2.3. Bridge Model and Soil Compaction

The soil samples for the bridge model test utilized standard sand. The particle grading curve obtained through the sieve analysis method is depicted in Figure 2, revealing an unevenness coefficient (Cu) of 2.38. To ensure uniform density within the model box, a layer-wise tamping approach was employed during sample pouring. Each layer underwent tamping followed by scraping until a cover layer thickness of 1 m was achieved, as illustrated in Figure 3. The tamping adhered to design weight requirements, determined through pre-test tamping trials. The tamping adhered to design weight requirements, determined through pre-test tamping trials. The maximum dry density of the compacted sandy soil sample was 1675 kg/m3.
Orthogonal experiments were conducted to assess the influence of constituent factors (cement, gypsum, sand, and water) on the bridge pouring material. Seventeen specimen groups underwent uniaxial compression tests, leading to the selection of a cement:gypsum:sand:water ratio of 2.5:2.5:15:55, yielding a compressive strength of 1.867 MPa. Reinforcement specifications for reinforced concrete piles, bearing platforms, abutments, and box girders followed the principle of equal strength [33]. This led to the choice of a 20 mm × 20 mm steel mesh with a 1 mm diameter at 20 mm intervals, as shown in Figure 4a. The casting process involved batching piles, abutments, and piers together, while the bridge deck slab was cast independently and assembled later. After reaching 80% strength during the conservation period, the bridge components underwent demolding and standard maintenance for seven days before testing. The bridge deck, two piers, and other elements were connected using cement mortar at joints, ensuring readiness for experimentation. The actual casting diagram of the bridge model is presented in Figure 4b.

2.4. Experimental Plan Design

This study conducted four tests simulating bedrock dislocation in sand overburden sites, detailed in Table 2. These comprised two tests on sand overburden sites and two on sand overburden bridge sites. To eliminate interference, all data recorded by the acquisition sensors during the test were presented as relative change values. Thus, all initial data values were zeroed within the acquisition software at the test’s outset. The actuator was programmed to lift the upper disc at an empirically determined rate of 1 mm/s to simulate bedrock dislocations. At the test’s initiation, the actuator raised the upper plate, initiating fault movement. The actuator recorded test data at 10 mm intervals. Simultaneously, high-definition cameras documented test phenomena from both front and top views. This configuration represents a comprehensive operational condition for the experiment.

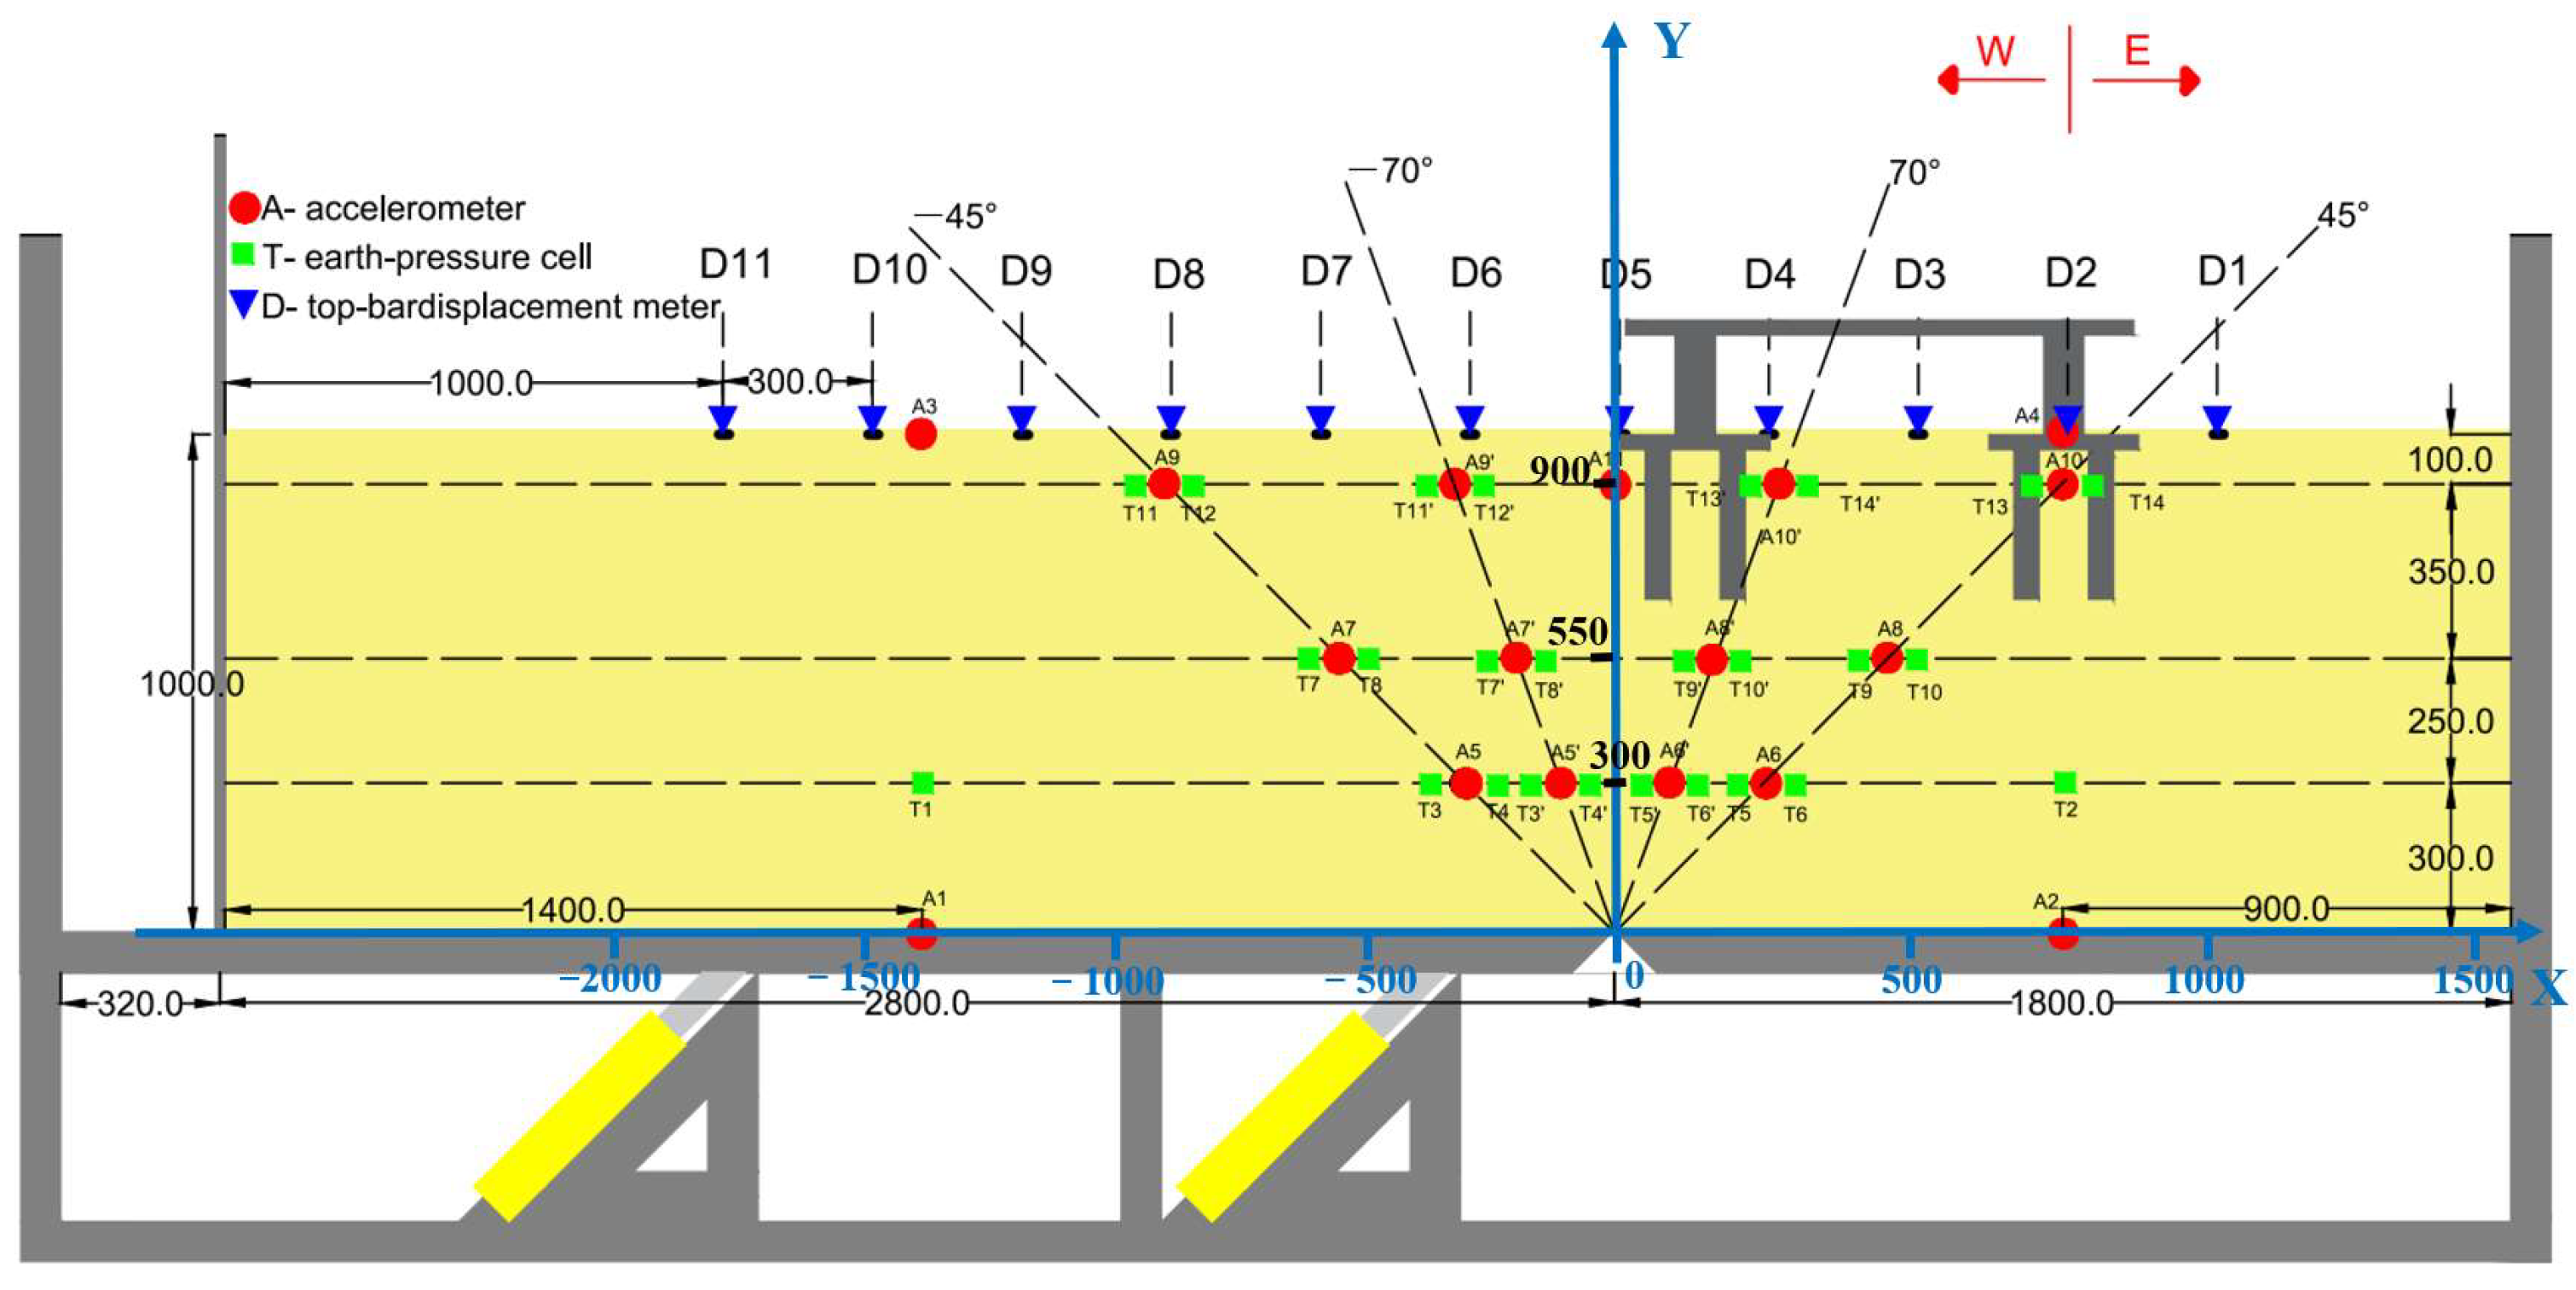
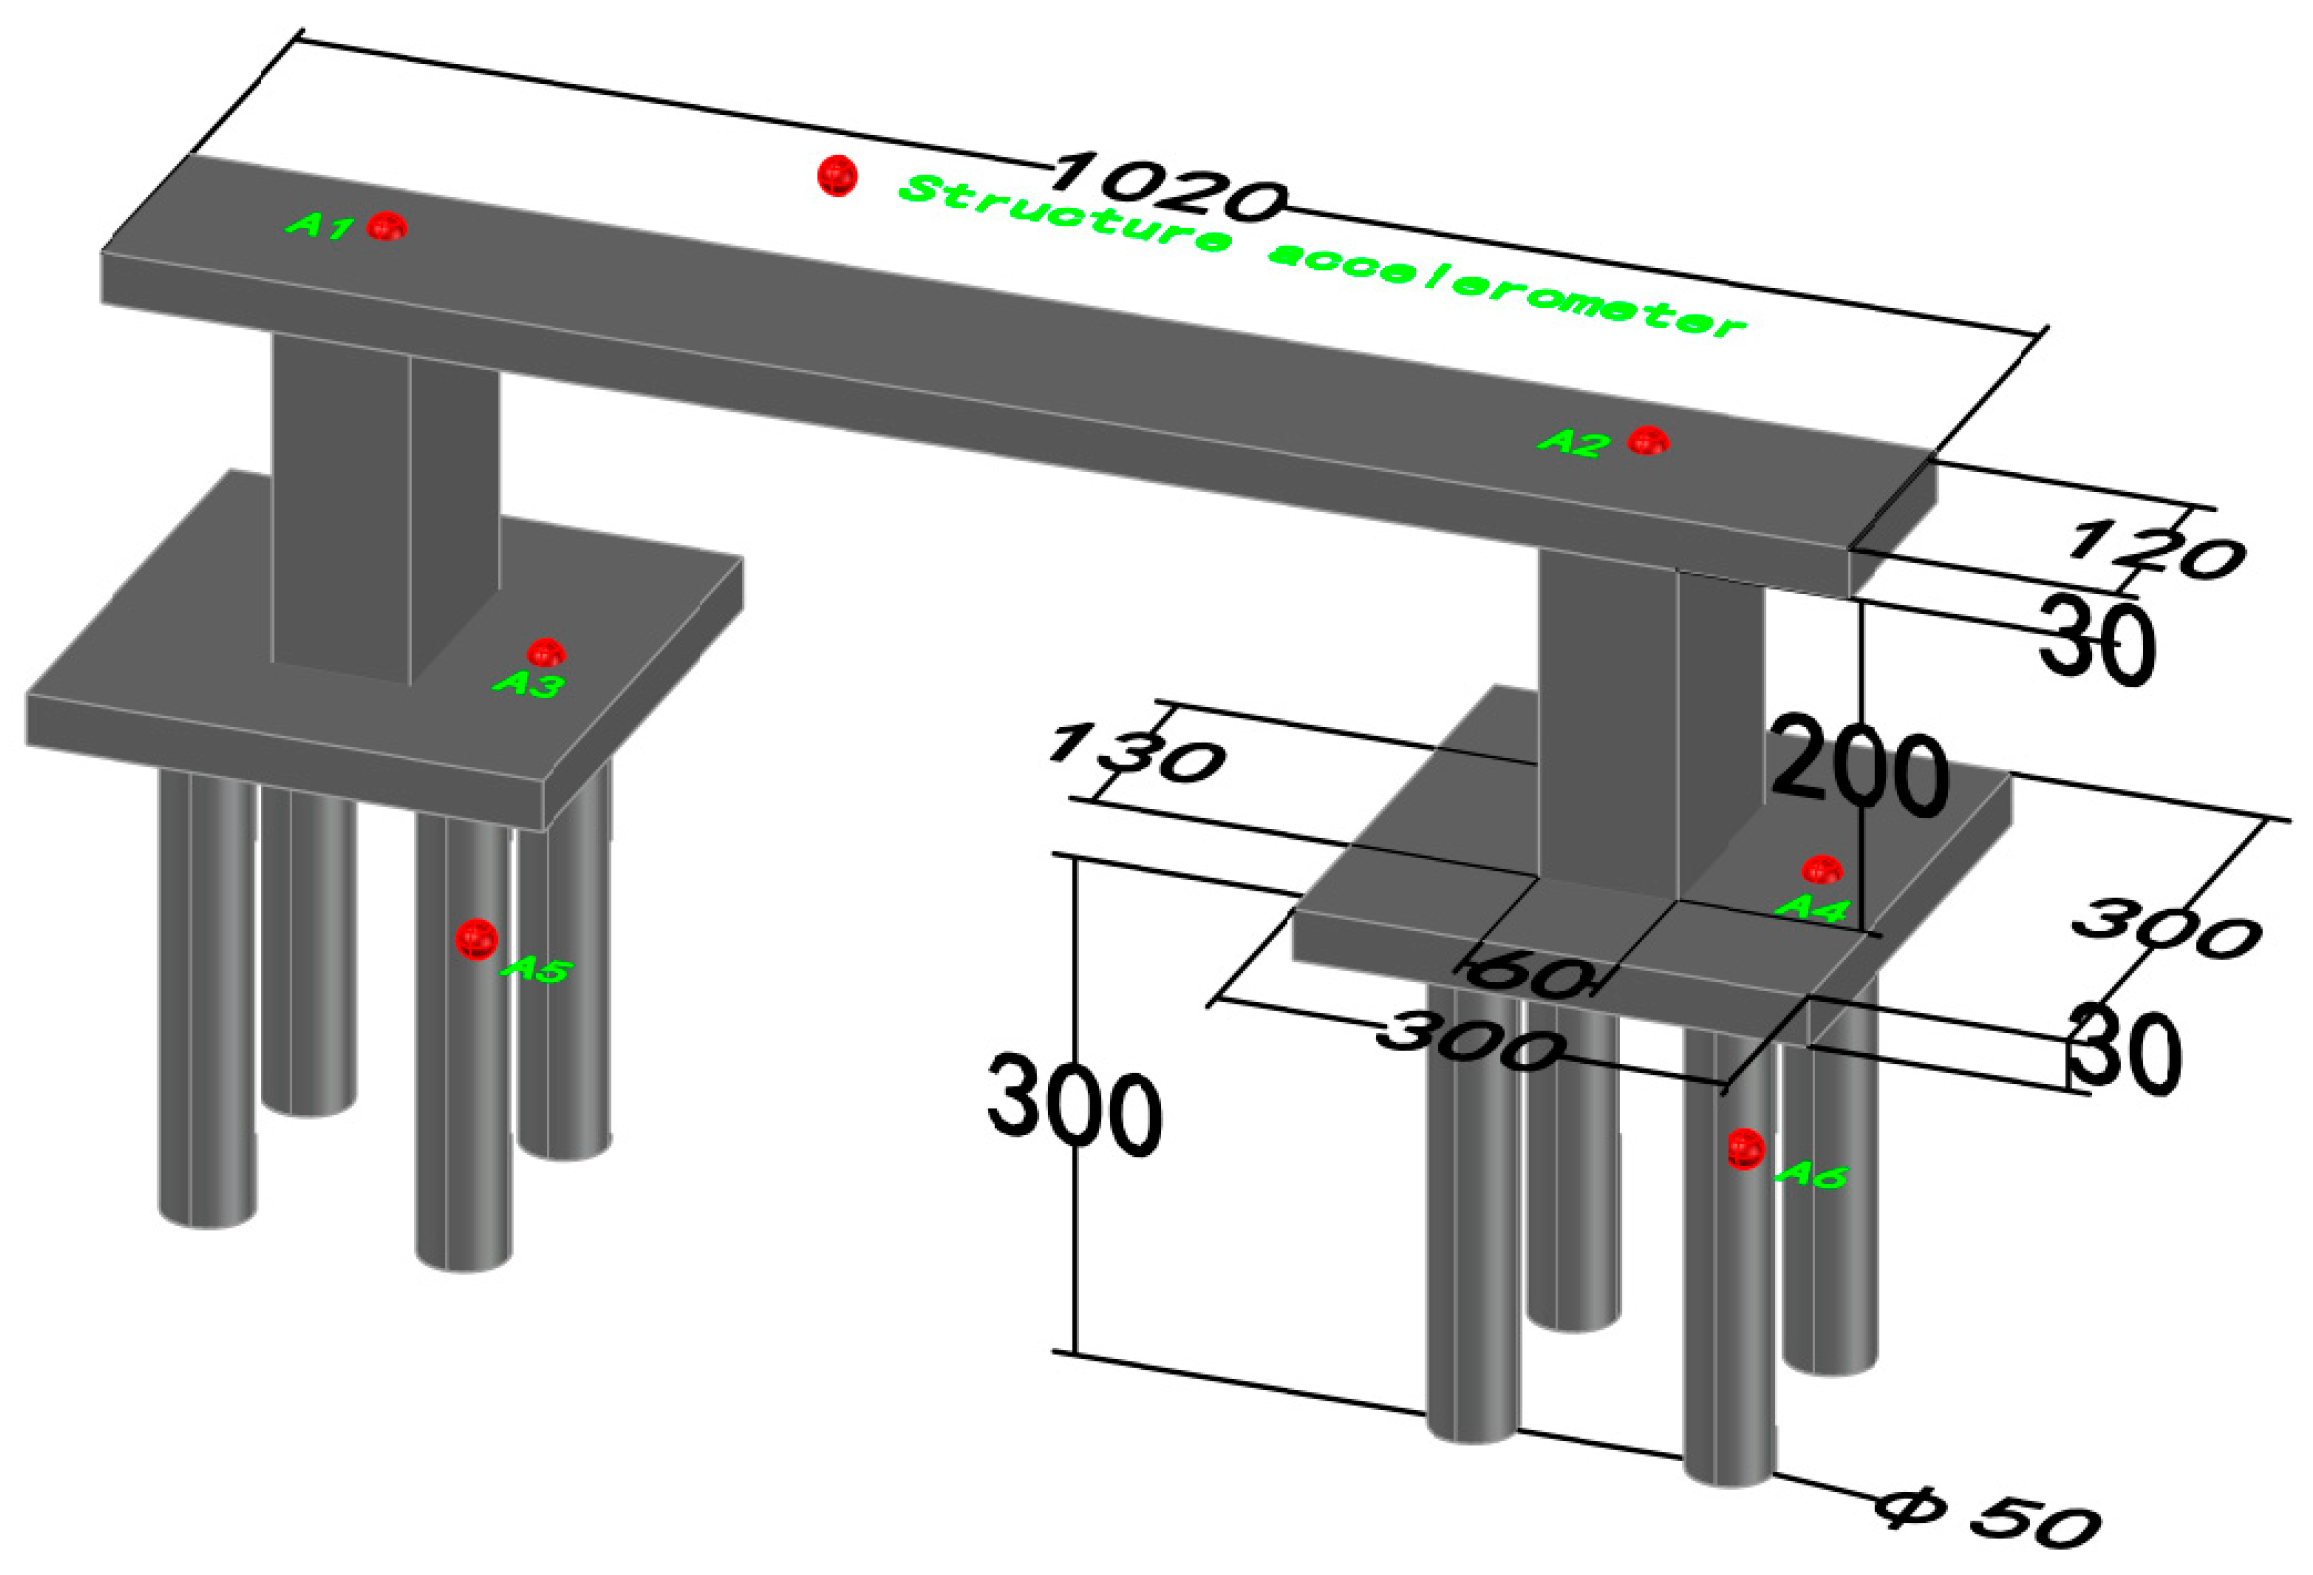
2.5. Monitoring Point Layout

During the test, the top bar displacement meter observed surface displacement and deformation, the soil pressure meter tracked changes in soil pressure within the sandy soil cover, and the accelerometer focused on monitoring the acceleration response of both the soil cover and the bridge structure. Pre-test results defined the scope and direction of the internal soil rupture zone as follows: consider the fault rupture point (point 0 at the junction of the upper and lower discs) as the center and extend to the soil layer with a staggered inclination, forming a “V” shaped area. Accordingly, the earth pressure gauge and accelerometer in the soil are positioned on both sides of the “V”-shaped area along the covering soil layer at distances of 300 mm, 550 mm, and 900 mm. Simultaneously, the top bar displacement gauge is situated 300 mm apart on the top surface of the soil layer. The bottom plate of the upper and lower discs, simulating the bedrock and the sandy soil overlay layer surface, is also equipped with accelerometers positioned 300 mm above the bottom plate covering the soil layer. The soil pressure gauge was positioned 300 mm above the soil cover of the bottom plate, and the test points were depicted in Figure 5. Accelerometers were strategically placed on both sides of the pile body, bearing platform, and bridge deck of the bridge structure, as illustrated in Figure 6. In Test ③, the rightmost side of the bridge bearing platform was 700 mm away from the soil box plate on the east side, and in Test ④, the distance to the east side of the soil box plate was 1100 mm.

3. Analysis of Test Results

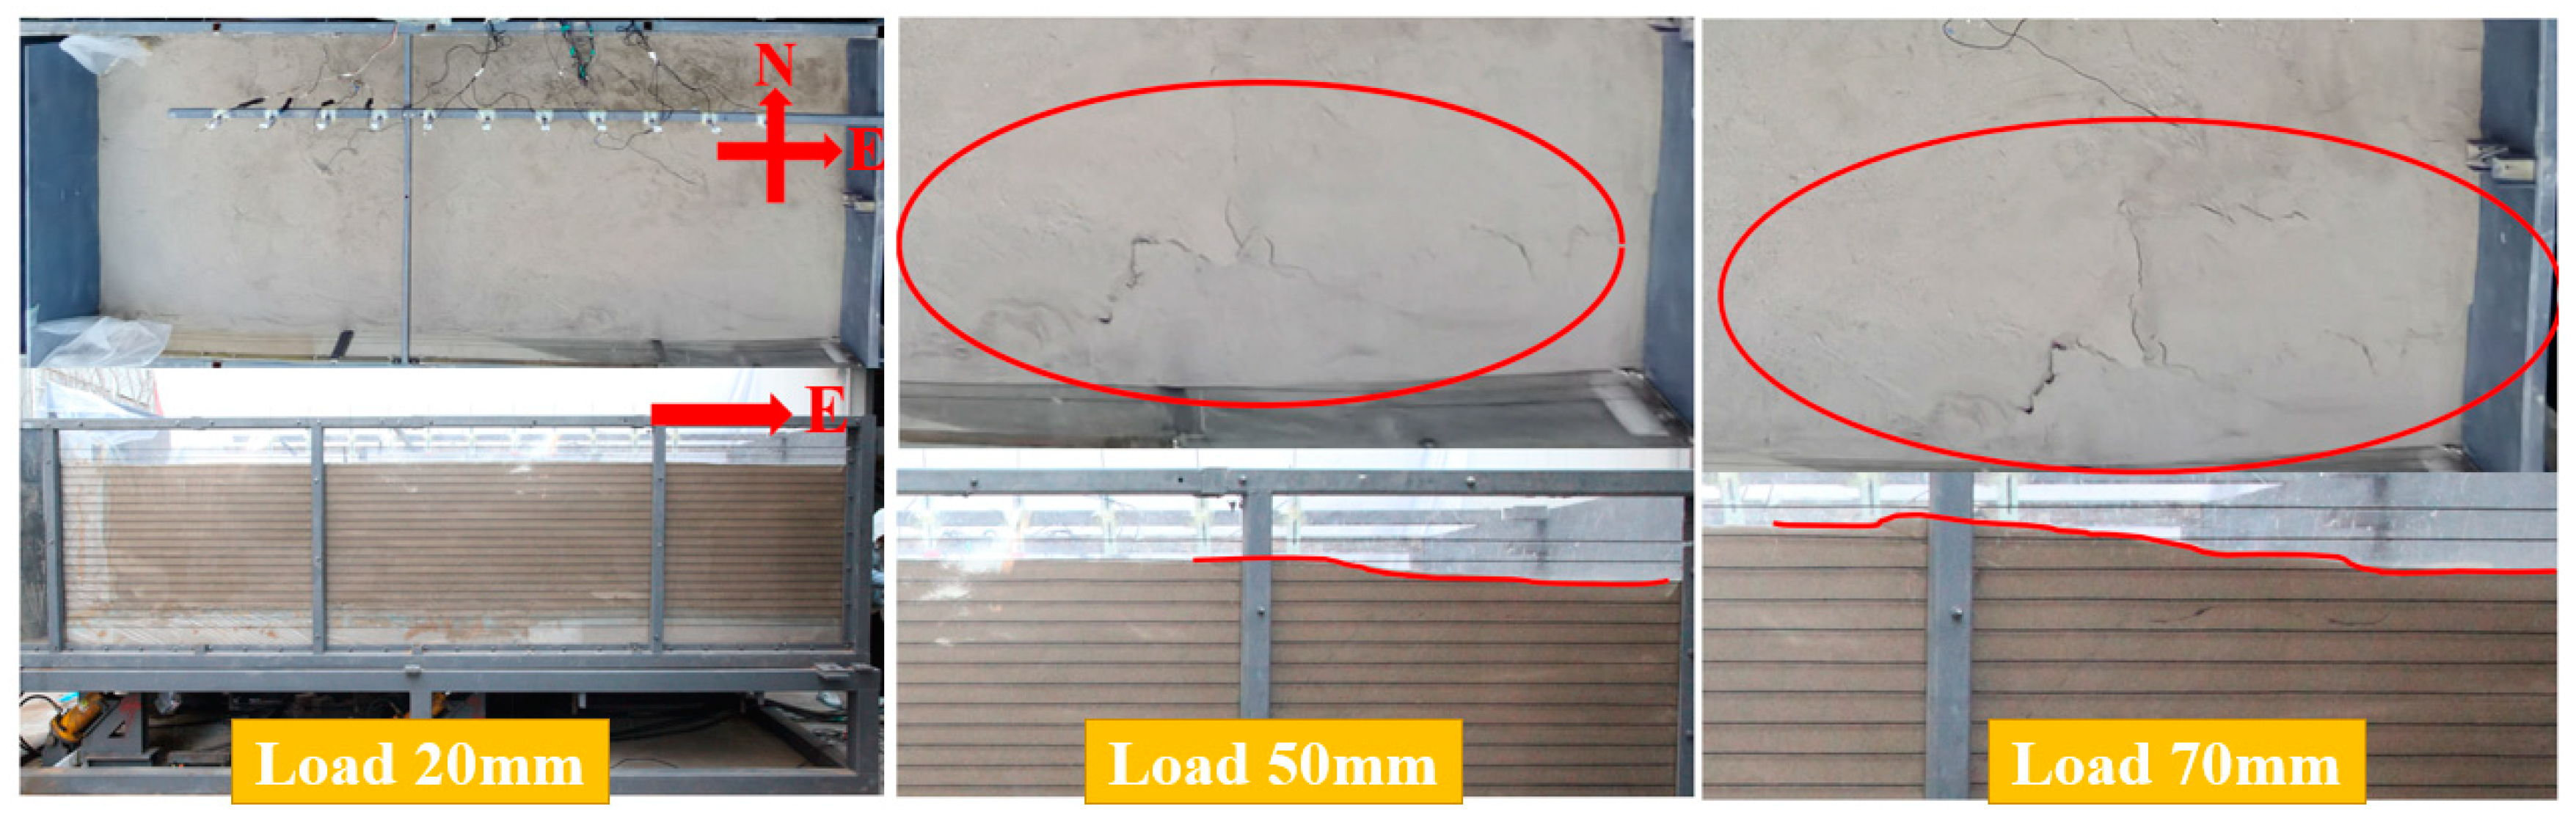
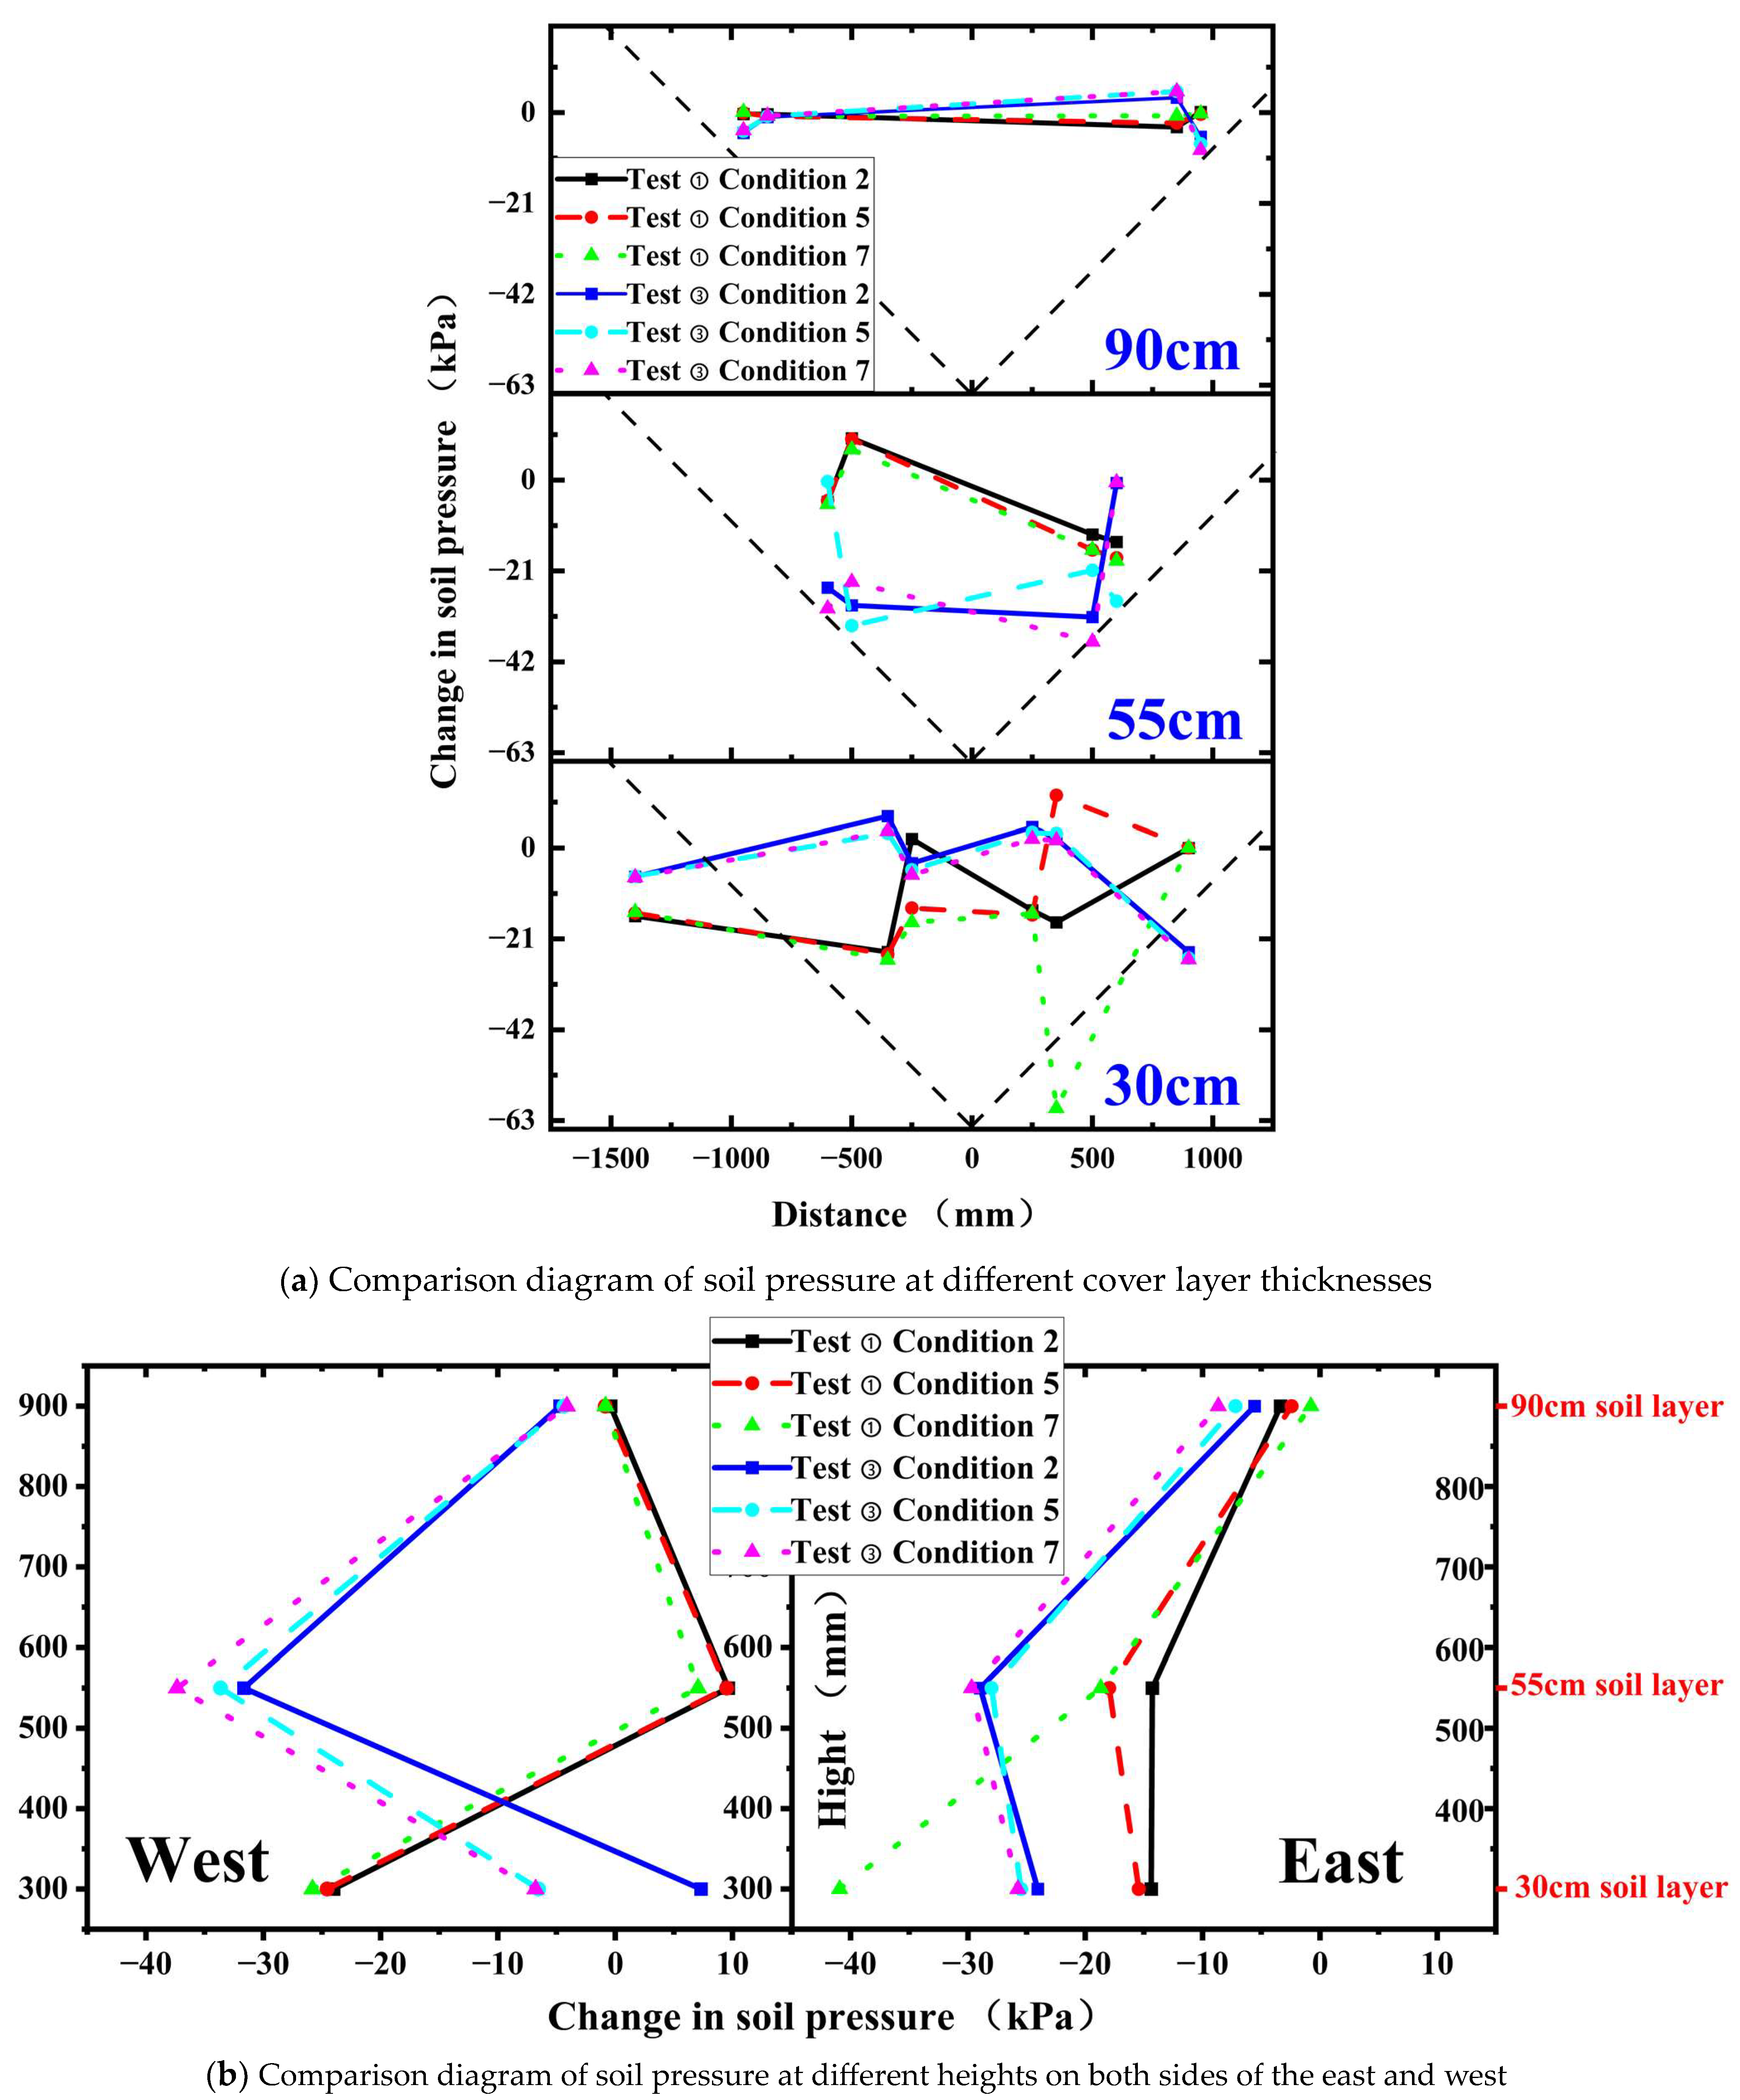
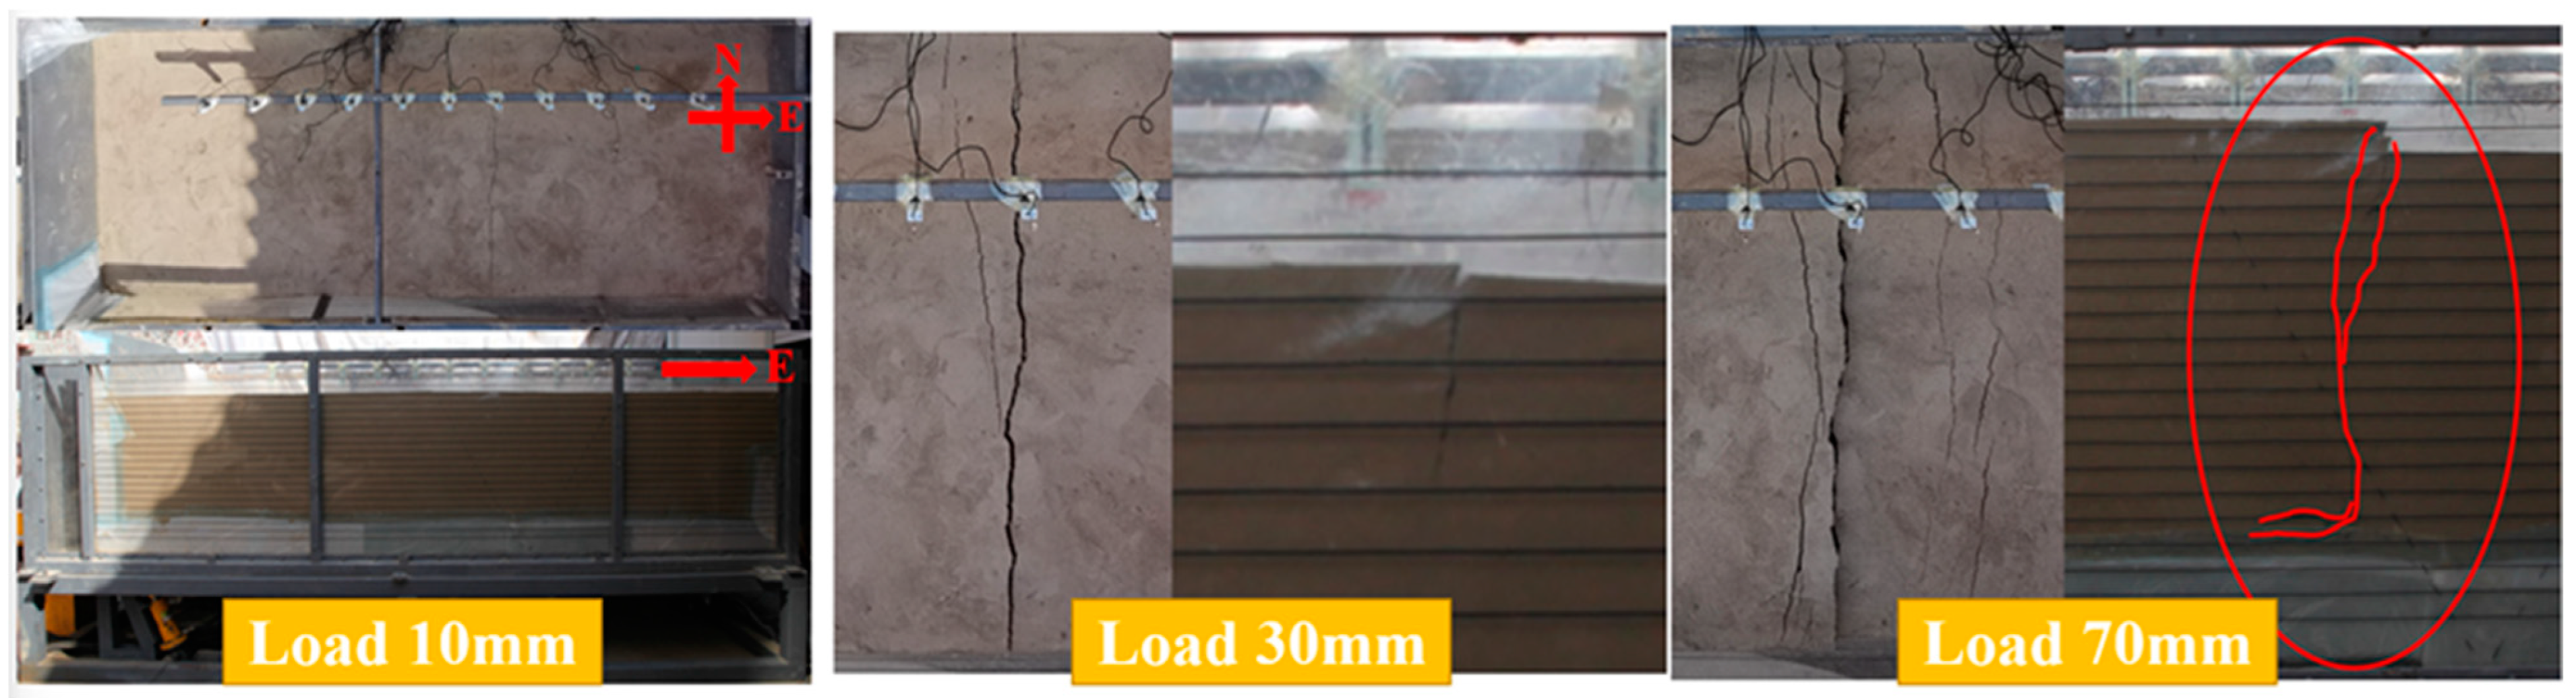
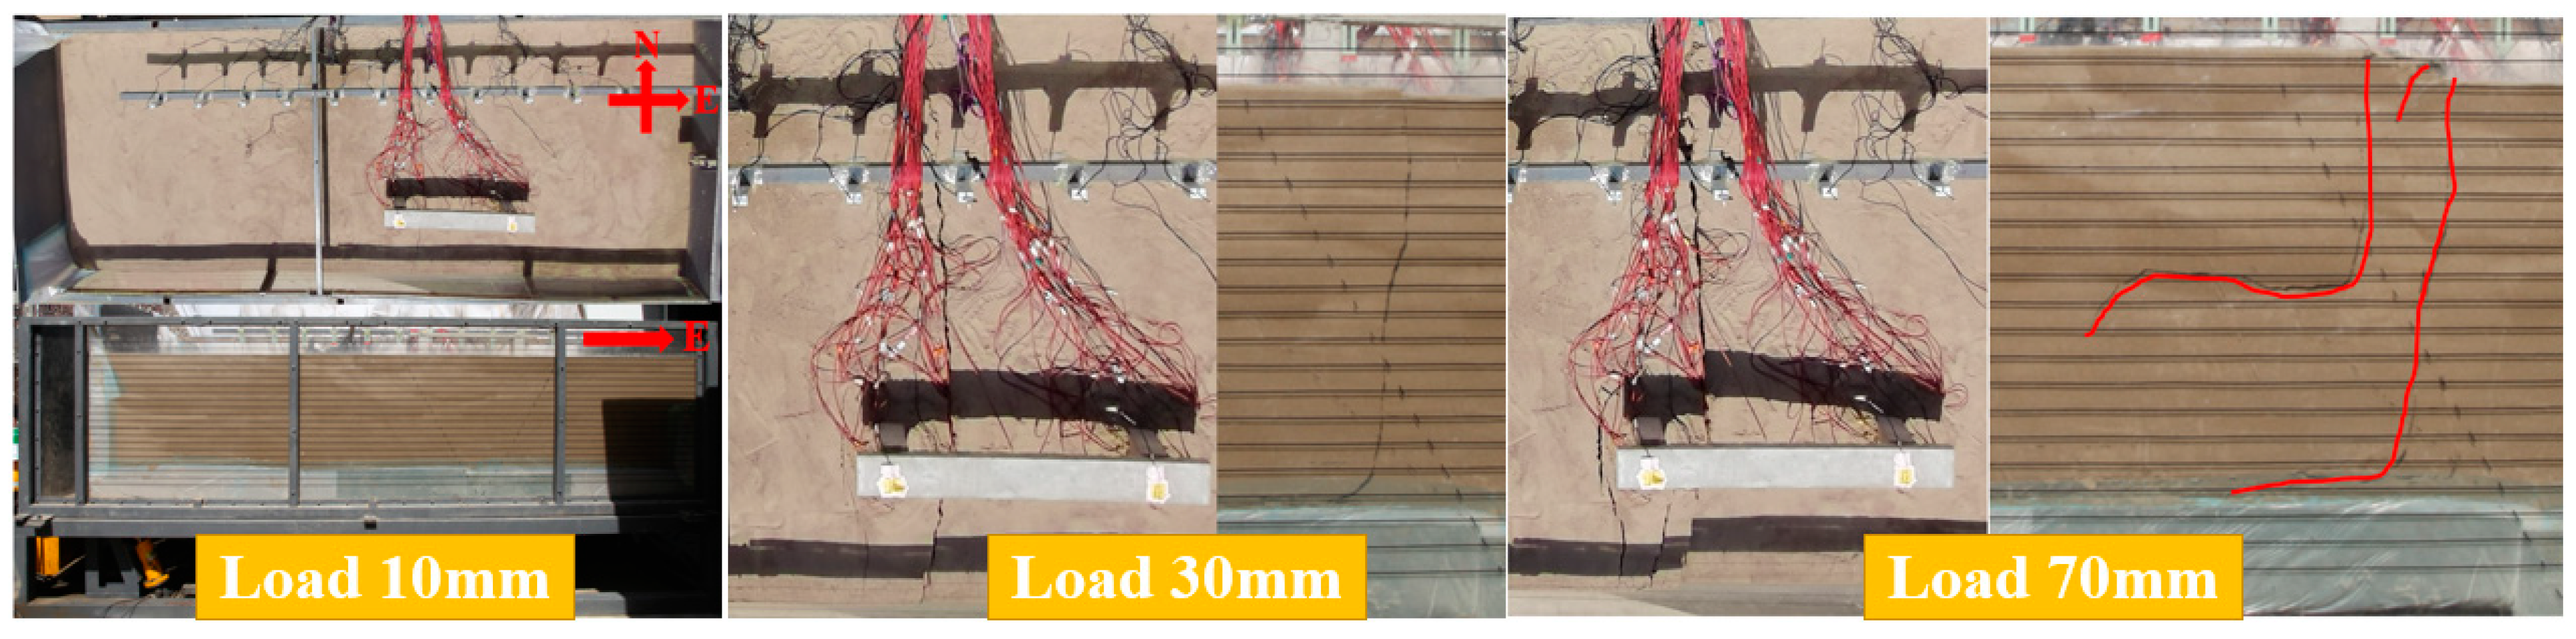
3.1. Comparison of Bridge Sites with Reverse Fault 45° Inclination Angle Sand soil Cover Layer

During the test, as bedrock dislocation increases, the overburdened soil in the box undergoes three stages: microfracture damage, damage expansion, and final penetration rupture forming an extrusion-type shear rupture zone within the reverse fault’s soil body. Representative loading conditions for Tests ➀ and ➂ are shown in Figure 7 and Figure 8. In the microcrack damage stage, no observable phenomena occur in both tests. During damage expansion, a raised surface rupture zone appears on the east side. The presence of the bridge shifts the rupture zone eastward, reducing its length and width. After the final penetration rupture, the surface damage reaches its maximum, evident by a rupture zone breaking through the bridge and on the north side. As depicted in Figure 9, deformation curves measured by the displacement meter align with field test observations. Both tests exhibit vertical ground deformation at −250 mm, with localized bulging around 900 mm. The inhomogeneous deformation range at the free site is 1.5 times wider than the bridge site, but the latter experiences three times greater settlement difference and tilt. In Figure 10, small cracks appear at joints between the eastern abutment and the bridge deck slab near the main rupture zone, with tilted piles. In Figure 11, increasing overburden soil depth results in larger changes in earth pressure. The free field exhibits noticeable earth pressure changes at the bottom, while the bridge site’s influence extends wider, especially below the bridge abutment depth. Figure 12 shows more apparent soil acceleration on the bridge site, contrasting with the free site, where acceleration is inconspicuous near “V” rupture signs. The bridge amplifies soil acceleration, especially on the top surface, which is four times greater than that in the middle and bottom layers.

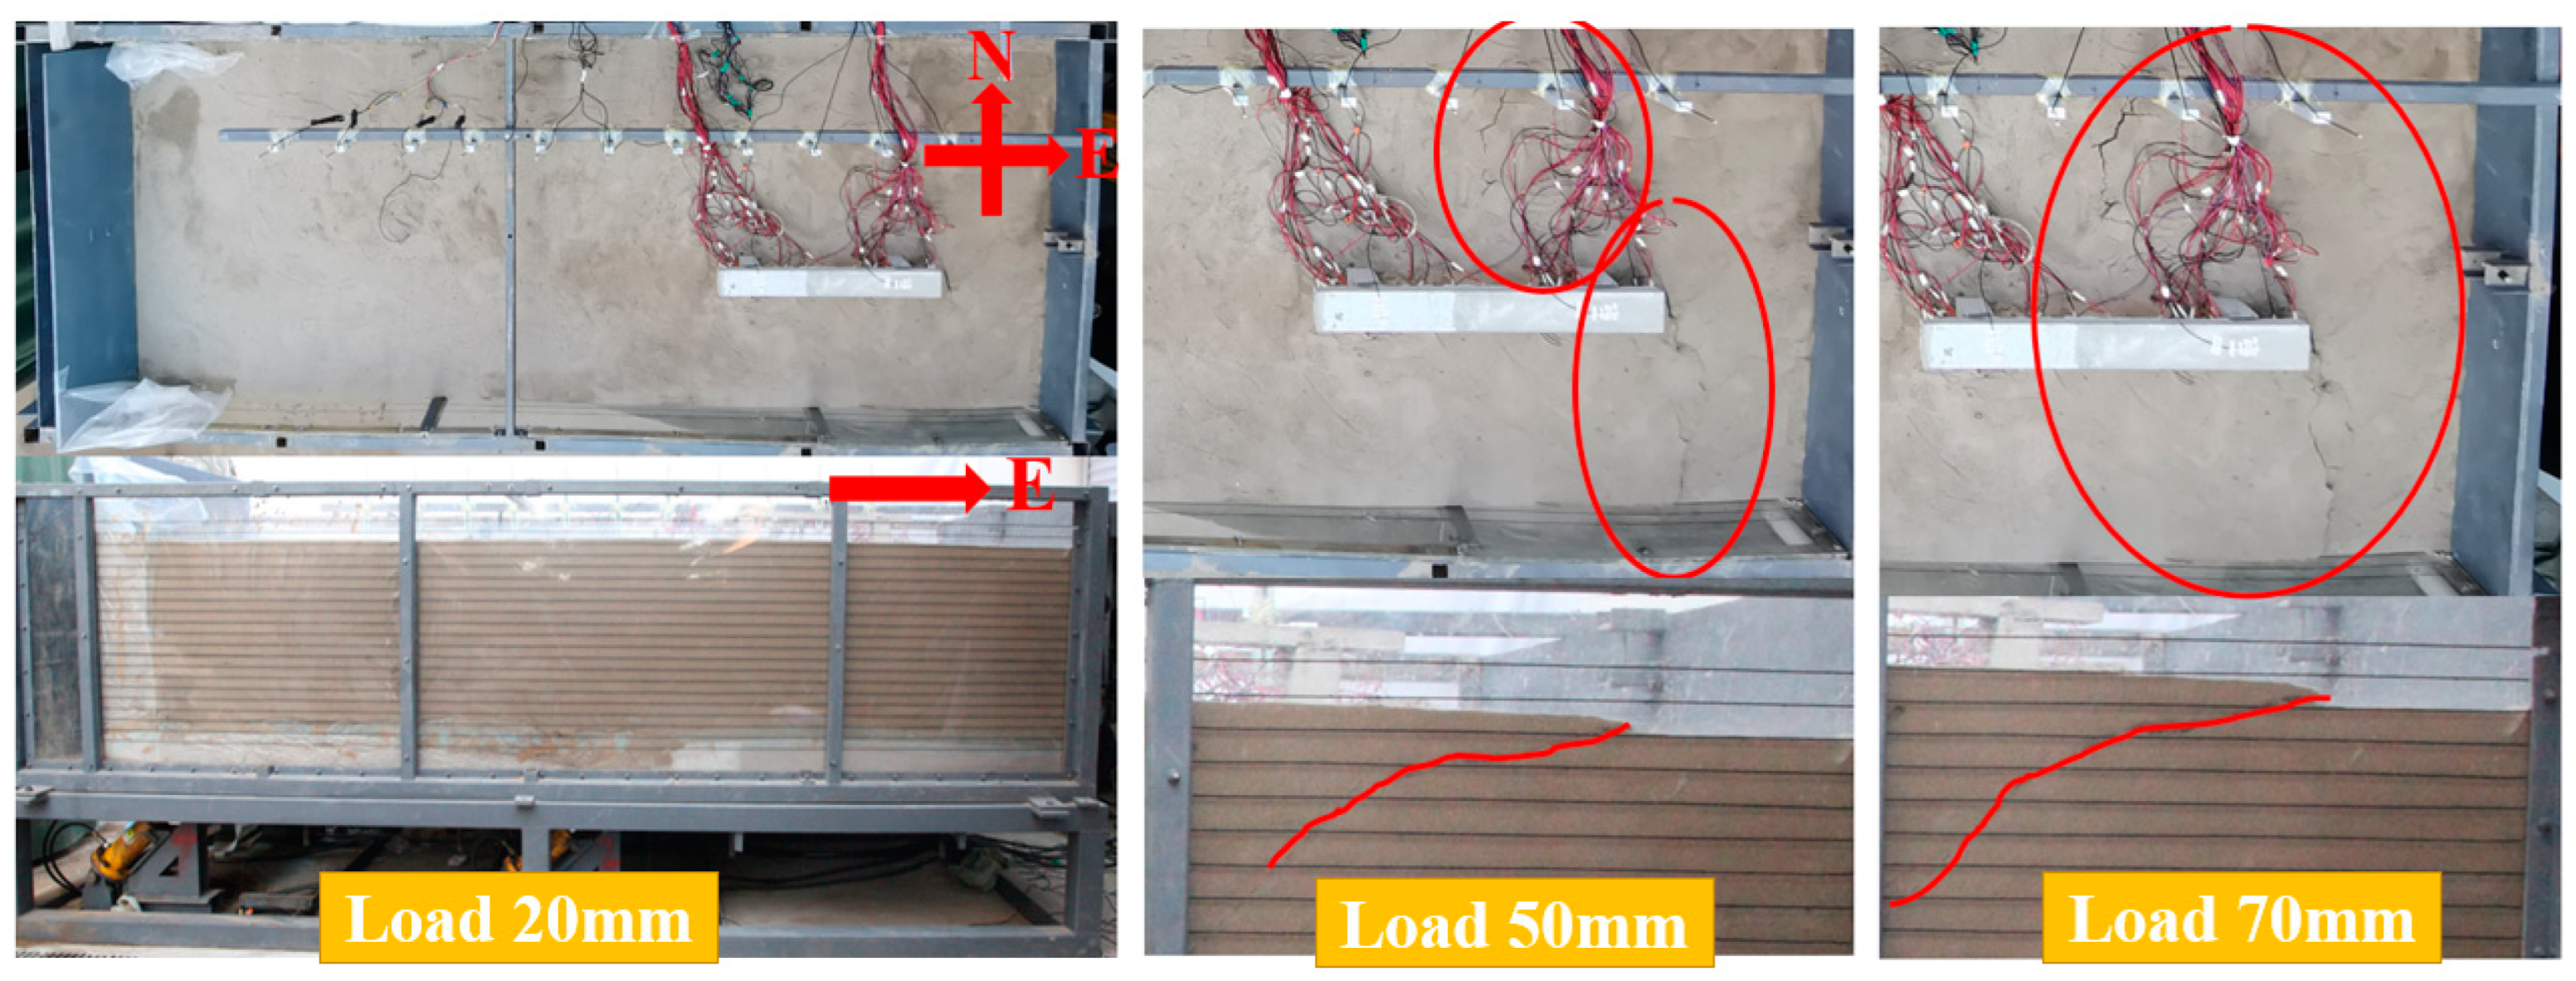
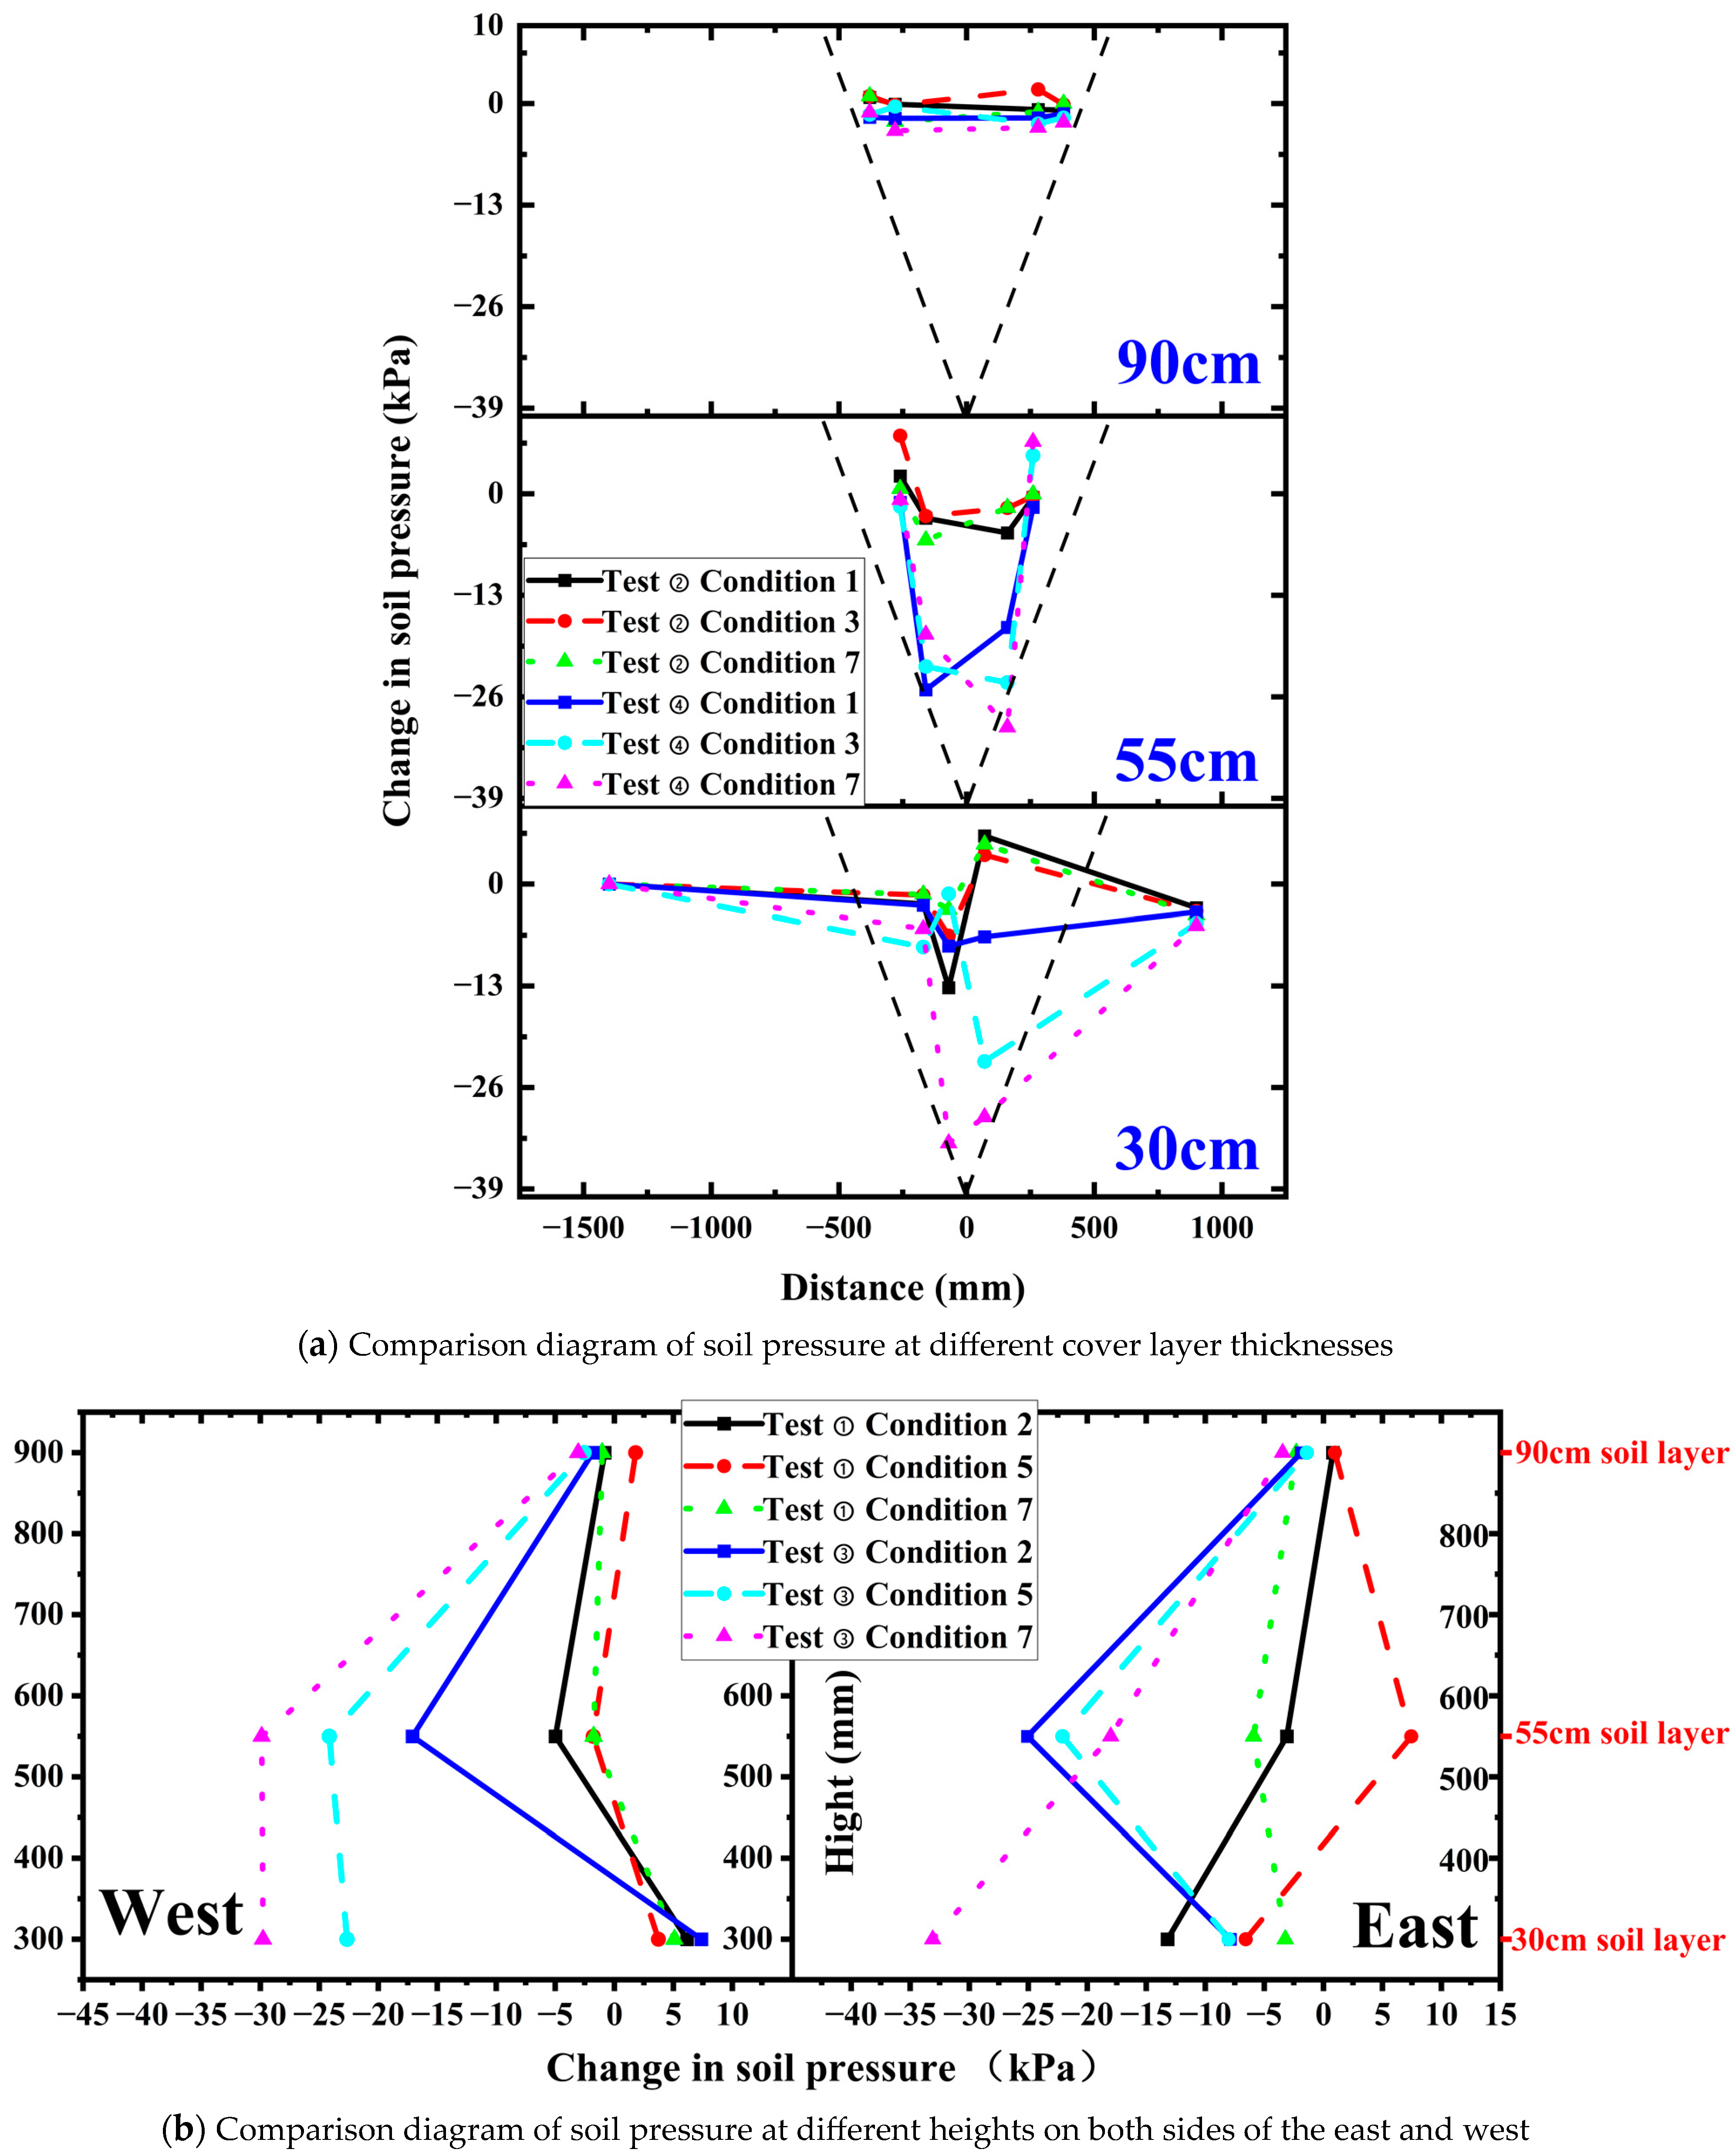
3.2. Comparison of Bridge Sites with 70° Dip Angle Sand Soil Cover Layer on Normal Fault

During the test, as bedrock dislocation increases, the overburdened soil layer in the box undergoes three stages: microcrack damage, damage extension, and final penetration fracture. A tensile shear rupture zone forms within the positive fault layer’s soil body. The representative loading conditions for Tests (➁ and ➃) are depicted in Figure 13 and Figure 14. In the microcrack damage stage, a less obvious surface crack appears at the same location in both tests, with a rupture line extending about 15 cm from the top down in the front view of the soil body. In the damage extension stage, the surface rupture band widens in both tests, generating new rupture bands. A rupture line running through the overburdened soil body becomes visible in the front view of the bridge site. After the final penetration rupture, surface rupture damage is maximized in both tests. Figure 15 illustrates that, with increasing bedrock dislocation, uneven deformation is prominent at −600 mm~600 mm. Uneven settlement is more severe in the free field, while the presence of the bridge mitigates surface uneven deformation to some extent. Uneven deformation of the deck slabs is evident in Figure 16, showing bending deformation. The connection between the bottom of the deck plate and the bridge abutment exhibits noticeable damage. Figure 17 indicates that earth pressure changes are minimal in the free field but significant in the bridge site, particularly in the middle and lower depths of the overburdened soil body, resulting in more serious damage. As seen in Figure 18, the acceleration of the top surface of the soil layer on the west side of the bridge site significantly increases relative to the interior soil body and bridge pile body. The amplification effect is pronounced, with the greatest change in acceleration observed in the bridge deck plate. On the east side, the acceleration of the pile body and bearing platform significantly increases relative to the soil depth, with a negligible change in bridge deck plate acceleration. The upper disk’s acceleration on the east side is amplified nearly four times compared to the lower disk on the west side, showcasing the clear effect of the upper disk.

4. Mechanism of Foundation Failure in Cross Fault Bridge Sites

Combining global instances of earthquake-induced bridge damage across faults and international seismic codes for bridges, the primary cause of bridge structure impairment and potential collapse on overburdened soil lies in significant deformation damage to both the soil and foundation. Addressing the challenge of rupturing the overburdened soil body during a severe earthquake requires expensive engineering interventions, such as digging deep trenches. However, this method may not guarantee precision in locating the rupture or determining the overall affected area [34,35,36]. Hence, understanding the rupture traces and widths within the overburdened soil body’s interior profile is crucial. This information directly influences factors such as the required avoidance distance and rupture-resistant measures, forming an integral part of the analysis of site foundation damage mechanisms.
Consequently, this paper conducts a comparative analysis of the damage characteristics observed in the foundation soil and bridge structure at both the free site and the bridge site under low-dip reverse fault and high-dip normal fault conditions. This analysis is based on four tests conducted on sandy soil cover under bedrock dislocation. The objective is to investigate and analyze the damage mechanism of the bridge site foundation across the fault:
(1)
When bedrock dislocates in a low-dip reverse fault, an extrusion-type shear rupture zone forms within the soil body. This zone extends from the dislocation point toward the dip angle direction, causing raised surface rupture zones. The bridge site’s rupture zones pass through the bridge pile foundations along the fault’s dip direction, offsetting relative to the free site. Due to the substantial stiffness of the bridge structure, soil and bridge interact, causing structural vibration energy to radiate into the soil layer, inducing a damping effect. This interaction results in larger soil pressure around the structure during rupture, influencing a broader range at the bridge site. It affects the middle of the soil layer from depth, highlighting a more noticeable soil amplification effect.
(2)
In the context of high-dip normal fault bedrock dislocation, a tensile shear rupture zone forms within the soil body, centered on the bedrock’s dislocation point. Cracks appear on the ground surface even with minimal bedrock dislocation, and increased dislocation leads to the derivation of multiple surface rupture zones. Simultaneously, the bridge site’s rupture zone passes through the bridge pile foundations along the fault’s dip direction, offsetting relative to the free site. Due to soil interaction with the pile and bearing platform of the bridge structure, soil pressure widens in scope and depth. Soil pressure changes in the middle and lower parts of the soil body become obvious, affecting deeper surface rupture cracks in the overburdened soil layer. Acceleration of the soil layer in the upper disk is about four times greater than in the lower disk, with a more pronounced effect on the upper disk.
(3)
In sandy soil cover sites, under low-dip reverse fault dislocation, the foundation damage area is lighter than in high-dip positive fault scenarios, both on the surface and within the soil body. The pile foundation in the main rupture zone’s concentrated area on the surface experiences greater stress from surface rupture traces, resulting in severe damage and deformation of the pile foundation, the bottom of the bridge deck slab, and the abutment connection.
In Table 3, for the model test with a bedrock dislocation of 70 mm, signifying complete overburden soil body rupture, the actual engineering site’s surface rupture width and length parameters are calculated based on observed test phenomena and the similarity ratio (Table 1). Simultaneously, considering internal rupture traces’ depth, soil width, uneven ground surface deformation, and soil pressure changes, a comprehensive avoidance distance is determined. Observations from the table reveal:
(4)
In the main rupture zone at the surface, the bridge site exhibits a width approximately half that of its corresponding free-field for both low-dip reverse fault and high-dip normal fault dislocations. Regarding rupture traces within the site soils (profile), the width of these traces at the bridge site is smaller than the free-field variant in the case of low-dip reverse fault dislocations. Conversely, under high-dip normal fault conditions, the width of the bridge site’s soil rupture traces is about 4.8 times larger than the free-field variant, reaching 72 m.
(5)
Concerning the avoidance distance, the bridge site has a smaller avoidance value compared to the free field for both low-dip reverse fault and high-dip normal fault dislocations. Regarding maximum surface deformation, the value is slightly larger for the bridge site under low-dip reverse fault dislocation and smaller for the bridge site under high-dip normal fault dislocation, compared to the free field.
(6)
The avoidance distance of the bridge site across the fault can be appropriately reduced based on free-field conditions. When the bridge site cannot avoid the surface rupture zone resulting from seismic rupture, a simply supported girder bridge can be selected within the avoidance distance, considering the characteristics of the bridge structure itself. Simultaneously, the site and bridge components can be strengthened to accommodate different dislocations. Alternatively, one may contemplate incorporating near-fault ground vibration records for the seismic analysis and design of bridges spanning faults [5]. Adhering to the “Guidelines for Seismic Design of Highway Bridges”, it is recommended to ensure a foundation cover layer thickness of at least 60 m. For bridges falling below category A, opting for structures with smaller spans facilitates easier repairs. In cases where avoiding the development of seismic rupture on the earth’s surface is not feasible, consider aligning all piers within the fault on the same disc, preferably the lower disc, of the foundation [15], and so forth.

5. Conclusions

Through the self-developed “bridge foundation-foundation-superstructure damage” physical modeling large-scale fault bedrock dislocation simulation test device, we conducted four tests on bedrock dislocation in sandy soil cover sites, yielding the following conclusions:
(1)
When a low-dip reverse fault is dislocated, an extruded shear rupture zone forms within the soil body. The presence of the bridge causes the surface rupture zone to shift to the passive disk, reducing the length and width of the rupture zone. With increasing bedrock dislocation, the range of surface deformation in the free site becomes wider, approximately 1.5 times that of the bridge site. However, the surface deformation and inclination within the bridge site are greater, about three times that in the free site. Earth pressure changes are evident only at the bottom of the soil cover in the free site, while in the bridge site, the influence of earth pressure extends more widely. The acceleration change of the soil body on the bridge site is more pronounced, especially on the top surface, where the acceleration is about four times larger than that in the center and at the bottom.
(2)
Under the high dip angle positive fault sandy soil cover site, a tensile shear rupture zone forms within the soil body. Due to significant changes in soil pressure at the bridge site in the middle and lower depths of the soil cover, the rupture zone at the bridge site deviates through the bridge pile foundation along the dip angle direction of the fault relative to the free site. The bridge deck plate exhibits bending deformation, and the connection with the bridge abutment shows significant damage. The acceleration of the soil layer on the upper disk is about four times more than that of the lower disk, with a more noticeable effect on the upper disk.
(3)
Based on the observed test phenomena and similarity ratios reflecting actual bridge project sites, we propose that, within the surface rupture zone and avoidance distance range, a simply supported beam can be used for “fuse” design and connected with both sides of the bridge for structural “disconnection”. Design parameters such as surface rupture zone and maximum deformation of the bridge site can be inferred from its free site. For example, irrespective of whether it is a low-dip reverse fault or a high-dip positive fault dislocation, the width of the bridge site is smaller than its corresponding free site, approximately half of the free site.
(4)
During the construction of bridges across or near faults on sand-covered sites, although the presence of bridges reduces the avoidance distance and maximum surface deformation to a certain extent, it is essential to implement reinforcement measures for the soils at the bridge-bearing platforms and piles within the main rupture zones at the surface. Simultaneously, specialized structural treatments should be applied to the pile-pedestal and bridge deck-pier joints to enhance fracture resistance in the presence of fault dislocations.
(5)
As the construction of bridges across faults and existing bridges facing the risk of surface rupture from strong earthquakes rises, the shift from “avoidance” to “rupture resistance” is increasingly urgent. Challenges include insufficient investigation of seismic damage data for bridges in strong earthquake rupture zones and uncertainty regarding the rupture mechanism of overburdened rock and soil layers under bridges. Therefore, further development of a large-scale modeling test loading device for bridges across faults is necessary. Conducting numerous modeling tests on rupture mechanisms in the immediate vicinity of bridges in rupture zones under various experimental conditions is crucial. This approach facilitates proposing reasonable rupture-resistant reinforcement measures, providing a vital basis and data for studying rupture resistance at bridge sites.

Author Contributions

Conceptualization, investigation, methodology, J.M. and J.Z.; data processing, H.Z. and J.T.; original draft, J.M.; writing and editing the draft, J.M. and J.Z. All authors have read and agreed to the published version of the manuscript.

Funding

This research was funded by the Seismic Technology Spark Project (No. XH22021A) and the National Science Foundation of China (No. 51608118).

Institutional Review Board Statement

Not applicable.

Informed Consent Statement

Not applicable.

Data Availability Statement

The data presented in this study are available on request from the corresponding author. The data are not publicly available due to privacy.

Acknowledgments

The authors expressed their appreciation to the editors and reviewers for taking time out of their busy schedules to review this paper and put forward valuable comments.

Conflicts of Interest

The authors declare no conflicts of interest.

References

  1. Zhang, J.; Bo, J.; Yuan, Y.; Huang, J. Review of research on active fault and its setback. J. Nat. Disasters 2012, 21, 9–18. [Google Scholar]
  2. Anastasopoulos, I.; Gerolymos, N.; Bransby, G.G.F. Simplified approach for design of raft foundations against fault rupture. Part II: Soil-structure interaction. Earthq. Eng. Eng. Vib. 2008, 7, 165–179. [Google Scholar]
  3. Ghafari, M.; Nahazanan, H.; Yusoff, Z.; Nik Daud, N.N. A Novel Experimental Study on the Effects of Soil and Faults’ Properties on Tunnels Induced by Normal and Reverse Faults. Appl. Sci. 2020, 10, 3969. [Google Scholar] [CrossRef]
  4. Irikura, K. Strong Motion Prediction for Inland Crustal Earthquakes Based on Active Fault Survey. Quat. Int. 2012, 279–280, 216. [Google Scholar]
  5. Hui, Y.; Tai, Y.; Wang, K.; Zhang, S. Discussion about earthquake resistance of the bridges crossing the active fault. China Earthq. Eng. J. 2017, 39, 7. [Google Scholar]
  6. O’Rourke, T.D.; Palmer, M.C. The Northridge, California earthquake of January 17, 1994: Perfomance of gas transmission pipelines. Nceer Bull. 1994, 79, 94-0011. [Google Scholar]
  7. Kawashima, K. Damage of bridges resulting from fault rupture in the 1999 Kocaeli and Duzce, Turkey earthquakes and the 1999 Chi-Chi, Taiwan earthquake. Struct. Eng./Earthq. Eng. 2001, 1, 171–190. [Google Scholar]
  8. Becker, D.; Earthquake Engineering Research Institute. The 1999 Turkey Earthquakes: Bridge Performance and Remedial Actions; Earthquake Engineering Research Institute (EERI): Oakland, CA, USA, 2003. [Google Scholar]
  9. Chang, K. Seismic Performance of Highway Bridges. Earthq. Eng. Eng. Seismol. 2000, 2, 157–166. [Google Scholar]
  10. Fan, L.; Hui, Y.; Liu, J.; Zhou, T. Analysis of the Effect of Lateral Collision on the Seismic Response of Bridges under Fault Misalignment. Appl. Sci 2023, 13, 10662. [Google Scholar]
  11. Kawashima, K.; Unjoh, S.; Hoshikuma, J.I.; Kosa, K. Damage Characteristic of Bridges due to 2010 Chile Earthquake. J. Earthq. Eng. 2010, 66, 1036–1068. [Google Scholar]
  12. Kam, W.Y.; Pampanin, S. The seismic performance of RC buildings in the 22 February 2011 Christchurch earthquake. Struct. Concr. 2011, 12, 223–233. [Google Scholar]
  13. CSA International. Canadian Highway Bridge Design Code. In Design of Highway Bridges; CSA Group: Toronto, ON, Canada, 2000. [Google Scholar]
  14. Yan, W.; Wang, K. Handbook for Seismic Reinforcement and Renovation of Highway Structures; China Communication Press: Beijing, China, 2008. [Google Scholar]
  15. Unit Chongqing Transportation Research and Design Institute. Guidelines for Seismic Design of Highway Bridges; Unit Chongqing Transportation Research and Design Institute: Chongqing, China, 2016. [Google Scholar]
  16. Ministry of Railways of the People’s Republic of China. Code for Seismic Design of Railway Engineering; Ministry of Railways of the People’s Republic of China: Beijing, China, 1989. [Google Scholar]
  17. JTG/T 2231-01-2020; Specifications for Seismic Design of Highway Brides. Ministry of Transport of the People’s Republic of China: Beijing, China, 2020.
  18. Jia, H.; Yang, J.; Zheng, S.; Zhao, C.; Du, X. A Review on Aseismic Bridges Crossing Fault Rupture Regions. J. Southwest Jiaotong Univ. 2021, 56, 1075–1093. [Google Scholar]
  19. Hui, Y.; Tai, Y.; Wang, K.; Zhang, S. Enlightenment and suggestions for seismic fortification of bridges crossing fault-rupture zones. China Earthq. Eng. J. 2017, 39, 7. [Google Scholar]
  20. Wang, Y.; Li, B.; Ma, J.; Deng, J. Girder Falling Mechanism of Gaoyuan Bridge Based on the Geomechanical Model Testing. Eng. Sci. Ed. 2015, 47, 89–96. [Google Scholar]
  21. Ling, X.; Xu, P.; Yu, E. Numerical simulation of shaking table test for seismic pilesoil-bridge structure interaction on liquefied ground. J. Earthq. Eng. Eng. Vib. 2008, 28, 172–177. [Google Scholar]
  22. Hokmabadi, A.S.; Fatahi, B.; Samali, B. Assessment of soil–pile–structure interaction influencing seismic response of mid-rise buildings sitting on floating pile foundations. Comput. Geotech. 2014, 55, 172–186. [Google Scholar] [CrossRef]
  23. Fan, X.; Bing, Z. Seismic Action Assessment Indicator of Near-fault Ground Motion for Long-span CFST Arch Bridge. J. Chongqing Jiaotong Univ. (Nat. Sci.) 2011, 30, 190–195. [Google Scholar]
  24. Li, P.; Chen, Y.; Lv, X. Shaking table testing of hard layered soil-pile-structure interaction system. Front. Archit. Civ. Eng. China 2007, 1, 346–352. [Google Scholar]
  25. Li, P.; Liu, S.; Lu, Z. Studies on Pounding Response Considering Structure-Soil-Structure Interaction under Seismic Loads. Sustainability 2017, 9, 2219. [Google Scholar] [CrossRef]
  26. Feng, Z.; Guan, Y.; Zhang, C. Dynamic Response and Avoidance Distance of Pile Foundation of Cross Fault Bridge in Strong Earthquake Area. J. Chongqing Jiaotong Univ. (Nat. Sci.) 2022, 41, 72–80. [Google Scholar]
  27. Yi, J.; Yang, H.; Li, J. Experimental and numerical study on isolated simply-supported bridges subjected to a fault rupture. Soil Dyn. Earthq. Eng. 2019, 127, 105811–105819. [Google Scholar] [CrossRef]
  28. Lin, Y.; Zong, Z.; Bi, K.; Hao, H.; Lin, J.; Chen, Y. Experimental and numerical studies of the seismic behavior of a steel-concrete composite rigid-frame bridge subjected to the surface rupture at a thrust fault. Eng. Struct. 2020, 205, 110101–110105. [Google Scholar] [CrossRef]
  29. Saiidi, M.S.; Vosooghi, A.; Choi, H. Shake Table Studies and Analysis of a Two-Span RC Bridge Model Subjected to a Fault Rupture. J. Bridge Eng. 2014, 19, 1–9. [Google Scholar] [CrossRef]
  30. Goelr, K.; Chopraa, K. Nonlinear Analysis of Ordinary Bridges Crossing Fault-Rupture Zones. J. Bridge Eng. 2009, 14, 216–224. [Google Scholar] [CrossRef]
  31. Zou, Z.; Zheng, S.; Ding, Z.; Jia, H. Seismic Response Analysis of Large-Span Truss Suspension Bridge Across Strike-slip. Railway Standrd Des. 2023, 68, 1–9. [Google Scholar]
  32. Wang, Z.; Wu, Z.; Zhang, J. Yantu Gongcheng Zhendongtai Shiyan Moxing Sheji Lilun Ji Jishu; Wuhan University Press: Wuhan, China, 2020. [Google Scholar]
  33. GB 55008-2021; General Code for Concrete Structures. Ministry of Housing and Urban-Rural Development of the People’s Republic of China: Beijing, China, 2021.
  34. Ran, Y.; Wang, H.; Li, Y. Key Techniques and several cases analysis in paleoseismic studies in mainland China(1): Trenching sites, layouts and paleoseismic indicators on active strike-slip faults. Seismol. Geol. 2012, 34, 197–210. [Google Scholar]
  35. Xu, D. Semiquantitative Evaluation of Paleoearthquake Identification from Trenches and Vertical Slio Rates on Normal Faults: A Case Study of the Northern Marginal Faults of Hetao Basin; National Institute of Natural Hazards: Beijing, China, 2023. [Google Scholar]
  36. Lei, Q.; Chai, Z.; Meng, G. Tectonic activity history based method for engineering safety distance to active fault. J. Eng. Geol. 2015, 23, 161–169. [Google Scholar]
Figure 1. Schematic diagram of the model device.
Applsci 14 00852 g001
Figure 2. Particle size distribution curve.
Applsci 14 00852 g002
Figure 3. Process diagram of soil compaction.
Applsci 14 00852 g003
Figure 4. Production of bridge models.
Applsci 14 00852 g004
Figure 5. Schematic diagram of layout profile of collection instruments (unit: mm).
Applsci 14 00852 g005
Figure 6. Layout diagram of bridge structure acquisition instruments (unit:mm).
Applsci 14 00852 g006
Figure 7. Details of Free Field Test ➀.
Applsci 14 00852 g007
Figure 8. Details of Bridge Site Test ➂.
Applsci 14 00852 g008
Figure 9. Comparison diagram of surface deformation in experiments ➀ and ➂.
Applsci 14 00852 g009
Figure 10. Front view of bridge model after Experiment ➂.
Applsci 14 00852 g010
Figure 11. Comparison of soil pressure in experiment ➀ and experiment ➂.
Applsci 14 00852 g011
Figure 12. Comparison chart of peak acceleration on both sides of the east and west with height variation in experiments ➀ and ➂.
Applsci 14 00852 g012
Figure 13. Details of Free Field Test ➁.
Applsci 14 00852 g013
Figure 14. Details of Bridge Site Test ➃.
Applsci 14 00852 g014
Figure 15. Comparison diagram of surface deformation in experiments ➁ and ➃.
Applsci 14 00852 g015
Figure 16. Front view of bridge model after Experiment ➃.
Applsci 14 00852 g016
Figure 17. Comparison of soil pressure in experiment ➁ and experiment ➃.
Applsci 14 00852 g017
Figure 18. Comparison chart of peak acceleration on both sides of the east and west with height variation in experiments ➁ and ➃.
Applsci 14 00852 g018
Table 1. Model design similarity constant.
Physical QuantitySoilBridge
Geometrical dimensionCL = 40CL = 40
DensityCρ = 1Cρ = 1.25
Acceleration of gravityCg = 1Cg = 1
Earth pressureCτ= CL·Cρ·Cg = 40
Rod displacementDL = 40
Bridge acceleration Ca = 1
Acceleration time Ct = 6.32
Table 2. Different model test parameters.
Sand Covered Layer SiteSand Covered Layer Bridge Site
Test number
Cover layer thickness1000 mm1000 mm1000 mm1000 mm
Fault typereverse faultnormal faultreverse faultnormal fault
Misalignment angle45°70°45°70°
Total bedrock loading capacity100 mm100 mm100 mm100 mm
Single working condition dislocation amount10 mm10 mm10 mm10 mm
Bridge structureNoNoYesYes
Table 3. Parameter table for actual site foundation cover layer soil breakthrough and rupture.
Bedrock Displacement ModeSite TypeBedrock Dislocation AmountThe Width of the Main Rupture Zone on the SurfaceWidth of Soil Profile Fractur TraceHeight Difference on Both Sides of the BridgeAvoidance DistanceMaximum Surface DeformationMaximum Inclination
Low dip
reverse fault
Free field2.8 m30 m50 m 70 m0.92 m2.1°
Bridge site2.8 m16 m36 m5.2 m48 m1.4 m6.6°
High dip
normal fault
Free field2.8 m36 m15 m 100 m3.24 m15.1°
Bridge site2.8 m20 m72 m9.2 m75 m2 m9.42°
Disclaimer/Publisher’s Note: The statements, opinions and data contained in all publications are solely those of the individual author(s) and contributor(s) and not of MDPI and/or the editor(s). MDPI and/or the editor(s) disclaim responsibility for any injury to people or property resulting from any ideas, methods, instructions or products referred to in the content.

