1. Introduction
Augmentation procedures are frequently used in the treatment of mandibular defects. There are many factors that affect the success of these procedures such as the type of graft (autogenous, allograft, xenograft), systemic diseases of the host (diabetes mellitus, osteoporosis, etc.), smoking, hormones, and vitamins that affect the bone metabolism (parathyroid hormone, vitamin K, sex hormones, etc.) [
1].
Vitamin D is a fat-soluble vitamin that is responsible for the regulation of calcium and phosphorus metabolism in tissues and is also defined as a hormone due to it being synthesized in the body, and it has an effect on areas other than where it was synthesized. Vitamins D2 and D3 are two precursor forms of vitamin D. Vitamin D2 is found in foods and is a 28-carbon molecule derived from ergosterol (pre-vitamin D2) while vitamin D3, a 27-carbon molecule derived from cholesterol, is essentially synthesized on the skin as a result of a complex chain reaction but can also be obtained through diet. 7-dehydrocholesterol (pro-vitamin D3), a natural compound of the skin, turns into pre-vitamin D3 (cholecalciferol) when exposed to UV-B rays. Following their obtainment through diet or reactions on the skin, both pre-vitamin D2 and pre-vitamin D3 undergo two successive hydroxylation reactions and are transformed first into 25-hydroxy vitamin D (calcifediol) (25[OH]D) in the liver and then into its biologically active form, 1.25-dihydroxyvitamin D (calcitriol) (1.25[OH]
2D), in the kidneys. The 1.25[OH]
2D ligand binds to vitamin D receptors (VDRs) with high affinity and later increases the intestinal absorption of both calcium and phosphor. Also, vitamin D actively participates in bone formation, resorption and mineralization, and protection of neuromuscular function. “25-hydroxy vitamin D (25[OH]D)”, the form of vitamin D found in serum, is used to measure vitamin D levels. The values of serum vitamin D (25OHD) between 0 and 30 ng/mL, between 40 and 80 ng/mL, and >150 ng/mL are, respectively, regarded as insufficient, sufficient, and toxic [
2,
3].
In clinical practice, vitamin D deficiency is usually treated with pre-vitamin D2 and pre-vitamin D3 supplements in order to increase the serum 25(OH)D level, but due to their longer half-life, pre-vitamin D3 supplements are preferred in the treatment of vitamin D deficiency [
4].
Vitamin D is known to have an effect on the health of many tissues and systems such as the veins, the brain, the skeletal system, the cardiovascular system, the immune system, the endocrine system, and the neuromuscular system [
5].
There are recent studies on the effects of serum vitamin D levels on bone healing. In clinical studies, vitamin D deficiency was found to be associated with delayed union [
6].
Experimental studies found that vitamin D supplements accelerated the process of callus formation and the healing of fractures. Many scientific studies have reported that vitamin D is effective in osseointegration and bone metabolism in dentistry [
7]. But, there are not sufficient studies on the effect of vitamin D levels on augmentation procedures [
8]. This study was conducted with the aim of determining the effects of low, normal, and high levels of serum vitamin D on the bone formation capacity of different graft materials used in the augmentation of intraosseous defects.
2. Materials and Methods
2.1. Study Design
A total of 36 4–5-month-old male Sprague Dawley rats weighing 300–350 g were used in this experimental study.
The study protocol was approved by the Animal Experimentation Ethics Committee of Istanbul University (approval date 27 December 2019; No. 2019/15).
All procedures were conducted in accordance with the international ethical guidelines for the treatment and welfare of experimental animals, and this study was prepared in conformity with the ARRIVE guidelines by Kilkenny et al. [
9].
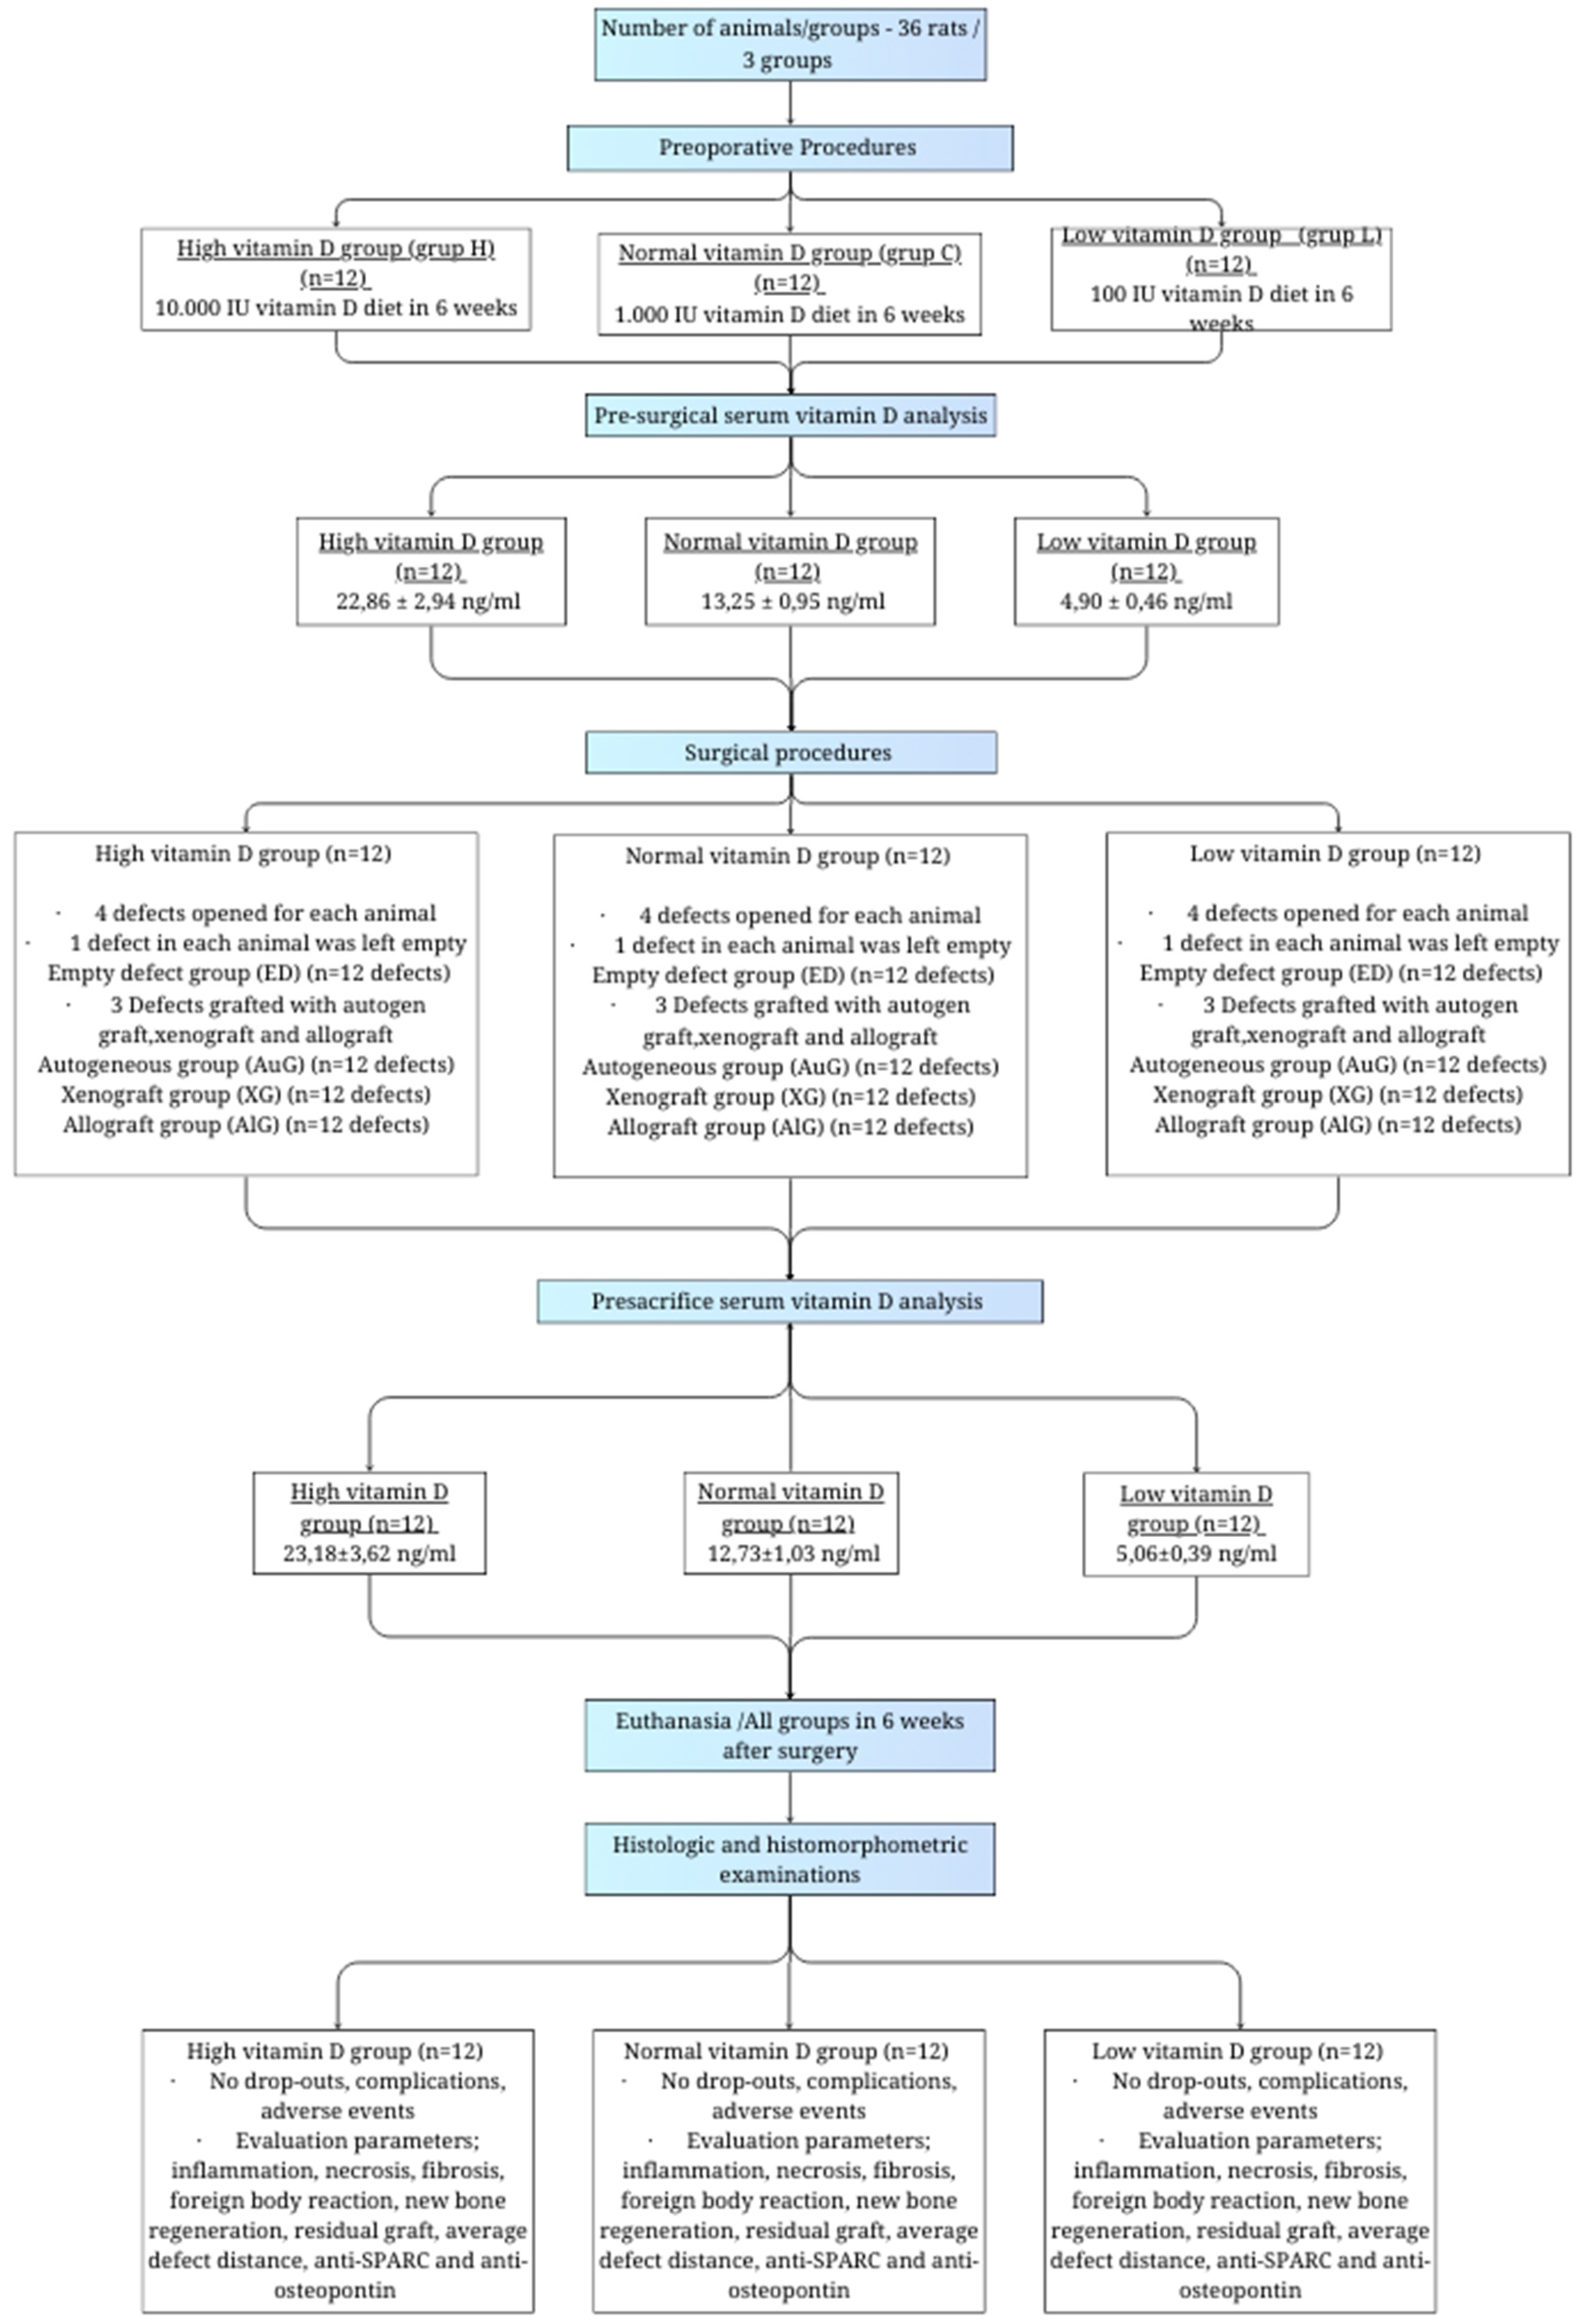
Our study was based on six main stages, namely the preoperational stage, presurgical analysis of serum vitamin D, the surgical stage, analysis of serum vitamin D before sacrifice, sacrifice, and the histological evaluation stage (
Figure 1).
2.2. Sample Size Calculation
In order to determine the number of samples, power analysis was performed using G*Power (v3.1.9.2) software. According to three different vitamin D levels (low, standard, and high) and partial eta estimated in the calculation of the difference in the new bone formation amounts in three different graft types applied to four defects produced in rats assumed as 0.5, it was calculated that at least nine rats per group were required in order to achieve 95% power with a level of α = 0.01, with a calculated effect size of d = 1.000. Twelve rats were included per group in the study, considering possible losses during the study process.
2.3. Preoperative Procedures
The animals in our study were kept in cages in an automated room with a 55% relative humidity rate at 21 °C with lights on and off for 12 h periods. They were subject to silence, ventilation, and heating, and they were fed ad libitum with water and feed.
A total of 36 rats were included in the study and were divided into 3 groups of 12 rats per group and were fed with special feeds with different vitamin D levels for 6 weeks.
An excess vitamin D diet was applied to the first group, with feed containing 10,000 iu/kg vitamin D3 (Altromin, Lage, Germany, product code C1017 Mod.) in order to create a high serum vitamin D level group (group H).
The second group (group C) was fed with feed containing 1000 iu/kg D3 (Altromin, Lage, Germany, product code C1000) in order to create the control group with standard serum vitamin D levels.
The third group (group L) was fed with feed containing 100 iu/kg vitamin D3 (Altromin, Lage, Germany, product code C1017) for a diet deficient in vitamin D in order to create a low-level vitamin D group.
2.4. Preoperative Biochemical Analysis
The serum vitamin D levels of the experimental animals were measured after being fed with a special diet for 6 weeks (42 days). The rats were anesthetized with 50 mg/kg ketamine HCl (Ketalar® Flakon, Pfizer, Istanbul, Turkey) and 5 mg/kg xylazine (Rompun® Flakon, Bayer Türk Kimya Sanayi Ltd., Şti, Istanbul, Turkey). Four mL blood samples were collected with a 25–30 g needle via the tails of each rat and put into EDTA containing tubes. The wound location on the tail was primarily sutured with material containing absorbable polyglycolic acid (Vicryl, Ethicon, Johnson & Johnson, New Brunswick, NJ, USA). The serum vitamin D levels of blood samples were biochemically analyzed with the HPLC (high-pressure liquid chromatography) method.
The reference range obtained by biochemical analysis was found to be 13.25 ± 0.95 ng/mL (control group), and it was 4.90 ± 0.46 ng/mL in the low-level vitamin D group and 22.86 ± 2.94 ng/mL in high-level vitamin D group on average.
The results were consistent with the aims of the specific diet applied in the preoperative care stage.
2.5. Surgical Procedures
A total of 50 mg/kg Ketamin HCl (Ketalar® Flakon, Pfizer, Istanbul, Turkey) and 10 mg/kg Xylazine (Rompun® Flakon, Bayer Türk Kimya Sanayi Ltd., Şti, Istanbul, Turkey) were intraperitoneally administered to the rats to achieve anesthesia. A total of 2 mg/kg lidocaine (Jetokain ampule (Adeka İlaç Sanayi ve Ticaret A.Ş., Samsun, Turkey) was subcutaneously administered to each experimental animal’s calvarium area in order to achieve local anesthesia. The hairs on the surface of the calvarium area were shaved and wiped with polyvinylpyrrolidone solution (Poviseptin, Mertsel Tic. A.Ş., Izmir, Turkey) to achieve asepsis. The surgical procedure was begun by performing a sagittal incision through the central line of the cranium, and the full-thickness flap was elevated. In the surgical area, the calvarial bone tissue was kept open with a clamp. Four bone defects per animal were produced, two on the left- and two on the right-hand side of the mid-sagittal suture, and 1–1.5 mm thick bone blocks with a 5 mm radius were produced via a trephine bur with a 5 mm inner radius (Ocean Trephine Bur, Bursa, Istanbul) under constant saline irrigation to prevent possible damage to the durometer. The first critical defect area was left empty (empty defect/ED group) in order to examine its recovery pattern and compare it with the other three. Autogenous bone grafts obtained from bone block produced with trephine bur were ground and then applied to the defect area next to the one left empty (Autogenous graft/AuG group). Bovine grafts (Bio-Oss, Geistlich Pharma, Wolhusen, Switzerland) were applied to the defect area below the empty defect area (Xenograft/XG group), and allografts were applied to the defect area in the cross-direction of the empty one (Maxxeus, Community Tissue Services, Kettering, OH, USA) (Allograft/AlG group).
The surgical operation area was sutured with resorbable material containing 3.0 polyglycolic acid (Vicryl, Ethicon, Johnson & Johnson, New Brunswick, NJ, USA) following the creation of critical defect areas and the application of graft material (
Figure 2).
To prevent pain and infection in the postoperative period, Tramadol HCl (Tramadolor 100 mg ampoule, Sandoz İlaç San. Ve Tic. Aş. İstanbul, Turkey) and Gentamicin (Gentamed 20 mg ampoule, Koçak Farma İlaç ve Kimya San. Aş. İstanbul, Turkey) were given intraperitoneally twice a day for 3 days. Wound surfaces were wiped and dressed in a polyvinylprolidone antiseptic solution (PVP K-30, Ataman Chemicals, Istanbul, Turkey) to protect against infection.
2.6. Sacrification
Six weeks after the surgical operation, the animals were intraperitoneally administered 50 mg/kg Ketamine HCl (Ketalar® Flakon, Pfizer, Turkey) and10 mg/kg Xylazine (Rompun® Flakon, Bayer Türk Kimya Sanayi Ltd., Şti, Turkey). Following the preoperative procedures, blood samples were collected to measure the serum vitamin D levels, and then sacrification was performed by administering the animals with 120 mg/kg sodium pentotalin (Pental Sodyum, İ.E. Ulagay İlaç Sanayi Türk A.Ş, İstanbul, Turkey).
Right after the sacrification, the full-thickness flap covering the calvaria was elevated following a mid-crestal incision, and the bone blocks obtained by dissecting the produced defect areas from other tissues were transferred into a 10% buffered formalin solution (Birpa Formaldehit, Birpa Kimyevi Maddeler Paz. Ve Tic. Ltd., Şti, Yenimahalle, Ankara, Turkey).
2.7. Histological Evaluations
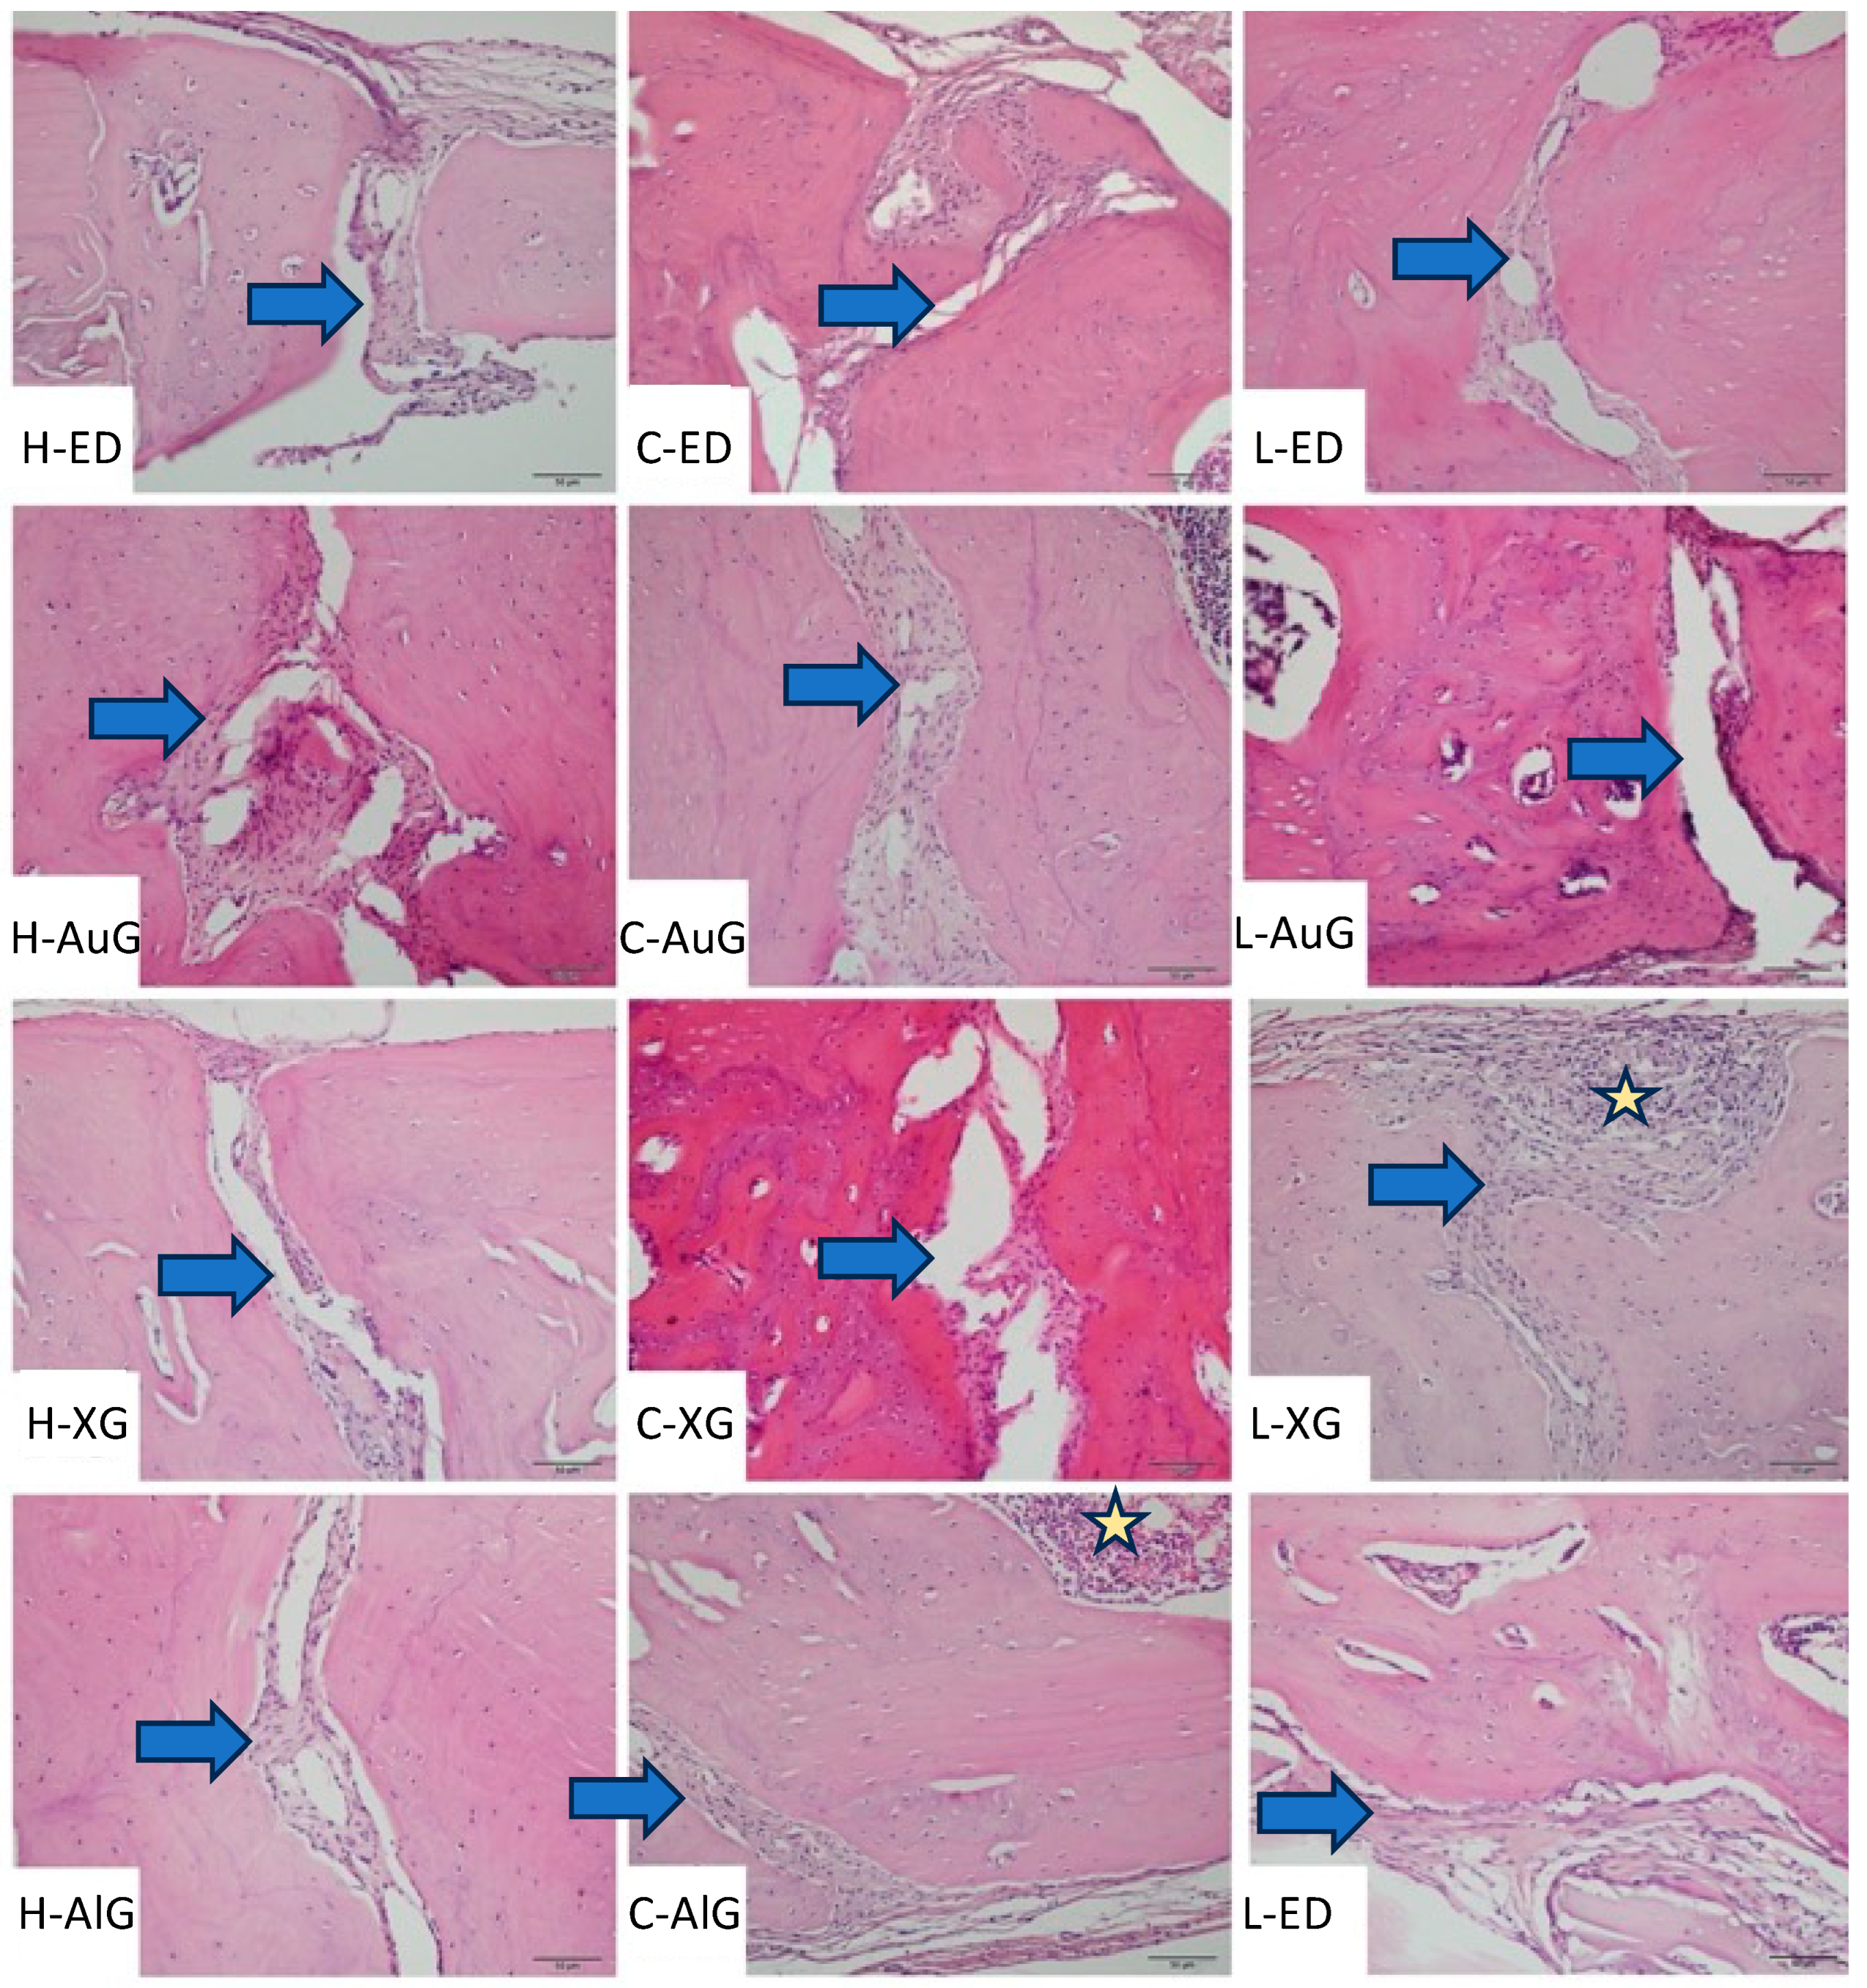
Histologic and histomorphometric evaluations were conducted by a single-blinded histologist. The tissues were fixed in a 4% buffered formalin solution for 48 h and then in an osteosoft (Merck, Darmstadt, Germany) solution for decalcification. The solution was changed once a week. A pin was jabbed on the surface of the bone far from the experiment area to determine whether proper decalcification was achieved. After decalcification was achieved, the tissues were cleansed with PBS (phosphate-buffered saline) and put under routine histological supervision. The tissue blocks under histological supervision were kept at +4 °C before dissection. Five μm sections were cut with a Leica RM 2145 microtome on polysine slides following a 37 °C water bath. Sections were kept in an oven at 57 °C for an hour before staining and were kept in xylol overnight after they became cold. The prepared sections were subjected to several staining protocols after deparaffinization to obtain histological findings. First, hematoxylin and eosin staining protocols and then Masson’s trichrome staining protocol were applied. The images from stained sections were captured via a color digital camera (Olympus C-5050; Olympus Corporation, Tokyo, Japan) integrated into a light microscope (BX-51; Olympus, Tokyo, Japan). Histological evaluations were performed by a single-blind histologist. Necrosis and foreign body reaction were scored as 0: absent and +: present in histopathological evaluations, while inflammation and fibrosis were scored as 0: absent, +: mild, ++: moderate, and +++: severe. New bone formation, residual graft, and mean defect distance were assessed histomorphometrically. The digital images of each section covering the whole defect area were captured at ×100, and the new bone formation and residual graft areas were measured in square micrometers with the image analysis program “Olympus analysis 5” (Olympus Corp.) for the assessment of new bone formations and residual grafts. The average defect distance was measured in micrometers by calculating the median distance of different random areas of sections obtained from each animal in the experimental groups.
2.8. Statistical Analysis
The NCSS (Number Cruncher Statistical System) 2020 Statistical Software (NCSS LLC, Kaysville, UT, USA) was used for statistical analyses. Methods of descriptive statistics (average, standard deviation, median, first quarter, third quarter) were used to evaluate the results obtained from this study. A Mann–Whitney U test was used for the comparison between two groups of variables with abnormal distribution, a Kruskal–Wallis test was used for comparisons between three or more groups and a Dunn test was used to determine the group that was responsible for the difference. A Wilcoxon signed-rank test was used for in-group evaluations. For the comparison of qualitative data, chi-squared and Fisher–Freeman–Halton tests were used. The results were found to have a confidence interval of 95%, and statistical significance was evaluated to be p < 0.05.
Shapiro–Wilk tests and box plot graphics were used to evaluate the suitability of the data for normal distribution. Since the variables did not show a normal distribution, the homogeneity of the variances was not examined.
4. Discussion
To the best of our knowledge, this is the first study that histologically and histomorphometrically evaluates the effects of the serum vitamin D level on autogenous grafts, allografts, and xenografts used in the treatment of bone defects. The results of this study demonstrate that higher vitamin D levels lead to an increase in the number of new bone formations in all defect types.
Fu et al. evaluated the effect of vitamin D on fracture healing in osteoporotic rats. A fracture line was created by osteotomy in the femurs of all rats in the experimental and control groups. The experimental group was administered 1.25(OH)
2D3, 0.1 μg/kg/day via oral gavage. All the animals were sacrificed in the sixth and sixteenth weekend, and the fracture lines were examined histomorphometrically. The histomorphometric data obtained 6 weeks after the fracture demonstrated that the 1.25(OH)
2D3-administered group had a 23% higher total callus volume compared to the control group. New bone volume and trabecular number displayed the same tendency. No histological differences were observed in the groups in week 16 [
10]. This might be due to a period of 4–8 weeks being considered sufficient for long-term bone healing for rat metabolism. For this reason, the period between the surgical operation and the sacrifice was determined to be 6 weeks, which is the period that is usually preferred in experimental studies in the literature.
In an in vivo study on rats conducted in 2017 by Williamson et al., the experimental animals were separated into three different groups, and feed containing 20,000 iu/kg and 8000 iu/kg vitamin D was used as high vitamin D dosage, while 1000 iu/kg vitamin D containing feed was used in the control group. The tibias of sacrificed animals were dissected following a special 4-week feed. The mechanical endurance and cortical and trabecular morphologies of the bones were examined. The findings demonstrated that the animals in the highest vitamin D group had higher volumes of trabecular and cortical bones and also had higher mechanical endurance and fracture resistance in their tibias, while there was no statistically significant difference regarding the volume and hardness of the bones between the normal vitamin D and low vitamin D groups. The research argued that the results of the study indicated that vitamin D supplements in diet increase bone health in general, and it is helpful to have a higher bone volume to prevent osteoporosis in adulthood [
11]. The vitamin D levels were not measured in this study, so it cannot be concluded whether the vitamin D level in the control group was, in fact, insufficient, or if 20,000 iu in the high vitamin D group could, in fact, be considered high enough. Similar to the studies conducted by Fu et al. and Williamson et al., our study also measured the highest number of new bone formations and the lowest defect distance in the high vitamin D group in the empty defect group after 6 weeks, and autogenous grafts, xenografts, and allografts were used for the treatment of intraosseous defects in our study. The findings indicated that high vitamin D levels had significantly higher numbers of new bone formations compared to the control and low vitamin D groups. Compared to grafts, the highest number of new bone formations in the high vitamin D and control groups was observed in allograft-applied cases, while in the low vitamin D group, the autogenous graft-applied cases had the highest number. In their in vivo study, Hong et al. evaluated the effect of vitamin D supplements on bone regeneration in alloplastic bone graft-applied defects. The premolars of dogs were extracted and 3 months later, standard defects with a 4 mm diameter and a 6 mm depth were prepared and then applied to alloplastic grafts. The experimental group was orally administered 37.5 iu vitamin D tablets each day for 4 weeks. The control group was fed a standard diet. The pre- and post-implant surgery vitamin D levels in the experimental animals were not measured. The supplemental diet group was observed to have statistically lower vertical crest resorption and higher bone density [
12]. The findings of this study, considered along with those of ours, demonstrate that the vitamin D level affects the ossification of all types of graft materials used in the treatment of defects.
A total of 95% of all experimental animals in medical research are rats and mice that are specifically bred for experiments. Their tiny size, ease of transportation and care, fast breeding, and short life span, allowing the observation of several generations in short periods of time, are some of the reasons why they are widely preferred for experiments. Also, rats have about a 95% similar DNA structure to human beings; thus, they are somewhat susceptible to diseases that are found in human beings and their treatments. Many rat inbreds and outbreds are used in experiments [
13]. An albino rat species, Sprague Dawley, was used for this study, which is a widely accepted strain used in many studies [
14].
Delwatta et al. reported that animal experiments in many medical fields are very important for researchers, and the hematological data required in research is insufficient, emphasizing the importance of determining the reference range of blood value of the experimental animal that will be used in research by creating control and experimental groups [
15]. There is no reference range data for serum vitamin D levels in rats in the literature. In our study, the vitamin D level of the twelve animals in the standard diet (1000 iu/kg vit D3) control group was measured and found to be 13.25 ± 0.95 ng/mL in young adult male rats. The serum vitamin D level in the high vitamin D3 diet group (10,000 iu/kg vit D3) was found to be 22.86 ± 2.94 ng/mL, whereas the low vitamin D3 diet group (100 iu/kg vit D3) was 4.90 ± 0.46 ng/mL. These results demonstrate that the special diet we implemented was successful in creating different serum vitamin D levels. The diets were implemented for 6 weeks in accordance with the instructions of the producing company in order to have a stabilized vitamin D level during the experiment. Pre-sacrification serum vitamin D levels were measured, the results were compared with initial values, and no statistically significant difference was found between the first and last measured vitamin D levels in all three groups, demonstrating that the experiment was successfully conducted. All the experimental animals completed the experiment without any issues, and this may be interpreted as the determined vitamin D levels were not beyond the toxic level. In the clinic, the reference vitamin D levels for human beings are regarded as insufficient if they are between 0 and 30 ng/mL, sufficient if they are between 40 and 80 ng/mL, and toxici if they are higher than 150 ng/mL [
3]. Further clinical studies may evaluate the effect of vitamin D supplement dosages within the safe range on the recovery of bone defects. In our study, 3 mL venous blood samples from each experimental’s tail were collected and biochemically analyzed to evaluate the vitamin D level. High-Performance Liquid Chromatography (HPLC) was used to measure the vitamin D level due to it being a routine method for evaluating the vitamin D level in laboratories today [
16].
Bone defects that cannot heal spontaneously without intervention are called critical bone defects. In the literature, 5 mm bone defects in rats are regarded as a “critical defect” [
17]. Calvaria in rats is an area where their paws and legs cannot reach the surgical area and thus cannot be irritated. It is also an anatomical structure where the materials placed in the defect area are in direct contact with bone tissues, making it a very useful experimental model to apply biocompatible materials to critical defects created in the calvaria area in order to see the effects of the material. A total of four 5 mm bone defects in the calvaria were created in our study, and lower bone regeneration was observed in empty defects compared to graft-applied defects; this demonstrated that 5 mm was the proper size for bone defects and allowed the evaluation of four different defect types on the same experimental animal.
This study has some limitations. Since a limited amount of blood can be taken from rats, the levels of bone turnover markers, calcium, and phosphorus in blood serum were not measured, and the activity of bone cells was not examined. Bone healing in rats takes 4–8 weeks, according to the literature. Sacrifices were performed at an average time of 6 weeks to use fewer subjects for ethical reasons. Different sacrifice times (e.g., 2nd, 4th, 6th, and 8th weeks) may be used in future studies to evaluate bone healing at different time points. Histomorphometry and micro-computed tomography (μCT) can be used to evaluate new bone formations [
18]. Using μCT, 3D, and 2D reconstructions, volumetric measurements can be obtained. Since there are a limited number of studies evaluating vitamin D and graft healing in the literature, a histological evaluation was made in these studies, and decalcified sections were taken instead of μCT in order to compare the results of this study with other studies. In future studies, μCT can also be used to evaluate bone formation at different intervals.


 ,
, 

