
A Numerical Evaluation for Estimating the Consequences on Users and Rescue Teams Due to the Fire of an Electric Bus in a Road Tunnel


Abstract
:1. Introduction
2. Summary of the Literature Review
3. Materials and Methods
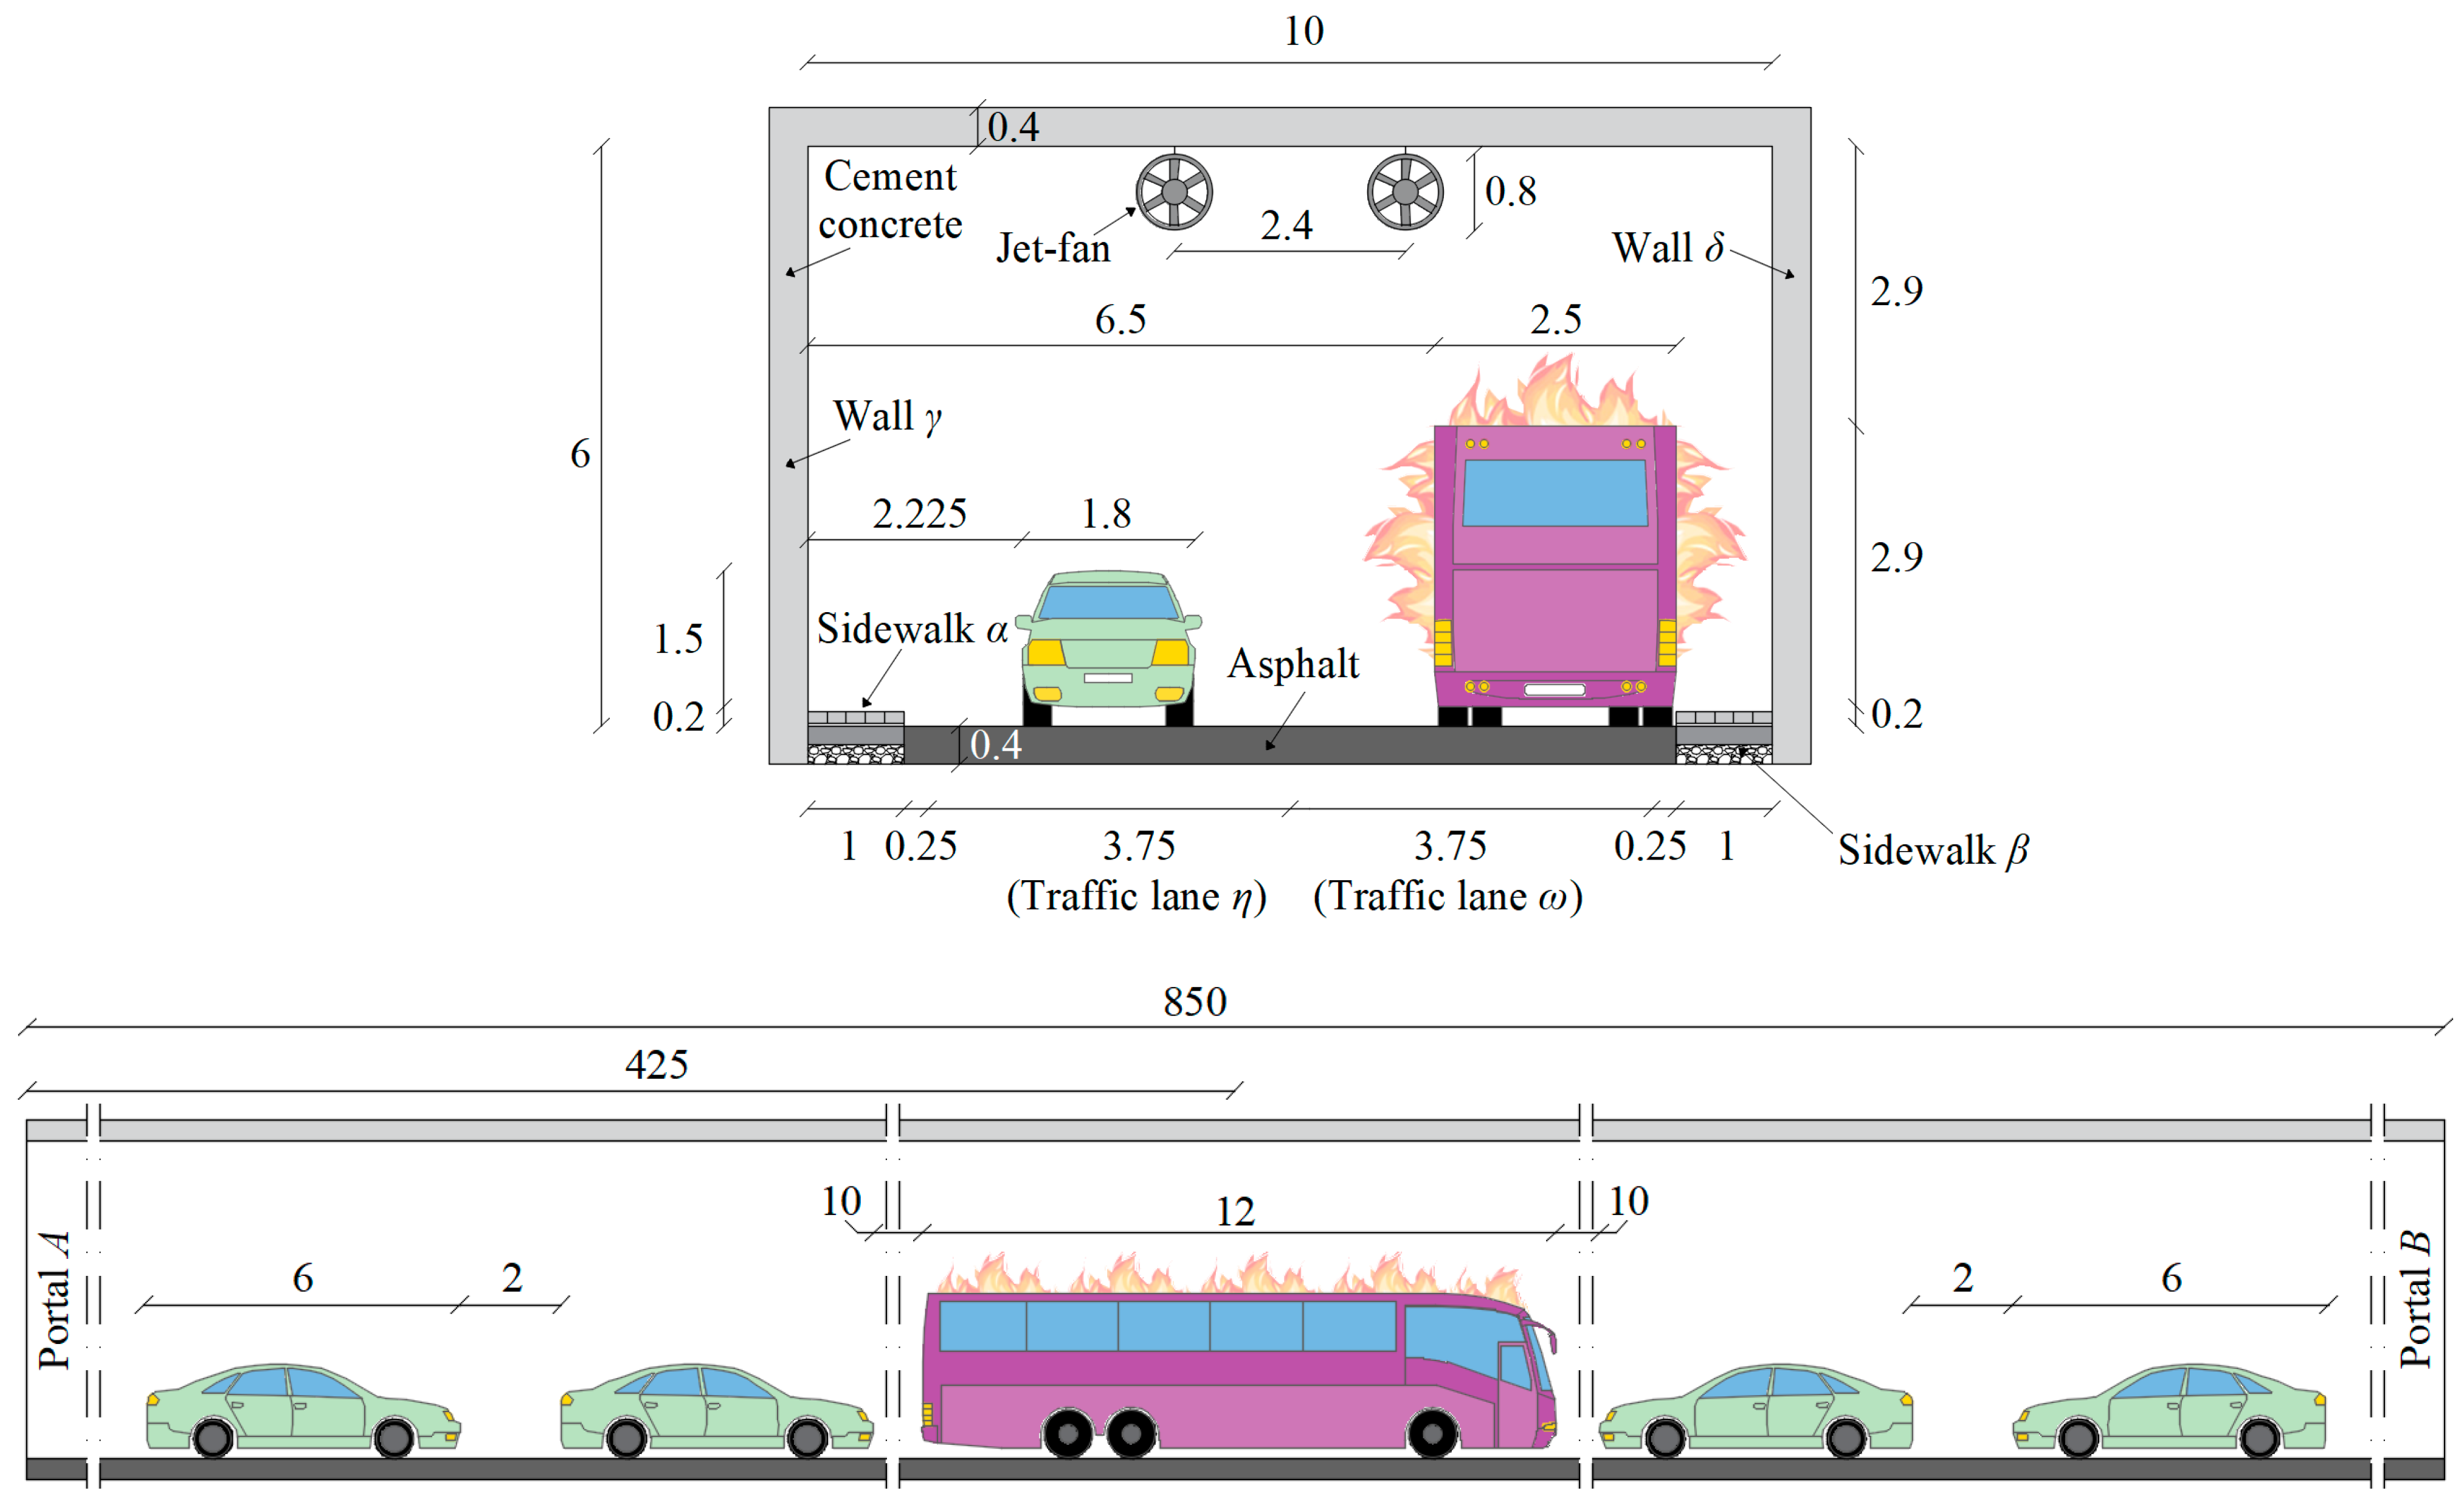
3.1. Tunnel Geometry
3.2. Ventilation Scenarios
3.2.1. General Description
3.2.2. Natural Ventilation
3.2.3. Longitudinal Mechanical Ventilation
3.3. Material Characterization
3.4. Hourly Traffic Volume
3.5. Fire and Evacuation Scenarios
3.5.1. Type, Location, and Geometry of the Burning Vehicles
3.5.2. Heat Release Rate of the Two Buses on Fire Investigated
3.5.3. Fire Curves
3.5.4. Hydrogen Fluoride of the Two Burning Buses
3.5.5. Combustion Products
3.5.6. Vehicles in the Queue
3.5.7. Escaping Users
3.6. Research Framework
4. Computational Fluid Dynamics Modeling
4.1. Overview
4.2. Fire Dynamics Simulator Code
4.3. Thermal Radiation, Turbulence, and Combustion Models
4.4. FDS Performing
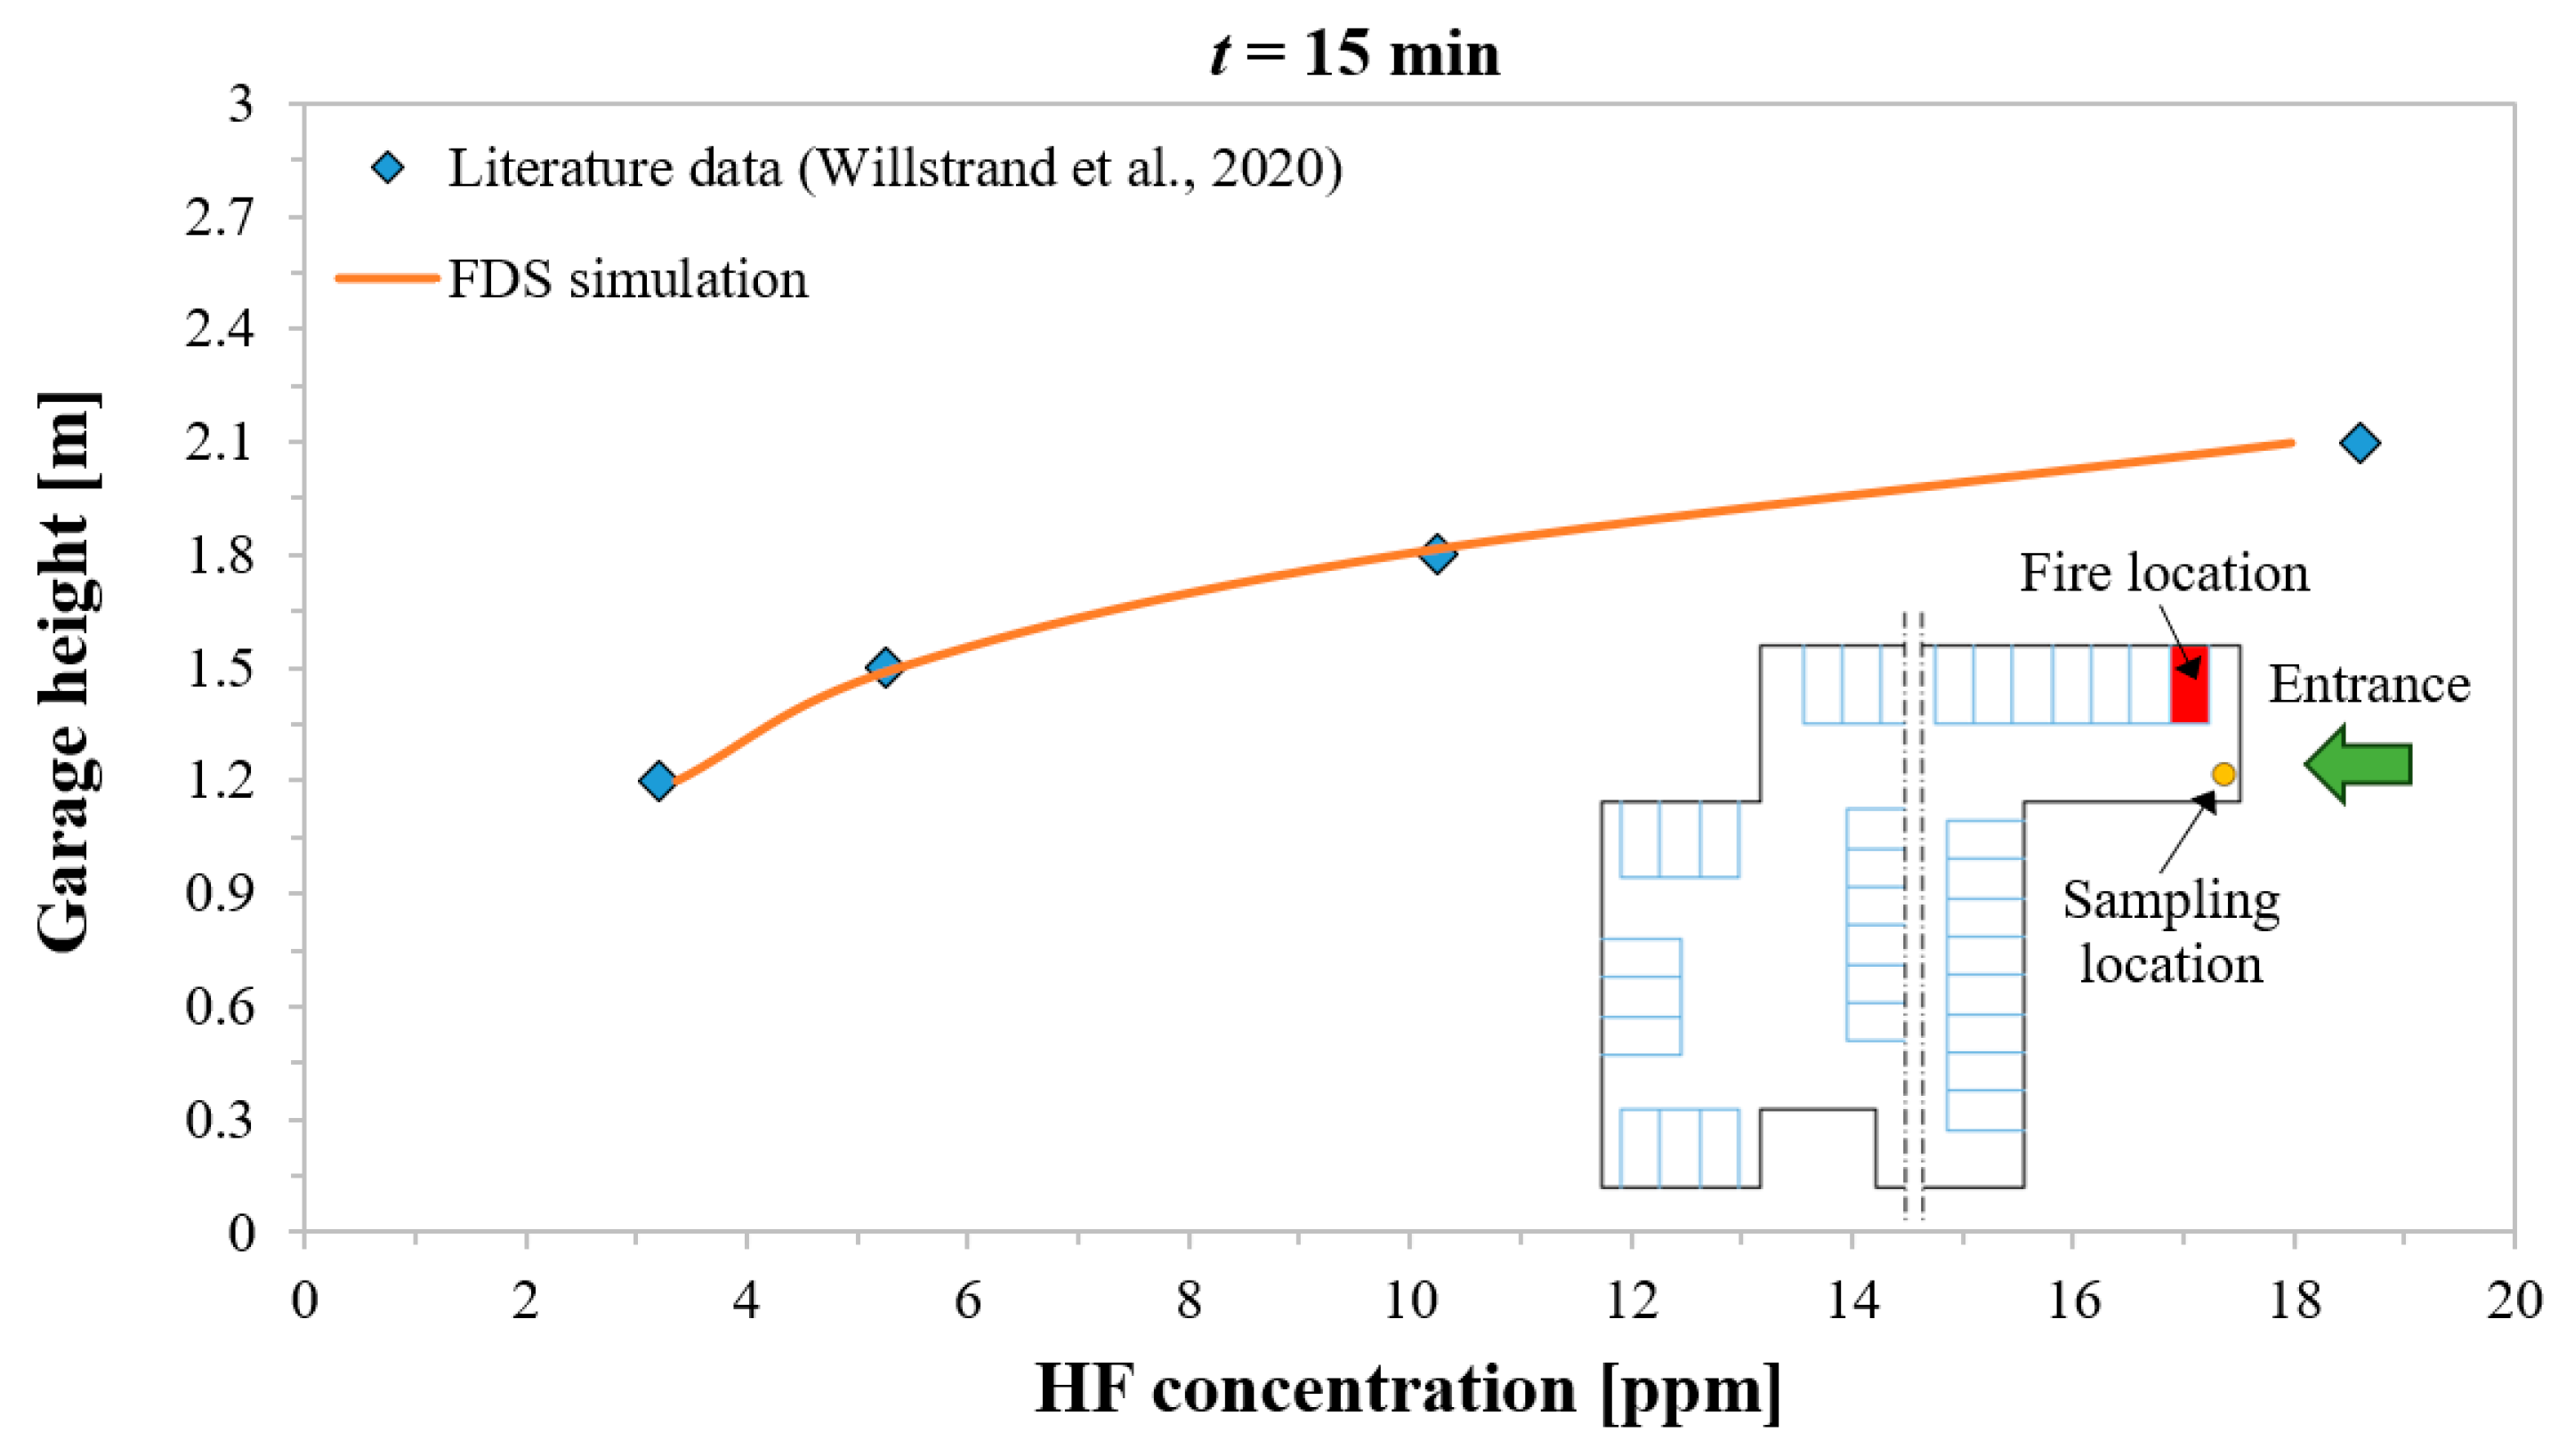
4.4.1. Calibration
4.4.2. Grid Sensitivity Analysis
5. Escape Process Modeling
5.1. Evac Code
5.2. Users’ Properties
5.3. Evacuation Strategies
6. Analysis and Discussion of the Results
6.1. Environmental Situations in the Tunnel to Which the Users Downstream of the Burning Bus Are Exposed (after tmax = 9 min from the Fire Start)
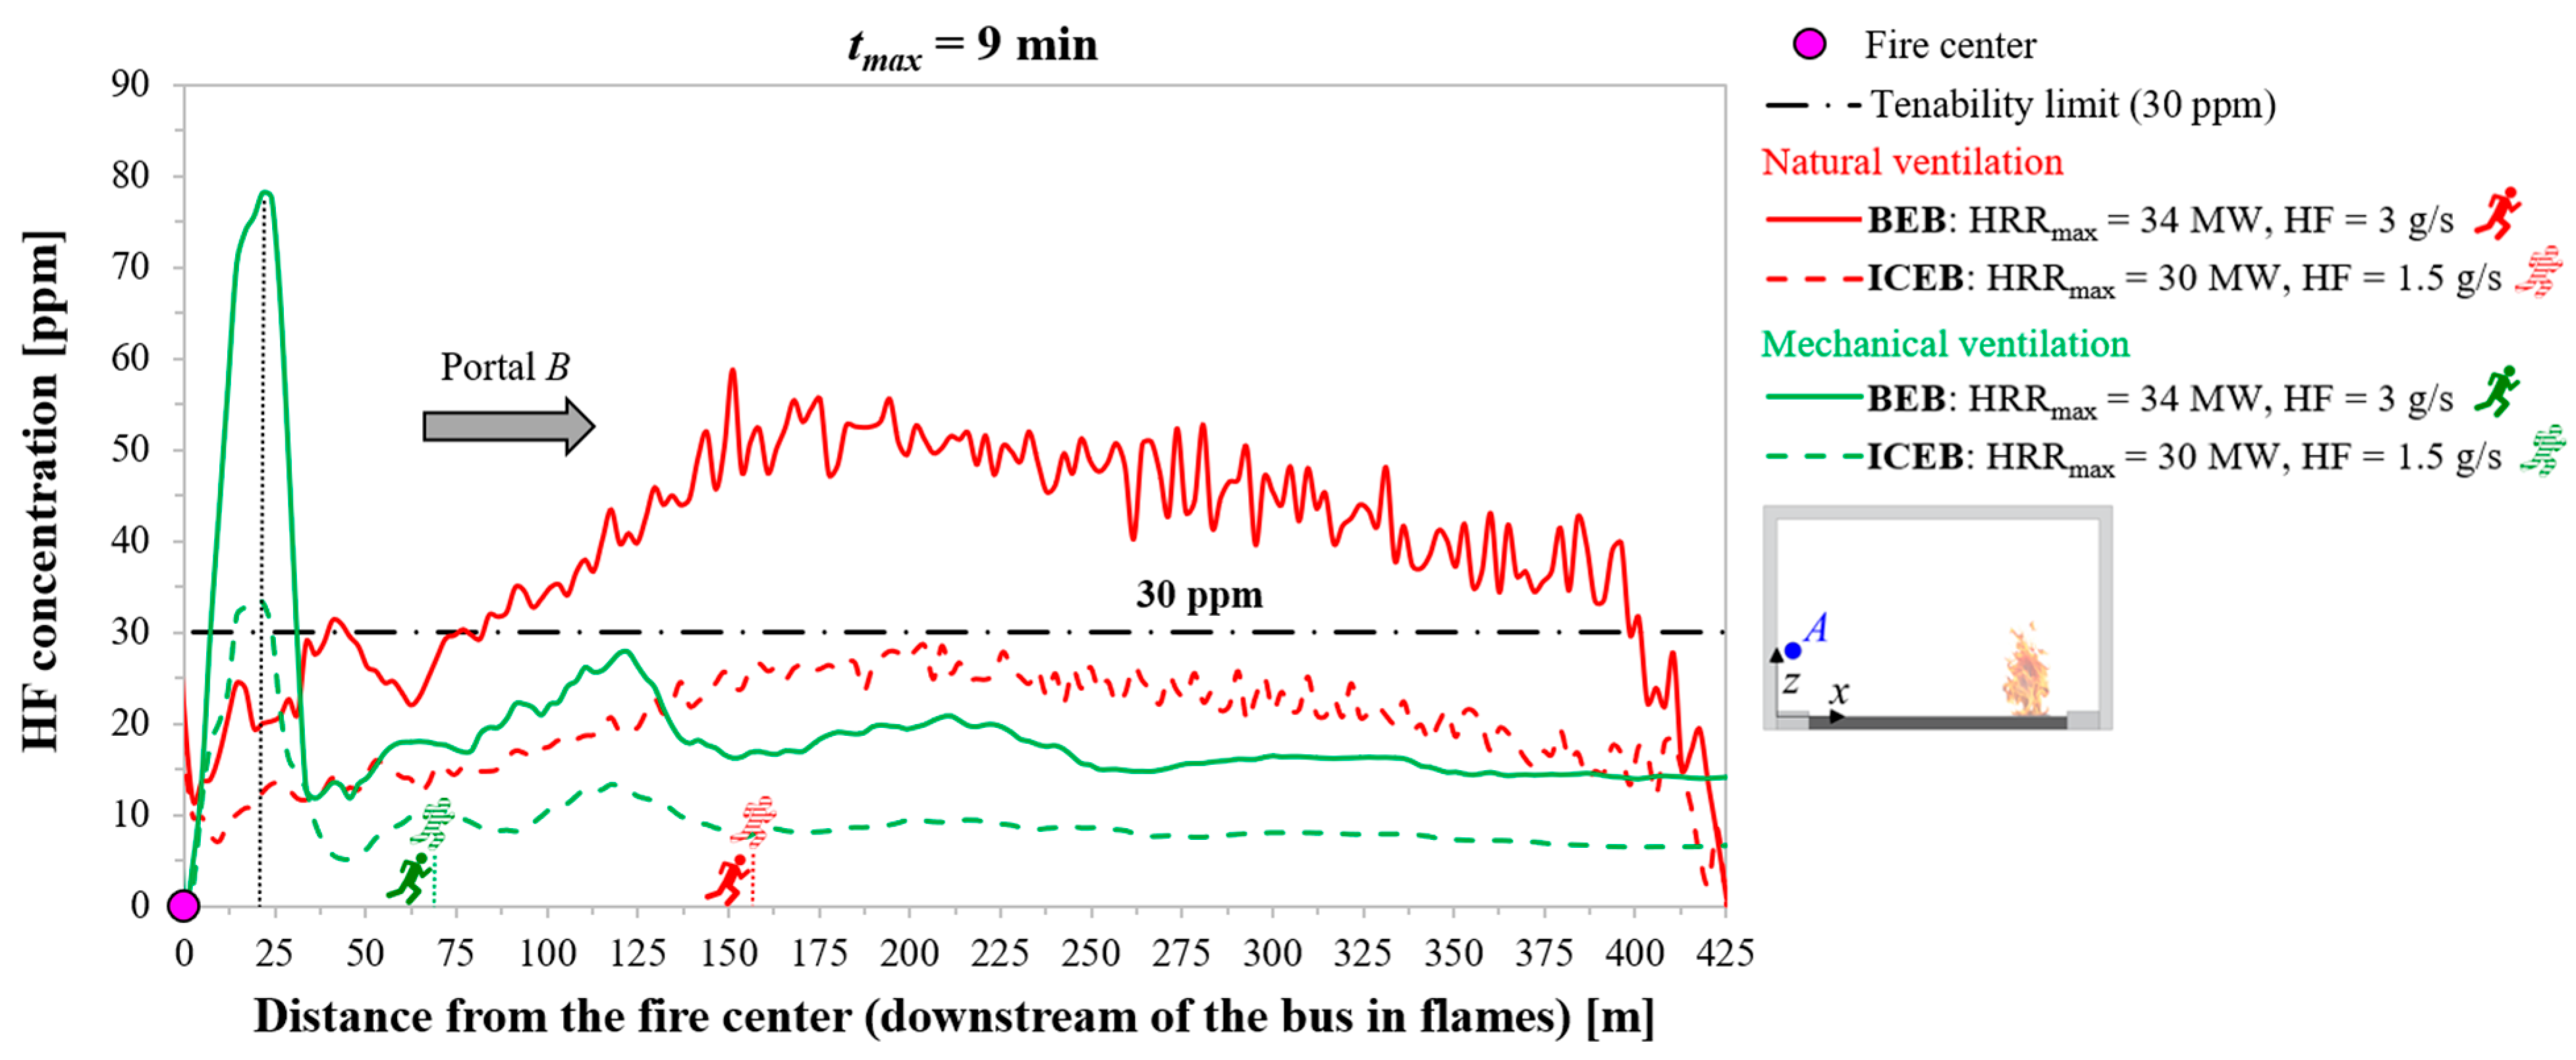
6.1.1. HF Amount
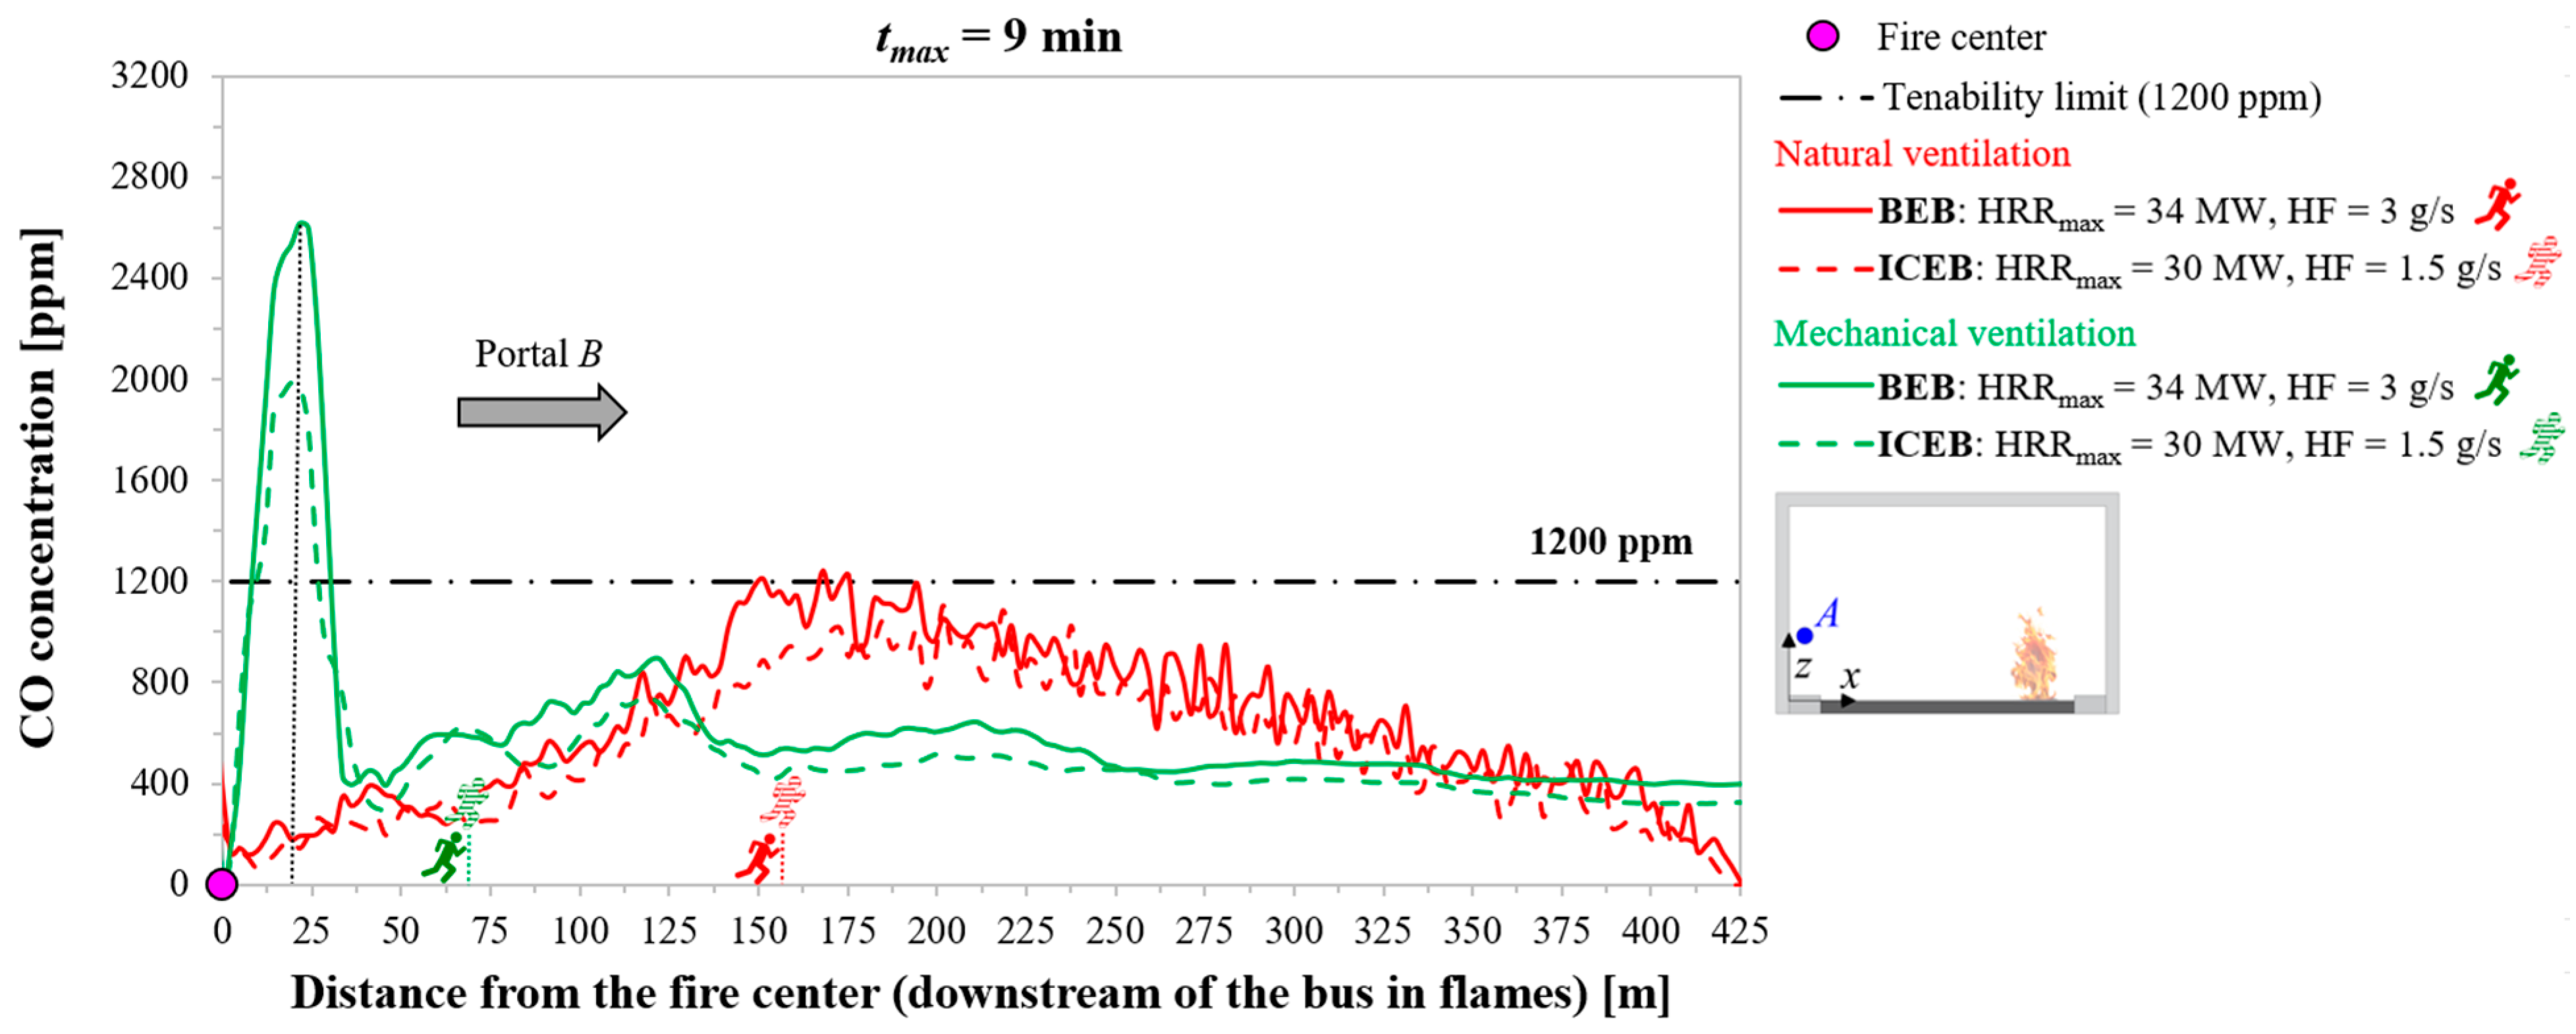
6.1.2. CO Level
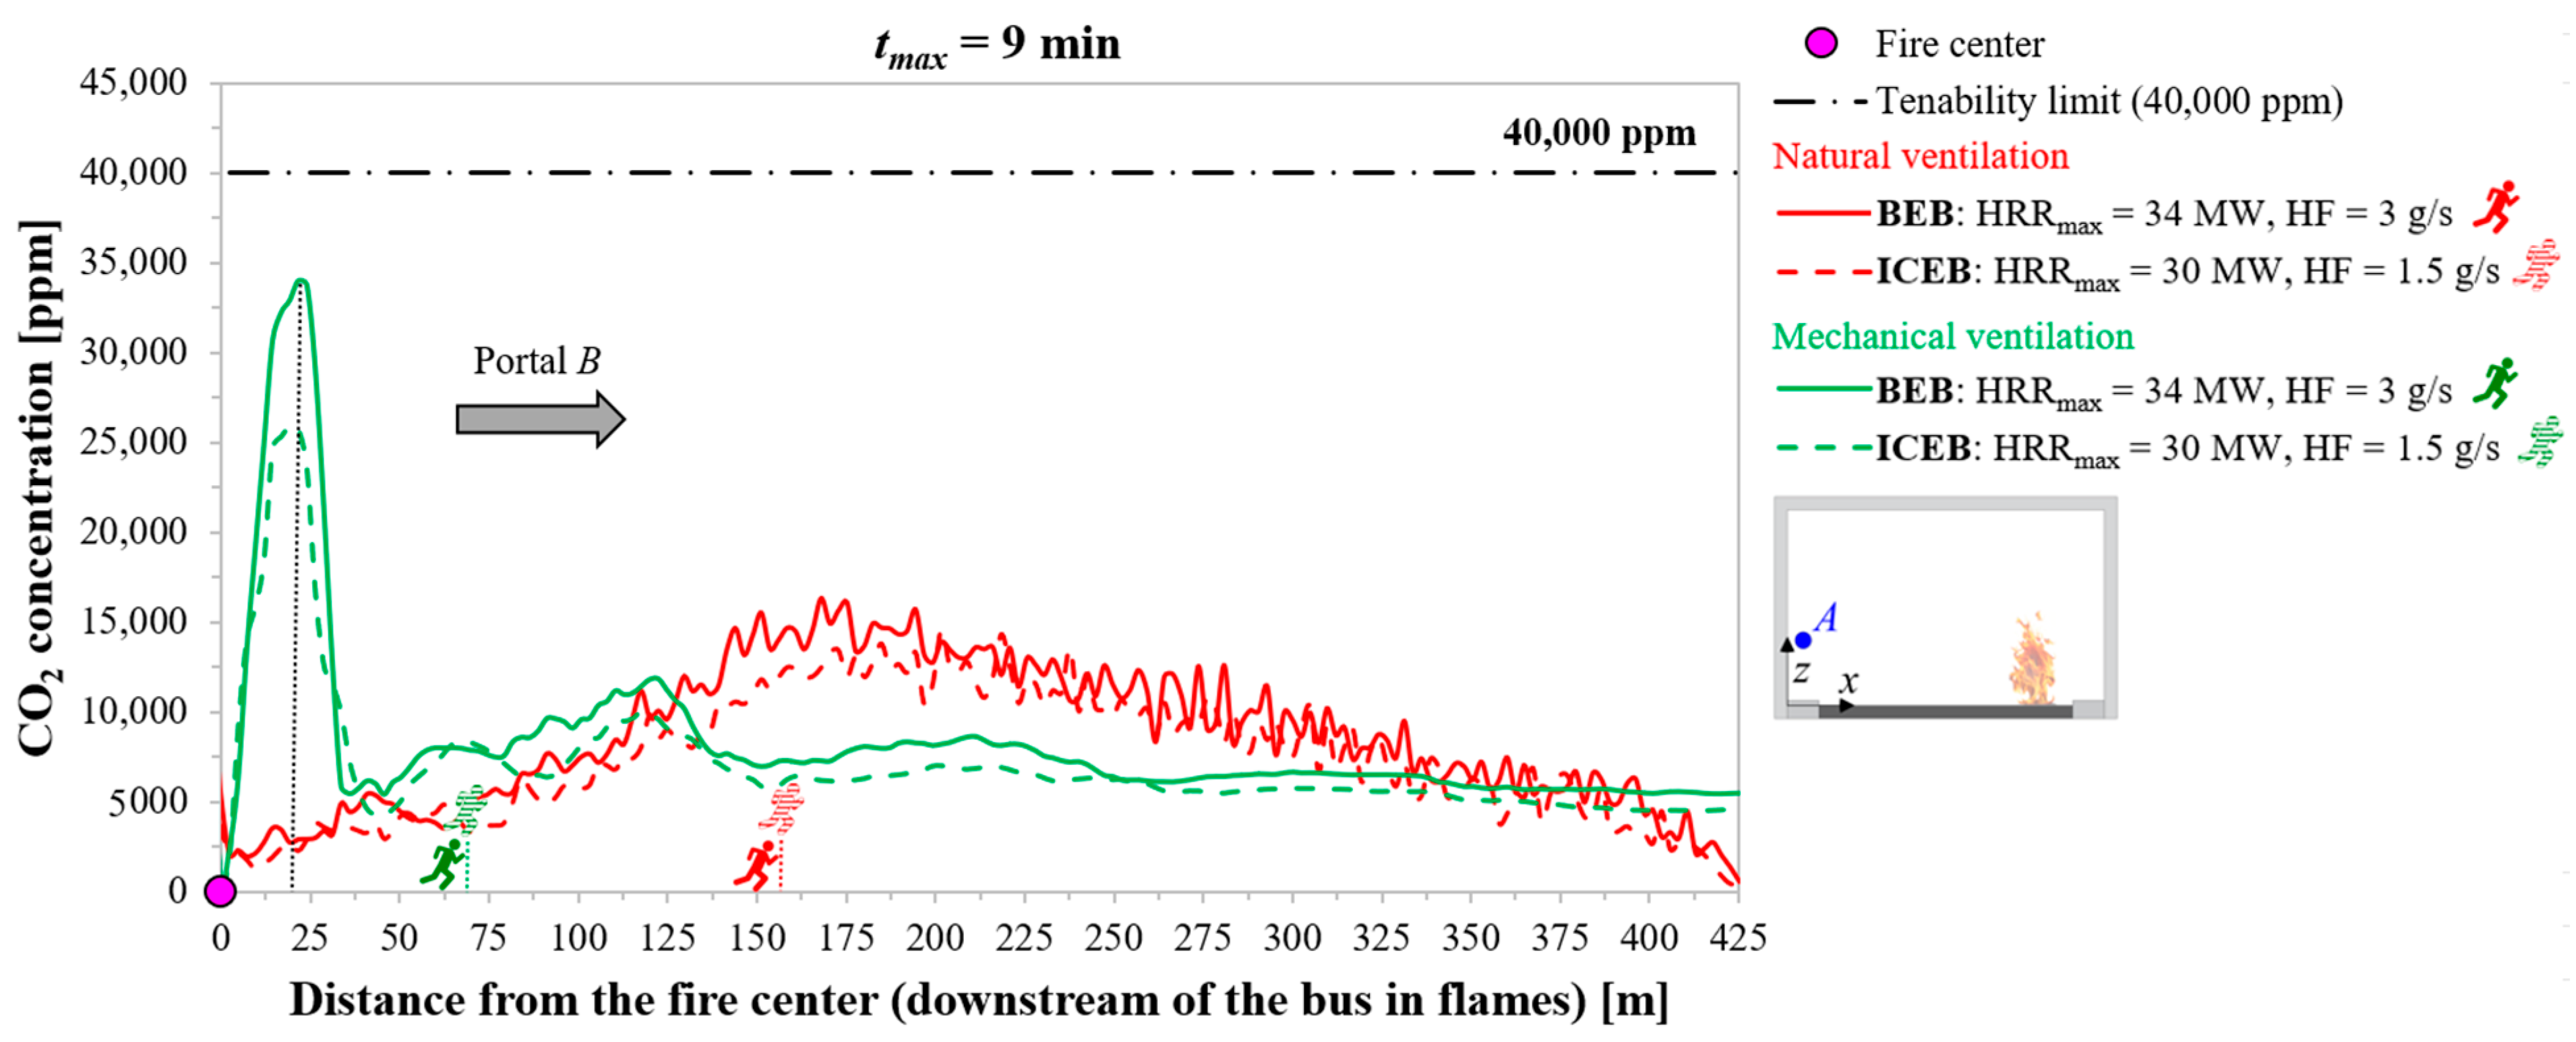
6.1.3. CO Quantity
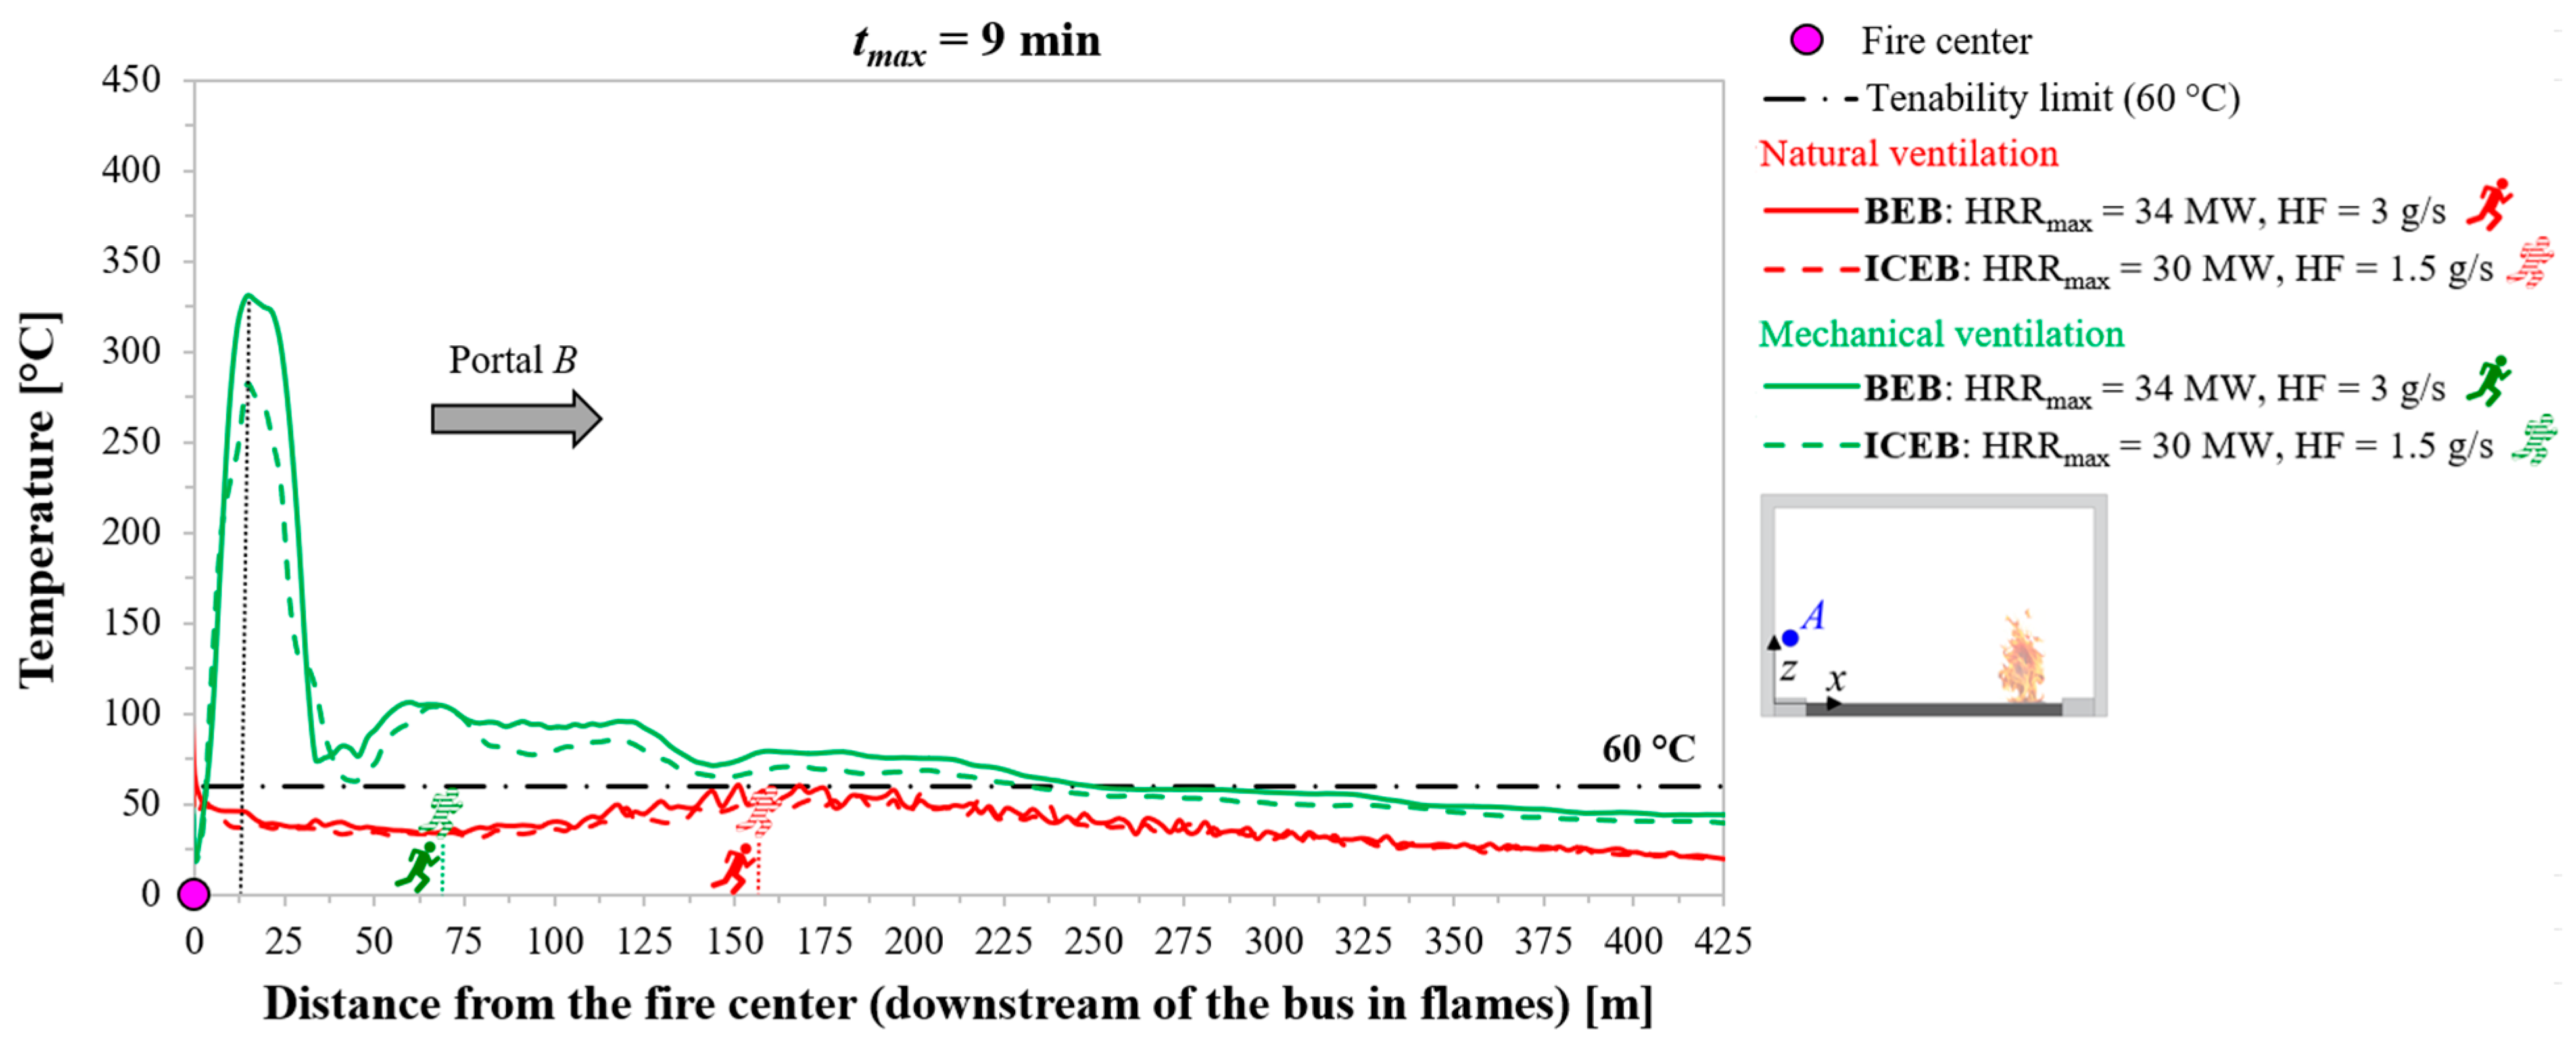
6.1.4. Temperature Value
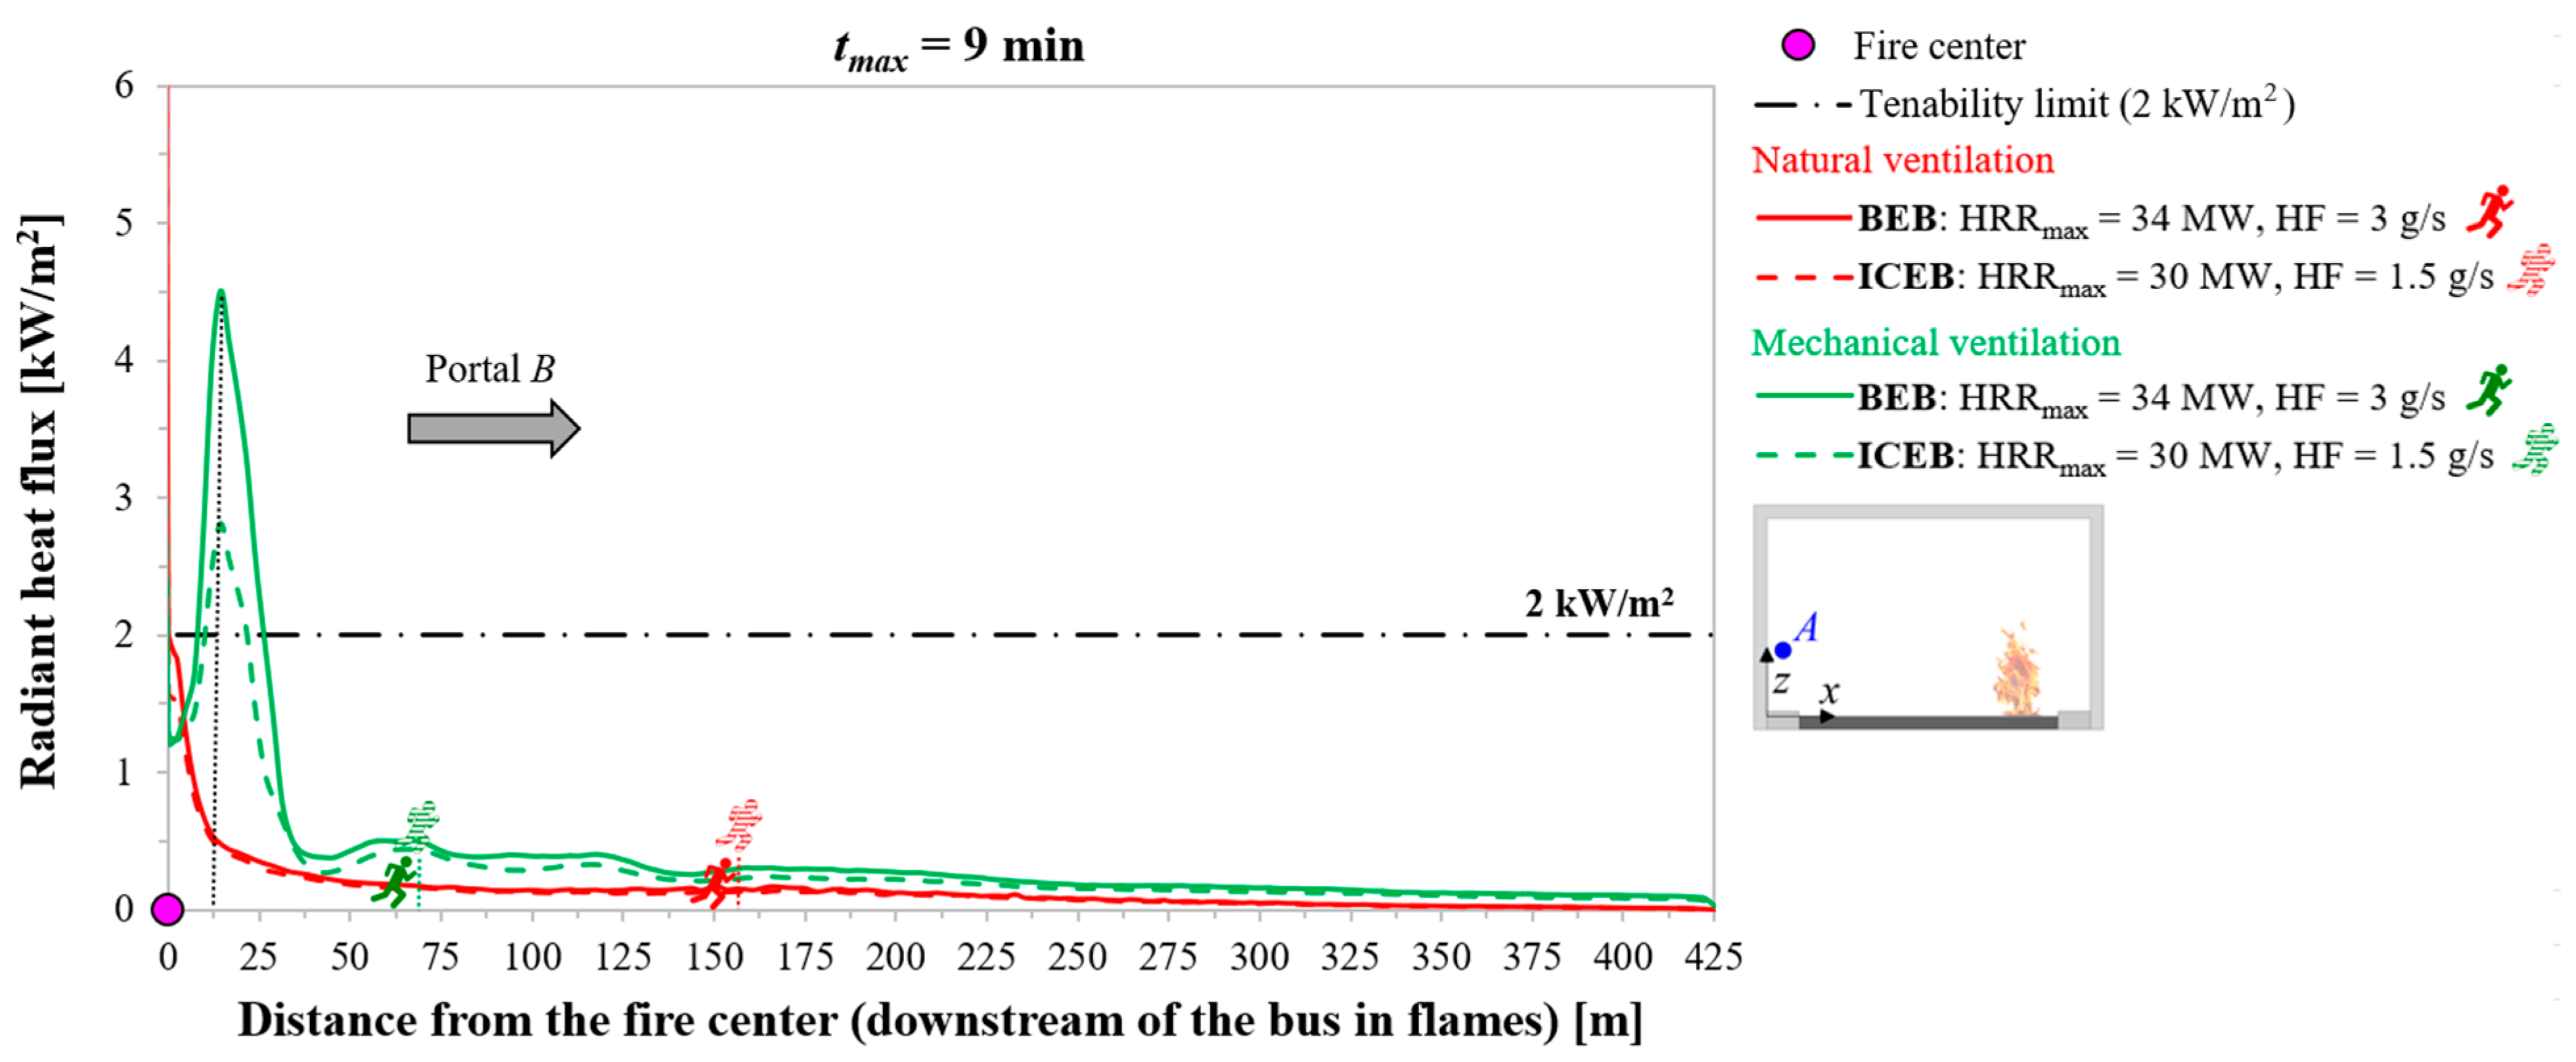
6.1.5. Radiant Heat Flux Level
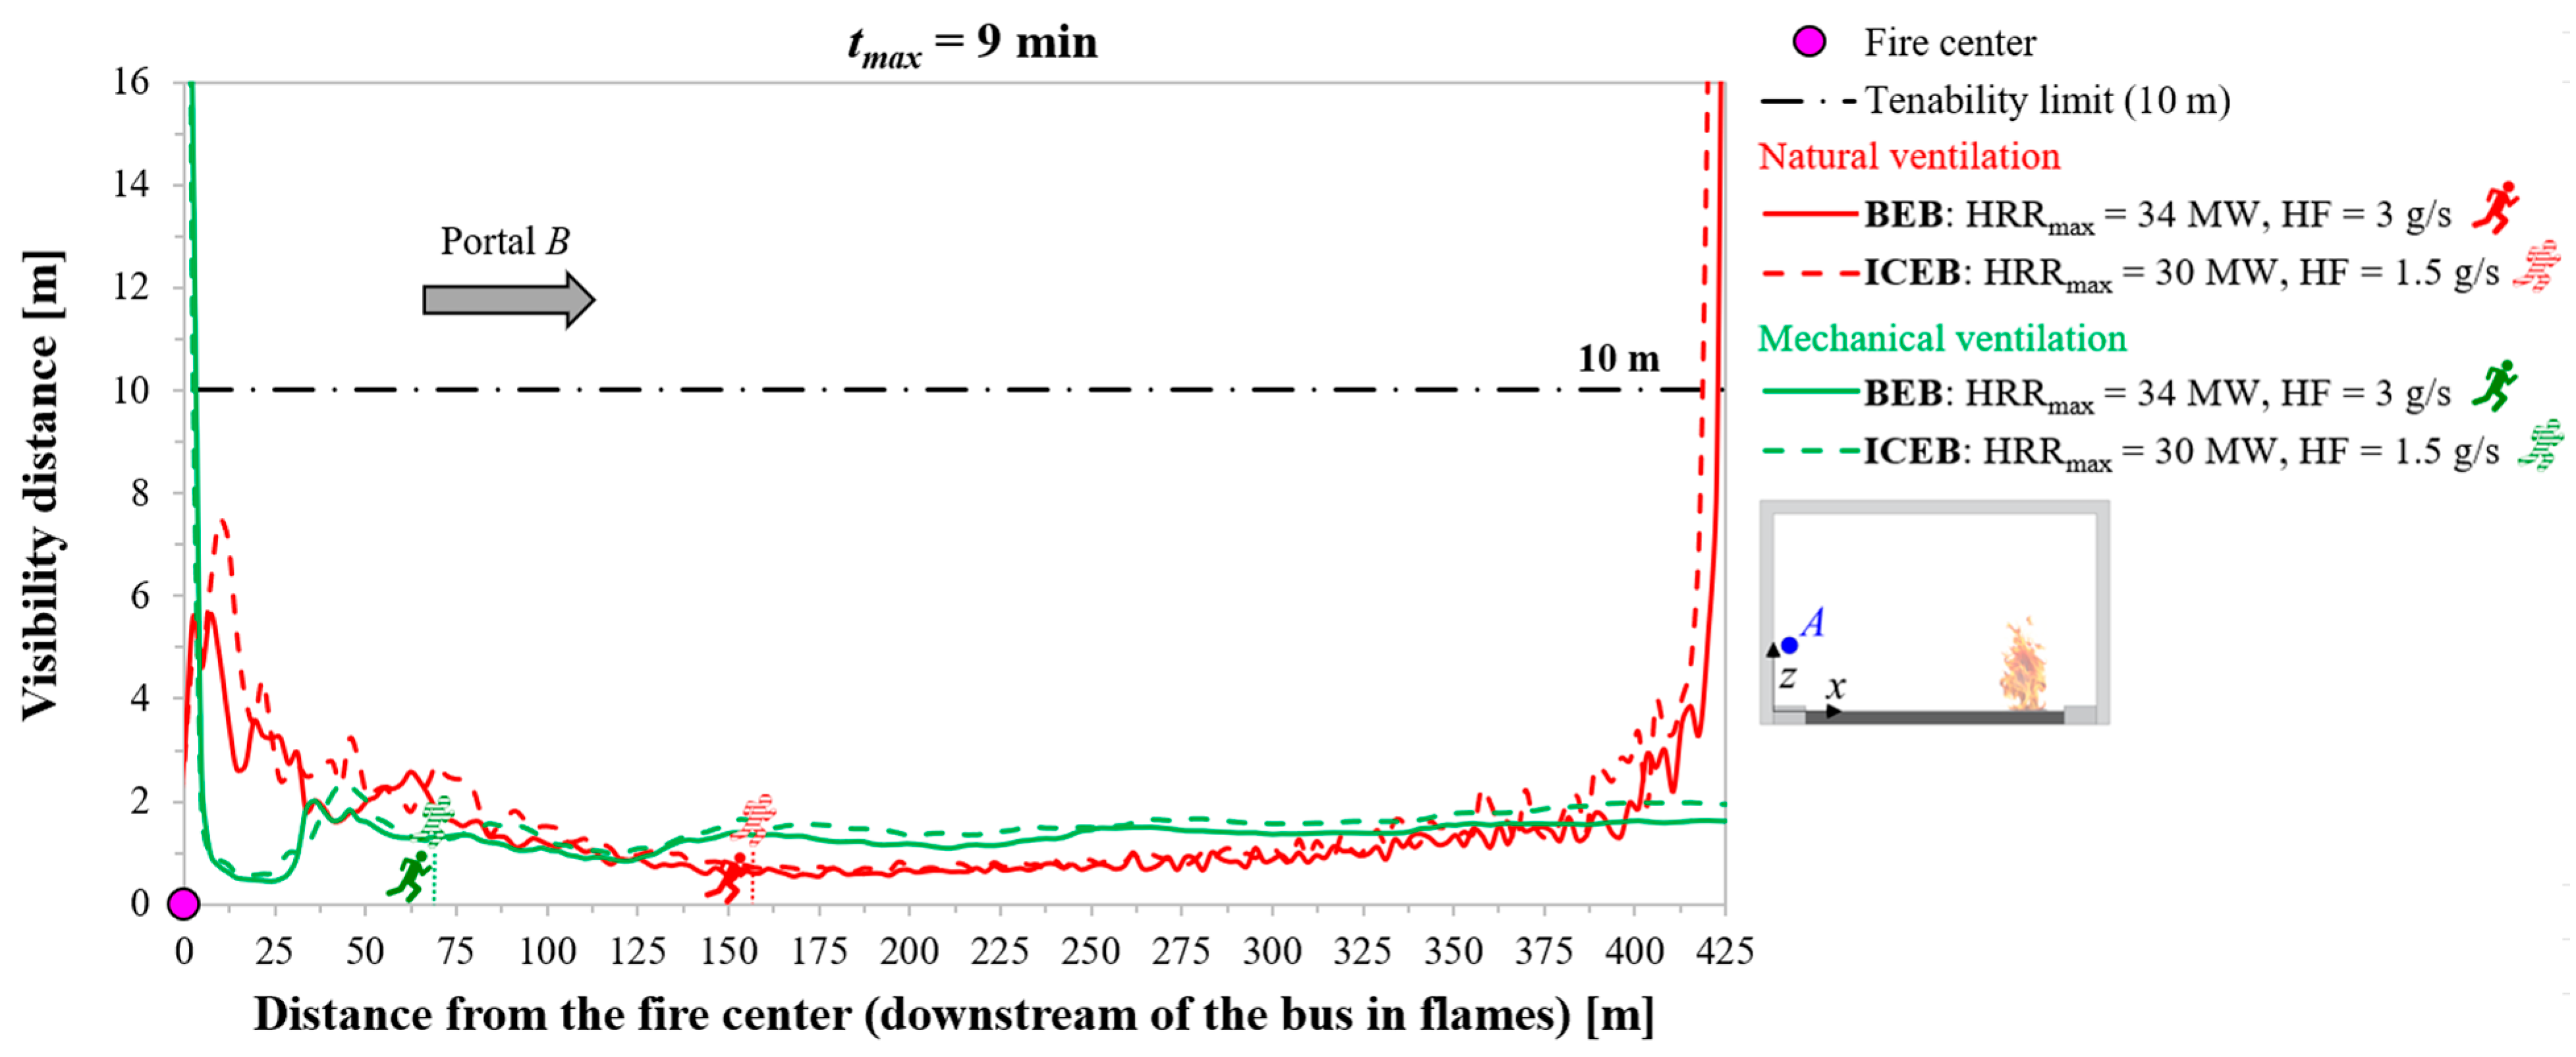
6.1.6. Visibility Distance Measurement
6.1.7. FEDtoxic gases Value
6.2. Environmental Situations in the Tunnel to Which the Firefighters are Exposed (after t = 15 min from the Fire Start)
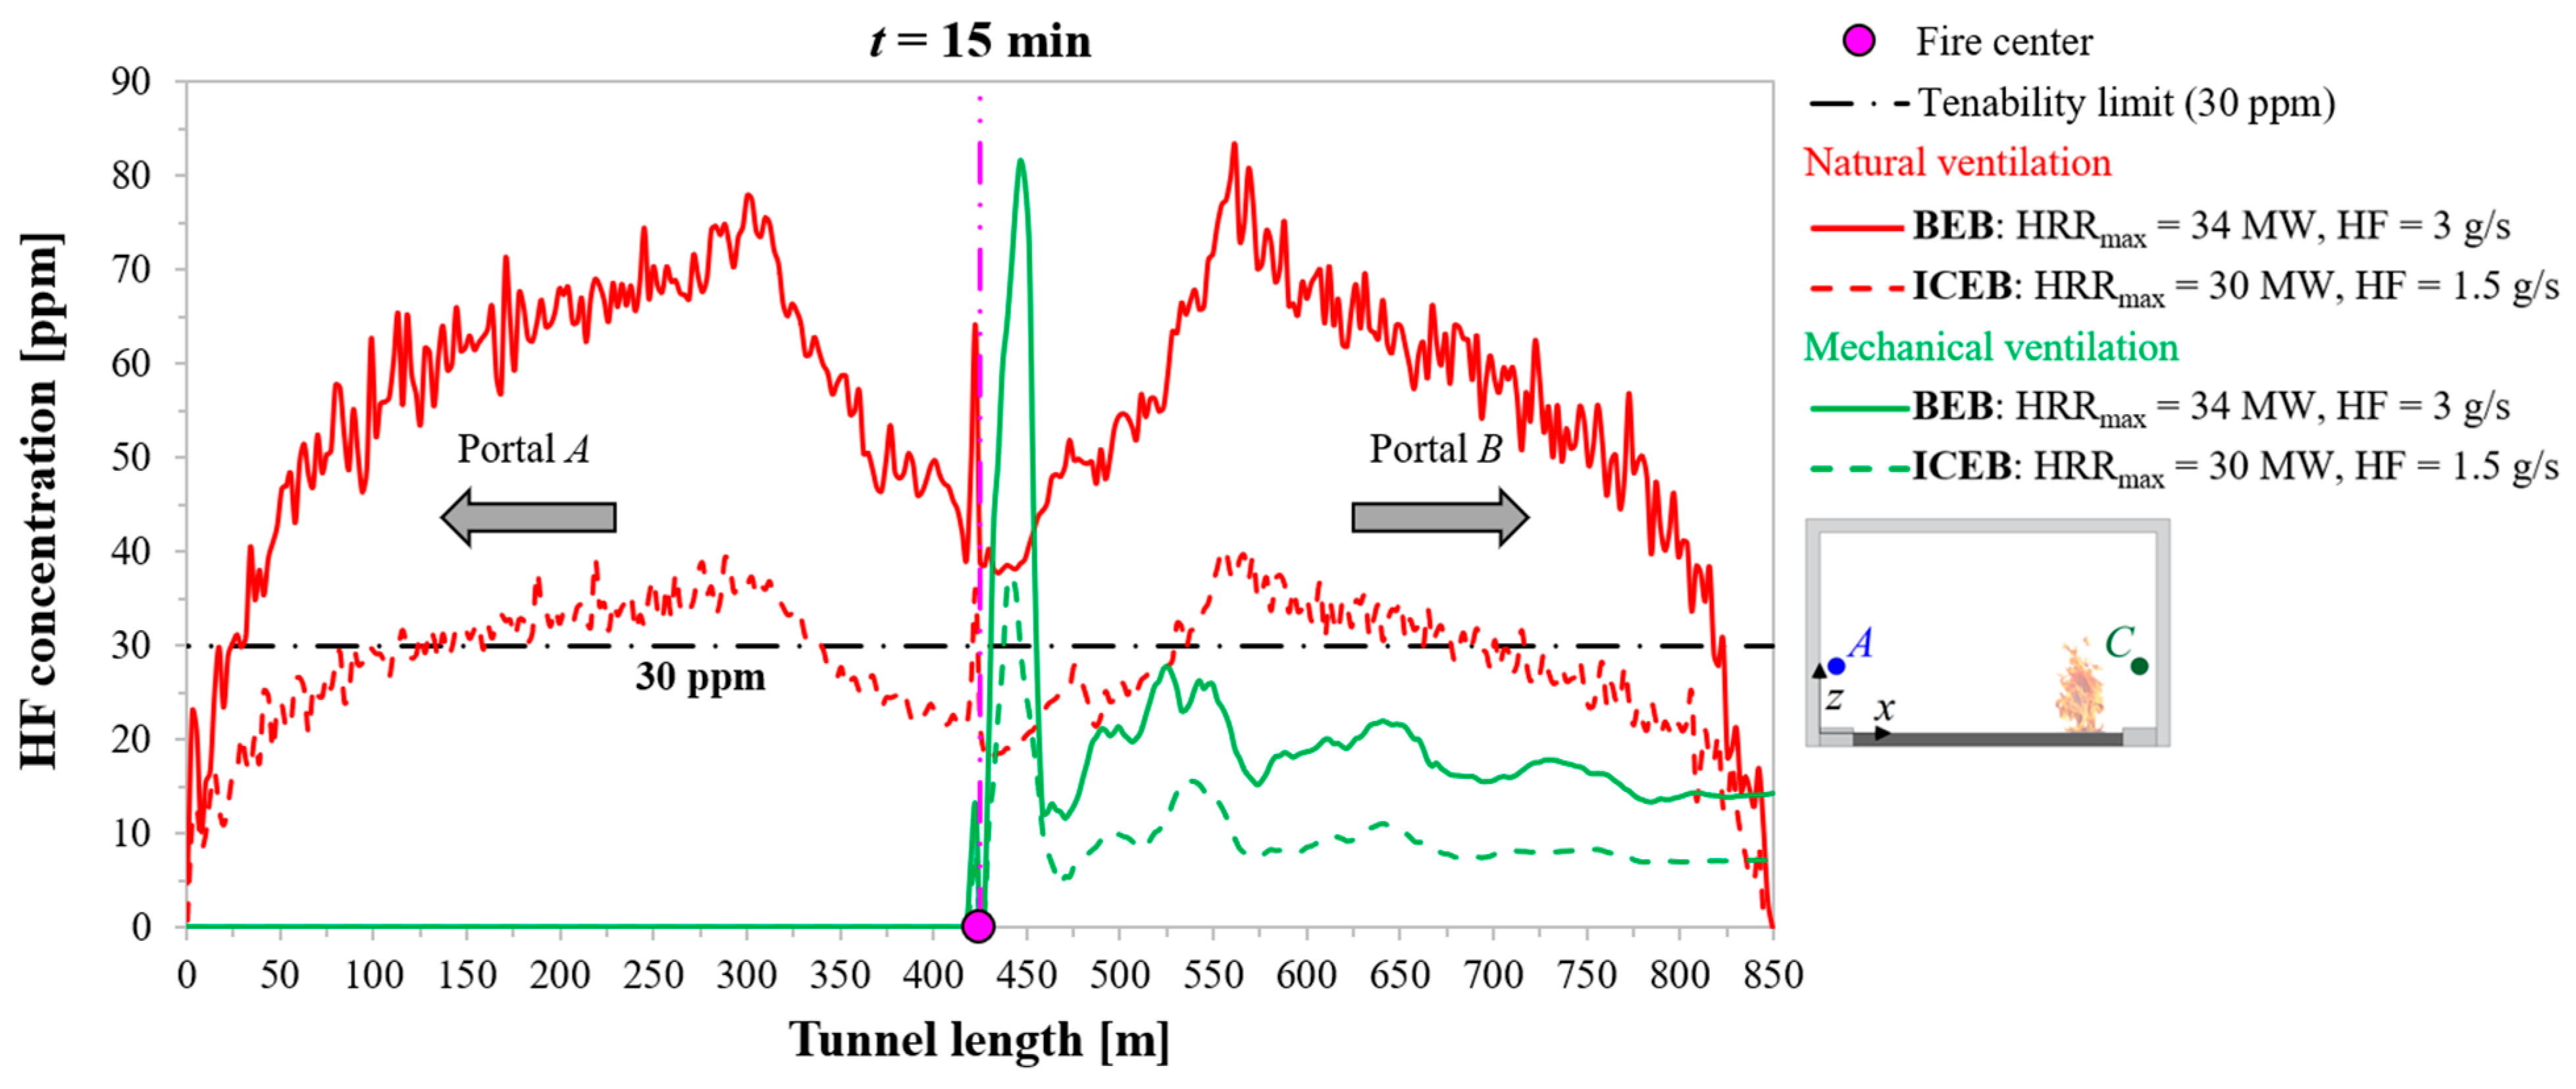
6.2.1. HF Concentration
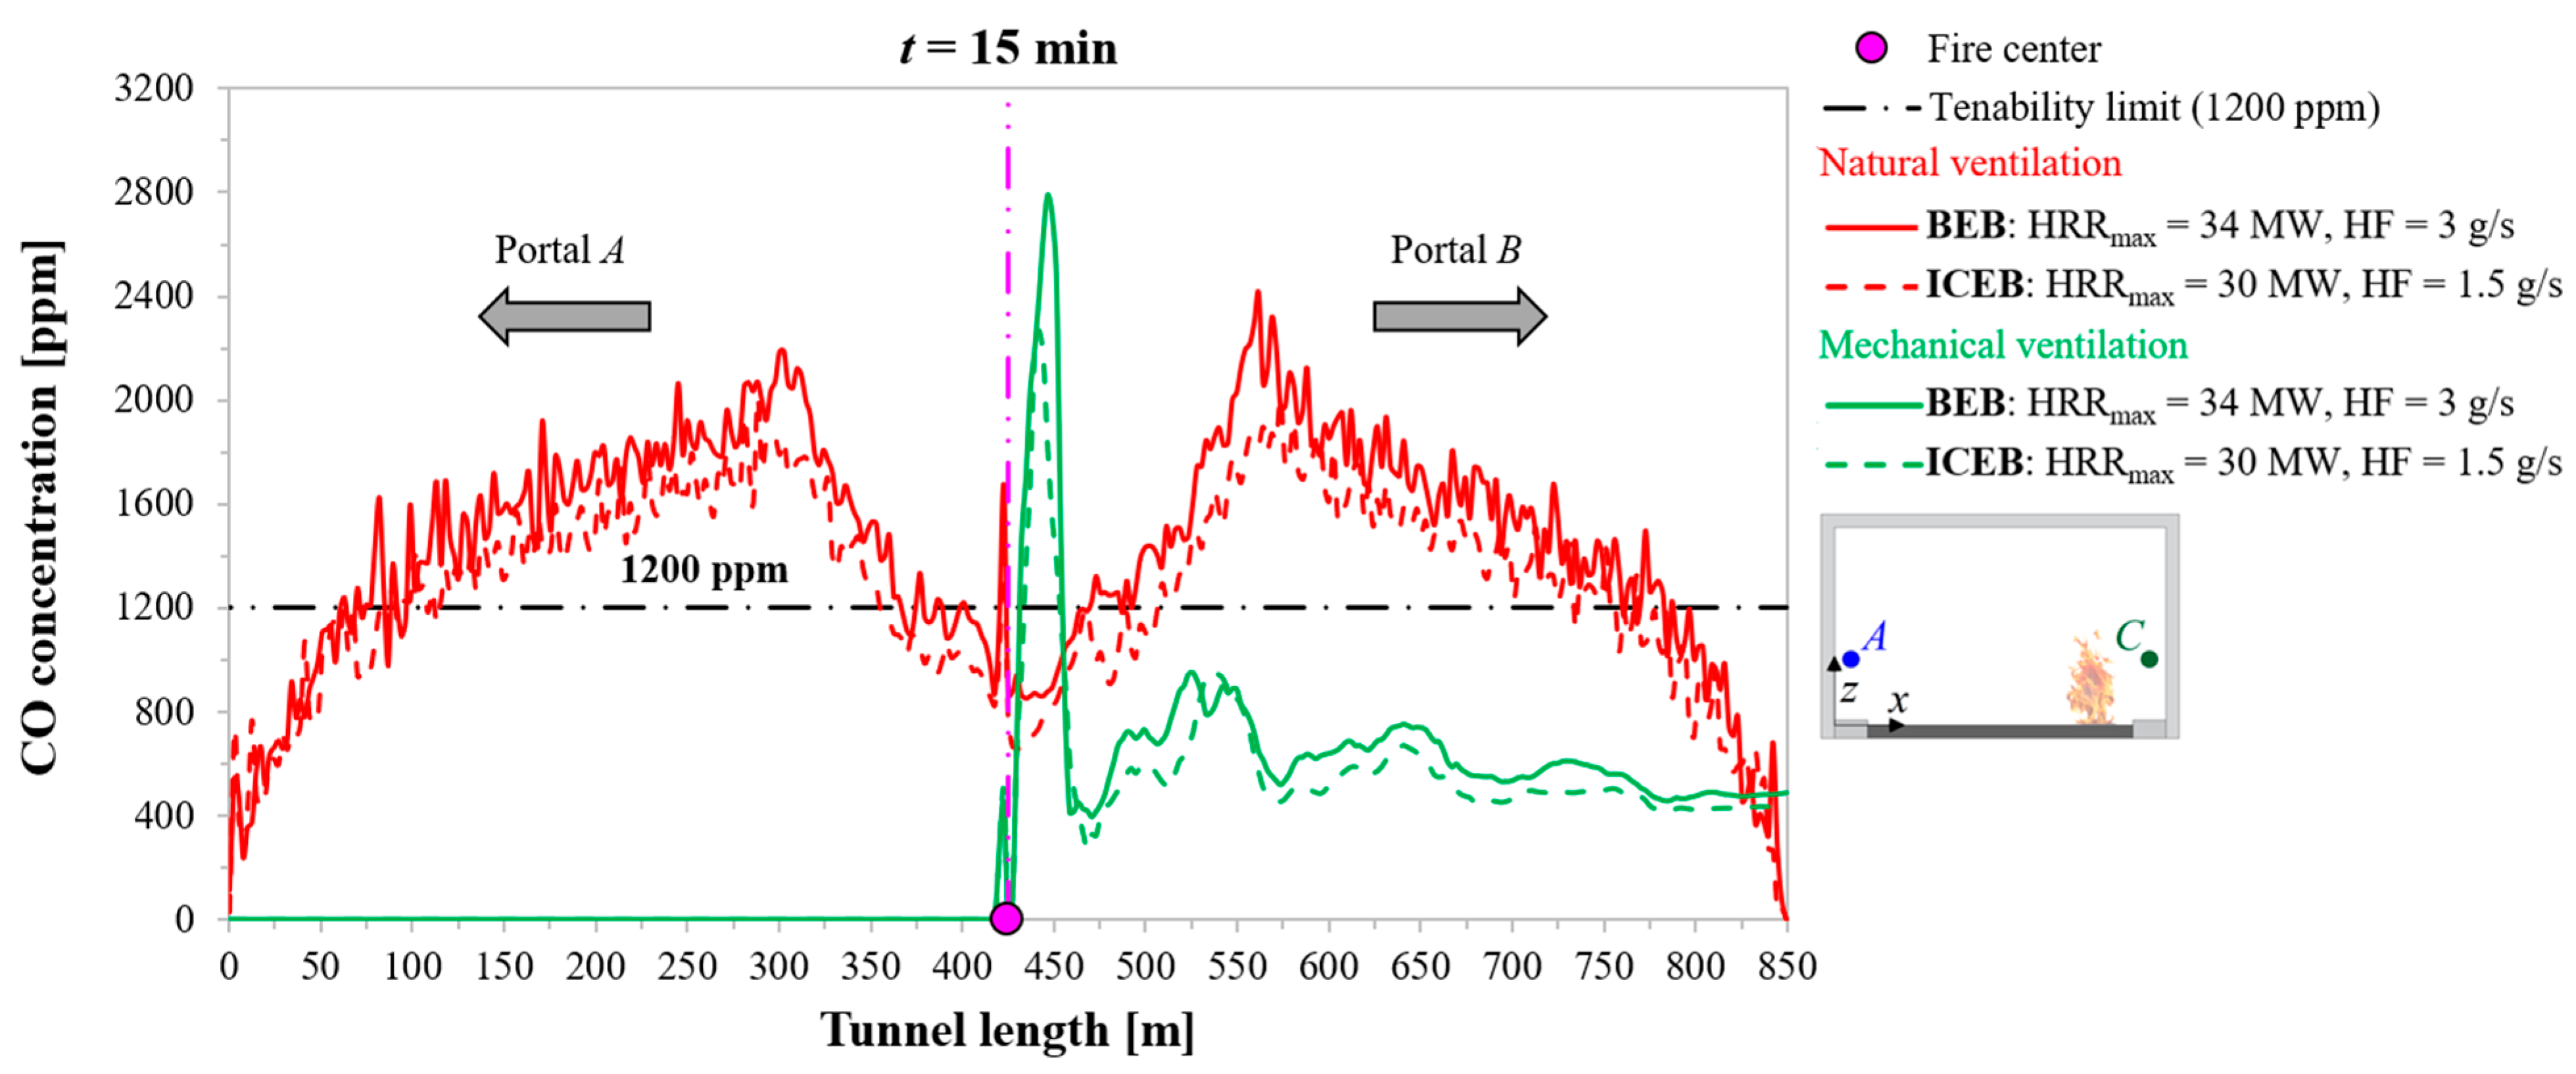
6.2.2. CO Concentration
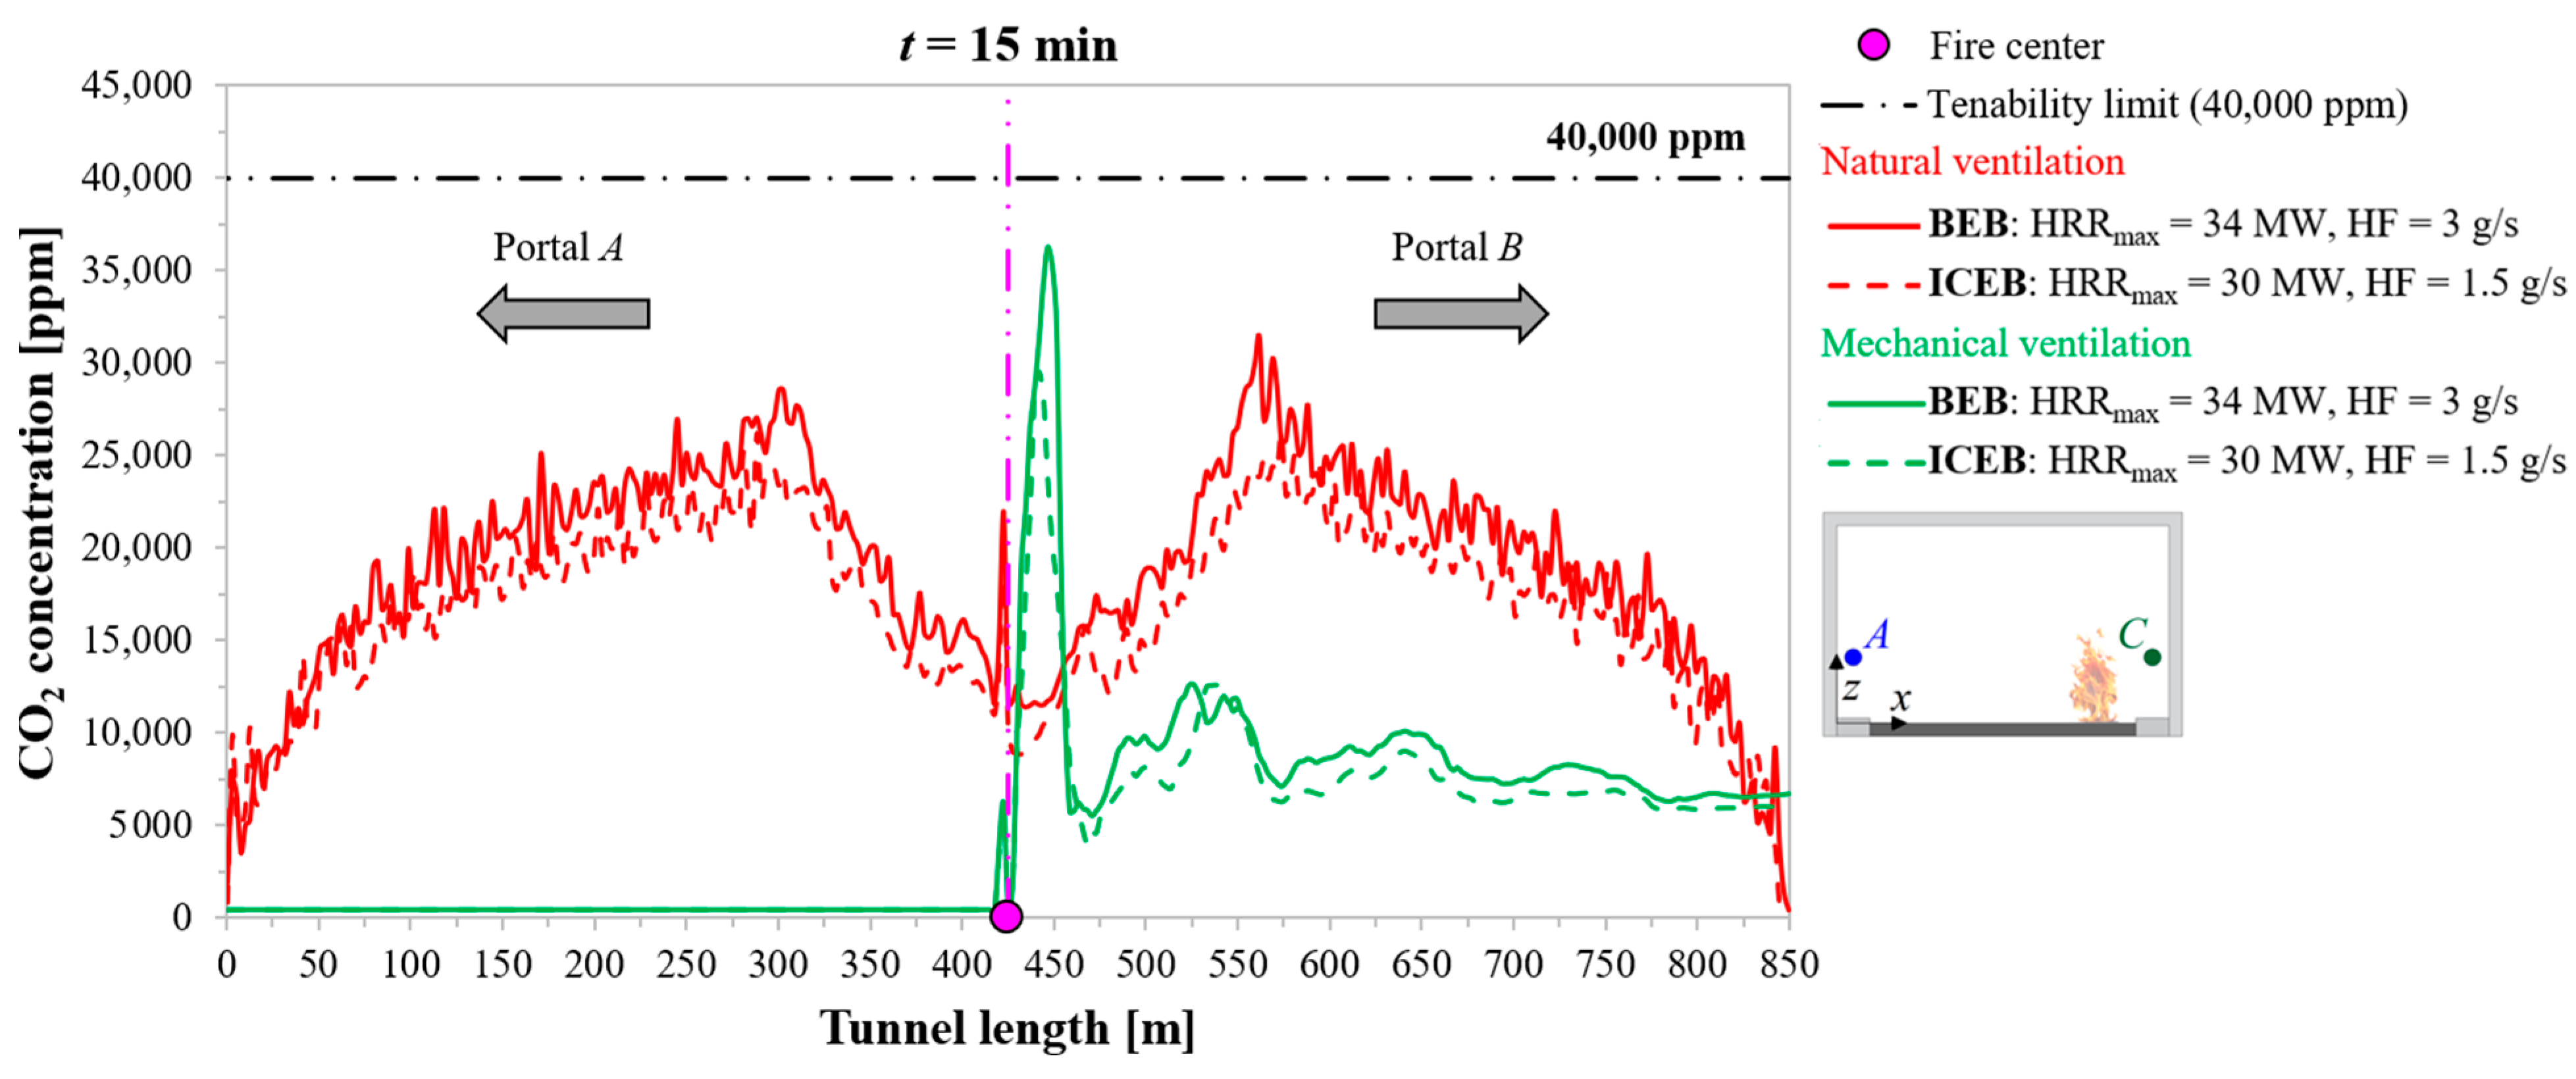
6.2.3. CO2 Concentration
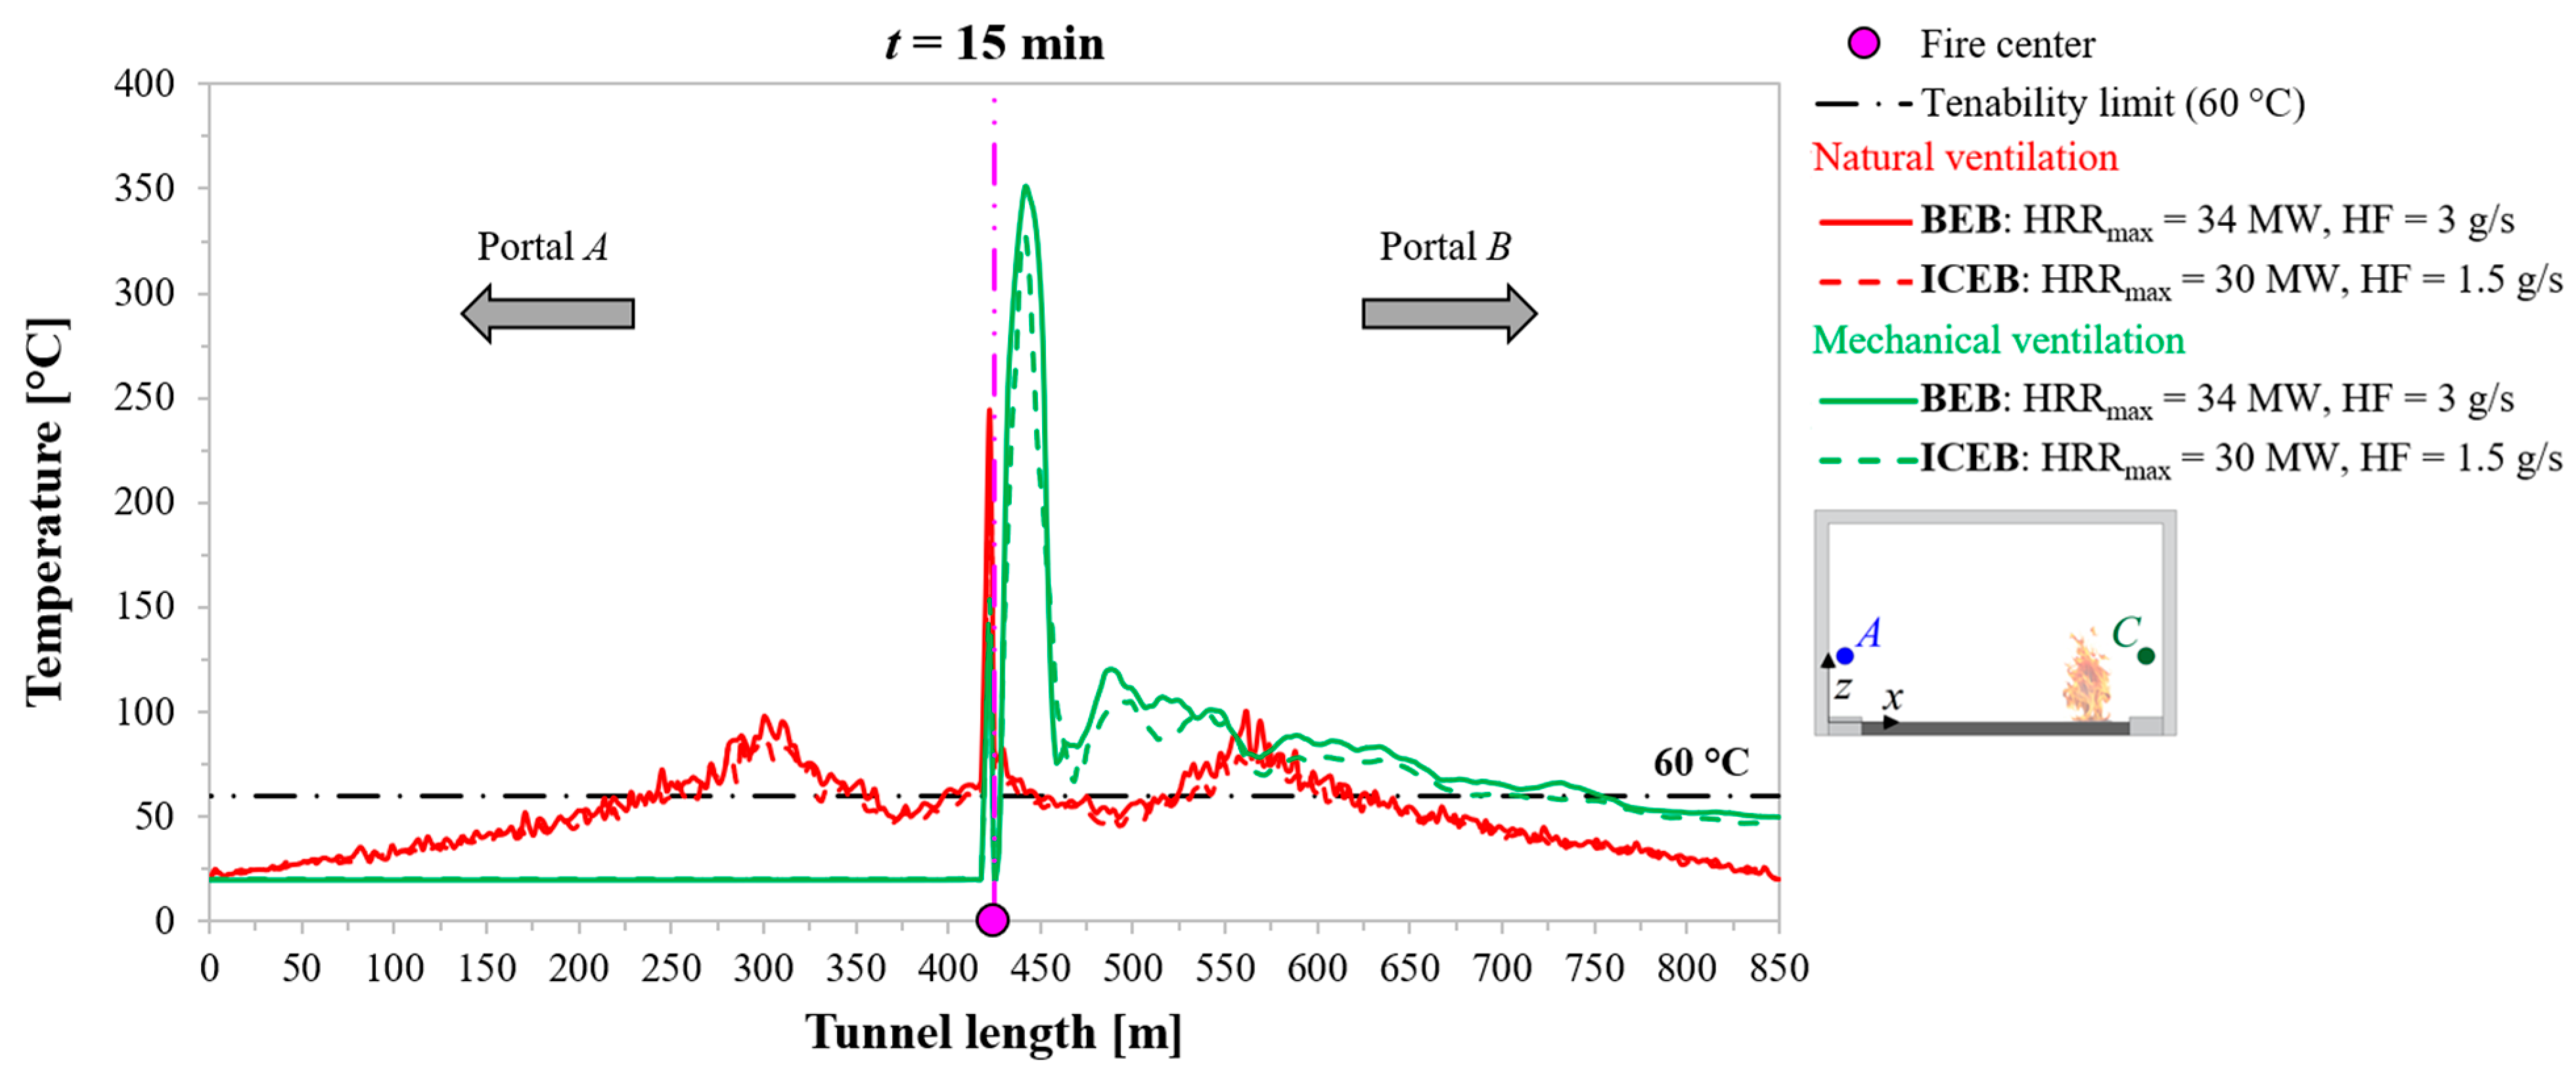
6.2.4. Temperature
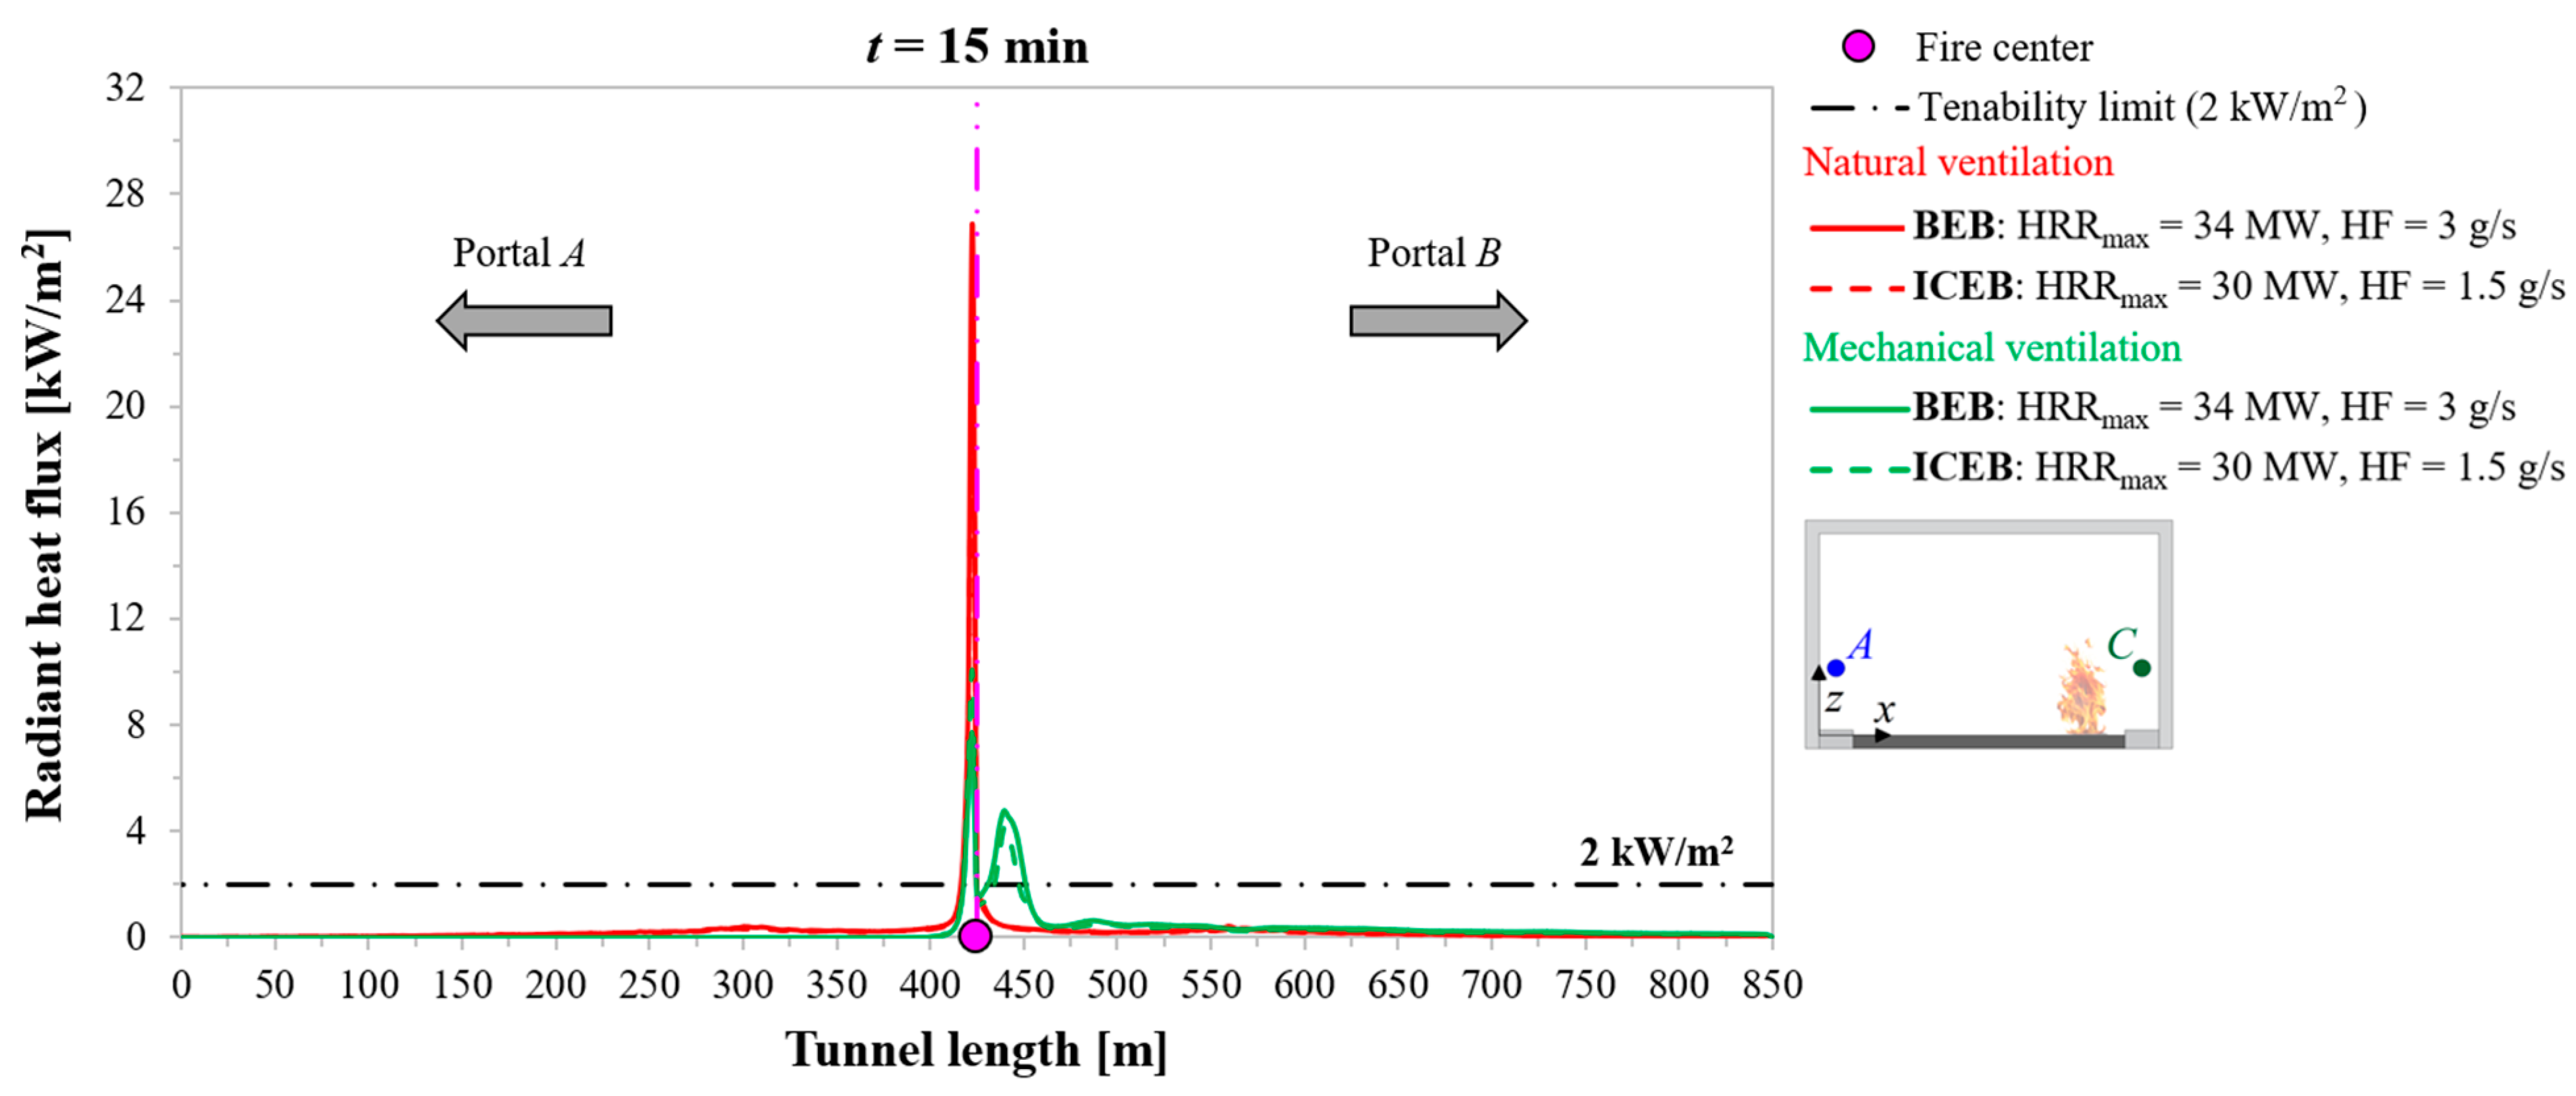
6.2.5. Radiant Heat Flux
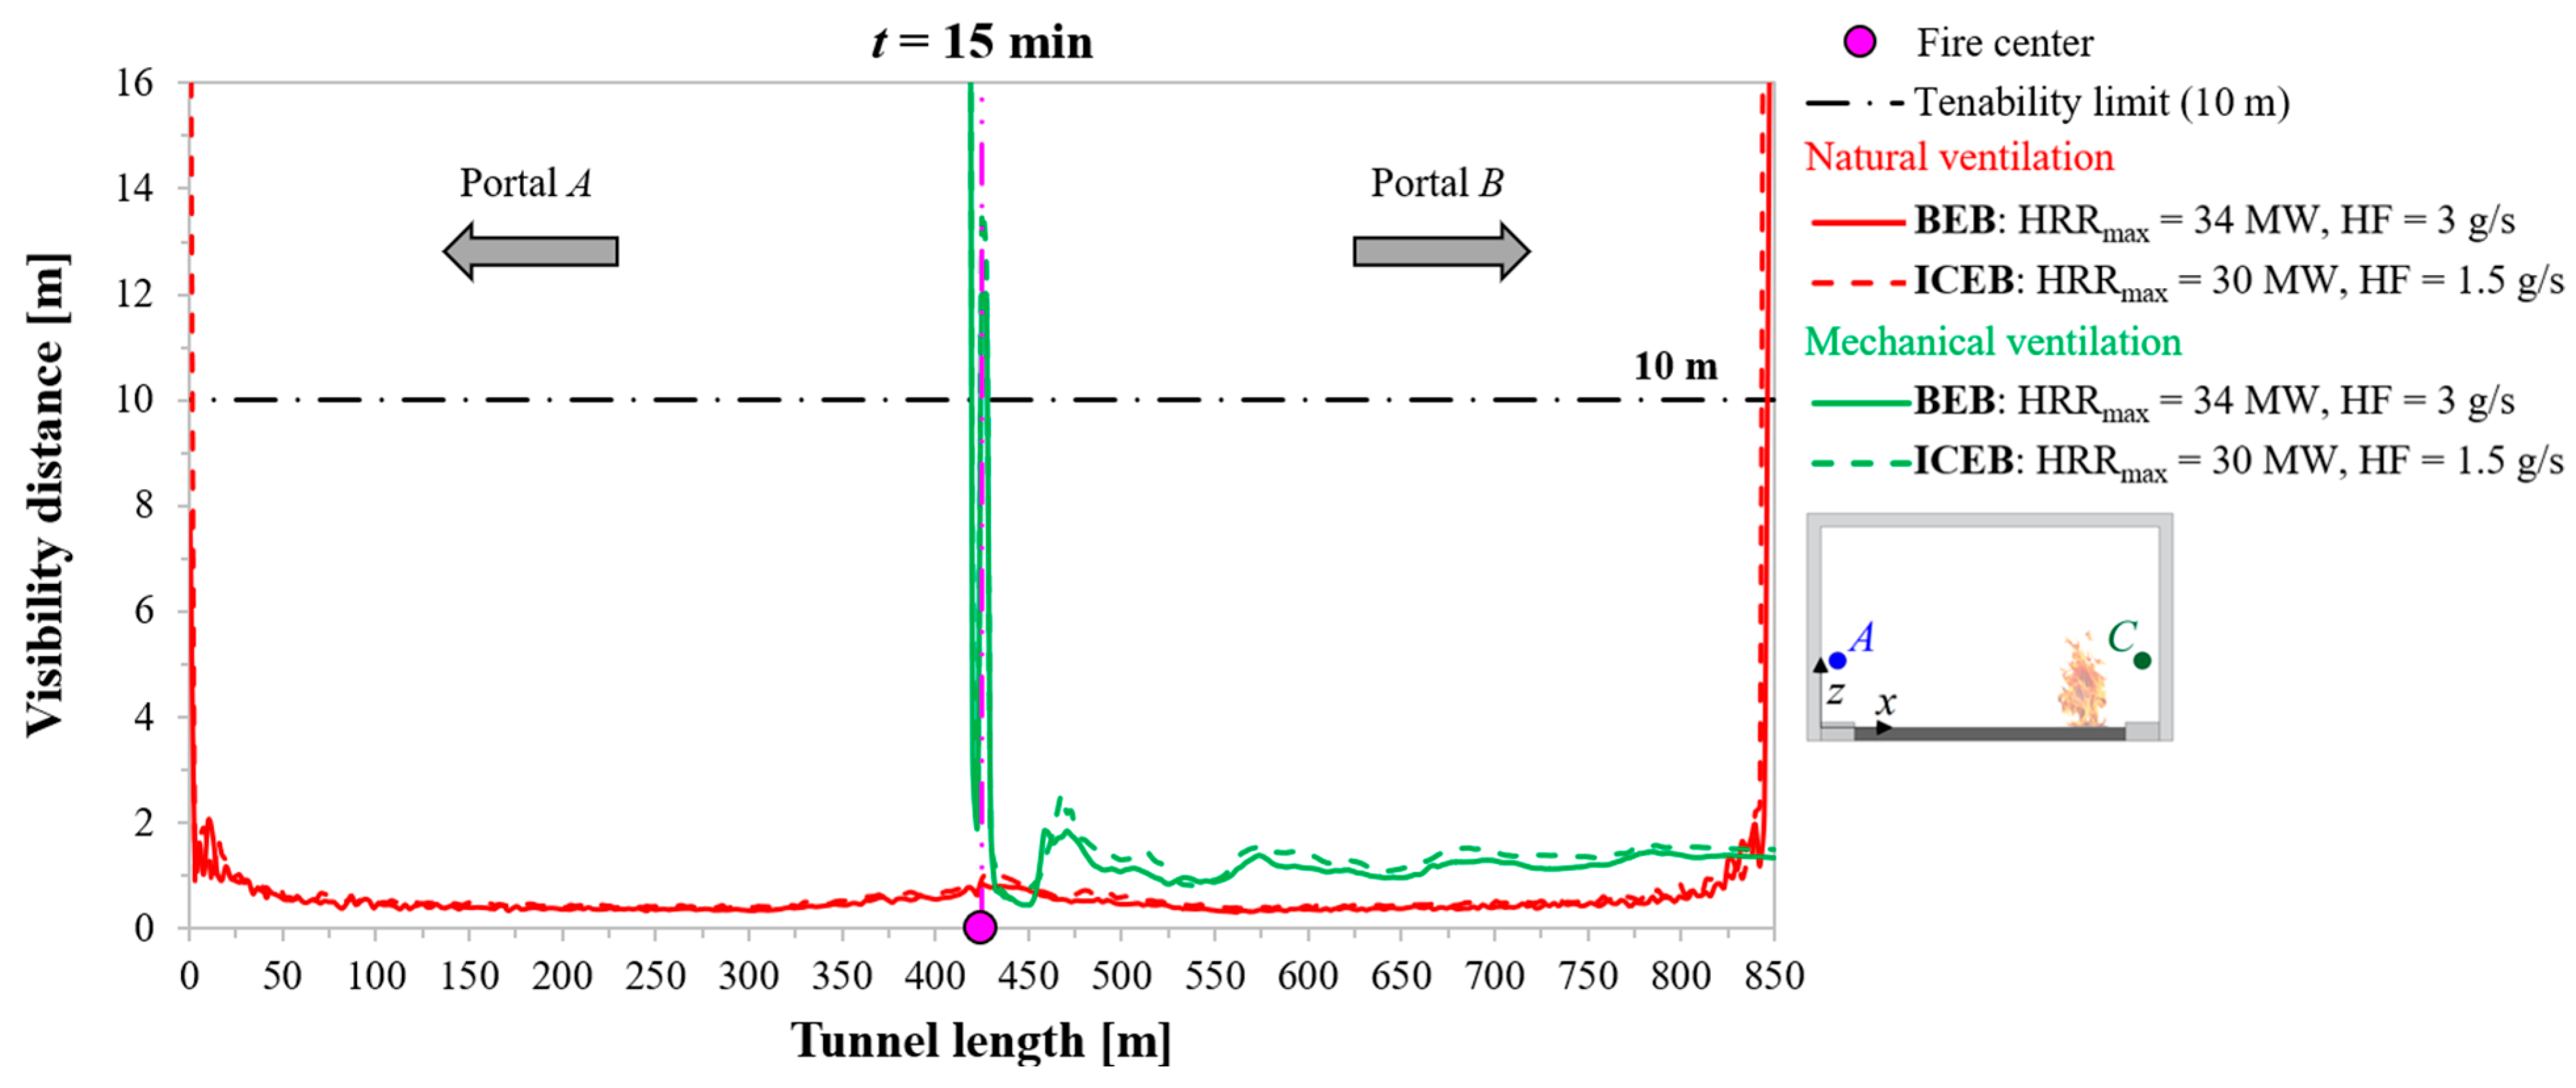
6.2.6. Visibility Distance
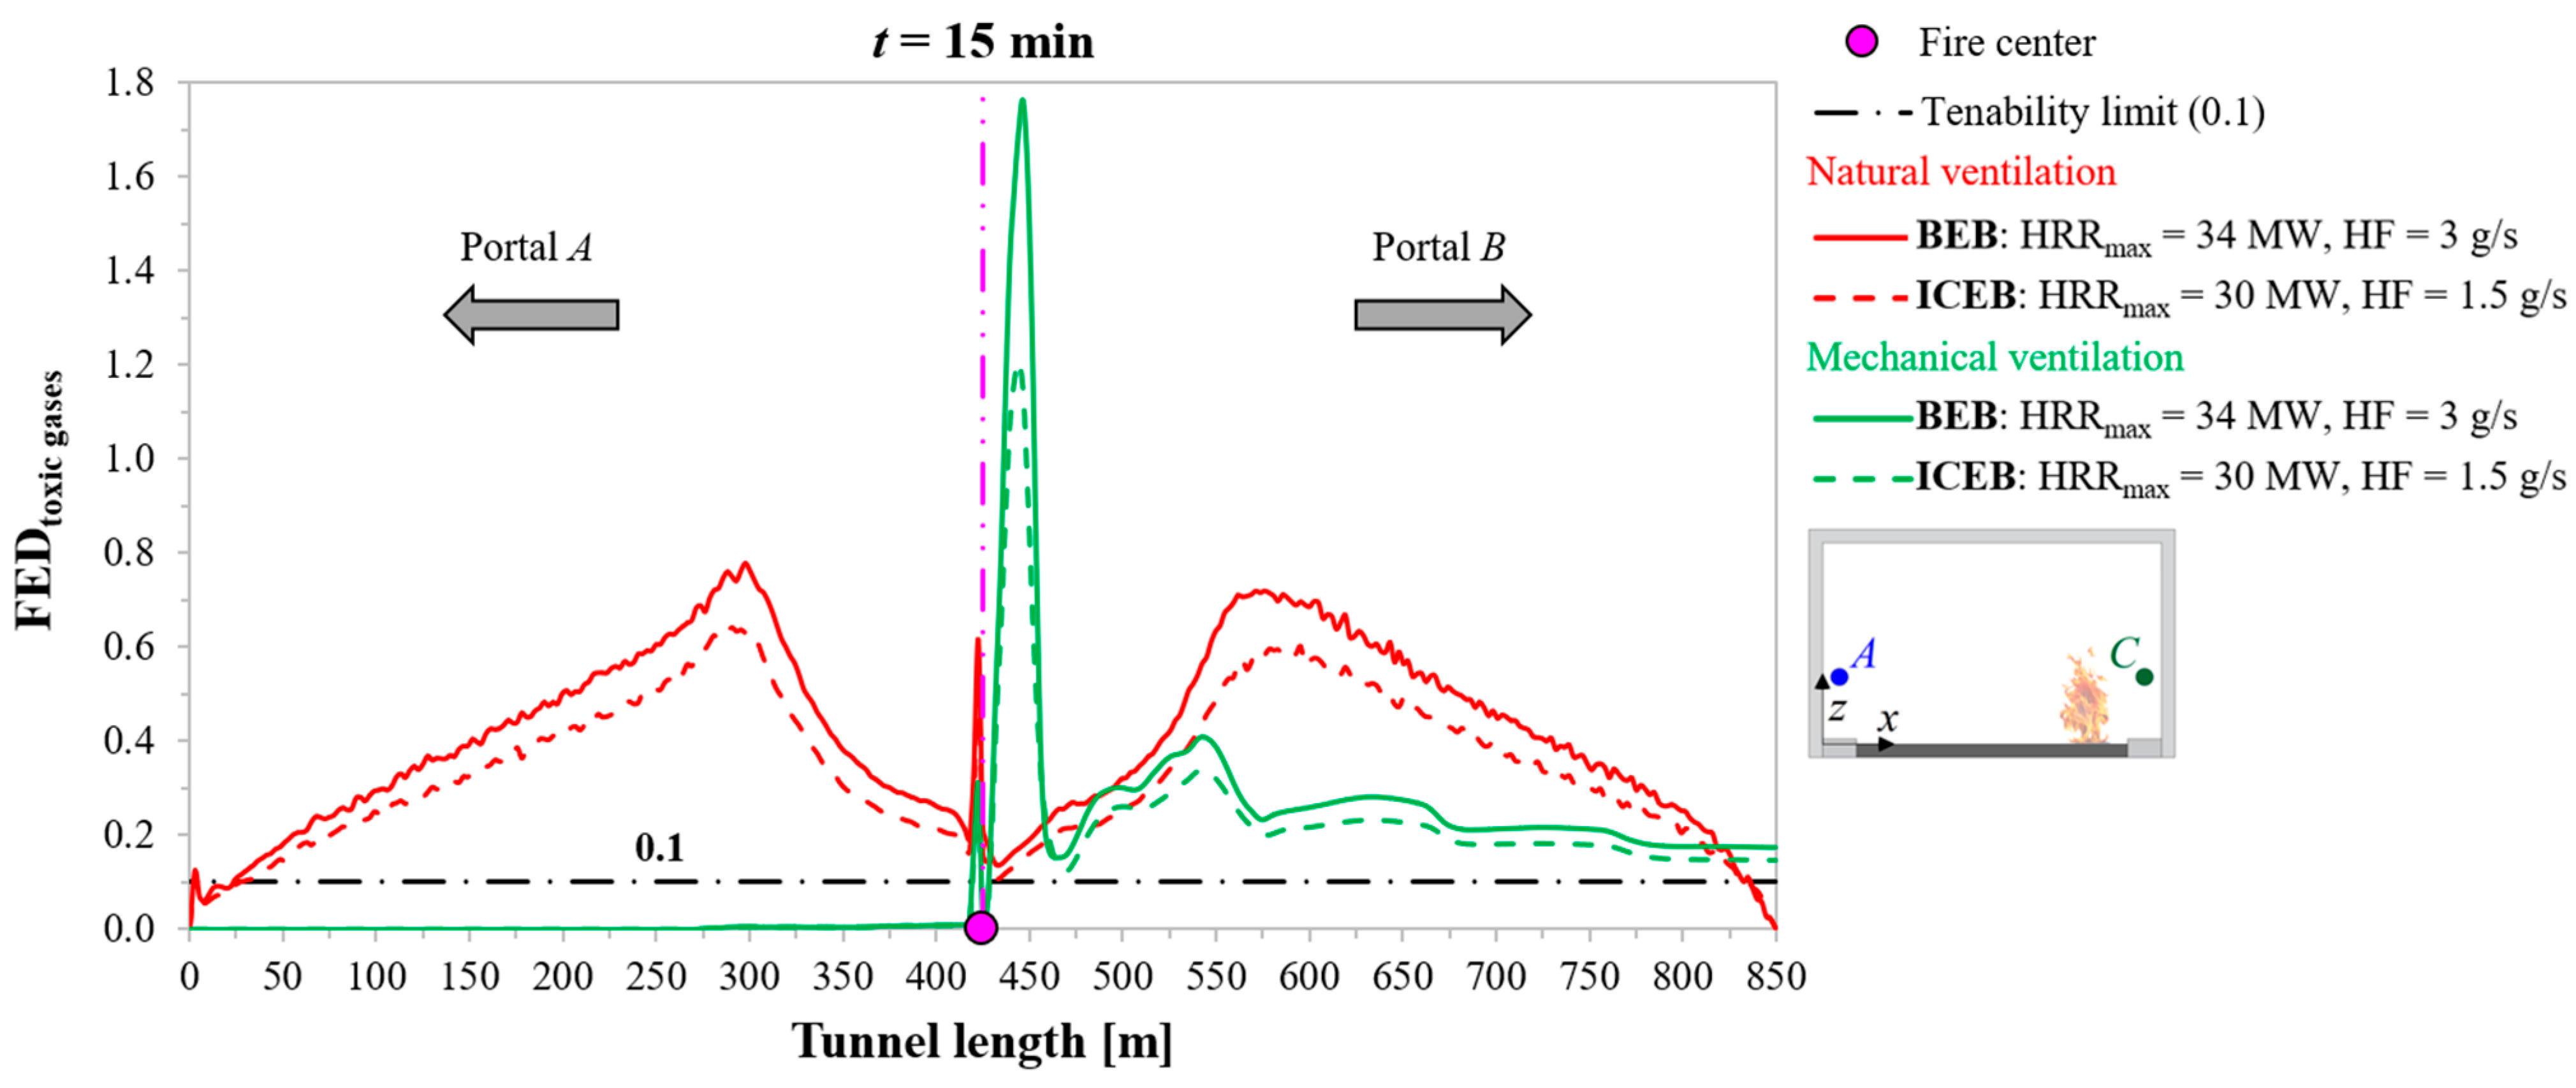
6.2.7. FEDtoxic gases
7. Considerations and Discussions
8. Summary and Conclusions
Author Contributions
Funding
Institutional Review Board Statement
Informed Consent Statement
Data Availability Statement
Conflicts of Interest
Nomenclature
| Symbol | Unit | Description |
| BEB | Battery Electric Bus | |
| BEC | Battery Electric Car | |
| BEV | Battery Electric Vehicle | |
| CFD | Computational Fluid Dynamics | |
| CN | Cyanide | |
| CO | ppm | Carbon Monoxide |
| EU | European Union | |
| EV | Electric Vehicle | |
| FDS | Fire Dynamics Simulator | |
| FED | Fractional Effective Dose | |
| m/s2 | Gravity Acceleration | |
| HF | ppm | Hydrogen Fluoride |
| HGV | Heavy Goods Vehicle | |
| HRR | MW | Heat Release Rate |
| ICEB | Internal Combustion Engine Bus | |
| ICEC | Internal Combustion Engine Car | |
| ICEV | Internal Combustion Engine Vehicle | |
| LIB | Lithium-Ion Battery | |
| NIST | National Institute of Standards and Technology | |
| NECs | New Energy Carriers | |
| PHEV | Plug-in Hybrid Electric Vehicle | |
| kW | HRR | |
| SOC | State Of Charge | |
| t | min | Time |
| x | m | Distance from the Wall γ |
| z | m | Distance from the Road Surface |
| Greek symbols | Unit | Description |
| m | Nominal Size of a Mesh Cell | |
| ΔP | Pa | Pressure Difference |
| kg/m3 | Density of Air | |
| Sup- and subscripts | Unit | Description |
| EB | Wh | Battery Energy |
| J/(kgK) | Specific Heat of Air | |
| CO2 | ppm | Carbon Dioxide |
| m | Characteristic Fire Diameter | |
| Fraction of an Incapacitating Dose of CN | ||
| Fraction of an Incapacitating Dose of CO | ||
| Fraction of an Incapacitating Dose of NOx | ||
| Fraction of an Incapacitating Dose of Low O2 Hypoxia | ||
| FEDtoxic gases | Fractional Effective Dose due to Toxic Gases | |
| Fraction Lethal Dose of Irritants | ||
| HRRmax | MW | Maximum Heat Release Rate |
| Hyperventilation Factor due to CO2 | ||
| NOx | Nitrogen Oxides | |
| O2 | Oxygen | |
| t0 | s | Time at Which the Fire Occurs |
| °C | Ambient Temperature | |
| talarm | s | Fire Alarm System Activation Time |
| tmax | min | Time to Reach the HRRmax |
References
- European Commission. The European Green Deal; European Commission: Brussels, Belgium, 2019; Available online: https://eur-lex.europa.eu/legal-content/EN/TXT/PDF/?uri=CELEX:52019DC0640&from=IT (accessed on 20 June 2024).
- European Environment Agency. New Registrations of Electric Vehicles in Europe. 2023. Available online: https://www.eea.europa.eu/en/analysis/indicators/new-registrations-of-electric-vehicles?activeAccordion=ecdb3bcf-bbe9-4978-b5cf-0b136399d9f8 (accessed on 20 June 2024).
- ACEA. New Car Registrations; European Union. 2024. Available online: https://www.acea.auto/files/Press_release_car_registrations_full_year_2023.pdf (accessed on 20 June 2024).
- ACEA. New Commercial Vehicle Registrations; European Union. 2024. Available online: https://www.acea.auto/files/Press_release_commercial_vehicle_registrations_2023.pdf (accessed on 20 June 2024).
- Sun, P.; Bisschop, R.; Niu, H.; Huang, X. A review of battery fires in electric vehicles. Fire Technol. 2020, 56, 1361–1410. [Google Scholar] [CrossRef]
- Wang, X.; Wang, M.; Jiang, R.; Xu, J.; Li, B.; Wang, X.; Lei, M.; Su, P.; Liu, C.; Yang, Q.; et al. Impact of battery electric vehicles on ventilation design for road tunnels: A review. Tunn. Undergr. Space Technol. 2023, 134, 105013. [Google Scholar] [CrossRef]
- The National Institute for Occupational Safety and Health (NIOSH). Immediately Dangerous To Life or Health (IDLH) Values . 1994. Available online: https://www.cdc.gov/niosh/idlh/7664393.html (accessed on 20 June 2024).
- Lecocq, A.; Bertana, M.; Truchot, B.; Marlair, G. Comparison of the fire consequences of an electric vehicle and an internal combustion engine vehicle. In Proceedings of the International Conference on Fires in Vehicles—FIVE 2012, Chicago, IL, USA, 27–28 September 2012; pp. 183–194. [Google Scholar]
- Watanabe, N.; Sugawa, O.; Suwa, T.; Ogawa, Y.; Hiramatsu, M.; Tomonori, H.; Miyamoto, H.; Okamoto, K.; Honma, M. Comparison of fire behaviors of an electric-battery-powered vehicle and gasoline-powered vehicle in a real-scale fire test. In Proceedings of the 2nd International Conference on Fires in Vehicles-FIVE, Chicago, IL, USA, 27–28 September 2012. [Google Scholar]
- Blum, A.; Long, R.T. Full-scale Fire Tests of Electric Drive Vehicle Batteries. SAE Int. J. Passeng. Cars Mech. Syst. 2015, 8, 565–572. [Google Scholar] [CrossRef]
- Lam, C.; MacNeil, D.; Kroeker, R.; Lougheed, G.; Lalime, G. Full-scale fire testing of electric and internal combustion engine vehicles. In Proceedings of the 4th International Conference on Fire in Vehicle, Baltimore, MD, USA, 5–6 October 2016. [Google Scholar]
- Truchot, B.; Fouillen, F.; Collet, S. An experimental evaluation of toxic gas emissions from vehicle fires. Fire Saf. J. 2018, 97, 111–118. [Google Scholar] [CrossRef]
- Willstrand, O.; Bisschop, R.; Blomqvist, P.; Temple, A.; Anderson, J. Toxic Gases from Fire in Electric Vehicles; RISE Research Institutes of Sweden: Goteborg, Sweden, 2020; Available online: https://www.diva-portal.org/smash/get/diva2:1522149/FULLTEXT01.pdf (accessed on 20 June 2024).
- Król, M.; Król, A. The Threats Related to Parking Electric Vehicle in Underground Car Parks. In Intelligent Solutions for Cities and Mobility of the Future; Sierpiński, G., Ed.; TSTP 2021; Lecture Notes in Networks and Systems; Springer: Cham, Switzerland, 2021; Volume 352. [Google Scholar]
- Dorsz, A.; Lewandowski, M. Analysis of Fire Hazards Associated with the Operation of Electric Vehicles in Enclosed Structures. Energies 2022, 15, 11. [Google Scholar] [CrossRef]
- Sturm, P.; Fößleitner, P.; Fruhwirt, D.; Galler, R.; Wenighofer, R.; Heindl, S.F.; Krausbar, S.; Heger, O. Fire tests with lithium-ion battery electric vehicles in road tunnels. Fire Saf. J. 2022, 134, 103695. [Google Scholar] [CrossRef]
- Hynynen, J.; Willstrand, O.; Blomqvist, P.; Andersson, P. Analysis of combustion gases from large-scale electric vehicle fire tests. Fire Saf. J. 2023, 139, 103829. [Google Scholar] [CrossRef]
- Kang, S.; Kwon, M.; Choi, J.Y.; Choi, S. Full-scale fire testing of battery electric vehicles. Appl. Energy 2023, 332, 120497. [Google Scholar] [CrossRef]
- Raza, H.; Li, S. The impact of battery electric bus fire on road tunnel. Expanding Underground–Knowledge and Passion to Make a Positive Impact on the World. In Proceedings of the ITA-AITES World Tunnel Congress 2023 (WTC 2023), Athens, Greece, 12–18 May 2023; pp. 3280–3288. [Google Scholar] [CrossRef]
- Gao, Y.; Jiang, C.; Cui, K.; Fu, Q.; Li, Y. Numerical study on the effects of blocking ratio and spraying angle on the smoke flow characteristics of new energy vehicle fires in tunnels. Therm. Sci. Eng. Prog. 2023, 42, 101927. [Google Scholar] [CrossRef]
- Bai, Z.P.; Yu, Y.Y.; Zhang, J.Y.; Hu, H.M.; Xing, M.Y.; Yao, H.W. Study on fire characteristics of lithium battery of new energy vehicles in a tunnel. Process Saf. Environ. Prot. 2024, 186, 728–737. [Google Scholar] [CrossRef]
- Hodges, J.L.; Salvi, U.; Kapahi, U. Design fire scenarios for hazard assessment of modern battery electric and internal combustion engine passenger vehicles. Fire Saf. J. 2024, 146, 104145. [Google Scholar] [CrossRef]
- Zhao, C.; Hu, W.; Meng, D.; Mi, W.; Wang, X.; Wang, J. Full-scale experimental study of the characteristics of electric vehicle fires process and response measures. Case Stud. Therm. Eng. 2024, 53, 103889. [Google Scholar] [CrossRef]
- Yao, H.; Xing, M.; Song, H.; Zhang, Y.; Luo, S.; Bai, Z. The Impact of Different Ventilation Conditions on Electric Bus Fires. Fire 2024, 7, 182. [Google Scholar] [CrossRef]
- McGrattan, K.; Hostikka, S.; Floyd, J.; McDermott, R.; Vanella, M. Fire Dynamics Simulator: User’s Guide, 6th ed.; National Institute of Standards and Technology, Fire Research Division, Engineering Laboratory: Gaithersburg, MD, USA, 2019.
- Korhonen, T. Fire Dynamic Simulator with Evacuation: FDS + Evac Technical Reference and User’s Guide; VTT Technical Research Centre of Finland: Espoo, Finland, 2018. [Google Scholar]
- European Parliament and Council. Directive 2004/54/EC. Off. J. Eur. Union 2004, L.167, 39–91. [Google Scholar]
- Caliendo, C.; Russo, I. CFD Simulation to Assess the Effects of Asphalt Pavement Combustion on User Safety in the Event of a Fire in Road Tunnels. Fire 2024, 7, 195. [Google Scholar] [CrossRef]
- Caliendo, C.; Ciambelli, P.; De Guglielmo, M.L.; Meo, M.G.; Russo, P. Computational analysis of fire and people evacuation for different positions of burning vehicles in a road tunnel with emergency exits. Cogent Eng. 2018, 5, 1530834. [Google Scholar] [CrossRef]
- Bonati, A.; Rainieri, S.; Bochicchio, G.; Tessadri, B.; Giuliani, F. Characterization of thermal properties and combustion behaviour of asphalt mixtures in the cone calorimeter. Fire Saf. J. 2015, 74, 25–31. [Google Scholar] [CrossRef]
- Schrefler, B.A.; Brunello, P.; Gawin, D.; Majorana, C.E.; Pesavento, F. Concrete at high temperature with application to tunnel fire. Comput. Mech. 2002, 29, 43–51. [Google Scholar] [CrossRef]
- National Research Council. HCM 2010: Highway Capacity Manual; Transportation Research Board: Washington, DC, USA, 2010; Volume 2, ISBN 9788578110796. [Google Scholar]
- NFPA. NFPA 502: Standard for Road Tunnels, Bridges, and Other Limited Access Highways; National Fire Protection Agency: Quincy, MA, USA, 2020; ISBN 978-145592341-0. [Google Scholar]
- Bi, K.; Qiu, R.; Jiang, Y.; Zheng, J. Reconstruction of a bus fire based on numerical simulation. J. China Univ. Sci. Technol. 2010, 40, 387–394. [Google Scholar]
- Li, Y.Z. Study of fire and explosion hazards of alternative fuel vehicles in tunnels. Fire Saf. J. 2019, 110, 102871. [Google Scholar] [CrossRef]
- Larsson, F.; Andersson, P.; Blomqvist, P.; Mellander, B.E. Toxic fluoride gas emissions from lithium-ion battery fires. Sci. Rep. 2017, 7, 10018. [Google Scholar] [CrossRef]
- Ribière, P.; Grugeon, S.; Morcrette, M.; Boyanov, S.; Laruelle, S.; Marlair, G. Investigation on the fire-induced hazards of Li-ion battery cells by fire calorimetry. Energy Environ. Sci. 2012, 5, 5271–5280. [Google Scholar] [CrossRef]
- Haack, A.; STUVA. FIT-European Thematic Network Fire in Tunnels. Design Fire Scenarios; Technical Report Part 1; European Commission: Brussels, Belgium, 2005. [Google Scholar]
- Steinert, C. Smoke and heat production in tunnel fires. In Proceedings of the International Conference on Fires in Tunnels, Boras, Sweden, 10–11 October 1994; pp. 123–137. [Google Scholar]
- Caliendo, C.; Ciambelli, P.; De Guglielmo, M.L.; Meo, M.G.; Russo, P. Numerical simulation of different HGV fire scenarios in curved bi-directional road tunnels and safety evaluation. Tunn. Undergr. Space Technol. 2012, 31, 33–50. [Google Scholar] [CrossRef]
- Caliendo, C.; Ciambelli, P.; De Guglielmo, M.L.; Meo, M.G.; Russo, P. Simulation of fire scenarios due to different vehicle types with and without traffic in a bi-directional road tunnel. Tunn. Undergr. Space Technol. 2013, 37, 22–36. [Google Scholar] [CrossRef]
- Ministry of the Interior. Modifiche All’Allegato 1 al Decreto del Ministro Dell’Interno 3 Agosto 2015, Recante «Approvazione di Norme Tecniche di Prevenzione Incendi, ai Sensi Dell’Articolo 15 del Decreto Legislativo 8 Marzo 2006, n. 139»; G.U., No. 41, Annex 1, Section M; Italian Ministry of the Interior: Rome, Italy, 2019.
- Xie, B.; Zhang, S.; Xu, Z.; He, L.; Xi, B.; Wang, M. Experimental study on vertical evacuation capacity of evacuation slide in road shield tunnel. Tunn. Undergr. Space Technol. 2020, 97, 103250. [Google Scholar] [CrossRef]
- CFPA Europe. Fire Safety Engineering Concerning Evacuation from Buildings. Guidelines No 19: 2009. CFPA Eur. 2009. Available online: https://cfpa-e.eu/app/uploads/2022/05/CFPA_E_Guideline_No_19_2009.pdf (accessed on 20 June 2024).
- UPTUN. Workpackage 2—Fire Development and Mitigation Measures. 2008. Available online: https://fogtec-international.com/files/uptun-guideline-08_30.08.07.pdf (accessed on 20 June 2024).
- Sturm, P.; Fößleitner, P.; Fruhwirt, D.; Heindl, S.F.; Heger, O.; Galler, R.; Wenighofer, R.; Krausbar, S. “BRAFA”–Brandauswirkungen von Fahrzeugen mit alternativen Antriebssystemen; Graz University of Technology: Graz, Austria, 2021. [Google Scholar] [CrossRef]
- Caliendo, C.; Guglielmo, M.L. Quantitative risk analysis based on the impact of traffic flow in a road tunnel. Int. J. Math. Comput. Simul. 2016, 10, 39–45. [Google Scholar]


| Year | Ref. | Study Methods | Scope |
|---|---|---|---|
| 2012 | [8] | Full-scale fire tests in an experimental tunnel facility | To compare the fire consequences of equivalent BECs and ICECs |
| 2012 | [9] | Full-scale fire tests in a fire room | To compare the risk associated with the fire of a BEC rather than an analogous ICEC |
| 2015 | [10] | Full-scale fire suppression tests in an open-space environment | To investigate whether tactical changes related to emergency response procedures are required to address BEC fires |
| 2016 | [11] | Full-scale fire tests in a burn hall | To compare the heat flux and HRR of similar BECs and ICECs subjected to external fire conditions |
| 2018 | [12] | Full-scale fire tests in an experimental tunnel facility | To compare the fire consequences of a BEC and its ICEC counterpart |
| 2020 | [13] | Full-scale fire tests inside a fire hall and numerical simulations in an enclosed garage | To evaluate the gases and heat released by the fire of similar battery electric and internal combustion engine full-size vans |
| 2021 | [14] | Numerical simulations in an underground garage | To assess the temperature distribution and the HF spread during a BEC fire |
| 2022 | [15] | Numerical simulations in an underground garage | To compare the consequences on user safety and property due to a fire involving a BEC and a similar ICEC |
| 2022 | [16] | Full-scale fire tests in a road tunnel | To evaluate the heat and toxic gases released by the fire of equivalent BEVs and ICEVs (i.e., vans and cars), while also investigating the efficiency of certain firefighting methods |
| 2023 | [17] | Full-scale fire tests inside a fire hall | To examine the effects on the fire consequences of a BEC and an analogous ICEC because of a sprinkler system |
| 2023 | [18] | Full-scale fire tests in an open-space environment | To assess the hazards due to the fire of a BEC and its ICEC counterpart |
| 2023 | [19] | Numerical simulations in a short road tunnel | To investigate the fire consequences of a BEB and a similar ICEB |
| 2023 | [6] | Review of studies | To evaluate the impact of BEVs (i.e., cars and light commercial vehicles) on ventilation design for road tunnels |
| 2023 | [20] | Numerical modeling | To analyze the impact of different blocking ratios and water mist spray angles in the event of electric vehicle fires in road tunnels |
| 2024 | [21] | Numerical modeling | To assess the safety of LIBs for electric cars in the event of a fire in a naturally ventilated road tunnel |
| 2024 | [22] | Prediction modeling | To predict the HRR curve over time of large BEVs and ICEVs (e.g., large SUVs) by extrapolating existing data from full-scale fire tests carried out on relatively small BEVs and ICEVs (e.g., cars) |
| 2024 | [23] | Full-scale fire tests in an open-space environment | To evaluate the suppression ability of compressed air foam, water spray, and fire blankets on BEC fires |
| 2024 | [24] | Numerical modeling | To analyze the temperatures and CO concentrations inside an electric bus generated by the fire of only its LIB |
| Material | Specific Heat [kJ/(kgK)] | Apparent Density [kg/m3] | Thermal Conductivity [W/(mK)] | Emissivity Coefficient [−] |
|---|---|---|---|---|
| Asphalt mixture | 0.88 | 2275 | 0.56 | 0.91 |
| Cement concrete | 0.94 | 2585 | 1.67 | 0.90 |
| Burning Vehicle | HRRmax [MW] | HF [g/s] | Natural Ventilation | Mechanical Ventilation |
|---|---|---|---|---|
| Distance Downstream of the Fire Center of the Last User Escaping toward Portal B after tmax = 9 min from the Fire Start (Their Average Effective Walking Speed): | ||||
| BEB | 34 | 3 | 150 m (0.417 m/s) | 63 m (0.175 m/s) |
| ICEB | 30 | 1.5 | 157 m (0.436 m/s) | 69 m (0.192 m/s) |
Disclaimer/Publisher’s Note: The statements, opinions and data contained in all publications are solely those of the individual author(s) and contributor(s) and not of MDPI and/or the editor(s). MDPI and/or the editor(s) disclaim responsibility for any injury to people or property resulting from any ideas, methods, instructions or products referred to in the content. |
© 2024 by the authors. Licensee MDPI, Basel, Switzerland. This article is an open access article distributed under the terms and conditions of the Creative Commons Attribution (CC BY) license (https://creativecommons.org/licenses/by/4.0/).
Share and Cite
Caliendo, C.; Russo, I.; Genovese, G. A Numerical Evaluation for Estimating the Consequences on Users and Rescue Teams Due to the Fire of an Electric Bus in a Road Tunnel. Appl. Sci. 2024, 14, 9191. https://doi.org/10.3390/app14209191
Caliendo C, Russo I, Genovese G. A Numerical Evaluation for Estimating the Consequences on Users and Rescue Teams Due to the Fire of an Electric Bus in a Road Tunnel. Applied Sciences. 2024; 14(20):9191. https://doi.org/10.3390/app14209191
Chicago/Turabian StyleCaliendo, Ciro, Isidoro Russo, and Gianluca Genovese. 2024. "A Numerical Evaluation for Estimating the Consequences on Users and Rescue Teams Due to the Fire of an Electric Bus in a Road Tunnel" Applied Sciences 14, no. 20: 9191. https://doi.org/10.3390/app14209191