Article

High-Sensitivity Displacement Sensor Using Few-Mode Optical Fibers and the Optical Vernier Effect

by
Luis E. Guillen-Ruiz
1,
Gilberto Anzueto-Sánchez
2,*,
Alejandro Martínez-Rios
2,
Myriam C. Jiménez-Mares
2 and
Javier A. Martin-Vela
3
1
Tecnológico Nacional de México, Instituto Tecnológico de Tuxtla Gutiérrez, Tuxtla Gutiérrez 29050, Chiapas, Mexico
2
Centro de Investigaciones en Óptica, A.C., León 37150, Guanajuato, Mexico
3
Tecnológico Nacional de México, Instituto Tecnológico de Conkal, Conkal 97345, Yucatán, Mexico
*
Author to whom correspondence should be addressed.
Appl. Sci. 2024, 14(20), 9300; https://doi.org/10.3390/app14209300
Submission received: 19 September 2024 / Revised: 9 October 2024 / Accepted: 10 October 2024 / Published: 12 October 2024
(This article belongs to the Special Issue Recent Trends in Fiber Optic Sensor: Technology and Applications)

Abstract

:

Featured Application

The displacement sensor developed in this work provides a robust and highly sensitive solution for measuring small displacements in industrial and scientific environments. It can be employed in precision machinery, robotics, and instrumentation, where detecting minimal movements with high accuracy is critical. Additionally, it holds potential for applications in optical metrology, structural health monitoring, and micro-mechanical systems, providing an adaptable and cost-effective tool for precise displacement measurements.

Abstract

This paper presents a displacement sensor designed to achieve the Optical Vernier Effect (OVE) through a simple yet robust configuration, enhancing sensitivity and precision in small displacement measurements. The sensor structure comprises a few-mode fiber (FMF) placed between two single-mode fibers (SMF) in an SMF-FMF-SMF (SFS) configuration. A series of distinct configurations of concatenated Mach–Zehnder fiber interferometers (MZFI) were examined, with the lengths of the reference FMF (FMFRef) and sensing FMF (FMFSen) adjusted to track the spectral envelope shifts. The results demonstrate that the direction of the spectral shift is governed by the ratio between the FMFRef and FMFSen lengths. The sensor achieved a sensitivity of up to 39.07 nm/mm and a magnification factor (M factor) of up to 50.09, demonstrating exceptional precision and adaptability across a range of applications. The proposed configuration also enhances the overall sensor performance, highlighting its potential for broader use in fields requiring precise displacement monitoring.

1. Introduction

In recent years, optical fiber sensors have consistently shown advances in high-precision detection and increased sensitivity, largely driven by the implementation of the OVE. Two key conditions must be met to achieve this effect: first, the waveforms of the two spectra interference patterns must approximate cosine functions, and second, the spectra must exhibit a slight phase shift. The OVE has been successfully implemented by concatenating various types of interferometers, including Mach–Zehnder (MZI), Lyot (LI), Fabry–Perot (FPI), Sagnac (SI), and Michelson (MI), as well as hybrid configurations, across different structures and types of the optical fibers [1,2,3].
More recently, the use of FMF has gained popularity due to its ability to generate well-defined, high-contrast interference patterns. Notable contributions employing FMF for achieving the OVE are listed chronologically as follows: Liu et al. [4] developed a high-sensitivity strain sensor by concatenating an SI composed of polarization-maintaining fiber (PMF) and a fiber modal interferometer (FMI) with an SFS structure. Lu et al. [5] demonstrated a static pressure sensor employing two critical-length SFS structures, which provided temperature compensation. Li et al. [6] developed a high-sensitivity temperature sensor utilizing tapered two-mode fibers (TTMFs) arranged in series, with each TTMF in an SMF–TTMF–SMF configuration. Gomes et al. [7] presented a refractive index sensor using FPIs comprising FMF for the sensor and a hollow capillary tube placed between SMFs for reference. Jiang et al. [8] demonstrated a temperature sensor by concatenating two interferometers consisting of a glass capillary tube that connects SMF with FMF, coated at the end with polydimethylsiloxane (PDMS). Fu et al. [9] proposed a temperature sensor based on FMF filled with PDMS, utilizing two FPIs with an SMF–air microcavity–FMF–PDMS–FMF structure. Yang (Abbas) et al. [10] introduced a novel approach to improve sensitivity by employing a simulated reference arm (SRA) technique, achieving the OVE with a single Multimodal Interferometer (MMI) comprising FMF and a simulated reference signal. Deng et al. [11] also designed an ultra-sensitive strain sensor with two parallel FPIs, where the sensor FPI was composed of TTMF, and the reference FPI included a quartz capillary between two SMFs, forming air cavities. Zhang (Xu) et al. [12] reported a highly sensitive salinity sensor based on the virtual Vernier effect in a TTMF fiber with an SMF–TTMF–SMF structure.
While these approaches offer significant advances, certain limitations persist. The use of cascaded interferometers to achieve the OVE introduces complexities in system calibration and measurement [4]. Additionally, multimode fiber interferometers are susceptible to noise from environmental variations [5,10], and the fabrication of tapered fibers remains a challenging process, often compromising sensor durability over time [6,11]. The use of FPIs with cavities demands complex configurations, requiring greater calibration effort [7].
Recent OVE research has incorporated computational tools for signal prediction and generation, leading to more refined envelope definitions, as demonstrated in the works of Yang and Zhang et al. Nonetheless, challenges remain in the precise and reliable extraction of useful signal information, as well as in managing environmental interference on physical reference arms, the high costs and complexity of conventional demodulation, and the stringent requirements for sensor fabrication and interrogation systems [10,12].
In this work, we propose the concatenation of two MZIs based on SFS sections to achieve the OVE and its harmonics. FMF has shown superior efficacy in generating the OVE and its harmonics easily, as MZIs with an SFS structure produce spectra with waveforms closely resembling cosine functions, eliminating the need for initial calibration (such as optical fiber bending). This differs markedly from previous studies [13,14]. It was demonstrated that the OVE harmonics emerge when the length of the FMFSen increases by a factor of i + 1 times the length of the FMFRef plus a mismatch factor, achieving the first four harmonics.

2. Principle of the OVE and Harmonics in Cascading SFS Sections

The OVE occurs by superimposing two independent interferometers, with a slight phase shift in their Free Spectral Range (FSR). This is achieved by splicing FMF segments of nearly identical lengths between two SMFs. When the sensor length LSen closely matches the reference length LRef, the characteristic OVE is observed, as illustrated in Figure 1.
Building upon the fundamental equation for modeling the OVE from [6] and adapting it to an SFS structure specifically supporting two modes, as demonstrated in [15,16], the transmission of the sensor (IS), reference (IR), and combined interferometer (IC) can be described by the following expressions:
I S = a + b cos φ S ;   I R = a + b cos φ R
I C = a 2 + a b cos φ S + cos φ R + b 2 2 cos φ S + φ R + cos φ S φ R
where a = t 1 2 + t 2 2 ; b = 2 t 1 t 2 , and t 1 and t 2 represent the optical power transfer ratios from the SMF to the fundamental mode and the first higher-order mode within the FMFs. The phase differences developed between these modes in the sensing and reference FMF segments are denoted as φ S = β S L S and φ R = β R L R , respectively. The propagation constants for the first and higher order mode in the sensing and reference FMF segments are β S   and β R , with corresponding lengths LS and LR.
Factor “a” represents the total optical intensity of the two modes when no interaction occurs between them, while factor “b” reflects the effect of constructive and destructive interference, which is influenced by the cosine of the phase difference between the two waves. This phase difference changes with variations in the bending of the optical fiber. In an SFS structure, with φ S as a function of both wavelength λ and curvature c, the phase difference can be expressed as follows:
φ S = β S λ L Δ λ S + φ S c Δ c
A thermoplastic polyurethane (TPU) tubular structure was designed using computational modeling software to form a ‘U’ shape to facilitate the controlled bending required for linear displacement. The structure has a cross-section with an outer diameter of 4 mm and an inner diameter of 2 mm. On the one hand, it features a 0.8 mm wide slot for inserting the optical fiber, ensuring a precise fit and preventing damage during deformation. The U-shape has an arc radius of 25 mm, connected laterally by two 50 mm tubes. This structure ensures that the linear displacement is precisely correlated to the curvature of the optical fiber, which is achieved using a transducer, as shown in Figure 2.
The mechanical properties of TPU are a tensile strength of 52 MPa, a tensile elongation of 500%, a density of 1.12 g/cm3, and a Shore A hardness of 85A. These properties suggest that the material would have good mechanical strength, especially in applications requiring flexibility and the ability to withstand repeated stresses without fracturing. The tensile elongation and Shore A hardness are ideal for situations where the material is subjected to both tensile and yield stresses, and the tensile strength of 52 MPa is sufficient for many industrial and commercial applications.
In an MZFI composed of a two-mode FMF spliced between two SMFs, interference arises due to the differences in propagation constants between the modes transmitted through the FMFs. As light propagates from the input SMF into the FMF, the two modes are excited. These modes exhibit distinct propagation constants owing to differences in their electromagnetic fields and confinement within the fiber. Although the modes traverse the same physical distance, each accumulates a different phase, and this phase difference is critical to generating the interference pattern. Upon reaching the opposite end of the FMF and entering the output SMF, the modes recombine. The distinct phase of each mode, due to their differing propagation constants, results in constructive or destructive interference, producing the characteristic interference pattern that depends on the accumulated phase difference between the modes [15].
The FSR of the MZFI is given by the following equation:
F S R = λ 2 n e f f i L
From Equation (4), it can be observed that the FSR decreases as the length of the FMF section increases. The FSR of the envelope is defined as [17]:
F S R E n v e l o p e = F S R R e f F S R s e n F S R R e f F S R S e n
As seen in Equation (5), the envelope FSR is larger when the difference between the sensor FSR and the reference interferometer FSR is minimal.
The M factor is the ratio between the FSR of the envelope and the FSR of the sensing interferometer:
M = F S R E n v e l o p e F S R S e n = F S R R e f F S R S e n F S R R e f F S R S e n F S R S e n = F S R R e f F S R R e f F S R S e n
As described in previous works, harmonics occur when the OPL of the first interferometer increases by i + 1 times relative to the second interferometer, with an additional length mismatch factor. According to [18], this relationship is expressed as
O P L s e n = ( i + 1 ) O P L r e f +
where Δ represents the length mismatch factor, “i” is a positive integer corresponding to the harmonic order, and OPLSen and OPLRef are the optical path lengths of the sensor and reference interferometers, respectively. According to previous studies, Equation (7) can be related to the FMF lengths as follows:
L s e n = ( i + 1 ) L r e f +
In a harmonic OVE, two types of envelopes arise: an external and an internal envelope. Regarding the external envelope, Gomes et al. [18] note that its FSR is a function of the FSRs of both interferometers (sensor and reference) and closely resembles the FSR of an OVE. Consequently, the harmonic OVE regenerates the external envelope with the same frequency and FSR as in the OVE:
F S R E x t i = F S R R e f F S R s e n i F S R R e f ( i + 1 ) F S R s e n i
Due to the limitations highlighted in previous studies [14], the technique of tracking internal envelopes is applied. Therefore, by grouping the peaks of the harmonic spectrum, the maxima of the internal envelopes are obtained and classified into peaks of i + 1, where “i” represents the harmonic order. The intersections between these internal envelopes provide multiple points that can be used to track wavelength shifts. As the harmonic order “i” increases, the internal envelopes increase proportionally in number and FSR range, facilitating spectral change detection by monitoring these envelope intersections.
The FSR of the internal envelope is defined as
F S R I n t = ( i + 1 ) F S R R e f F S R s e n i F S R R e f ( i + 1 ) F S R s e n i = ( i + 1 ) F S R E x t i
where FSRRef is the reference FSR; F S R s e n i is the sensor FSR at the harmonic order “i”, and F S R E x t i is the external envelope FSR at the harmonic order “i”. For harmonic orders, the M factor of the internal envelope, MInt, is defined as
M I n t = F S R I n t F S R s e n i = ( i + 1 ) F S R R e f F S R s e n i F S R R e f ( i + 1 ) F S R s e n i F S R R e f = ( i + 1 ) F S R R e f F S R R e f ( i + 1 ) F S R S e n i = i + 1 M
In an MZFI, Equation (8) is used to determine the length of the sensor FMF. The OVE is achieved when i = 0 , with a length mismatch factor Δ added to the equation LSen = (0 + 1)LRef + Δ. The first harmonic is obtained when i = 1 , doubling the reference MZFI length plus the length mismatch factor LSen = (1 + 1)LRef + Δ. The second harmonic order is achieved with i = 2 , tripling the reference MZFI length plus the mismatch factor. Similarly, the third harmonic is calculated by multiplying the reference MZFI length by four, and finally, the fourth harmonic is obtained by quintupling the reference length, adding the mismatch factor Δ at each step.

3. Experimental Setup

A broadband fluorescence light source, operating in the 1500–1600 nm range, was produced using a 3 m erbium-doped fiber (EDF) (LIEKKI Er16-8/125), pumped via a wavelength division multiplexer (WDM) with a 980 nm pigtailed laser diode (LD). Following the EDF, the FMF structures were spliced (Figure 3). The SFS structure was composed of SMF28 and FMF fibers. The FMF employed was the FM SI-2-ULL (step index) from the manufacturer YOFC. The fiber specifications included a core diameter of 16 µm, a cladding diameter of 125 µm, and an operating wavelength range of 1450–1700 nm.
At the outset of the experiment, both MZFIs, composed of FMF, displayed the typical interference patterns associated with the OVE, without requiring calibration. To facilitate the experiment, the reference MZFI (MZFIRef) was positioned in a straight configuration, while the sensing MZFI (MZFISen) was placed inside a transducer with a calibrated 2 cm opening for curvature. As linear displacement occurred, the transducer gradually closed, inducing curvature in the optical fiber and subsequently causing spectral displacement.
Five different concatenated MZFI tandems with varying lengths for LRef and LSen were examined. The specific lengths of LRef and LSen, along with their respective FSRs and M factor, are summarized in Table 1. For each measurement, the Yokogawa AQ6370B optical spectrum analyzer (OSA) was configured with a resolution of 0.05 nm. The sensor fabrication process was as follows: First, the FMF sections were measured using the dimensions specified in Table 1. They were then cut with a high-precision optical fiber cleaver. The cut FMF sections were spliced with a Fujikura FSM-60S splicer between two SMFs. This process was carried out twice, as shown in Figure 3, to obtain the cascaded MZFIs. The MZFIRef was fixedly placed in the work area, while the second MZFISen was introduced into the TPU tubular structure to correlate the linear displacement with respect to the envelope displacement.
In subsequent tests, three separate experiments were conducted to observe harmonic generation up to the fourth order, using the parameters listed in Table 2 below.

4. Results and Discussion

4.1. Fast Fourier Transform Analysis

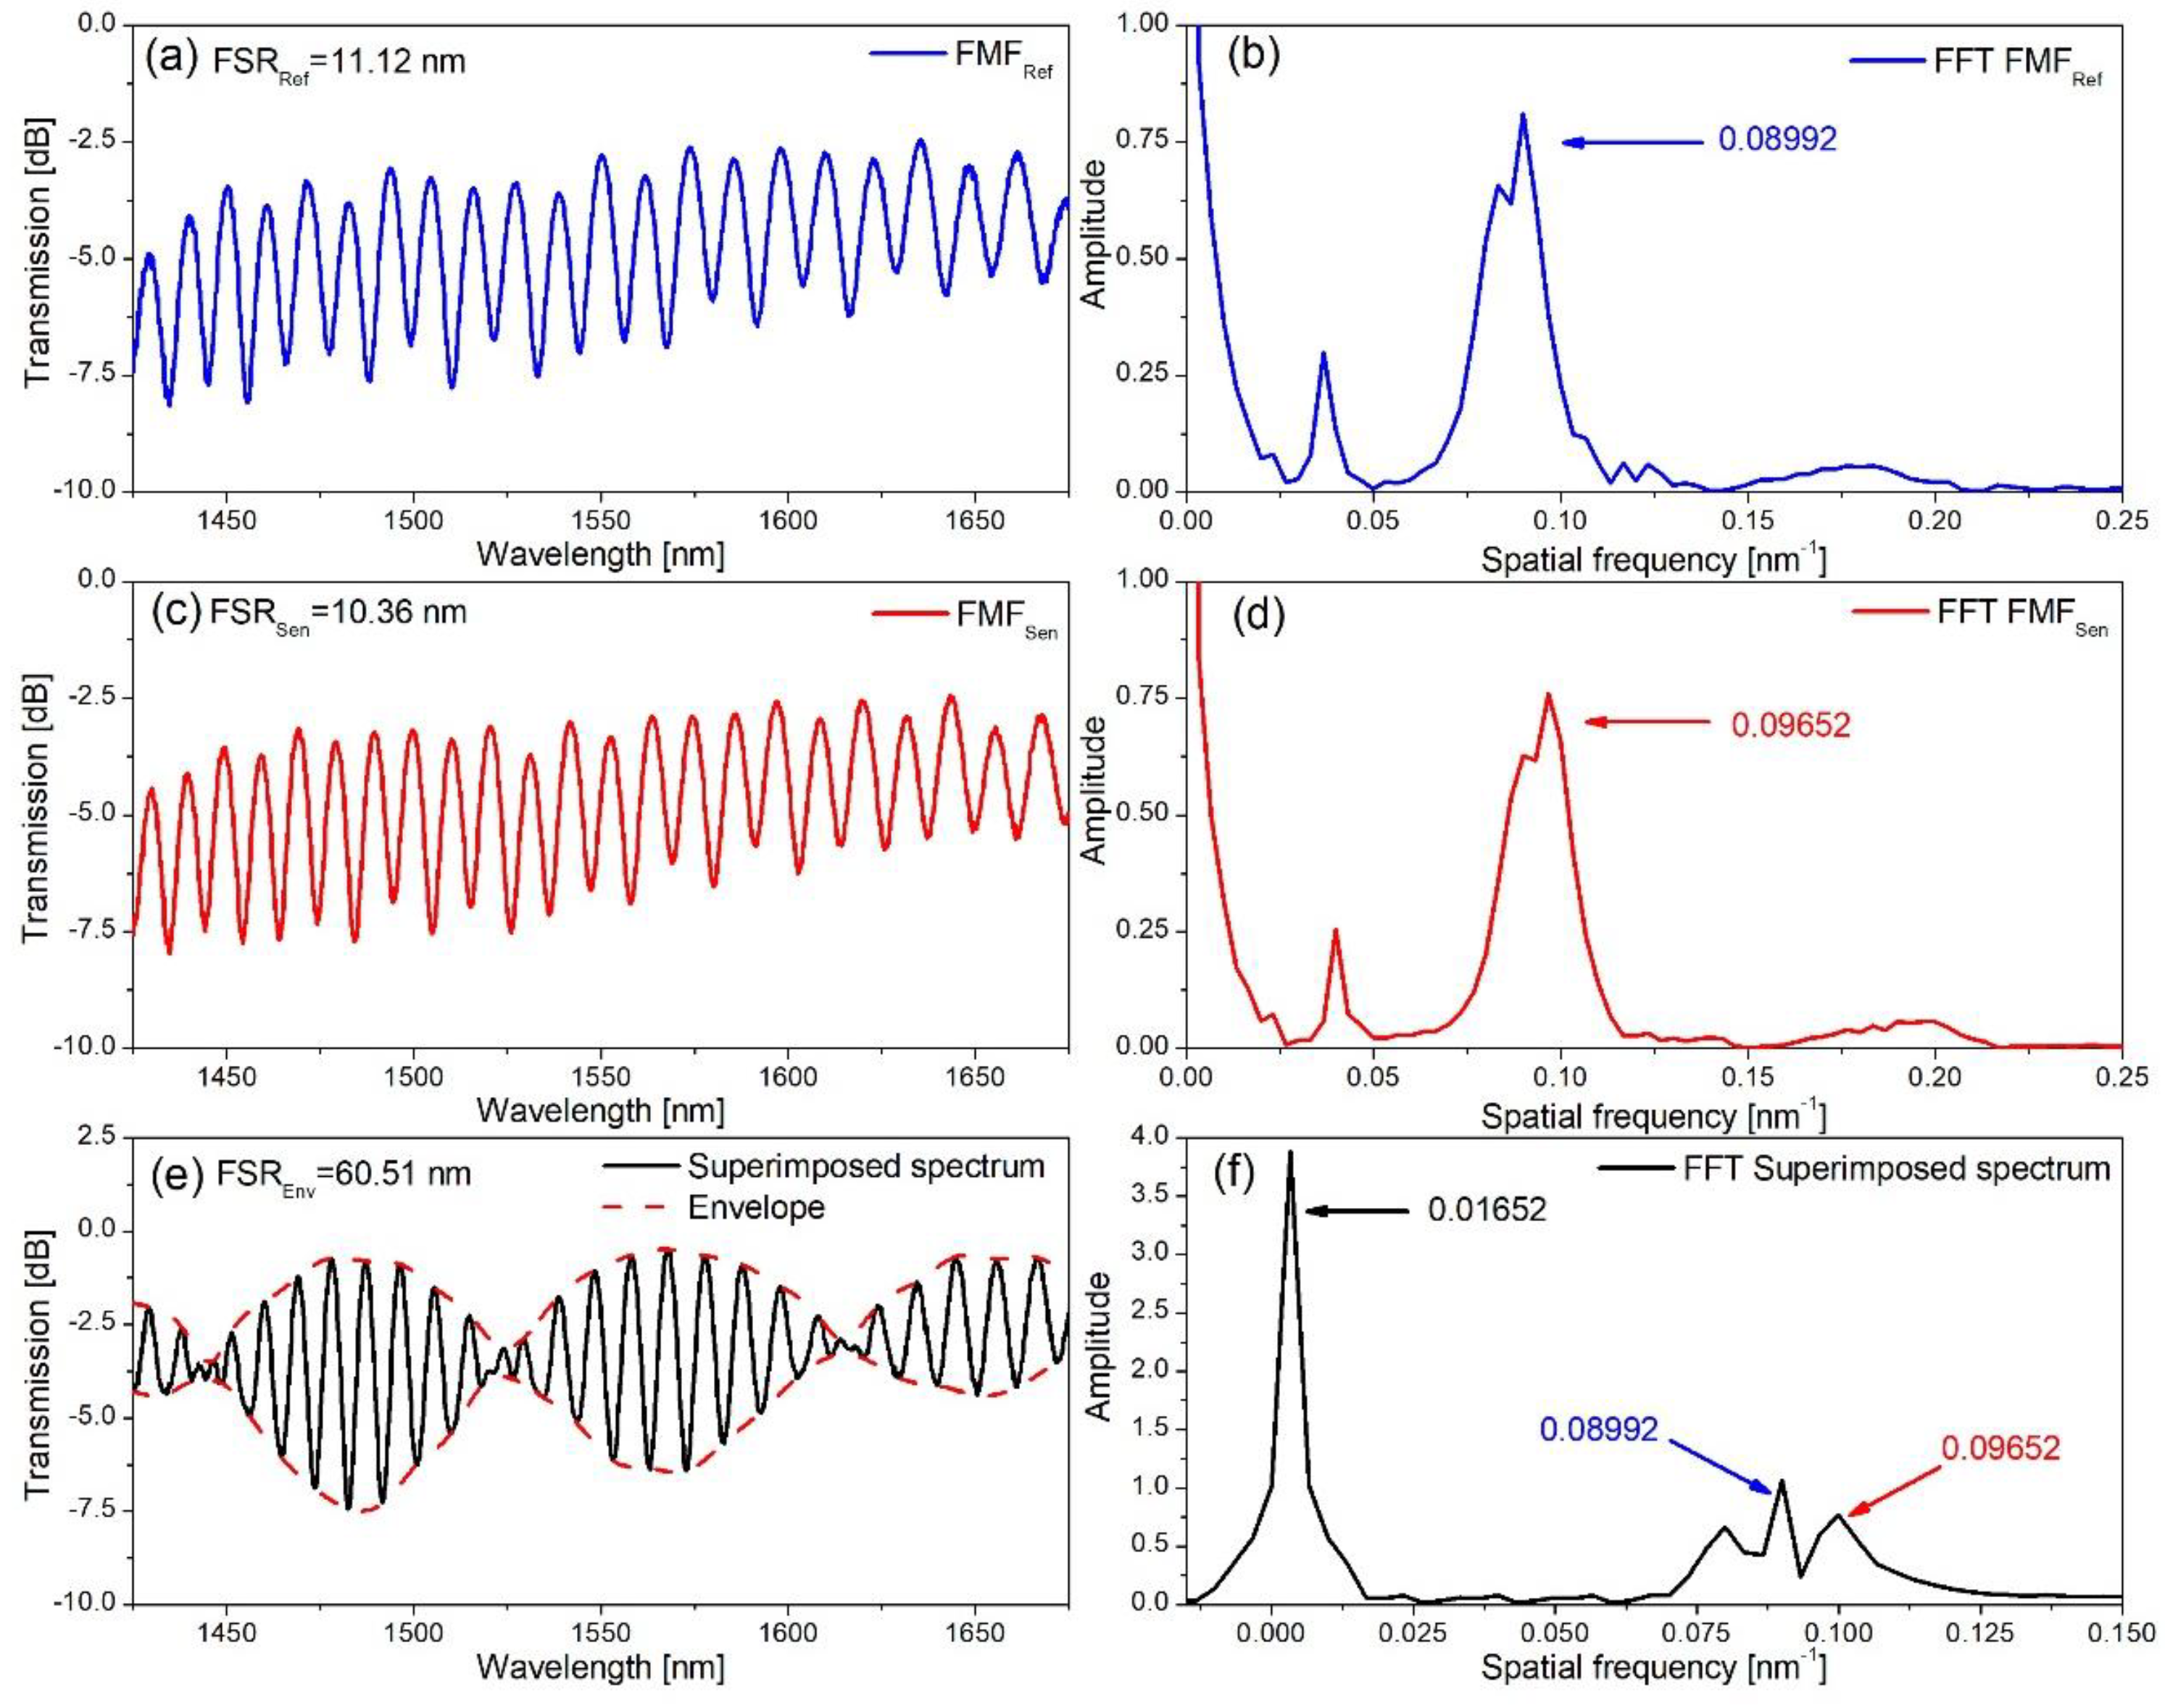
To analyze the spectra and identify the signals generated by both the MZFIRef and MZFISen, as well as confirm their overlap with the signals in the OVE, the Fast Fourier Transform (FFT) was applied to each of the proposed experimental setups. The results verified that all systems followed the expected trend, where the FSR decreased as the MZFI length increased. The relationship between spatial frequency and wavelength, expressed as f = 1 / F S R , was also consistent with previous studies [13]. The reference signal frequency was defined as FreqRef, the sensor signal frequency as FreqSen, and the envelope frequency as FreqEnvelope.
Figure 4, Figure 5, Figure 6, Figure 7 and Figure 8 illustrate the frequency analysis for the corresponding devices listed in Table 1. In each figure, panels (a), (c), and (e) present the transmission spectra for FMFRef, FMFSen, and the superimposed spectrum (envelope), respectively. It is noteworthy that the FSRRef and FSRSen must be closely matched to generate an envelope with a significantly larger FSREnvelope when superimposed. Panels (b), (d), and (f) in Figure 4, Figure 5, Figure 6, Figure 7 and Figure 8 display the spatial frequencies corresponding to the transmission spectra. Panels (b) and (d) in Figure 4, Figure 5, Figure 6, Figure 7 and Figure 8 highlight the dominant frequencies produced by the MZFIRef and MZFISen, characterized by their regularity and consistency. In panels (f) in Figure 4, Figure 5, Figure 6, Figure 7 and Figure 8, three key peaks are observed: one representing the superimposed spatial frequency of the envelope (the smallest peak) and the two adjacent peaks corresponding to the individual interferometer components. The frequency results are summarized in Table 3.

4.2. OVE Analysis (Spectral Shift and Slope)

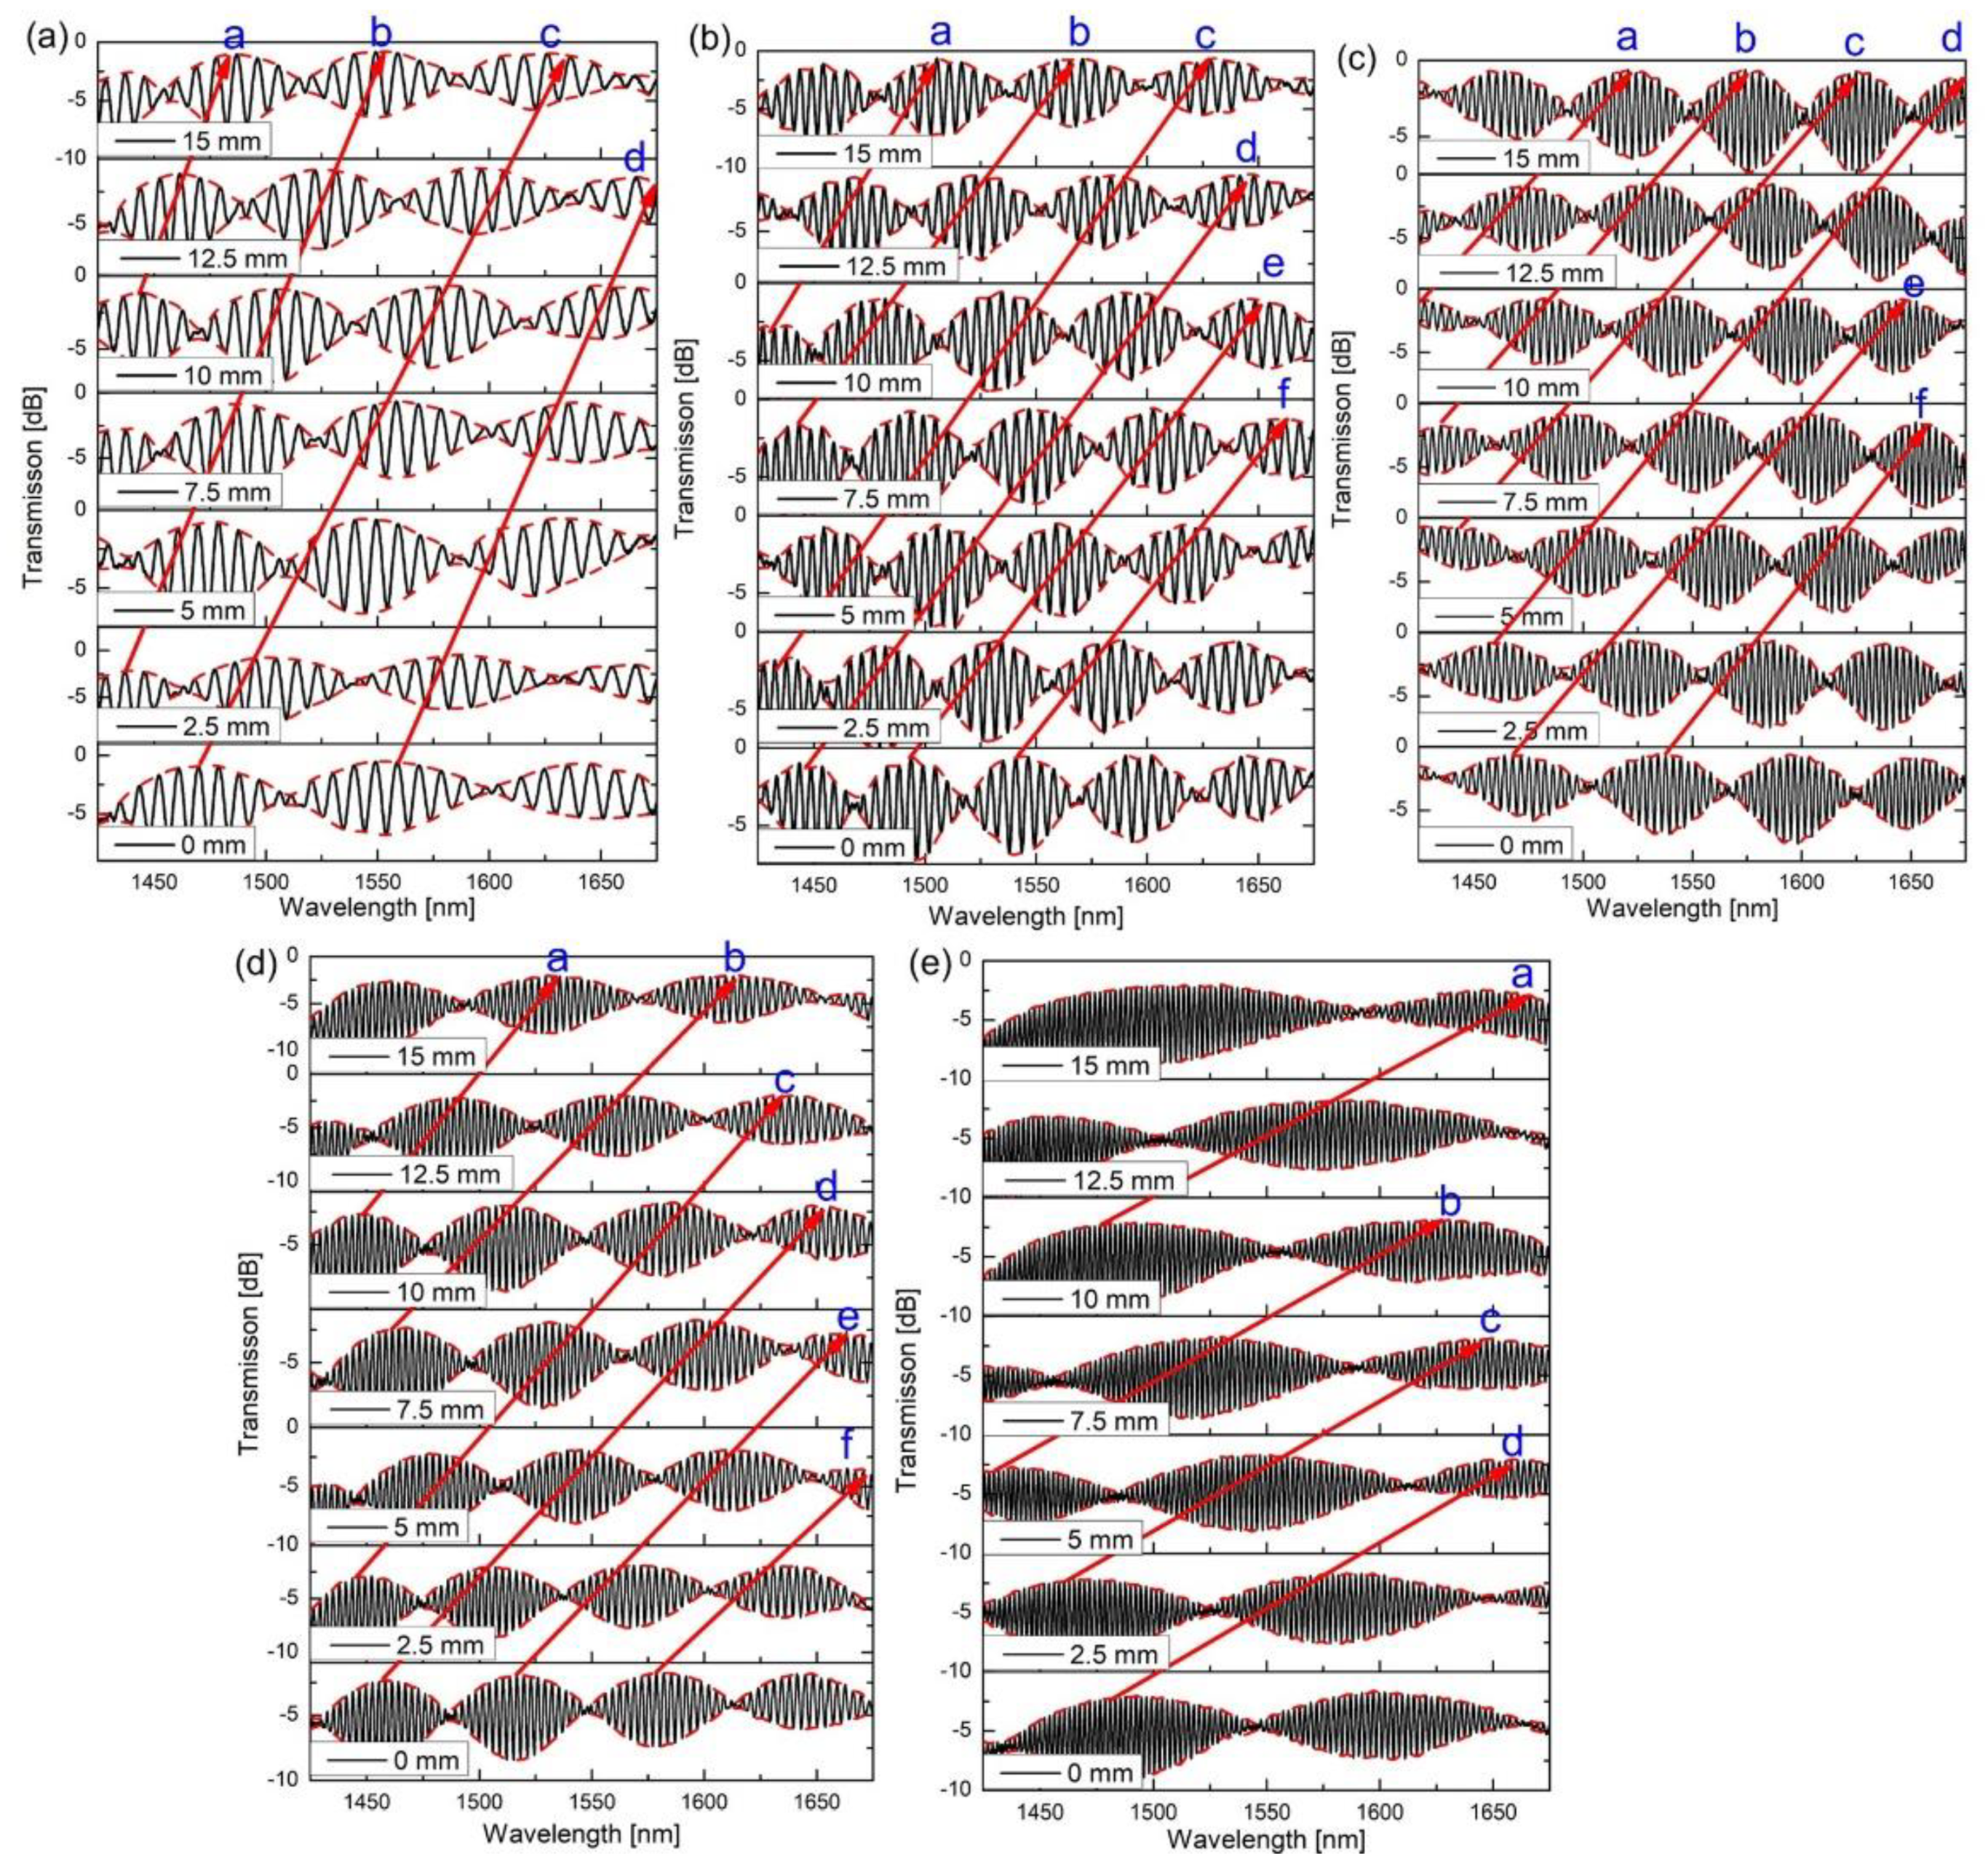
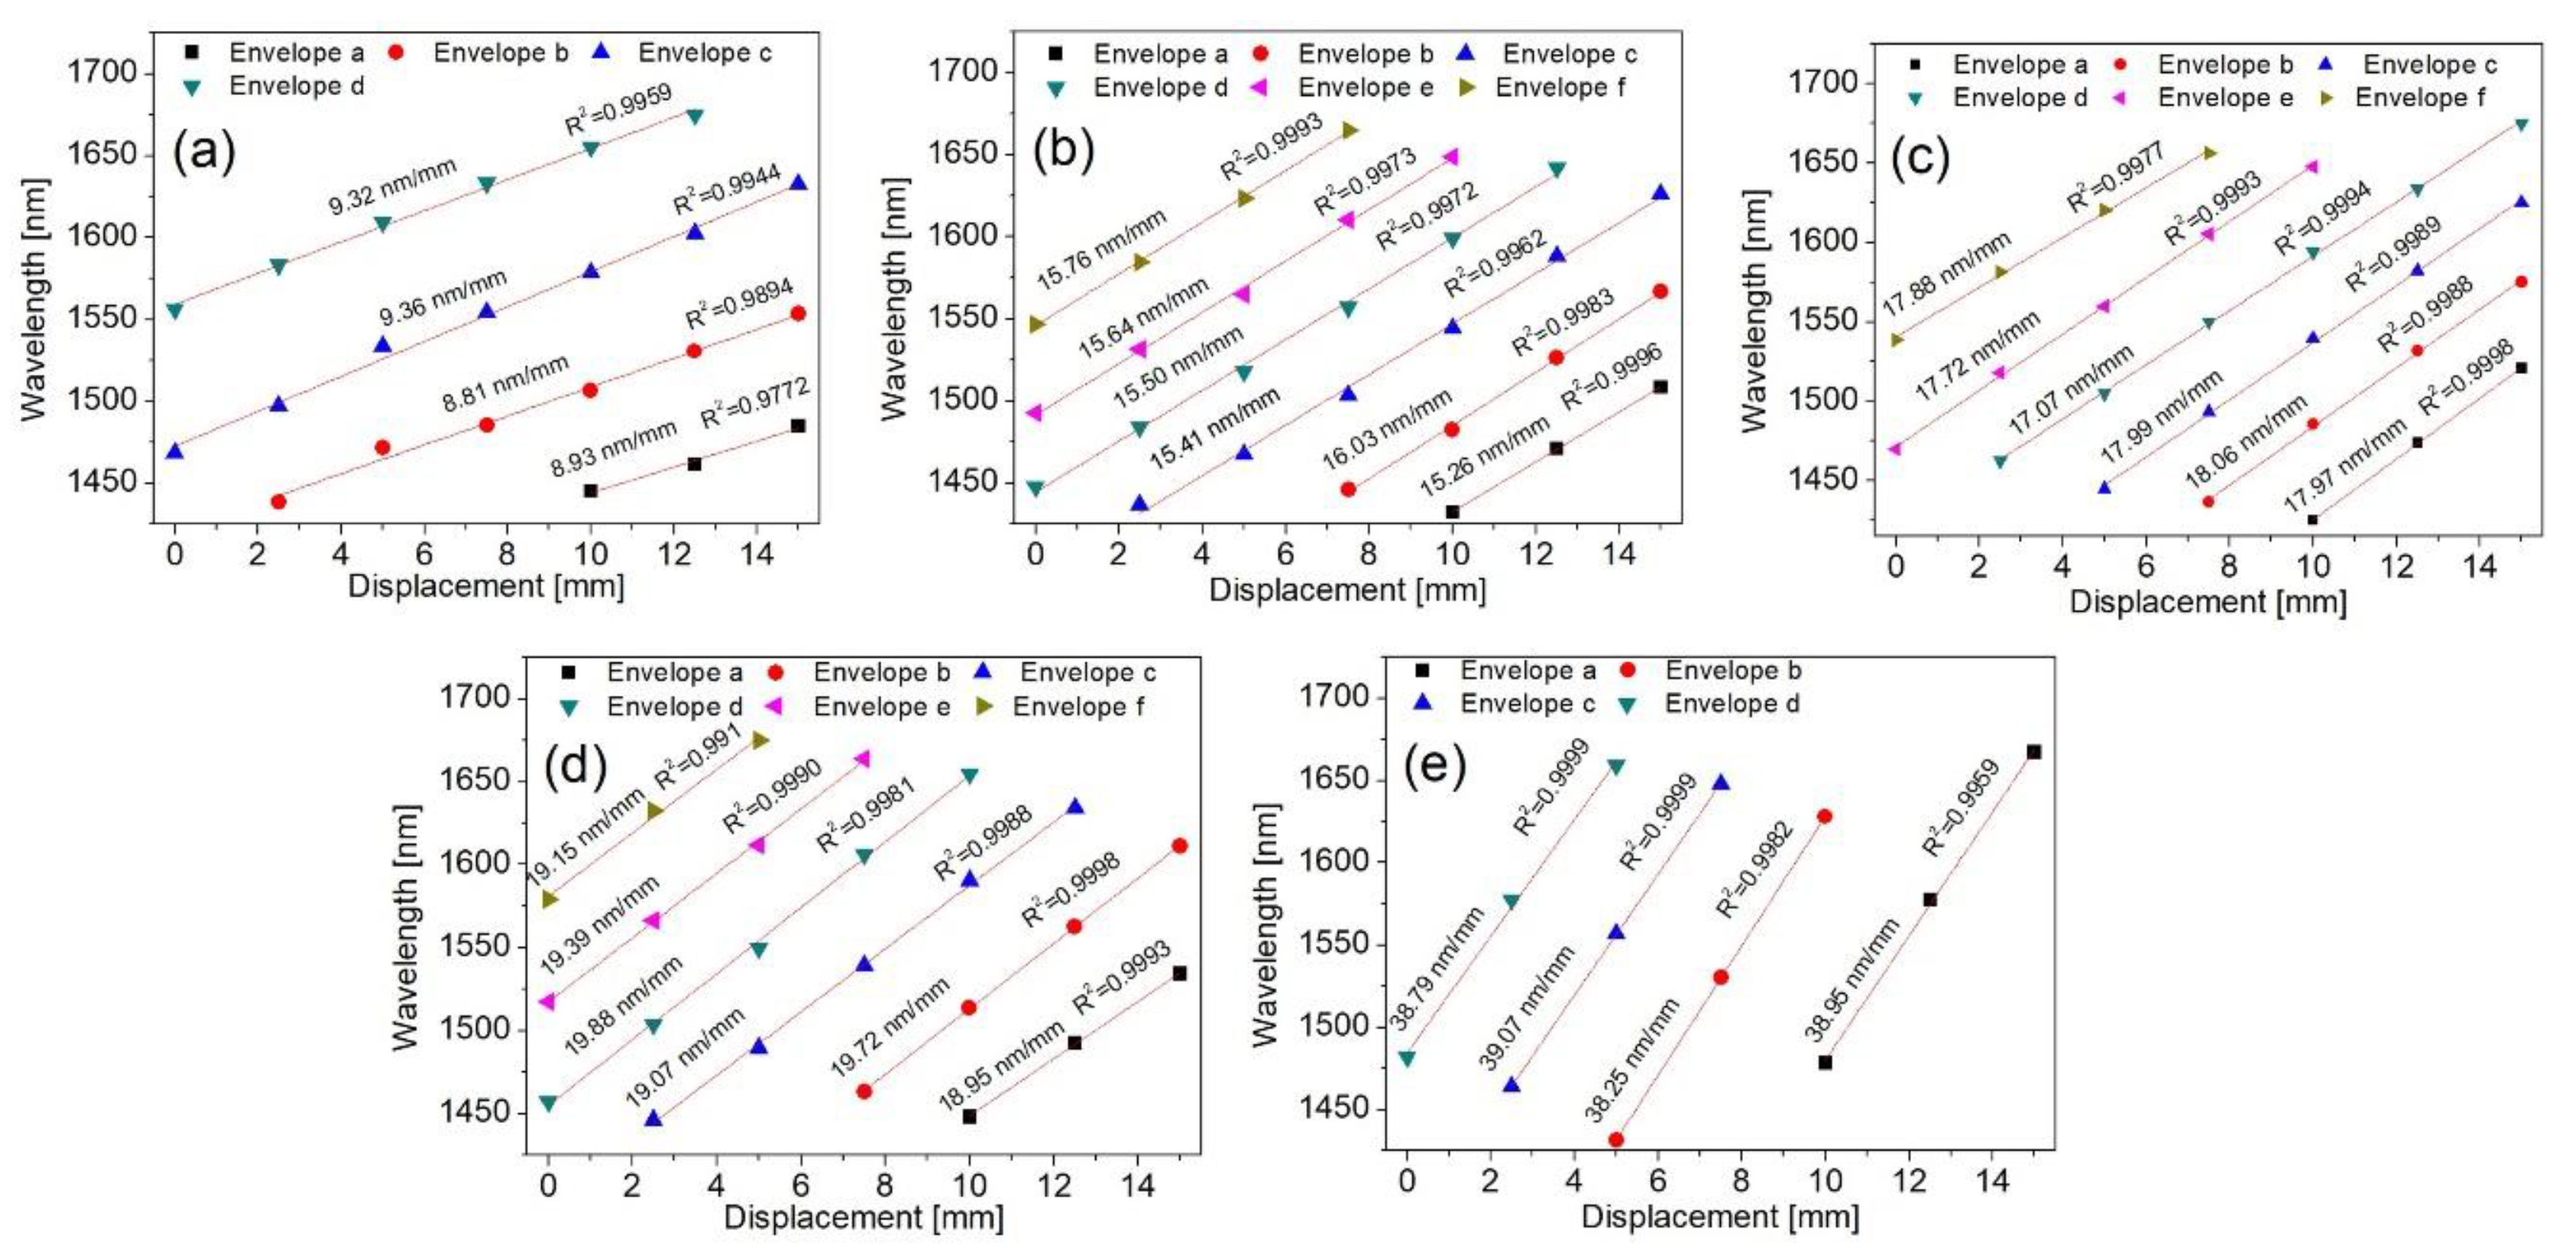
The spectral shift of the envelopes as a function of linear displacement was subsequently analyzed. To ensure a fair comparison, all devices were calibrated over a displacement range of 0 to 15 mm, with intervals of 2.5 mm. The resulting spectral shifts are illustrated in Figure 9, while the corresponding sensitivities are displayed in Figure 10. The experiment numbers 1 through 5 from Table 1 correspond to Figure 9a–e and Figure 10a–e, respectively.
These results demonstrate that the lengths of the FMFRef and FMFSen significantly impact the amplification of the OVE, as well as the sensor’s usable range and sensitivity. With each incremental increase in FMFRef and FMFSen lengths, there is a corresponding amplification in the FSRenvelope, enhancing the detection system’s sensitivity, as seen in Figure 10a–e. However, as the FSRenvelope increases significantly, the complete range of spectral shift becomes too large to capture within the optical spectrum analyzer’s (OSA) measurement window, as shown in Figure 9a–e. This limitation means that a higher sensitivity comes at the cost of a reduced measurement range. For instance, in Figure 9b, the range is reduced by 2.5 mm (from 0–12.5 mm), while in Figure 9c,d, a 5 mm reduction (from 0 to 10 mm) is observed. In Figure 9e, the range is further reduced by 10 mm (from 0 to 5 mm).
As highlighted in the previous discussion, sensitivity increased as the lengths of FMFRef and FMFSen extended, with values ranging from 9.36 nm/mm in Figure 10a to 39.07 nm/mm in Figure 10e. Each device displayed similar slopes between the envelopes, suggesting that the FMF provided a highly uniform refractive index and light dispersion characteristics. Furthermore, all devices exhibited an R2 value of 0.99 or higher, indicating a high degree of linearity. This high linearity is crucial for sensor development as it confirms the system’s consistency, accuracy, reproducibility, and ease of calibration.

4.3. Harmonic OVE Analysis

The harmonic analysis of the OVE, as discussed in Gomes [18], involves detecting each harmonic peak’s maxima, then grouping them into sets of “i + 1,” where “i” represents the harmonic order. Notably, the number of peak maxima coincides with the number of generated internal envelopes. As shown in Table 2, the first four harmonics of the three proposed configurations were obtained using Equation (8). Figure 11 clearly illustrates that both peaks and envelopes increase according to the proportion “i + 1”, with two peaks and internal envelopes in the first harmonic, three in the second harmonic, four in the third harmonic, and five in the fourth harmonic. The intersection points of the internal envelopes serve as critical markers for monitoring wavelength shifts in response to applied displacement.
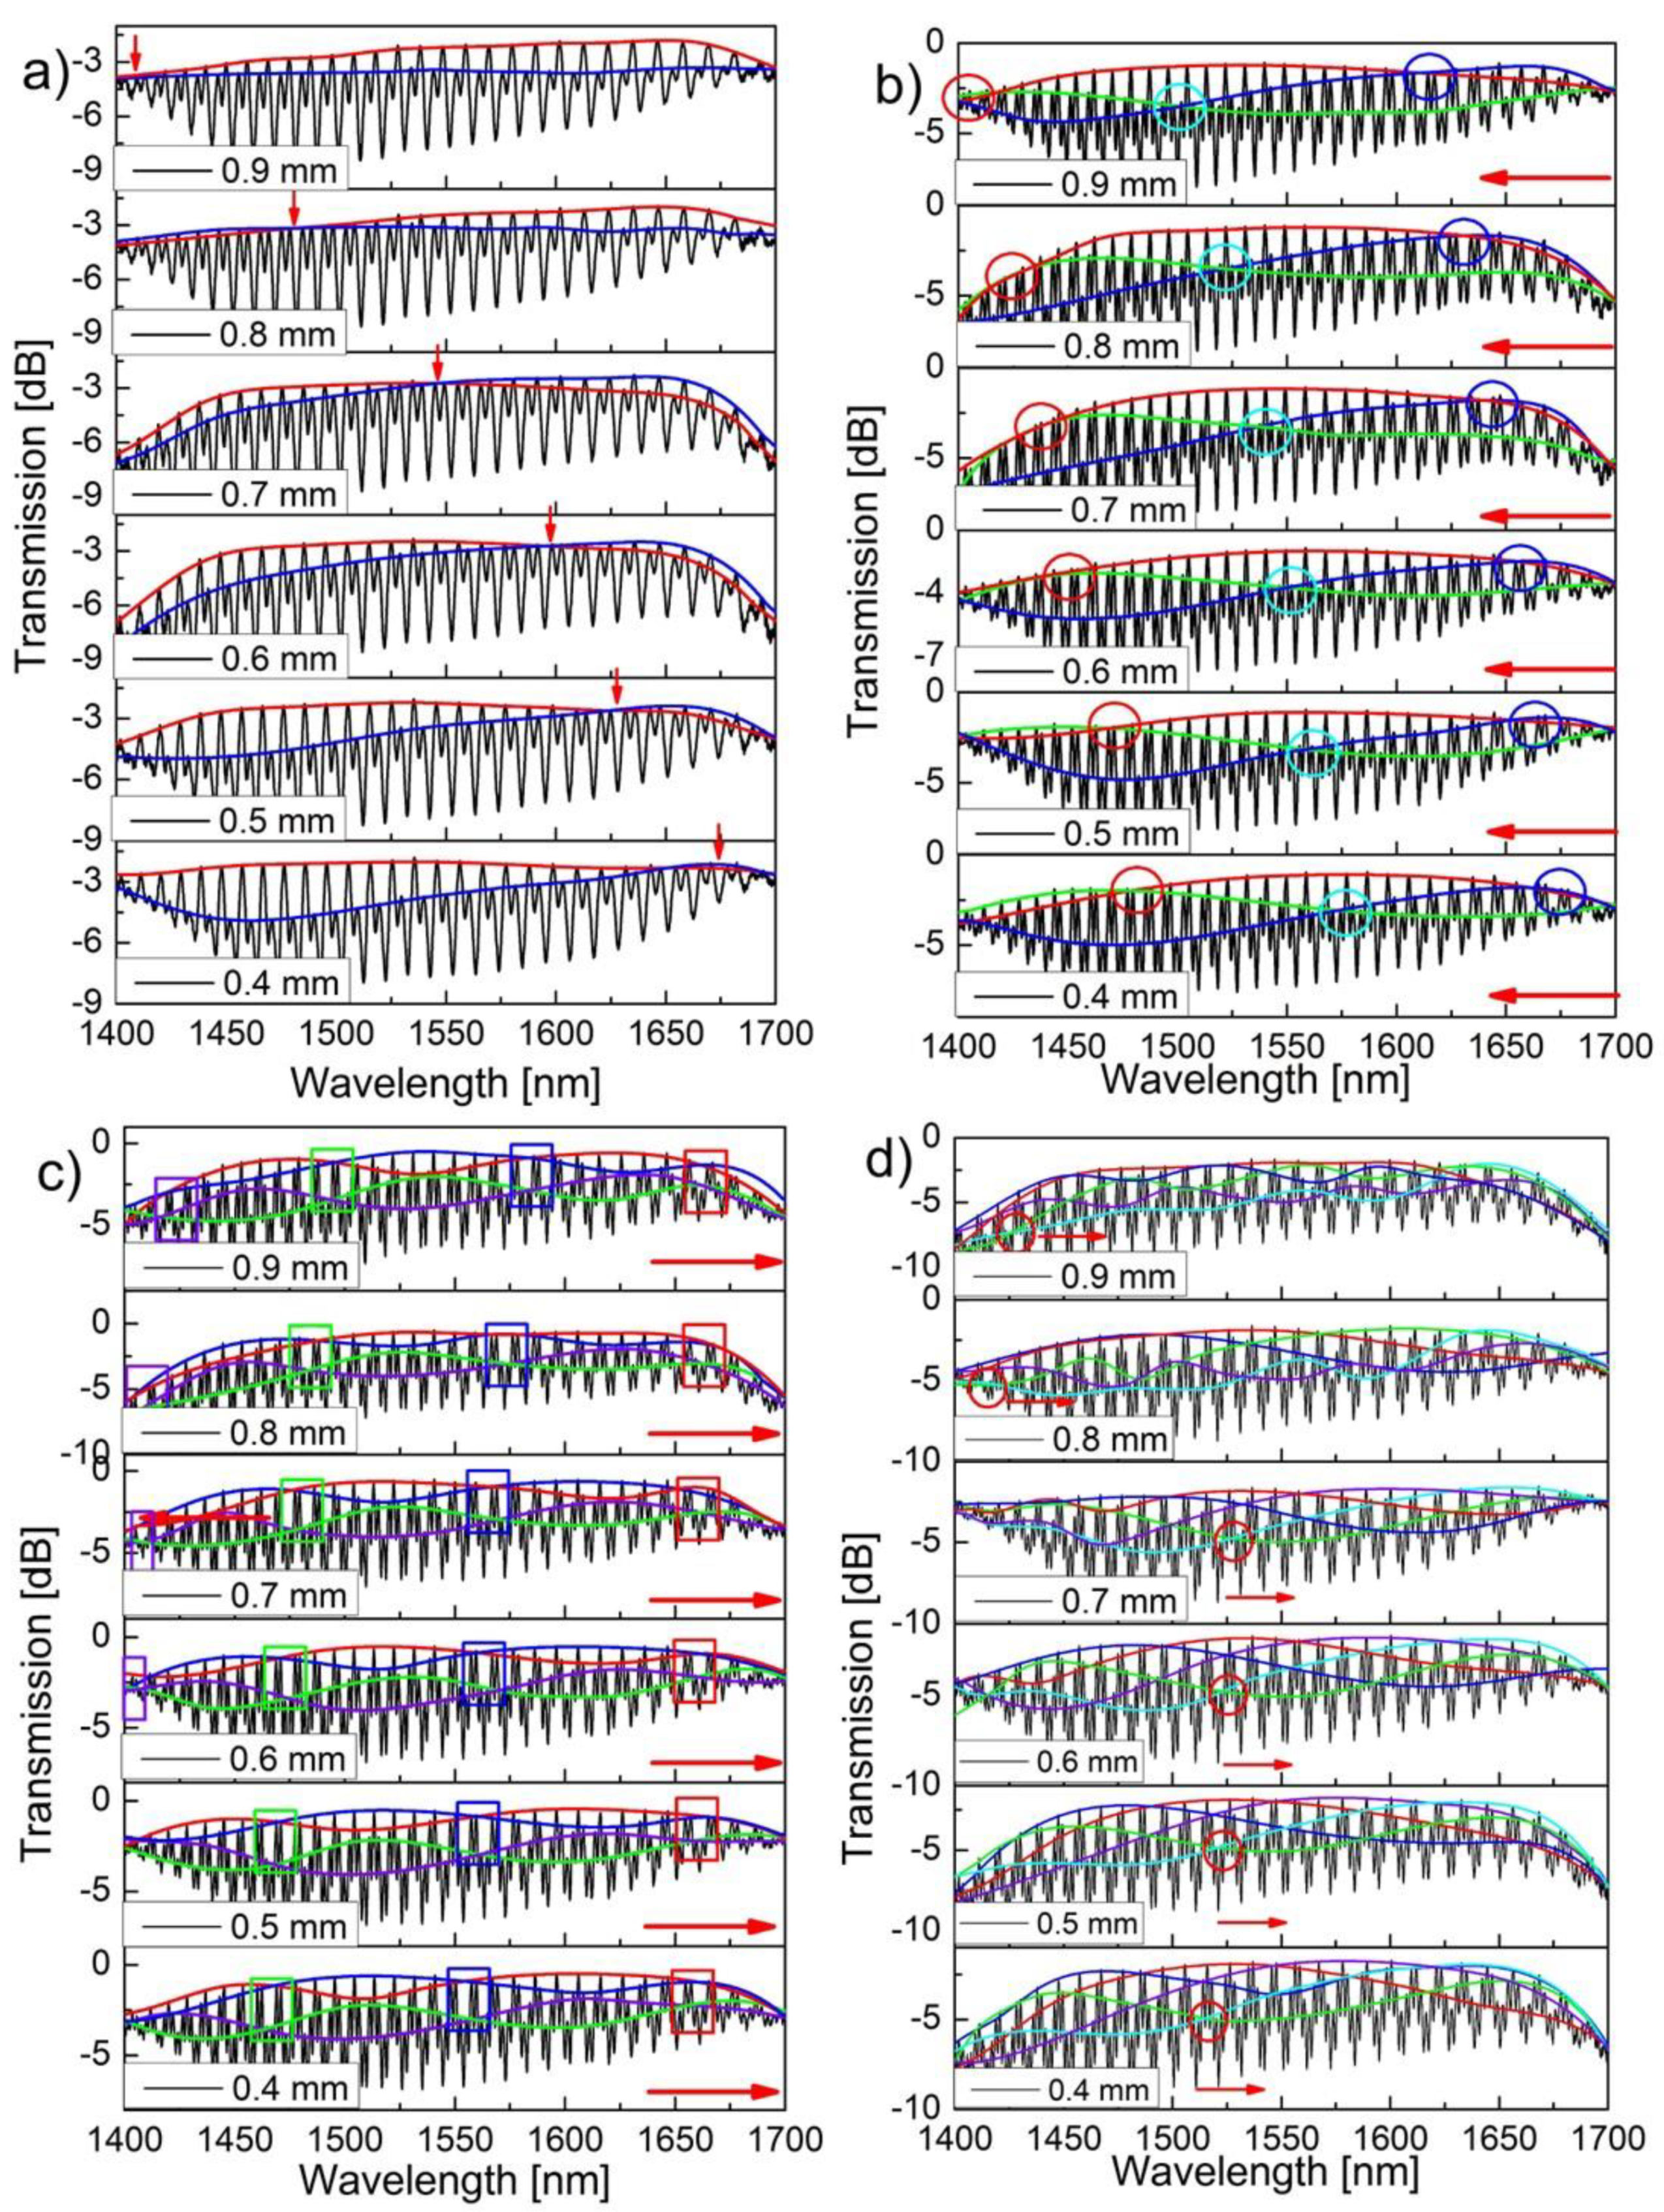
A displacement analysis was performed with the first device from Table 2. A linear displacement ranging from 0.4 mm to 0.9 mm, in 0.1 mm intervals, was applied. The spectral shifts are shown in Figure 12, and the sensitivities are shown in Figure 13. Figure 12 demonstrates that as the harmonic order increases, more intersection points of the internal envelopes are obtained. However, the downside is that sensitivity decreases, as observed in Figure 13. One factor to consider is that, due to the cyclical behavior, if an appropriate range is not selected, the displacement may be “cut off” within the OSA span, as occurred in Figure 12 and Figure 13d.
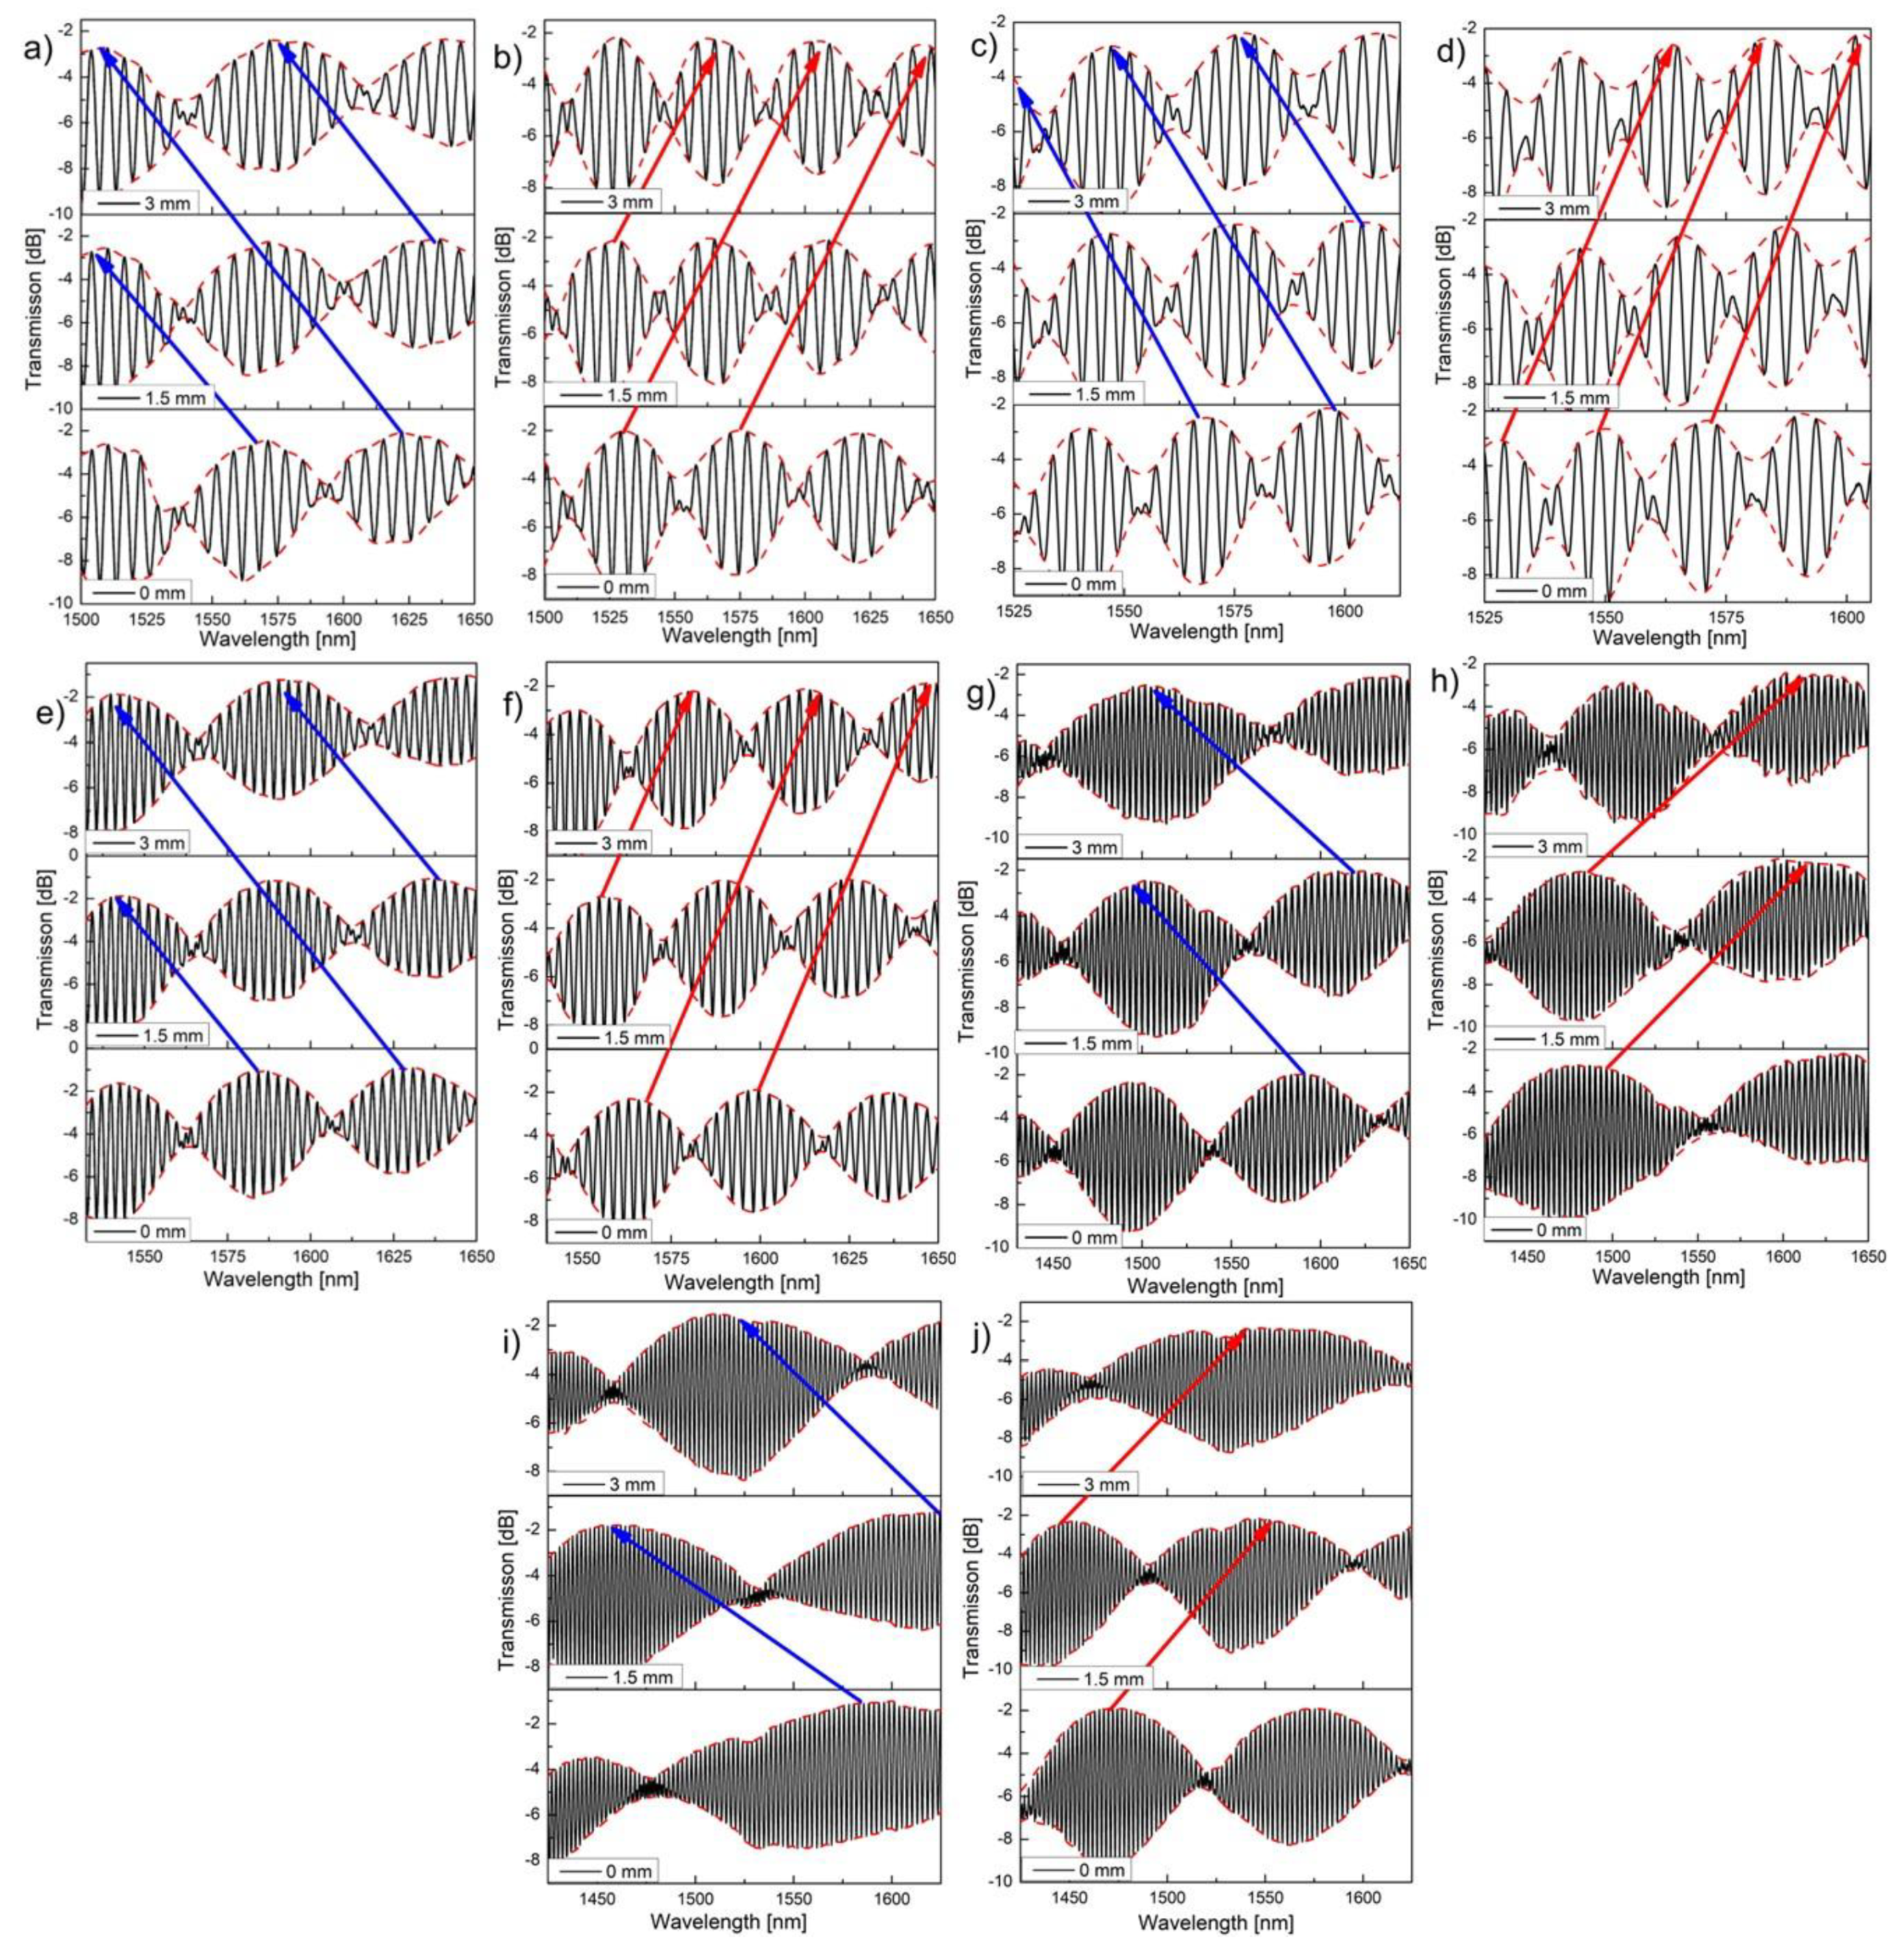
Further analysis of FMFs with varying lengths revealed an interesting observation. When the length of FMFRef exceeds that of FMFSen, the envelope shifts toward the shorter wavelengths (Blueshift). Conversely, when the length of FMFRef is shorter than that of FMFSen, the envelope shifts toward longer wavelengths (Redshift). This behavior was first reported in [19], where it was explained that when FMFSen is smaller than FMFRef, the envelopes of both the OVE and the individual interferometer shift in the same direction. Otherwise, they shift in opposite directions. This occurs because the M factor becomes negative when FMFSen is greater than FMFRef, causing the OVE and individual interferometer envelopes to shift in opposing directions.
The Blueshift or Redshift displacements are directly related to the ratio of the lengths of FMFRef and FMFSen. When FMFRef is longer, the optical paths are extended, leading to a greater accumulated phase difference between the signals. In this case, the OVE amplifies the phase difference, causing a Blueshift in the envelope, as constructive and destructive interference occurs at higher frequencies (shorter wavelengths) due to the increased optical path difference. In contrast, when FMFRef is shorter than FMFSen, the phase difference is reduced, and interference occurs at lower frequencies (longer wavelengths), resulting in a Redshift.
To verify the high repeatability of this behavior, five additional MZFI concatenations were performed with FMFRef lengths longer than FMFSen, followed by reversed lengths with FMFRef shorter than FMFSen, as detailed in Table 4. The results are plotted in Figure 14. To ensure consistency and uniformity in analysis, all devices were tested over a displacement range of 0 to 3 mm, with increments of 1.5 mm. The devices were labeled according to the observed envelope displacement. Labels in Figure 14a,c,e,g,i correspond to configurations where FMFRef lengths are greater than FMFSen lengths, and the red arrows indicate a Blueshift. Conversely, labels in Figure 14b,d,f,h,j correspond to configurations where FMFRef lengths are shorter, and the blue arrows indicate a Redshift. It should be noted that slight variations in arm lengths cause phase differences that generate complex interference patterns, thereby affecting the regularity of the envelope curve without impacting the accuracy of the displacement measurement, as observed in Figure 14.

5. Discussion

Table 5 provides an overview of various sensors from different applications that have utilized FMF to achieve the OVE. This table is organized chronologically, listing the year, configuration, application, measurement range, sensitivity, and M factor. The versatility of FMF in developing robust and sensitive sensors is highlighted, specifically with significant improvements in sensitivity achieved over time. Notably, unlike other sensors, our work presents, for the first time, a displacement sensor. Our sensor offers a measurement range of 0 to 15 mm, making it suitable for applications requiring precise control of small displacements. In terms of sensitivity and the M factor, both parameters increase significantly with greater FMF lengths; however, the operational range decreases. This trade-off allows for the sensor to be adjusted for various levels of sensitivity or range, providing flexibility in design. While some sensors utilize more complex configurations, such as hybrid structures [4], cascaded microcavities [8,9,11], or parallel Fabry–Perot structures [7], our design, based on a previously implemented structure [5], offers simplicity, robustness, high sensitivity, and precision. Additionally, it presents significant advantages in terms of production cost and ease of implementation. However, the limitations of this configuration include sensitivity to external factors such as temperature fluctuations or vibrations, which can introduce noise into the system. Additionally, the limited displacement range might restrict its applicability in scenarios that require measurements of larger displacements.
A potential future development could involve integrating the SFS structure with fiber Bragg gratings [20] or laboratory-on-fiber microstructures [21] to further improve sensitivity and resolution. This approach would expand the potential applications to new fields, such as medical healthcare and advanced diagnostics, offering a promising avenue for the development of next-generation optical fiber sensors.

6. Conclusions

This work presented a comprehensive analysis of the OVE using FMF fibers, which were applied for the first time to a linear displacement sensor. This study highlighted previously underexplored aspects, such as the direct relationship between FMF lengths and the displacement direction of the envelopes, spatial frequency, and harmonic order.
It was demonstrated that to achieve well-defined envelopes in the OVE, the MZFI lengths required a tuning factor of ±1 cm. With this adjustment, sensitivities of up to 39.07 nm/mm and M factors of up to 50.09 were achieved. To achieve the harmonic OVE, two conditions must be met: the MZFI lengths must follow a proportionality of “i + 1”, and the length mismatch factor must be ±1 cm. Under these conditions, sensitivities of up to 520.8 nm/mm were achieved using the second harmonic. Furthermore, it was shown that when the MZFRef lengths are greater than the MZFISen lengths, the envelopes shift to shorter wavelengths (Blueshift), while the opposite leads to a shift toward longer wavelengths (Redshift).
The FFT analysis confirmed the relationship f = 1 / F S R and identified three key peaks in the transmission spectra of the envelopes: two from the individual MZFIs and one from the envelope.
Unlike other sensors with more complex and specialized configurations, this approach achieved highly precise and sensitive results using a simple yet robust SFS structure. This configuration optimized the detection of small displacements with high precision, enhancing the sensor’s adaptability for industrial and scientific applications.

Author Contributions

Conceptualization, G.A.-S. and A.M.-R.; methodology, all authors; validation, G.A.-S. and A.M.-R.; formal analysis, all authors; investigation, all authors; resources, G.A.-S. and A.M.-R.; data curation, L.E.G.-R., M.C.J.-M., G.A.-S. and J.A.M.-V.; writing—original draft preparation, G.A.-S., A.M.-R. and M.C.J.-M.; writing—review and editing, all authors.; visualization, all authors.; supervision, G.A.-S.; project administration, G.A.-S.; funding acquisition, G.A.-S. and A.M.-R. All authors have read and agreed to the published version of the manuscript.

Funding

This research was funded by the Consejo Nacional de Humanidades, Ciencias y Tecnologías (CONAHCYT) in Mexico.

Institutional Review Board Statement

Not applicable.

Informed Consent Statement

Not applicable.

Data Availability Statement

The raw data supporting the conclusions of this article will be made available by the authors upon request.

Conflicts of Interest

All authors declare that they have no conflicts of interest.

References

  1. Liu, Y.; Li, X.; Zhang, Y.-N.; Zhao, Y. Fiber-optic sensors based on Vernier effect. Measurement 2020, 167, 108451. [Google Scholar] [CrossRef]
  2. Gomes, A.D.; Bartelt, H.; Frazão, O. Optical Vernier Effect: Recent Advances and Developments. Laser Photonics Rev. 2021, 15, 2000588. [Google Scholar] [CrossRef]
  3. Lashari, G.A.; Mumtaz, F.; Ai, Z.; Dai, Y. Recent advancements and future challenges in hybrid optical fiber interferometers. Optik 2023, 282, 170860. [Google Scholar] [CrossRef]
  4. Liu, L.; Ning, T.; Zheng, J.; Pei, L.; Li, J.; Cao, J.; Gao, X.; Zhang, C. High-sensitivity strain sensor implemented by hybrid cascaded interferometers and the Vernier-effect. Opt. Laser Technol. 2019, 119, 105591. [Google Scholar] [CrossRef]
  5. Lu, C.; Dong, X.; Lu, L.; Guan, Y.; Ding, S. Label Free All-Fiber Static Pressure Sensor Based on Vernier Effect with Temperature Compensation. IEEE Sens. J. 2020, 20, 4726–4731. [Google Scholar] [CrossRef]
  6. Xie, L.; Sun, B.; Chen, M.; Zhang, Z. Sensitivity enhanced temperature sensor with serial tapered two-mode fibers based on the Vernier effect. Opt. Express 2020, 28, 32447–32455. [Google Scholar] [CrossRef]
  7. Gomes, A.D.; Kobelke, J.; Bierlich, J.; Dellith, J.; Rothhardt, M.; Bartelt, H.; Frazão, O. Giant refractometric sensitivity by combining extreme optical Vernier effect and modal interference. Sci. Rep. 2020, 10, 19313. [Google Scholar] [CrossRef]
  8. Fu, X.; Ran, R.; Li, Q.; Zhang, R.; Li, D.; Fu, G.; Jin, W.; Bi, W.; Qi, Y.; Hu, Q. A sensitivity-enhanced temperature sensor with end-coated PDMS in few mode fiber based on vernier effect. Opt. Commun. 2021, 497, 127173. [Google Scholar] [CrossRef]
  9. Fu, X.; Ran, R.; Li, Q.; Huang, Z.; Li, D.; Zhang, R.; Fu, G.; Jin, W.; Qi, Y.; Bi, W. A Few Mode Fiber Temperature Sensor Filled with PDMS Based on Vernier Effect. IEEE Photonics J. 2021, 13, 6800205. [Google Scholar] [CrossRef]
  10. Yang, P.; Jiang, S.; Wang, Z.; Peng, X.; Peng, B. Enhancing Sensor Strain Sensitivity via Simulated Reference Arm for Optical Harmonic Vernier Effect. IEEE Sens. J. 2023, 23, 27375–27381. [Google Scholar] [CrossRef]
  11. Deng, L.; Jiang, C.; Guo, X.; Sun, S.; Jiang, G.; Cao, T.; Shu, Y.; Liu, C.; Huang, H. Ultra-sensitive strain sensor composed of tapered two-mode fiber micro-cantilever inserted into quartz capillary. Opt. Fiber Technol. 2024, 84, 103738. [Google Scholar] [CrossRef]
  12. Zhang, Y.; Yang, P.; Wei, W.; Jiang, S.; Bao, W.; Zhu, X.; Wu, G.; Chen, D. Highly Sensitive Salinity Sensor Based on Virtual Vernier Effect of Micro-Nano Fiber Mode Interferometer. IEEE Sens. J. 2024, 24, 16121–16129. [Google Scholar] [CrossRef]
  13. Guillen-Ruiz, L.; Anzueto-Sánchez, G.; Torres-Gómez, I.; Camas-Anzueto, J.; Martínez-Rios, A.; Salceda-Delgado, G. Experimental demonstration of optical Vernier effect by cascading tapered single-mode optical fibres. Opt. Fiber Technol. 2022, 70, 102869. [Google Scholar] [CrossRef]
  14. Guillen-Ruiz, L.; Anzueto-Sanchez, G.; Martínez-Rios, A.; Camas-Anzueto, J.; Nuñez-Gomez, R.E.; Martin-Vela, J.A. Demonstration of Improving the Performance of a Fibre Optic Displacement Sensor Using the Optical Harmonic Vernier Effect by Cascading Tapered Optical Single-Mode Fibres. IEEE Photonics J. 2023, 15, 7101309. [Google Scholar] [CrossRef]
  15. Su, J.; Dong, X.; Lu, C. Characteristics of few mode fiber under bending. IEEE J. Sel. Top. Quantum Electron. 2016, 22, 139–145. [Google Scholar] [CrossRef]
  16. Su, J.; Dong, X.; Lu, C. Property of Bent Few-Mode Fiber and Its Application in Displacement Sensor. IEEE Photonics Technol. Lett. 2016, 28, 1387–1390. [Google Scholar] [CrossRef]
  17. Wang, S.; Yang, Y.; Wu, L.; Mohanty, L.; Jin, R.-B.; Zhang, L.; Lu, P. In-situ adjustable fiber-optic piezometer based on parallelly structured external Fabry-Perot interferometers with Vernier effect and its harmonics. Opt. Express 2021, 29, 42800–42812. [Google Scholar] [CrossRef]
  18. Gomes, A.D.; Ferreira, M.S.; Bierlich, J.; Kobelke, J.; Rothhardt, M.; Bartelt, H.; Frazão, O. Optical harmonic vernier effect: A new tool for high performance interferometric fibre sensors. Sensors 2019, 19, 5431. [Google Scholar] [CrossRef]
  19. Yang, X.; Yang, G.; Chen, M.; Bing, P.; Li, Z.; Yang, X.; Liu, Y.; Yao, J. Ultrasensitive RI and temperature sensor based on cascaded microfiber MZIs with Vernier effect. Opt. Laser Technol. 2024, 177, 111082. [Google Scholar] [CrossRef]
  20. Presti, D.L.; Massaroni, C.; Leitao, C.S.J.; Domingues, M.D.F.; Sypabekova, M.; Barrera, D.; Floris, I.; Massari, L.; Oddo, C.M.; Sales, S.; et al. Fiber Bragg Gratings for Medical Applications and Future Challenges: A Review. IEEE Access 2020, 8, 156863–156888. [Google Scholar] [CrossRef]
  21. Vaiano, P.; Carotenuto, B.; Pisco, M.; Ricciardi, A.; Quero, G.; Consales, M.; Crescitelli, A.; Esposito, E.; Cusano, A. Lab on Fiber Technology for biological sensing applications (Laser Photonics Rev. 10(6)/2016). Laser Photonics Rev. 2016, 10, 858. [Google Scholar] [CrossRef]
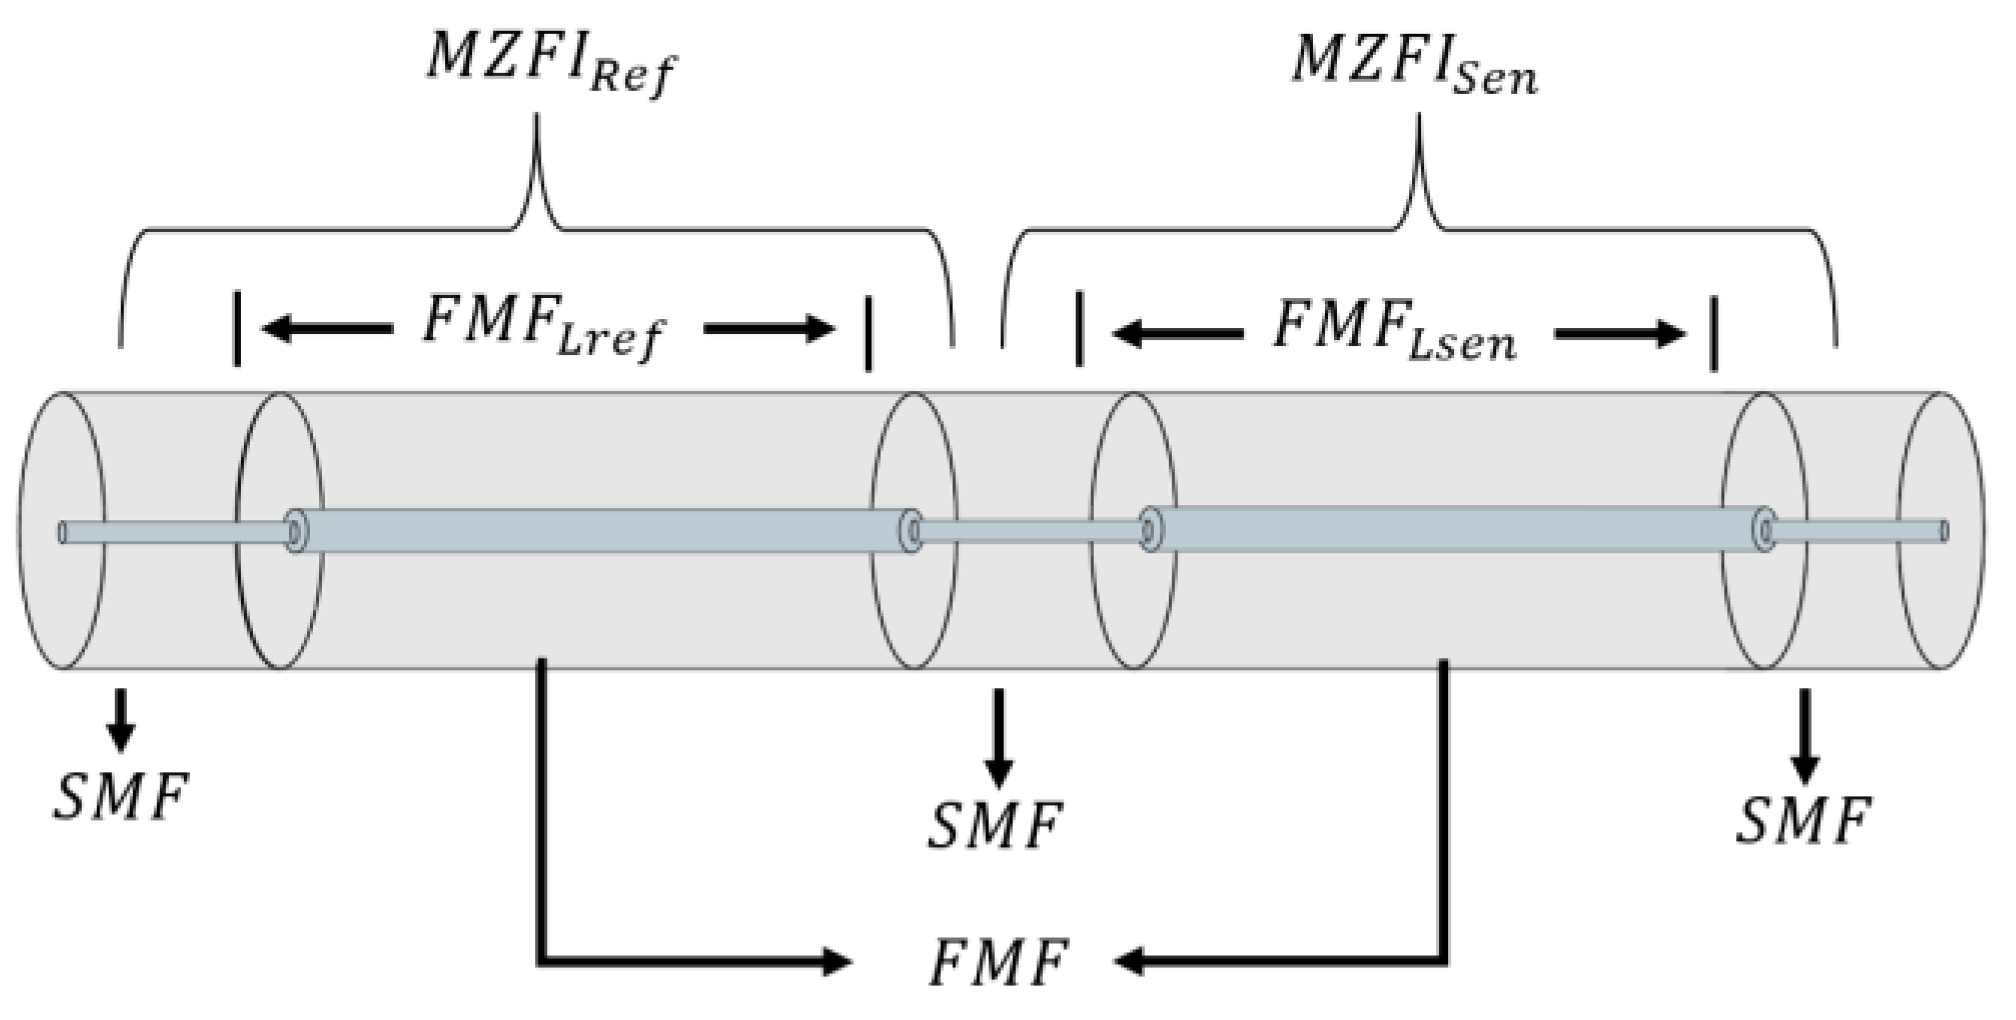
Figure 1. Schematic diagram of the cascade MZFIs.
Applsci 14 09300 g001
Figure 2. Transducer made of TPU that correlated the phase difference induced by the curvature of the optical fiber with the linear displacement.
Applsci 14 09300 g002
Figure 3. Experimental setup for the in-cascade MZFIs SFS structure to obtain OVE.
Applsci 14 09300 g003
Figure 4. (a,c) show the transmission spectra of MZFIRef and MZFISen, respectively. (b,d) represent their corresponding FFT spectra. (e) is the superimposed transmission of two MZFIs, and (f) is the FFT of the superimposed spectrum.
Applsci 14 09300 g004
Figure 5. (a,c) show the transmission spectra of MZFIRef and MZFISen, respectively. (b,d) represent their corresponding FFT spectra. (e) is the superimposed transmission of two MZFIs, and (f) is the FFT of the superimposed spectrum.
Applsci 14 09300 g005
Figure 6. (a,c) show the transmission spectra of MZFIRef and MZFISen, respectively. (b,d) represent their corresponding FFT spectra. (e) is the superimposed transmission of two MZFIs, and (f) is the FFT of the superimposed spectrum.
Applsci 14 09300 g006
Figure 7. (a,c) show the transmission spectra of MZFIRef and MZFISen, respectively. (b,d) represent their corresponding FFT spectra. (e) is the superimposed transmission of two MZFIs, and (f) is the FFT of the superimposed spectrum.
Applsci 14 09300 g007
Figure 8. (a,c) show the transmission spectra of MZFIRef and MZFISen, respectively. (b,d) represent their corresponding FFT spectra. (e) is the superimposed transmission of two MZFIs, and (f) is the FFT of the superimposed spectrum.
Applsci 14 09300 g008
Figure 9. The spectral shift of the envelopes as a function of linear displacement from table 1: (a) experiment 1, (b) experiment 2, (c) experiment 3, (d) experiment 4 and (e) experiment 5.
Applsci 14 09300 g009
Figure 10. Slopes of the envelopes from table 1: (a) experiment 1, (b) experiment 2, (c) experiment 3, (d) experiment 4 and (e) experiment 5.
Applsci 14 09300 g010
Figure 11. Specific characteristics of the first 4 harmonics of the 3 different devices described in table 2: (a) experimental setup 1, (b) experimental setup 2 and (c) experimental setup 3. It is observed that both the peaks and internal envelopes increase in proportion to “i + 1”, where “i” is the harmonic order.
Applsci 14 09300 g011
Figure 12. Spectral shift due to linear displacement. The red arrow indicates the wavelength shift: (a) first harmonic (one intersection); (b) second harmonic (three intersections); (c) third harmonic (six intersections); (d) fourth harmonic (multiple intersections).
Applsci 14 09300 g012
Figure 13. Sensitivity of the first four harmonics of the first device: (a) first harmonic; (b) second harmonic; (c) third harmonic; (d) fourth harmonic.
Applsci 14 09300 g013
Figure 14. Five devices demonstrating Blueshift (red arrows) in panels (a,c,e,g,i) and Redshift (blue arrows) in panels (b,d,f,h,j).
Applsci 14 09300 g014
Table 1. Main parameters of the experiments.
Number of Experiment L R e f
(cm)
L S e n
(cm)
F S R R e f
(cm)
F S R S e n
(nm)
F S R E n v e l o p e
(nm)
M Factor
11010.511.1210.3660.515.84
22020.55.965.8463.5310.87
33030.54.23.9667.9317.15
44040.53.12.9470.0825.19
55050.52.452.31115.7250.09
Table 2. Main parameters of the experiments for the harmonics.
Order L R e f
(cm)
Detuning
Factor Δ
(cm)
L S e n
(cm)
F S R R e f
(nm)
F S R S e n
(nm)
F S R E x t i
(nm)
F S R E x t i
(nm)
M I n t
Factor
Experimental setup 1First Harmonic10.5+0.521.510.365.8346.4692.9215.93
Second Harmonic323.7839.96119.8831.71
Third Harmonic
Fourth Harmonic
42.5
53
2.79
2.34
36.13
18.09
144.52
90.45
51.8
36.65
Experimental setup 2First Harmonic12.5+1269.244.55300.3600.6132
Second Harmonic38.53.1989.32267.9684
Third Harmonic512.461.6246.4102.66
Fourth Harmonic63.51.9827.72138.670
Experimental setup 3First Harmonic16.5−1327.543.781425.062850.12754
Second Harmonic48.52.54239.39718.185282.75
Third Harmonic651.8145.49181.96100.53
Fourth Harmonic81.51.4537.7188.5130
Table 3. Main parameters of the five fabricated tandems of concatenated MZFIs with their respective FFT analysis.
Number of Experiment L R e f
(cm)
L S e n
(cm)
F S R R e f
(nm)
F S R S e n
(nm)
F S R E n v e l o p e
(nm)
F r e q R e f
(nm−1)
F r e q S e n
(nm−1)
F r e q E n v e l o p e
(nm−1)
1 (Figure 4)1010.511.1210.3660.510.089920.096520.01652
2 (Figure 5)2020.55.965.8463.530.16770.17120.01574
3 (Figure 6)3030.54.23.9667.930.23800.25250.01472
4 (Figure 7)4040.53.12.9474.080.32250.34010.01349
5 (Figure 8)5050.52.452.31115.720.40810.43290.008864
Table 4. Main parameters of the five devices used to demonstrate Blueshift and Redshift.
Number of ExperimentLabel in Figure 14 F M F R e f
(cm)
F M F S e n
(cm)
1(a)17.518.5
(b)18.517.5
2(c)26.527.5
(d)27.526.5
3(e)34.535
(f)3534.5
4(g)41.542.5
(h)42.541.5
5(i)50.551.5
(j)51.550.5
Table 5. An overview of various sensors from different applications that have utilized FMF to achieve the OVE.
YearConfigurationApplicationMeasurement RangeSensitivityM
Factor
Ref.
2019Cascading an SI and an FMFStrain0–300 µε65.71 pm/µε20[4]
2020Structure SMF-TTFMF-SMFTemperature25–60 °C−3.348 nm/°C11.3[5]
2020Structure SMF-FMF-SMFGas Pressure
Temperature
0–10 MPa
25–40 °C
4.072 nm/MPa
1.753 nm/°C
21
40.4
[6]
2020Fabry–Perot in parallel with two access holes milled in the sensing FPIRIU0–8 × 10⁻⁵ RIU−568 nm/RIU
−28,496 nm/RIU
−418,387 nm/RIU
1
50.2
865
[7]
2021FMF with cascaded microcavities using a PDMS coatingTemperature35–45 °C4.7 nm/°C4.9[8]
2021FMF and PDMS
to form the SMF-air microcavity-FMF-PDMS-FMF structure.
Temperature40–56 °C3.98 nm/°C4.76[9]
2023Multimode interferometer (MMI) with FMF and a simulated reference arm technique SRAStrain0–1356.5 µε−5.18 pm/µε
−20.38 pm/µε
10.36
40.76
[10]
2024Micro-nano tapered TTMFSalinity
Temperature
0–39.22%
30–50 °C
6.138 nm/%
−3.672 nm/°C
13.64
14.81
[11]
2024Two parallel FP formed between tapered two-mode fiber cantilever beam inserted into quartz capillary and SMFStrain0–150 µε−2.30 nm/µε
−2.98 nm/µε
13.7
35.9
[12]
Temperature20–40 °C−79.6 pm/°C
−69.3 pm/°C
4.76
2024SFSDisplacementProposedAchieved(1) 9.36 nm/mm
(2) 16.03 nm/mm
(3) 18.06 nm/mm
(4) 19.88 nm/mm
(5) 39.07 nm/mm
(1) 5.84
(2) 10.87
(3) 17.15
(4) 25.19
(5) 50.09
This Work
0–15 mm(1) 0–15 mm
(2) 0–12.5 mm
(3) 0–10 mm
(4) 0–10 mm
(5) 0–5 mm
Disclaimer/Publisher’s Note: The statements, opinions and data contained in all publications are solely those of the individual author(s) and contributor(s) and not of MDPI and/or the editor(s). MDPI and/or the editor(s) disclaim responsibility for any injury to people or property resulting from any ideas, methods, instructions or products referred to in the content.