Abstract
This study explores the optimization of fused deposition modeling (FDM), a prominent 3D printing technology known for its accessibility and cost-effectiveness. The research aimed to identify and reduce errors associated with key printing parameters, specifically the layer height, printing temperature, and printing speed. Advanced tools such as a Keyence laser scanner and microscope were used to evaluate the dimensional accuracy and surface quality of various samples. The results indicate that the optimal settings for the layer height (0.16 mm), printing temperature (250 °C), and printing speed (350 mm/s) significantly minimize variation, resulting in more consistent and accurate prints. The results also showed that the samples printed with these optimized parameters had the lowest variability, underscoring the critical importance of precisely managing these factors. The findings highlight the critical role of fine-tuned FDM parameters in improving the quality and reliability of printed objects and provide valuable insights for further advances in 3D printing processes.
1. Introduction
Additive manufacturing (AM), particularly fused deposition modeling (FDM), has profoundly impacted numerous industries, offering cost-effective and flexible 3D printing solutions that have transformed the way products are manufactured. Notwithstanding the technological advancements that have occurred, ensuring the quality of 3D-printed parts continues to be a significant challenge due to the multitude of factors that affect the dimensional accuracy and surface integrity of the final product [1].
It is noteworthy that the digitized nature of 3D printing enables the expedited production of complex designs without the necessity of additional expenditures. This capability establishes 3D printing as a transformative technology across a range of industries, offering unparalleled levels of customization and innovation. The ability of 3D printing to create complex geometries that would be difficult or impossible with traditional methods allows for the exploration of new possibilities in fields such as healthcare, aerospace, and automotive manufacturing.
Nevertheless, as with any sophisticated manufacturing process, guaranteeing the quality and safety of 3D-printed products is of paramount importance. Manufacturing standards must be established and adhered to ensure the structural integrity and reliability of printed components, particularly in applications where precision and safety are of paramount importance, such as in medical implants or aerospace components [1]. It is of the utmost importance to implement consistent quality control measures and to develop new testing protocols to fully realize the potential of 3D printing while maintaining consumer and regulatory confidence in its outputs [2].
Several different types of 3D printing technologies are currently available, which include various methods, such as fused deposition modeling (FDM), stereolithography (SLA), selective laser sintering (SLS), and others. Each of these techniques has its own merits and limitations, with the choice of a particular one depending on factors such as the type of material used and the purpose for which the object is intended [3].
FDM has emerged as a highly popular and widely used technique in the field of 3D printing. This method involves the use of polymers to create models, prototypes, and even finished products [4]. One of the key factors driving the widespread adoption of FDM is its efficient and cost-effective fabrication process, which differentiates it from other prominent 3D printing methods. Despite its simplicity, FDM can produce complex shapes and intricate details with a satisfactory degree of accuracy [5]. FDM is a manufacturing method that involves depositing material layer by layer based on a 3D model. A filament feedstock is fed into the printer using rotating drive gears powered by a stepper motor. The drive gears have grooved surfaces to grip the filament securely. The filament melts as it passes through a heated liquefier and is pushed through the print nozzle by the solid portion of the filament acting like a piston. This complex process requires precise control of the filament feed mechanism and temperature to ensure consistent and reliable material deposition for creating detailed designs with strong structural integrity [5,6].
The core component of the FDM process is the utilization of a nozzle, typically characterized by a diameter of 0.4 mm, through which the filament feedstock is extruded. During the extrusion process, a thread of material is deposited in successive layers, with a thickness ranging from 0.1 to 0.4 mm. This range depends on various factors, including the settings of the 3D printer and the properties of the material being used [7].
The effectiveness of the FDM process largely depends on two crucial aspects: material selection and parameter optimization [8]. The material selection significantly influences the attributes and behavior of the printed object. Commonly used thermoplastics in FDM printing include PLA, ABS, PETG, and nylon, each offering unique strength, flexibility, heat resistance, and chemical resistance [9]. The selection of the appropriate filament material is essential to match the specific application and performance requirements of the printed item [3]. Optimizing the FDM parameters is equally important for a successful printing process. This involves the precise calibration and adjustment of a wide range of printing parameters, such as the nozzle temperature, bed temperature, layer height, printing speed, infill density, and cooling settings [10,11]. Proper management of these parameters ensures optimal layer adhesion, dimensional accuracy, the surface finish, and the structural integrity of the printed object. Additionally, fine-tuning aspects like the filament diameter, extrusion multiplier, and retraction settings are crucial to address potential issues such as stringing, warping, and layer adhesion inconsistencies [10,12].
It is noteworthy that the operational temperature range of an FDM printer typically falls within the span of 250–500 °C, albeit this is subject to variation depending on the specific model and manufacturer [13]. This temperature range encompasses the melting points of various thermoplastic materials commonly utilized in FDM printing, facilitating their extrusion and deposition onto the print bed. [13] In summary, the successful execution of the FDM process necessitates a judicious amalgamation of material science principles and meticulous parameter optimization. By leveraging suitable materials and fine-tuning the FDM parameters, practitioners can realize the full potential of this additive manufacturing technique, yielding printed objects characterized by superior quality, functionality, and performance [14,15].
The factors influencing the print quality of FDM have been the subject of several studies. Francisco Javier et al. [16] stressed the significance of quality control techniques, particularly during the product design and process planning stages. C. Grabowik et al. [17] suggest that while the filament quality can impact the strength of 3D-printed parts, its effect on the consumer-level print quality is minimal. Minjae Ko [18] advocates for the adoption of advanced test models and quantitative quality indexes to evaluate the quality of affordable 3D printing. Gordeev [19] directs attention to enhancing the quality of 3D-printed objects, emphasizing factors like the filament feed rate and wall geometry. These studies collectively underscore the necessity for a comprehensive approach to ensuring and evaluating the quality of 3D printing processes and products.
Ensuring the quality of 3D printing is of the utmost importance across various applications. It is important to consider these factors when making decisions about 3D printing. It is crucial to pay meticulous attention to various factors, including the dimensional accuracy, surface structure, and density [20]. Research has shown that the precision and accuracy of 3D-printed objects are profoundly influenced by the selection of the printing technology and specific parameters [21]. For example, the choice between material jetting or vat photopolymerization directly impacts the model accuracy [21]. It is crucial to optimize variables such as the line width, flow compensation, and geometric dimensions like the inner diameter and web thickness to ensure the production of high-quality 3D-printed products [22]. These factors have a significant impact on the uniformity of printed objects. By carefully considering and optimizing these variables, we can confidently produce high-quality 3D-printed products while maintaining a diplomatic approach to potential areas of disagreement [23].
In the realm of additive manufacturing, the quality of 3D printing can be both assessed and enhanced through the integration of sensors. These devices play a pivotal role in monitoring mechanical deformations within rigid bodies, with 3D-printed strain gauge sensors emerging as a notable avenue of exploration for this purpose [24]. Moreover, research has delved into understanding how alterations in the printing parameters impact the resultant quality of printed samples [25].
The flexibility afforded by rapid prototyping techniques, such as additive manufacturing, facilitates the facile creation of sensors tailored to specific geometric and material requirements. This capability enables swift iterations in design, empowering users to implement and evaluate modifications effectively [25,26].
Additionally, the monitoring of 3D printing operations can be facilitated through web-based applications linked to an Internet of Things (IoT) framework. These applications collect data from multiple sensors affixed to the printing device, allowing for the real-time assessment and optimization of printing processes [27].
The field of 3D printing has seen a rise in specialized sensors that are revolutionizing the way the process is monitored and controlled. Baumann [28] and Maillard [29] have both contributed to this trend, with Baumann focusing on sensor arrays that track motion/vibration, temperature, orientation, and humidity, while Maillard has developed 3D-printed optical sensors specifically designed for metrology purposes. Additionally, Agarwala [30] has introduced a flexible strain sensor with intricate microchannel features, showcasing the versatility of 3D printing in creating complex sensor designs. These advancements are poised to significantly improve the quality and efficiency of 3D printing technology.
Building on the existing research, this study aimed to optimize critical FDM printing parameters—specifically the layer height, temperature, and speed—using precise instrumentation and detailed perimeter accuracy analysis through box plot statistics. Advanced measurement tools, including a Keyence laser scanner and microscope, were employed to assess the dimensional accuracy and surface quality, focusing on enhancing the consistency of the outer perimeters of printed objects. This research seeks to comprehensively understand how the outer-perimeter and surface quality variables impact the overall print quality, with the findings contributing to the refinement of FDM techniques and insights for improving the print accuracy in industrial settings.
2. Materials and Methods
The FDM printing process is predicated on the principles of hot-melt extrusion, whereby objects are manufactured directly from digital 3D model data. At the outset of the process, a material is selected, typically a thermoplastic filament, which is 1.75 mm or 3.00 mm in diameter. This material is then fed into the printer through a rotating drive gear mechanism [31]. A stepper motor powers the filament through the system, with grooved drive gears ensuring security, and even feeding into the liquefier.
Once the filament reaches the heated liquefier, it undergoes a phase transition from a solid to a molten state. The solid part of the filament, located at the rear, acts like a piston, exerting pressure that forces the molten material through the print nozzle. This precise control of the material flow is critical to achieving high-quality prints [31].
FDM is popular for its versatility, ease of use, and ability to create complex geometries with various thermoplastic materials, making it ideal for prototyping and production in multiple industries [4]. Table 1 provides a comprehensive overview of the processes involved in printing and preparing for 3D printing, including the preparation of materials and digital models. Each step in these processes is crucial to achieving the desired final product. Understanding these processes can assist in selecting the optimal approach for specific needs.

Table 1.
FDM process.
2.1. Process of the Optimization of FDM Printing
The effectiveness of the FDM process depends on selecting suitable materials and precisely tuning the printing parameters, both of which are crucial for achieving smooth surface finishes and accurate results [13]. In the context of this research project, polylactide (PLA) was selected as the optimal material for 3D printing for several compelling reasons. PLA is widely used in FDM 3D printing due to its affordability, accessibility, and favorable properties, making it ideal for various applications. It has a low printing temperature (180 °C to 230 °C), reducing energy demands and simplifying temperature control. Additionally, PLA is biodegradable and made from renewable resources like cornstarch, offering an eco-friendly alternative to materials like ABS.
The technical properties of PLA (as shown in Table 2) include a favorable dimensional stability and minimal warping risk, which are crucial for the precise and uniform printing of objects, particularly in the context of critical parameters such as the layer height and printing speed. Its strength and stiffness render it a suitable material for a plethora of applications, particularly in the domain of prototyping and in contexts where high thermal or mechanical loads are not a prerequisite.

Table 2.
Technical parameters of PLA.
It is similarly important to recall the principal parameters associated with the FDM technique, which encompass the layer thickness, orientation, filling density, structure orientation, temperature, and speed. Incorrectly setting these parameters can result in the occurrence of undesirable outcomes, such as the over- or under-extrusion of the plastic material [36]. As illustrated in Figure 1, two noteworthy defects (identified with a red arrow) are evident in the printed sample: an excess of material at the perimeter and string-like formations that bear a resemblance to spider webs. These imperfections are accompanied by a visible unevenness in the surface texture of the side perimeter. Such defects typically arise due to an inability to control the printing parameters with sufficient precision, particularly regarding the temperature, feed rate, and print speed. The observed unevenness and stringing may be indicative of inappropriate nozzle temperature settings, which could result in excessive material deposition and filament drag. Achieving an optimal print quality necessitates a meticulous equilibrium between the viscosity of the polymer and the velocity at which it is extruded, which is temperature-dependent. It is therefore essential to calibrate the printing temperature of the chosen material to minimize these defects and ensure consistent surface quality [35].
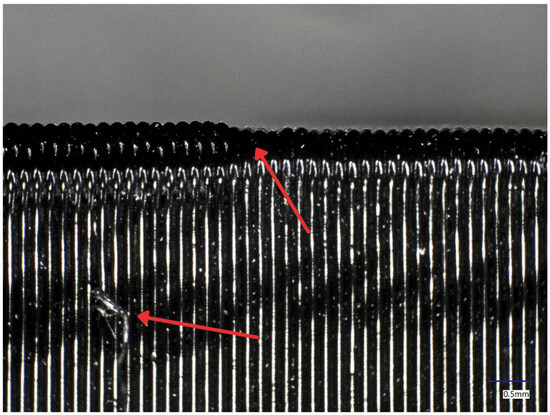
Figure 1.
Defects of 3D printing.
One of the key tools for monitoring and controlling 3D printing is the open-source OctoPrint system, which provides a user-friendly interface to streamline the printing process [37]. Users can easily monitor their prints, preview models, and adjust settings through a web interface, with the option to expand its capabilities through customizable plugins [38]. OctoPrint version 1.10.2 offers remote monitoring via built-in webcam access and real-time temperature control for optimal printing. Its GCODE visualizer allows for detailed customization and precise control over prints. With wide compatibility and easy add-on installation, it simplifies 3D printing management and enhances the print reliability and accuracy [39].
A 3D printing system can be modeled as a control system with input, state, and output parameters, allowing for comprehensive analysis and optimization. This model helps consider all factors affecting the final product’s quality. The parameters in 3D printing technology fall into three categories: input, state, and output [40].
Our first step was designing the model using graphics software to meet all the specifications and functional requirements. We then transferred the design to a web application, where we entered technical details for the 3D model, such as the material and geometry, creating the model in STL format. Finally, the STL file was imported into a slicer (as shown in Figure 2), which converted the model into layers and generated the G-code for the 3D printer [41]. The slicer allowed us to adjust various printing parameters, and we experimented with 17 variations, focusing on the layer height and print speed. This trial-and-error process helped us analyze how these adjustments impacted the final product’s quality. Smaller layer heights improved the detail and surface quality at the cost of longer print times, while larger heights sped up the printing but reduced the quality; similarly, faster print speeds decreased the accuracy, while slower speeds enhanced the quality but extended the print time [42].
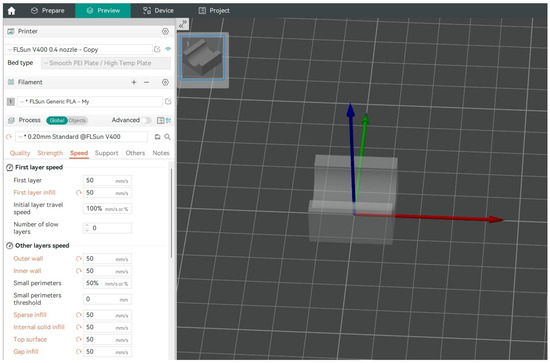
Figure 2.
Slicer 3D basic settings: filament, speed, quality, and printer selection.
In this piece of research, 17 samples were produced using a variety of different combinations of key parameters, including the temperature, printing speed, and layer height. These controlled variations permitted an exhaustive examination of the impact of disparate input parameters on the quality of the final 3D-printed products [43]. Table 3, Table 4 and Table 5 provide a comprehensive overview of the input parameters monitored for each sample, with specific attention to the temperature, layer thickness, and print speed. The primary objective was to ascertain which parameter combinations would yield optimal results, with a particular focus on enhancing the dimensional accuracy, surface finish, and overall material properties. Critical parameters, such as the nozzle temperature, bed temperature, and cooling rates, were meticulously adjusted throughout the printing process for each sample to assess their direct effect on the print quality.

Table 3.
Setting critical parameters (change—layer height).

Table 4.
Setting critical parameters (change—temperature).

Table 5.
Setting critical parameters (change—print speed).
2.2. Laser Sensor for Detecting Defects on Printed Products
The utilization of laser sensors has the potential to minimize errors and variations in the final products produced by the 3D printing process. The integration of such devices into equipment and machine control systems is facilitated by the provision of both analog and digital output signals [44]. The sensors are capable of measuring the dimensional properties of the objects that are being printed with great precision [45].
The Keyence LJ-X8020, (Keyence Internation NV/SA, Mechelen, Belgium) a high-precision 2D and 3D laser displacement sensor from the LJ-X8000 series, is widely employed in industrial settings, particularly in the inspection of defects in FDM 3D-printed products. Renowned for its high level of precision and material compatibility, the LJ-X8020 employs a blue semiconductor laser with a wavelength of 405 nm. This feature allows for the production of a precise and finely focused beam of light, which is ideal for conducting meticulous and precise inspections of surfaces. In particular, the resolution of the LJ-X8020 is contingent upon the selected measurement mode and configuration. It should be noted that the Z-axis resolution (height) is contingent upon the selected measurement range. The Z-axis resolution of the LJ-X8020 can be as low as 0.1 µm (microns), contingent on the selected range and settings. The resolution along the X-axis (width) is contingent upon the width of the measurement range. The LJ-X8020 can achieve a resolution along the X-axis of up to 4.5 µm [46]. All parameters you can see in Table 6.

Table 6.
Parameters of the Keyence LJ-X8020 laser sensor.
One of the LJ-X8020’s key features is its integration capability, allowing for its seamless incorporation into existing manufacturing and quality control systems via analog and digital output signals. This versatility makes it suitable for real-time monitoring and control in 3D printing. The continuous scanning and measurement of the printed layers enable the sensor to dynamically adjust the printing parameters, minimizing defects and enhancing the overall print quality [47].
The LJ-X8020’s advanced software enables precise data analysis and defect identification, facilitating the detection of issues like layer misalignments, warping, and surface roughness for a comprehensive quality assessment. This functionality is crucial in high-precision manufacturing environments, where maintaining the product quality is essential. In addition, the LJ-X8020 is capable of high-resolution measurement, which permits the detection of even the smallest defects, such as surface irregularity, dimensional inaccuracy, and structural inconsistency, in 3D-printed objects. The sensor’s capacity to capture 3200 points per profile ensures a comprehensive analysis of the printed surface, which is essential for the preservation of the quality and integrity of 3D-printed parts [48].
For the experiment, the decision was made to measure the outer perimeters of individual layers within a single sample, as shown in Figure 3. To achieve this, 1000 values were derived from the 3200 points measured by the laser sensor, as presented in Figure 4. These values represent 2.2 mm of the total thickness of the measured perimeter of the sample (Figure 5). Consequently, the total thickness of the measured strip of one sample is 5.2 mm. Figure 3 and Figure 4 illustrate the measurement process. This approach allows for a detailed analysis of the outer perimeters, providing insight into the dimensional accuracy and surface quality of the 3D-printed layers.
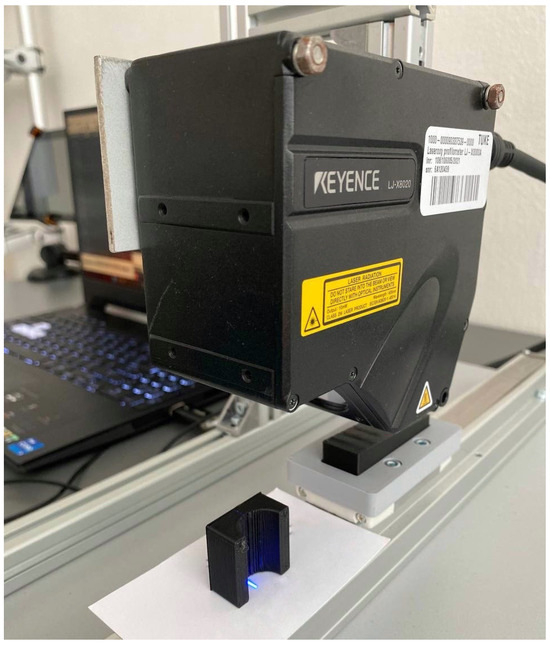
Figure 3.
The Keyence LJ-X8020 laser displacement sensor.
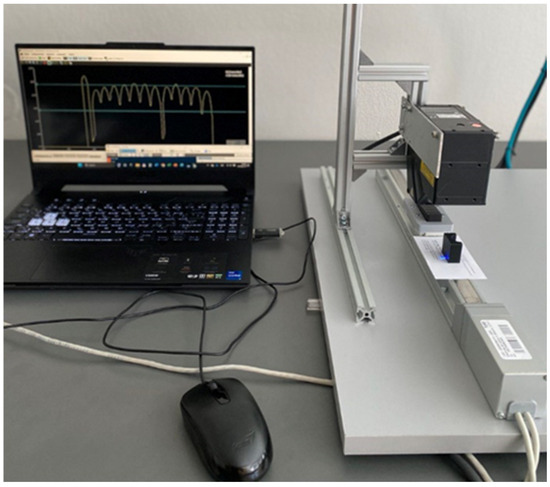
Figure 4.
The process of measuring the outer perimeter at each layer within a single sample.
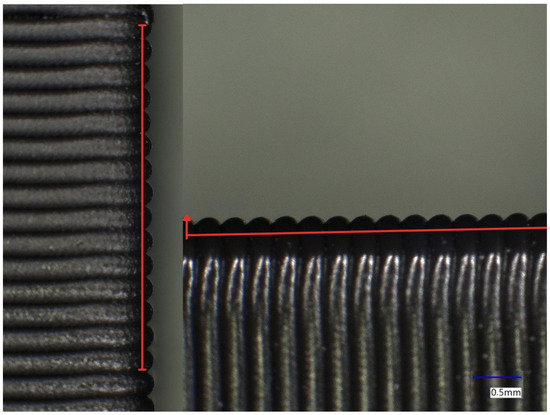
Figure 5.
The outer perimeter of a single sample.
The primary objective of the experiment was to scan the exterior boundaries of the samples marked with a red line, enabling a thorough examination of the printed object’s layers. Figure 5 shows these layers distinguished under a microscope, facilitating an in-depth analysis of the intricate layering. This approach allows for a meticulous inspection of the print quality and accuracy, revealing subtle nuances and providing a precise representation of the final product [49].
In-depth microscopic images are crucial for identifying potential issues such as layer alignment errors or minor imperfections that could affect the final product quality. Analyzing these images and the layer under the microscope is essential for fine-tuning 3D printer settings to achieve an optimal performance [50].
During the experiment, data were collected from 17 samples, each containing 1000 identical measured points across the lateral perimeter, to detect and evaluate discrepancies between layers. The main goal was to determine the maximum and minimum deviations in the 3D printing under various conditions and critical parameters for each sample [51]. The incorporation of this comprehensive measurement approach into the 3D printing process serves to enhance the quality of the final product and improve the overall reliability of the manufacturing process. This degree of precision and oversight is vital for advancing 3D printing technology across various industrial sectors [52]. The measurement method is of great importance for the comprehension of the layer uniformity, the examination of the influence of diverse printing parameters on the ultimate product, and the provision of a more precise evaluation. Precise measurements of the outer perimeters with a laser sensor yield valuable insights into the strength and quality of three-dimensional-printed objects, thereby enabling detailed inspections of the key features to identify and document any deviations or flaws. This process enables the identification and rectification of potential defects, thereby ensuring the production of high-quality and accurately sized components [53].
3. Results
The objective of the experiment was to identify the optimal 3D printing parameters for minimizing the deviation in the samples. For this purpose, we printed 17 samples under different printing parameter conditions, including variations in the printing temperature, layer height, and printing speed. Figure 6 presents a graphical representation of the samples printed at varying parameter values. The first row displays the samples printed at varying layer heights (0.08 mm to 0.39 mm) at a constant temperature of 225 °C and a speed of 50 mm/s. The second row depicts the samples printed at different temperatures (190 °C to 270 °C) at a constant layer height of 0.2 mm and a speed of 50 mm/s. The samples in the third row were printed at different printing speeds (ranging from 50 mm/s to 350 mm/s) at a constant temperature of 225 °C and a layer height of 0.2 mm.
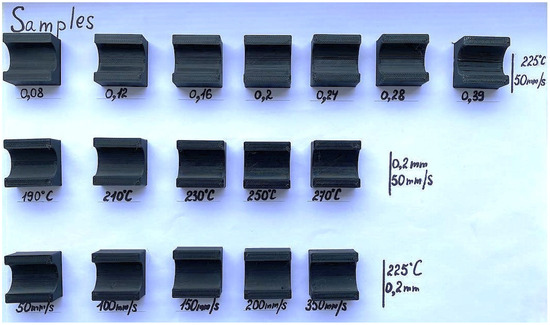
Figure 6.
Presentation of printed samples obtained during the experiment.
Figure 7 illustrates the external surface of a representative sample observed under optical microscopy, with a outer perimeter line. The image illustrates the distinct layers of the printed object, each of which is clearly discernible due to the high resolution of the microscope. The image illustrates the delineation of the individual layers, as indicated by the yellow dotted line, which facilitates a comprehensive examination of the intricate layering and the identification of subtleties and potential imperfections. This measurement approach is advantageous for gaining insights into the uniformity of the printed object’s layers, which, in turn, can inform the optimization of the printing process.
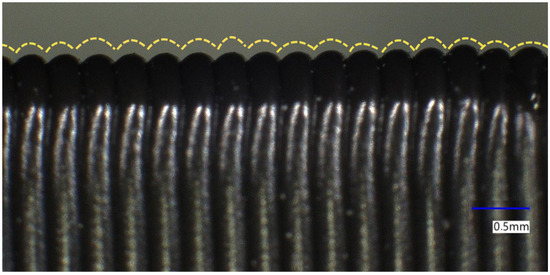
Figure 7.
Microscopic image of the outer edge of one sample.
By measuring the external boundaries of the samples using a laser sensor, 1000 data points from 3200 measurements were obtained for each sample. These values represent a 2.2 mm section of the overall thickness of the measured perimeter of the sample. To identify the range of the data, a plot was created. The graph (Figure 8) shows the measured outer-perimeter values for samples produced at various printing speeds. The X-axis represents the measurement values, which range from 1 to 1000 and correspond to individual points on the outer perimeter of the sample. The Y-axis depicts the height values in millimeters, spanning from 1.9 to 2.25 mm.
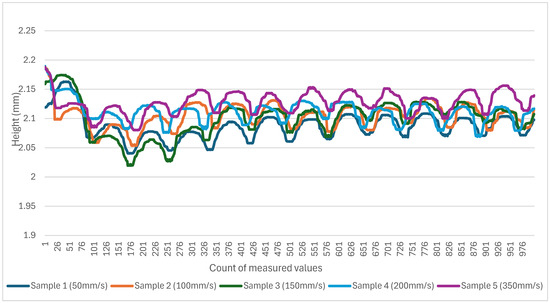
Figure 8.
Graph of measured outer-perimeter values for samples printed at different speeds.
The first sample is represented in dark blue. The values in question exhibit a range of approximately 0.123 mm, with notable fluctuations within this range. Sample 2, depicted in orange, exhibits values that are slightly inferior to those of Sample 1, spanning a range between 2.0533 mm and 2.1885 mm. However, it also demonstrates a pattern of regular oscillations. Sample 3, displayed in green, exhibits a comparable range to Sample 2, with values between 2.0195 mm and 2.1743 mm, though with slightly elevated minimum values. Sample 4, depicted in blue, exhibits values between 2.0688 mm and 2.1895 mm, displaying a distinctive pattern of oscillations in comparison to the other samples. Sample 5, depicted in purple, exhibits the most pronounced range of values, spanning from 2.08 mm to 2.188 mm, with discernible peaks and troughs. A statistical evaluation of the data indicates a consistent oscillation present in the measured values of all the samples, which may be indicative of regular variation in the perimeters of the printed layers. The range of values across the samples remains relatively consistent, with minimal variation between the lowest and highest values. This indicates that varying print speeds may influence the uniformity of the layered process to a certain extent, although the observed discrepancies are relatively insignificant.
Following the creation of a box plot (Figure 9) that provides a comprehensive overview of the consistency of and variations in the layering of the 3D-printed samples at different printing speeds, a table (Table 7) of values was constructed that offers a detailed analysis of the data. The height values range from 2.0195 mm to 2.1895 mm, enabling the overall range of and variation in the outer circumferences of the printed layers to be observed. These data are significant in optimizing the printing process and ensuring the production of high-quality final products. A comprehensive analysis of the data, accompanied by the presentation of detailed graphs, enables the identification of the optimal printing parameters, which, in turn, facilitates the reduction in errors and the enhancement of the quality of 3D-printed objects.
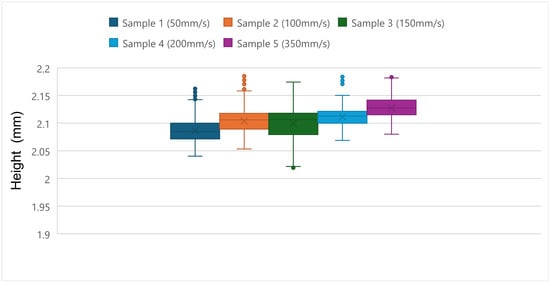
Figure 9.
Box plot summarizing data collected for samples printed at different speeds.

Table 7.
Table comparing statistical indicators of samples printed with different speed settings.
The following graph (Figure 10) illustrates the measured values of the outer perimeters for samples produced at varying print temperature changes. The objective of creating the graphs was to identify the spectrum of data in which the measured outer-perimeter values range. The initial graph illustrates the samples in which the objective was to ascertain the optimal printing temperature for the reduction in errors in the final prints. A graph of the measured values was created based on the examination of temperature data ranging from 190 °C to 270 °C. The X-axis represents the measurement values (1 to 1000), which correspond to individual points on the outer perimeter of the sample. The vertical axis represents the height values in millimeters, with a range of 0.2493 mm to 2.5 mm.
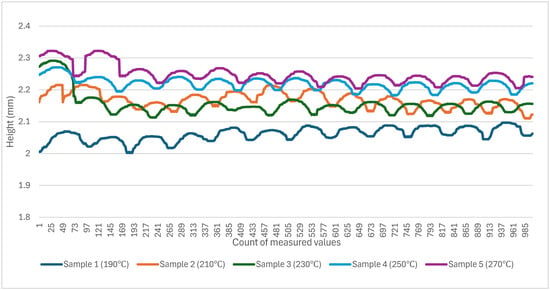
Figure 10.
Graph of measured outer-perimeter values for samples printed with different temperature settings.
The chart comprises five samples, which are represented by different colors. Sample 1 is represented by a dark-blue line and begins at a lower value, subsequently reaching a value of approximately 2 mm. Subsequently, the values demonstrate a reduction in variability and tend towards stability. Sample 2 is depicted in orange. Initially, there is a precipitous rise from 1 mm to a value of approximately 2 mm between points 1 and 17. Subsequently, the values stabilize at approximately 2 mm, exhibiting slight oscillations. Sample 5 is illustrated in purple and, as with Sample 2, commences at a lower value and rises abruptly to a value of approximately 2 mm between points 1 and 40. Following this increase, the values remain stable, exhibiting only minor fluctuations. Sample 4 (light blue) and Sample 3 (green) commence at approximately 2 mm and subsequently remain stable within this range, exhibiting only slight oscillations.
Subsequently, a box plot (Figure 11) was created to provide a comprehensive representation of the total range and deviation of the outer perimeters. The chart provides a comprehensive analysis of the consistency of and variation in the layering of the 3D-printed samples at different printing temperatures, as well as a detailed overview of how the printing temperature affected the outer perimeters of the samples. Sample 4 (light blue) exhibits the smallest range of values and the lowest variability, indicating that a temperature of 250 °C yields consistent results. Samples 2 (orange) and 3 (green) exhibit greater variability, indicating that intermediate temperatures (approximately 230 °C) result in slightly elevated variations. The values of Samples 1 (blue) and 5 (purple) span a range from approximately 0.326 mm to 2.3223 mm. This suggests that the greatest discrepancies are observed at temperatures approaching 270 °C.
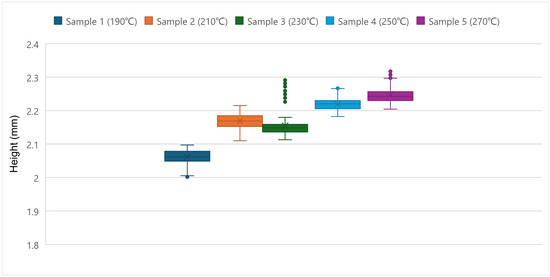
Figure 11.
Box plot summarizing data collected for samples printed with different temperature settings.
Consequently, the box plot illustrates the ranges of values and deviations, thereby enabling a comparison of the consistency of the individual samples. A table (Table 8) of values was constructed from these data, offering a detailed analysis of the data. Furthermore, the graph enables the extraction of the maximum and minimum values, which also allows for the overall range of the values to be observed. The data allow for the optimization of the printing temperature parameters to achieve the best quality of the final products. The data indicate that the printing temperature had a significant impact on the consistency of the outer perimeters of the printed samples. Lower temperatures resulted in more stable outcomes with reduced variation, whereas higher temperatures led to increased variation and potential quality issues in the final products. To optimize the printing process and achieve high-quality final products, it is therefore advisable to select lower printing temperatures.

Table 8.
Table comparing statistical indicators of samples printed with different temperature settings.
The subsequent graph (Figure 12) illustrates the recorded outer-perimeter values for samples produced with varying layer height settings. The X-axis represents the measurement values (1 to 1000), which correspond to individual points on the outer perimeter of the sample. The height values, expressed in millimeters (1.9 mm to 2.25 mm), are represented on the Y-axis. The seven distinct samples are represented by different colors. The samples are identified as follows: Sample 1 (blue); Sample 2 (orange); Sample 3 (green); Sample 4 (light blue); Sample 5 (purple); Sample 6 (light green); and Sample 7 (dark blue).
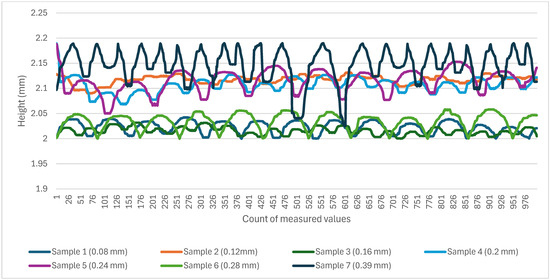
Figure 12.
Graph of measured outer-perimeter values for samples printed with varying layer height settings.
The range of values observed in Sample 1 (blue) spans from 2.0 mm to 2.0425 mm, exhibiting distinct and regular oscillations. This indicates that the perimeter height is inconsistent. Sample 2 (orange) exhibits a range of values from 2.09 mm to 2.1315 mm, with less pronounced oscillations than those observed in Sample 1. Sample 3 (green) exhibits a range of values from 2.0 mm to 2.0318 mm, displaying regular, moderate oscillations. Sample 4 (light blue) exhibits a range of values from 2.0683 mm to 2.1893 mm, with slight oscillations and a consistent range. Sample 5 (purple) exhibits a range of values from 2.05 mm to 2.188 mm, with a few significant oscillations present. Sample 6 (light green) exhibits a range of values from 2.0 mm to 2.0583 mm, with moderately significant oscillations. Sample 7 (dark blue) exhibits the most pronounced oscillations, with a range of values from 2.0248 mm to 2.1898 mm, and is therefore the sample with the largest range of values.
The box plot (Figure 13) provides an overview of the total range and outer-perimeter variations for each sample. From the plot, different layer height settings have a significant effect on the consistency of the outer perimeter. The data indicate that higher layer values, as observed in Samples 1 and 7, exhibit significant oscillations. This suggests that the layer height setting may influence the consistency and accuracy of the printed objects. A table (Table 9) of values was constructed based on the analyzed data, offering a detailed analysis of the data. It can be determined from this analysis that optimizing the layer height is key to minimizing errors and improving the quality of the final 3D-printed objects. This methodical approach allows for the precise configuration of the printing apparatus and the optimization of the printing process, thereby ensuring the production of the highest-quality final products.
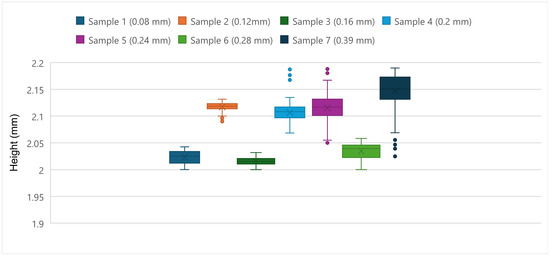
Figure 13.
Box plot summarizing data collected for samples printed with varying layer height settings.

Table 9.
Table comparing statistical indicators of samples printed with different height settings.
The final evaluation of the measured values for the outer perimeters of samples printed at different speeds, temperatures, and layer heights reveals several key aspects, which will be discussed in the following paragraphs. A total of 17 samples were subjected to analysis, with each sample printed using a distinct set of settings. An examination of the print speed plots revealed that varying speeds (from 50 mm/s to 350 mm/s) exert a significant influence on the consistency of the outer perimeter. The findings suggest that higher print speeds result in greater oscillations, indicating that lower speeds may be more conducive to achieving greater accuracy and consistency.
The analysis of the printing temperatures (ranging from 190 to 270 degrees Celsius) revealed a significant impact on the consistency and quality of the printed objects. Higher temperatures led to greater oscillations and inconsistent results, while lower temperatures resulted in more stable perimeter values. Additionally, a detailed examination of the layer height (from 0.08 mm to 0.39 mm) showed that adjusting this parameter significantly affects the outer perimeter, with higher layer heights causing notable oscillations and inconsistencies. This suggests that optimizing the layer height is crucial for achieving superior quality in final products. The final evaluation indicates that the meticulous optimization of the printing speed, temperature, and layer height is imperative to minimize errors and enhance the quality of 3D-printed objects. It is therefore evident that the consistent and accurate adjustment of these parameters is essential to achieve high-quality results.
This research was conducted to identify errors in 3D printing, with a particular focus on the setting of critical printing parameters. The experimental results, obtained using a Keyence laser scanner and microscope, demonstrated that the samples exhibited minimal imperfections. Box plots were employed to obtain data for a statistical analysis of the indices obtained for each printed sample.
Based on our analysis of the data, we compiled a table (Table 10) of the minimum deviations for each of the critical print parameters.

Table 10.
Minimum deviations of statistical data for set critical parameters in selected samples.
The data were subjected to analysis, which revealed that the samples printed with the optimal parameters exhibited the least variation. As can be observed from the table, the lowest minimum range deviation (min. range (R)) was observed for the change in the layer height (Sample 3: 0.16 mm), with a value of 0.007392462. When the printing temperature was modified (Sample 4: 250 °C), the minimum range deviation was 0.018802606, and when the printing speed was altered (Sample 5: 350 mm/s), the minimum range deviation was 0.018380501. The lowest value for the minimum span (min. span (S)) was observed when the layer height was altered (Sample 3: 0.16 mm), with a value of 0.0318.
4. Conclusions
The results, corroborated by laser profilometry and microscopic analysis, substantiate that the optimal layer height of 0.16 mm yielded the most uniform outcomes, exhibiting the least variation with a minimum range deviation (R) of 0.007392462 and a minimum span (S) of 0.0318, as indicated in the table. Higher print speeds and elevated temperatures resulted in larger oscillations and surface inconsistencies. In particular, the sample printed at 250 °C demonstrated a range deviation of 0.018802606, whereas a speed of 350 mm/s yielded deviations of 0.018380501. This illustrates that these settings introduce dimensional variations that could potentially impair the quality of the final product.
The analysis demonstrates that samples produced under the optimized printing parameters exhibited the least variation in the dimensional accuracy. The most favorable outcomes can be attained by making minor adjustments to the most crucial variables, including the layer height, printing temperature, and print speed. This approach also serves to reduce the occurrence of errors. This conclusion emphasizes the crucial role of controlling these key parameters in improving the print quality. Furthermore, future studies should investigate a more extensive range of materials, extending beyond PLA, ABS, PETG, and nylon, to gain a deeper understanding of their impact on the surface quality and dimensional precision.
Further investigation into parameters such as the infill density, cooling settings, and retraction settings is recommended, as they may exert a significant influence on the quality of the final product. The creation of software or algorithms to automate the optimization of these settings across a range of materials and geometries would be of significant benefit to the field. Furthermore, the long-term testing of printed samples will assist with evaluating how the material properties change over time and affect the overall print quality. To enhance the rigor and reliability of the findings, a more comprehensive examination of the materials that influence the print accuracy and quality is necessary. Furthermore, additional research should be conducted to optimize other FDM parameters, such as the filler density and cooling settings, which have the potential to significantly impact the resulting quality. The subsequent phase of this research may entail the development of sophisticated algorithms for the automatic optimization of these parameters across diverse materials and geometries. Moreover, the long-term durability testing of printed objects could yield valuable insights into their longevity and reliability.
Author Contributions
Conceptualization, O.K. and J.H.; methodology, J.H.; software, P.L.; validation, O.K. and J.H.; formal analysis, O.K. and P.L.; investigation, O.K. and J.H.; resources, O.K.; data curation, P.L.; writing—original draft preparation, O.K.; writing—review and editing, J.H. and O.K.; visualization, O.K. and P.L.; supervision, J.H.; project administration, J.H.; funding acquisition, J.H. All authors have read and agreed to the published version of the manuscript.
Funding
This research was funded by the Ministry of Education, Science, Research, and Sport of the Slovak Republic under the project VEGA 1/0700/24.
Institutional Review Board Statement
Not applicable.
Informed Consent Statement
Not applicable.
Data Availability Statement
Data is contained within the article.
Acknowledgments
This work was supported by the Slovak Research and Development Agency under the contract No. APVV-23-0591, and by the projects VEGA 1/0700/24 and KEGA 014TUKE-4/2023 granted by the Ministry of Education, Science, Research, and Sport of the Slovak Republic.
Conflicts of Interest
The authors declare no conflicts of interest.
References
- Rahim, T.N.A.T.; Abdullah, A.M.; Md Akil, H. Recent Developments in Fused Deposition Modeling-Based 3D Printing of Polymers and Their Composites. Polym. Rev. 2019, 59, 589–624. [Google Scholar] [CrossRef]
- Fang, Q.; Xiong, G.; Zhou, M.; Tamir, T.S.; Yan, C.-B.; Wu, H.; Shen, Z.; Wang, F.-Y. Process Monitoring, Diagnosis and Control of Additive Manufacturing. IEEE Trans. Autom. Sci. Eng. 2022, 21, 1041–1067. [Google Scholar] [CrossRef]
- He, H.; Zhu, Z.; Zhang, Y.; Zhang, Z.; Famakinwa, T.; Yang, R. (Chunhui) Machine Condition Monitoring for Defect Detection in Fused Deposition Modelling Process: A Review. Int. J. Adv. Manuf. Technol. 2024, 132, 3149–3178. [Google Scholar] [CrossRef]
- Kopec, J.; Pekarčíková, M.; Trojan, J. FDM Printing and Parameter Setting in the KISSlicer Program. In Proceedings of the EAI International Conference on Automation and Control in Theory and Practice, Orechová Potôň, Slovakia, 7–9 February 2024; Balog, M., Iakovets, A., Hrehova, S., Eds.; Springer Nature: Cham, Switzerland, 2023; pp. 183–192. [Google Scholar]
- Mercado Rivera, F.J.; Rojas Arciniegas, A.J. Additive Manufacturing Methods: Techniques, Materials, and Closed-Loop Control Applications. Int. J. Adv. Manuf. Technol. 2020, 109, 17–31. [Google Scholar] [CrossRef]
- Najjartabar Bisheh, M.; Chang, S.I.; Lei, S. A Layer-by-Layer Quality Monitoring Framework for 3D Printing. Comput. Ind. Eng. 2021, 157, 107314. [Google Scholar] [CrossRef]
- Przekop, R.E.; Gabriel, E.; Pakuła, D.; Sztorch, B. Liquid for Fused Deposition Modeling Technique (L-FDM)—A Revolution in Application Chemicals to 3D Printing Technology: Color and Elements. Appl. Sci. 2023, 13, 7393. [Google Scholar] [CrossRef]
- Shahrubudin, N.; Lee, T.C.; Ramlan, R. An Overview on 3D Printing Technology: Technological, Materials, and Applications. Procedia Manuf. 2019, 35, 1286–1296. [Google Scholar] [CrossRef]
- Singh, S.; Ramakrishna, S.; Berto, F. 3D Printing of Polymer Composites: A Short Review. Mater. Des. Process. Commun. 2020, 2, e97. [Google Scholar] [CrossRef]
- Ferretti, P.; Leon-Cardenas, C.; Santi, G.M.; Sali, M.; Ciotti, E.; Frizziero, L.; Donnici, G.; Liverani, A. Relationship between FDM 3D Printing Parameters Study: Parameter Optimization for Lower Defects. Polymers 2021, 13, 2190. [Google Scholar] [CrossRef]
- Kim, C.; Espalin, D.; Cuaron, A.; Perez, M.A.; MacDonald, E.; Wicker, R.B. A Study to Detect a Material Deposition Status in Fused Deposition Modeling Technology. In Proceedings of the 2015 IEEE International Conference on Advanced Intelligent Mechatronics (AIM), Busan, Korea, 7–11 July 2015; IEEE: Busan, Republic of Korea, 2015; pp. 779–783. [Google Scholar]
- Kim, H.; Lin, Y.; Tseng, B. A Review on Quality Control in Additive Manufacturing. Rapid Prototyp. J. 2018, 24, 645–669. [Google Scholar] [CrossRef]
- Kumar, S.; Kolekar, T.; Patil, S.; Bongale, A.; Kotecha, K.; Zaguia, A. A Low-Cost Multi-Sensor Data Acquisition System for Fault Detection in Fused Deposition Modelling. Sensors 2022, 22, 517. [Google Scholar] [CrossRef] [PubMed]
- Mwema, F.M.; Akinlabi, E.T. Basics of Fused Deposition Modelling (FDM). In Fused Deposition Modeling: Strategies for Quality Enhancement; Mwema, F.M., Akinlabi, E.T., Eds.; Springer International Publishing: Cham, Switzerland, 2020; pp. 1–15. ISBN 978-3-030-48259-6. [Google Scholar]
- Fused Deposition Modeling, FDM. Available online: https://www.manufacturingguide.com/en/fused-deposition-modeling-fdm (accessed on 9 July 2024).
- Blanco-Encomienda, F.; Rosillo-Díaz, E.; Muñoz, J. Importance of Quality Control Implementation in the Production Process of a Company. Eur. J. Econ. Bus. Stud. 2018, 4, 240–244. [Google Scholar] [CrossRef]
- Ćwikła, G.; Grabowik, C.; Kalinowski, K.; Paprocka, I.; Ociepka, P. The Influence of Printing Parameters on Selected Mechanical Properties of FDM/FFF 3D-Printed Parts. IOP Conf. Ser. Mater. Sci. Eng. 2017, 227, 012033. [Google Scholar] [CrossRef]
- Ko, M.; Kang, H.; Kim, J.; Lee, Y.; Hwang, J.-E. How to Measure Quality of Affordable 3D Printing: Cultivating Quantitative Index in the User Community. In HCI International 2016—Posters’ Extended Abstracts; Springer: Berlin/Heidelberg, Germany, 2016; Volume 617, p. 121. ISBN 978-3-319-40547-6. [Google Scholar]
- Gordeev, E.G.; Galushko, A.S.; Ananikov, V.P. Improvement of Quality of 3D Printed Objects by Elimination of Microscopic Structural Defects in Fused Deposition Modeling. PLoS ONE 2018, 13, e0198370. [Google Scholar] [CrossRef] [PubMed]
- Rozum, T.; Zolotukhina, K.; Kushlyk-Dyvulska, O.; Petryshyna, A.; Marchuk, I. Improving Printed Products Manufacturing Technology Using 3D Printing. East. Eur. J. Enterp. Technol. 2023, 2, 99–108. [Google Scholar] [CrossRef]
- Wang, M.R.; Jin, G.R.; Zhou, Y.R.; Chen, L.; Zhang, J.W.; Lin, X.Y.; Nan, F.Q.; He, W.D. Study on the Forming Quality of Double-Base Gun Propellants Based on Extrusion 3D Printing Technology. J. Phys. Conf. Ser. 2023, 2478, 032079. [Google Scholar] [CrossRef]
- Nguyen, P.; Stanislaus, I.; McGahon, C.; Pattabathula, K.; Bryant, S.; Pinto, N.; Jenkins, J.; Meinert, C. Quality Assurance in 3D-Printing: A Dimensional Accuracy Study of Patient-Specific 3D-Printed Vascular Anatomical Models. Front. Med. Technol. 2023, 5, 1097850. [Google Scholar] [CrossRef]
- Chen, J.R.; Morris, J.; Wentworth, A.; Sears, V.; Duit, A.; Erie, E.; McGee, K.; Leng, S. Three-Dimensional Printing Accuracy Analysis for Medical Applications across a Wide Variety of Printers. J. Med. Imaging 2023, 10, 026501. [Google Scholar] [CrossRef]
- Dipon, W.; Garnsey, S.; Estrada, M.; Guo, R.; Bhalla, A. Development and Evaluation of a Fast Fabrication Process-Based 3D Printed Strain Gauge Sensors. Ferroelectrics 2023, 611, 150–160. [Google Scholar] [CrossRef]
- Tauberova, R.; Lazorik, P.; Nazarejova, J.; Knapcikova, L. Monitoring of Printing Quality in Additive Manufacturing. In Proceedings of the 2023 14th International Conference on Measurement, Smolenice, Slovakia, 28–31 May 2023; pp. 1–4. [Google Scholar]
- Sun, Y.; Li, D.; Shi, Y.; Wang, Z.; Okeke, S.I.; Yang, L.; Zhang, W.; Zhang, Z.; Shi, Y.; Xiao, L. Application of 3D Printing Technology in Sensor Development for Water Quality Monitoring. Sensors 2023, 23, 2366. [Google Scholar] [CrossRef]
- Sampedro, G.A.; Agron, D.J.; Huyo-a, S.L.; Abisado, M.; Kim, D.-S.; Lee, J.-M. 3D Printer State Monitoring Mobile Application through a Deep Learning Approach. In Proceedings of the 2022 IEEE International Symposium on Advanced Control of Industrial Processes (AdCONIP), Vancouver, BC, Canada, 7–9 August 2022; pp. 283–284. [Google Scholar]
- Baumann, F.; Schön, M.; Eichhoff, J.; Roller, D. Concept Development of a Sensor Array for 3D Printer. Procedia CIRP 2016, 51, 24–31. [Google Scholar] [CrossRef]
- Maillard, P.; Heinrich, A. 3D Printed Freeform Optical Sensors for Metrology Application; Duparré, A., Geyl, R., Eds.; SPIE: Jena, Germany, 2015; p. 96281J. [Google Scholar]
- Agarwala, S.; Goh, G.L.; Yap, Y.L.; Goh, G.D.; Yu, H.; Yeong, W.Y.; Tran, T. Development of Bendable Strain Sensor with Embedded Microchannels Using 3D Printing. Sens. Actuators A Phys. 2017, 263, 593–599. [Google Scholar] [CrossRef]
- Husár, J.; Kaščak, J. Monitoring the Energy Consumption of FDM Device Based on the Variation of Operating Parameters: A Study. In Sustainable Management of Manufacturing Systems in Industry 4.0; Knapcikova, L., Peraković, D., Perisa, M., Balog, M., Eds.; Springer International Publishing: Cham, Switzerland, 2022; pp. 237–258. ISBN 978-3-030-90462-3. [Google Scholar]
- Rupal, B.S.; Mostafa, K.G.; Wang, Y.; Qureshi, A.J. A Reverse CAD Approach for Estimating Geometric and Mechanical Behavior of FDM Printed Parts. Procedia Manuf. 2019, 34, 535–544. [Google Scholar] [CrossRef]
- Sampedro, G.A.R.; Agron, D.J.S.; Amaizu, G.C.; Kim, D.-S.; Lee, J.-M. Design of an In-Process Quality Monitoring Strategy for FDM-Type 3D Printer Using Deep Learning. Appl. Sci. 2022, 12, 8753. [Google Scholar] [CrossRef]
- Mollah, M.T.; Comminal, R.; Serdeczny, M.P.; Pedersen, D.B.; Spangenberg, J. Stability and Deformations of Deposited Layers in Material Extrusion Additive Manufacturing. Addit. Manuf. 2021, 46, 102193. [Google Scholar] [CrossRef]
- Hongyao, S.; Xiaoxiang, Y.; Jianzhong, F. Research on the Flexible Support Platform for Fused Deposition Modeling. Int. J. Adv. Manuf. Technol. 2018, 97, 3205–3221. [Google Scholar] [CrossRef]
- Solomon, I.J.; Sevvel, P.; Gunasekaran, J. A Review on the Various Processing Parameters in FDM. Mater. Today Proc. 2021, 37, 509–514. [Google Scholar] [CrossRef]
- Kakade, S.; Mulay, A.; Patil, S. IoT-Based Real-Time Online Monitoring System for Open Ware FDM Printers. Mater. Today Proc. 2022, 67, 363–367. [Google Scholar] [CrossRef]
- Di Cataldo, S.; Vinco, S.; Urgese, G.; Calignano, F.; Ficarra, E.; Macii, A.; Macii, E. Optimizing Quality Inspection and Control in Powder Bed Metal Additive Manufacturing: Challenges and Research Directions. Proc. IEEE 2021, 109, 326–346. [Google Scholar] [CrossRef]
- Häußge, G. OctoPrint.Org. Available online: https://octoprint.org/ (accessed on 19 December 2023).
- Pavlenko, I.; Piteľ, J.; Ivanov, V.; Berladir, K.; Mižáková, J.; Kolos, V.; Trojanowska, J. Using Regression Analysis for Automated Material Selection in Smart Manufacturing. Mathematics 2022, 10, 1888. [Google Scholar] [CrossRef]
- Kaščak, J.; Gašpár, Š.; Paško, J.; Knapčíková, L.; Husár, J.; Baron, P.; Török, J. Design of an Atypical Construction of Equipment for Additive Manufacturing with a Conceptual Solution of a Printhead Intended for the Use of Recycled Plastic Materials. Appl. Sci. 2021, 11, 2928. [Google Scholar] [CrossRef]
- Demčák, J.; Židek, K.; Krenický, T. Digital Twin for Monitoring the Experimental Assembly Process Using RFID Technology. Processes 2024, 12, 1512. [Google Scholar] [CrossRef]
- Behun, M.; Kascak, P.; Hrabcak, M.; Behunova, A.; Knapcikova, L.; Sofranko, M. Investigation of Sustainable Geopolymer Composite Using Automatic Identification Technology. Sustainability 2020, 12, 6377. [Google Scholar] [CrossRef]
- Lazár, I.; Husár, J. Validation of the serviceability of the manufacturing system using simulation. J. Effic. Responsib. Educ. Sci. 2012, 5, 252–261. [Google Scholar] [CrossRef][Green Version]
- Adamczak, M.; Kolinski, A.; Trojanowska, J.; Husár, J. Digitalization Trend and Its Influence on the Development of the Operational Process in Production Companies. Appl. Sci. 2023, 13, 1393. [Google Scholar] [CrossRef]
- Duhančík, M.; Židek, K.; Husár, J. The Automated Quality Control of 3D Printing using Technical SMART Device. In Proceedings of the 2024 25th International Carpathian Control Conference (ICCC), Krynica Zdrój, Poland, 22–24 May 2024; pp. 1–6. [Google Scholar] [CrossRef]
- Lishchenko, N.; Piteľ, J.; Larshin, V. Online Monitoring of Surface Quality for Diagnostic Features in 3D Printing. Machines 2022, 10, 541. [Google Scholar] [CrossRef]
- Coranic, T.; Mascenik, J. Experimental Measurement of Dynamic Characteristics of Structural Units. Processes 2023, 11, 3333. [Google Scholar] [CrossRef]
- Trojanowska, J.; Żywicki, K.; Varela, M.L.R.; Machado, J.M. Shortening changeover time—An industrial study. In Proceedings of the 2015 10th Iberian Conference on Information Systems and Technologies (CISTI), Aveiro, Portugal, 17–20 June 2015; pp. 1–6. [Google Scholar] [CrossRef][Green Version]
- Duhancik, M.; Krenicky, T.; Coranic, T. Design and Testing of a Measurement Device for High-Speed Bearing Evaluation. Appl. Sci. 2024, 14, 508. [Google Scholar] [CrossRef]
- Vandzura, R.; Simkulet, V.; Gelatko, M.; Hatala, M.; Mitalova, Z. Effect of Hardening Temperature on Maraging Steel Samples Prepared by Direct Metal Laser Sintering Process. Machines 2023, 11, 351. [Google Scholar] [CrossRef]
- Husar, J.; Knapcikova, L.; Balog, M. Implementation of Material Flow Simulation as a Learning Tool. In Design, Simulation, Manufacturing: The Innovation Exchange; Springer: Cham, Switzerland, 2019; pp. 33–41. [Google Scholar] [CrossRef]
- Żukowska, M.; Górski, F.; Wichniarek, R.; Kuczko, W. Methodology of Low Cost Rapid Manufacturing of Anatomical Models with Material Imitation of Soft Tissues. Adv. Sci. Technol. Res. J. 2019, 13, 120–128. [Google Scholar] [CrossRef] [PubMed]
Disclaimer/Publisher’s Note: The statements, opinions and data contained in all publications are solely those of the individual author(s) and contributor(s) and not of MDPI and/or the editor(s). MDPI and/or the editor(s) disclaim responsibility for any injury to people or property resulting from any ideas, methods, instructions or products referred to in the content. |
© 2024 by the authors. Licensee MDPI, Basel, Switzerland. This article is an open access article distributed under the terms and conditions of the Creative Commons Attribution (CC BY) license (https://creativecommons.org/licenses/by/4.0/).