Article

Investigation of the Conservatism in Multiple Cracks Coalescence Criteria Using Finite Element-Based Crack Growth Analysis

Department of Mechanical System Design Engineering, Seoul National University of Science and Technology, 232 Gongneung-ro, Nowon-gu, Seoul 01811, Republic of Korea
*
Author to whom correspondence should be addressed.
These authors contributed equally to this work.
Appl. Sci. 2024, 14(20), 9441; https://doi.org/10.3390/app14209441
Submission received: 11 September 2024 / Revised: 10 October 2024 / Accepted: 10 October 2024 / Published: 16 October 2024

Abstract

:
The interactions between multiple cracks significantly influence fracture mechanics parameters, necessitating their consideration in crack assessments. Codes such as ASME Section XI, API 579, BS 7910, and British Energy R6 provide guidelines for crack growth and coalescence, taking crack interactions into account. However, these guidelines often employ idealized crack models, which lead to overly conservative assessments. This study proposes a new criterion for multiple crack coalescence, based on the plastic zone size, to better model the growth and merging of natural cracks. This criterion was implemented using the Advanced Iterative Finite Element Method (AI-FEM), an automated crack-growth simulation program utilizing re-meshing. Fatigue crack growth (FCG) simulations using AI-FEM validated the proposed criterion by comparing it with experimental data. Additionally, the AI-FEM results were compared with those obtained through code-based procedures to evaluate the conservatism of current codes. The findings demonstrate that the proposed criterion closely matches experimental results, providing a more realistic simulation of crack growth and reducing the conservatism of existing codes.

1. Introduction

Cracks in nuclear power plant (NPP) structures can develop due to residual stress, cyclic loading, and corrosion [1,2]. In-service inspections are carried out to detect these cracks. If the detected crack size does not exceed the allowable crack size specified in ASME Section XI [3], the NPP can continue to operate without requiring maintenance or replacement. However, if the crack size exceeds the allowable crack size, the detected crack is assumed to be an idealized semi-elliptical or circular shape, and structural integrity is assessed using fracture mechanics parameters, including the elastic stress intensity factor (SIF) and the elastic–plastic J-integral [4]. This evaluation determines the maintenance and replacement cycle of NPP structures by comparing the findings with the critical crack size specified in ASME Section XI. For multiple cracks, various studies [5,6,7,8,9] have revealed that interaction effects vary depending on factors such as the distance between cracks, geometric configuration, and loading conditions.
These interaction effects alter the trends of fracture mechanics parameters due to the influence between adjacent cracks. Moreover, as adjacent cracks grow and coalesce into a single crack, the crack shape can diverge from the idealized semi-elliptical or circular form. The variability in fracture mechanics parameters due to these interaction effects, along with the changes in crack shape caused by multiple crack coalescence, makes it challenging to accurately assess structural integrity under multiple crack conditions.
To address these challenges, existing codes such as ASME Section XI, API 579 [10], BS 7910 [11], and British Energy R6 [12] provide criteria for coalescence distance and shape to account for crack interaction in crack evaluation. These coalescence criteria propose that, when the distance between adjacent cracks meets a specific coalescence distance criterion, the multiple cracks should be treated as a single, idealized semi-elliptical crack.
However, this approach may lead to overly conservative predictions of coalescence timing, potentially treating non-cracked areas as cracks and resulting in an excessively conservative structural integrity assessment. Such evaluations can prematurely advance the maintenance and replacement cycles of NPP structures, potentially incurring unnecessary costs.
Extensive studies utilizing 3D finite element analysis (FEA) have been conducted to evaluate the conservatism of the coalescence criteria considering interaction effects proposed in these codes [13,14,15]. Hasegawa et al. [13] conducted a quantitative analysis of the interaction effects on the SIF under membrane and bending stresses to validate the suitability of the newly proposed coalescence criterion, which aims to reduce the conservatism of the existing ASME Section XI criteria. The study confirmed that the new coalescence criterion is less conservative than the ASME Section XI and is more suitable for evaluating multiple cracks. Kim et al. [14] quantitatively analyzed the impact of distance and aspect ratio between multiple cracks located in the same plane of a plate structure on interaction effects using SIF and J-integral values. They compared the interaction effects observed under various distance conditions with the coalescence distance criteria specified in ASME Section XI, API 579, and BS 7910 to evaluate conservatism and discuss potential improvements to the existing coalescence criteria. M. Kamaya et al. [15] analyzed the interaction effects of non-coplanar multiple cracks in plate structures, considering the distance between cracks and the offset distance between planes under limited loading conditions, to propose an alternative to the offset distance criteria presented in ASME Section XI by examining changes in the SIF and the J-integral. These studies have quantitatively analyzed the interaction effects of multiple cracks on fracture mechanics parameters using 3D FEA techniques and verified the conservatism of coalescence criteria specified in existing codes. However, 3D FEA techniques are limited to examining interaction effects only in stationary multiple crack conditions, thus presenting a limitation in assessing the conservatism of coalescence crack shape criteria proposed in existing codes.
For this reason, extensive studies have been conducted using 3D iterative FEA to evaluate the conservatism of the coalescence shape criteria in codes that assume multiple cracks coalesce into a single semi-elliptical crack [16,17,18,19]. Iterative FEA is preferred as it simulates crack growth more naturally by calculating crack growth at each node along the crack front [20]. X. B. Lin et al. [16] performed 3D iterative FEA using the commercial FEA software Abaqus (2021 version) to simulate fatigue crack growth (FCG) for various single and multiple cracks in piping, verifying the suitability of iterative FEA for crack-growth simulations and identifying an increase in the SIF during coalescence in multiple crack conditions. H. Doi et al. [17] developed the CRACK-FEM program to simulate FCG for multiple cracks in a plate, validating the effectiveness of CRACK-FEM through comparisons with experimental results. This study fixed the coalescence distance criterion for multiple cracks at a specific distance. M. Kikuchi et al. [18] utilized S-version FEM to simulate FCG for multiple cracks of varying sizes in a plate to examine the rationality of the coalescence criterion proposed by the JSME Code [21]. Through comparisons between experimental results, FEA results, and the JSME Code methodology, they confirmed that the JSME Code reasonably predicts coalescence behavior. J. F. Wen et al. [19] proposed a new coalescence criterion for FCG and SCC crack growth, applied it to ZENCRACK for iterative FEA, and simulated FCG for multiple cracks in a plate. The results were compared with those obtained using methodologies from ASME Section XI, BS 7910, API 579, and GB/T19624 [22], confirming the suitability of the proposed coalescence criteria for multiple cracks.
These studies have demonstrated that 3D iterative FEA is suitable for predicting the growth behavior of multiple cracks. However, most studies have focused on applying existing coalescence criteria to 3D iterative FEA to evaluate the suitability of current codes. Although some prior studies have proposed new coalescence criteria for multiple cracks, they have not extended to validation through comparisons with experimental results. Therefore, comprehensive studies that propose and validate a new coalescence criterion for multiple cracks thereby examining the conservatism of the coalescence criteria presented in existing codes, remain limited.
This study proposes a coalescence criterion based on plastic zone size to simulate the natural growth and coalescence of multiple cracks. This criterion was implemented in the Advanced Iterative Finite Element Method (AI-FEM) algorithm, an automatic crack growth program utilizing re-meshing developed by Lee et al. [23]. Fatigue Crack Growth (FCG) simulations were conducted using AI-FEM for multiple cracks on the same plane within both plate and pipe geometries. The proposed coalescence criterion was validated through comparisons between AI-FEM results and experimental data. Additionally, the new criterion was compared with the ASME Section XI coalescence criterion, allowing for a quantitative analysis of the conservatism in existing codes. This paper is structured as follows: Section 2 reviews coalescence criteria for multiple cracks as presented in various codes. Section 3 details the AI-FEM algorithm, focusing on the proposed plastic zone size-based criteria. Section 4 compares AI-FEM results with experimental data and examines the conservatism of ASME Section XI criteria for plate geometries. Section 5 extends this analysis to pipe geometries. Finally, Section 6 presents this study’s conclusions.

2. Review of the Multiple Cracks Coalescence Criteria in Codes

In this study, to propose a coalescence criterion for adjacent multiple surface cracks on the same plane, the coalescence criteria of various codes were investigated. The results of analyzing codes such as ASME Section XI, API 579, BS 7910, and British Energy R6 are summarized in Table 1. The investigation revealed that, although various codes initially proposed different coalescence criteria, continuous development has led to the suggestion of the same critical distance ( S m ) for cases where the crack depth is less than or equal to the crack length. However, for cases where the crack depth exceeds the crack length, only BS 7910 and R6 provide separate coalescence criteria. Figure 1 illustrates the concept of coalescence for multiple cracks. In Figure 1, a 1 and a 2 represent the depths of each crack, while c 1 and c 1 represent half of the crack lengths. The distance between the two adjacent cracks is denoted as S . Additionally, a and c represent the depth and half of the crack length, respectively, when the two surface cracks are considered as a single semi-elliptical crack according to the coalescence methodologies presented in the codes. If S is less than or equal to S m ( S S m ), the two adjacent surface cracks are coalesced into a single semi-elliptical surface crack, where the crack depth is defined by Equation (1) and the crack length by Equation (2), as presented in Table 1.
a = m a x ( a 1 , a 2 )
2 c = 2 c 1 + c 2 + S
The depth of the coalesced single semi-elliptical crack is defined as the depth of the deeper of the two surface cracks, while the length is defined as the sum of the lengths of the two surface cracks and the distance between them.

3. Development of AI-FEM Multiple Cracks Growth Algorithm

3.1. The Overall Procedure for Multiple Cracks Growth in AI-FEM

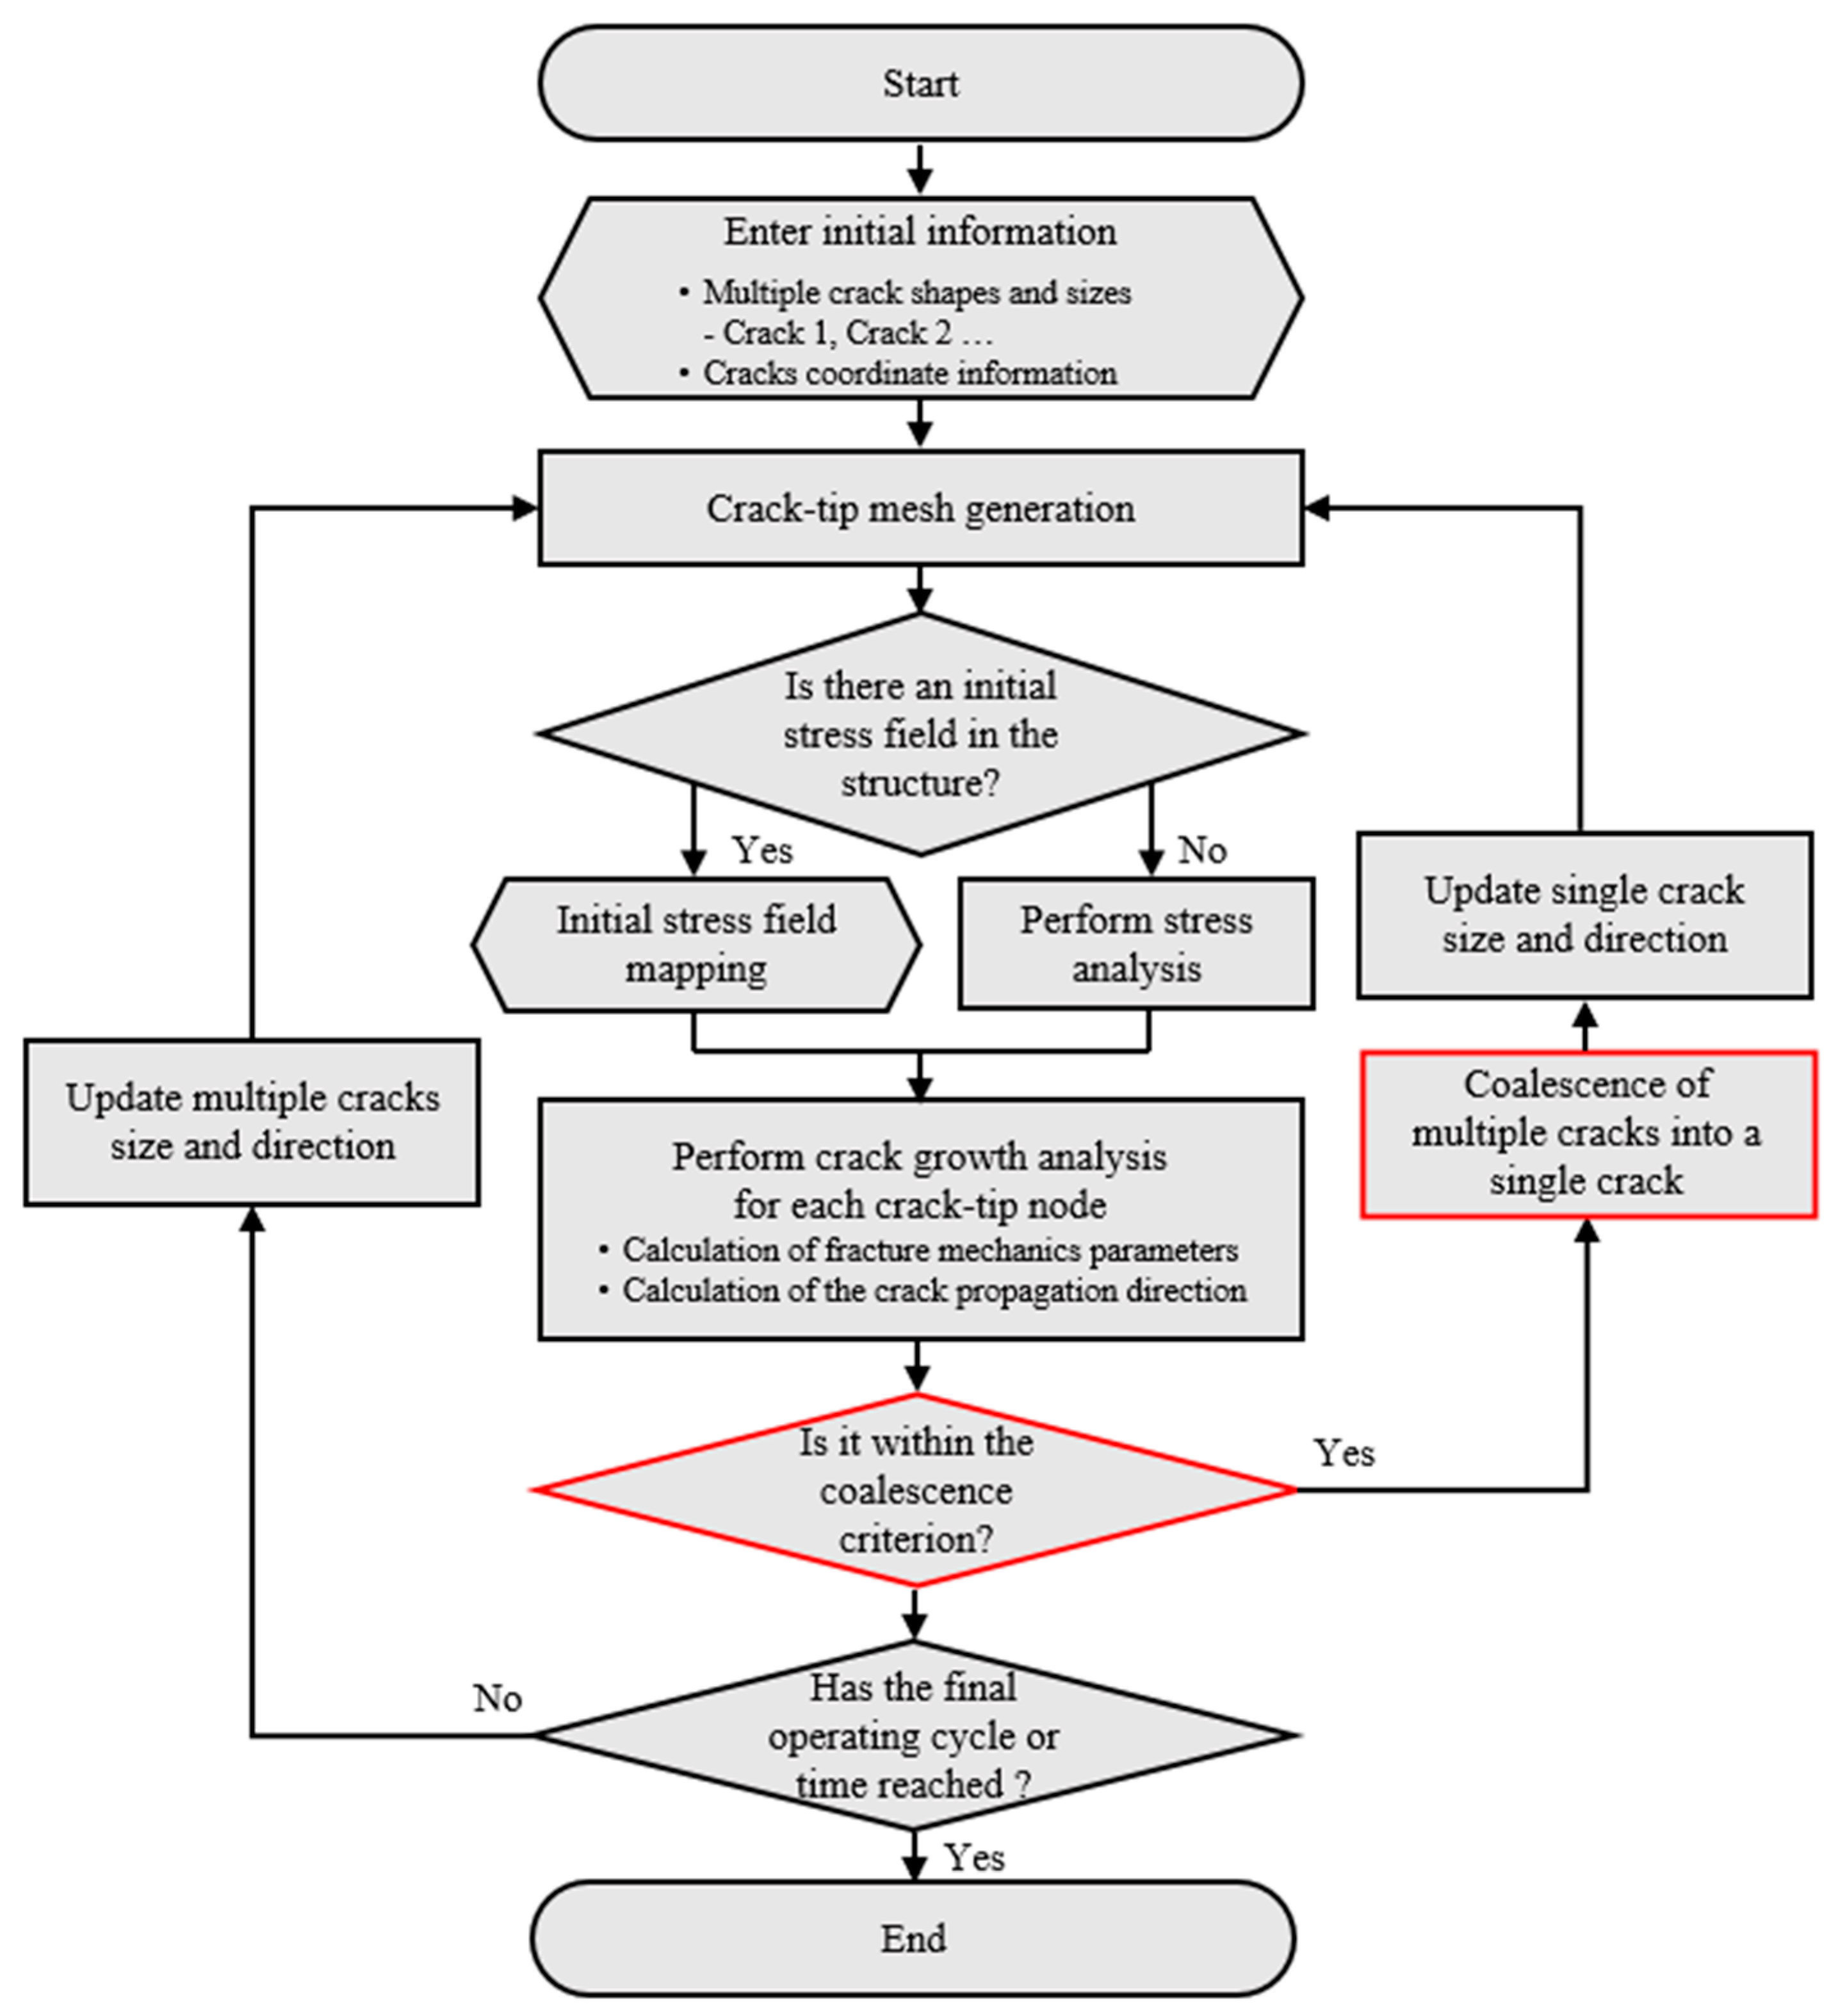
AI-FEM is a Python-based plugin for the commercial finite element analysis (FEA) program Abaqus [24], which automatically simulates crack growth using re-meshing techniques. Although AI-FEM was originally designed to simulate single-crack growth, additional functionality has been developed through this study to simulate the growth of multiple cracks. Figure 2 illustrates the algorithm of AI-FEM for simulating the growth of multiple cracks.
First, the initial crack information, including the shape and location of the multiple cracks, as well as the geometry of the structure, is input. Then, AI-FEM automatically generates elements based on the input information. As shown in Figure 3, C3D20R elements (quadratic brick elements with reduced integration) are used for the crack-tip region, C3D10 elements (quadratic tetrahedral elements) are used for the region around the crack, and C3D8R elements (linear reduced-integration elements) are used for the rest of the structure. The reason for using tetrahedral elements (C3D10) in the region around the crack is to provide higher degrees of freedom when modeling the crack. The reason for using reduced integration elements is to reduce computational time costs while maintaining analysis accuracy. The appropriateness of the element type applied to each region was previously verified by Lee et al. [23] through comparison with theoretical results. The spider-web configuration of the crack-tip elements is essential for accurately calculating the SIF [25].
Next, depending on the user’s needs, the initial stress field can be mapped using Abaqus (2021 version) ‘Map Solution’ function. This step is optional and can be omitted if not needed. Subsequently, the SIF is calculated through FEA, and the amount of crack growth is determined based on Paris’ law input by the user, preparing for modeling subsequent cracks. The newly modeled crack contains more elements compared to the previous crack model. This is to represent the larger crack shape as the crack grows. On the other hand, the element size varies depending on the region. For the crack-tip region (C3D20R), the initial element size set by the user is maintained, whereas for the region surrounding the crack-tip (C3D10), the element size changes adaptively. As shown in Figure 3, the farther the distance from the crack tip, the larger the C3D10 element size becomes.
In the next step, the distance ( S ) between adjacent cracks is calculated, and it is determined whether the calculated distance is smaller or larger than the proposed critical distance ( S p r o p o s e d ) defined by the new coalescence criteria proposed in this study. If S is smaller than or equal to S p r o p o s e d ( S S p r o p o s e d ), the two separate surface cracks are coalesced into a single crack, and the curvature of the re-entrant region resulting from the coalescence is applied to simulate the natural crack growth of multiple cracks. In the overall algorithm presented in Figure 2, the boxes related to the new coalescence criteria, coalescence method, and growth algorithm for multiple cracks are marked with red borders, and these aspects are discussed in Section 3.2. Finally, once the cracks are modeled, AI-FEM evaluates whether the user-specified final cycle or time has been reached. If the condition is met, AI-FEM terminates the process; otherwise, the program repeats the above steps.

3.2. Plastic Zone Size-Based New AI-FEM Multiple Cracks Coalescence Criteria

Linear elastic fracture mechanics (LEFM) is generally used when simulating crack growth, as the plastic zone near the crack tip is small, allowing elastic analysis to sufficiently approximate crack behavior. Elastic analysis is also relatively simple and computationally efficient, which contributes to its widespread use. However, when multiple cracks are present in the structure, especially when the distance between them decreases, significant plastic behavior may occur due to interactions between the crack tips. In such cases, the linear elastic assumption may not accurately simulate crack growth behavior. Plastic deformation affects the stress field at the crack-tip and can alter the crack growth rate and direction.
Several researchers have addressed this issue using different approaches. Gao et al. [26] utilized the Kachanov method [27], and Mises yield criterion to analyze crack interactions in plates, focusing on the influence of crack geometry and spacing on plastic zone development. Nishimura [28] employed a strip yield model to study crack coalescence in riveted stiffened sheets, treating multiple cracks as a single fictitious crack. Hassani et al. [29] primarily focused on predicting the plastic zone size ahead of crack-tips using a numerical analysis method based on Dugdale‘s model [30]. This study reveals that the relative position and arrangement of multiple cracks are major factors in determining the plastic zone size. Their study revealed that the relative position and arrangement of multiple cracks are major factors in determining the plastic zone size.
While these methods provide valuable insights into the plastic effects of crack coalescence and multiple cracks, they often come with limitations. Many are computationally intensive or limited in their applicability to complex geometries, making them less suitable for practical engineering applications, especially in cases involving multiple crack-growth simulations.
AI-FEM performs iterative finite element analyses to simulate crack growth, making it essential to balance computational cost with the accuracy of capturing plastic effects. To address this challenge, this study proposes a crack coalescence criterion based on the plastic zone correction method presented by Irwin et al. [31]. Irwin’s approach offers a compromise between computational efficiency and accuracy by adjusting the stress intensity factor (SIF) to account for the plastic zone size, thereby improving the accuracy of elastic analysis without significantly increasing computational demands. The plastic zone size calculation formula proposed by Irwin et al. [31] was used, and it is as follows:
r p = 1 3 π K σ y 2
where r p represents the secondary plastic zone size, K represents the SIF, and σ y represents the yield strength of the materials. Furthermore, the critical distance ( S p r o p o s e d ) of the newly proposed coalescence criteria for multiple cracks, which applies the concept of plastic zone size, is defined as follows in Equation (4):
S p r o p o s e d = r p . c r a c k 1 + r p . c r a c k 2
where r p . c r a c k 1 and r p . c r a c k 2 are the secondary plastic zone sizes derived from the SIFs at the surface points of two adjacent cracks. S p r o p o s e d is defined as the sum of these two plastic zone sizes. If S     S p r o p o s e d (coalescence occurs if the sum of the plastic zone sizes exceeds the distance between cracks), the two cracks are combined, and the remaining sections are removed as the cracks are coalesced into a single crack.
Figure 4 schematically illustrates crack growth and coalescence based on the plastic zone size criterion previously presented.
First, Figure 4a illustrates the process of evaluating whether multiple cracks will coalesce into a single crack. The propagated crack is modeled using the calculated crack growth amount from the initial crack. Subsequently, the SIFs at the surface points of the two adjacent cracks are input into Equation (3), and the respective plastic zone sizes are determined. S p r o p o s e d is calculated according to Equation (4). Finally, S is calculated and compared with S p r o p o s e d . If S   >   S p r o p o s e d , the coalescence step is skipped, and crack growth is performed again. On the other hand, if S     S p r o p o s e d , the process moves to the coalescence step shown in Figure 4b.
Figure 4b illustrates the process of introducing curvature to the re-entrant region to simulate the natural coalescence shape when multiple cracks coalesce into a single crack. To model this shape, a virtual crack is generated by vertically offsetting from the crack front by R c , which has the same magnitude as S p r o p o s e d . A virtual circle with radius R c is created at the intersection of two virtual cracks (gray dashed line), touching the advanced crack (orange solid line), and is used for smoothing the cracks.
Figure 4c shows the final process of crack coalescence. The advanced crack (orange solid line) is integrated with the virtual circle with radius R c to form a single crack and complete the modeling process.

4. Validation of New AI-FEM Multiple Cracks Coalescence Criteria

4.1. Geometry and Material

This section validates the plastic zone size-based coalescence criterion and crack growth using AI-FEM by comparing it with experimental results. The validation is performed by comparing the FCG simulation results obtained from AI-FEM with the FCG experimental data from three-point bending tests on plates with multiple cracks conducted by B. Bezensek et al. [5]. Before validating the proposed multiple crack coalescence criteria, the crack modeling and SIF calculation module in AI-FEM for plate geometry used in this study were verified by comparing the results with analytical solutions. Specifically, the SIF values along the crack front for a single surface crack in a plate derived from AI-FEM were compared with the SIF solutions presented by Raju-Newman et al. [32].
Figure 5 illustrates the schematic diagram of the plate used in the FCG experiment. In this diagram, w , t , and l   denote the width, thickness, and length of the plate, respectively, while v indicates the distance between supports. These dimensions are summarized in Table 2. Multiple cracks are located at the center of the plate. The plate material is carbon-manganese 50D steel (BS 4360), with a Young’s modulus ( E ) of 210 GPa, a Poisson’s ratio ( υ ) of 0.3, and a yield strength ( σ y ) of 350 MPa. The material and properties were applied to the analysis as provided in the experimental literature by B. Bezensek et al. [5] to ensure the same conditions as the experiment.
Figure 6a depicts the schematic diagram of a single surface crack used to verify the AI-FEM FE model. Here, a indicates the single crack depth, c represents half of the single crack length, and θ denotes the angle along the crack front. The crack shapes used for verification are summarized in Table 3.
Figure 6b illustrates the schematic diagram of two surface cracks on the same plane, used for experimental validation of the newly proposed multiple crack coalescence criteria. In this diagram, S denotes the distance between the two surface cracks, while a 1 , c 1 , and a 2 , c 2 represent the depth and half-length of multiple cracks 1 and 2, respectively. The shapes and distances of these cracks are summarized in Table 4.

4.2. Summary of FCG Experiment

The three-point bending test for FCG was conducted using a servo-hydraulic testing machine at a frequency of 4 Hz and a stress ratio of 0.1. The loading condition was adjusted to keep the applied SIF below 30 MPa m . To enhance the visibility of beach marks, the maximum load was kept constant, while the minimum load was varied to adjust the stress ratio. In this experiment, B. Bezensek et al. [5] provided FCG rate curve data in the form of Paris’ law. The equation for Paris’ law is presented in Equation (5):
d a / d N = 8.0 × 10 12 ( K ) 2.92
where d a / d N is the crack growth rate per cycle, and Δ K is the difference in the stress intensity factor defined as K m a x K m i n . Additionally, the Paris’ law constants are presented through curve fitting.
In this experiment, B. Bezensek et al. [5] conducted FCG testing up to 270,000 cycles, presenting the results in terms of FCG rate in the crack depth direction and the characteristics of the fatigue fracture surface over cycles. According to the experimental results, the two surface multiple cracks grew independently up to approximately 210,000 cycles. During this period, multiple crack 1 exhibited a faster FCG rate in the depth direction compared to multiple crack 2. This was due to the initial crack size of multiple crack 1 being relatively larger than that of crack 2. After 210,000 cycles, the two surface multiple cracks coalesced, forming a re-entrant region, and from this point on, the FCG rates of multiple crack 1 and crack 2 became similar in the depth direction. However, the FCG rate in the re-entrant region was significantly higher. Due to these differences in growth rates, by the final 270,000 cycles, the crack depths of multiple crack 1, crack 2, and the re-entrant region had become similar, and the fatigue fracture surface showed a near semi-elliptical crack shape in the coalesced multiple cracks at the final cycle.

4.3. FE Model

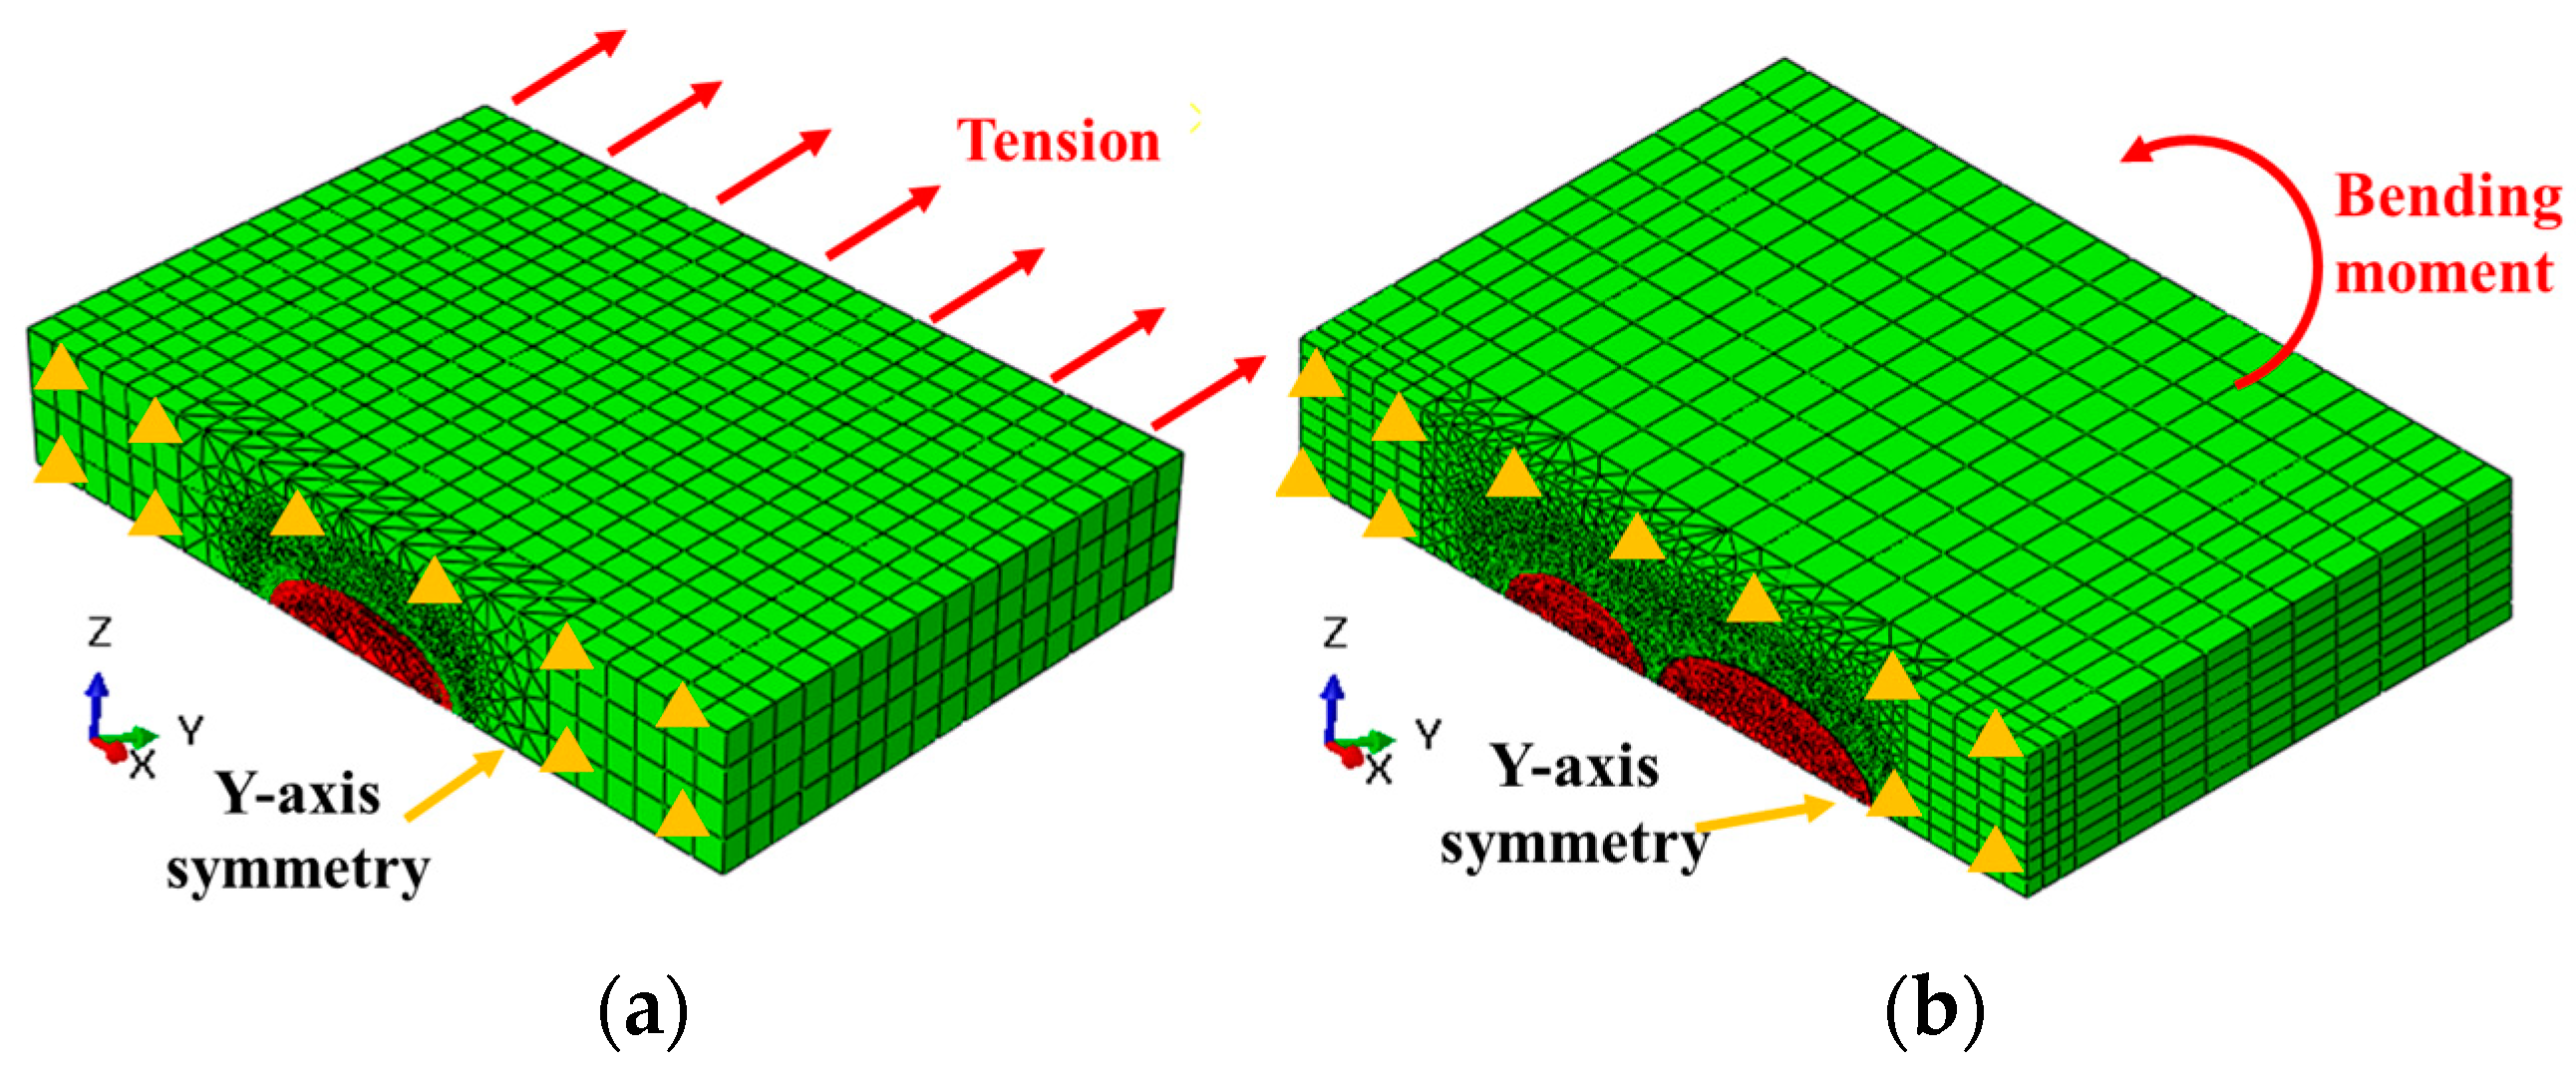
Figure 7a illustrates the FE model and boundary conditions for a plate with a single crack, utilized to validate the crack modeling and SIF calculation module in AI-FEM. Due to geometric symmetry, a 1/2 symmetric model was used, with symmetry conditions applied to the symmetry plane in the Y-axis direction. A tensile load of 68 MPa was applied in the Z-axis direction as the loading condition. The element types implemented in the FE model, as described in Section 3.1, include C3D20R elements at the crack-tip, C3D10 elements surrounding the crack excluding the crack-tip, and C3D8R elements for the remaining region.
Figure 7b illustrates the FE model and boundary conditions for a plate with multiple cracks, designed to validate the accuracy of the newly proposed plastic zone size-based multiple cracks coalescence criteria through comparison with experimental results. The applied boundary conditions and element types are the same as those in the FE model of a plate with a single crack. Multi-point constraint (MPC) conditions were applied to the plate ends to impose cyclic bending moments. As mentioned in Section 4.2, the experimental literature does not provide specific details about the applied loads other than stating that the SIF was kept below 30 MPa m and that the initial stress ratio was set to 0.1, with subsequent adjustments to the stress ratio made by varying the minimum load. To simulate the experiment, the stress ratio was fixed at 0.1 from 0 to 180,000 cycles, and the magnitude of the maximum bending moment was varied to determine the value that matched the experimental results well. After determining the appropriate maximum bending moment, it was kept constant while adjusting the stress ratio in the same manner as the experiment to simulate FCG. The magnitudes of the applied maximum and minimum bending moments are summarized in Table 5.

4.4. Results

4.4.1. FE Model Verification

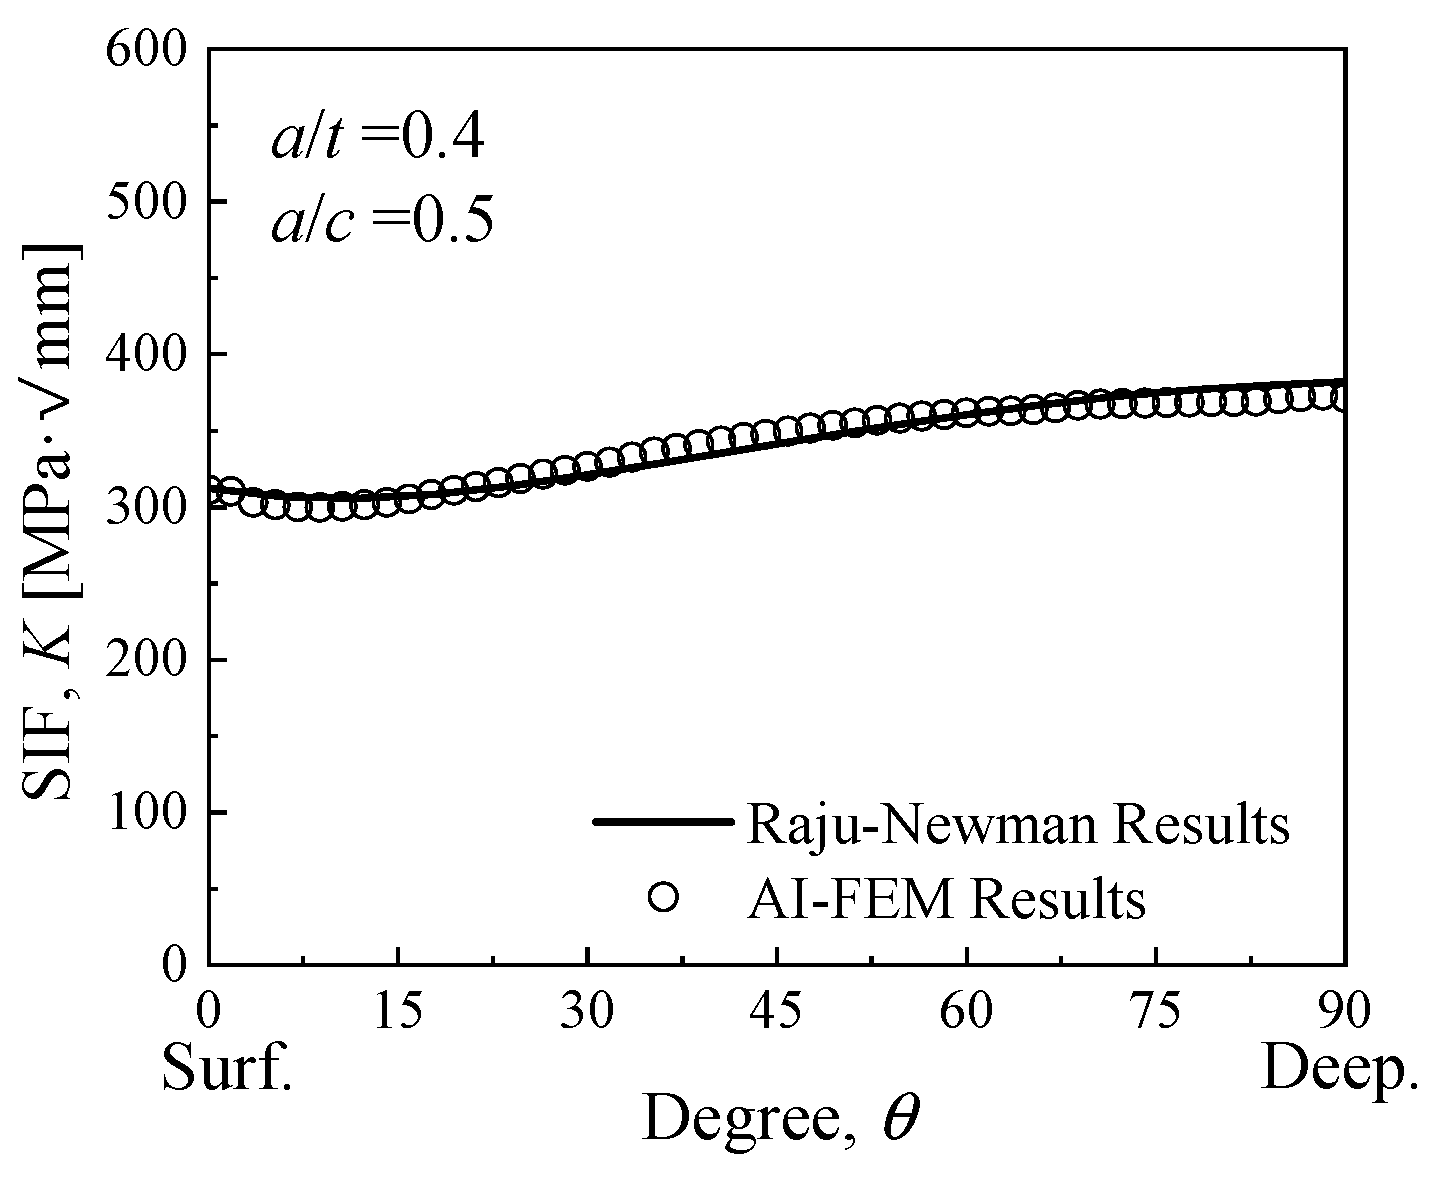
Figure 8 presents a comparison between the SIF values obtained by AI-FEM along the crack front of a single crack in a plate and those derived from the Raju–Newman SIF solution [32]. In Figure 8, ‘Surf.’ represents the surface point of the crack, and ‘Deep.’ represents the deepest point of the crack. For a single crack, the SIF is symmetrical at the deepest point, so values from 0 to 90 degrees are shown. The SIF calculated by AI-FEM is represented by open circle symbols, while the SIF calculated by the Raju–Newman solution is shown as a black solid line. The comparison results show that the SIFs calculated by AI-FEM and the Raju–Newman solution exhibit good overall agreement from the surface point to the deepest point. Therefore, AI-FEM is deemed capable of accurately calculating the SIF and reliably simulating FCG.

4.4.2. Comparison of FCG Results from AI-FEM, Experiment, and Codes

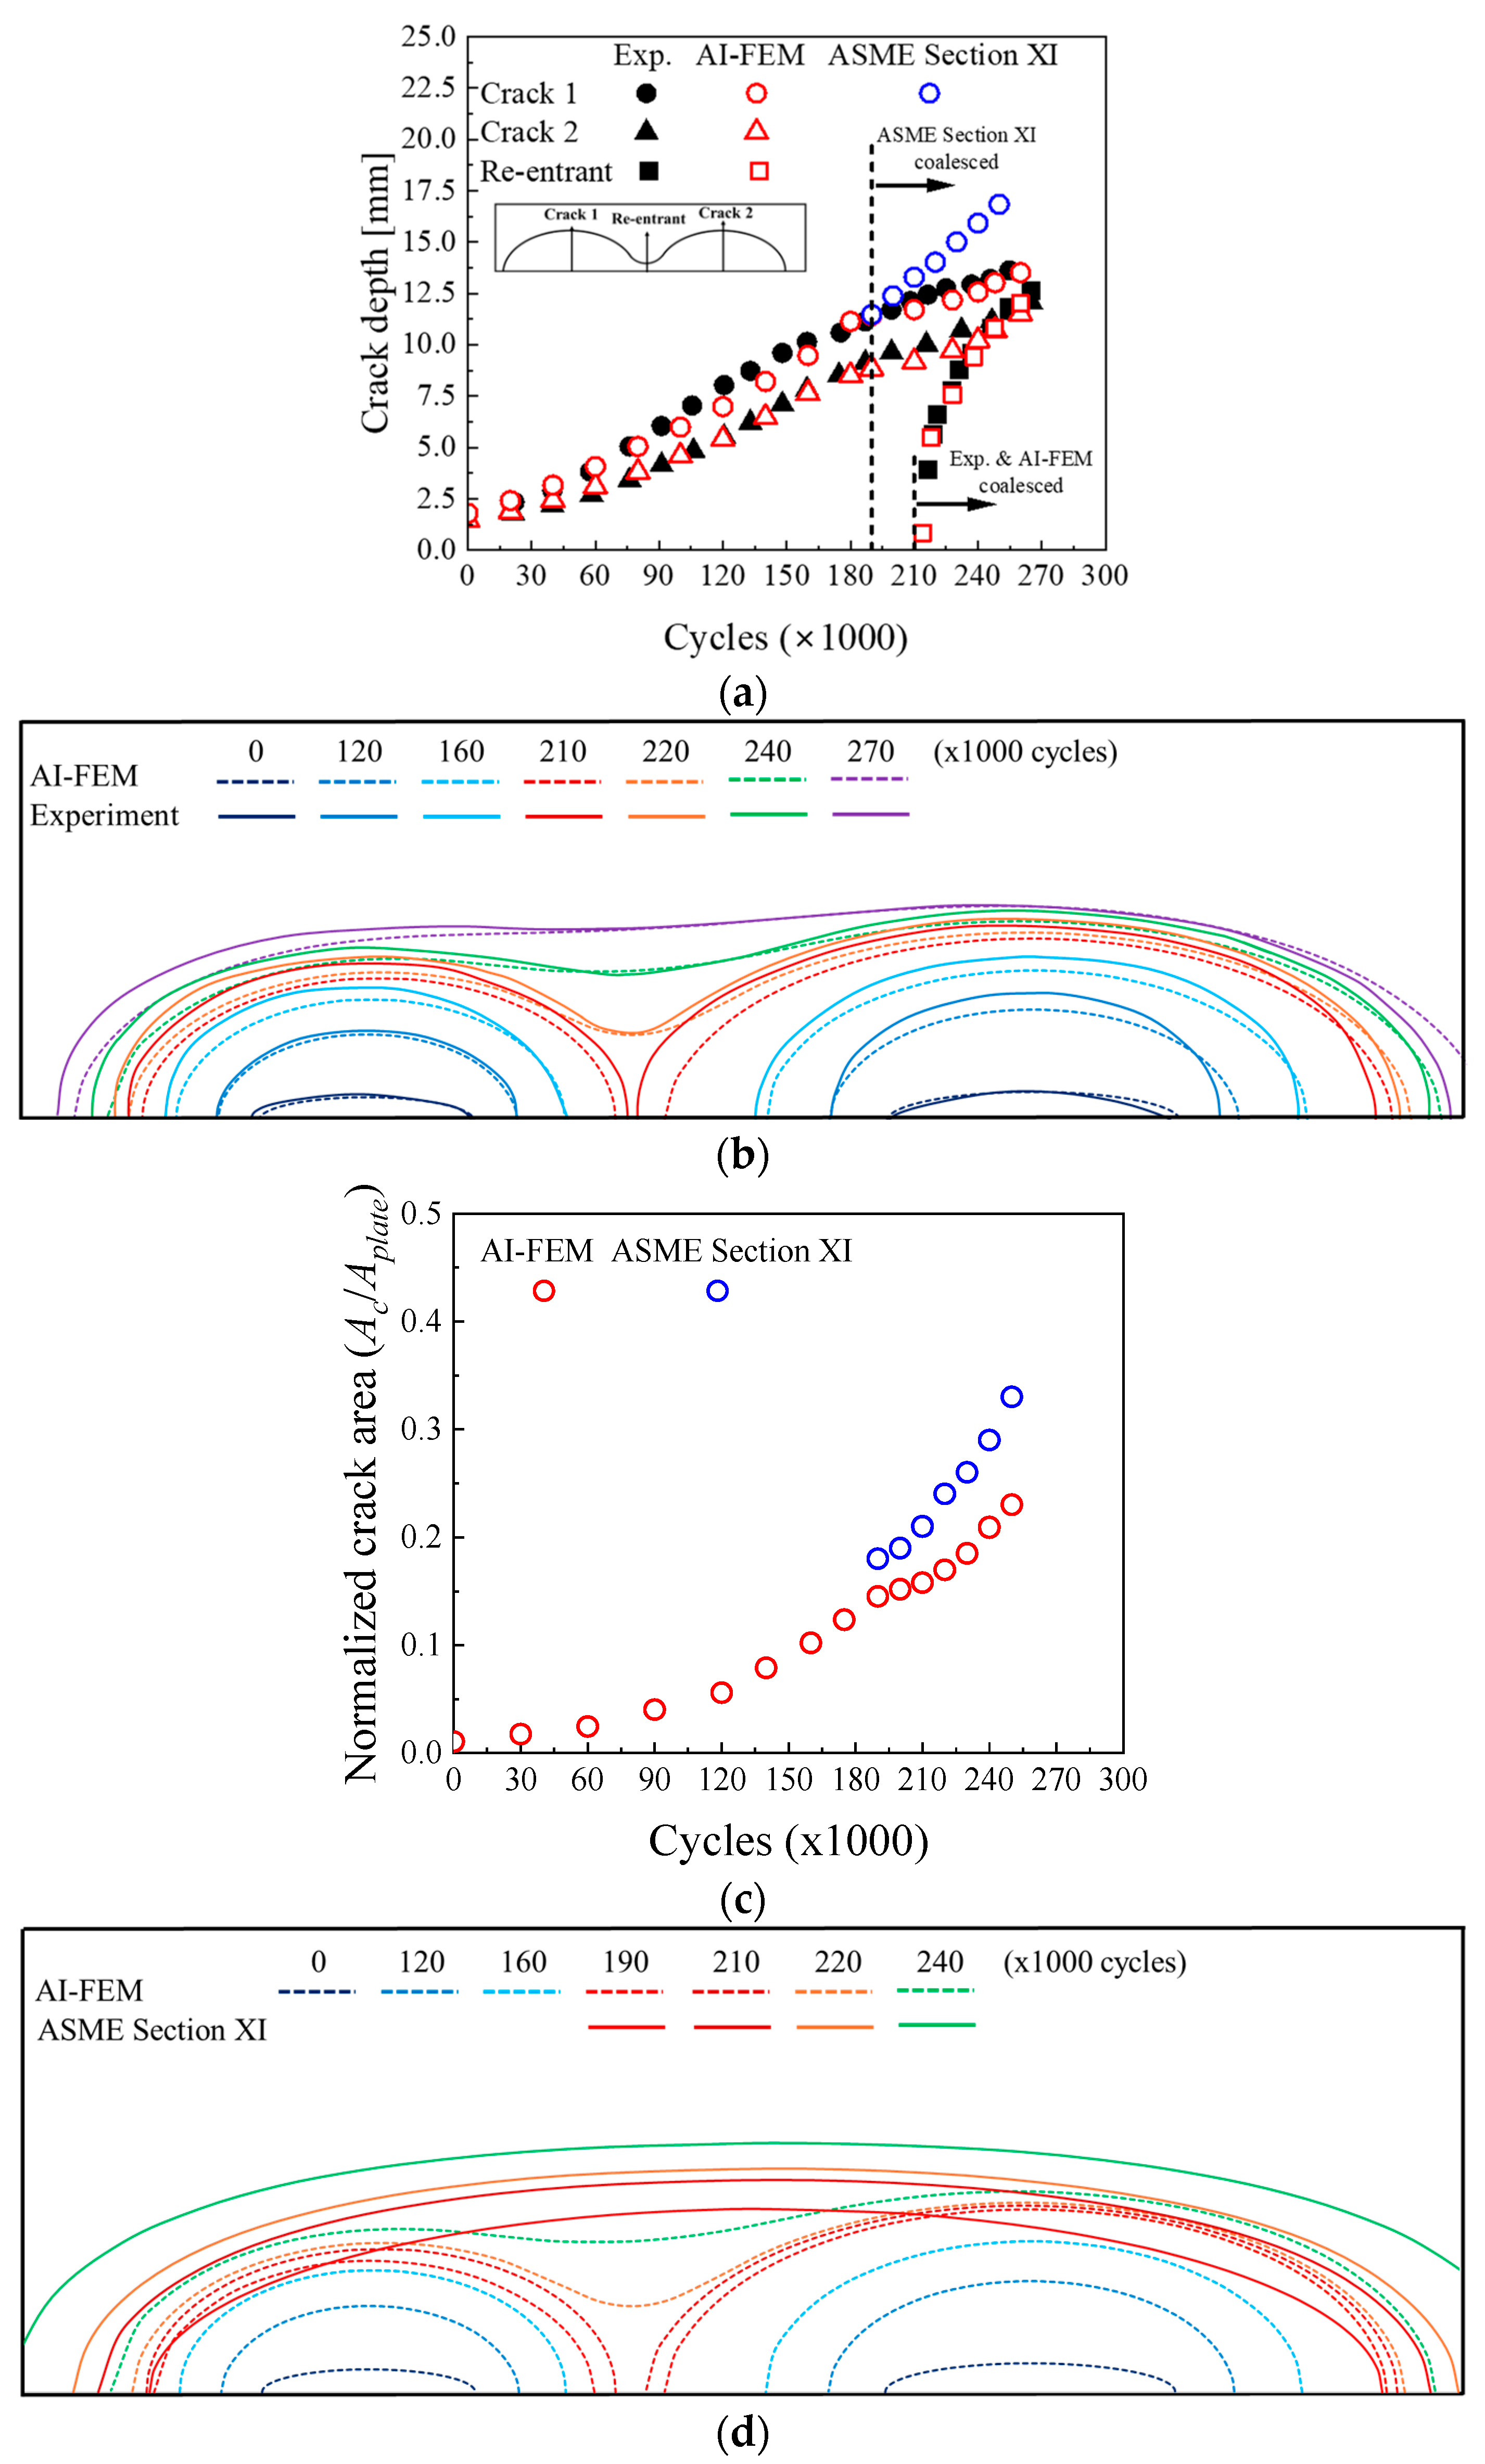
Figure 9 compares the natural multiple FCG results using AI-FEM with experimental results and the FCG results applying the crack coalescence criteria from ASME Section XI. In Figure 9a, the crack depth is compared over the cycles, while, in Figure 9b, the fracture surfaces from the experimental results and AI-FEM FCG results are compared over the cycles. Additionally, Figure 9c compares the normalized crack area over the cycles between the ASME Section XI and AI-FEM FCG results. A c represents the crack area, while A p l a t e represents the area of the plate cross-section. Figure 9d compares the fracture surfaces over the cycles between ASME Section XI and AI-FEM results.
Table 6 summarizes the quantitative analysis of differences in the cycle at which crack coalescence occurs, the final cycle coalesced area, and the final cycle crack depth to quantify the conservatism of the ASME Section XI crack coalescence criteria. The equation representing these differences is as follows:
D i f f . = R A S M E R A I F E M R A S M E  
where R A S M E represents the crack growth results obtained using the ASME Section XI coalescence criteria, and R A I F E M represents the crack growth results obtained using AI-FEM. The results derived by each methodology are quantitatively analyzed for differences in terms of coalesced cycles, normalized crack area, and maximum crack depth.
Figure 9a,b compares the FCG rate in the crack depth direction and the fatigue fracture surface formed by the beach mark method, as provided in the FCG experiment conducted by B. Bezensek et al. [5], with the AI-FEM results. The experimental data for the FCG rate in the crack depth direction were reconstructed by digitizing the graph provided in the literature. Additionally, the fatigue fracture surface provided in the experiment was re-expressed in the same form to ensure a clearer comparison, as the fracture surface was not clearly visible due to experimental limitations. In Figure 9a, the experimental results (Exp.) are shown with black symbols, the FCG results from AI-FEM are shown with red open symbols, and the FCG results using the ASME Section XI crack coalescence criteria are shown with blue open symbols. The crack depth at the deepest point of the left crack (multiple crack 1) is represented by circular symbols, the crack depth at the deepest point of the right crack (multiple crack 2) is shown with triangular symbols, and the crack depth in the re-entrant region formed by the coalescence of the two multiple cracks is represented by square symbols. As shown in Figure 9a, the experimental results overall matched well with the FCG results using AI-FEM. The cycles at which crack coalescence occurred were also the same, at approximately 210,000 cycles. The maximum error in crack depth was 7.8% at around 220,000 cycles. This trend was also confirmed in Figure 9b, where the experimental results (solid line) and FCG results using AI-FEM (dashed line) showed the same shape at the same cycle. Therefore, applying the proposed plastic zone size-based crack coalescence criteria to AI-FEM is expected to simulate experimental results well, providing a realistic model for crack growth.
Figure 9c compares the normalized crack area ( A c / A p l a t e ) as a function of cycles using the FCG results from AI-FEM and the ASME Section XI methodology. The AI-FEM results are represented by red open circles, and the ASME Section XI results by blue open circles. As shown in Figure 9c, applying the coalescence criteria presented in ASME Section XI idealizes the crack, leading to the assumption of non-crack areas as crack. Therefore, a difference in crack area occurs from the coalescence point, and the area difference increases with cycles.
This trend is also observed in Figure 9d, which compares the crack shapes over cycles. In the figure, the AI-FEM results are depicted with dashed lines, and the ASME Section XI results with solid lines. For the same cycle (color), the ASME Section XI results show earlier crack coalescence (195,000 cycles) and a larger crack at the same cycle. The same results were observed in Table 6, where a quantitative comparison was made between natural crack growth simulated by AI-FEM and FCG results using the ASME Section XI coalescence criteria. As shown in Table 6, applying the coalescence criteria of ASME Section XI resulted in more conservative outcomes compared to those obtained using the newly proposed coalescence criteria in all aspects. The coalescence cycles differed by 16%, the normalized crack area by 30%, and the maximum crack depth by approximately 22%. These results indicate that applying the ASME Section XI crack coalescence criteria may result in a conservative crack evaluation.

5. Investigation into Conservatism of Codes Using Multiple Crack Coalescence Criteria Based on Plastic Zone Size

5.1. Geometry and Material

In Section 4, the newly proposed plastic zone size-based coalescence criterion was validated through comparison with experimental results, and the conservatism of the distance and shape criteria for multiple crack coalescence in plate geometries, as presented in the current codes, was investigated. In this section, further conservatism investigation was performed on multiple cracks present in the pipe geometry of major NPP structures using AI-FEM. This investigation was conducted through AI-FEM-based FCG simulations.
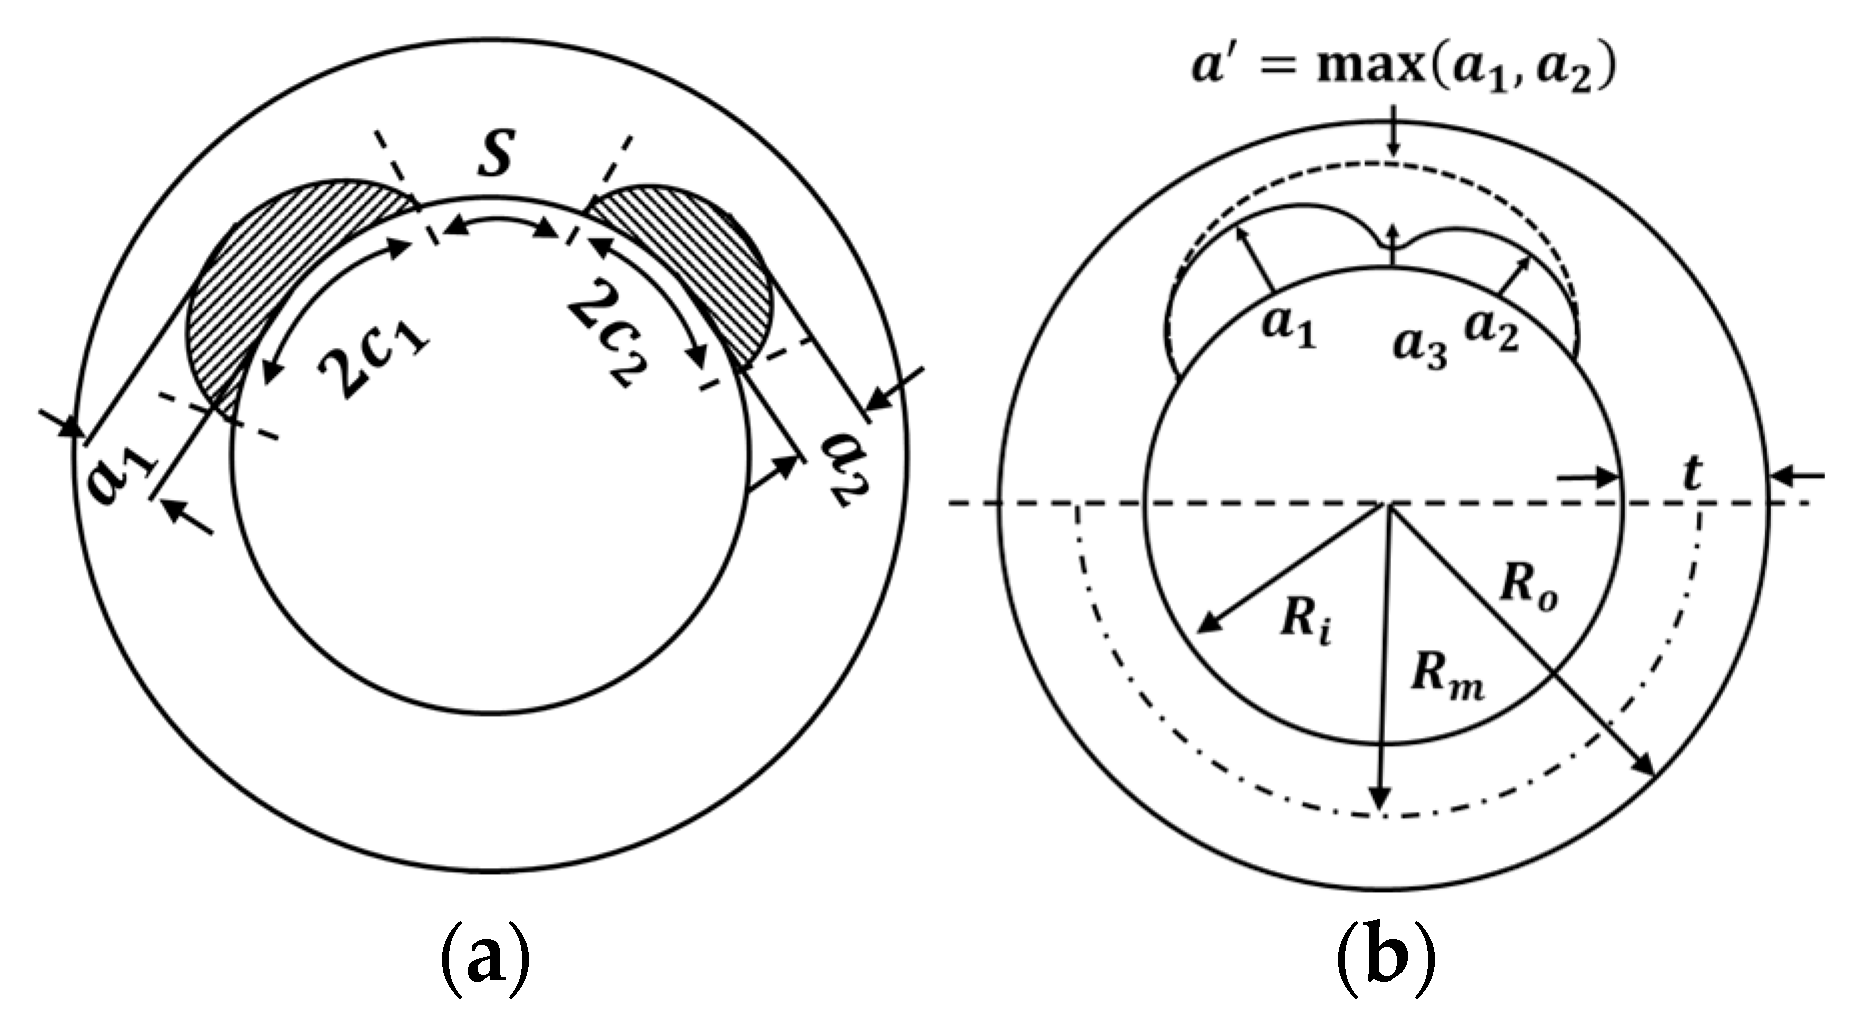
Figure 10a shows a schematic diagram of a pipe with multiple cracks. a 1 and c 1 represent the crack depth and half of the crack length for multiple crack 1, respectively, while a 2 and c 2 represent the crack depth and half of the crack length for multiple crack 2, respectively. S indicates the distance between the two adjacent surface cracks.
Figure 10b illustrates a schematic diagram of a pipe with a single crack formed by coalescence according to each methodology. a 1 and a 2 represent the maximum crack depths of crack 1 and crack 2, respectively, while a 3 indicates the crack depth in the re-entrant region formed by the coalescence of the two cracks. The crack depth formed by the code methodology is equal to the depth of the deeper crack between multiple cracks 1 and 2. R o , R m , R i , and t represent the outer radius, mean radius, inner radius, and thickness of the pipe, respectively. The distances between multiple cracks, pipe geometry, and initial crack shapes used in the FCG simulation are summarized in Table 7. Crack 1 has a greater depth than crack 2, and two crack aspect ratios, a semi-elliptical crack with c / a = 3 and a semi-circular crack with c / a = 1 , were considered.
The material applied in this analysis is AISI 304L stainless steel, which is commonly used in NPP piping systems. The material properties and FCG rate curves for this material were referenced from the FCG experiment conducted by K. Shibata et al. [6]. The Young’s modulus is 200 GPa, the Poisson’s ratio is 0.3, and the yield strength is 274 MPa. The Paris’ law form of Equation (7) for the presented FCG curve is as follows:
d a / d N = 1.586 × 10 12 ( K ) 2.734
The FCG curve was obtained under loading conditions with a R = 0.1 in an air environment.

5.2. FE Model

Figure 11 shows the FE model, boundary conditions, and loading conditions for multiple cracks in the pipe geometry. A 1/2 symmetry model was used, considering the geometric symmetry, and the symmetry condition was applied to the Z-axis symmetry plane. Additionally, the bottom of the pipe was constrained in the Y-axis direction to prevent unnecessary movement. The maximum applied tensile load was set to 90% of the yield strength, and the minimum tensile load was set to achieve a stress ratio of 0.1. This tensile load was applied in the Z-axis direction at the pipe end. The element type used in the FE model of the pipe geometry was configured in the same way as in the plate FE model.

5.3. Results

Figure 12 compares the FCG results of multiple cracks in a pipe over loading cycles using two different methods: the natural FCG results simulated using AI-FEM and the FCG results obtained by applying the crack coalescence methodology from ASME Section XI. To evaluate the conservatism of crack coalescence criteria of ASME Section XI, the results from both methods were quantitatively analyzed based on three factors: coalescence distance, coalescence shape, and maximum crack depth.
The conservatism inherent in the ASME Section XI coalescence criteria, specifically the conservatism related to the distance criterion, was assessed by comparing the cycles at which crack coalescence occurred. The conservatism of the coalesced crack shape was evaluated by normalizing and comparing the difference in the crack area ( A c ) formed at the final cycle for each method against the total pipe cross-sectional area ( A p i p e ). Lastly, the conservatism due to differences in both distance and shape criteria was investigated by comparing the maximum crack depth at the final cycle.
Figure 12a presents a comparison of the fatigue fracture surfaces over cycles for the multiple crack configuration with a c / a = 3 . The quantitative analysis results for investigating conservatism are summarized in Table 8. In the FCG results obtained using AI-FEM, coalescence occurred at 28,000 cycles, whereas, when applying the ASME Section XI methodology, coalescence occurred slightly earlier, at 24,000 cycles, resulting in a 14% difference. When comparing the normalized area of the two cracks at the final cycle, AI-FEM shows a value of 0.08, whereas ASME Section XI shows a value of 0.12, indicating that the crack grows approximately 33% larger. Due to the conservative nature of the distance and shape criteria in ASME Section XI, the crack depth at the final cycle is 0.91, while the crack depth determined by AI-FEM at the final cycle is 0.72, showing a difference of about 20%.
Figure 12b presents a comparison of the fatigue fracture surfaces over cycles for the multiple crack configuration with a c / a = 1 . The quantitative analysis results for investigating conservatism are summarized in Table 9. In the FCG results obtained using AI-FEM, coalescence occurred at 40,000 cycles, whereas, when applying the ASME Section XI methodology, coalescence occurred slightly earlier, at 36,000 cycles, resulting in an 11% difference. When comparing the normalized area of the two cracks at the final cycle, AI-FEM shows a value of 0.043, whereas ASME Section XI shows a value of 0.066, indicating that the crack grows approximately 35% larger. Due to the conservative nature of the distance and shape criteria in ASME Section XI, the crack depth at the final cycle is 0.87, while the crack depth determined by AI-FEM at the final cycle is 0.65, showing a difference of about 25%.
Based on the plastic zone size coalescence criteria of AI-FEM and the coalescence criteria of ASME Section XI, FCG was analyzed for both methods. The FCG results derived from each methodology were quantitatively compared in terms of coalescence cycles, normalized crack area, and maximum crack depth. The comparison results showed that the FCG results of ASME Section XI were more conservative in all aspects, with coalescence cycles differing by approximately 14%, normalized crack area by about 34%, and maximum crack depth by 23%. The conservatism of the ASME Section XI coalescence criteria observed in this pipe geometry is similar to the degree of conservatism seen in the plate geometry discussed in Section 4.4.2.

6. Conclusions

In this study, a new coalescence criterion was proposed to realistically simulate the growth and coalescence of multiple cracks. This criterion is based on the size of the plastic zone and was implemented into a remeshing-based automatic crack growth program called AI-FEM. The validity of this new coalescence criterion was validated by comparing it with FCG experimental results for a plate containing multiple cracks.
Additionally, to investigate the conservatism of the coalescence distance and shape criteria presented in existing codes, an FCG simulation was conducted on multiple cracks in plate and pipe geometries. The differences in coalesced cycles, normalized crack area, and maximum crack depth were quantitatively compared, respectively. The results showed that outcomes derived from ASME Section XI were conservatively biased.
When evaluating the integrity of multiple cracks using the coalescence criteria from existing codes, excessive conservatism may be applied to actual NPP structures, potentially leading to accelerated replacement cycles and unnecessary cost increases during maintenance. Consequently, this study suggests that the newly proposed coalescence criterion and AI-FEM algorithm could serve as more efficient alternatives for evaluating multiple cracks.
However, the newly proposed coalescence criterion and algorithm have currently been validated only under specific conditions: multiple cracks in the same plane and in a single plane under Mode I loading conditions. Therefore, further research on multiple cracks in non-coplanar conditions and under various loading modes is needed to develop a more universally applicable methodology.

Author Contributions

Conceptualization, N.-S.H.; methodology, N.-S.H.; software, N.-S.H., C.-G.H. and G.-B.L.; validation, N.-S.H., C.-G.H. and G.-B.L.; resources, N.-S.H.; formal analysis, C.-G.H.; investigation, N.-S.H. and C.-G.H.; data curation, G.-B.L.; writing—original draft preparation, C.-G.H. and G.-B.L.; writing—review and editing, N.-S.H.; supervision, N.-S.H.; project administration, N.-S.H.; funding acquisition, N.-S.H. All authors have read and agreed to the published version of the manuscript.

Funding

This research was funded by KOREA HYDRO & NUCLEAR POWER CO., LTD (Gyeongju, Republic of Korea), (No. 2022-TECH-14).

Institutional Review Board Statement

Not applicable.

Informed Consent Statement

Not applicable.

Data Availability Statement

The raw data supporting the conclusions of this article will be made available by the authors on request.

Acknowledgments

The authors extend special thanks to Sung-Hoon Park of VENG Co., Ltd. for his assistance in the development and validation of AI-FEM.

Conflicts of Interest

The authors declare no conflicts of interest.

References

  1. Na, M.G.; Kim, J.W.; Lim, D.H.; Kang, Y.J. Residual stress prediction of dissimilar metals welding at NPPs using support vector regression. Nucl. Eng. Des. 2008, 238, 1503–1510. [Google Scholar] [CrossRef]
  2. Shang, Y.B.; Shi, H.J.; Wang, Z.X.; Zhang, G.D. In-situ SEM study of short fatigue crack propagation behavior in a dissimilar metal welded joint of nuclear power plant. Mater. Des. 2015, 88, 598–609. [Google Scholar] [CrossRef]
  3. ASME Boiler and Pressure Vessel Code Section XI. Rules for Inservice Inspection of Nuclear Power Plant Components; ASME: New York, NY, USA, 2015. [Google Scholar]
  4. Rice, J.R. A Path Independent integral and the approximate analysis of strain concentration by notches and cracks. J. Appl. Mech. 1968, 35, 379–386. [Google Scholar] [CrossRef]
  5. Bezensek, B.; Hancock, J.W. The re-characterisation of complex defects: Part I: Fatigue and ductile tearing. Eng. Fract. Mech. 2004, 71, 981–1000. [Google Scholar] [CrossRef]
  6. Shibata, K.; Oba, T.; Kawamura, T.; Miyazono, S.; Yokoyama, N. Fatigue and fracture behavior of straight pipe with flaws in inner surface. Nucl. Eng. Des. 1981, 66, 33–45. [Google Scholar] [CrossRef]
  7. Iida, K.; Ando, K.; Hirata, T. An evaluation technique for fatigue life of multiple surface cracks (Part 1) a problem of multiple series surface cracks. J. Jpn. Soc. Nav. Archit. Ocean Eng. 1980, 1980, 284–293. [Google Scholar] [CrossRef]
  8. Kamaya, M. Growth evaluation of multiple interacting surface cracks. Part I: Experiments and simulation of coalesced crack. Eng. Fract. Mech. 2008, 75, 1336–1349. [Google Scholar] [CrossRef]
  9. Tu, S.T.; Dai, S.H. An engineering assessment of fatigue crack growth of irregularly oriented multiple cracks. Fatigue Fract. Eng. Mater. Struct. 1994, 17, 1235–1246. [Google Scholar] [CrossRef]
  10. API 579-1/ASME FFS-1; Fitness-for Service, 2nd ed. American Petroleum Institute and American Society of Mechanical Engineers: Houston, TX, USA, 2007.
  11. BS 7910:2013; Guide to Methods for Assessing the Acceptability of Flaws in Metallic Structures. British Standard Institute: London, UK, 2013.
  12. Milne, I.; Ainsworth, R.A.; Dowling, A.R.; Stewart, A.T. Assessment of the integrity of structures containing defects. Int. J. Press. Vessels Pip. 1988, 32, 3–104. [Google Scholar] [CrossRef]
  13. Hasegawa, K.; Shiratori, M.; Miyoshi, T.; Seki, N. Comparison of stress intensity factors of two flaws and a combined flaw due to combination rules. In Proceedings of the 2002 ASME Pressure Vessels and Piping Conference, Vancouver, BC, Canada, 5–9 August 2002; Volume 439, pp. 307–312. [Google Scholar]
  14. Kim, J.M.; Huh, N.S. On crack interaction effects of in-plane surface cracks using elastic and elastic-plastic finite element analyses. Nucl. Eng. Technol. 2010, 42, 680–689. [Google Scholar] [CrossRef]
  15. Kamaya, M. A criterion for combination rule in flaw assessment of parallel surface cracks. J. Press. Vessel. Technol. 2011, 42, 680–689. [Google Scholar] [CrossRef]
  16. Lin, X.B.; Smith, R.A. Direct simulation of fatigue crack growth for arbitrary-shaped defects in pressure vessels. Proc. Inst. Mech. Eng. Part C J. Mech. Eng. Sci. 1998, 213, 175–189. [Google Scholar] [CrossRef]
  17. Doi, H.; Azuma, K. Simulation on propagation and coalescence of fatigue crack by automatic three-dimensional finite element crack propagation system. In Proceedings of the 2014 ASME Pressure Vessels and Piping Conference, Anaheim, CA, USA, 20–24 July 2014; Volume 50428. [Google Scholar]
  18. Kikuchi, M.; Wada, Y.; Suga, K.; Ohdama, C. Numerical simulation of coalescence behavior of multiple surface cracks. In Proceedings of the 2011 ASME Pressure Vessels and Piping Conference, Baltimore, MA, USA, 17–21 July 2011; Volume 44519. [Google Scholar]
  19. Wen, J.F.; Zhan, Y.; Tu, S.T.; Xuan, F.Z. A combination rule for multiple surface cracks based on fatigue crack growth life. AIMS Mater. Sci. 2016, 3, 1649–1664. [Google Scholar] [CrossRef]
  20. Branco, R.; Antunes, F.V.; Costa, J.D. A review on 3D-FE adaptive remeshing techniques for crack growth modelling. Eng. Fract. Mech. 2015, 141, 170–195. [Google Scholar] [CrossRef]
  21. JSME S NA1-2000; Codes for Nuclear Power Generation Facilities-Rules on Fitness-for-Service for Nuclear Power Plants. Japan Society of Mechanical Engineers: Tokyo, Japan, 2000.
  22. GB/T 19624; Safety Assessment for In-Service Pressure Vessels Containing Defects. Chinese Standards: Beijing, China, 2004.
  23. Lee, G.B.; Park, S.H.; Jang, Y.Y.; Huh, N.S.; Park, S.H.; Park, N.H.; Park, J. Development of automatic crack growth simulation program based on finite element analysis. Appl. Sci. 2022, 12, 3075. [Google Scholar] [CrossRef]
  24. Abaqus Version 2021, Users Manual. Available online: http://130.149.89.49:2080/v2016/index.html (accessed on 12 October 2024).
  25. Mohmadsalehi, M.; Soghrati, S. An automated mesh generation algorithm for simulating complex crack growth problems. Comput. Methods Appl. Mech. Eng. 2022, 398, 115015. [Google Scholar] [CrossRef]
  26. Gao, W.; Xiao, T.; Wang, X.; Wang, C. Theoretical study on extension of crack tip plastic zone by remote simple tensile considering crack interaction. Eur. J. Mech. A-Solid 2019, 77, 103814. [Google Scholar] [CrossRef]
  27. Kachanov, M. Elastic solids with many cracks: A simple method of analysis. Int. J. Solids Struct. 1987, 23, 23–43. [Google Scholar] [CrossRef]
  28. Nishimura, T. Strip yield analysis on coalescence of plastic zones for multiple cracks in a riveted stiffened sheet. J. Eng. Mater. Technol. 1999, 121, 352–359. [Google Scholar] [CrossRef]
  29. Hassani, A.; Faal, R.T. Dugdale’s model for plastic zone size of interacting cracks under anti-plane deformation. Procedia Struct. Integr. 2016, 2, 2424–2431. [Google Scholar] [CrossRef]
  30. Dugdale, D.S. Yielding of steel sheets containing slits. J. Mech. Phys. Solids 1960, 8, 100–104. [Google Scholar] [CrossRef]
  31. Irwin, G.R. Plastic zone near a crack and fracture toughness. In Proceedings of the 7th Sagamore Research Conference on Mechanics & Metals Behavior of Sheet Material, New York, NY, USA, 16–19 August 1960; Volume 4, pp. 463–478. [Google Scholar]
  32. Raju, I.S.; Newman, J.C., Jr. Stress-intensity factors for a wide range of semi-elliptical surface cracks in finite-thickness plates. Eng. Fract. Mech. 1979, 11, 817–829. [Google Scholar] [CrossRef]
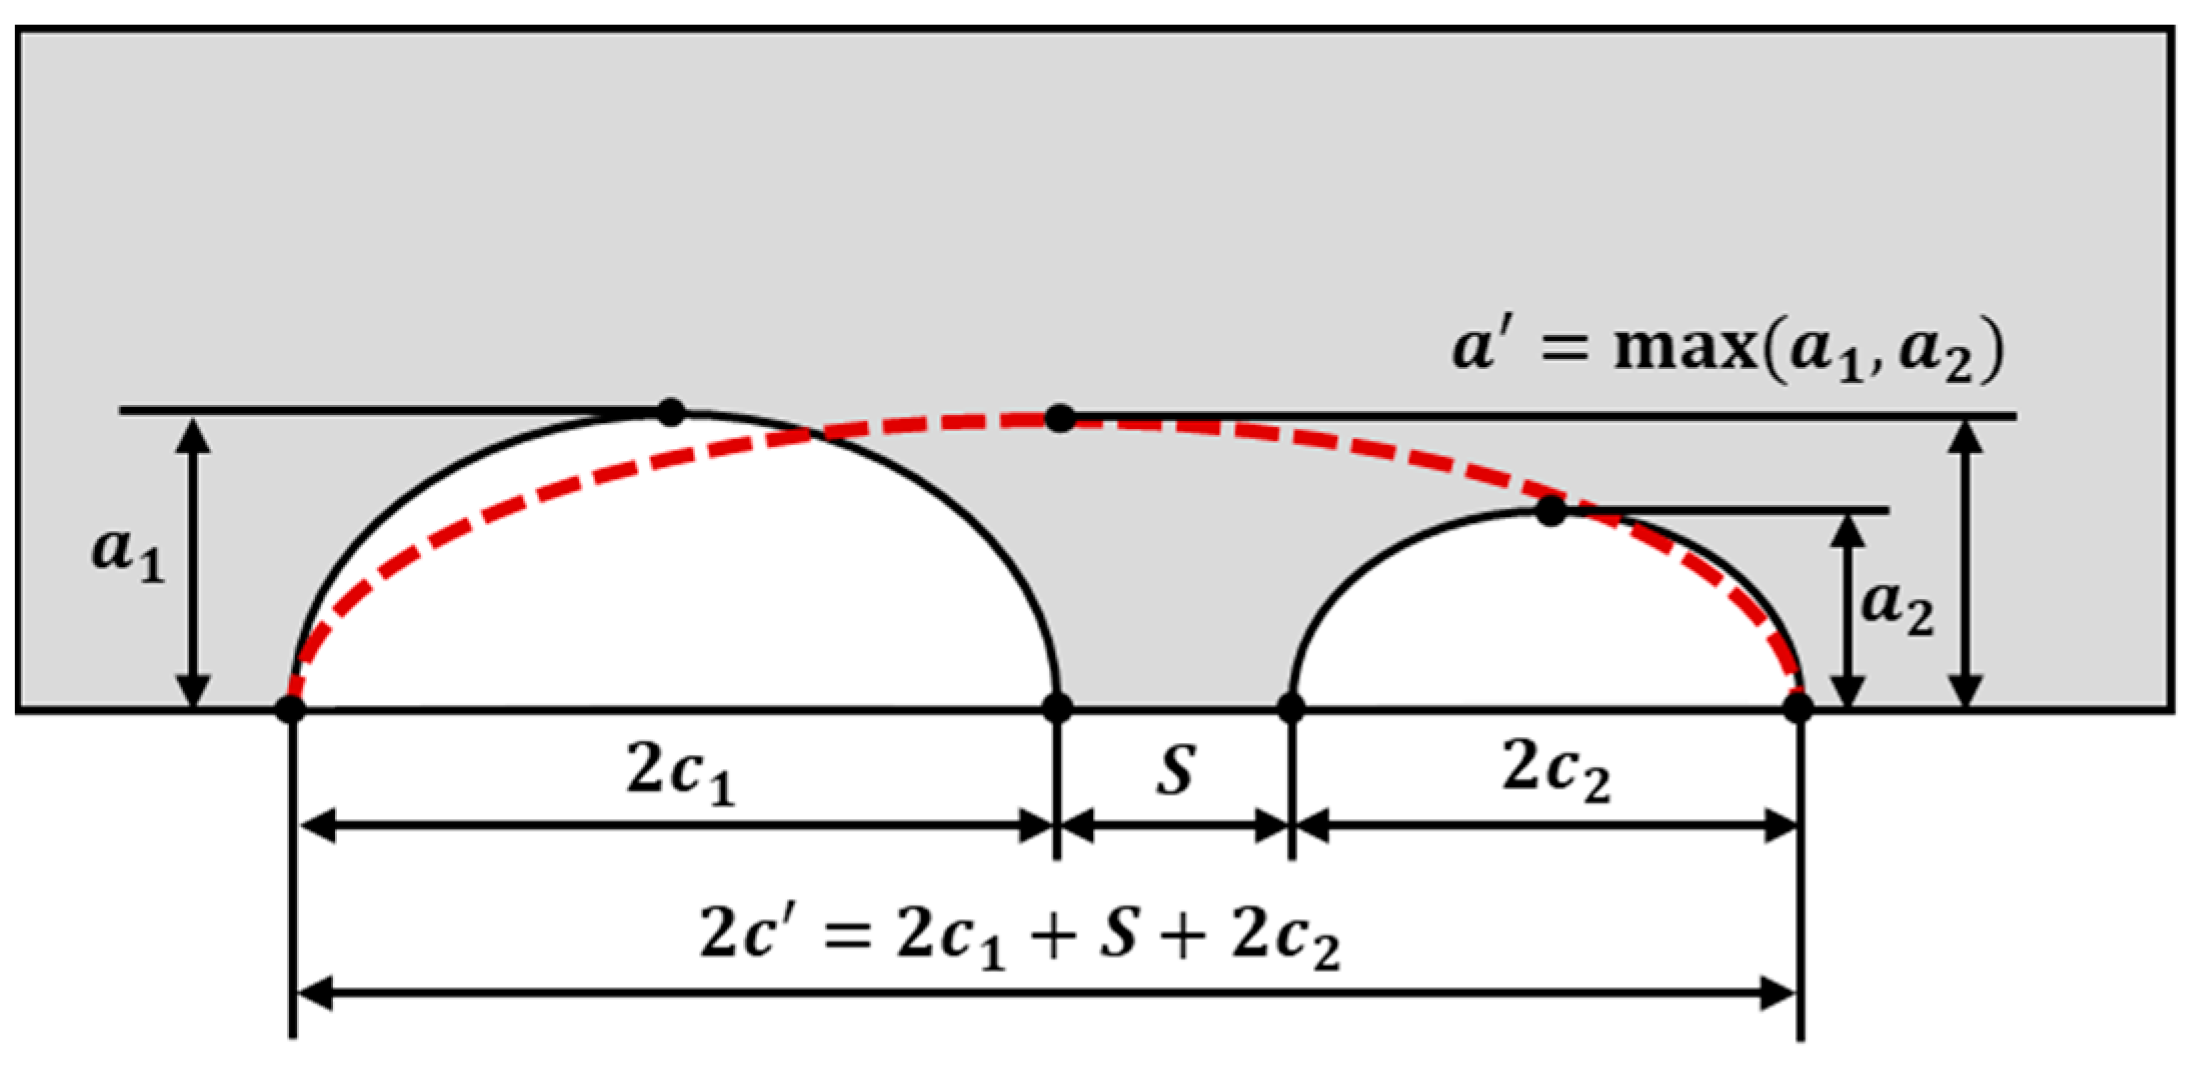
Figure 1. Geometry of dual adjacent coplanar surface cracks.
Applsci 14 09441 g001
Figure 2. The algorithm of the multiple crack growth analysis in AI-FEM.
Applsci 14 09441 g002
Figure 3. Visualized element type in the crack-tip area generated by AI-FEM.
Applsci 14 09441 g003
Figure 4. Schematic diagram of the AI-FEM multiple crack-growth simulation algorithm: (a) multiple crack coalescence criteria application process; (b) re-entrant region curvature calculation process; (c) multiple crack coalescence modeling process.
Applsci 14 09441 g004
Figure 5. Schematic diagram of the plate used in the three-point bending experiment.
Applsci 14 09441 g005
Figure 6. A schematic diagram of the crack shape: (a) definition of the single crack angle θ along the crack front; (b) definition of the distance between multiple crack shapes and the distance between cracks.
Applsci 14 09441 g006
Figure 7. FE model of plate geometry: (a) plate with a single crack for FE model verification; (b) plate with multiple cracks for simulating FCG.
Applsci 14 09441 g007
Figure 8. Comparison of the SIF values derived along the crack front obtained by AI-FEM with Raju–Newman SIF values.
Applsci 14 09441 g008
Figure 9. Comparison of FCG results: (a) FCG rate in the depth direction of the crack over cycles; (b) fatigue fracture surfaces over cycles between AI-FEM and experiments; (c) crack area over cycles between AI-FEM and ASME Section XI; (d) fatigue fracture surfaces over cycles between AI-FEM and ASME Section XI.
Applsci 14 09441 g009
Figure 10. Schematic diagram of a cracked pipe: (a) multiple cracks; (b) coalesced single crack.
Applsci 14 09441 g010
Figure 11. FE model and boundary conditions of pipe geometry.
Applsci 14 09441 g011
Figure 12. Comparison fatigue fracture surface over cycles: (a) c/a = 3; (b) c/a = 1.
Applsci 14 09441 g012
Table 1. Summary of industrial codes for multiple crack coalescence criteria.
DocumentFlaw Interaction Criteria
( a / c 1 )
Flaw Interaction Criteria
( a / c > 1 )
ASME Section XI S S m ( = 0.5 max a 1 , a 2 ) -
API 579-
BS 7910 (and R6) S S m ( 2 c 1   c 1 < c 2 )
Table 2. Shape variables of the plate.
w [mm] t [mm] l [mm] v [mm]
15025230200
Table 3. Normalized shape variables of a single crack in a plate.
a / t c / a
0.40.5
Table 4. Normalized shape variables of multiple cracks and the distance between cracks.
a 1 / t c 1 / a 1 a 2 / t c 2 / a 2 S / t
0.0584.50.0724.91
Table 5. Loading conditions for simulating FCG.
Maximum Bending Moment
[ N · m m ]
Minimum Bending Moment
[ N · m m ]
1.3 × 1061.3 × 105
Table 6. Quantitative comparison of AI-FEM and ASME Section XI FCG results in a flat plate with multiple cracks.
Coalesced
Cycles
(Cycles)
Normalized
Crack Area
( A c / A p l a t e )
Normalized
Crack Depth
( a / t )
AI-FEM220,0000.230.50
ASME Section XI195,0000.300.64
Maximum difference16%30%22%
Table 7. Normalized pipe, crack shape, and distance between cracks for FCG simulation.
S / t R m / t a 1 / t a 2 / t c 1 / a 1 , c 2 / a 2
0.43.50.30.23
1
Table 8. Quantitative comparison of FCG results between AI-FEM and ASME Section XI for c / a = 3 multiple crack configuration.
Coalesced
Cycles
(Cycles)
Normalized
Crack Area
( A c / A p i p e )
Normalized
Crack Depth
( a / t )
AI-FEM28,0000.080.72
ASME Section XI24,0000.120.91
Maximum difference 16%33%20%
Table 9. Quantitative comparison of FCG results between AI-FEM and ASME Section XI for c / a = 1 multiple crack configuration.
Coalesced
Cycles
(Cycles)
Normalized
Crack Area
( A c / A p i p e )
Normalized
Crack Depth
( a / t )
AI-FEM40,0000.0430.65
ASME Section XI36,0000.0660.87
Maximum difference 11%35%25%
Disclaimer/Publisher’s Note: The statements, opinions and data contained in all publications are solely those of the individual author(s) and contributor(s) and not of MDPI and/or the editor(s). MDPI and/or the editor(s) disclaim responsibility for any injury to people or property resulting from any ideas, methods, instructions or products referred to in the content.