Abstract
This research developed smart integrated hybrid renewable systems for small energy communities and applied them to a real system to achieve energy self-sufficiency and promote sustainable decentralized energy generation. It compares stand-alone (SA) and grid-connected (GC) configurations using a developed optimized mathematical model and data-driven optimization, with economic analysis of various renewable combinations (PV, Wind, PHS, BESS, and Grid) to search for the optimal solution. Four cases were developed: two stand-alone (SA1: PV + Wind + PHS, SA2: PV + Wind + PHS + BESS) and two grid-connected (GC1: PV + PHS + Grid, GC2: Wind + PHS + Grid). GC2 shows the most economical with stable cash flow (−€123.2 annually), low CO2 costs (€367.2), and 91.7% of grid independence, requiring 125 kW of installed power. While GC options had lower initial investments (between €157k to €205k), the SA configurations provided lower levelized costs of energy (LCOE) ranging from €0.039 to €0.044/kWh. The integration of pumped hydropower storage enhances energy independence, supporting peak loads for up to two days with a storage capacity of 2.17 MWh.
1. Introduction
Water is a vital resource, fundamental not only for various human activities but also for maintaining life-sustaining processes [1]. The growing water demand, combined with declining freshwater resources, necessitates vigilant monitoring of water consumption to effectively manage the increasing pressure on these resources [2]. To mitigate the effects of human activities, integrating artificial intelligence into water distribution systems is transforming urban areas’ efficiency, sustainability, and resilience [3]. Artificial intelligence techniques in conjunction with big data analytics enhance the precision of simulation models by reducing inaccuracies, thereby refining model feedback [4]. These techniques are expected to improve the efficiency and resilience of hydraulic systems while also contributing to the sustainable management of global water systems. They facilitate the reduction of pressure [5], assessment of distribution flows [6], and mitigation of leaks through the use of pressure-reducing valves or pipe replacement [7]. Such advancements significantly improve system performance, with performance increases ranging from 36% to 65% [8]. These improvements stem from several interrelated factors, including increased processing speed, better data handling, and more accurate predictions made possible by leveraging cutting-edge technologies. The gains in performance help to enhance system reliability, minimize downtime, and optimize the use of existing resources, leading to substantial benefits for industries that rely on complex infrastructures, such as water distribution and energy management.
Research shows that advanced algorithms, digital twin optimization models, and machine learning techniques play a crucial role in optimizing water resource management [9]. Advanced algorithms streamline various water management processes, from optimizing pump operations and distribution schedules to predicting system failures and identifying anomalies in real time. Digital twin optimization models, which create virtual replicas of physical systems, allow for testing and scenario analysis under different conditions without impacting the actual infrastructure. This capability helps operators to dynamically optimize the network and improve resilience against disruptions. Machine learning techniques, meanwhile, are used for pattern recognition and predictive analytics, learning from historical data to enhance future performance. When combined, these technologies can create a more integrated and adaptive approach to managing water resources, reducing inefficiencies, and addressing emerging challenges in water distribution. Moreover, these advancements facilitate accurate forecasting of demand, which is crucial for ensuring the reliability and sustainability of water supply systems [10]. Predictive models help utilities forecast water consumption patterns based on factors like population growth, seasonal changes, and socio-economic activities. Such demand predictions enable more efficient planning and allocation of resources, reducing both operational costs and the environmental footprint of water management practices.
Detecting water and energy losses or infrastructure failures at an early stage is another significant advantage [11]. By using data analytics and sensor networks, predictive maintenance techniques can pinpoint potential issues before they escalate, such as leaks in pipes or electrical faults in pump stations. Early detection of such problems minimizes repair costs, reduces water wastage, and avoids major service disruptions. This capability also contributes to prolonging the lifespan of equipment, as systems can be maintained proactively based on real-time insights.
These predictive approaches enable water managers to make real-time decisions [12], such as adjusting water distribution routes or changing pumping schedules based on current demand and supply conditions. Real-time decision-making allows for adaptive management of water resources in response to unexpected events, such as extreme weather conditions, natural disasters, or equipment failures. This adaptability ensures a more resilient and responsive water distribution network that can maintain service quality even under challenging circumstances. Improving the monitoring and control of complex networks is another critical benefit [13]. Using advanced sensors and IoT devices, water distribution systems can collect vast amounts of data on various parameters, including pressure, flow rate, and water quality. Centralized control platforms integrate this data to provide operators with a comprehensive view of the system’s status, making it easier to identify and address issues. Enhanced monitoring leads to improved system reliability and operational efficiency by allowing utilities to continuously optimize network performance. Furthermore, these technologies support the development of digital twins that replicate system behavior virtually [14], enabling operators to simulate different operational scenarios, plan maintenance activities, and evaluate the impact of new policies or infrastructure upgrades. Digital twins can be used to train staff and test emergency response strategies, providing valuable insights into system dynamics without risking the actual infrastructure. As a result, digital twins enhance operational planning and support informed decision-making.
The combined effect of these innovations is more efficient resource use, cost savings, and improved environmental sustainability in water distribution and supply systems [15]. By optimizing the allocation and use of water resources, these technologies contribute to reduced energy consumption in water treatment and distribution processes, thus lowering greenhouse gas emissions. Additionally, sustainable water management practices help to protect natural ecosystems by reducing water extraction from natural sources and minimizing pollution.
Emerging intelligent optimization algorithms, especially those based on swarm intelligence, form a category of optimization methods inspired by collective behaviors in natural systems. The most widely used algorithms include Ant Colony Optimization (ACO) [16] and Particle Swarm Optimization (PSO) [17]. Additionally, less commonly employed algorithms have been developed, such as the Sticky Mushroom Algorithm (SMA) [18], Artificial Bee Colony (ABC) [19], Grasshopper Optimization Algorithm (GOA) [20], Butterfly Optimization Algorithm (BOA) [21], Moth-Flame Optimization (MFO) [22], Seagull Optimization Algorithm (SOA) [23], Whale Optimization Algorithm (WOA) [24], and Golden Sine Algorithm (GSA) [25], as well as the Generalized Reduced Gradient Non-linear method [26]. These algorithms utilize decentralized decision-making processes to address complex optimization problems related to microgrid applications in water distribution systems [27] or small energy communities. Water management is intrinsically connected to energy consumption, requiring distribution systems designed to achieve zero energy demand and self-sufficiency in both water and energy [28]. The incorporation of renewable energy sources into various technologies has broadened their application in water distribution systems, promoting the sustainable use of traditional energy resources [29]. The global energy crisis, particularly in Europe, has driven numerous countries to explore alternatives to imported fossil fuels, leading to a substantial increase in global renewable energy capacity [15].
Recent advancements in renewable energy have primarily focused on photovoltaic (PV) systems, wind energy, and hydropower technologies [30]. PV systems can be utilized in a variety of settings, from urban rooftops to remote off-grid areas, provided there is sufficient sunlight [31]. However, a major challenge of solar systems is the need to integrate them with other clean energy generation methods to ensure continuous power supply and manage surplus energy produced by the solar system [32]. Urban planning that considers solar energy potential can further optimize the integration of PV technologies with other sustainable systems [33]. Wind energy with several innovations in turbine design, aerodynamics, and materials has boosted energy efficiency and capacity [34]. Modern turbine designs have become taller and lighter, featuring larger blades and more robust materials, allowing them to capture more wind energy even at lower wind speeds. Enhanced aerodynamics has improved the ability to convert kinetic energy into electricity, making turbines more efficient. These advancements have also increased the capacity factor, meaning wind turbines generate more electricity over time. Materials such as carbon fiber and advanced composites have made turbines more durable, reducing maintenance costs and extending their operational lifespan. These innovations have collectively led to significant reductions in the levelized cost of energy (LCOE) from wind, making it competitive with conventional energy sources.
The adaptability of wind power is evident [35]. Onshore wind farms are typically installed in areas with high wind speeds, such as open plains, mountain ridges, or coastal regions. Offshore wind installations, on the other hand, are located in shallow and deep waters where wind speeds are typically stronger and more consistent. Off-shore wind farms can achieve higher capacity factors due to the stable wind conditions, although they require more sophisticated engineering to withstand harsh marine environments. Technological advances, such as floating turbines, are expanding the potential for offshore wind by allowing installations in deeper waters, increasing access to high-wind areas previously deemed inaccessible. These projects not only contribute to renewable energy goals but also create local economic opportunities through job creation and infrastructure development.
The integration of energy storage solutions and smart grid technologies will make power sources capable of meeting significant global electricity needs [36]. Energy storage technologies, such as batteries and pumped-storage hydropower, help balance the intermittent nature of wind energy by storing excess power during periods of high generation and releasing it when demand exceeds supply. This ensures a stable electricity supply and reduces reliance on fossil fuel backup systems. Additionally, smart grid technologies facilitate the seamless integration of wind energy into the power grid by managing the flow of electricity, optimizing energy distribution, and responding dynamically to changes in supply and demand. These advancements make wind energy not only more reliable but also more economically viable, contributing to the de-carbonization of the energy sector. By 2050, the global demand for hydropower is expected to grow by 400 GW, harnessing roughly 64% of the total available capacity, which is a 35% increase over current use [37]. This expansion is driven by the need for clean, renewable energy sources to replace fossil fuels and meet rising energy demands. Hydropower’s ability to provide base-load power and flexibility in power generation makes it an essential component of the future energy mix. The increased hydropower capacity will support grid stability, particularly as the share of intermittent renewable energy sources like wind and solar continues to grow. The development of new hydro-power projects, especially in regions with untapped hydro potential, will be essential for meeting global renewable energy targets.
To ensure sustainable water allocation [37] alerts to the growth in water storage capacity to address the challenges posed by climate change, including more frequent droughts and irregular rainfall patterns, sustainable irrigation practices will require improved water management techniques, such as using efficient irrigation systems, recycling wastewater, and implementing smart water monitoring solutions. Enhanced storage capacity can also be achieved through the construction of new reservoirs, re-habilitation of existing dams, and the use of aquifer recharge methods to increase groundwater reserves. These efforts will ensure a steady water supply for agricultural, industrial, and domestic needs while reducing the environmental impact. Hence, pumped-storage hydropower has expanded significantly [38]. Pumped-storage hydropower, which functions by moving water between reservoirs at different elevations, acts as a giant battery that stores energy by pumping water uphill when electricity demand is low and releasing it to generate electricity when demand is high. This technology plays a critical role in grid balancing, particularly as more renewable energy sources are integrated into power systems. It is also adaptable for micro-scale systems within urban settings, enabling cities to enhance their energy resilience and optimize local water management. Integrating such systems into urban infrastructure encourages water managers to embrace smart city innovations to optimize water management, energy efficiency, and the integration of renewable energy sources [39]. Digital twins, which are virtual representations of physical assets, allow for real-time monitoring, simulation, and optimization of water and energy systems within a city. By integrating renewable energy sources such as solar and wind with pumped-storage hydropower, urban areas can achieve higher energy efficiency and reduce their carbon footprint. This holistic approach aligns with smart city initiatives that aim to improve quality of life, enhance sustainability, and manage resources more effectively.
The cost of electricity for large-scale hydropower remains competitive when compared with fossil fuels [40]. This cost advantage is due to the low operating and maintenance expenses associated with hydropower plants and their long operational lifespans, often exceeding 50 years. Large-scale hydropower projects can generate electricity at prices ranging from 0.03 to 0.05 €/kWh, making them among the most affordable renewable energy options. When combined with other renewable energy sources, such as solar and wind, hydropower helps lower the overall LCOE, further incentivizing the transition to a cleaner energy system. By combining renewable energy systems like solar, wind, and pumped-storage hydropower, the levelized electricity costs can be lower [41]. This integrated approach takes advantage of the complementary characteristics of different renewable energy sources. For example, solar energy is more abundant during the day, while wind energy can often provide power during nighttime or cloudy periods. Pumped-storage hydropower adds a layer of reliability by storing excess energy and releasing it when needed, thus ensuring a continuous and stable power supply. This synergy between renewables reduces the need for fossil fuel-based power generation, cuts emissions, and provides a pathway toward achieving net-zero energy systems.
The global energy transition towards greener systems has become a central focus of climate policy worldwide [42]. Governments and international organizations are increasingly committing to reducing greenhouse gas emissions, phasing out coal and other fossil fuels, and investing in clean energy technologies. Policies such as carbon pricing, subsidies for renewable energy projects, and targets for zero-emission vehicles are being implemented to accelerate the shift towards a sustainable energy future. It is urgent to replace fossil fuels with clean energy alternatives to achieve global climate goals and meet various sustainable development targets [43,44]. The shift from fossil fuels to renewable energy sources like wind, solar, and hydropower is essential for limiting global temperature rise to 1.5 °C above pre-industrial levels, as outlined in the Paris Agreement. Additionally, the transition supports several Sustainable Development Goals (SDGs), including affordable and clean energy (SDG 7), climate action (SDG 13), and sustainable cities and communities (SDG 11).
This situation underscores the need to develop intelligent methodologies powered by extensive databases and artificial intelligence algorithms. These methodologies can optimize the management of diverse energy systems [45], with the primary goal of maximizing energy efficiency and the system’s overall effectiveness over time. This includes accounting for variations in water demand, wind, and solar radiation, among other factors, ultimately achieving net-zero energy consumption [46]. Introducing smart hybrid systems improves the performance indicators in the water distribution systems [47].
Hence, the primary goal of this research is to synchronize energy consumption with production, based on the available renewable resources. A smart optimization model is developed and applied to a small energy community, Marruge, with the vision of creating a future sustainable eco-village. This requires an in-depth analysis of the integration of diverse energy sources.
The structure of this research is organized as follows:
Section 1 provides a comprehensive and up-to-date literature review on the optimization of smart hybrid renewable solutions within the water-energy nexus.
Section 2 outlines the methods and advancements in the development of simulation and optimization models for hybrid renewable energy solutions, capable of utilizing nonlinear gradient, such as the GRG Nonlinear, evolutionary techniques and multi-objective methods, such as the non-dominated sorting genetic algorithm (NSGA-II). This section includes fundamental mathematical formulations for the model’s simulation process, model optimization implementation and deployment, and microgrid characterization.
Section 3 presents the results and analysis of the model simulations, exploring four potential solutions based on both stand-alone and grid-connected configurations. Different renewable energy sources are considered for the technical, economic, and environmental evaluations.
Section 4 summarizes the key conclusions and limitations of the study.
2. Methods and Developments
2.1. Smart Optimization Model
Hybrid energy systems are very versatile and complex, due to the operation and management of different energy sources, demands, and constraints; it is crucial to seek the most optimized values corresponding to each energy sector/unit [48]. The thinnest modification of the energy balance throughout the season can produce significant deviations from optimal results. Therefore, once the input data is defined in the simulation model and the preliminary results are computed, several smart optimization simulations are carried out for each water allocation, seeking to improve the results obtained, depending on the selected optimized configuration [49].
Different objective optimization functions, such as the GRG Nonlinear (MS-Solver) and the NSGA-II (Python), can be selected and tested on the model. The multi-objective optimization, NSGA-II, can be integrated in the model with Python, through the Pymoo framework. The chosen method for the following case study, the GRG Nonlinear, seeks better results through gradient patterns, making it very dependent on the initial values for the decision variables, resulting in mostly local best solutions; nevertheless, the option multistart was enabled to improve the precision of the GRG Nonlinear method, mixing its fast-computing power with the complexity and precision of evolutionary methods, functioning similarly to genetic algorithms (GA) [50]. With the multistart option, the optimization process can seek a global solution. The population size was 250, with no set initial seed; the convergence requirement was considered 0.0001.
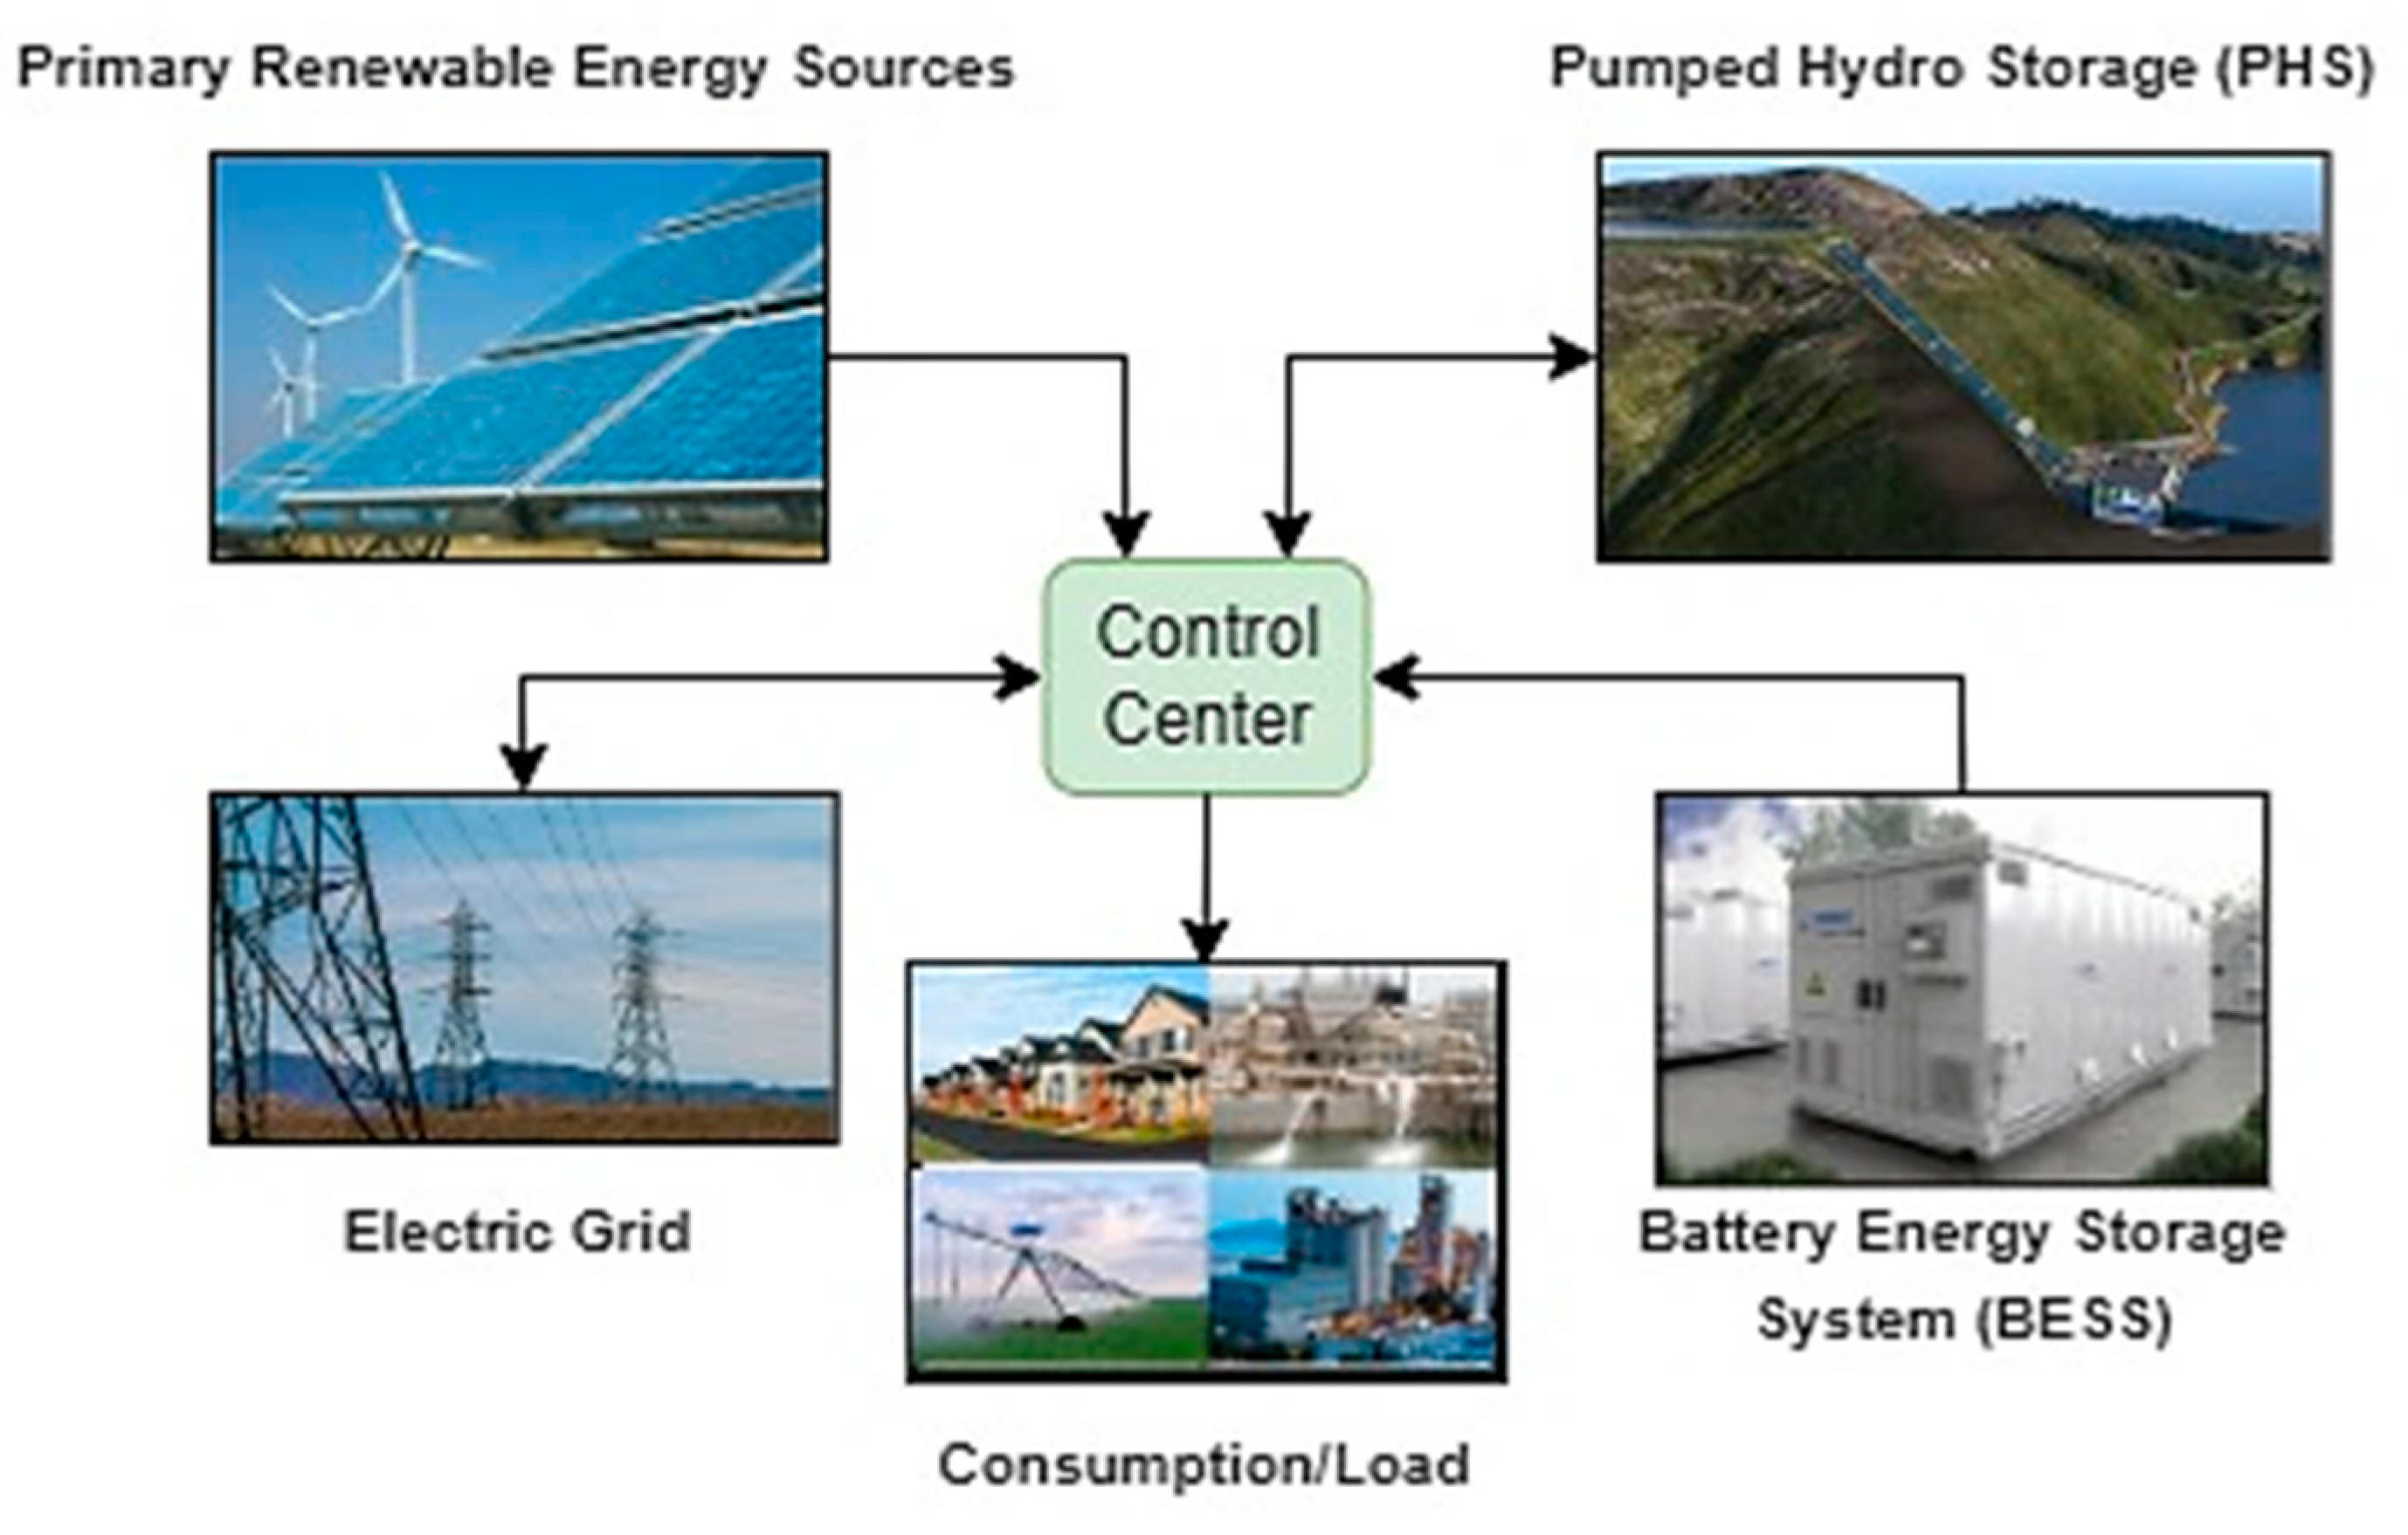
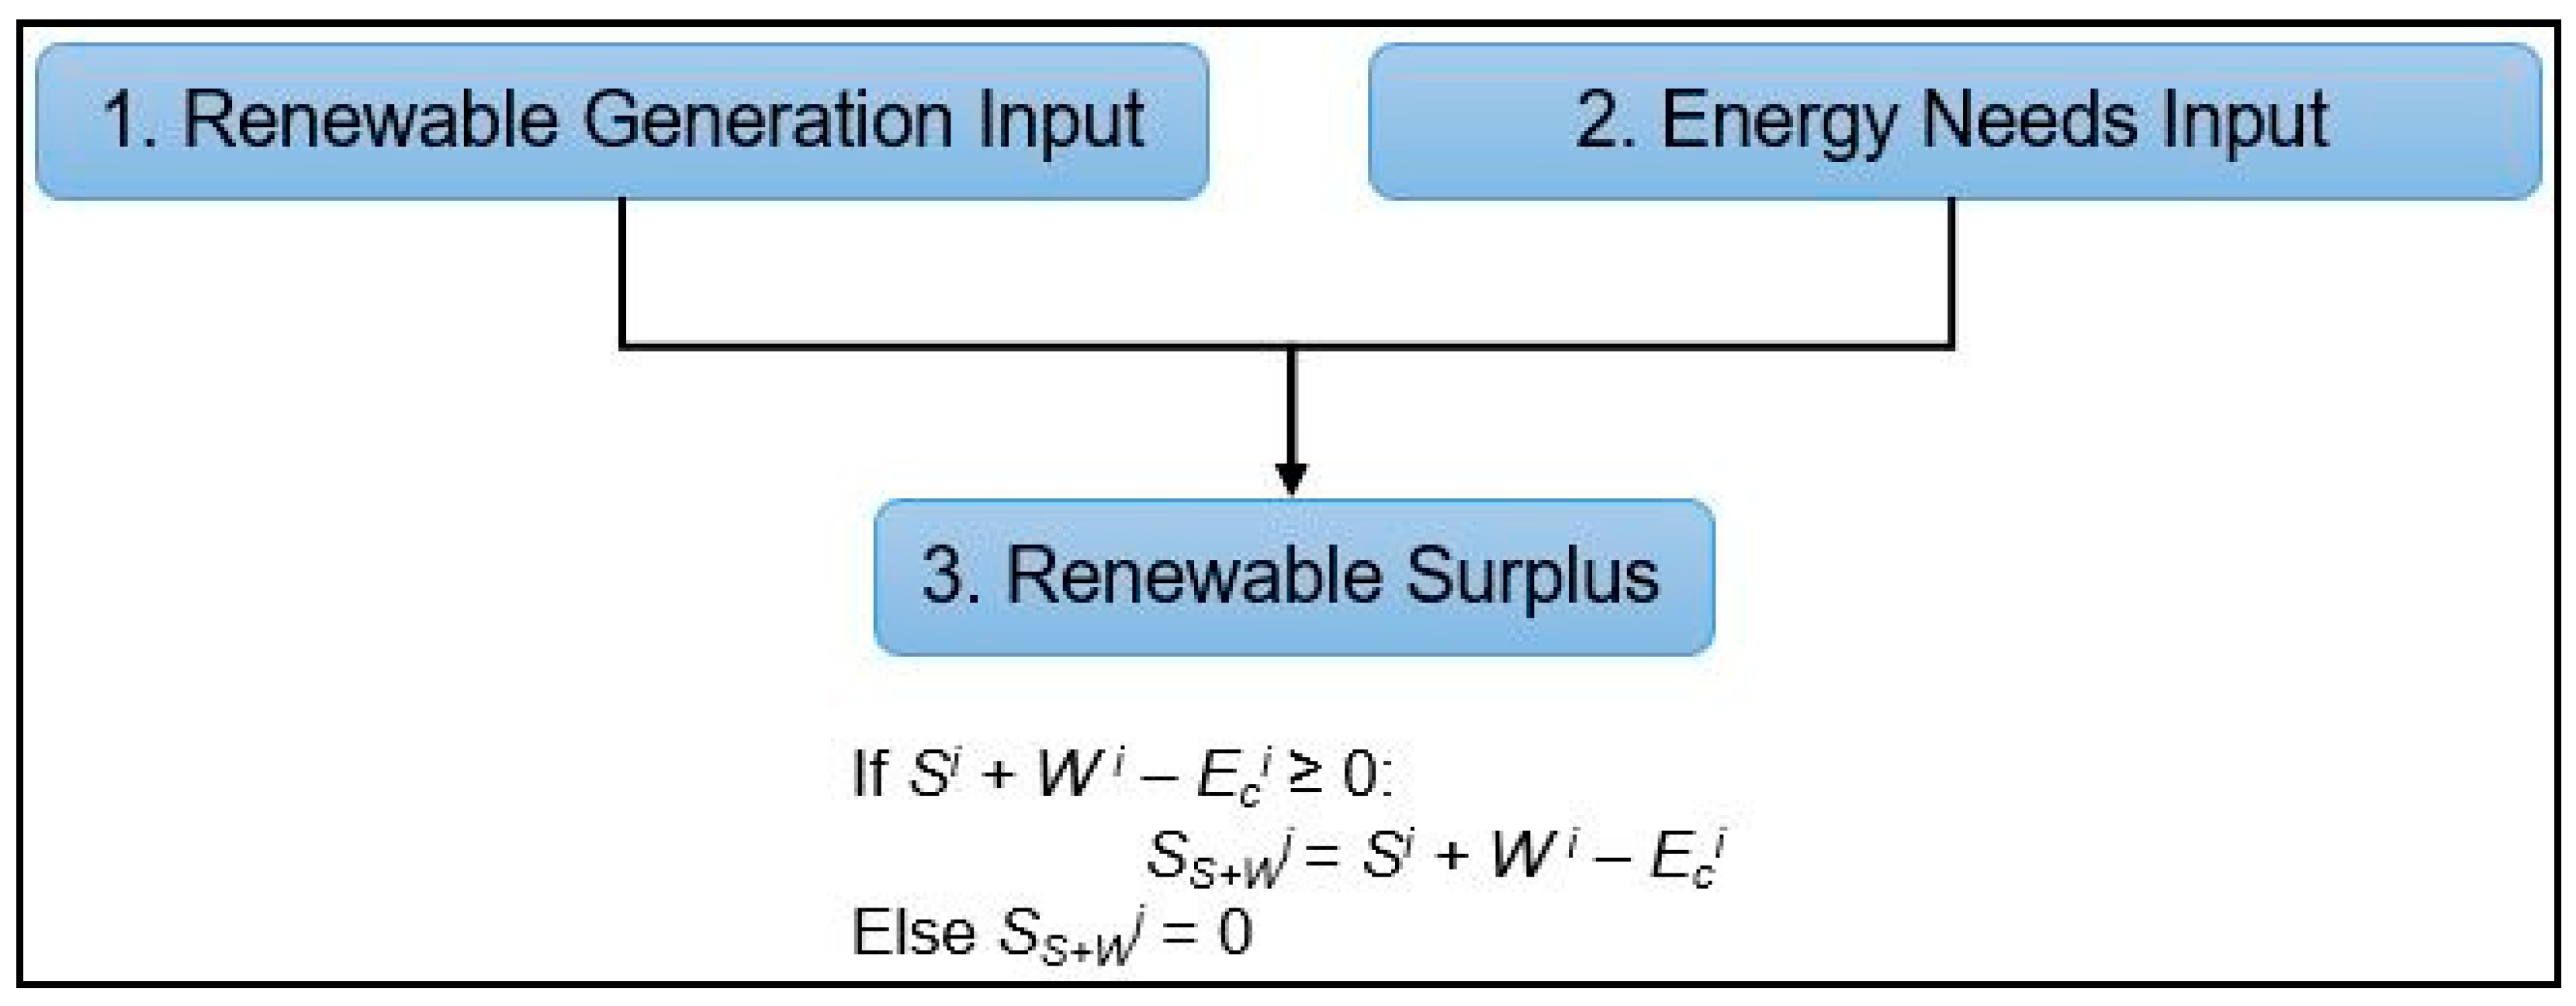
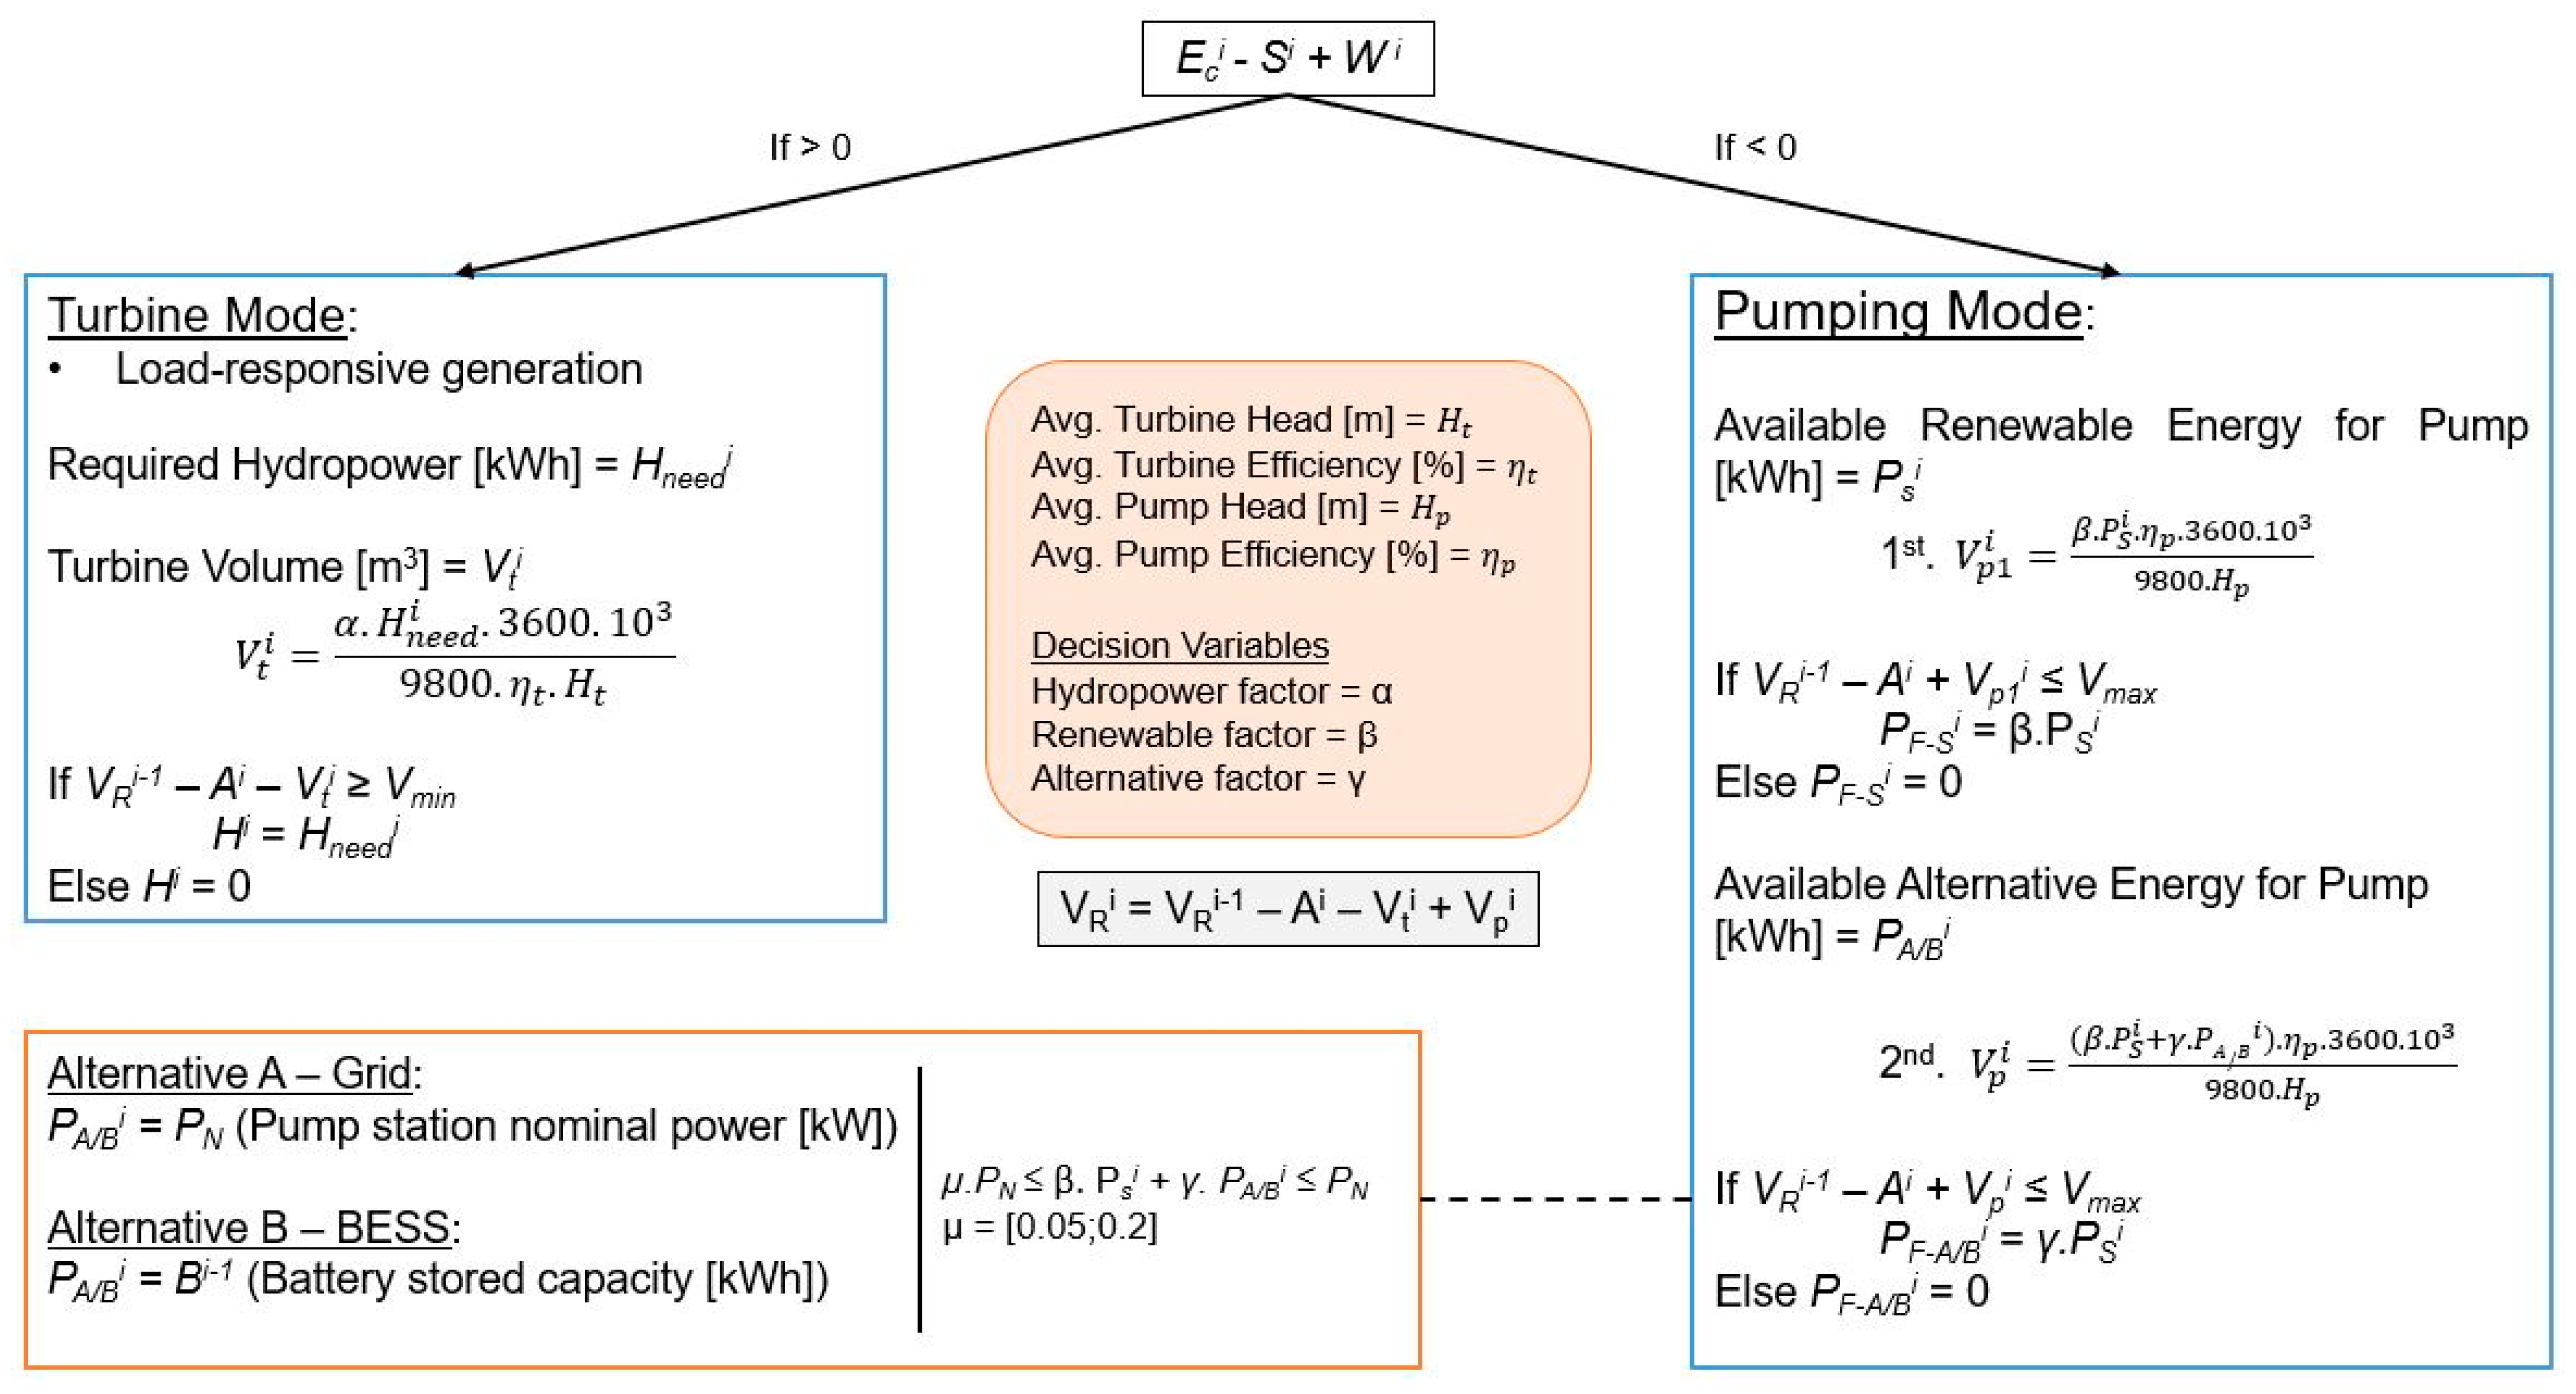
The model’s energy management process involves multiple sources and systems and a defined hierarchy. The main steps/subsystems that summarize/integrate the model are described next. Figure 1, Figure 2, Figure 3, Figure 4 and Figure 5 describe the mentioned subsystems and their mathematical algorithm that dictates the energy/water management.
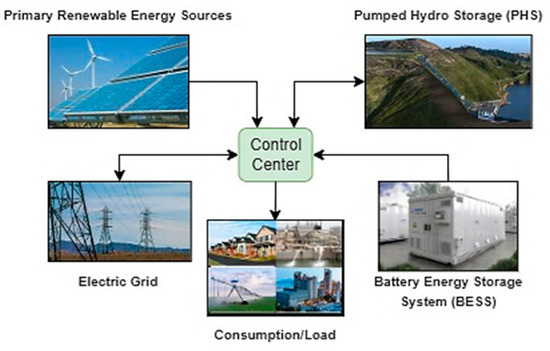
Figure 1.
Scheme of control center to connect intermittent renewables and energy demand.
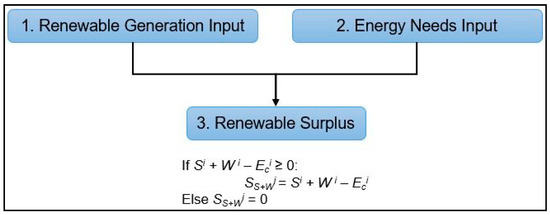
Figure 2.
Steps I and II, renewable surplus computation.
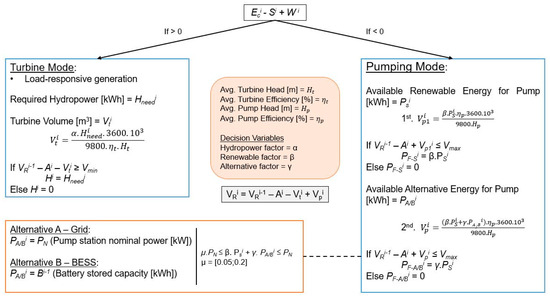
Figure 3.
Steps III and IV, pumped hydropower storage computation.

Figure 4.
Step VI, Alternative A-grid computation.

Figure 5.
Step VII, Alternative B—battery computation.
Step I—Primary Renewable Energy Sources: Hourly data on solar (Si) or wind (Wi) energy production is obtained from the PVGIS database. If solar energy is the main source, it is checked if it can meet the energy demand. Any excess energy indicates a surplus.
Step II—Energy and Water Demand Fulfillment: Energy needs (Eci) can be met through solar/wind, hydropower, and grid electricity or batteries. The water demand (Ai) refers to the specific water volume required to be retrieved from the PHS reservoir. The renewables surplus (SS+Wi) is deducted as presented in Figure 2.
Step III—Pumped Storage Hydropower (PSH): When solar/wind energy is insufficient, hydropower is required, corresponding to a load-responsive generation. Surplus solar/wind energy can pump water to store potential energy. Pumping and turbine operations depend on reservoir volume constraints.
Step IV—Reservoir Management: The upper reservoir has a set capacity (maximum and minimum). Each hour’s reservoir volume (VRi) is updated based on energy use and input/output.
Step V—Energy Surplus/Deficit and Alternative Selection: After the PHS iteration balance, the system might produce a surplus (E+i) or deficit (E−i) of energy that benefits from the presence of an auxiliary system.
Step VI—Grid Energy: If alternative A is selected, the electric grid is utilized if renewable sources and hydropower cannot meet the energy demand. Excess energy can be sold, while energy deficits are covered by buying from the grid, with hourly tariffs determining costs and profits, as described in Figure 4.
Step VII—Off-Grid Solutions with Batteries: In off-grid setups, batteries store excess energy and supply energy during deficits, ensuring that energy needs are fully met. This alternative replaces the conventional electric grid configuration.
The main equations used in the model are as follows:
where Ss+wi is the total intermittent renewables surplus; PSi is the available renewable energy to be used by the pumps, in kW;, VRi−1 corresponds to the reservoir volume at the end of the previous hour and Vti to the turbine volume, both in m3; Vpi corresponds to the pumped volume, in m3; E+i is the energy surplus in kWh; and is the energy deficit in kWh. Where the solar energy and the hydropower generated cannot satisfy the energy needs of the system, there is the option to buy from the grid the energy that is in debt. is the grid energy for the pump; Bei represents the energy needed from the batteries for energy needs, in kWh; and Bpi is the feasible battery energy to be used for pump operation, in kWh.
Concerning the optimization defined for the following case study, the decision variables are the hydropower, grid, and solar factors, where all these variables must be valued between 0 and 1. Additionally, the rated power of each energy source/variable is also set as a decision variable. Concerning the constraints, the total number of hours of water-energy needs not satisfied was set to zero to ensure satisfaction with these needs. Different objective functions can be used depending on the system’s characteristics and objectives. For the case study analyzed in this work, the objective function used aims to minimize the overall installed power capacity of the hybrid energy system (HES), i.e., to minimize the sum of all rated power sources/variables installed, whilst respecting the constraints defined. An off-grid solution with batteries can also be explored, with the developed optimization model. To enhance these results, the defined optimization objective seeks to diminish the required initial investment and operation and maintenance costs associated with the installed capacity.
2.2. Model Deployment
2.2.1. Small Energy Community Characteristic
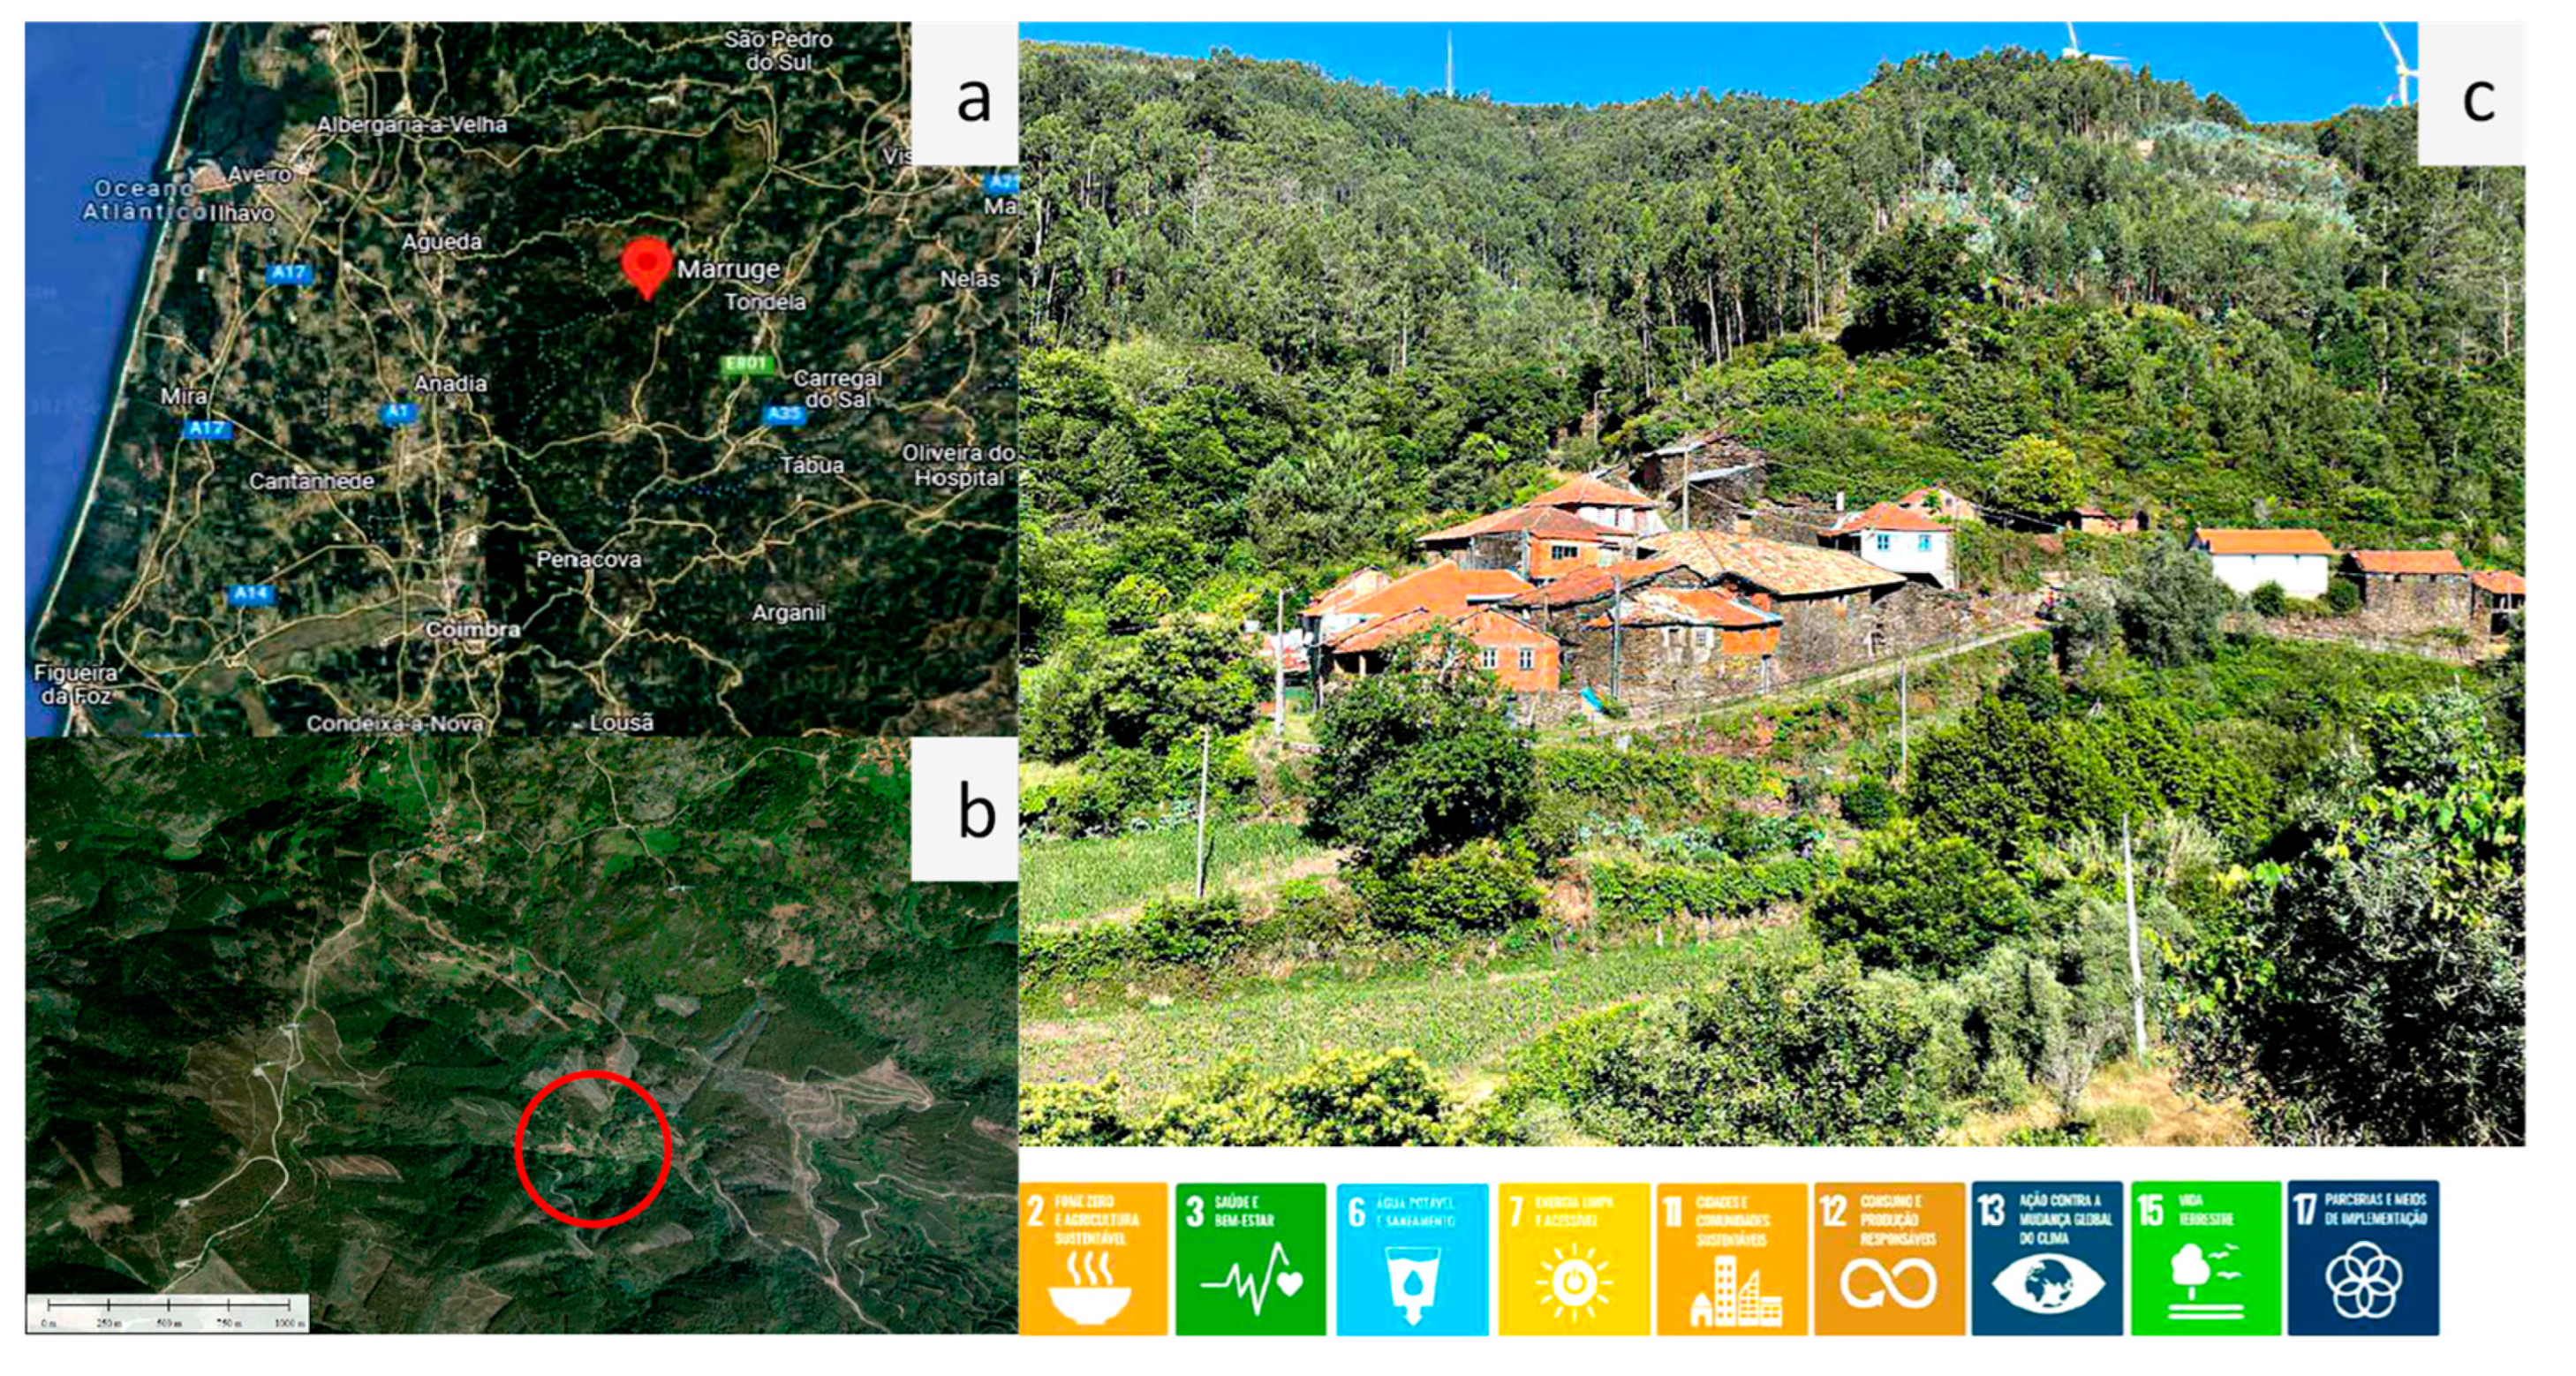
In this study, a small community in the northern part of Portugal, Marruge, was selected as the site for the setup implementation of a small hybrid energy solution (Figure 6). The model’s simulation algorithm is set to an hourly timestep. Two approaches were delineated for this study: stand-alone and grid-connected.
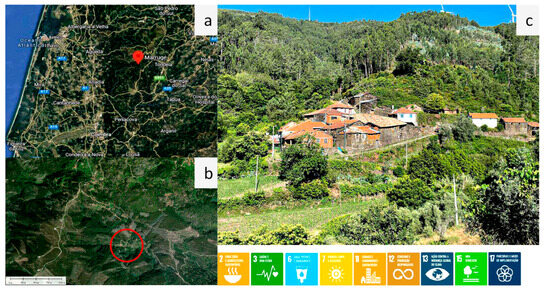
Figure 6.
Marruge as a future eco-village: location in country (a); place (b); small community village (c).
The village of Marruge, located in the Caramulo Mountains, provides an ideal setting for studying a grid-connected energy system due to its accessible location, as it is neither an isolated nor a highly remote community. Marruge features an agricultural area spanning approximately 8 hectares, developed into terraces. While this system stabilizes soil, reduces water runoff, and minimizes erosion, it also poses challenges, such as making the use of heavy machinery difficult. Traditionally, the land has been used to cultivate cereals, fruits, legumes, and vegetables. The village uses an irrigation system based on uneven gutters fed by local springs. However, several risks threaten the sustainability of Marruge, including the aging population, fire hazards, limited accessibility, and the loss of natural habitats due to the spread of eucalyptus trees.
Despite these challenges, Marruge holds significant potential for development, particularly in sustainable rural tourism focused on health, nature, and well-being. The village’s rich biodiversity, favorable microclimate, and strong cultural heritage, including traditional mills, granaries, and schist houses, make it an attractive destination. Its location in Serra do Caramulo and the presence of abundant water sources further enhance its appeal. Marruge could also benefit from investment partnerships with regional companies interested in social and environmental responsibility, alongside institutional support and a growing demand for sustainable tourism. These factors present a valuable opportunity for revitalizing the village while conserving its natural and cultural assets, providing new hybrid energy solutions able to incentive new water and energy nexus allocations.
2.2.2. Microgrid System
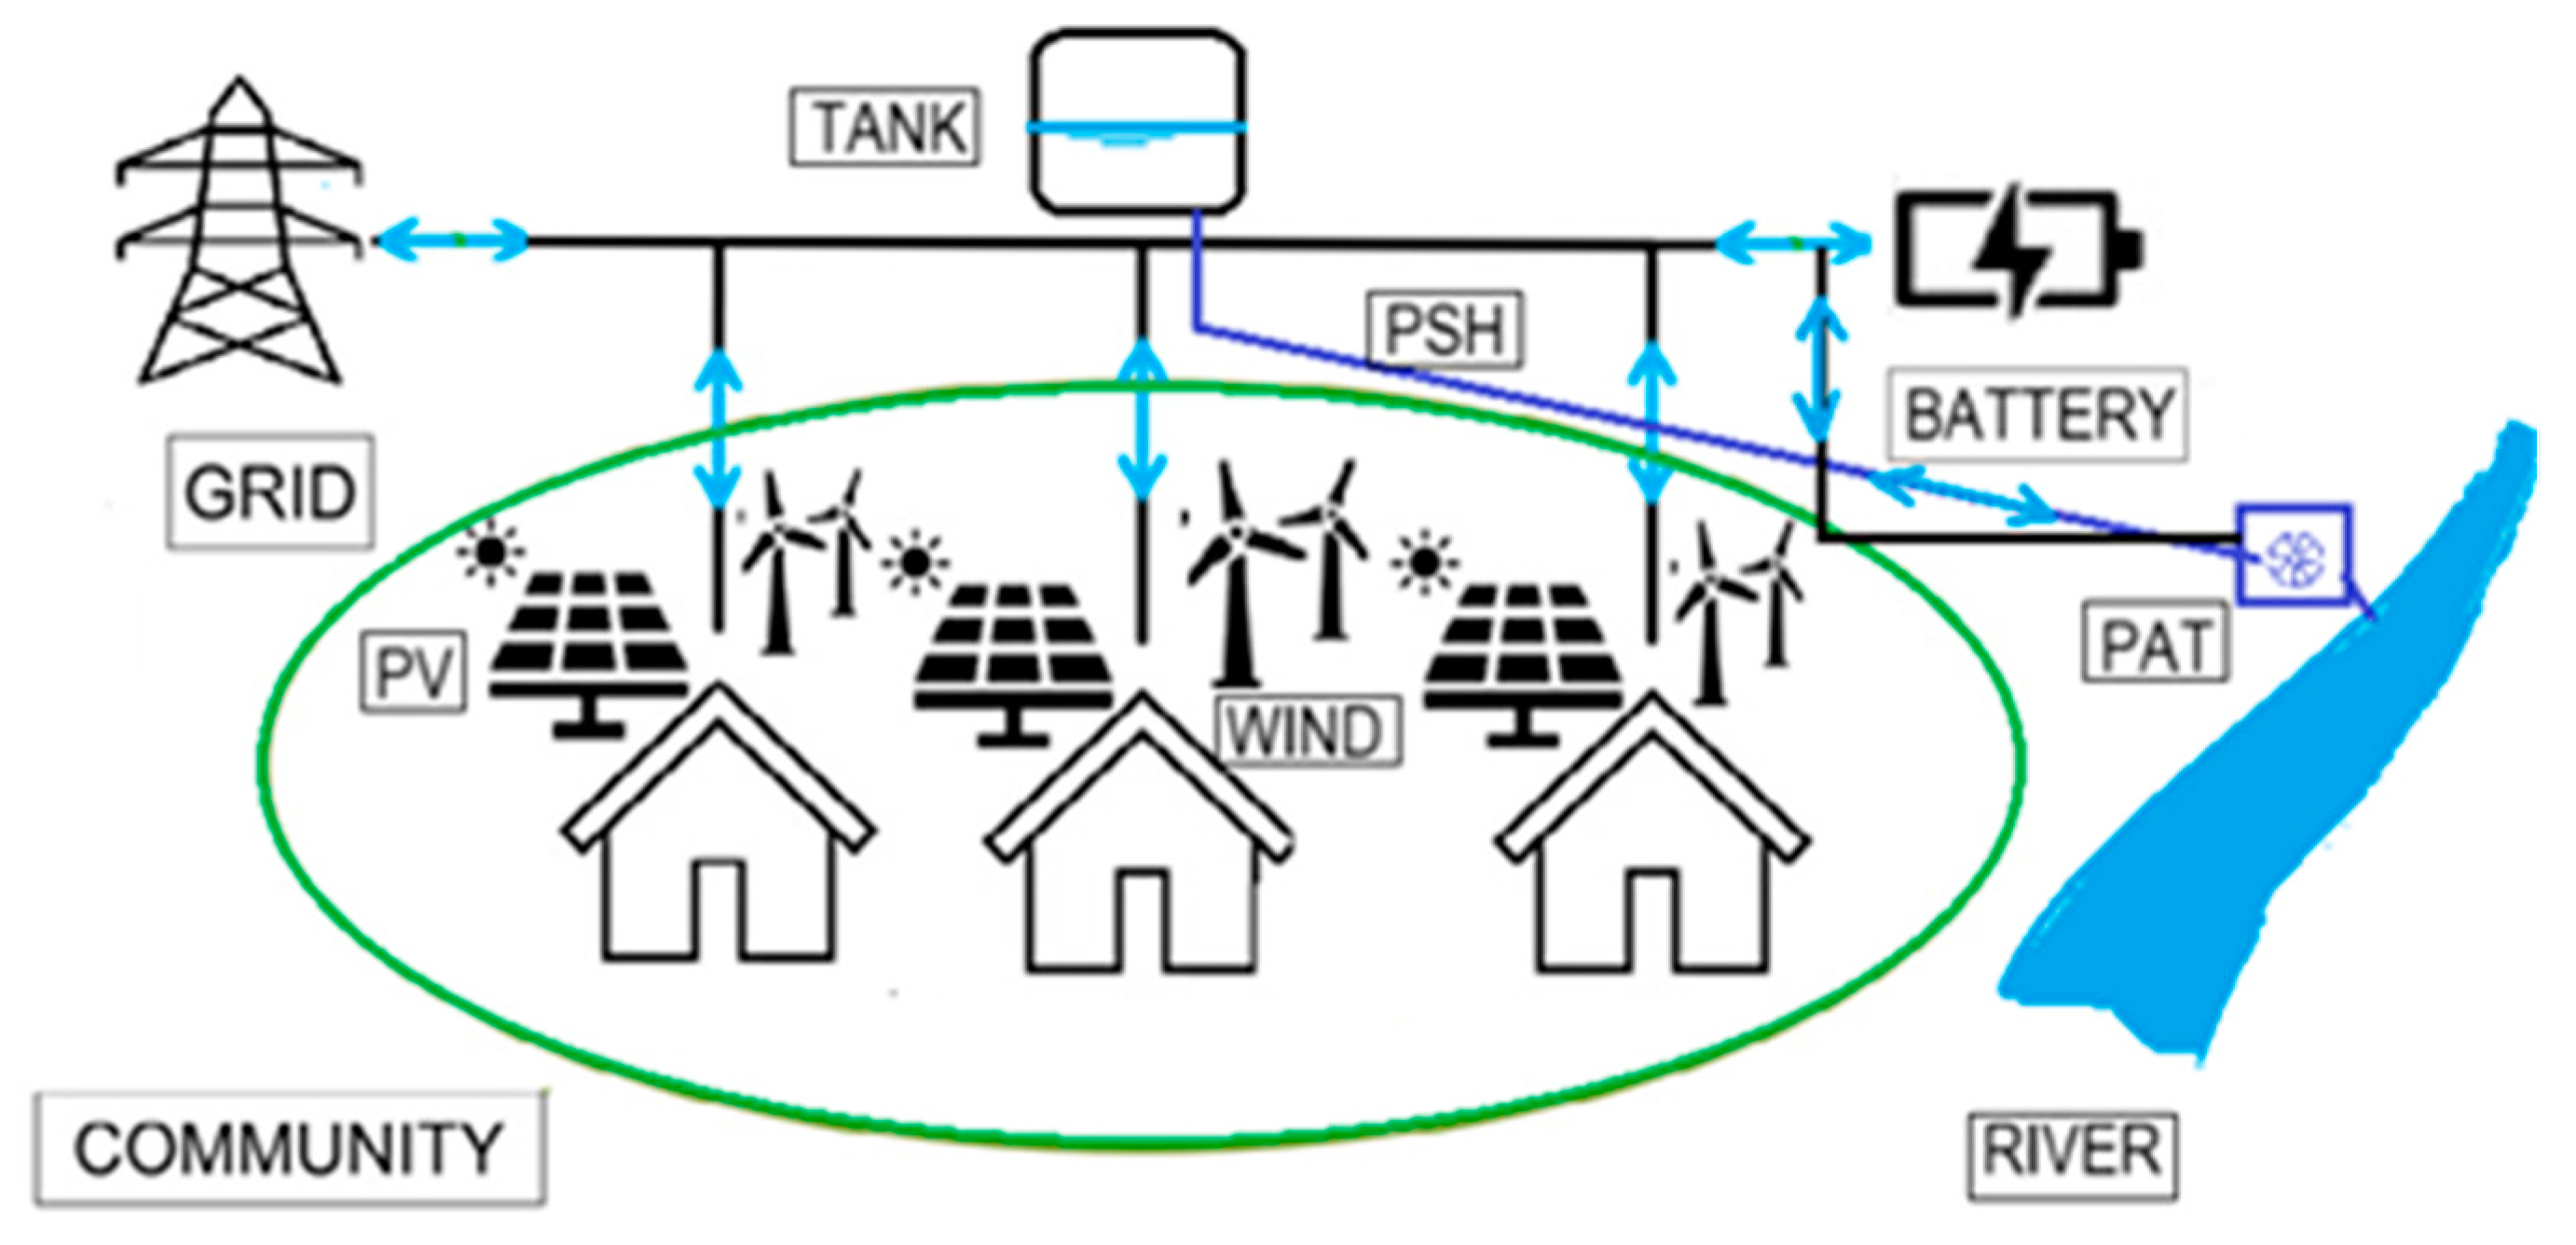
As a model deployment, it was utilized to analyze a microgrid of a small energy community as a microgrid may be entirely isolated from the national electric grid (i.e., stand-alone) or grid-connected (Figure 7). In the latter case, synchronization is required to enable imports/exports between the microgrid and the outside grid network.
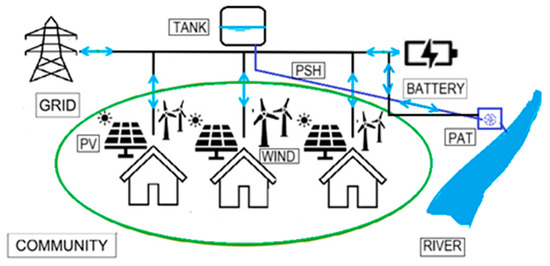
Figure 7.
Microgrid definition: can include photovoltaic, PV, wind, pumped-storage hydropower (PSH), battery energy storage system (BESS), and GRID support.
The stand-alone (SA) configuration employs solar and wind energy as the primary renewable energy source, integrating PHS as an energy storage and production mechanism. Furthermore, a scenario with a battery energy storage system (BESS) is presented. The grid-connected (GC) setup implements solar or wind with PHS. The grid-connected solutions were validated based on two criteria: a minimum yearly grid independence of 80%, i.e., only 20% is allowed as a maximum dependence, and a positive grid balance, defined as energy exports minus imports. The cash flow corresponds to the difference between revenue (selling excess energy to the grid) and costs (buying energy from the grid).
The primary objective is to develop a reliable and cost-effective solution for a small-scale energy community. Accordingly, the evaluation encompasses a range of energy source configurations and installed capacities in both the stand-alone and the grid-connected setups.
In this case study, the subsidies are not considered, nor are the costs associated with the hydraulic circuit of the pump-storage hydropower (PSH), including reservoirs, pipelines, and valves, which already exist to satisfy the existent irrigation system. The economic parameters defined for this small-scale analysis are summarized in Table 1.

Table 1.
Economic parameters of this small energy community.
The grid balance cash flow for the grid-connected setup is constant throughout its entire lifetime due to the absence of state subsidies. The hybrid system can be independent of the grid according to certain water-energy allocation values. Nowadays, most EU countries tax these emissions, which increases the costs, thus requiring them to be taken into account when analyzing the economic parameters during a lifetime. The cost derivative from CO2 emissions can be computed as follows, by Equation (8) defined in [53].
where ECCO2 corresponds to the annual costs derivative from CO2 emissions, in €; grid energy is the total annual energy consumed by the system, in kWh; the CO2 factor is the relation value between energy and kilograms of carbon dioxide emitted, equal to 0.331 kgCO2/kWh; and the emissions tax corresponds to the value defined by the government/authorities to penalize the emissions associated with the system operation, equal to 0.1162 €/kgCO2 [53].
Once the results for different water-energy needs have been obtained and optimized, the yearly energy and economic balance can be evaluated. In this case study, a lifetime analysis of 25 years is defined. Regarding the economic aspect, the cash flow can be calculated for every year using the following Equation (9).
The cash flow (n) corresponds to the total annual difference between profits and costs, where “n” represents the year; profits(i) and costs(i) are the hourly profits and costs, respectively; and “k” is the total number of hours in the studied year.
Additionally, the levelized cost of energy (LCOE) can be computed. This metric is crucial to analyze the viability of a project for an extended period. The formula to obtain the LCOE is listed by Equation (10).
Accordingly, the net present value of the cash flow is computed by Equation (11). The total project’s NPV and LCOE are obtained from the following:
Hence, after defining all equations to support the model’s best solution decision, the smart hybrid energy algorithm is ready to be applied to a small energy community to find the finest system energy source combination depending on the system constraints and objectives.
3. Case Study
This section presents the input data for the analyzed small energy community case study, followed by the subsequent results and discussion section.
3.1. Data Collection
3.1.1. Energy Demand
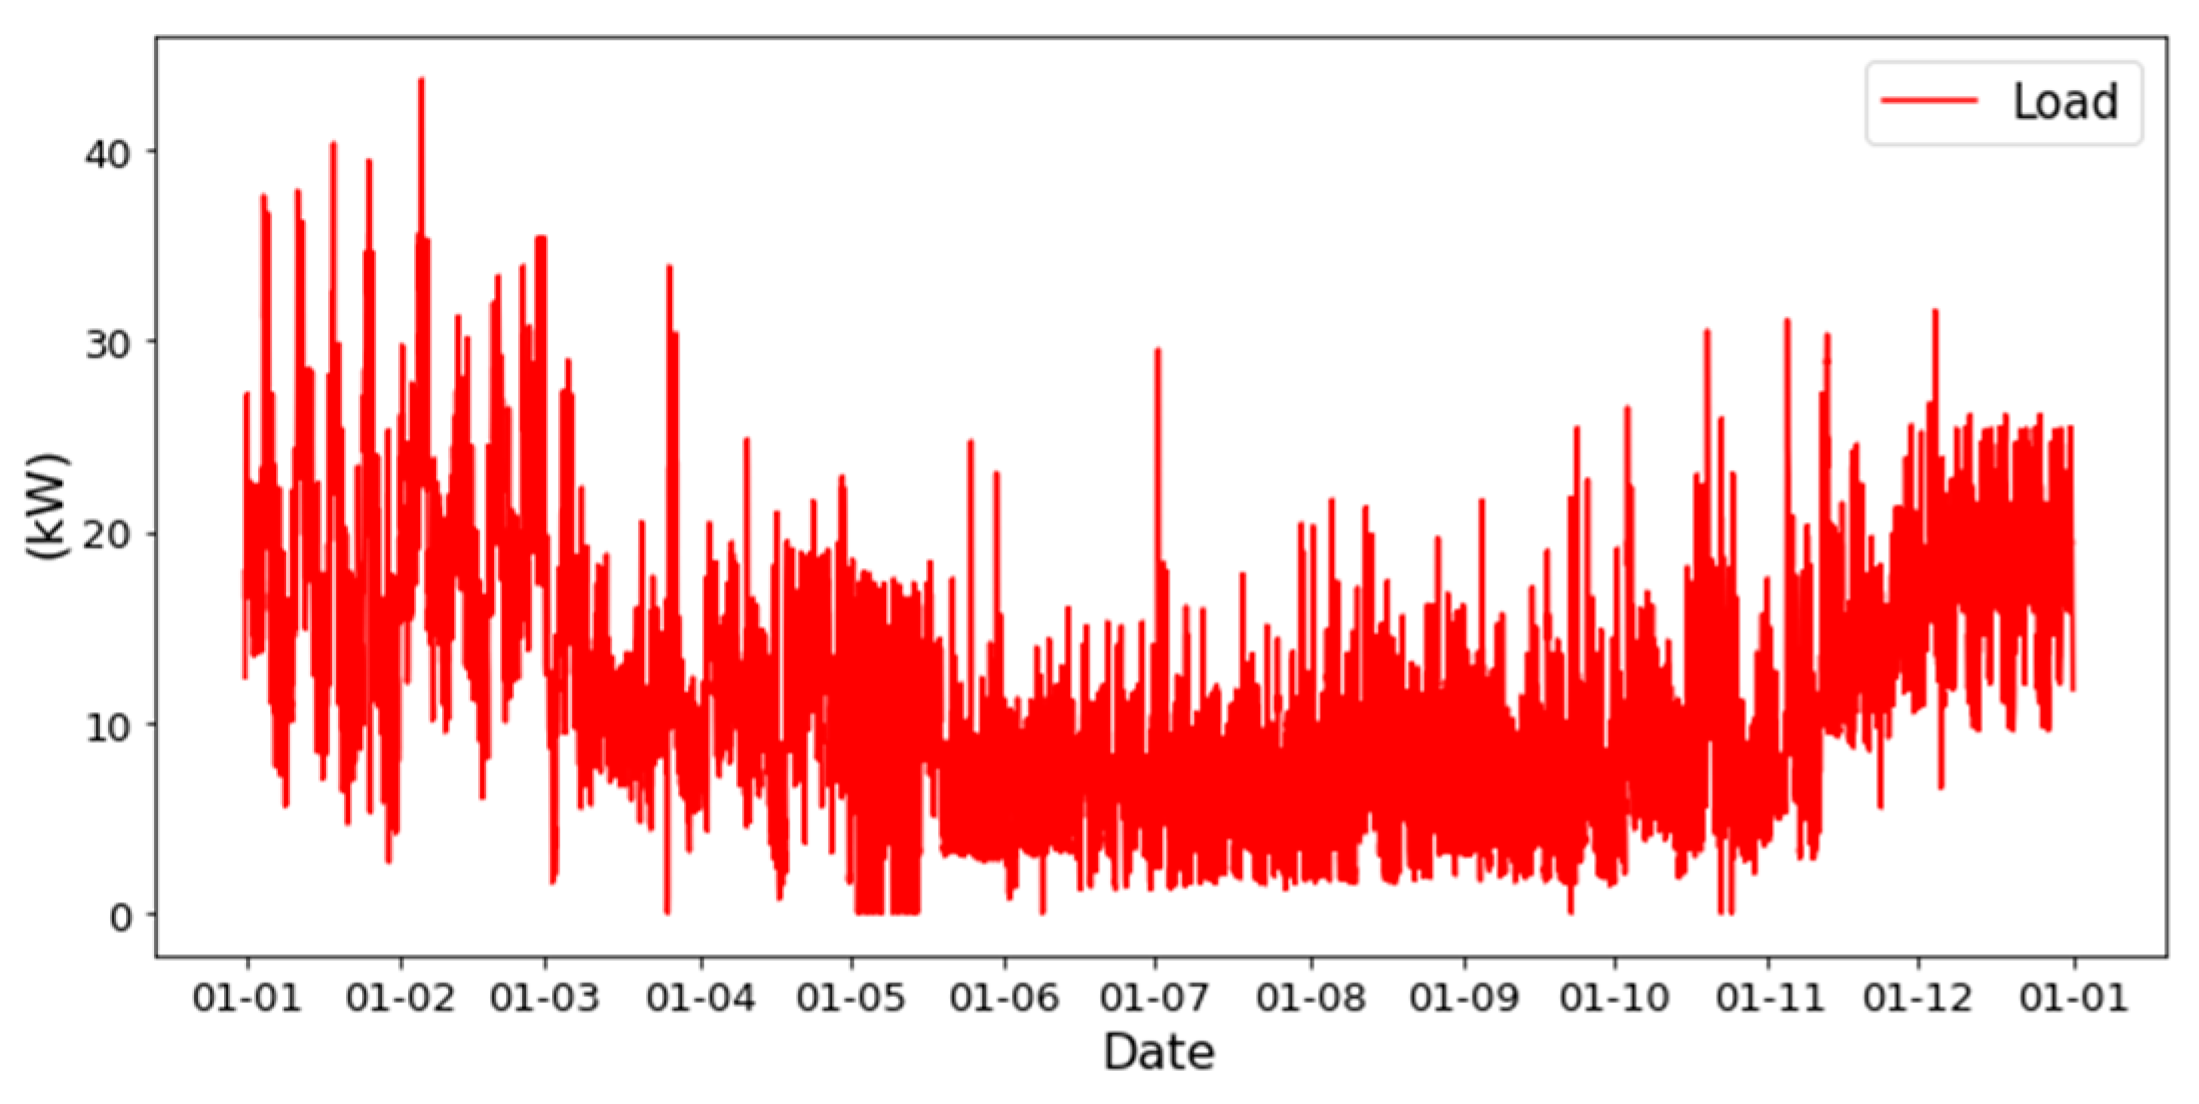
The annual energy consumption profile of the small energy community of Marruge, in Tondela, Portugal, is presented in Figure 8, wherein a markedly elevated consumption pattern distinguishes the months of January, February, and December. The maximum load recorded was 43.68 kW, in February.
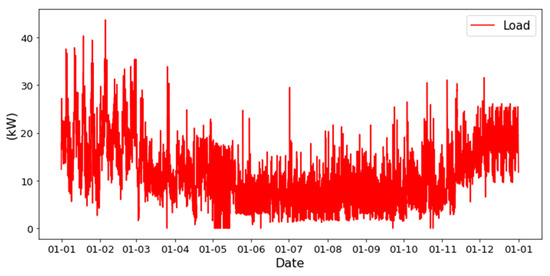
Figure 8.
Microgrid’s yearly load profile.
3.1.2. Intermittent Energy Production: Photovoltaic and Wind Generation
The solar power production data were obtained from the tool PVGIS for a peak power of 1 kWp and subsequently scaled up in accordance with the proposed setup and configuration. The selected module was of the monocrystalline silicon module type with an optimized slope and azimuth orientation of 32 and −5 degrees, respectively.
The wind power output (Wi), in kW, was estimated by Equation (12) for standard wind speed limits: cut-in speed (uci) = 2 m/s, rated speed (ur) = 10 m/s, and cut-out speed (uco) = 25 m/s [56]. The hourly wind speed at a height of 50 m (ui), was retrieved from PVGIS solar data, in m/s. Pr corresponds to the wind turbine rated power, in kW.
3.1.3. Pumped-Storage Hydropower
The site for the PSH plant has a gross head of 80 m. The average pump and turbine efficiencies (mechanic + electric) are set to 70% and 80%, respectively. To ascertain the optimal average pump and turbine heads, the model was initially run with the gross head value to retrieve the typical flow range of the hydraulic circuit with various PSH installed capacities. Given a flow rate range of 30 to 65 l/s, the optimal diameter for the length of a 350 m single pipeline, constructed from cast iron, is 200 mm (flow velocity does not exceed 3 m/s in the penstock). Based on this, it is feasible to calibrate the average pump and turbine heads, defined as 82 and 77 m, respectively. The PSH system was modeled with two water levels, the bottom—the river—and the upper water storage tanks, with a maximum and minimum volume of 10,000 and 1000 m3, respectively. The designed optimization model applies to both water levels at the starting and ending nodes of the hydraulic circuit. This is because the total volume of water, which is equal to the capacity of the upper reservoir, remains constant. Accordingly, the mathematical algorithm developed remains applicable for this setup. The case study could also use a smaller hydropneumatic tank, or a combination of several, to produce hydropower with the storage of potential energy and compressed air.
Concerning the grid-connected setup solutions for the small energy community system, the import and export tariffs must be defined. The grid cash flow highly depends on the type of energy contract and the price market fluctuation. Nevertheless, a fixed (simple tariff) purchase and sale price of 0.22 and 0.08 €/kWh were defined, respectively, for this analysis.
3.2. Results and Discussion
A total of four solutions were assembled, two stand-alone and two grid-connected solutions, which combine different renewable energy sources and energy storage mechanisms. The following section presents their technical capabilities and assesses their economic comparison, obtained by the defined optimization method, that minimizes the total installed capacity of the small energy community.
The stand-alone setup examines a microgrid solution. It is entirely independent from the external electric grid, through two similar configurations, with the corresponding designations: SA1—PV + Wind + PSH and SA2—PV + Wind + PSH + BESS. The grid-connected (GC) setups (i.e., GC1—PV + PSH + Grid and GC2—Wind + PSH + Grid) explore the small energy community solution that maintains synchronization with the national electric grid. Nevertheless, to prevent the grid from unduly influencing the system’s operation and deviating it from the intended purpose of a microgrid, it is essential to establish two validation criteria. The solution must be at least 80% independent from it and have more energy export than import.
3.2.1. SA1—PV + Wind + PSH
The fundamental configuration of the off-grid system, named SA1, employs the combination of solar and wind energy sources, with the supplementation of a pumped-storage hydropower system. The optimization method, defined as OPT5, which minimizes the required installed capacity while adhering to the 100% grid independence constraint, yielded the power installments for each energy source, which are distributed as 40 kW in the PV system, 120 kW in wind turbine, 20 kW in pump, and 40 kW in turbines, with the total power equal to 220 kW.
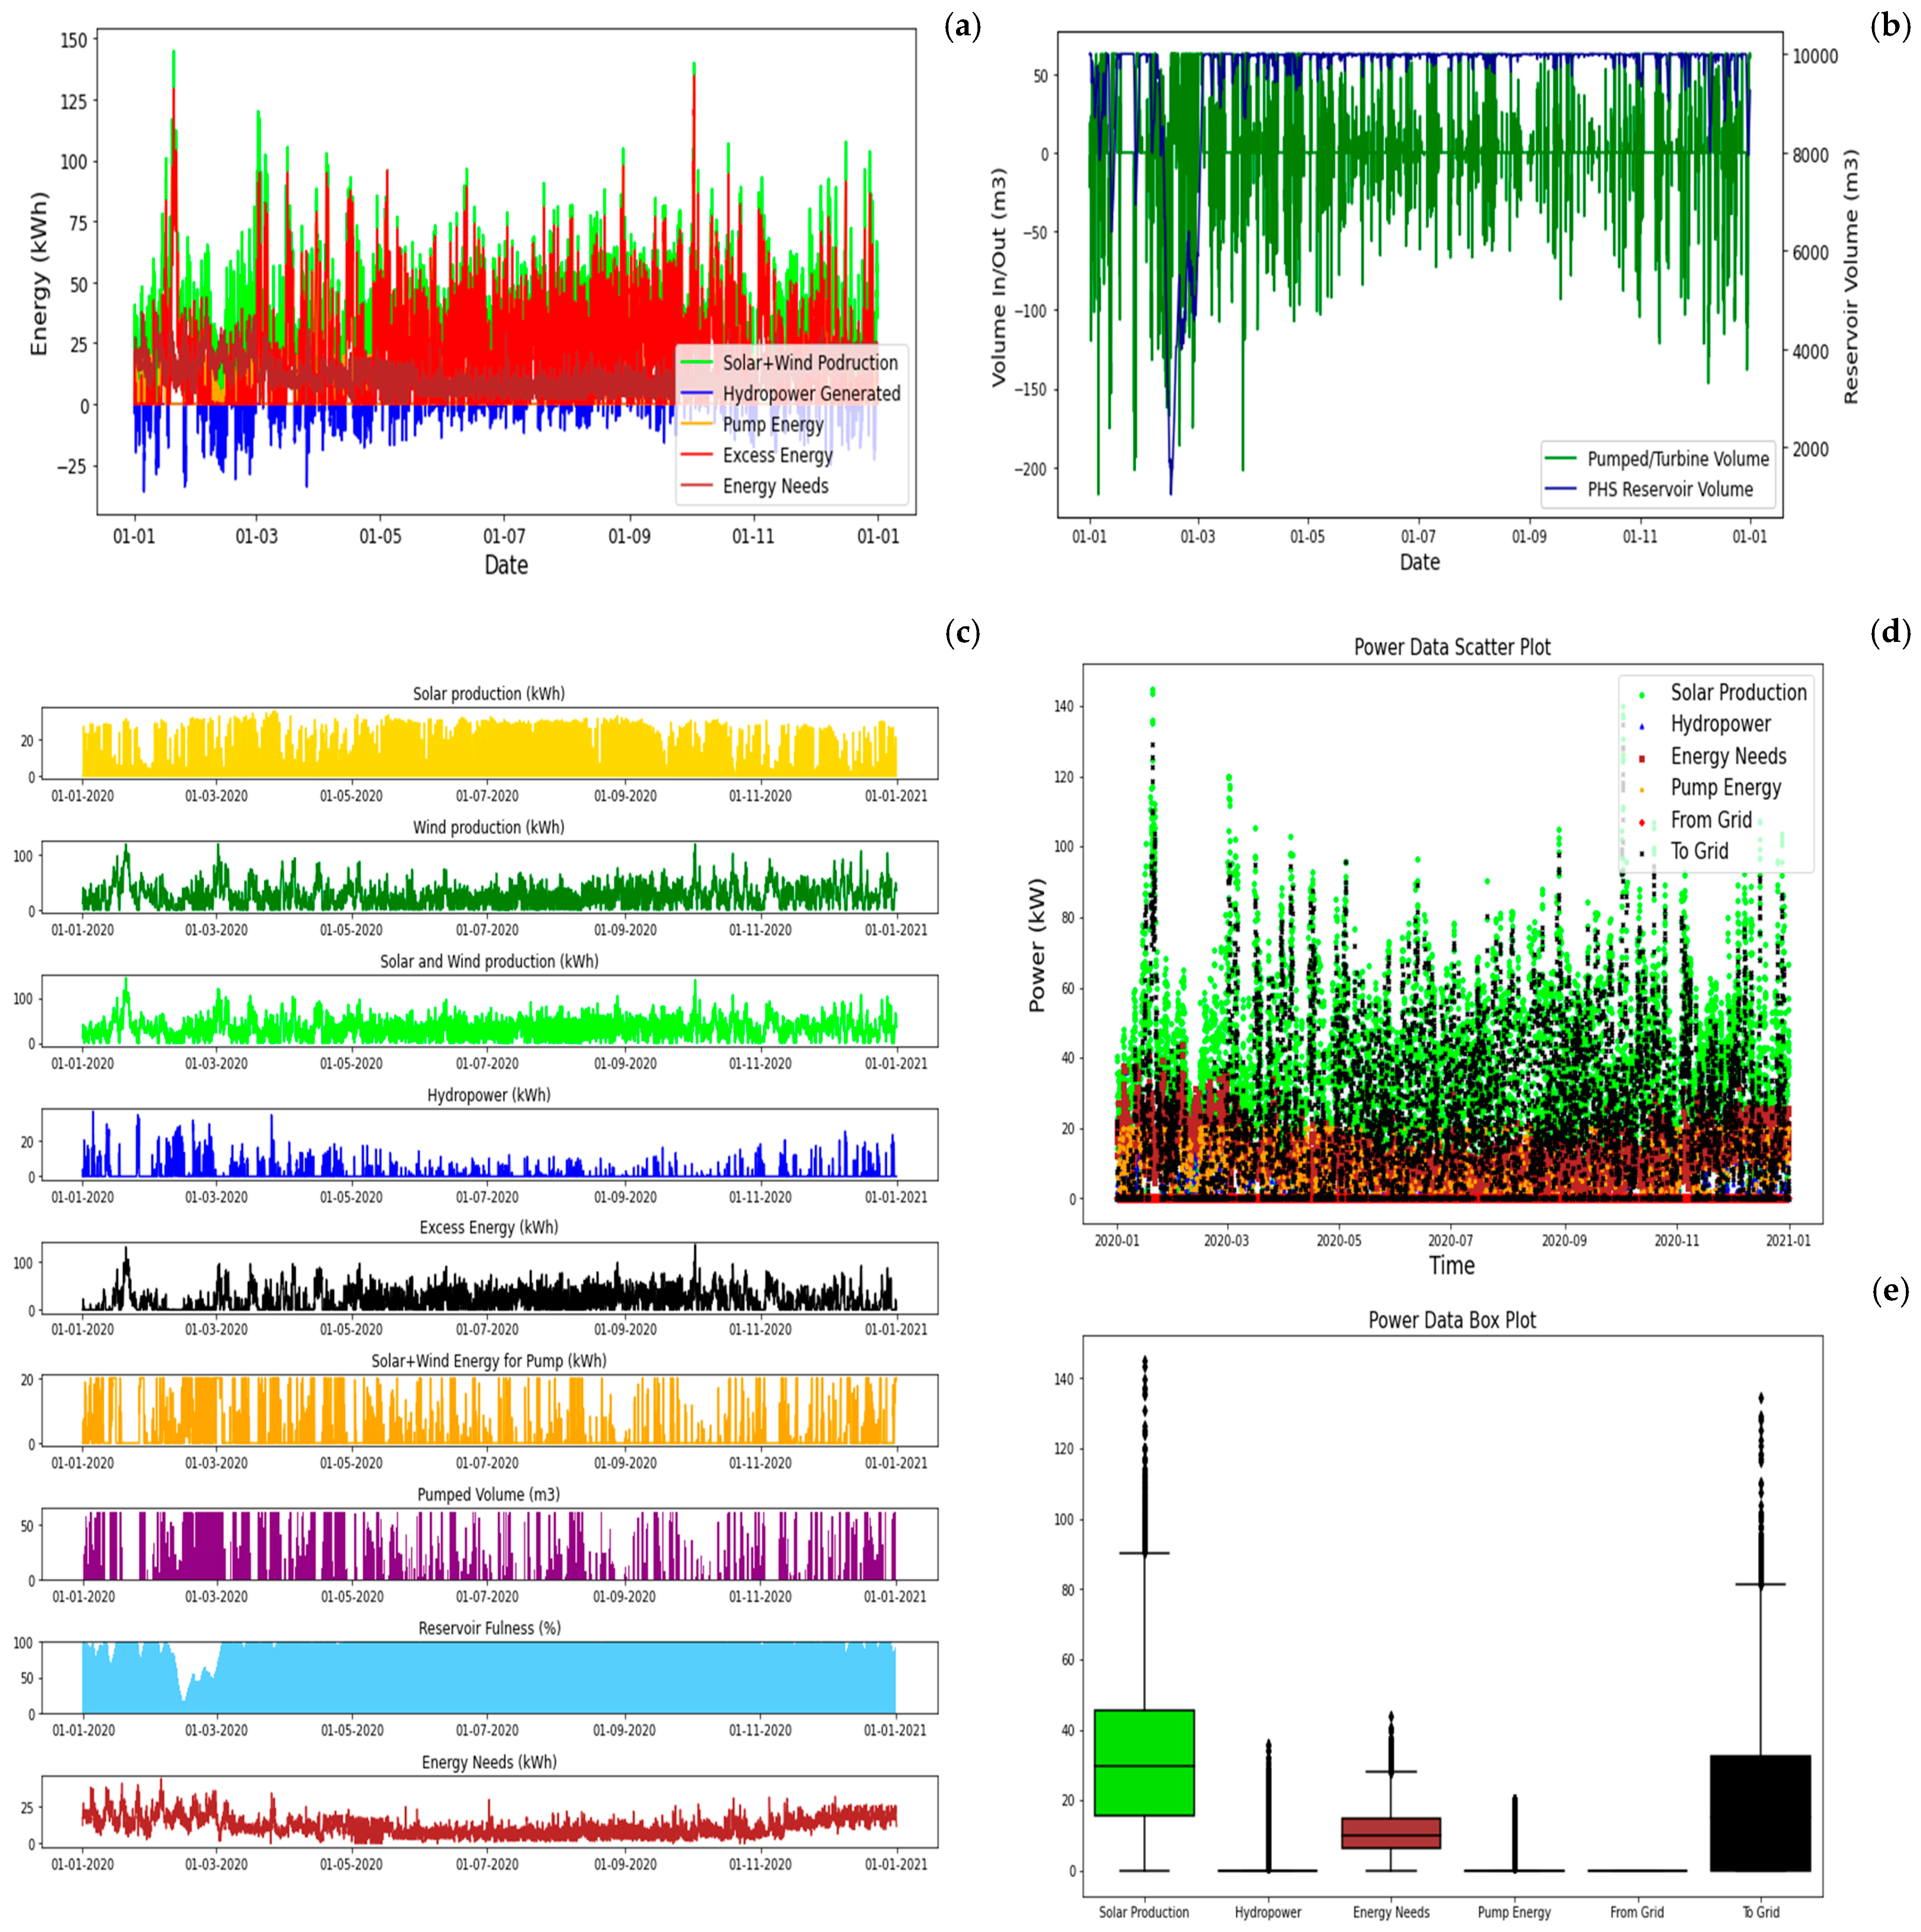
In the absence of an external grid, the peak winter months require the installation of supplementary power sources to meet the increased demand for energy. Accordingly, the power installed yielded by the optimization generates three times the total consumption energy, in case all the energy sources are permanently connected throughout the year. Figure 9 illustrates the energy and water balances throughout the year, with particular emphasis on the excess energy (i.e., wasted energy) generated by the system during periods of low or average demand. The combination of wind and solar energy markedly augments the system’s capacity to meet the demand. While the optimized power installations may be deemed excessive for the average consumption load, it is nevertheless imperative to guarantee sufficient capacity during peak months.
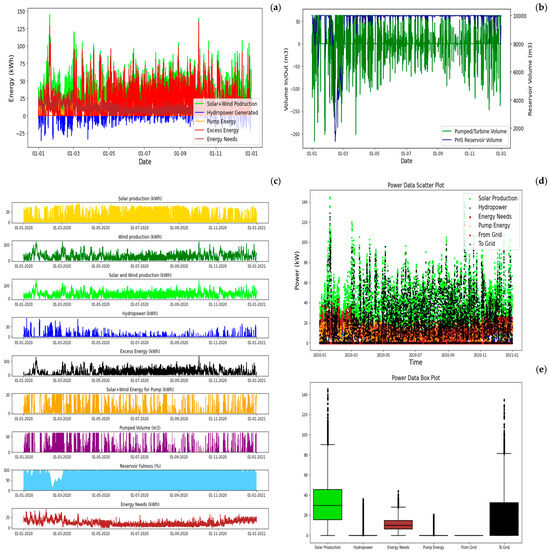
Figure 9.
SA1—PV + Wind + PHS yearly balance: (a) energy balance, (b) water balance, (c) energy by sources, (d) power data, and (e) statistics (between percentile 25 and 75%).
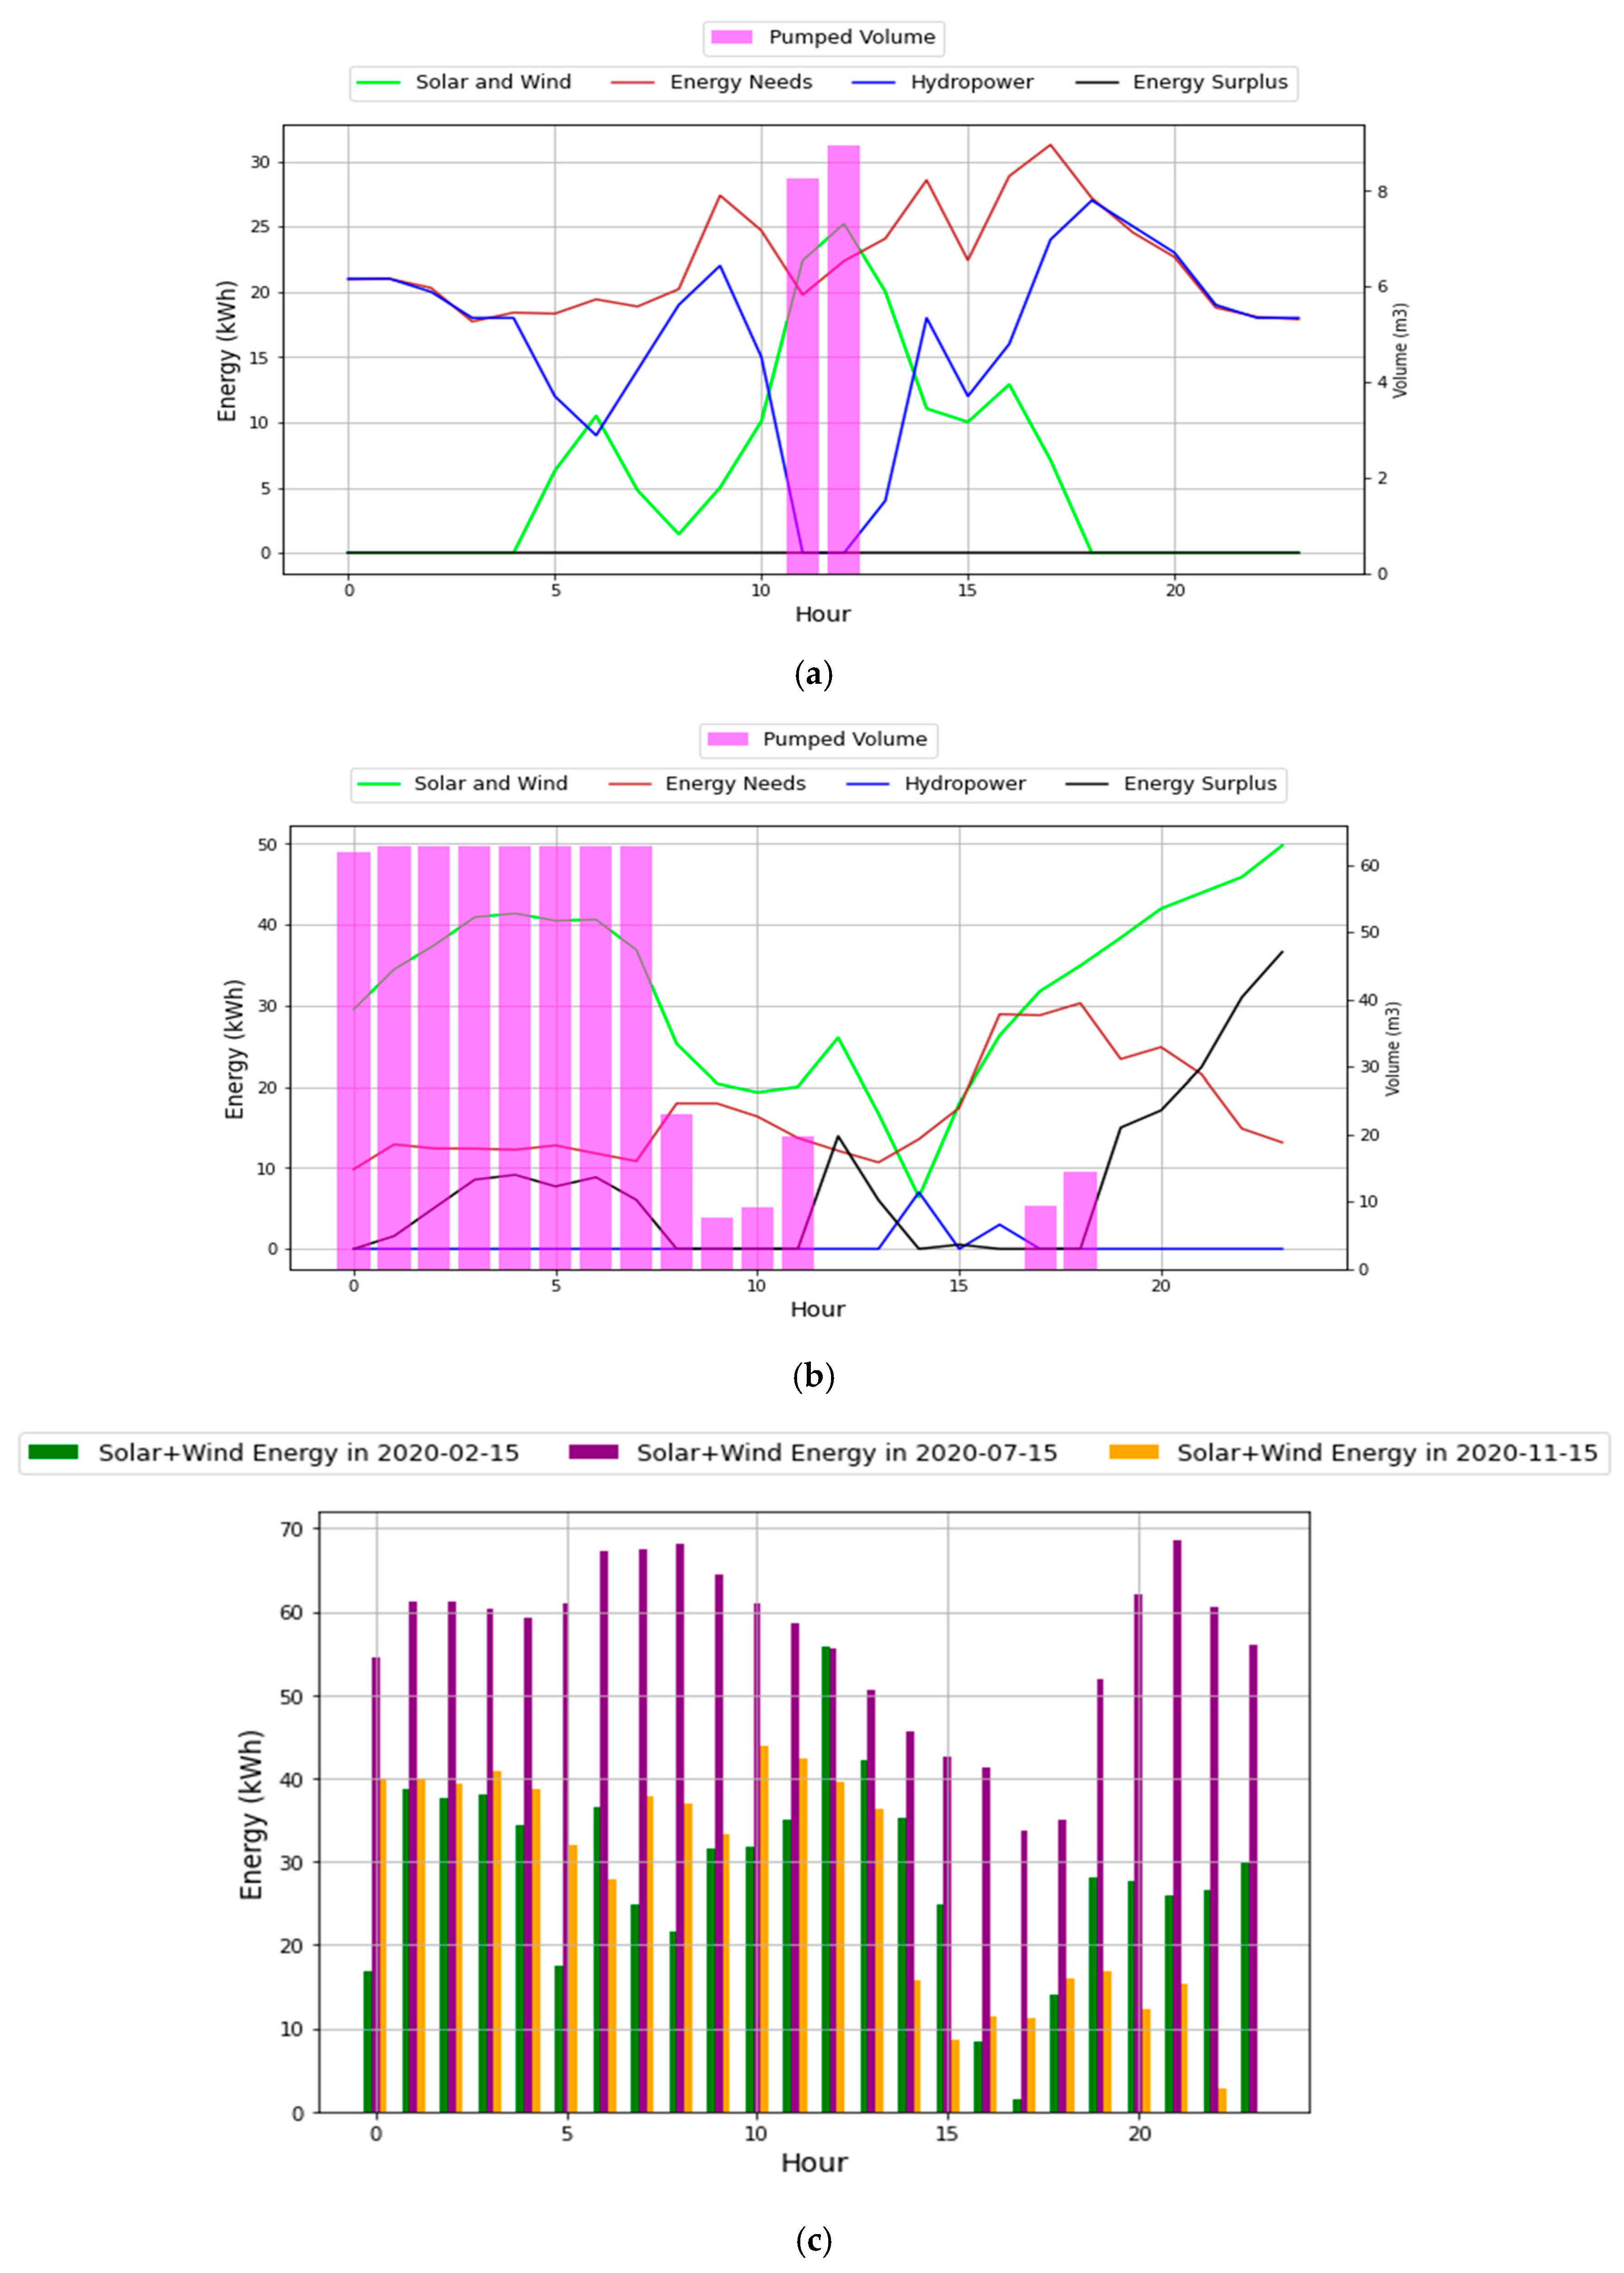
The issue of wasted energy can be addressed by either deactivating primary renewable sources or, ultimately, connecting the microgrid to the national grid for exclusive exportation. Figure 10 presents the daily balance on two distinct days. The consumption profile on 12 February is significantly greater than on 12 November.
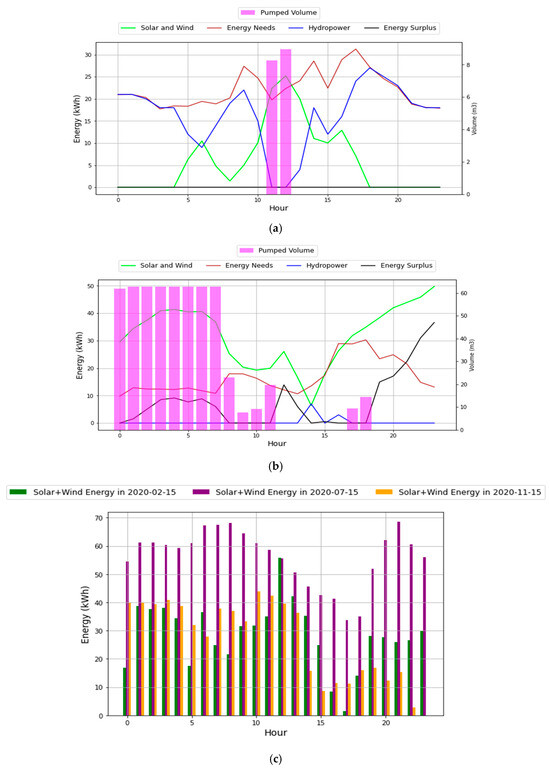
Figure 10.
SA1—PV + Wind + PSH yearly balance: (a) daily balance on February 12, (b) daily balance on November 12, (c) solar and wind generation profile.
The high energy demand requires more hydropower generation to satisfy the unmet consumption by solar and wind energy sources. Subsequently, February is characterized by the balance presented, wherein the pumped volume is restricted to a few hours, defined in Figure 10a, permanently decreasing the reservoir’s stored volume, and hydropower is highly required to fulfill the energy needs. On the contrary, for months of lower demand, such as is presented in Figure 10b, the installed power of solar and wind is enough to completely fulfill the energy load, with its surplus being used to pump significant volumes of water for storage.
3.2.2. SA2—PV + Wind + PSH + BESS
The second stand-alone solution, SA2, introduces a battery energy storage system (BESS) to investigate its influence on the system’s behavior and ascertain whether it is advantageous by reducing the necessary power installations of other energy sources. The optimized power results were distributed as 55 kW in the PV system, 100 kW in wind turbine, 35 kW in pump, 40 kW in turbines, and 40 kW in batteries, making the total power equal to 270 kW.
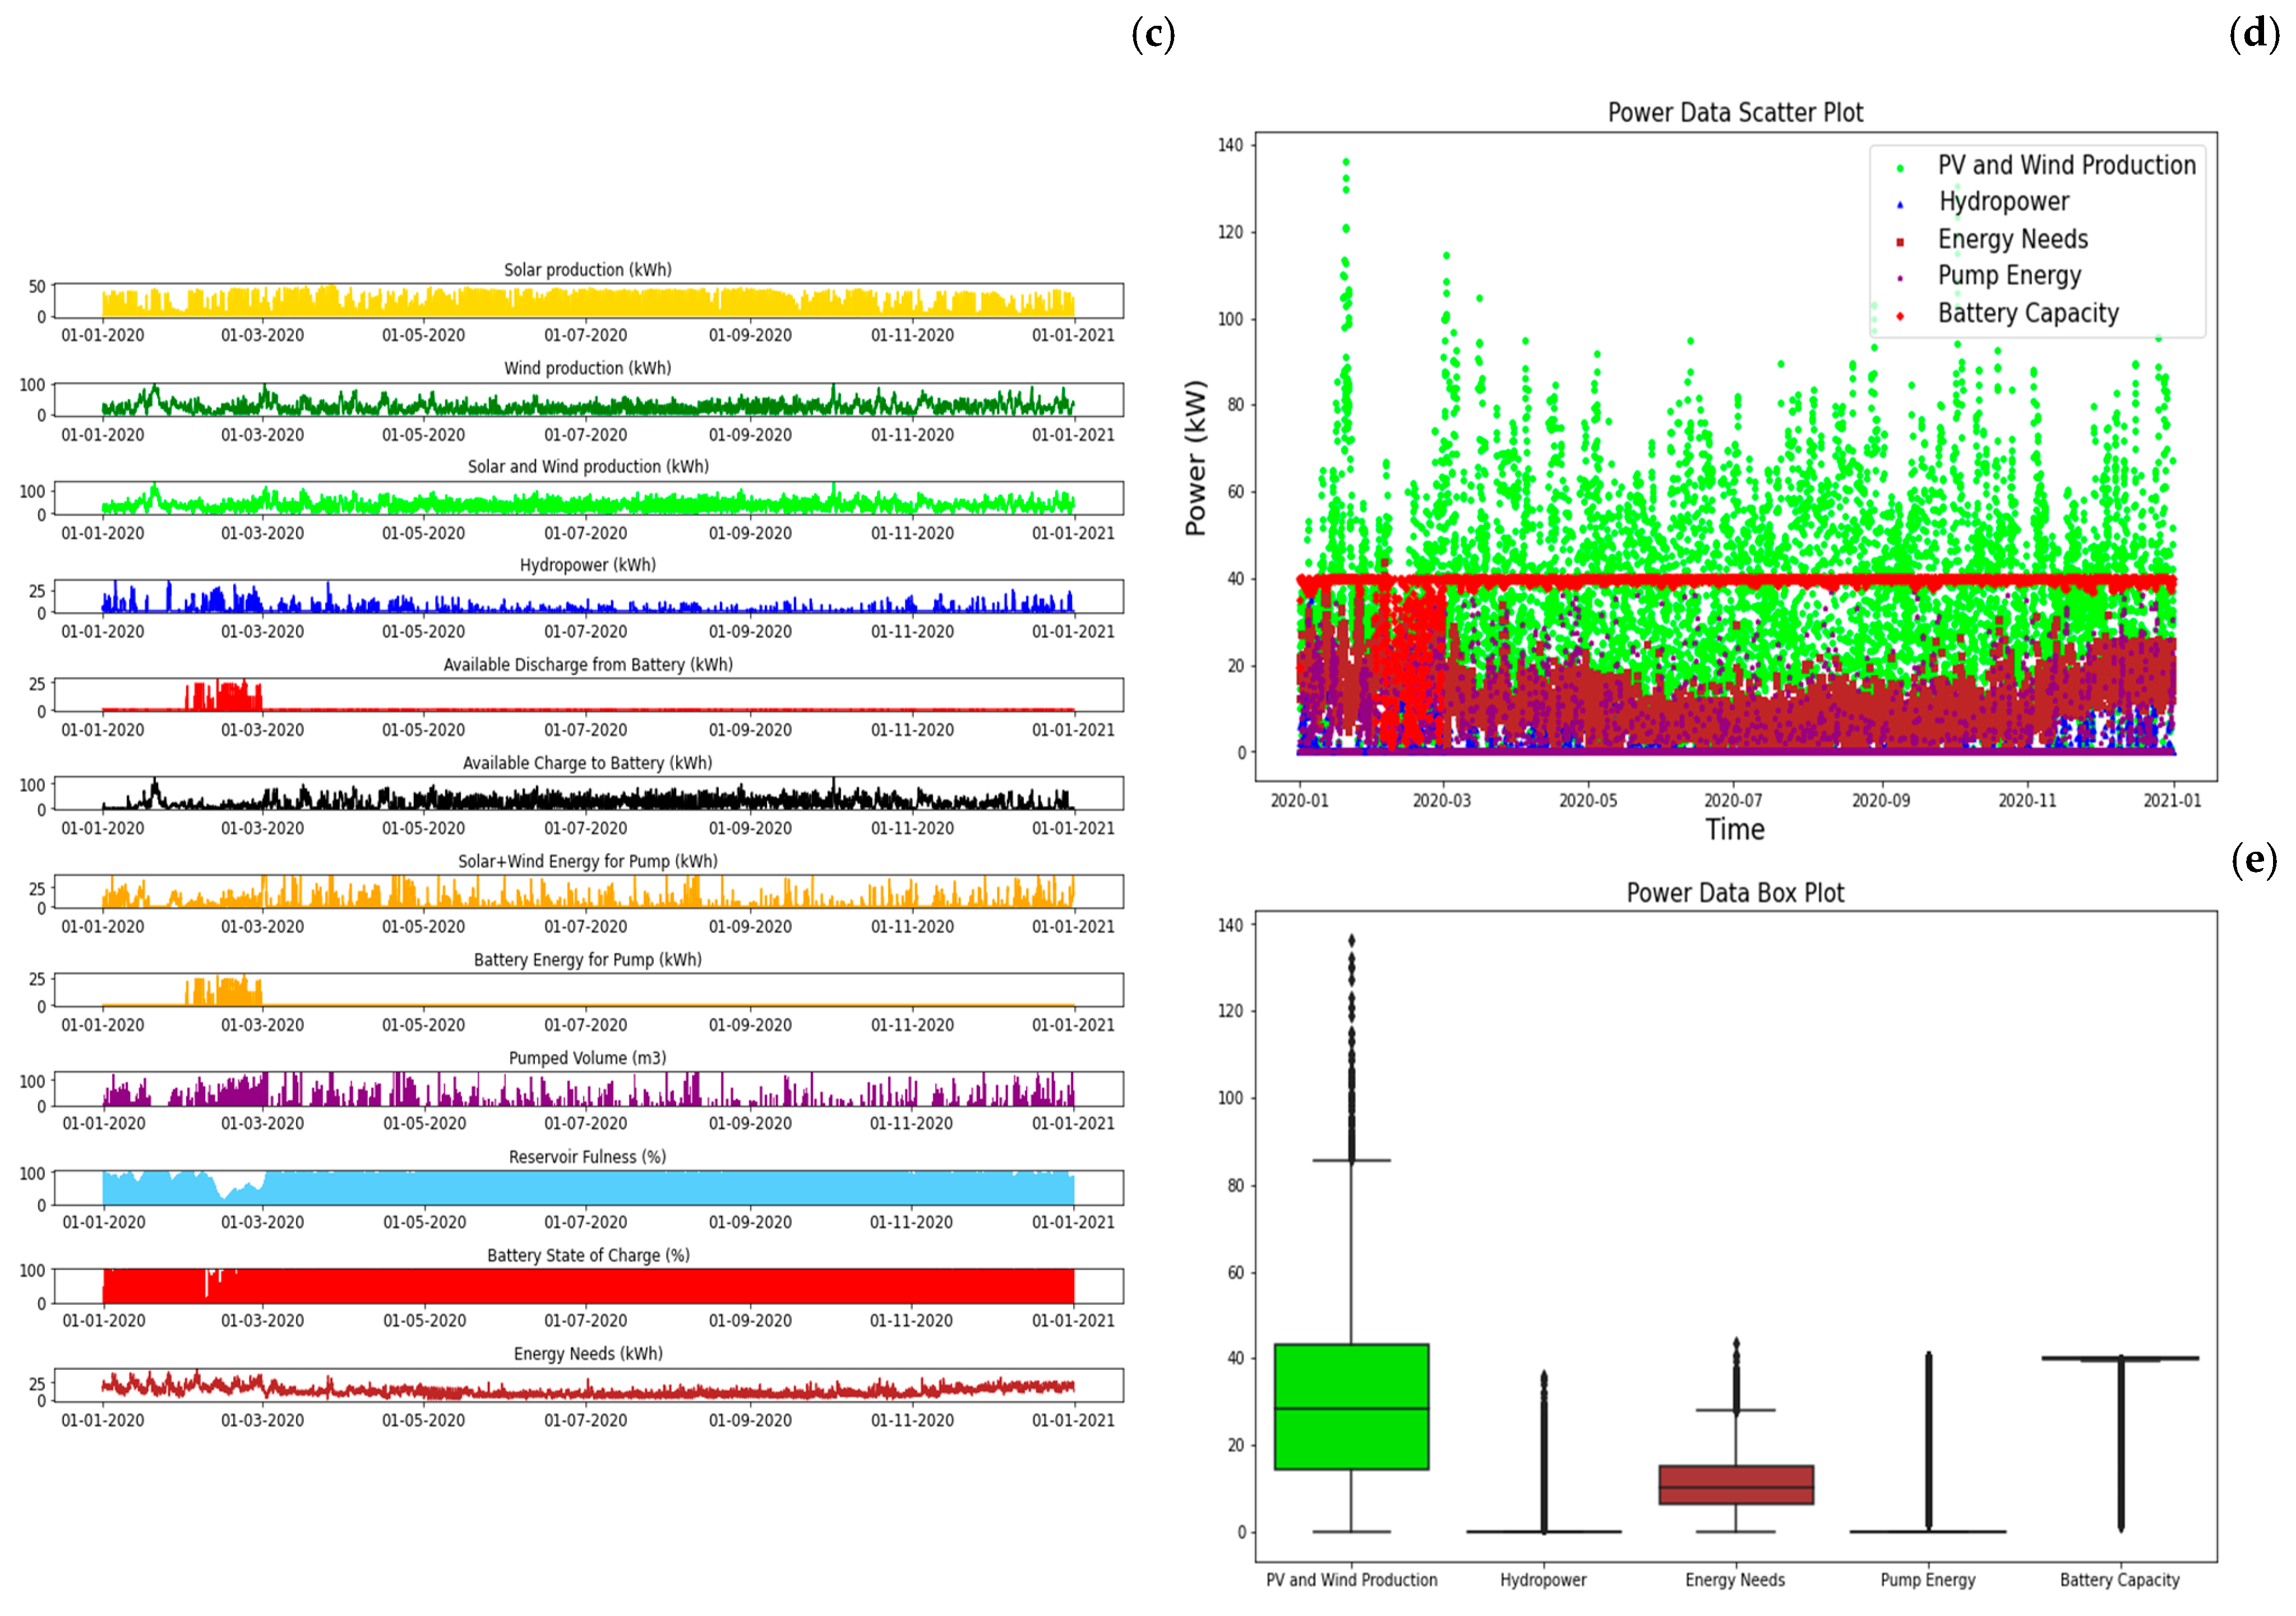
Figure 11 shows the annual balance with the integration of a battery energy storage system (BESS). The incorporation of the BESS into the stand-alone setup resulted in a slight decrease in the solar and wind energy sources. However, the total power installation increased, due to an increase in pump power resulting from the optimization preference for installing more solar energy. The surplus energy generated from solar sources exceeds that from wind sources. Consequently, a higher pump nominal power is required to enable its usage in the pumped-storage process, as the solar surplus is characterized by higher peaks than wind surplus due to their distinct generation patterns. The BESS plays a relatively inferior role in the SA2 solution. Even if its storage capacity was to increase to a hypothetical 1 MWh, the power installation of the other energy sources would not undergo a notable reduction.

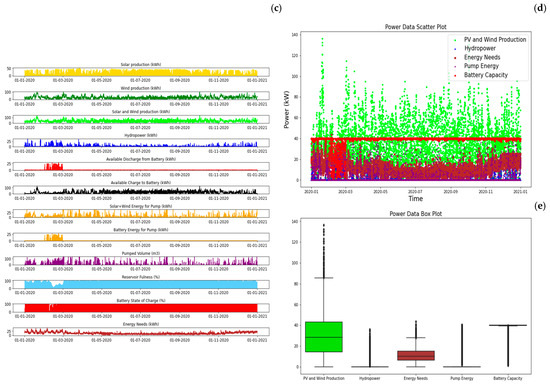
Figure 11.
SA2—PV + Wind + PSH + BESS yearly balance: (a) energy balance, (b) water balance, (c) energy by sources, (d) power data, and (e) statistics (between percentile 25 and 75%).
During the winter months, maximum loads occur over consecutive hours on various days, which presents a challenge for the performance of an electric battery under the power ranges of the presented small energy solution. Figure 12 shows the battery state of charge variation along the analyzed year and the solar + wind generation profile for three different days of the year.

Figure 12.
SA2—PV + Wind + PSH + BESS: (a) battery state of charge, (b) solar and wind generation profile for three days of an average year.
3.2.3. GC1—PV + PSH + Grid
The initial grid-connected configuration, GC1, integrates solar energy with pumped hydropower storage. The optimized results yielded a required photovoltaic peak power of 95 kW, with nominal pump and turbine powers of 65 and 40 kW, respectively.
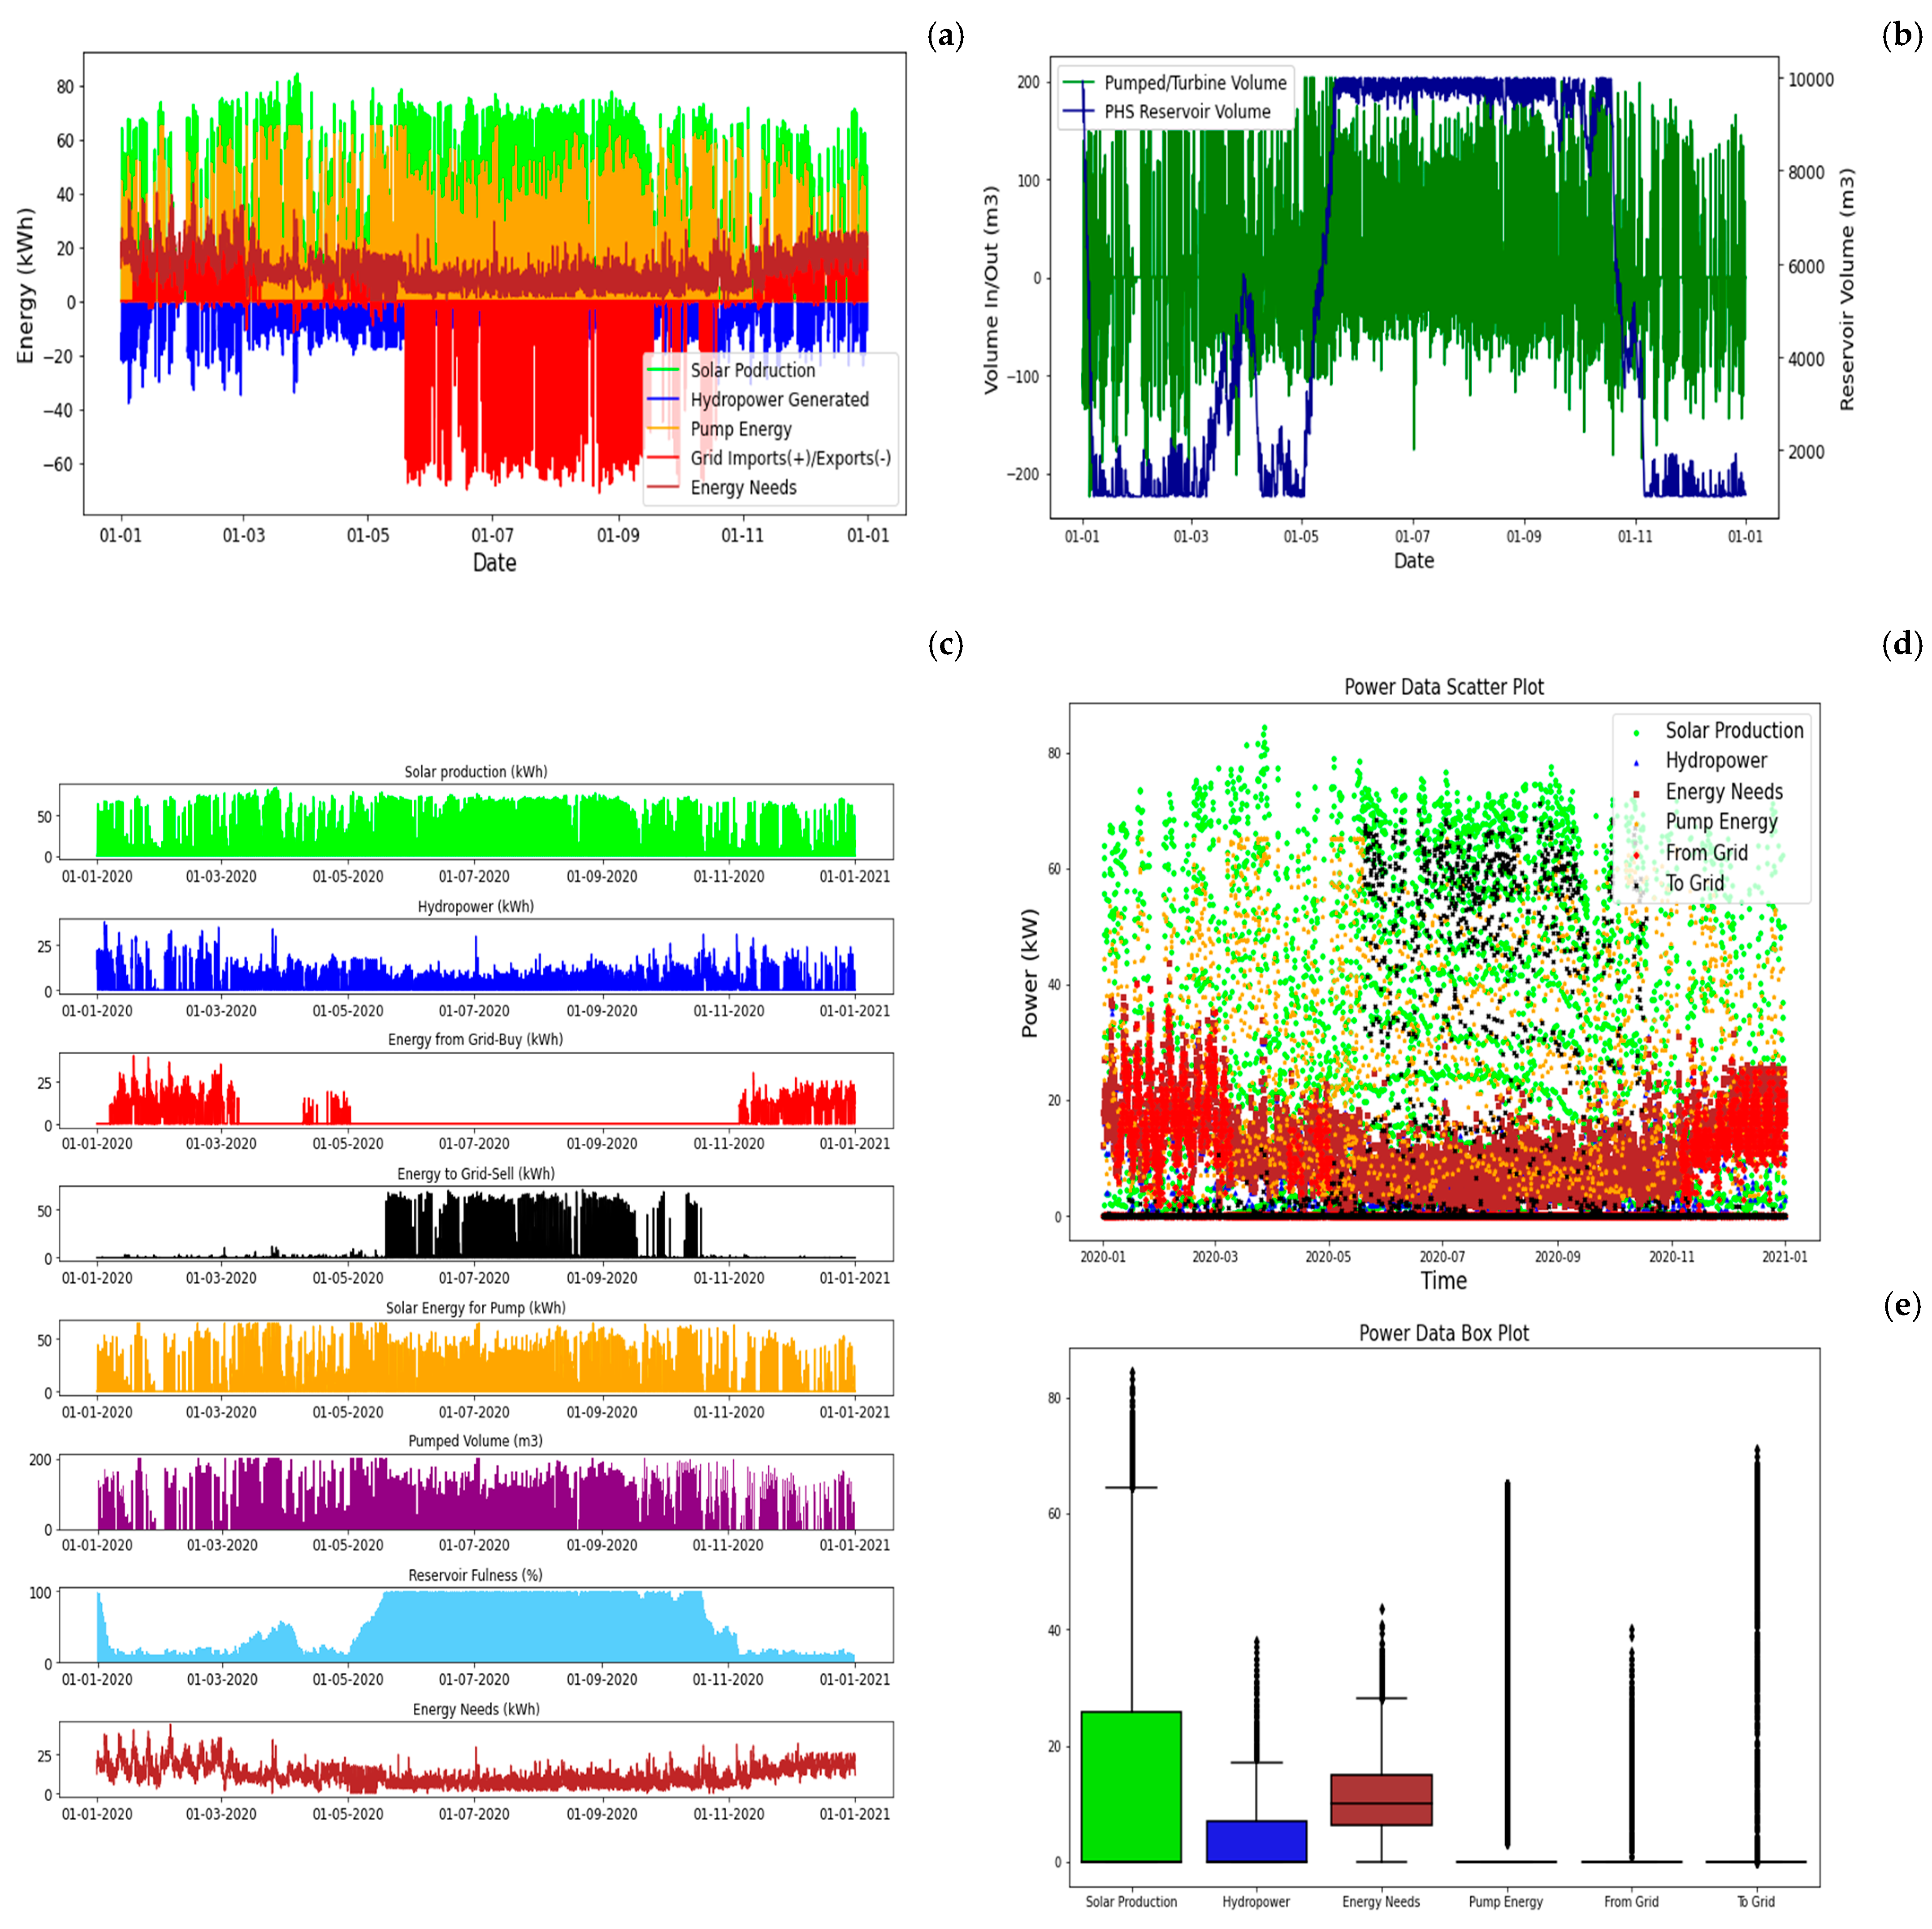
The installed power thus satisfies both criteria for the system to be considered a valid small community solution for this case study. If this configuration was entirely independent of the external grid, it would necessitate 330 kW of PV and 180 kW of pump power, thereby increasing the initial investment by more than double. Figure 13 illustrates the annual balance of the grid-connected solar power solution with PSH.
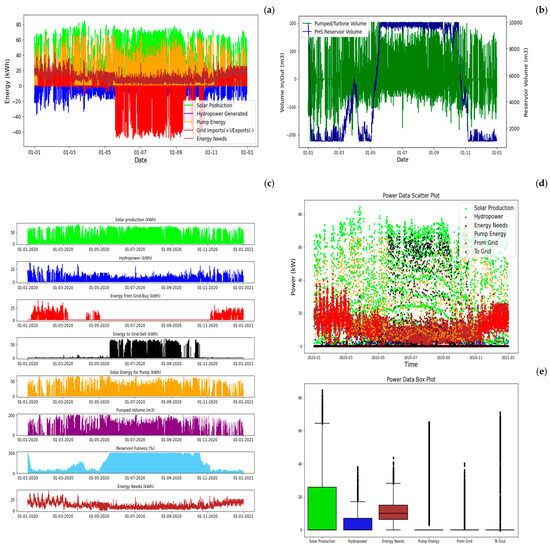
Figure 13.
GC1—PV + PSH + Grid yearly balance: (a) energy balance, (b) water balance, (c) energy by sources, (d) power data, and (e) statistics (between percentile 25 and 75%).
Compared to the stand-alone configurations, the grid-connected setup with solar power is more suitable for meeting the total load demand, with a total solar energy production of 134 MWh for an annual energy consumption of 97 MWh. In the stand-alone setup, both configurations demonstrated a primary renewable energy production level that was approximately three times greater than the demand. The import of grid energy is permitted solely during the peak winter months.
3.2.4. GC2—Wind+ PSH + Grid
The second configuration for a grid-connected solution, GC2, involves wind energy with pumped-storage hydropower instead of the solar energy in the previous solution (GC1). The optimization yielded a requisite wind power installation of 65 kW, with nominal pump and turbine powers of 20 and 40 kW, respectively.
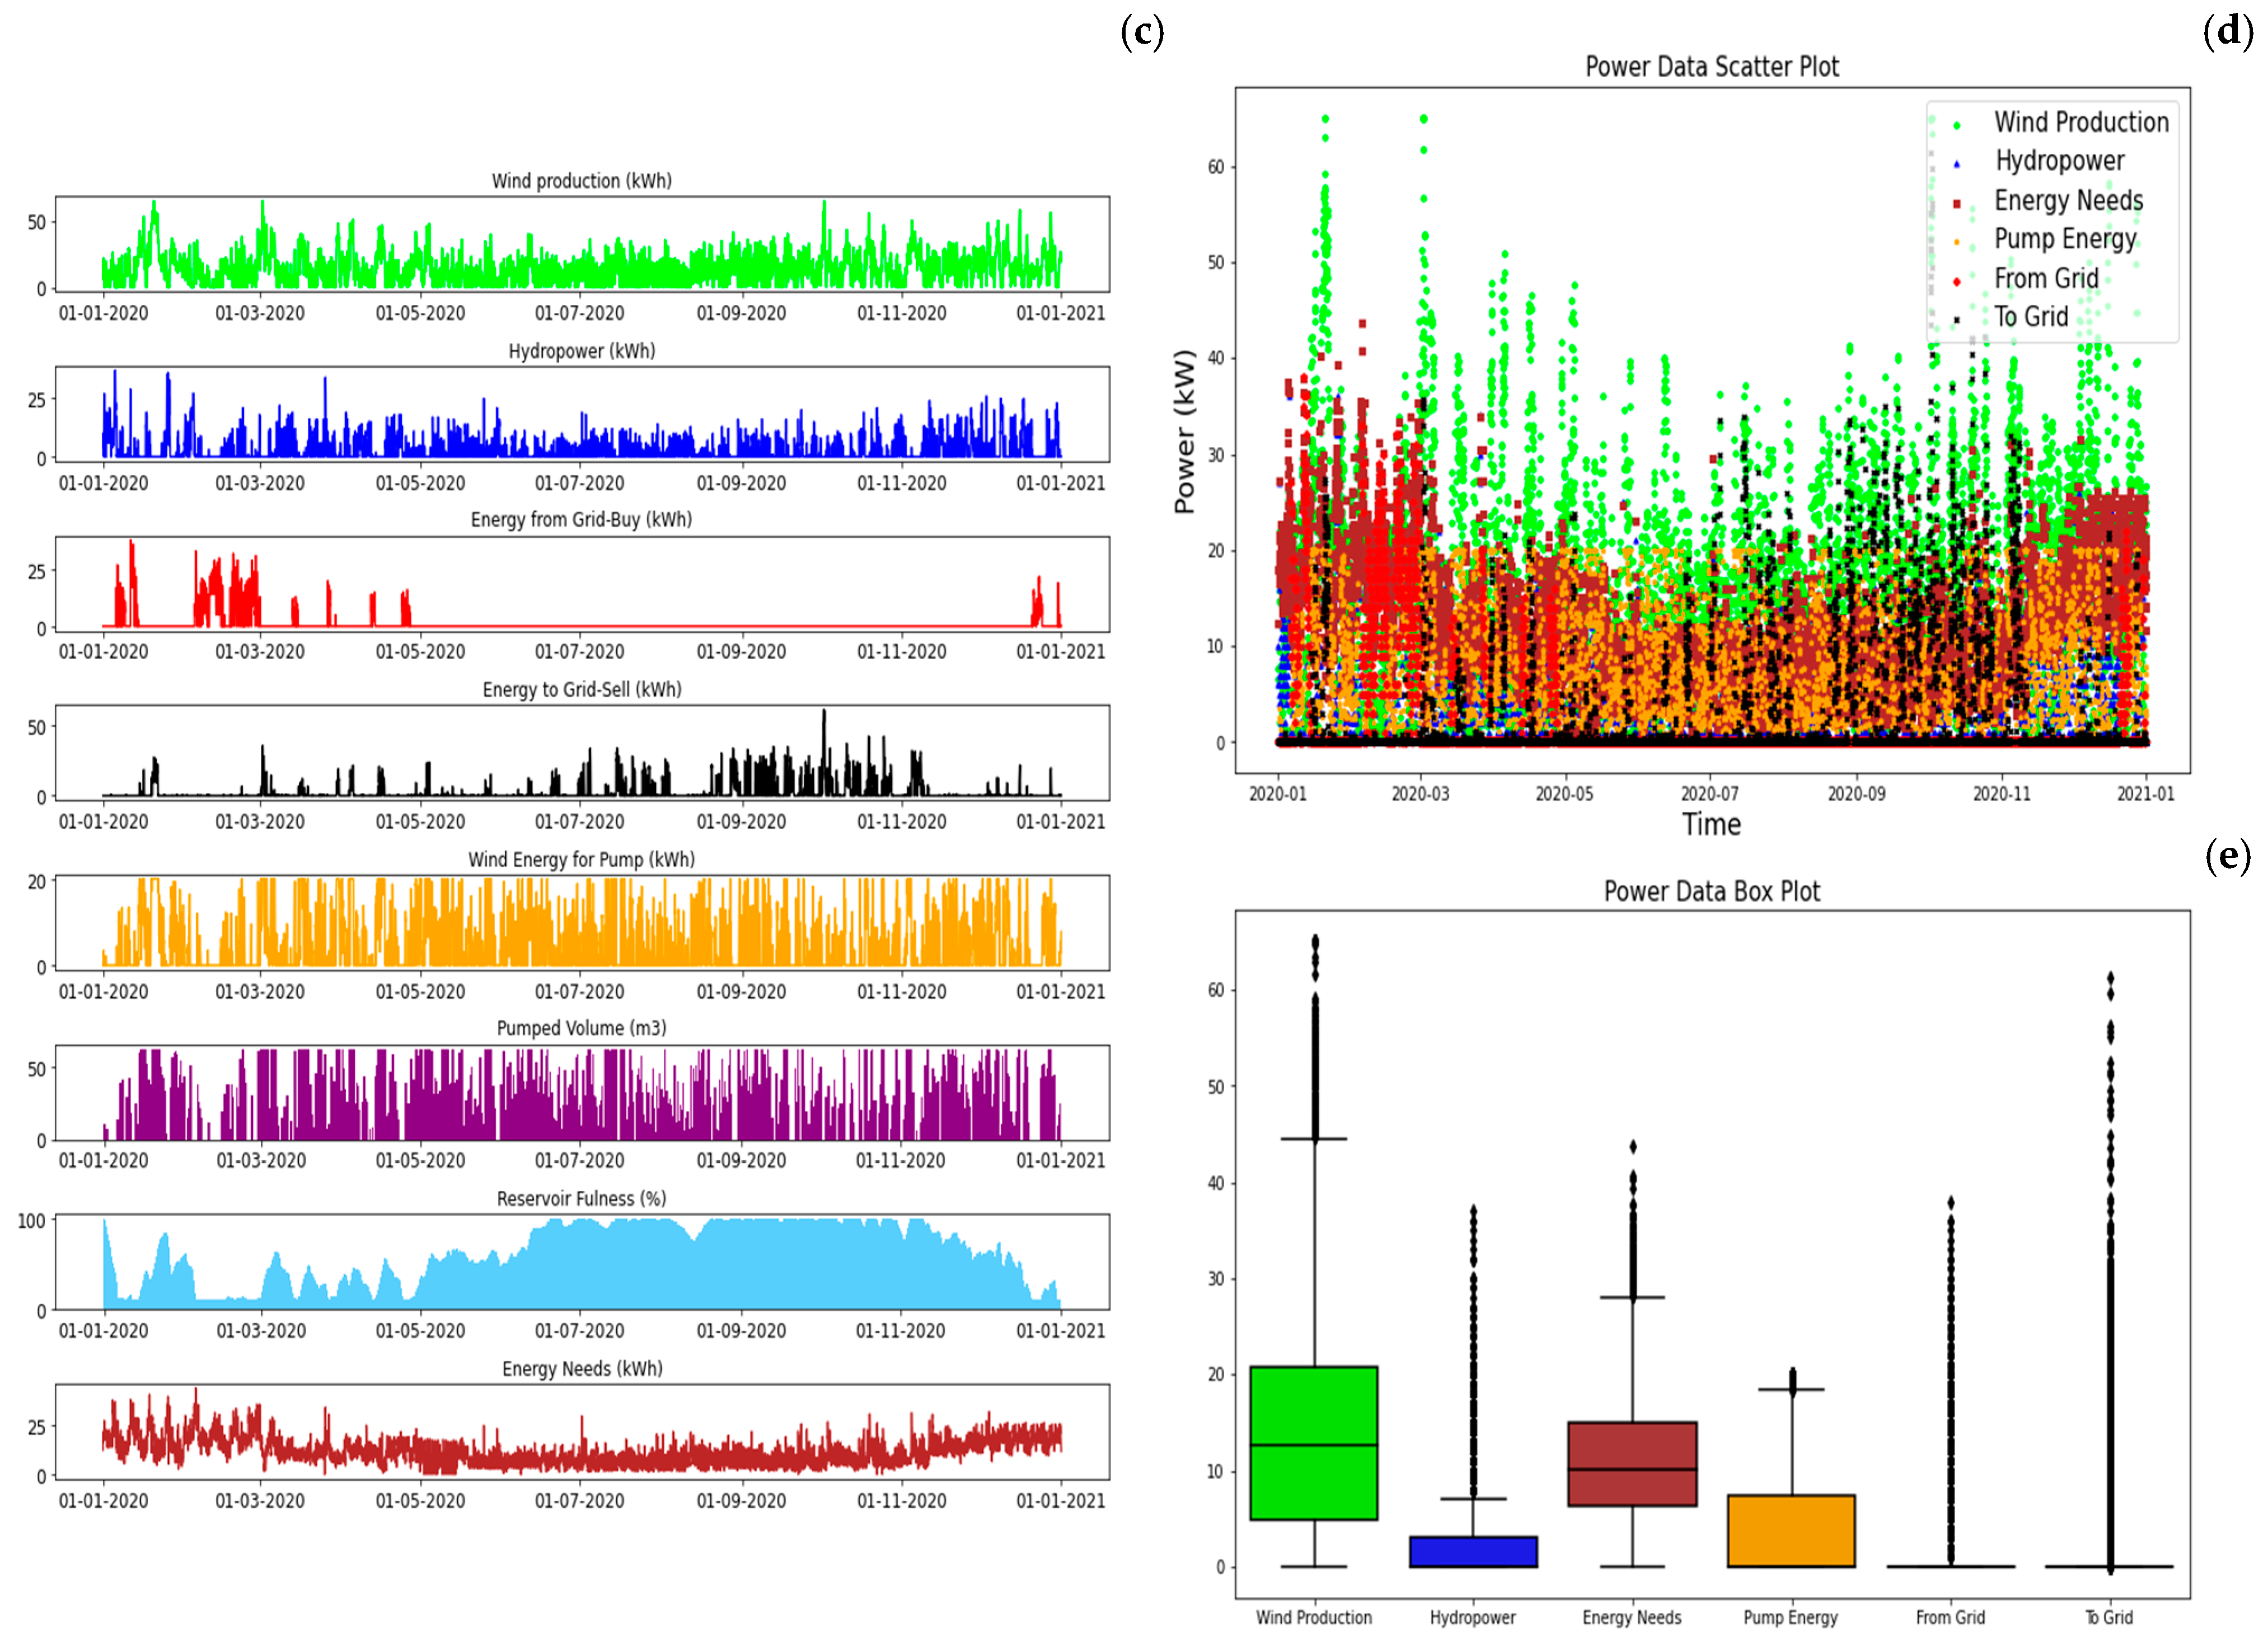
The obtained installed power demonstrates a grid independence of 91.7% with a positive grid balance wherein exports are twice the imported energy required. To be fully independent from the grid, it would require a wind power installation of 205 kW and a pump power of 65 kW, representing a doubling of the initial investment. Figure 14 illustrates the yearly energy and water balance for the second grid-connected configuration, constituted by wind energy and pumped hydropower storage. This microgrid solution is the optimal choice regarding installed power versus energy needs. The annual wind energy production is 123 MWh, with a grid energy requirement of only 9.5 MWh to satisfy the load demand.

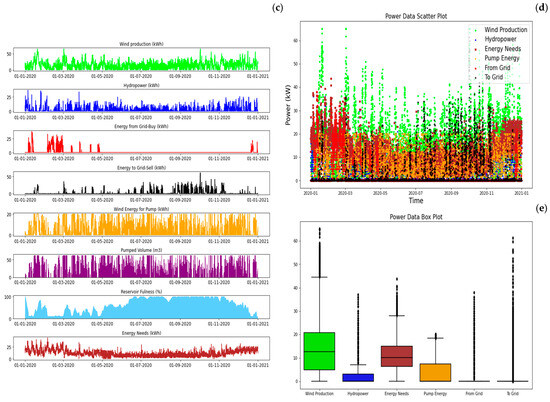
Figure 14.
GC2—Wind + PSH + Grid yearly balance: (a) energy balance, (b) water balance, (c)energy by sources, (d) power data, and (e) statistics (between percentile 25 and 75%).
3.3. Economic and Environmental Assessment
Under the economic parameters outlined in Table 2, the required initial investment and the annual operation and maintenance costs are summarized accordingly. For the grid-connected system, the costs related to grid installation and synchronization with the national grid’s frequency are not applicable, as the site currently operates as a fully grid-dependent system. The grid-connected configurations, referred to as GC1 and GC2, exhibit a stable annual cash flow, determined by the net difference between energy sales to the grid and purchases from it.

Table 2.
Energy community: initial investment and O&M costs.
The annual cash flows for GC1 and GC2 are −2956.3 and −123,2 €, respectively. These values are contingent upon the assigned grid tariffs, which were simplified for this case study. It is important to note that the import of grid energy entails the consideration of taxes associated with carbon dioxide emissions. The CO2 costs for GC1 and GC2 are 1012.6 and 367.2 €, respectively. The final net present value of each microgrid solution is presented in Table 2, alongside the levelized cost of energy (LCOE). The grid-connected solution of wind and pumped hydro storage presents the lowest net present value (NPV) and required power installed, 125 kW, wherein 105 kW corresponds to energy generation sources, such as wind and hydropower.
Concerning the selected site for the examination of a small energy community, the grid-connected solution, designated as GC2, remains a viable option and the most economical. Since the site is not located on an island or in an extremely remote area and it benefits from an existing electric grid infrastructure, this solution is particularly well suited to the configuration of a small energy system. In scenarios where integration with the general grid is not possible, alternative stand-alone configurations must be considered. If that restriction was imposed, then the first stand-alone solution (SA1) would be the most appropriate. The stand-alone solution with the battery auxiliary (SA2) possesses the highest NPV, whilst the integration of a BESS does not have a significant impact on the performance and flexibility of the system. It still requires a superior overall installed power, increasing initial investment and O&M costs, as can be seen in Table 2. The integration of pumped hydropower storage in this study proved advantageous in reducing grid dependency and the required installed power of primary energy sources, contributing to an energy storage capacity of 2.17 MWh. This storage potential can ensure hourly maximum loads for two days.
4. Conclusions
Hybrid energy systems are flexible but complex due to the need to manage multiple energy sources, demands, and constraints. Smart optimization of these systems requires several iterations and restatements to achieve the most efficient configuration for each scenario. In this particular study, the Generalized Reduced Gradient (GRG) was used, but other methods, such as evolutionary algorithms and multi-objective algorithms, such as the NSGA-II, could also be employed to find global solutions. The newly presented model integrates solar, wind, hydropower, and grid electricity to meet energy demands through the following steps: (i) Solar/Wind Energy: Hourly energy production data is analyzed to determine if it can meet all energy demands or if there is surplus energy. (ii) Energy Demand: Unmet energy needs are supplemented by hydropower or grid electricity. (iii) Pumped-storage Hydropower (PSH): Surplus renewable energy is to pump water to store potential energy. (iv) Reservoir Management: Ensures proper volume levels in the reservoir for efficient operation, considering the maximum and minimum previously defined. (v) Water Demand: Must be met fully from the reservoir, maintaining 100% reliability. (vi) Grid Energy: Utilized for buying or selling energy depending on supply and demand, with tariffs affecting profitability. (vii) Off-Grid Solutions: Batteries store excess and supply energy during deficits, ensuring continuous operation without grid reliance.
This research work fulfilled the objective of developing advanced smart optimization models in hybridization of the water sector by the definition and design of a mathematical algorithm.
The decision variables imposed in this model are the hydropower, grid, and solar factors, each constrained between 0 and 1, for which water-energy needs are fully met. The defined objective function, used equally for each scenario, aims to minimize the total installed power capacity of the system, corresponding to the sum of primary renewable sources, pump and hydropower, and battery capacity, if present.
A small community in the north of Portugal, Marruge, was selected as the site for the model implementation as a smart hybrid energy solution. As a model deployment, it was utilized to analyze a microgrid of a small energy community entirely isolated from the national electric grid (i.e., stand-alone) or grid connected.
Four solutions were analyzed, two stand-alone and two grid-connected, integrating various renewable sources and storage methods. The stand-alone configuration uses solar and wind energy with pumped-storage hydropower (PSH) for energy storage and production, while also considering battery storage: SA1 (PV + Wind + PSH) and SA2 (PV + Wind + PSH + BESS). SA1 uses solar and wind energy combined with pumped-storage hydropower (PHS) to ensure 100% independence from the grid, resulting in 220 kW of installed power distributed across PV, wind turbines, pumps, and turbines. The optimized system generates excess energy to meet peak demand during winter, ensuring sufficient capacity despite periods of lower demand. The second stand-alone solution, SA2, incorporates a battery energy storage system (BESS) to assess its impact on reducing the required power installations of other energy sources. The optimized power distribution includes 55 kW in PV, 100 kW in wind, 35 kW in pumps, 40 kW in turbines, and 40 kW in batteries, totaling 270 kW. While BESS slightly decreases solar and wind installations, the total power increases due to higher pump power needs for using excess solar energy. The BESS has a limited impact, even with a hypothetical increase to 1 MWh storage capacity.
On the other hand, the grid-connected setup combines solar or wind with PHS, aiming for at least 80% yearly grid independence and a positive grid balance: GC1 (PV + PSH + Grid) and GC2 (Wind + PSH + Grid). The GC1 configuration requires 95 kW of PV, 65 kW of pump, and 40 kW of turbine power to meet the criteria. Achieving full independence would require significantly higher PV and pump capacities, doubling the initial investment. The grid-connected setup with solar power (GC1) is more efficient in meeting the total load demand compared to stand-alone configurations, producing 134 MWh for an annual consumption of 97 MWh, while grid energy imports are limited to peak winter months. The second grid-connected configuration (GC2) requires 65 kW of wind power and achieves 91.7% grid independence with energy exports twice the imports. Full independence would require a significant increase in wind and pump power, doubling the initial investment. GC2 is optimal for balancing installed power with energy needs, producing 123 MWh annually with only 9.5 MWh of grid energy required.
The economic analysis reveals that the grid-connected configurations, GC1 and GC2, offer stable cash flows of −€2956.3 and −€123.2 annually, respectively, with GC2 being more economical. The CO2 costs for GC1 and GC2 are €1012.6 and €367.2, respectively. GC2, which integrates wind energy and pumped hydropower storage, has the lowest NPV and installed power requirement of 125 kW, making it the most suitable for sites with existing grid infrastructure. If grid integration is not feasible, the stand-alone solution SA1 would be preferred. The integration of pumped hydropower storage enhances energy independence and offers a storage capacity of 2.17 MWh, supporting peak loads for up to two days. GC presented lower initial investment (between 157 to 205 k€), while SA had lower LCOE (between 0.039 and 0.044 €/kWh).
Author Contributions
Conceptualization, J.S.T.C. and H.M.R.; methodology, J.S.T.C. and H.M.R.; software and calculus, J.S.T.C.; writing—original draft preparation, J.S.T.C., H.M.R. and M.P.-S.; review, J.S.T.C., H.M.R., M.P.-S., O.E.C.-H. and F.-J.S.-R.; supervision, H.M.R., A.M. and M.P.-S.; editing and final preparation, all authors. All authors have read and agreed to the published version of the manuscript.
Funding
This work was supported by FCT, to UIDB/04625/2020 CERIS, in the Hydraulic Laboratory, for experiments on pumped storage performance, and the project HY4RES (Hybrid Solutions for Renewable Energy Systems) EAPA_0001/2022 from INTERREG ATLANTIC AREA PROGRAMME. This research was carried out during Modesto Pérez-Sánchez’s stay at the CERIS-IST research center, called “INCORPORATION OF NEW WATER RESOURCES IN IRRIGATION SYSTEMS THROUGH THE USE OF SUSTAINABLE TECHNOLOGIES AND COMPUTATIONAL TOOLS TO MITIGATE WATER SCARCITY”.
Institutional Review Board Statement
Not applicable.
Informed Consent Statement
Not applicable.
Data Availability Statement
The original contributions presented in the study are included in the article, further inquiries can be directed to the corresponding author.
Acknowledgments
The authors are grateful for the project HY4RES (Hybrid Solutions for Renewable Energy Systems) EAPA_0001/2022 from INTERREG ATLANTIC AREA PROGRAMME 2021-2027, as well as the Foundation for Science and Technology’s support to UIDB/04625/2020, the research unit CERIS.
Conflicts of Interest
The authors declare no conflicts of interest.
Nomenclature
| Acronyms | |
| AC | Alternate current |
| BESS | Battery energy storage system |
| CO2 | Carbon dioxide |
| DC | Direct current |
| EU | European Union |
| GA | Genetic Algorithm |
| GC | Grid-connected |
| GRG | Generalized Reduced Gradient |
| HES | Hybrid energy system |
| HRES | Hybrid renewable energy system |
| LCOE | Levelized cost of energy |
| MG | Microgrid |
| NPV | Net present value |
| O&M | Operation and maintenance |
| PHS | Pumped-hydropower storage |
| PV | Photovoltaic |
| SA | Stand-alone |
| Variables | |
| Ai | Water consumption [m3] |
| Bci | Battery charge [kWh] |
| Bdi | Battery discharge [kWh] |
| Bei | Battery discharge for energy needs [kWh] |
| Bi | Battery capacity [kWh] |
| Bi−1 | Previous battery capacity [kWh] |
| Bmax | Maximum battery capacity [kWh] |
| Bpi | Battery discharge for pump [kWh] |
| E+i | Energy surplus [kWh] |
| Cinv_PV | Photovoltaic initial investment [€/kW] |
| Cinv_Inv | Inverter initial investment [€/kW] |
| Cinv_WT | Wind turbine initial investment [€/kW] |
| Cinv_Hydro | Hydro turbine initial investment [€/kW] |
| Cinv_Pump | Pump initial investment [€/kW] |
| Cinv_BESS | Battery initial investment [€/kW] |
| ECCO2 | Annual emissions cost tax [€] |
| Eci | Energy consumption [kWh] |
| E-i | Energy deficit [kWh] |
| Hi | Feasible hydropower [kWh] |
| Hneedi | Required hydropower [kWh] |
| Hp | Average pump head [m] |
| Ht | Average turbine head [m] |
| i | timestamp [seconds, hours, days, months] |
| k | annual period (i.e., number of hours) |
| n | year(s) |
| O&M_PV | Photovoltaic O&M [€/kW/year] |
| O&M_Inv | Inverter O&M [€/kW/year] |
| O&M_WT | Wind turbine O&M [€/kW/year] |
| O&M_Hydro | Hydro turbine O&M [€/kW/year] |
| O&M_Pump | Pump O&M [€/kW/year] |
| O&M_BESS | Battery O&M [€/kW/year] |
| PA/Bi | Available alternative for pump [kWh] |
| PF−A/Bi (PGi) | Feasible alternative for pump [kWh] |
| PF−Si | Feasible renewable for pump [kWh] |
| Pi | Feasible energy for pump [kWh] |
| PN | Pump nominal power [kW] |
| PSi | Available renewable for pump [kWh] |
| r | discount rate [%] |
| Ri | Grid revenue [€] |
| Si | Solar energy [kWh] |
| SS+Wi | Renewable surplus [kWh] |
| SSi | Solar surplus [kWh] |
| TBi | Grid buy tariffs [€/kWh] |
| TSi | Grid sell tariffs [€/kWh] |
| Vmax | Maximum reservoir volume [m3] |
| Vmin | Minimum reservoir volume [m3] |
| Vpi | Pumped volume [m3] |
| VR0 | Initial reservoir volume [m3] |
| VRi | Reservoir volume [m3] |
| VRi−1 | Previous reservoir volume [m3] |
| Vti | Turbine volume [m3] |
| Wi | Wind energy [kWh] |
| α | Hydropower factor |
| β | Renewable factor |
| γ | Alternative factor |
| ηp | Average pump efficiency [%] |
| ηt | Average turbine efficiency [%] |
References
- Di Prima, S.; Fernandes, G.; Burguet, M.; Ribeiro Roder, L.; Giannini, V.; Giadrossich, F.; Lassabatere, L.; Comegna, A. Assessing Soil Physical Quality in a Layered Agricultural Soil: A Comprehensive Approach Using Infiltration Experiments and Time-Lapse Ground-Penetrating Radar Surveys. Appl. Sci. 2024, 14, 9268. [Google Scholar] [CrossRef]
- Rosińska, W.; Jurasz, J.; Przestrzelska, K.; Wartalska, K.; Kaźmierczak, B. Climate change’s ripple effect on water supply systems and the water-energy nexus—A review. Water Resour. Ind. 2024, 32, 100266. [Google Scholar] [CrossRef]
- Wei, Y.; Zhong, F.; Song, X.; Huang, C. Exploring the impact of poverty on the sustainable development goals: Inhibiting synergies and magnifying trade-offs. Sustain. Cities Soc. 2023, 89, 104367. [Google Scholar] [CrossRef]
- Huerta-Vergara, A.R.; Escolero, O. The role of citizen participation in advancing sustainable water solutions: The Mexico City case study. Sustain. Cities Soc. 2024, 101, 105104. [Google Scholar] [CrossRef]
- Magini, R.; Moretti, M.; Boniforti, M.A.; Guercio, R. A Machine-Learning Approach for Monitoring Water Distribution Networks (WDNs). Sustainability 2023, 15, 2981. [Google Scholar] [CrossRef]
- Suresh, A.; Kishorekumar, R.; Kumar, M.S.; Elaiyaraja, K. Assessing transmission excellence and flow detection based on Machine Learning. Opt. Quantum Electron. 2022, 54, 500. [Google Scholar] [CrossRef]
- Ávila, C.A.M.; Sánchez-Romero, F.J.; López-Jiménez, P.A.; Pérez-Sánchez, M. Improve leakage management to reach sustainable water supply networks through by green energy systems. Optimized case study. Sustain. Cities Soc. 2022, 83, 103994. [Google Scholar] [CrossRef]
- Bermúdez, J.-R.; López-Estrada, F.-R.; Besançon, G.; Valencia-Palomo, G.; Santos-Ruiz, I. Predictive Control in Water Distribution Systems for Leak Reduction and Pressure Management via a Pressure Reducing Valve. Processes 2022, 10, 1355. [Google Scholar] [CrossRef]
- Anjum, R.; Parvin, F.; Ali, S.A. Machine Learning Applications in Sustainable Water Resource Management: A Systematic Review. In Emerging Technologies for Water Supply, Conservation and Management; Part F1186; Springer: Berlin/Heidelberg, Germany, 2023; pp. 29–47. [Google Scholar] [CrossRef]
- Oğuz, A.; Ertuğrul, Ö.F. A survey on applications of machine learning algorithms in water quality assessment and water supply and management. Water Supply 2023, 23, 895–922. [Google Scholar] [CrossRef]
- Joseph, K.; Sharma, A.K.; van Staden, R.; Wasantha, P.L.P.; Cotton, J.; Small, S. Application of Software and Hardware-Based Technologies in Leaks and Burst Detection in Water Pipe Networks: A Literature Review. Water 2023, 15, 2046. [Google Scholar] [CrossRef]
- Fu, G.; Jin, Y.; Sun, S.; Yuan, Z.; Butler, D. The role of deep learning in urban water management: A critical review. Water Res. 2022, 223, 118973. [Google Scholar] [CrossRef] [PubMed]
- Wang, S.; Taha, A.F.; Abokifa, A.A. How Effective is Model Predictive Control in Real-Time Water Quality Regulation? State-Space Modeling and Scalable Control. Water Resour. Res. 2021, 57, e2020WR027771. [Google Scholar] [CrossRef]
- Wu, Z.Y.; Chew, A.; Meng, X.; Cai, J.; Pok, J.; Kalfarisi, R.; Lai, K.C.; Hew, S.F.; Wong, J.J. High Fidelity Digital Twin-Based Anomaly Detection and Localization for Smart Water Grid Operation Management. Sustain. Cities Soc. 2023, 91, 104446. [Google Scholar] [CrossRef]
- Manny, L. Socio-technical challenges towards data-driven and integrated urban water management: A socio-technical network approach. Sustain. Cities Soc. 2022, 90, 104360. [Google Scholar] [CrossRef]
- Zhan, C.; Tian, M.; Liu, Y.; Zhou, J.; Yi, X. A novel greedy adaptive ant colony algorithm for shortest path of irrigation groups. Math. Biosci. Eng. 2022, 19, 9018–9038. [Google Scholar] [CrossRef]
- Nishanth, J.R.; Kushwaha, K.K.; Deshmukh, M.A.; Balaji, S.; Kushwah, R.; Sampath, B. Particle Swarm Optimization of Hybrid Renewable Energy Systems. In Intelligent Engineering Applications and Applied Sciences for Sustainability; IGI Global: Hershey, PA, USA, 2023; pp. 291–308. [Google Scholar] [CrossRef]
- Fossati, J.P.; Galarza, A.; Martín-Villate, A.; Echeverría, J.M.; Fontán, L. Optimal scheduling of a microgrid with a fuzzy logic controlled storage system. Int. J. Electr. Power Energy Syst. 2015, 68, 61–70. [Google Scholar] [CrossRef]
- Najarzadegan, M.R.; Moeini, R. Optimal Design of Water Distribution Network Using Improved Artificial Bee Colony Algorithm. Iran. J. Sci. Technol.-Trans. Civ. Eng. 2023, 47, 3123–3136. [Google Scholar] [CrossRef]
- Liu, J.; Wang, A.; Qu, Y.; Wang, W. Coordinated Operation of Multi-Integrated Energy System Based on Linear Weighted Sum and Grasshopper Optimization Algorithm. IEEE Access 2018, 6, 42186–42195. [Google Scholar] [CrossRef]
- Hu, K.; Jiang, H.; Ji, C.G.; Pan, Z. A modified butterfly optimization algorithm: An adaptive algorithm for global optimization and the support vector machine. Expert Syst. 2021, 38, e12642. [Google Scholar] [CrossRef]
- Singh, R.K.; Gangwar, S.; Singh, D.K.; Pathak, V.K. A novel hybridization of artificial neural network and moth-flame optimization (ANN–MFO) for multi-objective optimization in magnetic abrasive finishing of aluminium 6060. J. Braz. Soc. Mech. Sci. Eng. 2019, 41, 270. [Google Scholar] [CrossRef]
- Wang, D.; Chen, H.; Ma, Z.; Yi, B. Optimization scheduling for multi-source water distribution systems in mountainous region based on seagull optimization algorithm. Mod. Phys. Lett. B 2024. [Google Scholar] [CrossRef]
- Afzali Ahmadabadi, S.; Jafari-Asl, J.; Banifakhr, E.; Houssein, E.H.; Ben Seghier, M.E.A. Risk-Based Design Optimization of Contamination Detection Sensors in Water Distribution Systems: Application of an Improved Whale Optimization Algorithm. Water 2023, 15, 2217. [Google Scholar] [CrossRef]
- Elseify, M.A.; Hashim, F.A.; Hussien, A.G.; Kamel, S. Single and multi-objectives based on an improved golden jackal optimization algorithm for simultaneous integration of multiple capacitors and multi-type DGs in distribution systems. Appl. Energy 2024, 353, 122054. [Google Scholar] [CrossRef]
- Singh, G.; Leung, W.; Wheeler, M.F. Multiscale methods for model order reduction of non-linear multiphase flow problems. Comput. Geosci. 2019, 23, 305–323. [Google Scholar] [CrossRef]
- Wang, Y.; Zhang, Y.; Wang, W.; Liu, Z.; Yu, X.; Li, H.; Wang, W.; Hu, X. A Review of Optimal Design for Large-Scale Micro-Irrigation Pipe Network Systems. Agronomy 2023, 13, 2966. [Google Scholar] [CrossRef]
- Ramos, H.M.; Vargas, B.; Saldanha, J.R. New Integrated Energy Solution Idealization: Hybrid for Renewable Energy Network (Hy4REN). Energies 2022, 15, 3921. [Google Scholar] [CrossRef]
- Sayed, E.T.; Olabi, A.G.; Elsaid, K.; Al Radi, M.; Semeraro, C.; Doranehgard, M.H.; Eltayeb, M.E.; Abdelkareem, M.A. Application of artificial intelligence techniques for modeling, optimizing, and controlling desalination systems powered by renewable energy resources. J. Clean. Prod. 2023, 413, 137486. [Google Scholar] [CrossRef]
- Khan, T.; Yu, M.; Waseem, M. Review on recent optimization strategies for hybrid renewable energy system with hydrogen technologies: State of the art, trends and future directions. Int. J. Hydrogen Energy 2022, 47, 25155–25201. [Google Scholar] [CrossRef]
- Mokhtara, C.; Negrou, B.; Settou, N.; Bouferrouk, A.; Yao, Y. Optimal design of grid-connected rooftop PV systems: An overview and a new approach with application to educational buildings in arid climates. Sustain. Energy Technol. Assess. 2021, 47, 101468. [Google Scholar] [CrossRef]
- Ramos, H.M.; Sintong, J.E.; Kuriqi, A. Optimal integration of hybrid pumped storage hydropower toward energy transition. Renew. Energy 2024, 221, 119732. [Google Scholar] [CrossRef]
- Akrofi, M.M.; Okitasari, M. Integrating solar energy considerations into urban planning for low carbon cities: A systematic review of the state-of-the-art. Urban Gov. 2022, 2, 157–172. [Google Scholar] [CrossRef]
- Calautit, K.; Johnstone, C. State-of-the-art review of micro to small-scale wind energy harvesting technologies for building integration. Energy Convers. Manag. X 2023, 20, 100457. [Google Scholar] [CrossRef]
- Pérez-Collazo, C.; Greaves, D.; Iglesias, G. A review of combined wave and offshore wind energy. Renew. Sustain. Energy Rev. 2015, 42, 141–153. [Google Scholar] [CrossRef]
- Khalid, M. Smart grids and renewable energy systems: Perspectives and grid integration challenges. Energy Strateg. Rev. 2024, 51, 101299. [Google Scholar] [CrossRef]
- Schmitt, R.J.P.; Rosa, L. Dams for hydropower and irrigation: Trends, challenges, and alternatives. Renew. Sustain. Energy Rev. 2024, 199, 114439. [Google Scholar] [CrossRef]
- Boroomandnia, A.; Rismanchi, B.; Wu, W.; Anderson, R. Optimal design of micro pumped-storage plants in the heart of a city. Sustain. Cities Soc. 2024, 101, 105054. [Google Scholar] [CrossRef]
- Alonso, A.P. Pumped hydro energy storage systems for a sustainable energy planning. Sustain. Energy Plan. Smart Grids 2024, 71–89. [Google Scholar] [CrossRef]
- Xiang, P.; Jiang, K.; Wang, J.; He, C.; Chen, S.; Jiang, W. Evaluation of LCOH of conventional technology, energy storage coupled solar PV electrolysis, and HTGR in China. Appl. Energy 2024, 353, 122086. [Google Scholar] [CrossRef]
- Ren, Y.; Sun, K.; Zhang, K.; Han, Y.; Zhang, H.; Wang, M.; Jing, X.; Mo, J.; Zou, W.; Xing, X. Optimization of the capacity configuration of an abandoned mine pumped storage/wind/photovoltaic integrated system. Appl. Energy 2024, 374, 124089. [Google Scholar] [CrossRef]
- Tatar, S.M.; Aydin, E. Design and operation of renewable energy microgrids under uncertainty towards green deal and minimum carbon emissions. Sustain. Energy, Grids Netw. 2024, 37, 101233. [Google Scholar] [CrossRef]
- Garcia, C.; López-Jiménez, P.A.; Sánchez-Romero, F.J.; Pérez-Sánchez, M. Assessing water urban systems to the compliance of SDGs through sustainability indicators. Implementation in the valencian community. Sustain. Cities Soc. 2023, 96, 104704. [Google Scholar] [CrossRef]
- Beker, B.A.; Kansal, M.L. Complexities of the Urban Drinking Water Systems in Ethiopia and Possible Interventions for Sustainability; Springer: Cham, The Netherlands, 2024; Volume 26, ISBN 0123456789. [Google Scholar]
- Alhasnawi, B.N.; Almutoki, S.M.M.; Hussain, F.F.K.; Harrison, A.; Bazooyar, B.; Zanker, M.; Bureš, V. A new methodology for reducing carbon emissions using multi-renewable energy systems and artificial intelligence. Sustain. Cities Soc. 2024, 114, 105721. [Google Scholar] [CrossRef]
- Elghaish, F.; Matarneh, S.; Hosseini, M.R.; Tezel, A.; Mahamadu, A.M.; Taghikhah, F. Predictive digital twin technologies for achieving net zero carbon emissions: A critical review and future research agenda. Smart Sustain. Built Environ. 2024; ahead-of-print. [Google Scholar] [CrossRef]
- Morani, M.C.; Carravetta, A.; Fecarotta, O.; Montillo, R. Detailed Audit of the Energy Efficiency in Water Systems: New Performance Indices. Water Resour. Manag. 2024, 38, 1241–1260. [Google Scholar] [CrossRef]
- Velasco-Muñoz, J.F.; Aznar-Sánchez, J.A.; Belmonte-Ureña, L.J.; Román-Sánchez, I.M. Sustainable Water Use in Agriculture: A Review of Worldwide Research. Sustainability 2018, 10, 1084. [Google Scholar] [CrossRef]
- Yin, X.L.; Cheng, L.; Wang, X.; Lu, J.; Qin, H. Optimization for Hydro-Photovoltaic-Wind Power Generation System Based on Modified Version of Multi-Objective Whale Optimization Algorithm. Energy Procedia 2019, 158, 6208–6216. [Google Scholar] [CrossRef]
- Coelho, J.S.T.; van de Loo, M.; Díaz, J.A.; Coronado-Hernández, O.E.; Perez-Sanchez, M.; Ramos, H.M. Multi-Objective and Multi-Variable Optimization Models of Hybrid Renewable Energy Solutions for Water–Energy Nexus. Water 2024, 16, 2360. [Google Scholar] [CrossRef]
- Amoussou, I.; Tanyi, E.; Ali, A.; Agajie, T.F.; Khan, B.; Ballester, J.B.; Nsanyuy, W.B. Optimal Modeling and Feasibility Analysis of Grid-Interfaced Solar PV/Wind/Pumped Hydro Energy Storage Based Hybrid System. Sustainability 2023, 15, 1222. [Google Scholar] [CrossRef]
- Rauf, H.; Gull, M.S.; Arshad, N. Complementing hydroelectric power with floating solar PV for daytime peak electricity demand. Renew. Energy 2020, 162, 1227–1242. [Google Scholar] [CrossRef]
- Mercedes Garcia, A.V.; Sánchez-Romero, F.J.; López-Jiménez, P.A.; Pérez-Sánchez, M. A new optimization approach for the use of hybrid renewable systems in the search of the zero net energy consumption in water irrigation systems. Renew. Energy 2022, 195, 853–871. [Google Scholar] [CrossRef]
- Zhang, Y.; Lian, J.; Ma, C.; Yang, Y.; Pang, X.; Wang, L. Optimal sizing of the grid-connected hybrid system integrating hydropower, photovoltaic, and wind considering cascade reservoir connection and photovoltaic-wind complementarity. J. Clean. Prod. 2020, 274, 123100. [Google Scholar] [CrossRef]
- Simão, M.; Ramos, H.M. Hybrid Pumped Hydro Storage Energy Solutions towards Wind and PV Integration: Improvement on Flexibility, Reliability and Energy Costs. Water 2020, 12, 2457. [Google Scholar] [CrossRef]
- Rozon, F.; McGregor, C.; Owen, M. Long-Term Forecasting Framework for Renewable Energy Technologies’ Installed Capacity and Costs for 2050. Energies 2023, 16, 6874. [Google Scholar] [CrossRef]
Disclaimer/Publisher’s Note: The statements, opinions and data contained in all publications are solely those of the individual author(s) and contributor(s) and not of MDPI and/or the editor(s). MDPI and/or the editor(s) disclaim responsibility for any injury to people or property resulting from any ideas, methods, instructions or products referred to in the content. |
© 2024 by the authors. Licensee MDPI, Basel, Switzerland. This article is an open access article distributed under the terms and conditions of the Creative Commons Attribution (CC BY) license (https://creativecommons.org/licenses/by/4.0/).

