Exploring Asymmetric Lens–Total Internal Reflection (AL–TIR) Optics for Uniform Ceiling Illumination in Interior Lighting


Abstract
1. Introduction
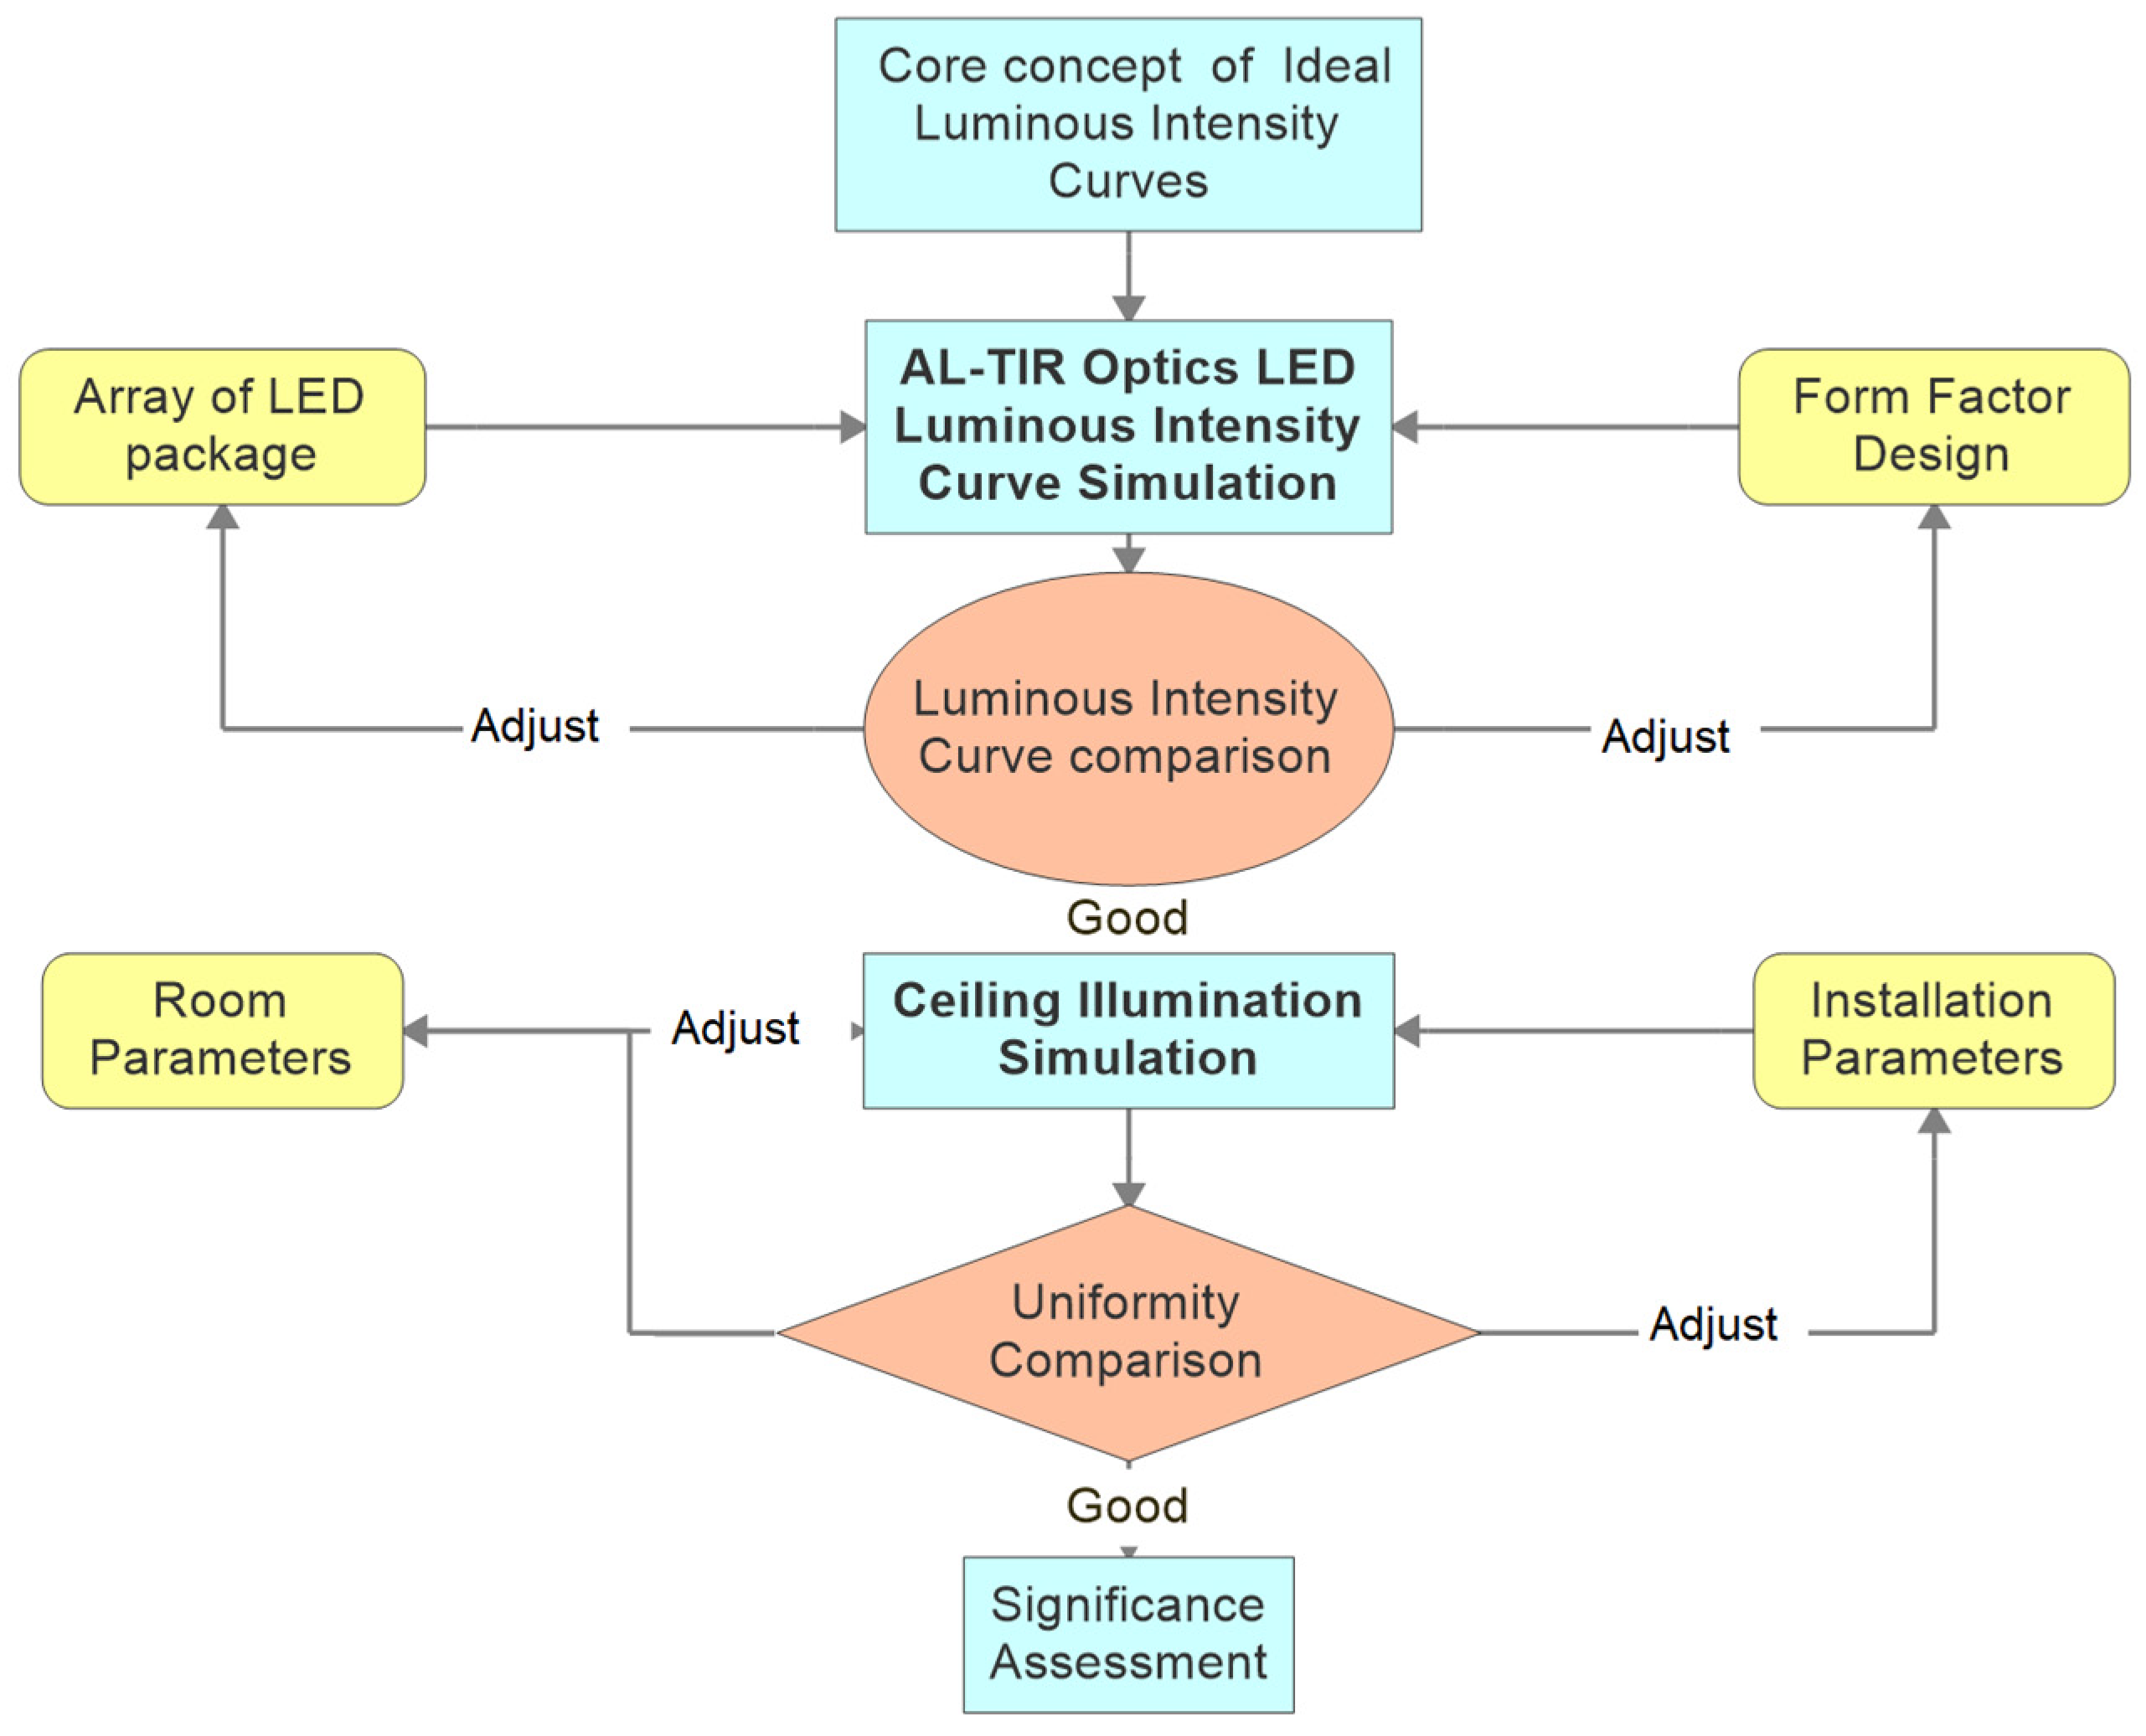
2. Design Method
3. Calculation and Simulation Results
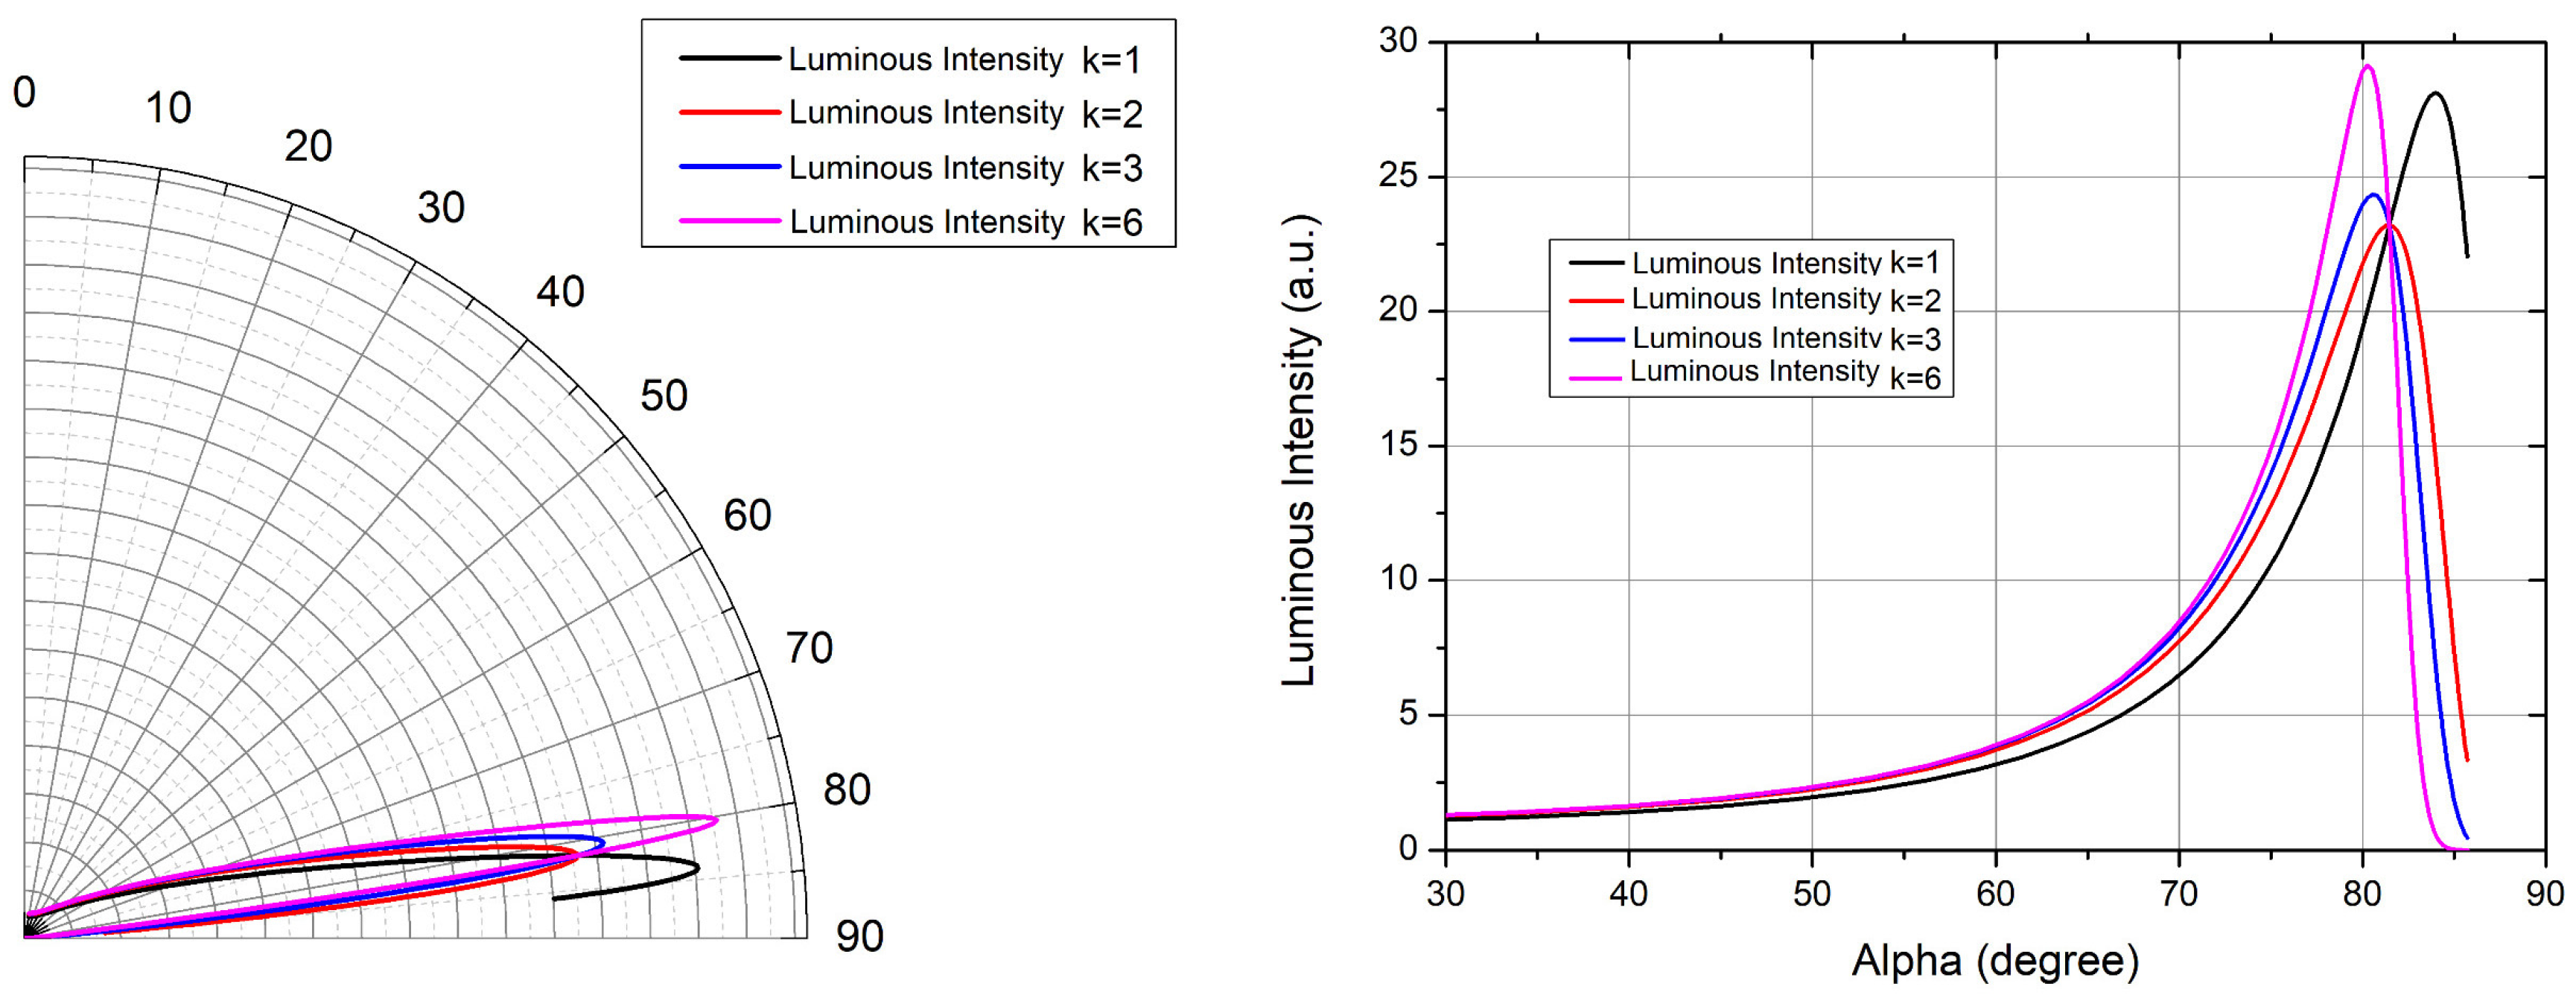
3.1. Calculation of Ideal Luminous Intensity Curves
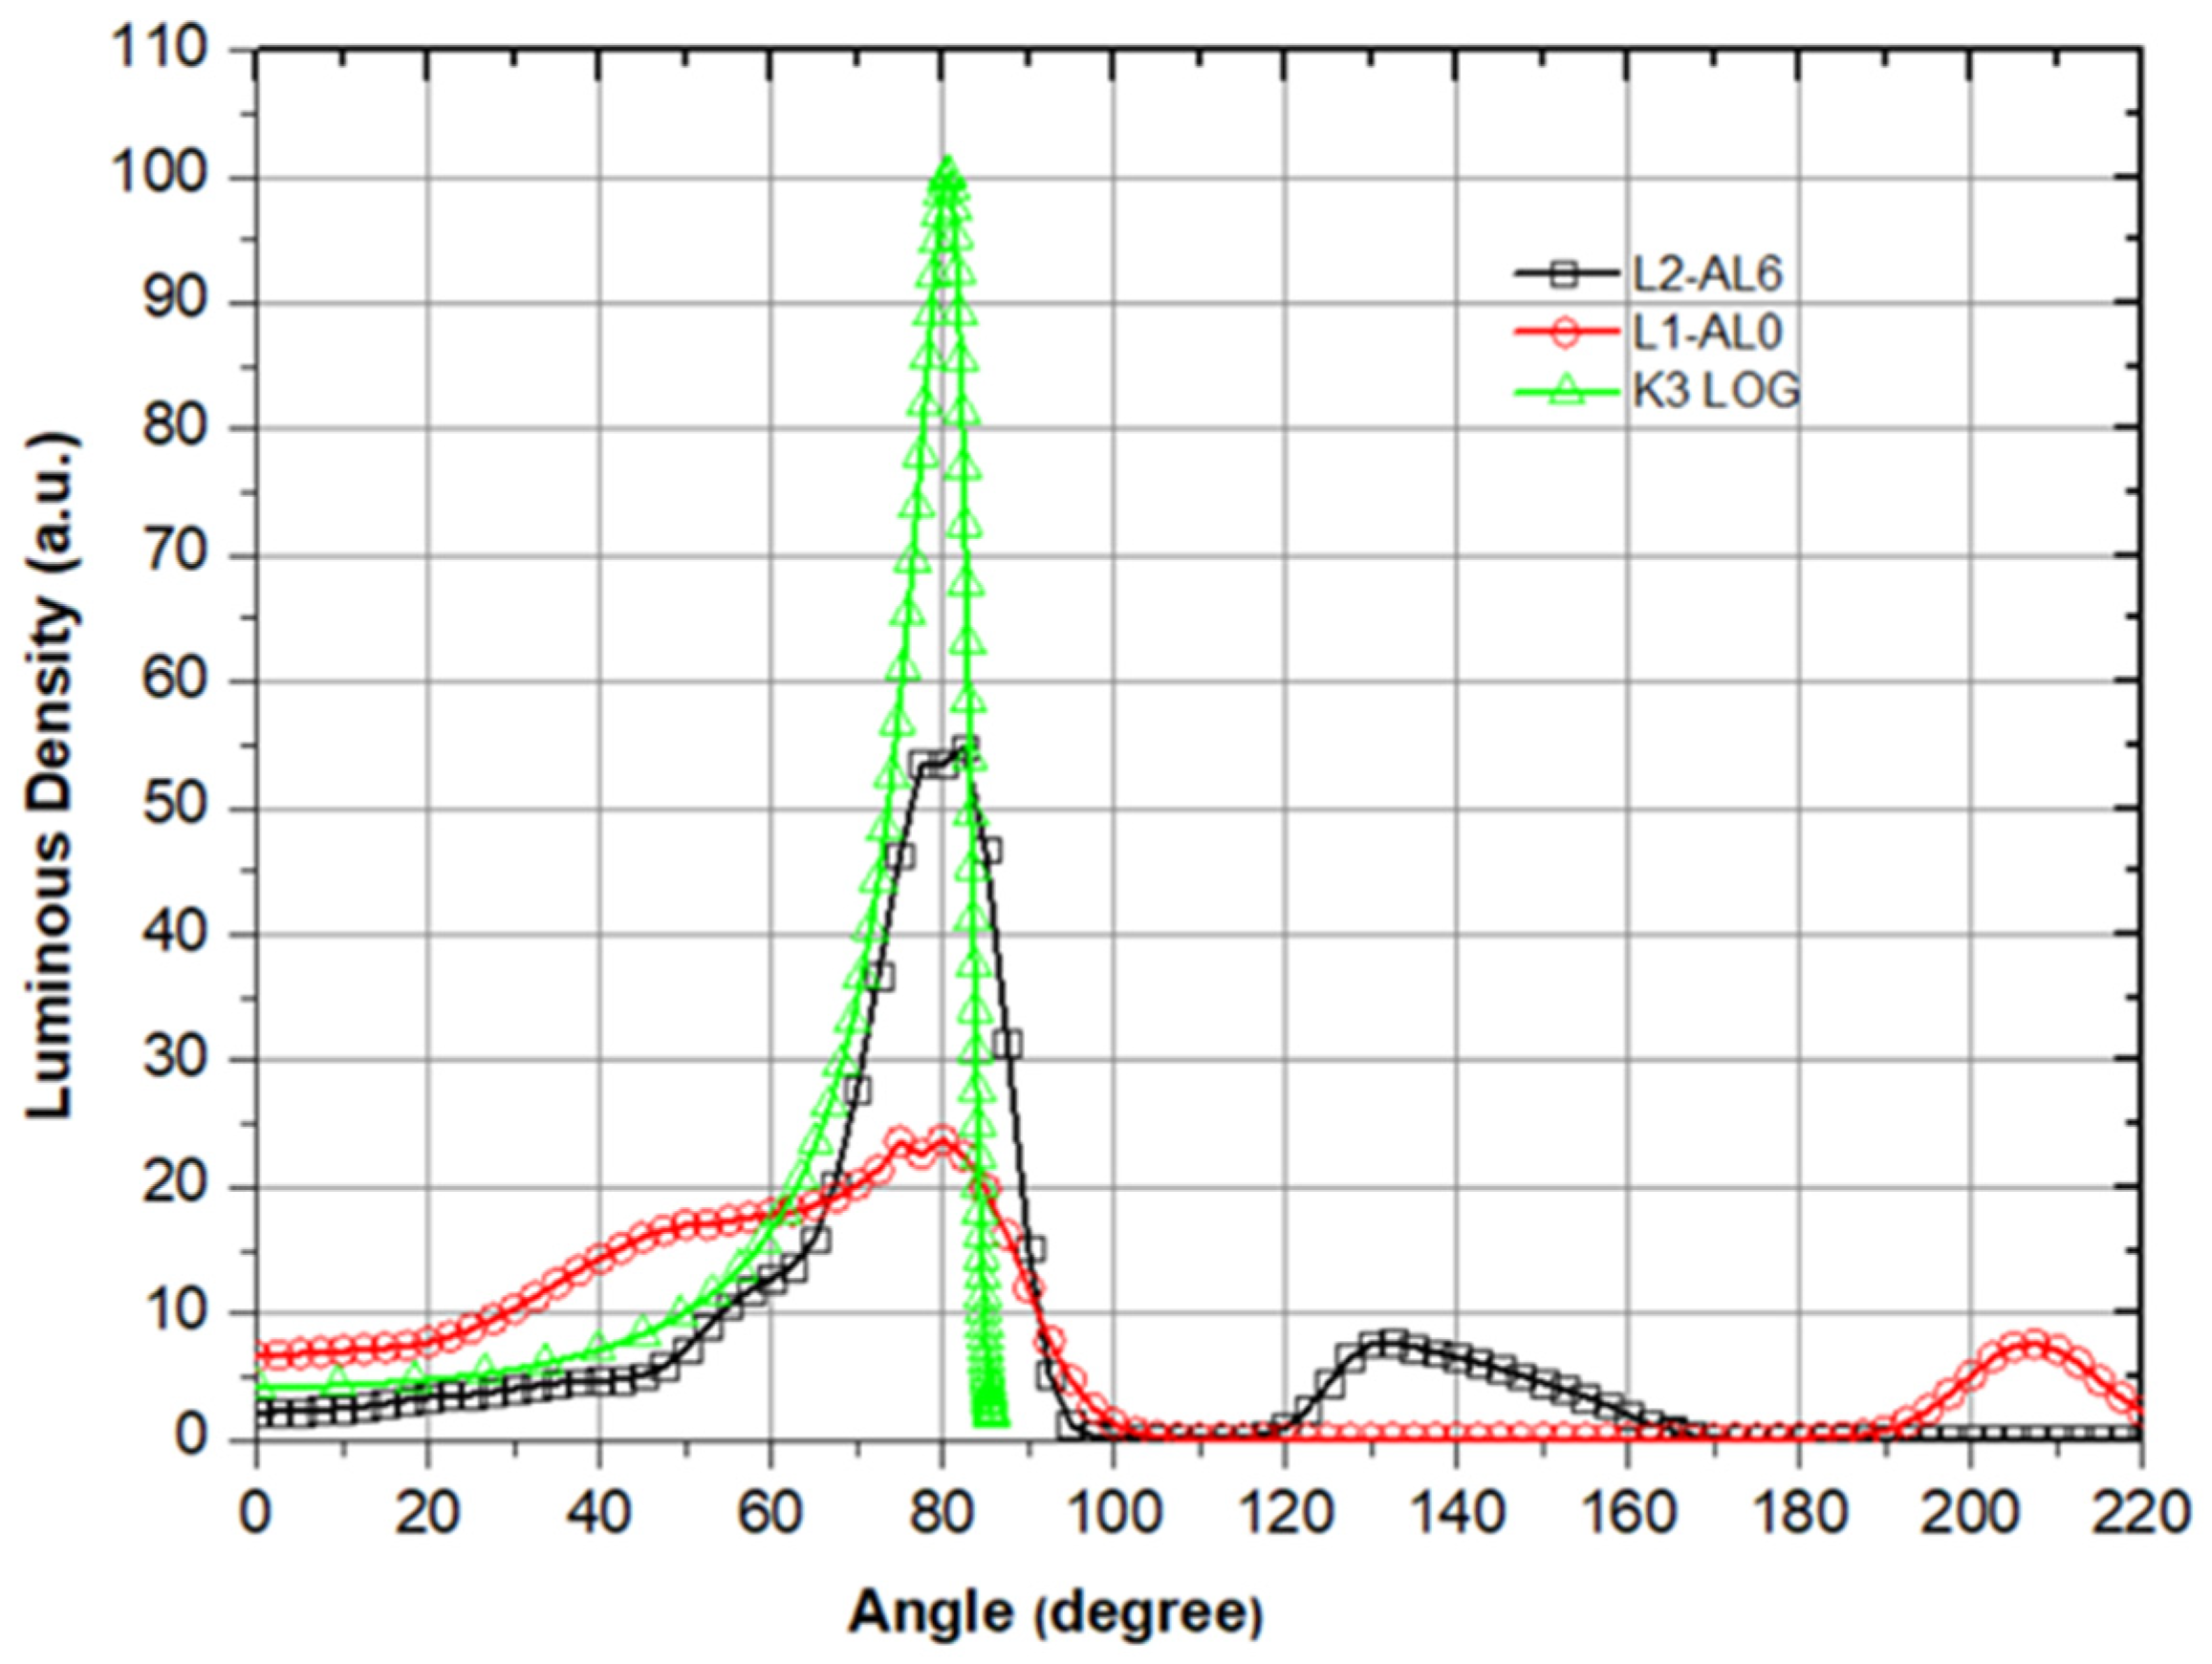
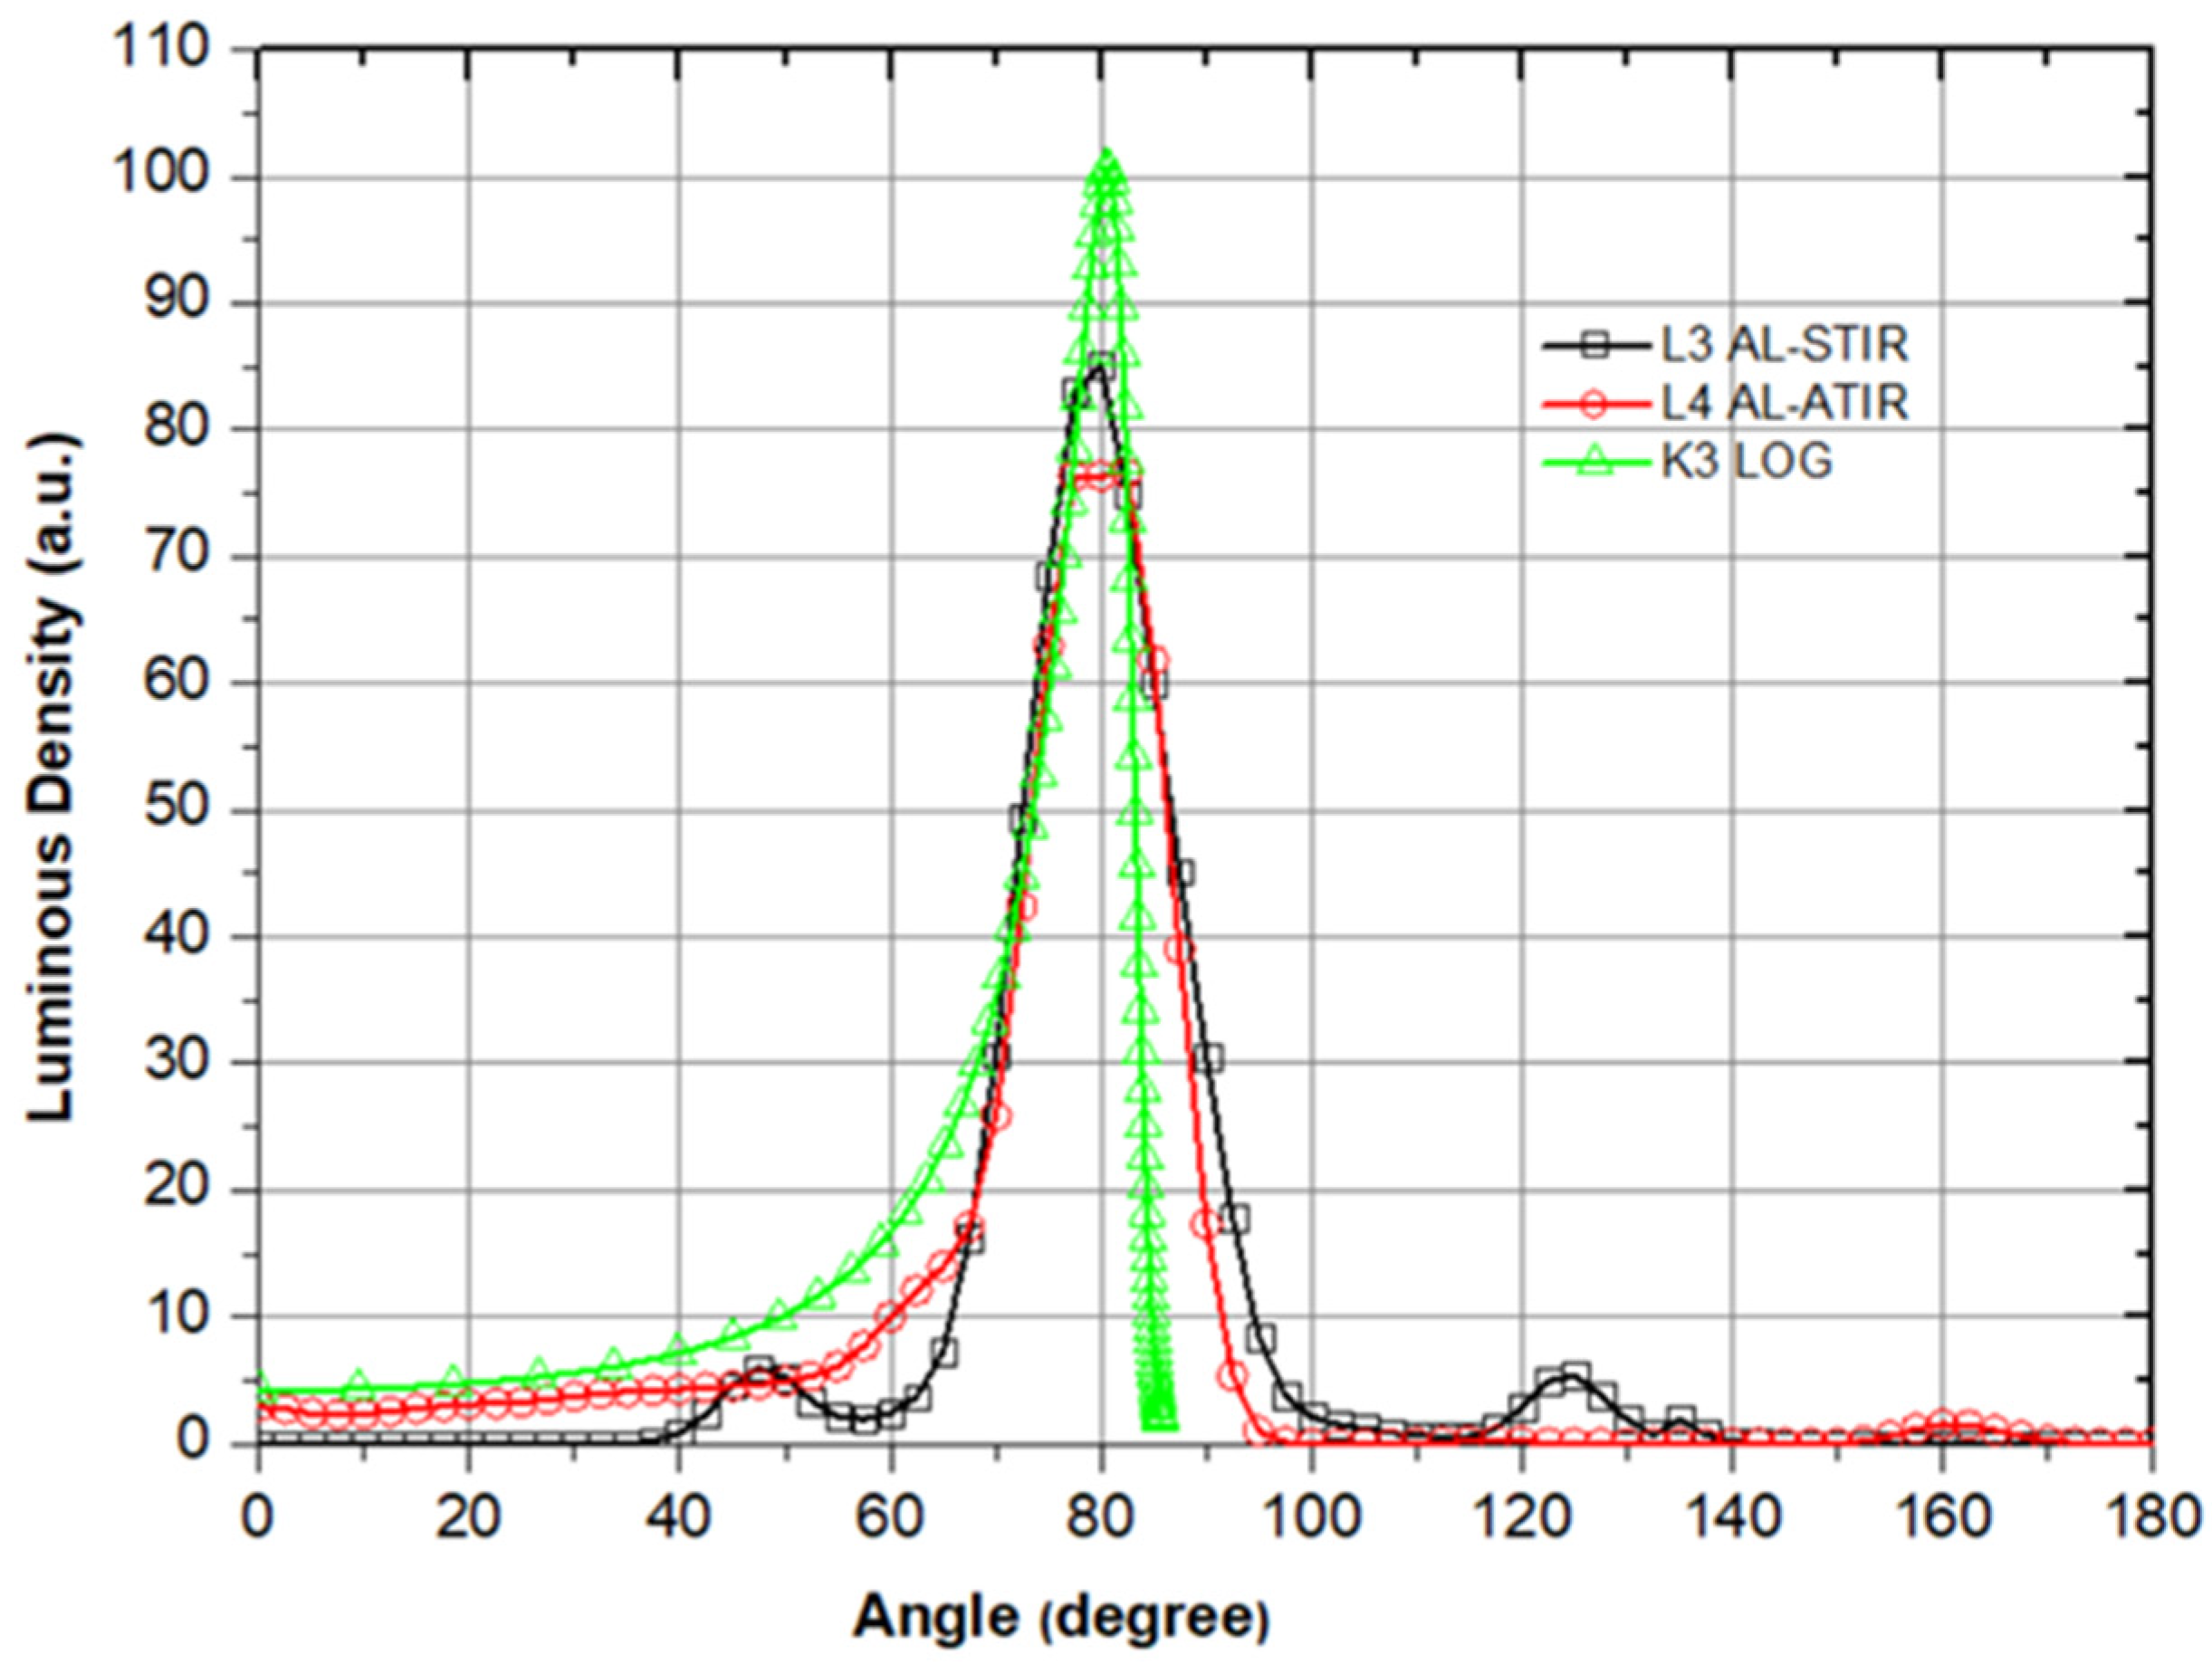
3.2. Lens Form Factor Design and Luminous Intensity Curve Comparison
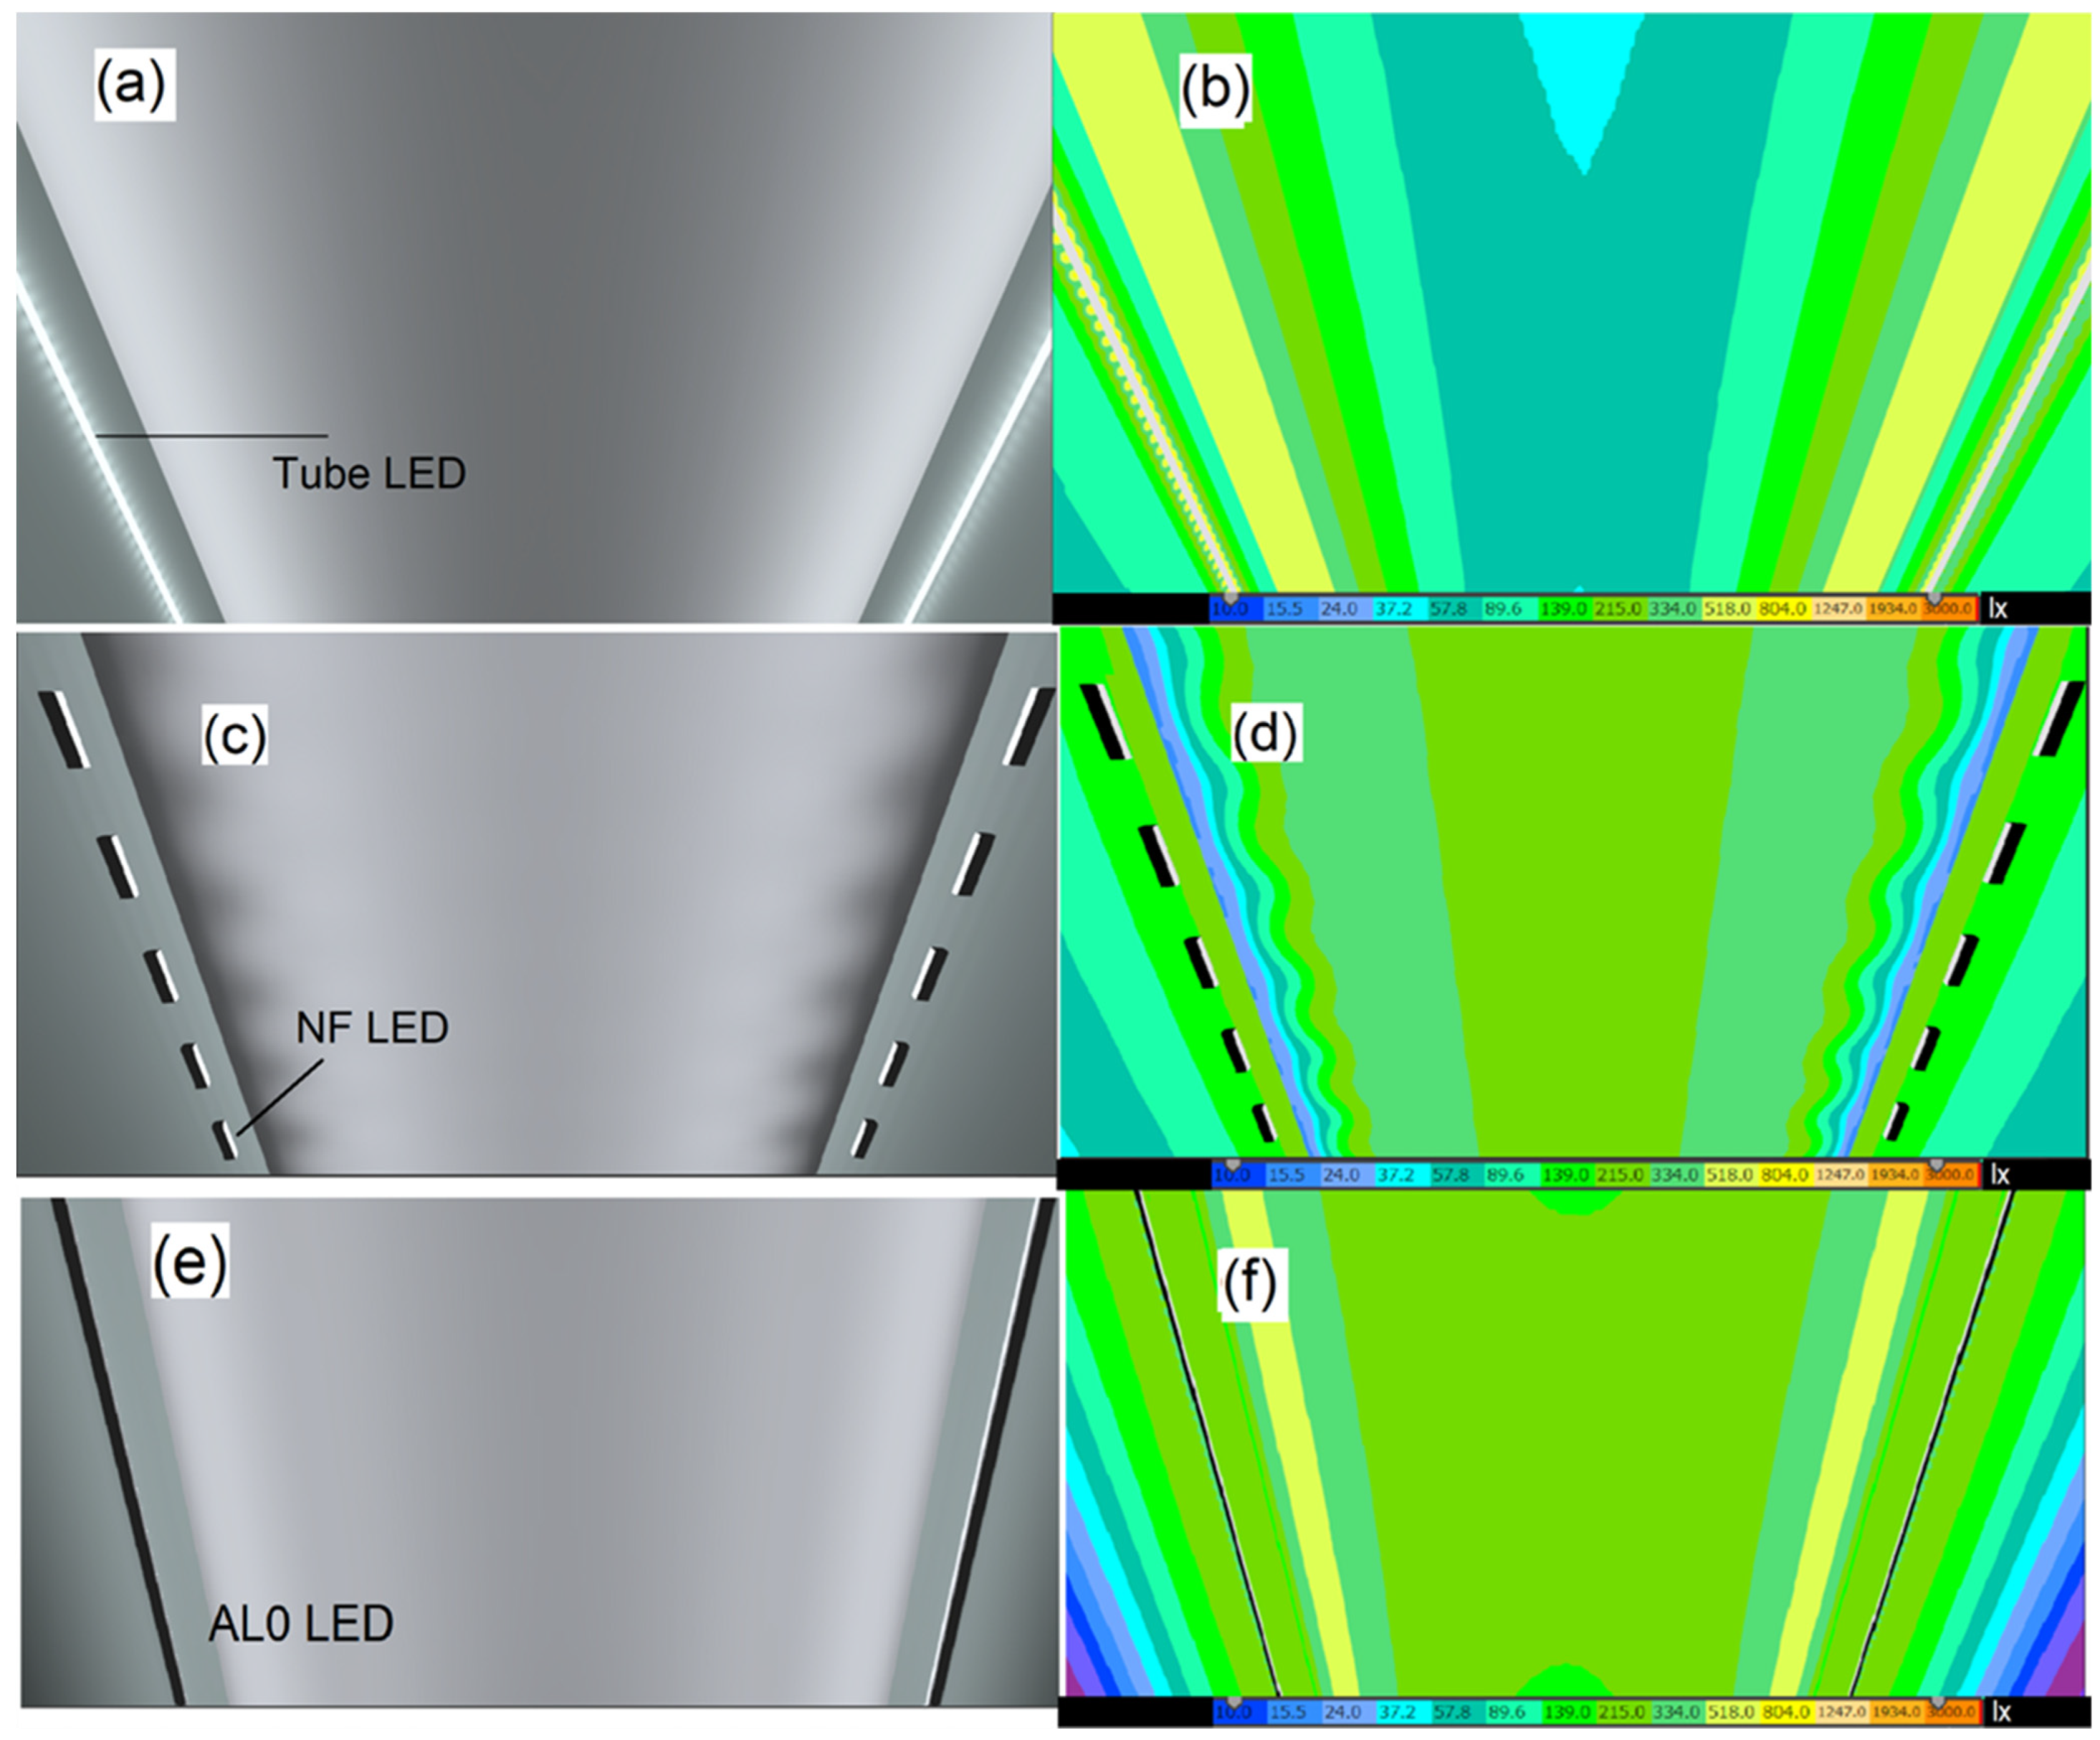
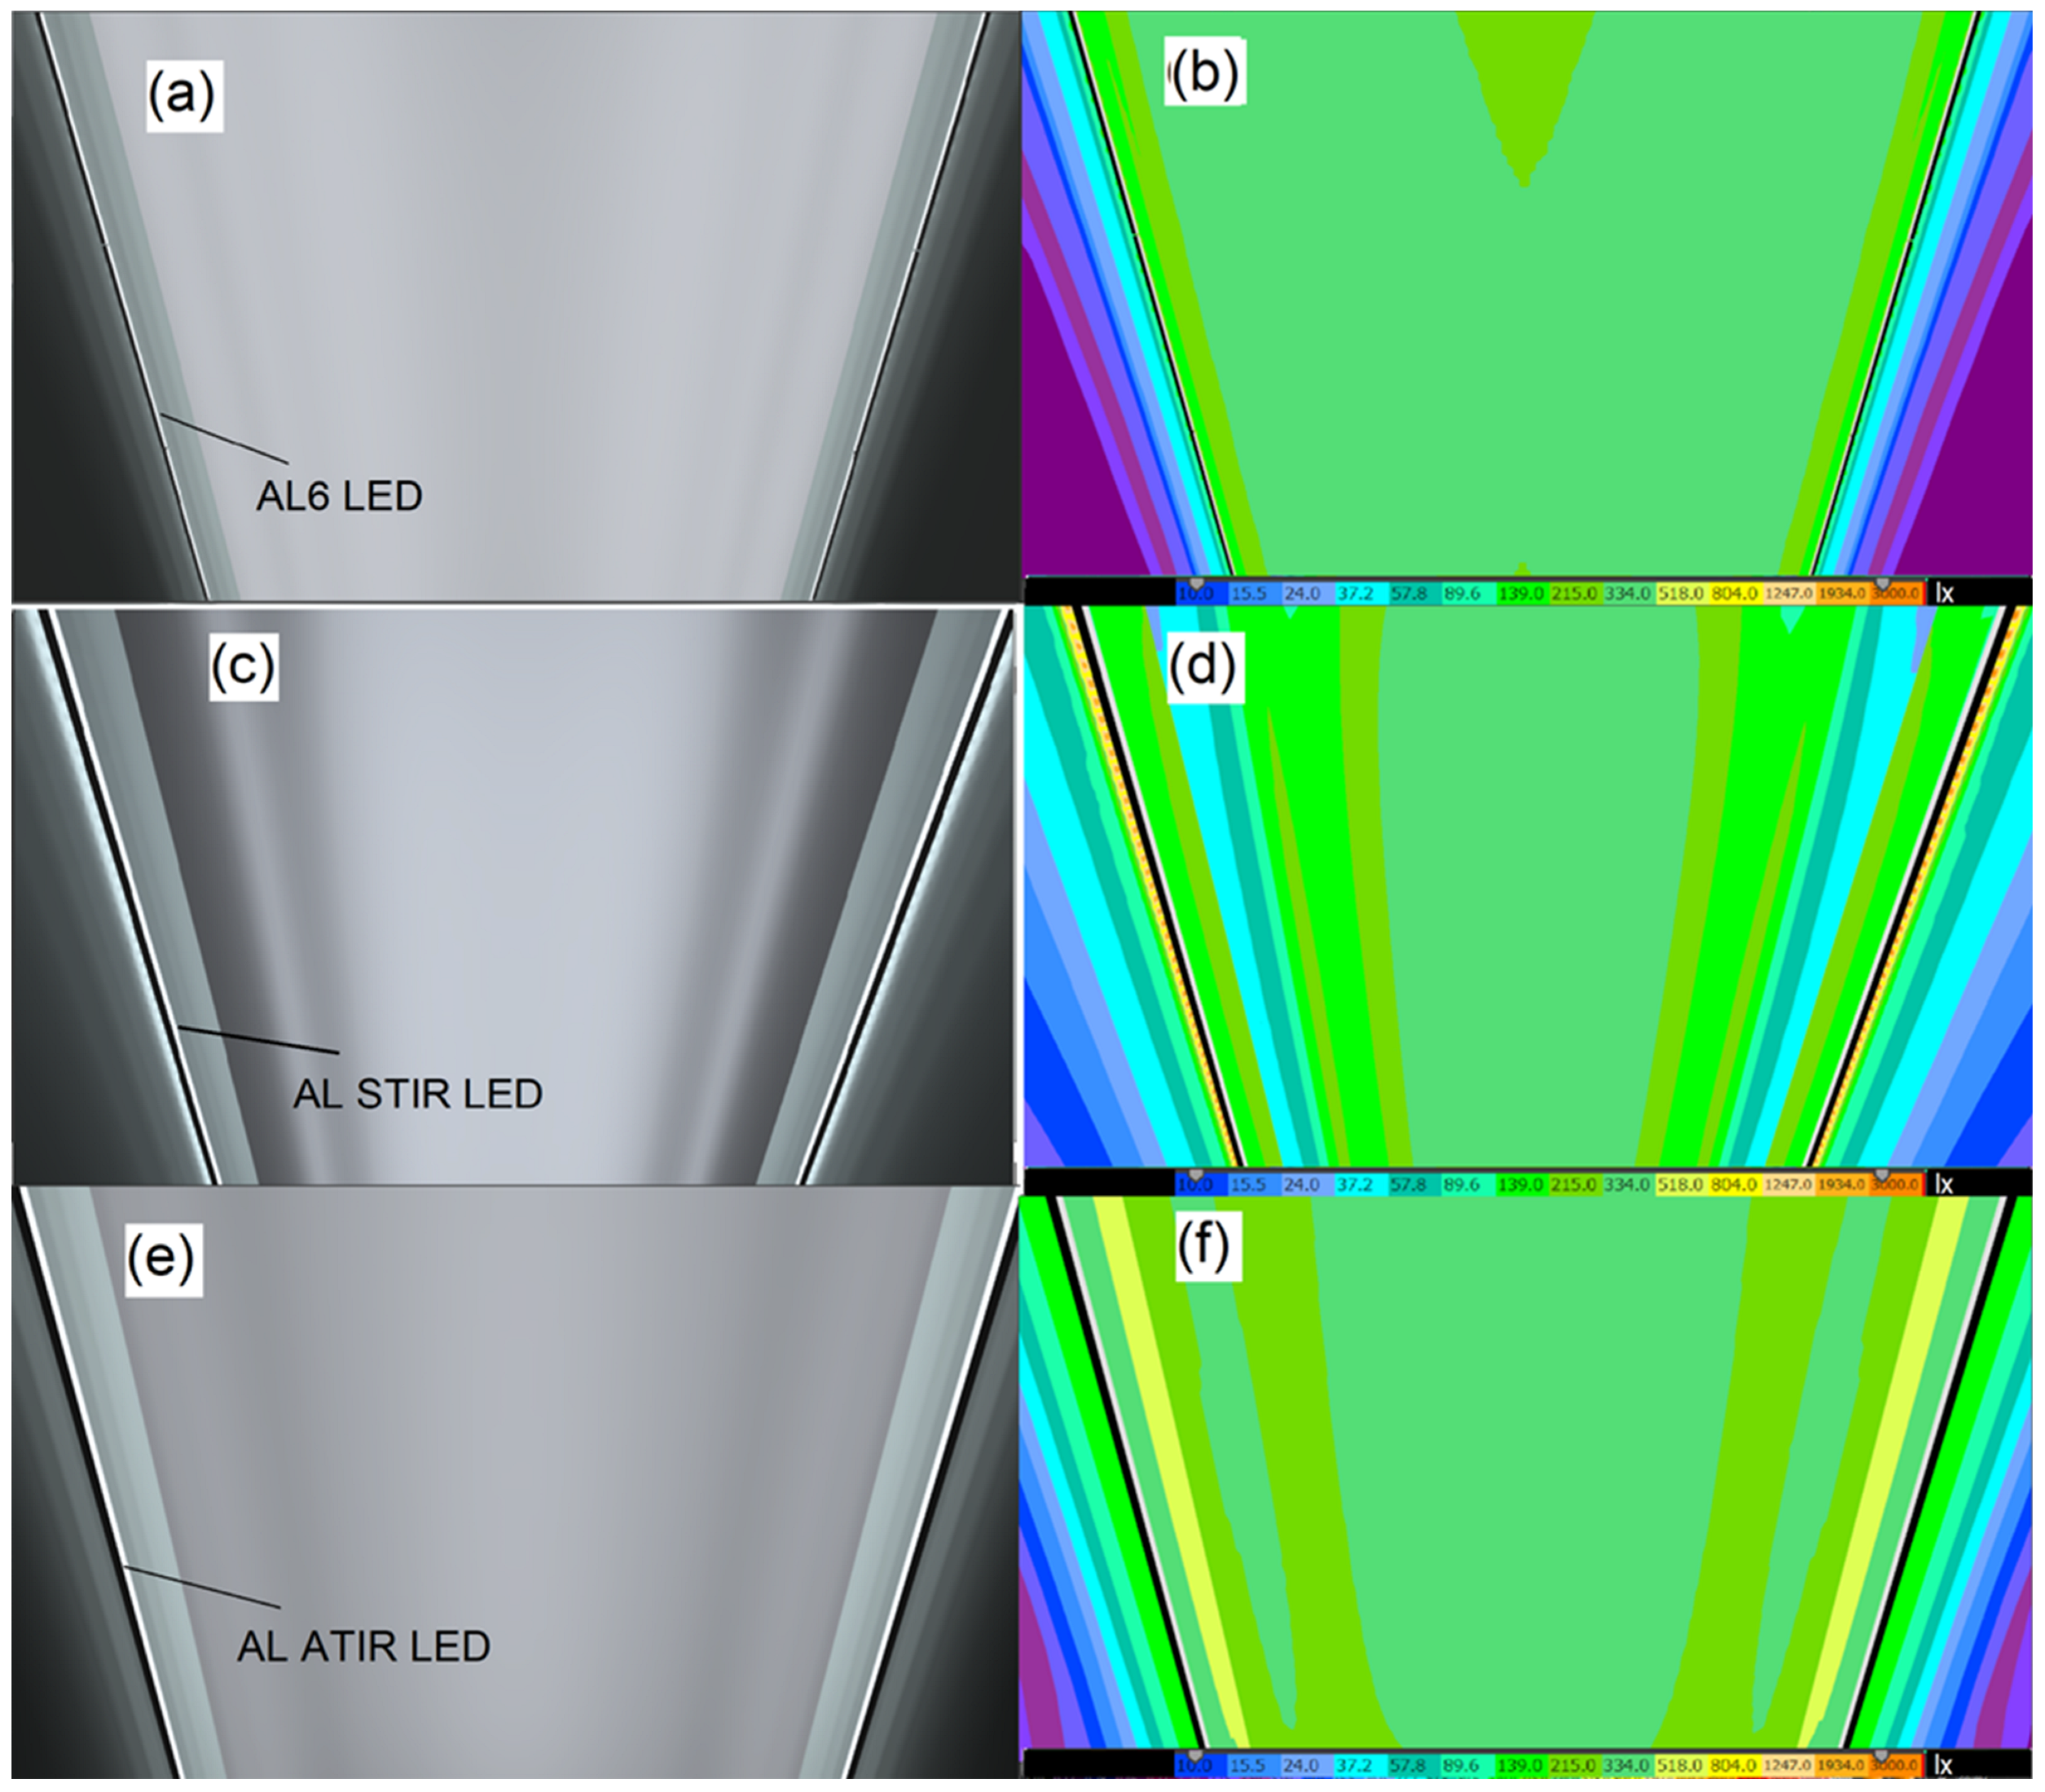
3.3. Simulation Results
4. Discussion
4.1. Comparison of Luminous Intensity Distribution Curves
4.2. Comparison of Ceiling Light Distribution Uniformity
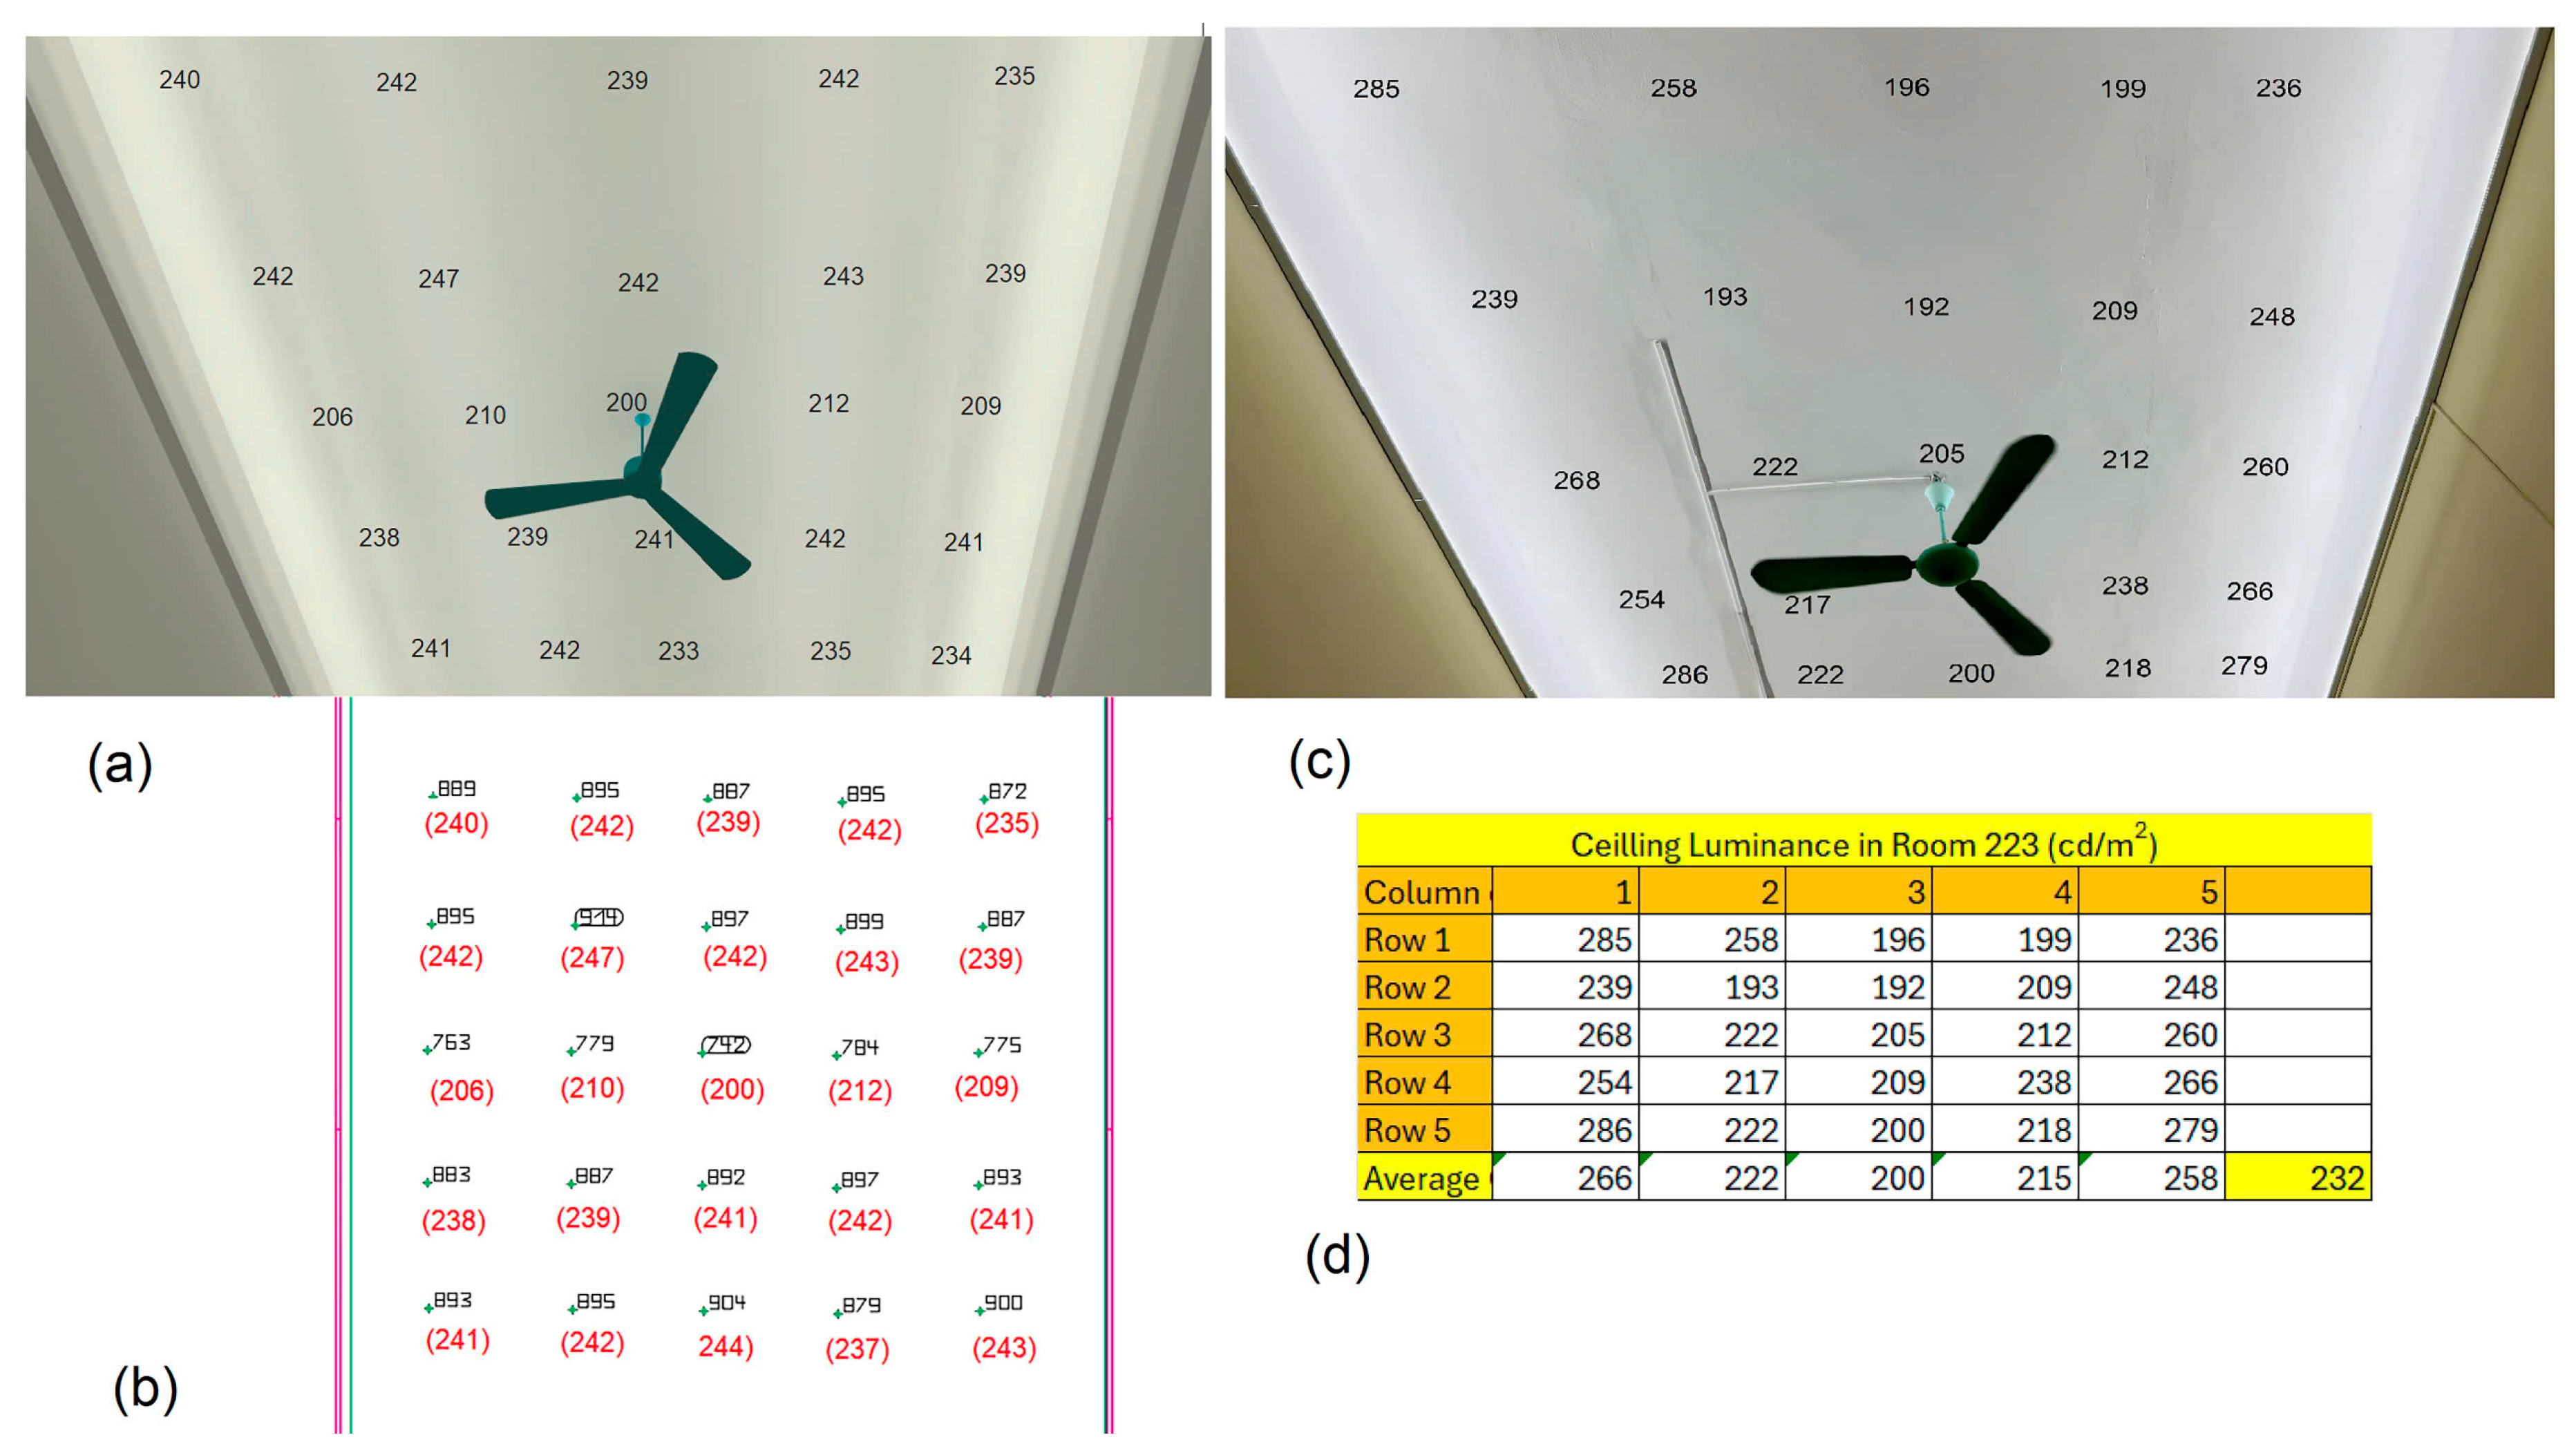
4.3. Comparison with Real Lighting Scenario
5. Conclusions
Author Contributions
Funding
Institutional Review Board Statement
Informed Consent Statement
Data Availability Statement
Conflicts of Interest
Abbreviations
| AL | Asymmetric lens |
| AL–STIR | Asymmetric Lens–Symmetric Total Internal Reflection |
| AL–ATIR | Asymmetric Lens–Asymmetric Total Internal Reflection |
| TOUF | Total optical utilization factor (including multiple reflections) |
| Average illuminance | |
| Average Illuminance on Ceiling | |
| Average Direct Illuminance on Ceiling | |
| Average Total Illuminance on Ceiling | |
| HCL | Human-centric lighting |
| TIR | Total internal reflection |
| Direct illuminance uniformity | |
| Total Illuminance Uniformity | |
| Uo | Illuminance uniformity |
References
- House, K.W.; Esposito, T. Human–Centric Lighting: Foundational Considerations and a Five–Step Design Process. Front. Neurol. 2021, 12, 630553. [Google Scholar] [CrossRef]
- Ticleanu, C. Impact of home lighting on human Health. Light. Res. Technol. 2021, 53, 453–475. [Google Scholar] [CrossRef]
- Knoop, M.; Stefani, O.; Bueno, B.; Matusiak, B.; Hobday, R.; Wirz-Justice, A.; Martiny, K.; Kantermann, T.; Aarts, M.P.; Zemmouri, N.; et al. Daylight: What makes the difference? Light. Res. Technol. 2020, 52, 423–442. [Google Scholar] [CrossRef]
- Sánchez-Cano, A.; Aporta, J. Optimization of lighting project including photopic and Circadian criteria: A Simplified Action Protocol. Appl. Sci. 2020, 10, 8068. [Google Scholar] [CrossRef]
- Münch, M.; Wirz-Justice, A.; Brown, S.A.; Kantermann, T.; Martiny, K.; Stefani, O.; Vetter, C.; Wright, K.P., Jr.; Wulff, K.; Skene, D.J. The Role of Daylight for Humans: Gaps in Current Knowledge. Clocks Sleep. 2020, 2, 61–85. [Google Scholar] [CrossRef]
- De Vries, A.; Heynderickx, I.; Souman, J.; de Kort, Y. Putting the ceiling center stage—The impact of direct/indirect lighting on room appraisal. Build. Environ. 2021, 201, 107989. [Google Scholar] [CrossRef]
- Chraibi, S.; Crommentuijn, L.; Van Loenen, E.; Rosemann, A. Influence of wall luminance and uniformity on preferred task illuminance. Build. Environ. 2017, 117, 24–35. [Google Scholar] [CrossRef]
- Klir, S.; Babilon, S.; Myland, P.; Benkner, S.; Khanh, T.Q. Sky-like interior light settings: A preference study. Front. Built Environ. 2023, 9, 1101534. [Google Scholar] [CrossRef]
- Zielinska-Dabkowska, K.M. Healthier and Environmentally Responsible Sustainable Cities and Communities. A New Design Framework and Planning Approach for Urban Illumination. Sustainability 2022, 14, 14525. [Google Scholar] [CrossRef]
- Yang, C.-C.; Chou, C.-H.; Su, Y.-T.; Lee, C.-R.; Lin, Y.-H.; Huang, K.C. Smart Health Lighting Design Applied to Healthy Residential Environment. In Proceedings of the 2022 IEEE International Conference on Imaging Systems and Techniques (IST), Kaohsiung, Taiwan, 21–23 June 2022; pp. 1–6. [Google Scholar] [CrossRef]
- Fang, F.; Cheng, Y.; Zhang, X. Design of freeform optics. Adv. Opt. Technol. 2013, 2, 445–453. [Google Scholar] [CrossRef]
- Lai, M.F.; Chen, Y.C.; Anh, N.D.Q.; Chen, T.Y.; Ma, H.Y.; Lee, H.Y. Design of asymmetric freeform lens for low glared LED streetlight with total internal reflection. Opt. Express 2016, 24, 1409–1415. [Google Scholar] [CrossRef] [PubMed]
- Zhu, Z.M.; Sun, X.; Peng, B. Rectangular illumination based on diffuse reflective off–axis surface. IEEE Photon. J. 2017, 9, 6500808. [Google Scholar] [CrossRef]
- Zhu, Z.; Ma, D.; Hu, Q.; Tang, Y.; Liang, R. Catadioptric freeform optical system design for LED off–axis road illumination applications. Opt. Express 2018, 26, A54–A65. [Google Scholar] [CrossRef] [PubMed]
- Sorgato, S.; Mohedano, R.; Chaves, J.; Hernández, M.; Blen, J.; Grabovičkić, D.; Benítez, P.; Miñano, J.C.; Thienpont, H.; Duerr, F. Compact illumination optic with three freeform surfaces for improved beam control. Opt. Express 2017, 25, 29627–29641. [Google Scholar] [CrossRef] [PubMed]
- Sorgato, S.; Chaves, J.; Thienpont, H.; Duerr, F. Design of illumination optics with extended sources based on wavefront tailoring. Optica 2019, 6, 966–971. [Google Scholar] [CrossRef]
- Babadi, S.; Ramirez-Iniguez, R.; Boutaleb, T.; Mallick, T. Symmetric and asymmetric freeform lens to produce uniform illumination. Opt. Eng. 2020, 59, 015102. [Google Scholar] [CrossRef]
- Yang, L.; Liu, Y.; Ding, Z.; Zhang, J.; Tao, X.; Zheng, Z.; Wu, R. Design of freeform lenses for illuminating hard–to–reach areas through a light–guiding system. Opt. Express 2020, 28, 38155–38168. [Google Scholar] [CrossRef]
- He, X.; Zhang, Y.; Shao, L.; Zou, N.; Li, X.; Hao, B.; Wang, C.; Liu, Y.; Yu, L. Optical system design of blackboard light. J. Phys. Conf. Ser. 2020, 1449, 012116. [Google Scholar] [CrossRef]
- Kang, D.H.; Jung, M.S. Study on the Design of Asymmetric Lighting with Uniform Illumination Over a Large Area at Short Distance. Korean J. Opt. Photonics 2020, 31, 183–190. [Google Scholar] [CrossRef]
- Thi Giang, D.; La, T.L.; Quoc Tien, T.; Hong Duong, P.; Tong, Q.C. A simple designed lens for human centric lighting using LEDs. Appl. Sci. 2020, 10, 343. [Google Scholar] [CrossRef]
- Li, Y.; Feng, Z.; Cheng, D.; Wang, Y. Designing double freeform surfaces for large ray bending irradiance tailoring of extended LED sources. Opt. Express 2021, 29, 13469. [Google Scholar] [CrossRef] [PubMed]
- Giang, D.T.; Pham, T.S.; Ngo, Q.M.; Tien, T.Q.; Duong, P.H. An Alternative Approach for High Uniformity Distribution of Indoor Lighting LED. IEEE Photonics J. 2020, 12, 7100810. [Google Scholar] [CrossRef]
- De Boer, J.B.; Fischer, D. Interior Lighting; Philips Technical Review: Eindhoven, The Netherlands, 1978; Volume 2, pp. 43–63. [Google Scholar]
- Standard EN 12464-1; Light and Lighting–Lighting of Workplaces–Part 1: Indoor Work. ISO: Geneva, Switzerland, 2021.


| Luminaires | Optics | Illuminance (lx) | Dir. Util. Factor DOUF | Direct Uniform | Illuminance (lx) | Total Uniform | Total Util. Factor TOUF |
|---|---|---|---|---|---|---|---|
| 12 × TLED | Diffuser | 252 | 36% | 0.25 | 483 | 0.42 | 70% |
| 24 × NF301 | Sym. Lens | 292 | 43% | 0.56 | 404 | 0.76 | 57% |
| 12 × L1-AL0 | AL0 Lens | 366 | 53% | 0.64 | 606 | 0.75 | 88% |
| 12 × L2-AL6 | AL6 Lens | 362 | 53% | 0.78 | 556 | 0.90 | 81% |
| 12 × L3-AL STIR | AL STIR | 354 | 51% | 0.63 | 487 | 0.87 | 71% |
| 12 × L4-AL ATIR | AL ATIR | 429 | 63% | 0.83 | 700 | 0.91 | 100% |
Disclaimer/Publisher’s Note: The statements, opinions and data contained in all publications are solely those of the individual author(s) and contributor(s) and not of MDPI and/or the editor(s). MDPI and/or the editor(s) disclaim responsibility for any injury to people or property resulting from any ideas, methods, instructions or products referred to in the content. |
© 2024 by the authors. Licensee MDPI, Basel, Switzerland. This article is an open access article distributed under the terms and conditions of the Creative Commons Attribution (CC BY) license (https://creativecommons.org/licenses/by/4.0/).
Share and Cite
Giang, D.T.; Duong, P.H.; Khanh, T.Q. Exploring Asymmetric Lens–Total Internal Reflection (AL–TIR) Optics for Uniform Ceiling Illumination in Interior Lighting. Appl. Sci. 2024, 14, 10081. https://doi.org/10.3390/app142110081
Giang DT, Duong PH, Khanh TQ. Exploring Asymmetric Lens–Total Internal Reflection (AL–TIR) Optics for Uniform Ceiling Illumination in Interior Lighting. Applied Sciences. 2024; 14(21):10081. https://doi.org/10.3390/app142110081
Chicago/Turabian StyleGiang, Duong Thi, Pham Hong Duong, and Tran Quoc Khanh. 2024. "Exploring Asymmetric Lens–Total Internal Reflection (AL–TIR) Optics for Uniform Ceiling Illumination in Interior Lighting" Applied Sciences 14, no. 21: 10081. https://doi.org/10.3390/app142110081
APA StyleGiang, D. T., Duong, P. H., & Khanh, T. Q. (2024). Exploring Asymmetric Lens–Total Internal Reflection (AL–TIR) Optics for Uniform Ceiling Illumination in Interior Lighting. Applied Sciences, 14(21), 10081. https://doi.org/10.3390/app142110081