Article

Analysis of the End-Bearing Capacity of Piles in Sand Under Limited Region Failure by a Mixed Zero-Extension Line Method

1
Research Center of Coastal and Urban Geotechnical Engineering, Zhejiang University, Hangzhou 310058, China
2
Institute of Wenzhou, Zhejiang University, Wenzhou 325035, China
3
School of Civil Engineering, Ningbo Tech University, Ningbo 315100, China
4
School of Civil Engineering and Architecture, Zhejiang Sci-Tech University, Hangzhou 310018, China
*
Author to whom correspondence should be addressed.
Appl. Sci. 2024, 14(21), 9713; https://doi.org/10.3390/app14219713
Submission received: 18 September 2024 / Revised: 20 October 2024 / Accepted: 21 October 2024 / Published: 24 October 2024
(This article belongs to the Section Civil Engineering)

Abstract

:
The failure zone around the pile tip varies greatly with the different failure patterns considered in research on the end-bearing capacity of piles. In an effort to improve the consideration of the size of the failure zone, a new failure pattern is proposed in the estimation of the end-bearing capacity of driven piles in sand and the failure zone is determined by zero-extension line (ZEL). Considering a failure zone limited below the pile end plane and an equivalent frictional contact condition with the equivalent frictional strength fully mobilized at the failure zone boundary, a more realistic prediction of the end-bearing capacity of piles is achieved. Reasonable values of parameters are obtained through parameter and numerical analysis. It is found that the failure zone is roughly within the range of 40° from the vertical direction. Comparison between the ultimate toe capacity predicted by the proposed method, a method directly using cone penetration test (CPT) data, and a method based on characteristic theory shows that the mixed zero-extension line method considering limited region failure has a better consistency with experimental data.

1. Introduction

The determination of the end-bearing capacity of piles has always been a major issue in geotechnical engineering and has received a great deal of attention from researchers. Paying attention to the failure mechanism and stress field around the pile tip, several methods have been used to study the end-bearing capacity of piles, such as the limit analysis method, the characteristics method, and the cavity expansion method.
In the cavity expansion method, the deformation of the soil around the pile tip is considered similar to the expansion of a spherical cavity, and the ultimate toe capacity is associated with the limited cavity expansion pressure. Through research on cavity expansion failure mechanisms and limited cavity expansion pressure, the ultimate toe capacity has been widely studied [1,2,3,4,5].
In the limit equilibrium method, the failure pattern around the pile tip and the failure surface are usually assumed directly. On the basis of the assumed failure surface, static equilibrium analysis is carried out to obtain the ultimate toe capacity and the constitutive soil model is generally not required. Meyerhof [6] established a failure pattern with the failure surface reverting to the pile shaft. Hanna and Nguyen [7] established an analytical model wherein the interdependence between the shaft and tip resistance is taken into account. Zhang et al. [8] investigated the ultimate toe capacity of rock-socketed piles based on the Hoek–Brown criterion.
The limit analysis method analyzes the ultimate toe capacity based on the upper bound or the lower bound theorem and the soil is usually considered as rigid plastic or elastic perfectly plastic in the limit analysis method. Jiang et al. [9] studied the ultimate bearing capacity of composite pile foundations by using the finite element plastic lower bound limit method and the interior-point algorithm. Zhang et al. [10] applied the upper bound limit analysis method to the analysis of the ultimate toe capacity considering the splitting failure of grouted base.
In the characteristics method, it is necessary to predetermine the failure pattern around the pile tip. Based on the determined failure pattern, the failure surface is defined by the stress characteristic line calculated using the equilibrium equation of the soil element around the pile tip. Considering different failure patterns and using different failure criteria for varying soil conditions, researchers studied the end-bearing capacity of piles. Veiskarami et al. [11] considered the end-bearing capacity of driven pile based on the failure pattern with the failure surface reverting to the pile shaft. Valikhah et al. [12] focused on the ultimate bearing capacity and the load–displacement behavior of driven pile based on a non-associated flow assumption. The ultimate bearing capacity of rock-socketed piles was also studied by the characteristics method [13,14,15].
When it comes to the most commonly used methods, the calculated ultimate toe capacity by the cavity expansion method is influenced by the rationality of the assumption of spherical expansion and the value of the limited cavity expansion pressure. The accuracy of other methods is affected by the assumption of the failure pattern and the range of the failure surface. The form of the failure pattern and the failure surface are usually assumed directly in the limit equilibrium method. The range of the shear failure surface considered in the limit analysis method and the characteristics method usually exceeds that observed in the actual situation due to a larger assumed failure pattern. There is relatively little research on the punching shear failure in which the range of failure surface is more in line with reality. Except for the deviation in the predicted ultimate toe capacity caused by the inaccurate assumed failure pattern, the flow rule influences the predicted results by affecting the extent of the failure range. The characteristics method and most limit theorems are mainly based on an associated flow rule that exhibits a larger failure pattern and a higher bearing capacity, while most geomaterials obey a non-associated flow rule. In these methods, the improvement of the failure zone size and the estimation of ultimate capacity is usually achieved by considering the non-associativity through the equivalent friction angle [11,12].
Roscoe [16] studied the displacement characteristics of the soil behind the retaining walls during the model wall test. Based on the test results, Roscoe [16] held that the slip line should be the zero-extension line, along which the linear incremental strain is seen as zero, rather than the stress characteristic line. Following the work of Roscoe, the zero-extension line (ZEL) method has developed and been used to characterize the plastic zone and compute the earth pressure of the retaining wall and the ultimate bearing capacity of shallow foundations [17,18,19,20,21]. Jahanandish and Ansaripour [22] established the maximum shear strain field and ZEL net by a particle image velocimetry technique in laboratory tests and verified the consistency between the slip directions and the zero-extension lines. The comparison between the estimation made by the ZEL methods and the measured record reveals the rationality of the ZEL. Compared to other methods, zero-extension line can characterize the velocity field of the plastic zone and more accurately consider the size of the failure zone by directly considering the strength and dilatancy effect of soil, without introducing the concept of equivalent friction angle.
Incorporating the ZEL concept, this paper proposes an analytical method to estimate the end-bearing capacity of piles in sand. The proposed method takes into account a limited failure zone below the pile end plane. Suggested values of the parameter in the proposed methods are obtained by parameter analysis and numerical analysis. The proposed method is validated through case histories, and the results obtained using the proposed method are compared with a method directly using CPT data and a method based on stress characteristics.

2. Failure Pattern and Basic Hypotheses

When the axial load on the pile top increases to a certain extent, settlement occurs at the pile tip. As the axial load continues to increase, portions of the soil around the pile tip deform into a plastic state and the plastic zone develops. With the expansion of the plastic zone, the pile tip resistance increases to the ultimate bearing capacity. The possible failure mechanisms around the pile tip at the ultimate state generally include general shear failure, cavity expansion failure, and local shear failure. They are shown in Figure 1. Figure 1a shows the general shear failure with the failure surface extending to the ground. Figure 1b shows the spherical cavity expansion failure pattern in which it is assumed that outside the rigid cone, the soil expands as a spherical cavity. Figure 1c shows the local shear failure with the failure zone limited below the pile end plane. Figure 1d shows the Prandtl failure patterns considering equivalent overload. Figure 1e shows the Meyerhof failure mode with the failure surface reverting to the pile shaft. Experimental research has found that general shear failure only occurs in shallow foundations, while in deep foundations, the failure zone around the pile tip does not revert to the pile shaft but is only limited below the pile end plane [23]. Therefore, considering a failure zone larger than that in engineering practice is difficult to prove as reasonable.
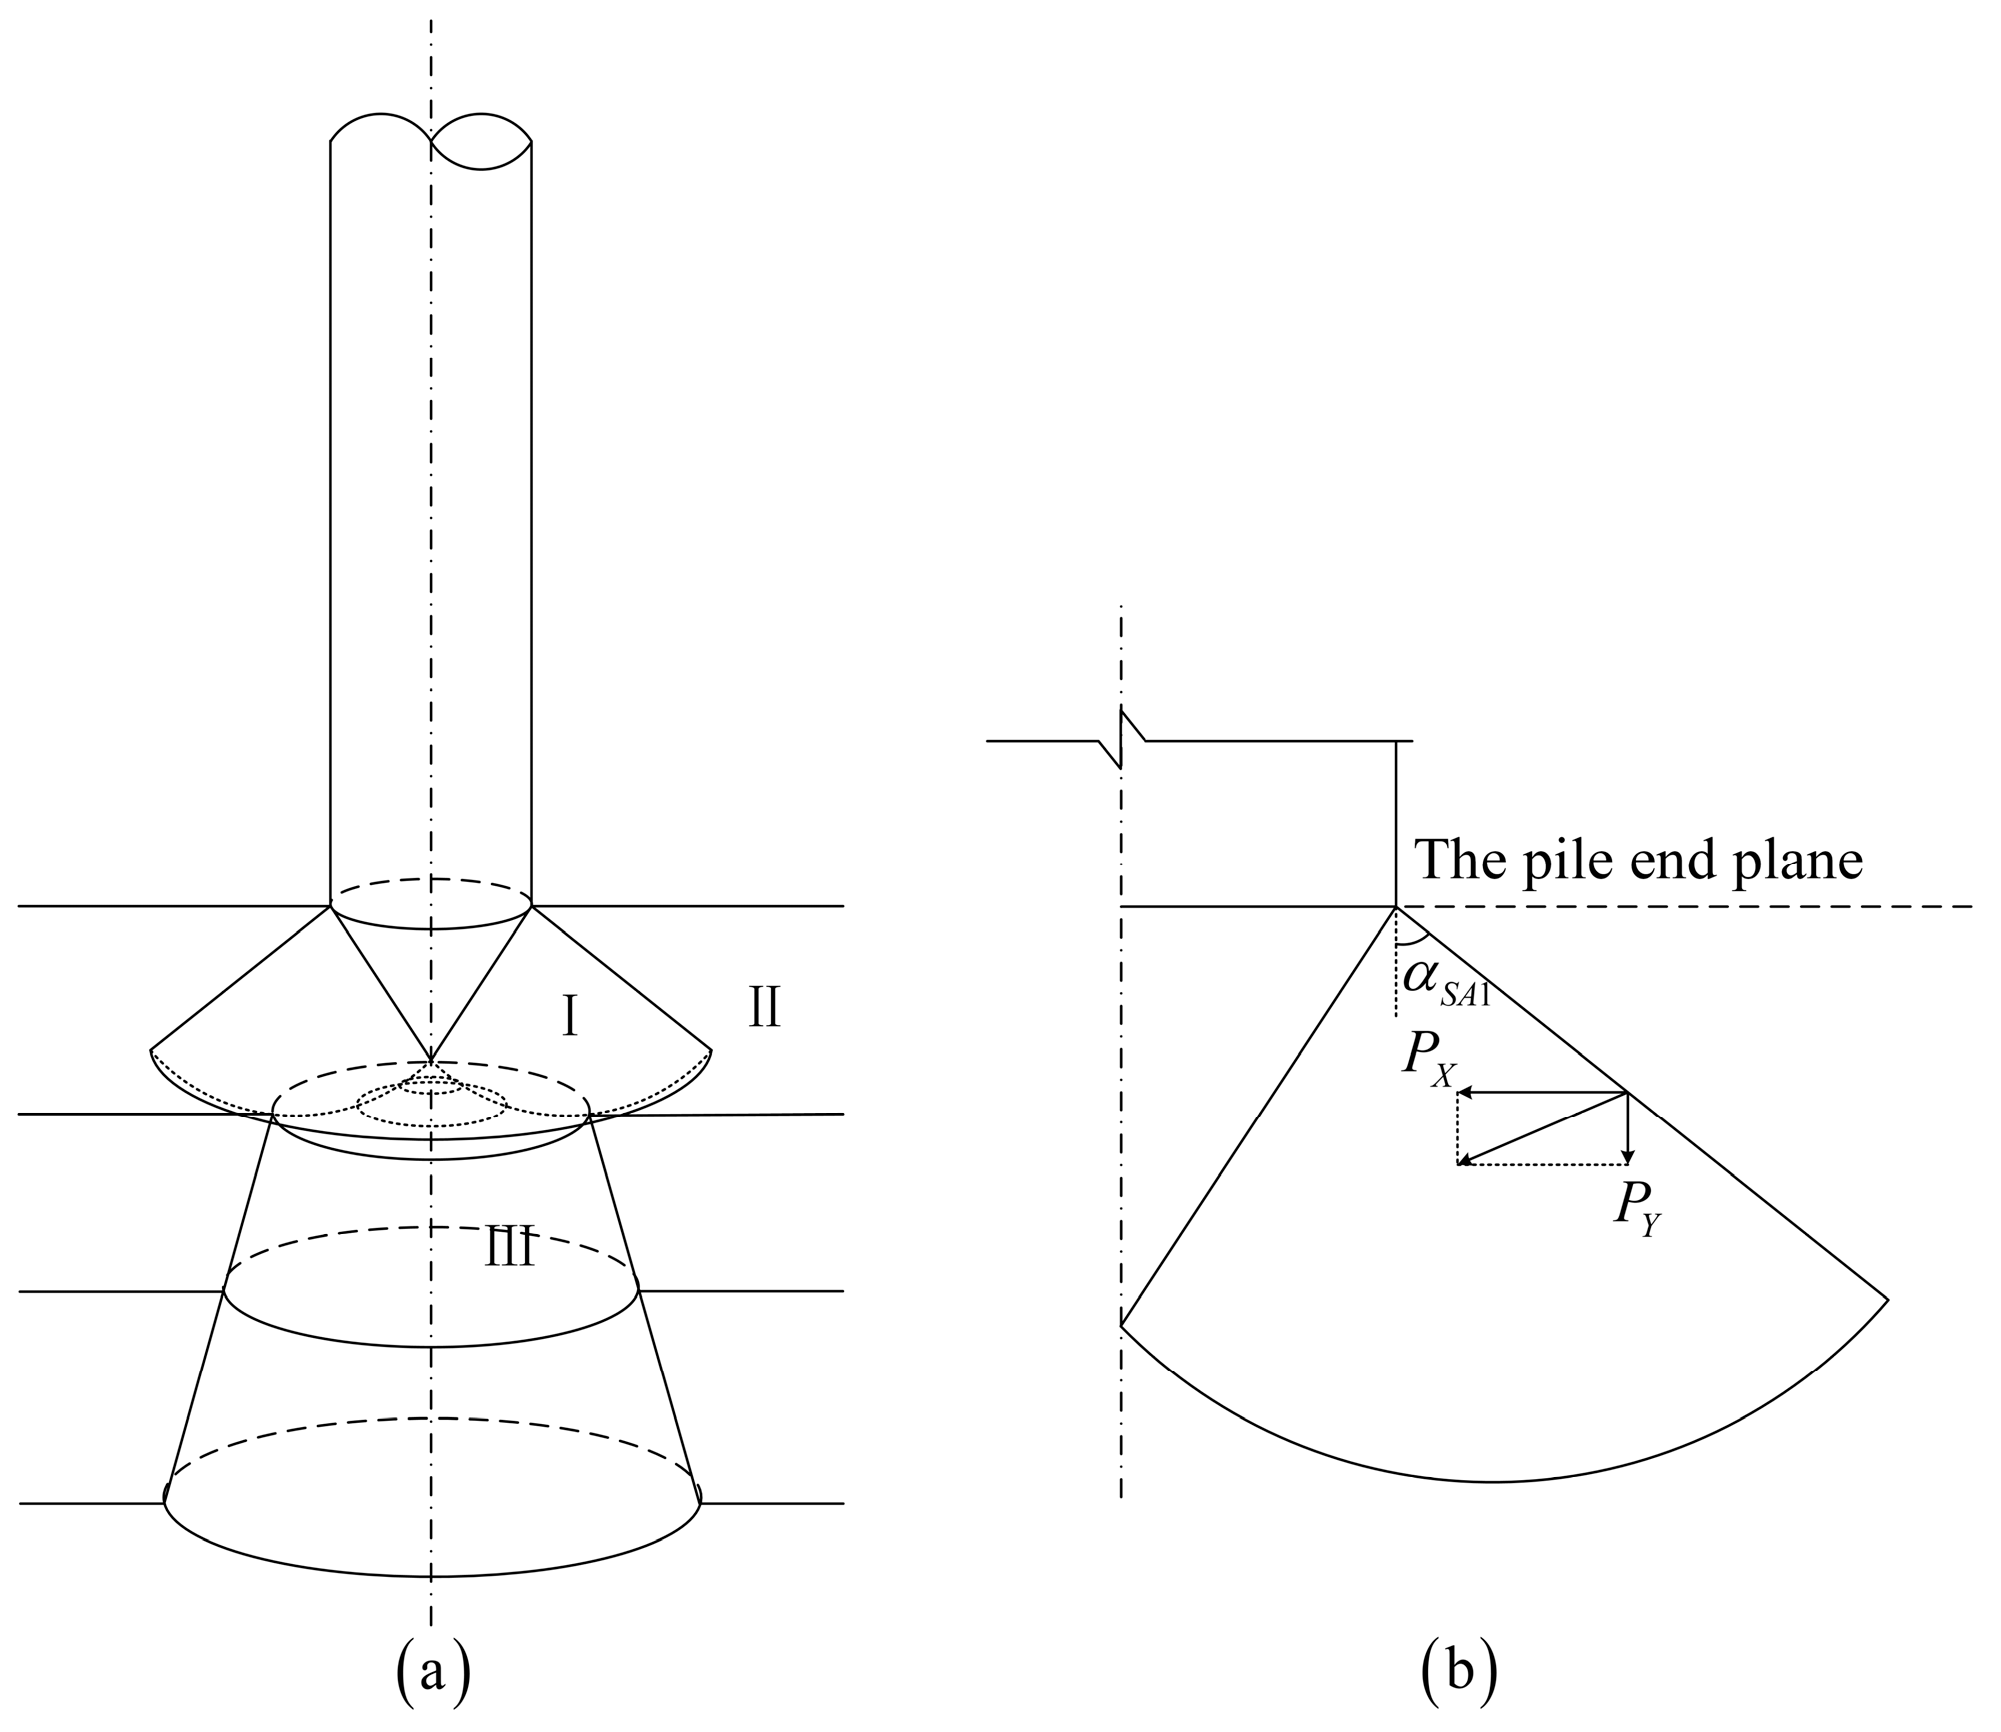
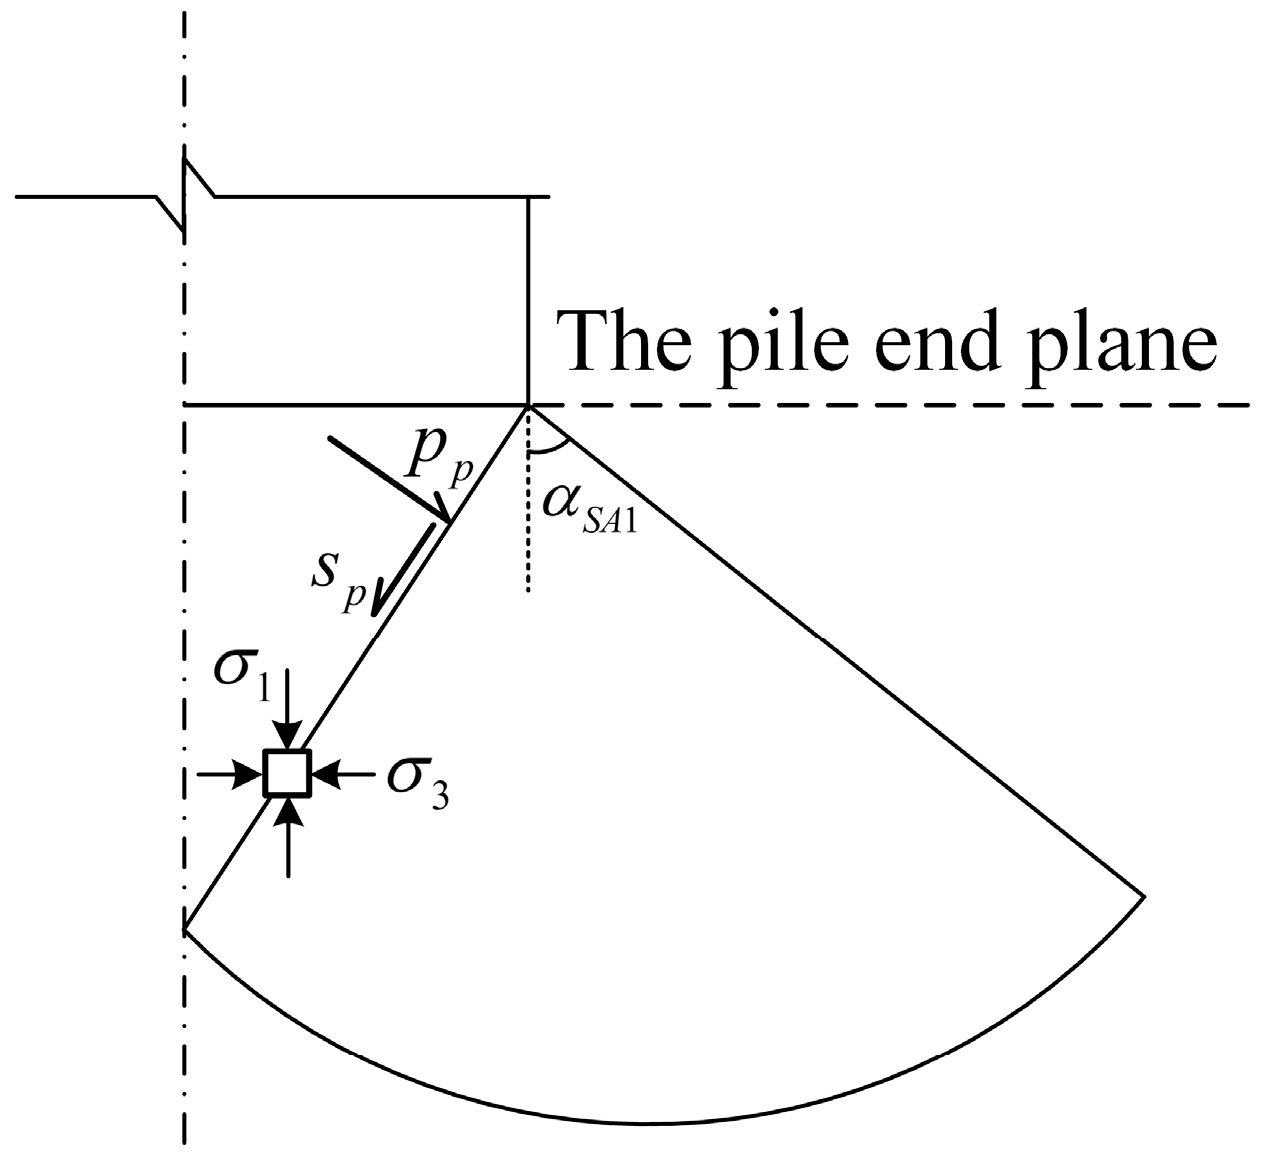
In this study, a limited region failure with a failure zone limited below the pile end plane is considered and the soil under the pile end is considered to be divided into four parts at the ultimate state, as shown in Figure 2a. Outside the rigid cone beneath the pile end, zone I is in a state of high shear failure, zone II, surrounding zone I, is not damaged, and zone III is mainly under vertical compression deformation. Under the considered partitioning conditions, the end-bearing capacity of piles is intended to be computed based on the following assumptions:
  • The end-bearing capacity of piles is independent of the pile shaft resistance; that is, the pile shaft resistance does not affect the stress state at the boundary of the failure zone;
  • When the pile tip resistance reaches the ultimate state, the failure zone around the pile tip is limited below the pile end plane;
  • When the pile tip resistance reaches the ultimate state, the boundary between zone I and zone II is in the passive state;
  • Soil obeys a non-associated flow rule that takes into account the difference between the dilation angle and the soil friction angle.
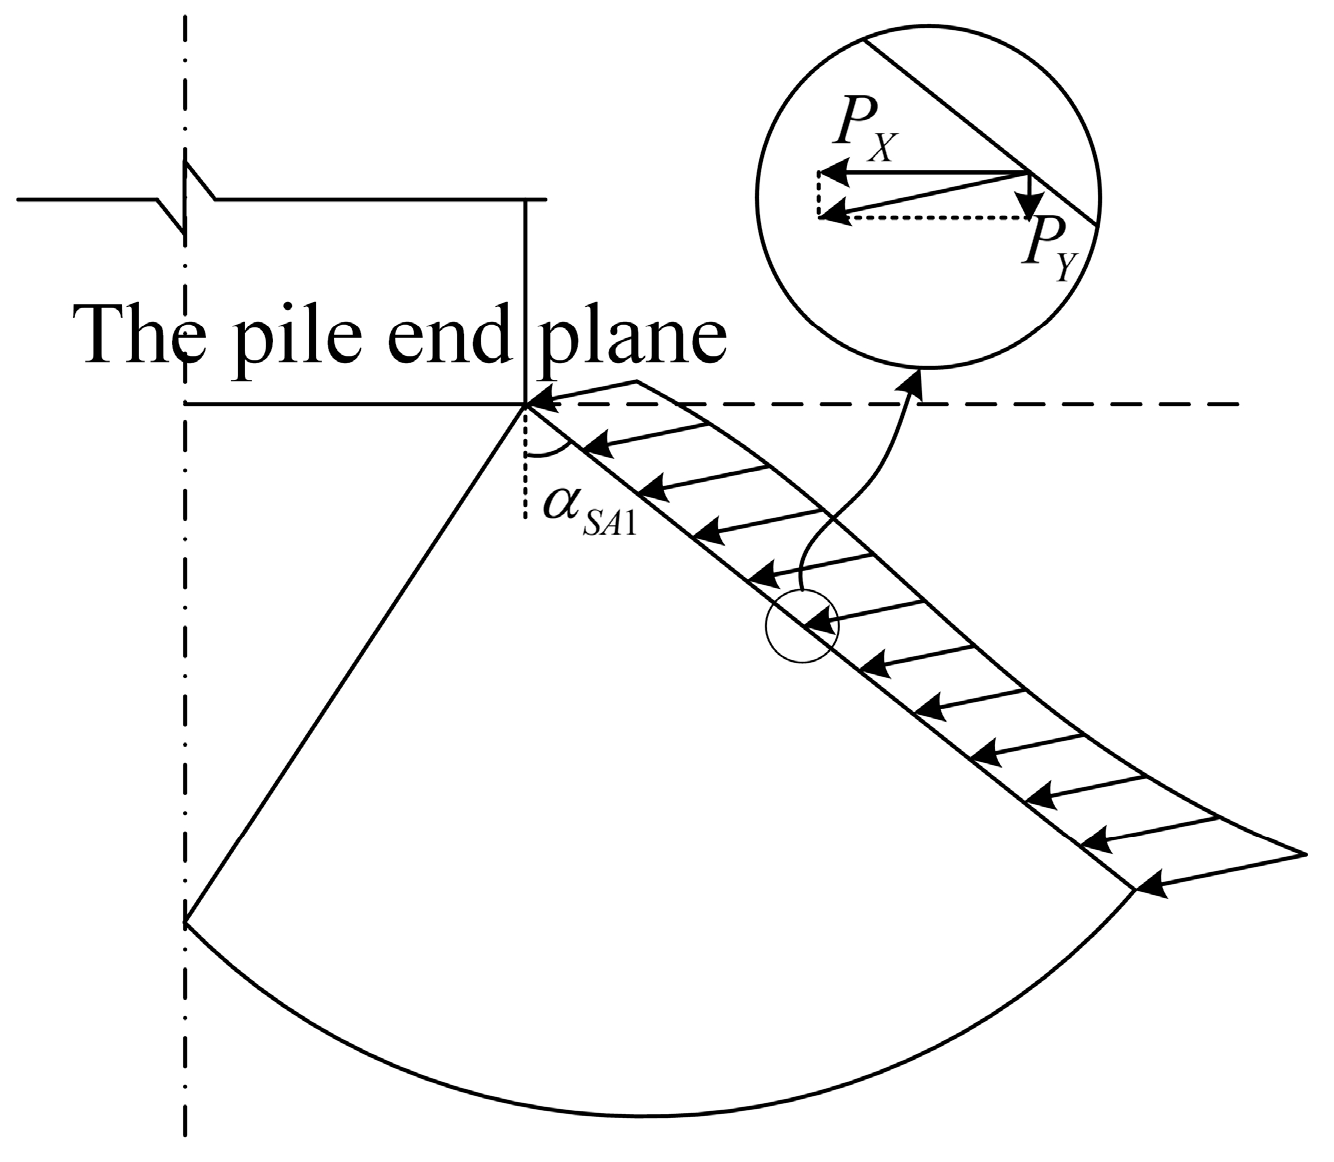
The stress boundary condition at the boundary of the failure zone limited below the pile end plane is shown in Figure 2b. P Y represents the vertical load acting on the boundary of the failure zone, and P X represents the horizontal load acting on the boundary of the failure zone.

3. Numerical Solution Procedure

3.1. The Governing Equation of the Soil Around the Pile Tip

The failure zone below the pile end plane is determined by the zero-extension line combined with the assumed failure pattern mentioned above and the boundary conditions. Investigating the end-bearing capacity of a single pile shown in Figure 3, the governing equation of soil element around the pile tip in the cylindrical coordinate system r , θ , z can be written as follows:
σ r r + τ r z z + σ r σ θ r = 0 τ r z r + σ z z + τ r z r γ = 0 ,
where σ r , σ z , σ θ , and τ r z are components of the stresses; and γ is the soil unit weight.
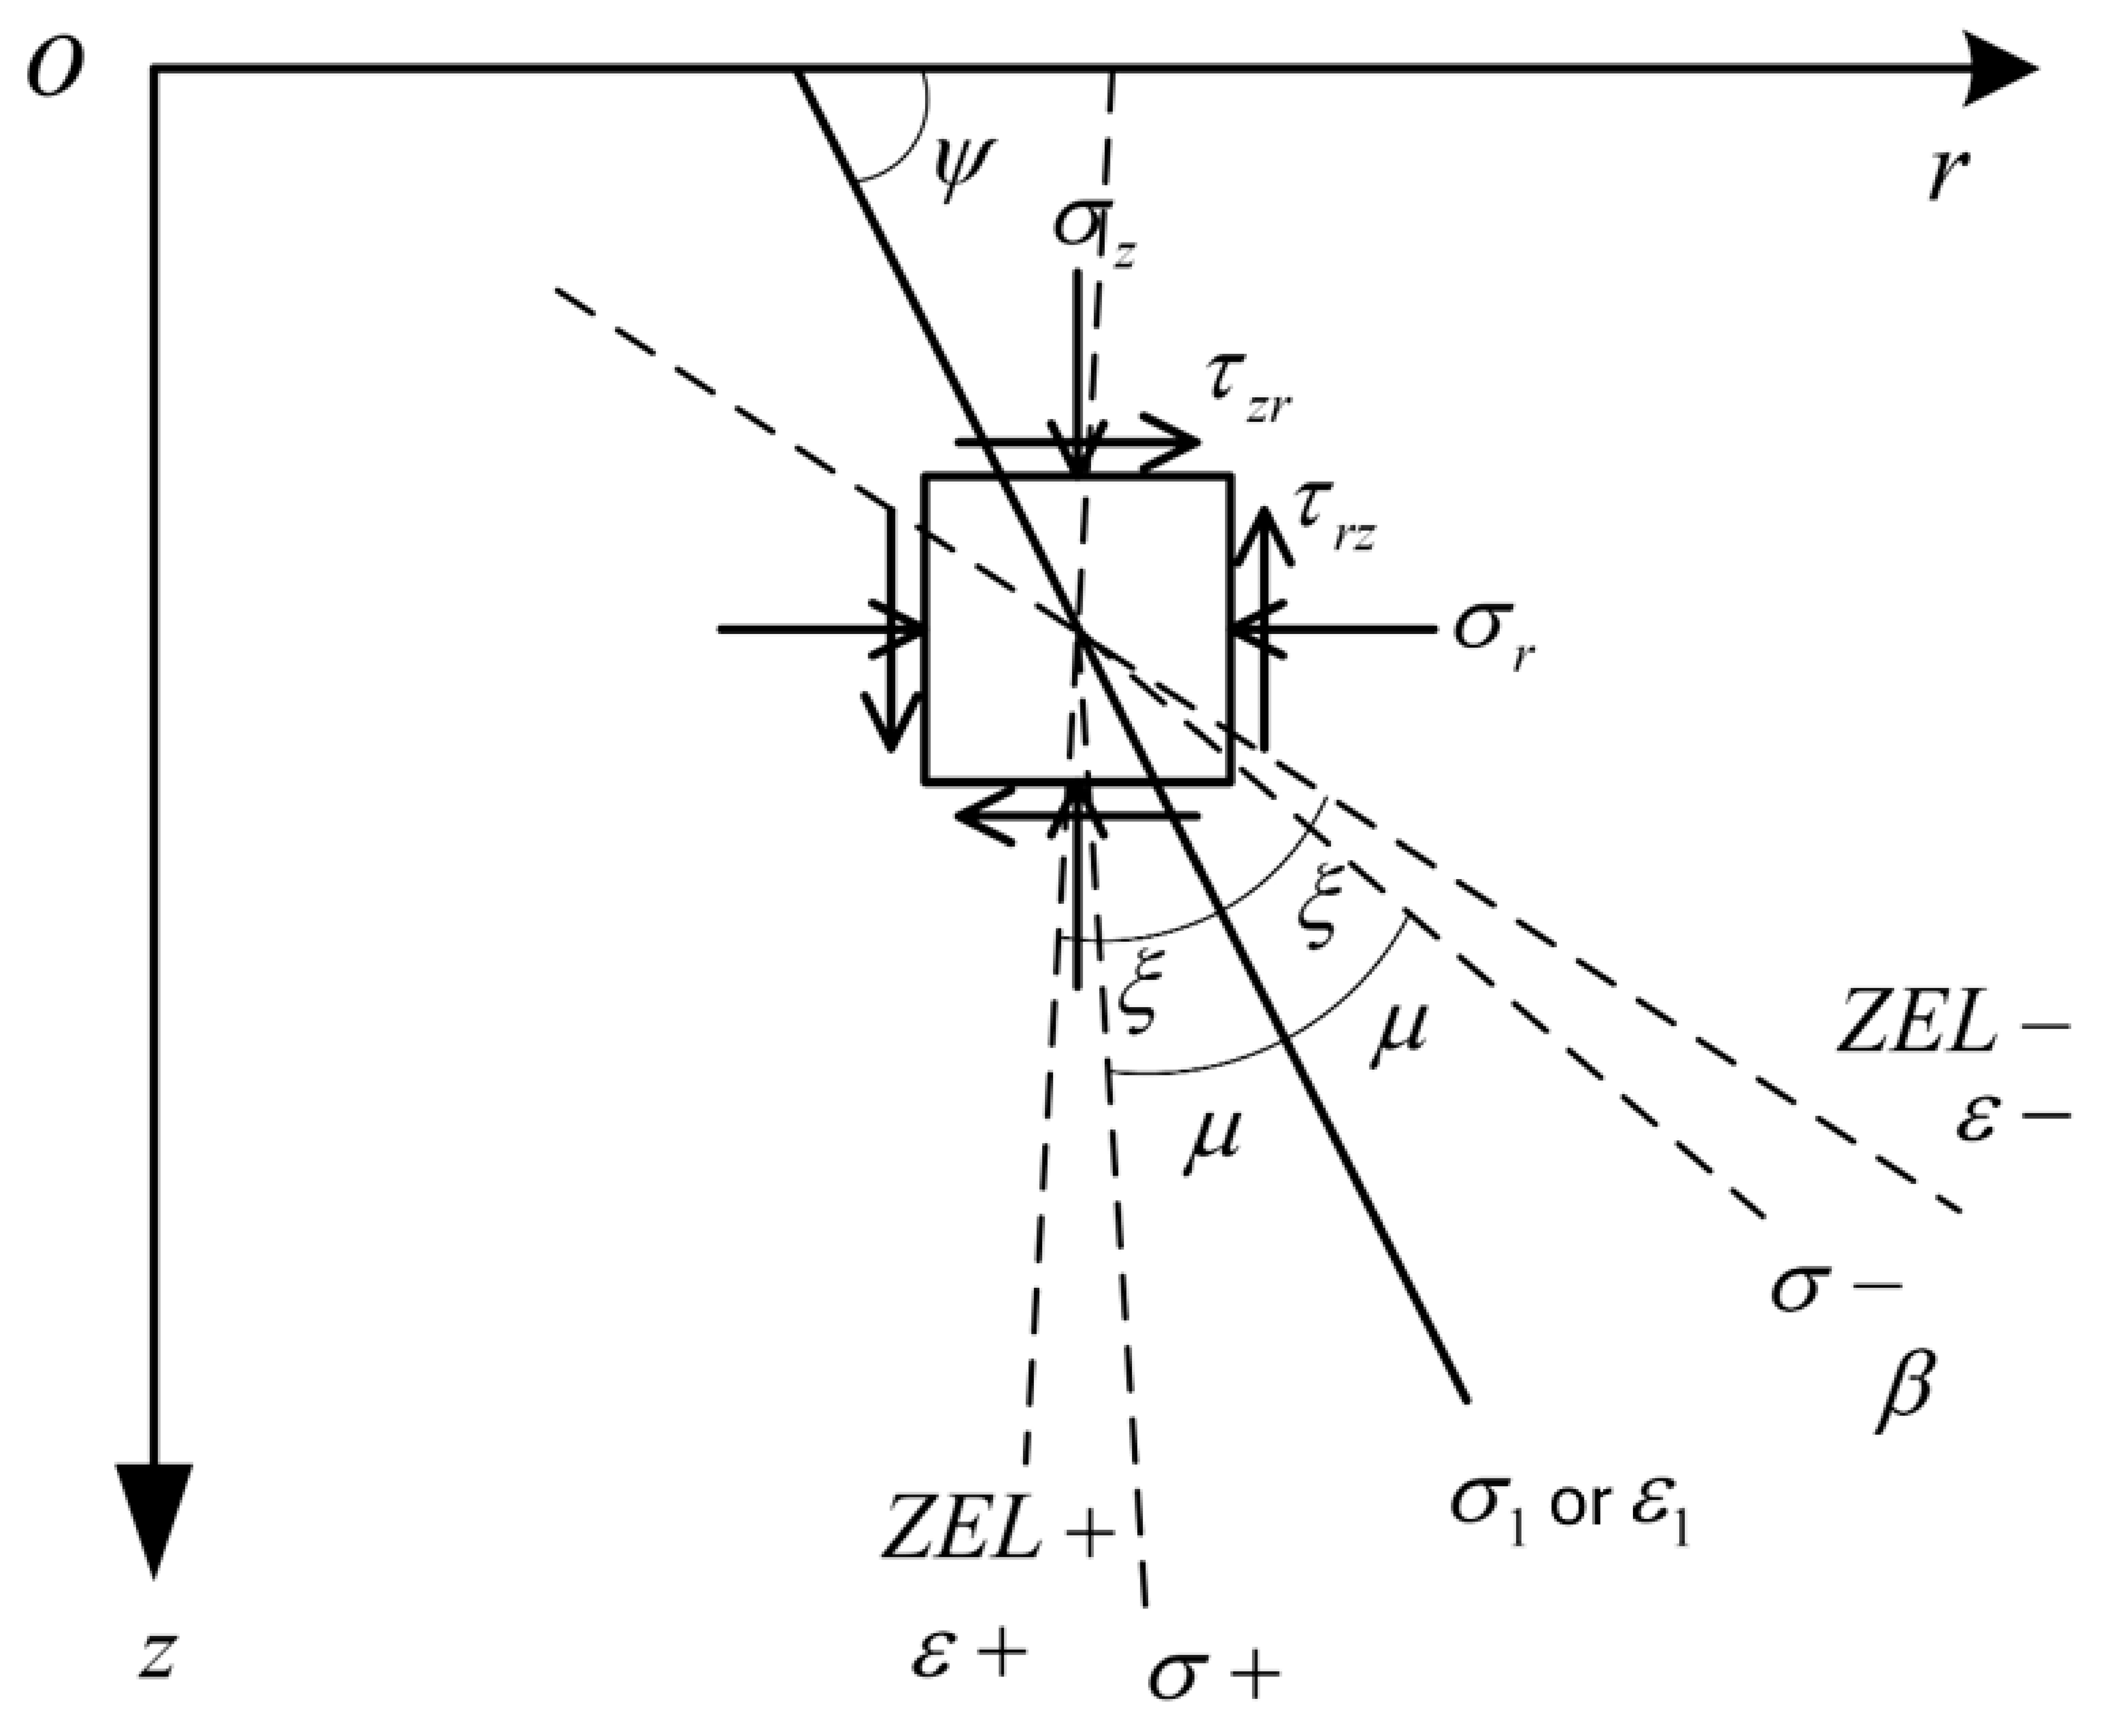
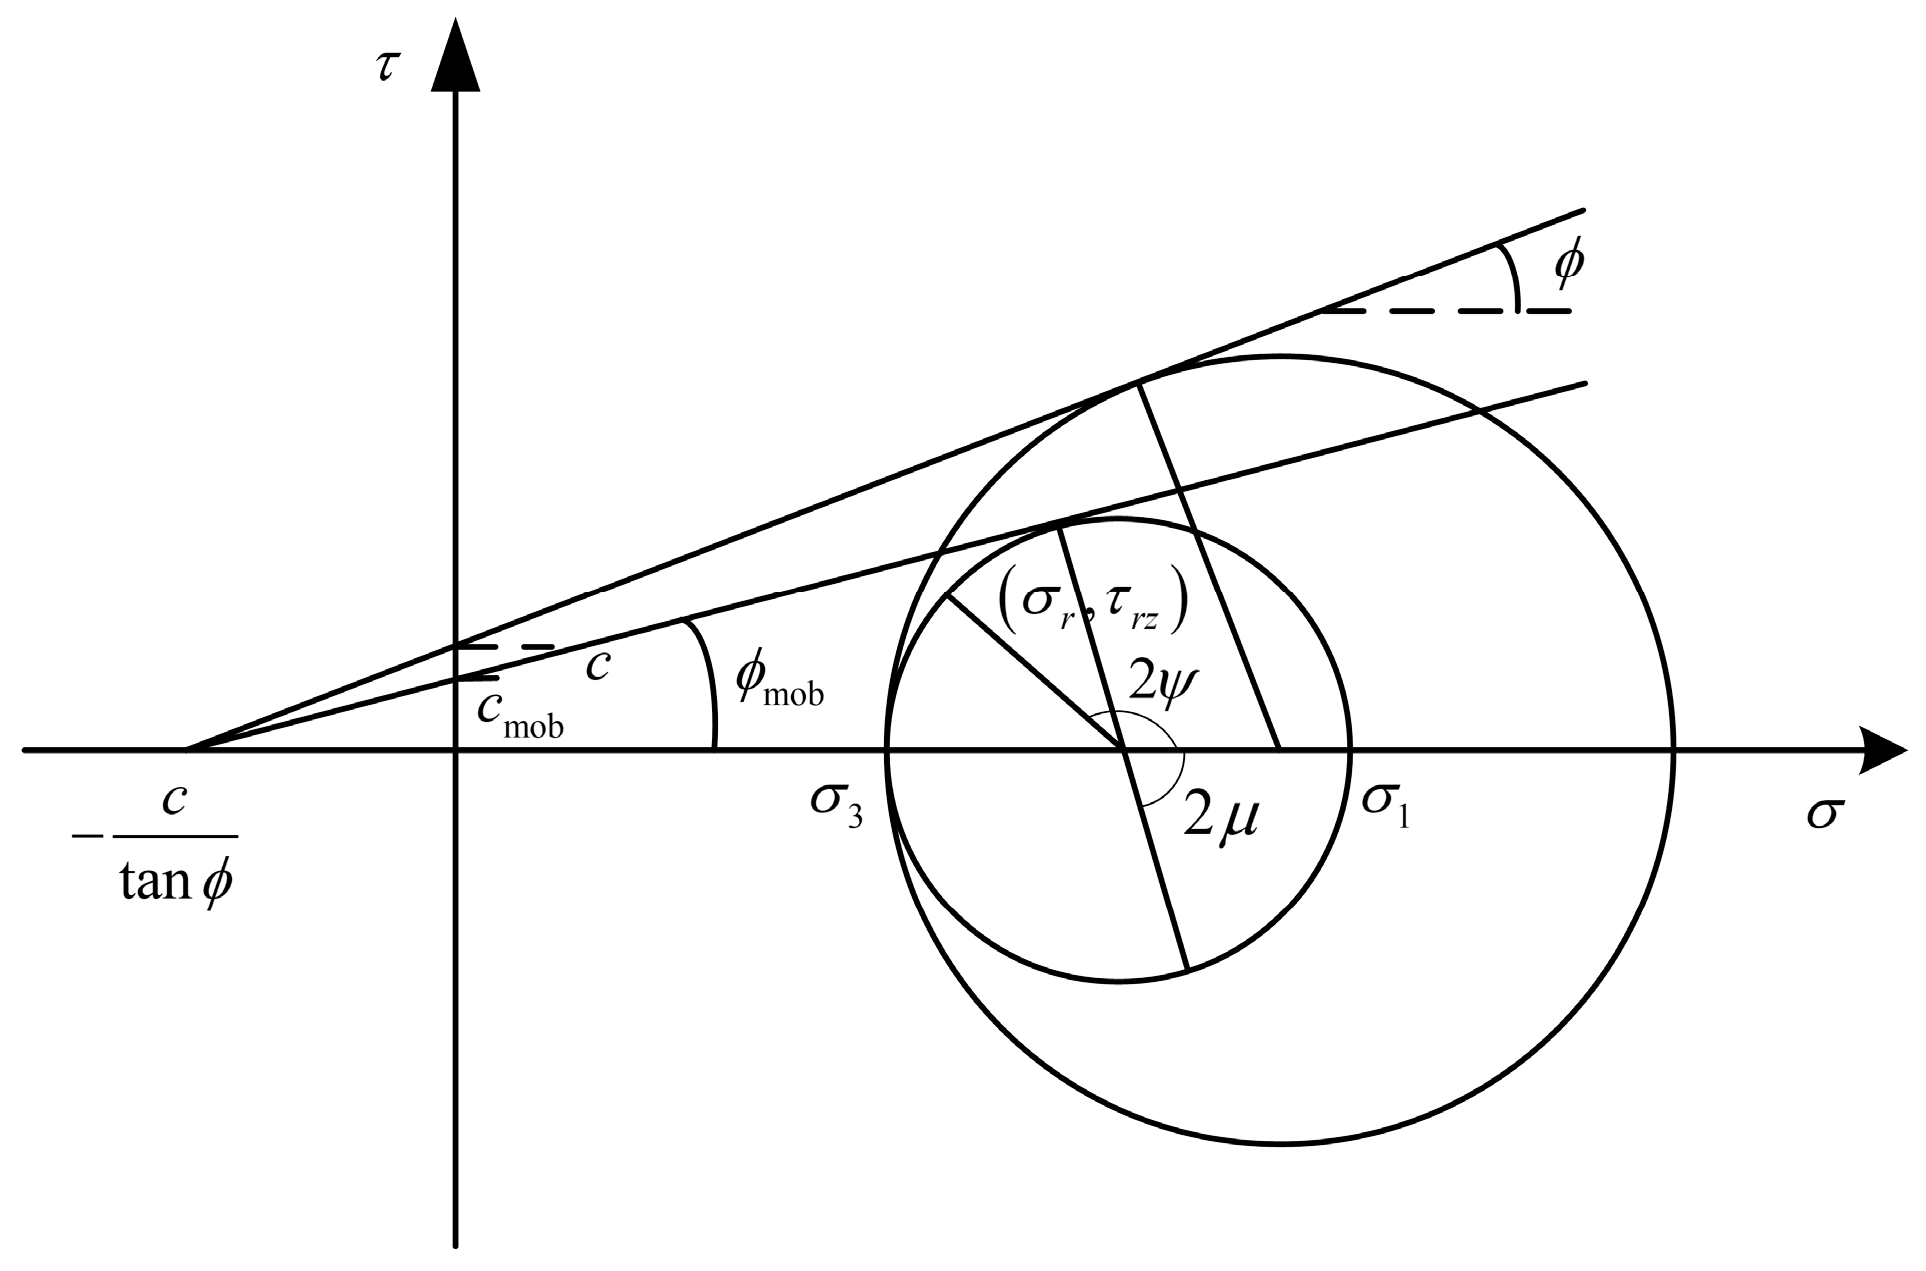
The state of stress at a point is shown in Figure 4 and Figure 5. Using the Mohr–Coulomb yield criterion, the components of the stresses can be written as follows, with the assumption of σ θ being equal to the minor principal stress [24]:
σ z = σ R cos 2 ψ = σ 1 sin ϕ cos 2 ψ c cos ϕ cos 2 ψ σ r = σ + R cos 2 ψ = σ 1 + sin ϕ cos 2 ψ + c cos ϕ cos 2 ψ τ r z = R sin 2 ψ = τ z r = σ sin ϕ sin 2 ψ + c cos ϕ sin 2 ψ σ θ = σ 3 = σ R = σ 1 sin ϕ c cos ϕ ,
where σ is the mean stress ( σ = σ r + σ z / 2 = σ 1 + σ 3 / 2 ), R is the radius of the Mohr stress circle ( R = σ 1 σ 3 / 2 ), ψ is the angle between the direction of the major principal stress and the positive direction of the r -axis, ϕ is the mobilized friction angle, and c is the soil cohesion intercept. Substituting Equation (2) in Equation (1), the governing equation expressed in terms of σ and R is obtained as follows:
σ r + R r cos 2 ψ + R z sin 2 ψ + 2 R sin 2 ψ ψ r + cos 2 ψ ψ z = R r 1 + cos 2 ψ σ z + R r sin 2 ψ R z cos 2 ψ + 2 R cos 2 ψ ψ r + sin 2 ψ ψ z = γ R r sin 2 ψ ,
The zero-extension line along which the linear incremental strain is zero is defined by two families that intersect with the direction of major principal stress at ξ , as shown in Figure 4. The equations for the zero-extension line can be written as follows:
+ Z E L d i r e c t i o n : d z d r = tan ψ + ζ Z E L d i r e c t i o n : d z d r = tan ψ ζ ,
where ξ = π / 4 v / 2 and v is the dilation angle.
The ZEL net can be constructed by simultaneously solving the soil governing Equation (3) and the ZEL Equation (4) from the boundary between zone I and zone II to the boundary between the rigid cone and zone I. The finite-difference method is used to solve these equations and the difference forms of these equations are derived to obtain the position and stress information of the node in the failure zone.
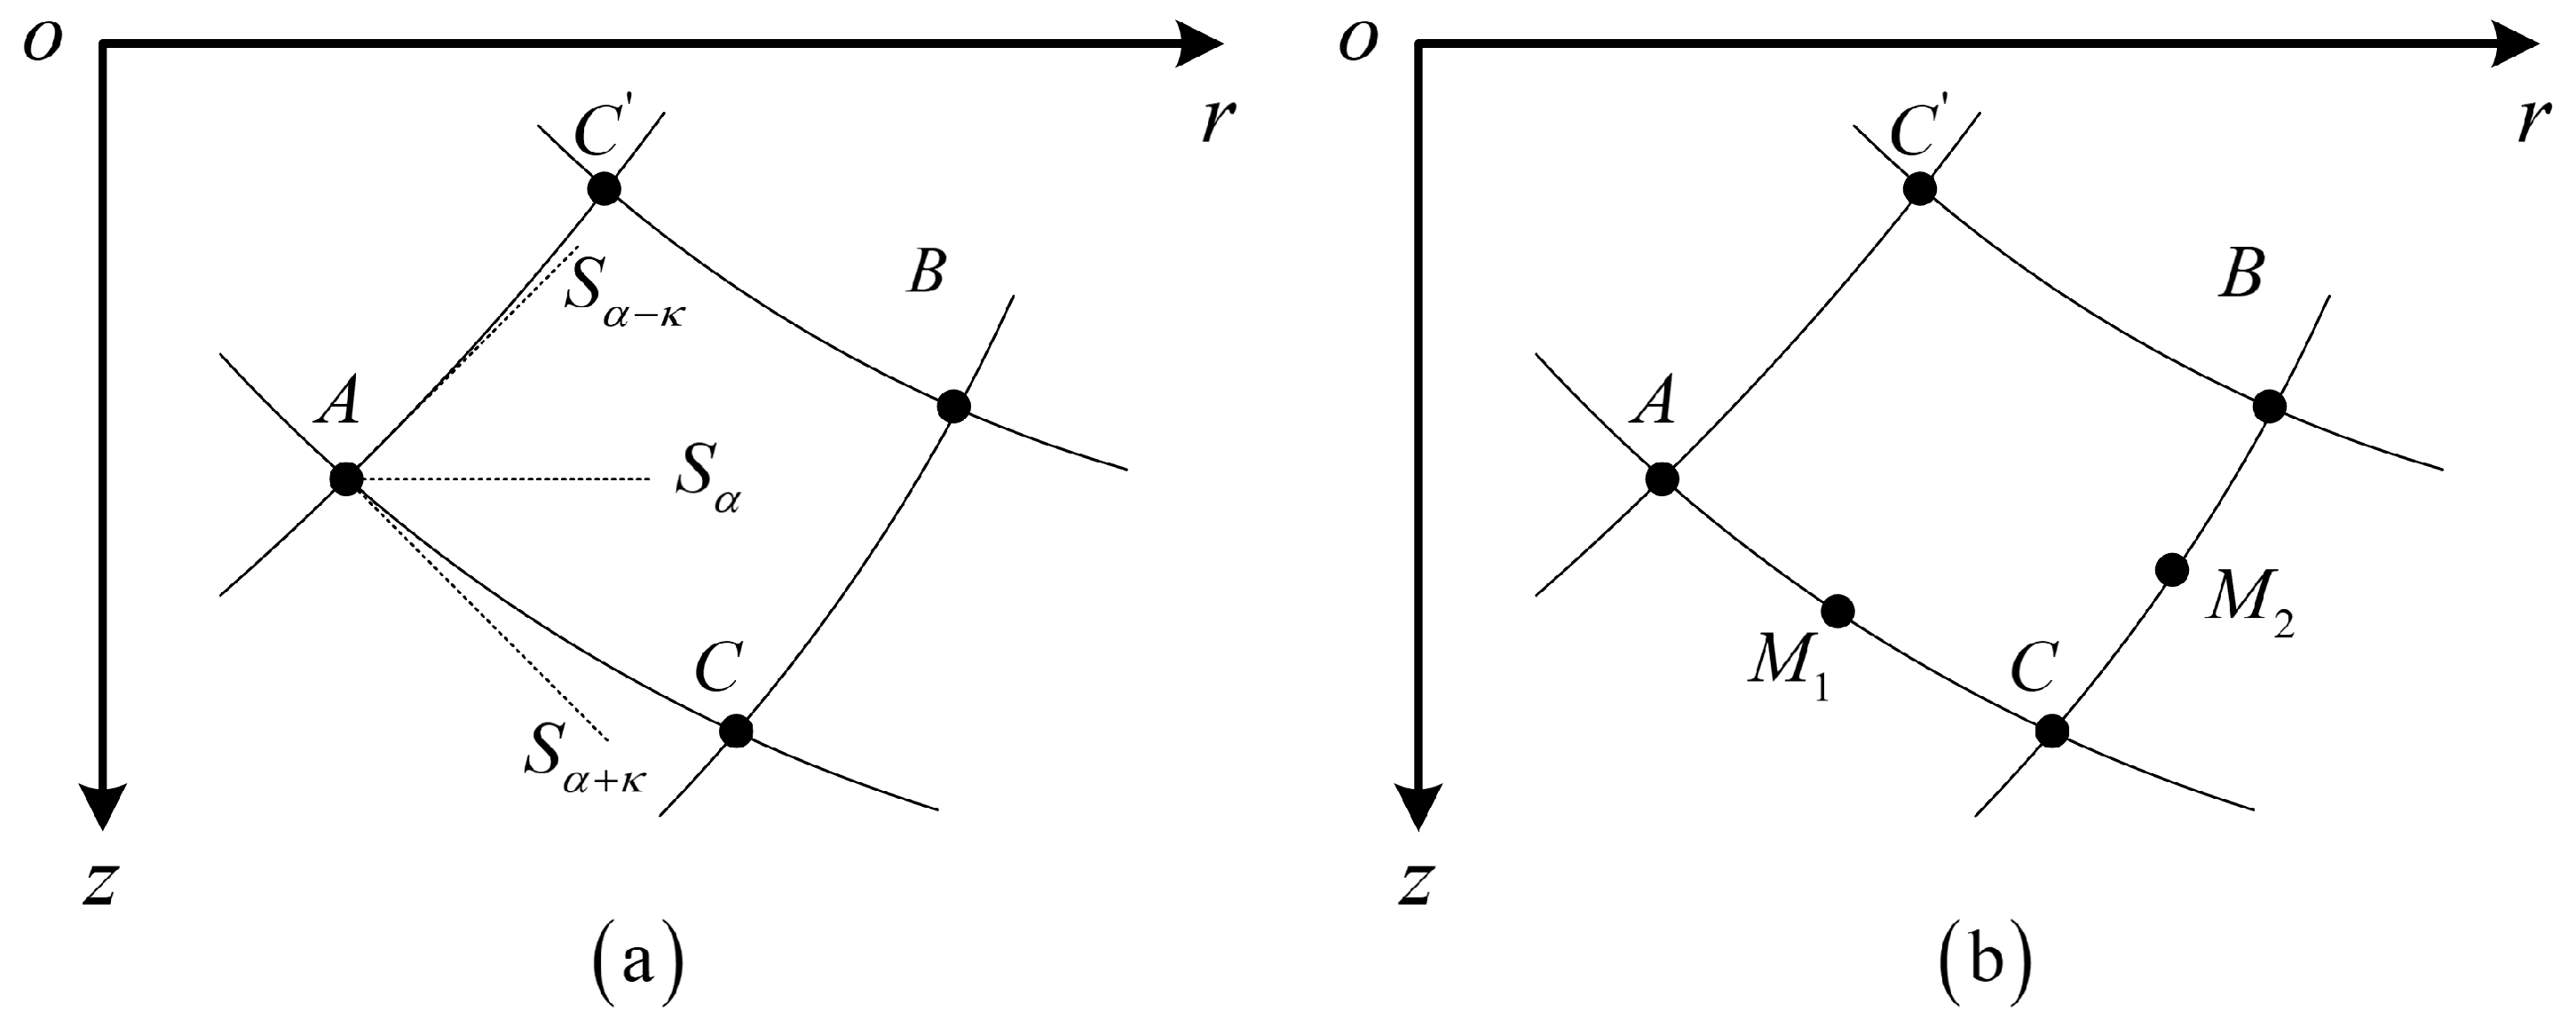
Using the directional derivative rule (5), the governing equation along any curve coordinate S α + κ S α κ at the computing node shown in Figure 6a can be written as Equation (6):
F r = 1 sin 2 κ sin α + κ F S α κ sin α κ F S α + κ F z = 1 sin 2 κ cos α + κ F S α κ + cos α κ F S α + κ ,
σ S α + κ 1 sin 2 κ R S α κ sin 2 ψ 2 α 2 κ R S α + κ sin 2 ψ 2 α 2 R sin 2 κ ψ S α κ cos 2 ψ 2 α 2 κ ψ S α + κ cos 2 ψ 2 α = f r cos α + κ + f z sin α + κ σ S α κ 1 sin 2 κ R S α κ sin 2 ψ 2 α R S α + κ sin 2 ψ 2 α + 2 κ 2 R sin 2 κ ψ S α κ cos 2 ψ 2 α ψ S α + κ cos 2 ψ 2 α + 2 κ = f r cos α κ + f z sin α κ ,
where α is the angle between the angular bisector and the positive direction of the r -axis, κ is the angle between the curve coordinate direction and the angular bisector, f r = R / r 1 + cos 2 ψ , and f z = γ R / r sin 2 ψ . The governing Equation (6) describes the variation of stress state variables σ , R , ψ along curve coordinate direction S α + κ and S α κ .
To calculate the position and stress information σ , R , ψ , r , z of an unknown node from the known nodes, the discrete form of the governing equation is then derived. For the known nodes A and B and node C to be calculated as shown in Figure 6b, the midpoint M1 of AC in the curve coordinate S α A + κ A S α A κ A and the midpoint M2 of BC in the curve coordinate S α B + κ B S α B κ B are selected to make a center difference scheme. The difference formulas are shown in Equations (7) and (8):
σ S α M 1 + κ M 1 = σ C σ A Δ A C , R S α M 1 + κ M 1 = R C R A Δ A C , ψ S α M 1 + κ M 1 = ψ C ψ A Δ A C ,
σ S α M 2 κ M 2 = σ C σ B Δ B C , R S α M 2 κ M 2 = R C R B Δ B C , ψ S α M 2 κ M 2 = ψ C ψ B Δ B C ,
Substituting Equations (7) and (8) in (6), the discrete governing equation is obtained as follows:
σ C σ A Δ A C 1 sin 2 κ M 1 R C R B Δ B C sin 2 ψ M 1 2 α M 1 2 κ M 1 R C R A Δ A C sin 2 ψ M 1 2 α M 1 + 2 R M 1 sin 2 κ M 1 ψ C ψ B Δ B C cos 2 ψ M 1 2 α M 1 2 κ M 1 + ψ C ψ A Δ A C cos 2 ψ M 1 2 α M 1 = f r M 1 cos α M 1 + κ M 1 + f z M 1 sin α M 1 + κ M 1 σ C σ B Δ B C 1 sin 2 κ M 2 R C R B Δ B C sin 2 ψ M 2 2 α M 2 R C R A Δ A C sin 2 ψ M 2 2 α M 2 + 2 κ M 2 + 2 R M 2 sin 2 κ M 2 ψ C ψ B Δ B C cos 2 ψ M 2 2 α M 2 + ψ C ψ A Δ A C cos 2 ψ M 2 2 α M 2 + 2 κ M 2 = f r M 2 cos α M 2 κ M 2 + f z M 2 sin α M 2 κ M 2 ,
When the curve coordinate system is selected as S ψ + ξ S ψ ξ , that is, in Equation (9), α is taken as the angle ψ between the direction of the major principal stress at the ultimate state and the positive direction of the r -axis, and κ is taken as the angle ξ between the zero-extension line and the direction of the major principal stress at the ultimate state, the discrete form of the governing equation along the zero-extension line is finally obtained as follows:
σ C σ A Δ A C + R C R B Δ B C + 2 R M 1 sin 2 ξ ψ C ψ B Δ B C cos 2 ξ + ψ C ψ A Δ A C = f r M 1 cos α M 1 + κ M 1 + f z M 1 sin α M 1 + κ M 1 σ C σ B Δ B C + R C R A Δ A C + 2 R M 2 sin 2 ξ ψ C ψ B Δ B C + ψ C ψ A Δ A C cos 2 ξ = f r M 2 cos α M 2 κ M 2 + f z M 2 sin α M 2 κ M 2 ,
The iterative method can be used to solve Equation (10) and the difference form of the ZEL equations. The ultimate toe capacity means the vertical resultant force acting on the boundary of cone. Converting the calculation results σ , R , ψ of the computing node at the lateral boundary of the cone into the stress components σ z , σ r , τ z , σ θ , the ultimate toe capacity can be obtained by integrating the stress component σ z of the computing node at the contact boundary.

3.2. Contact Boundary Condition

According to Meyerhof [6], a rigid cone was formed and stabilized beneath the foundation at the ultimate state, with the lateral boundary of the cone inclined at 45 + ϕ / 2 with respect to the minus horizontal direction. This article considers a same contact boundary condition and assumes that the frictional resistance at the boundary of cone is fully mobilized at the ultimate state. The direction of the major principal stress at the contact boundary is vertical downward, as shown in Figure 7.

3.3. Stress Boundary Condition

Based on the assumptions in Section 2, the stress boundary conditions shown in Figure 8 are considered. The stress condition at the boundary of the failure zone is considered as an equivalent frictional contact, and the equivalent frictional strength is assumed to be fully mobilized.
Without considering the effect of the pile shaft resistance on the stress state at the boundary of the failure zone, assuming that the vertical load acting on the boundary of the failure zone is equivalent to the weight of the overlying soil, the vertical load can be written as follows:
P Y = i = 1 n 1 γ i H i + γ n L i = 1 n 1 H i ,
where γ i is the effective unit weight of each soil layer above the pile end, H i is the thickness of each soil layer above the pile end, and L is the depth of computing node at the boundary.
The assumption that the equivalent frictional strength is fully mobilized requires that the shear stress σ τ and the normal stress σ n of the computing node at the boundary meet the following conditions:
σ τ σ n = tan ϕ ,
Between the external load P Y , P X and the stress components σ τ , σ n , Equation (13) holds:
σ τ = P Y cos α S A 1 + P X sin α S A 1 σ n = P Y sin α S A 1 + P X cos α S A 1 ,
where α S A 1 is the angle between the boundary of the failure zone and the vertical direction.
Combining (11), (12) and (13), the horizontal load P X acting on the boundary of the failure zone can be obtained as follows:
P X = tan ϕ sin α S A 1 + cos α S A 1 P Y + tan ϕ c / tan ϕ max sin α S A 1 tan ϕ cos α S A 1 ,

4. Numerical Analysis and Parameter Determination

The proposed method takes into account the failure zone limited below the pile end plane, as well as the equivalent frictional contact at the boundary of the failure zone, where the equivalent frictional strength is fully mobilized. For the numerical modeling, the parameters friction angle, dilation angle, and inclination angle of the failure zone boundary need to be determined.

4.1. Determination of Soil Strength Parameter ϕ

In this study, the input parameter friction angle ϕ is determined by the method using the CPT data as follows [25]:
ϕ = arctan 0.1 + 0.38 log q c σ v ,
where q c is the arithmetic average of the cone resistance over a zone extending from a depth of 1B beneath the pile toe to a height of 4B above the pile toe (B is the pile diameter), and σ v is the effective vertical stress of the in situ soil at the depth of the pile toe.

4.2. Parameter Analysis

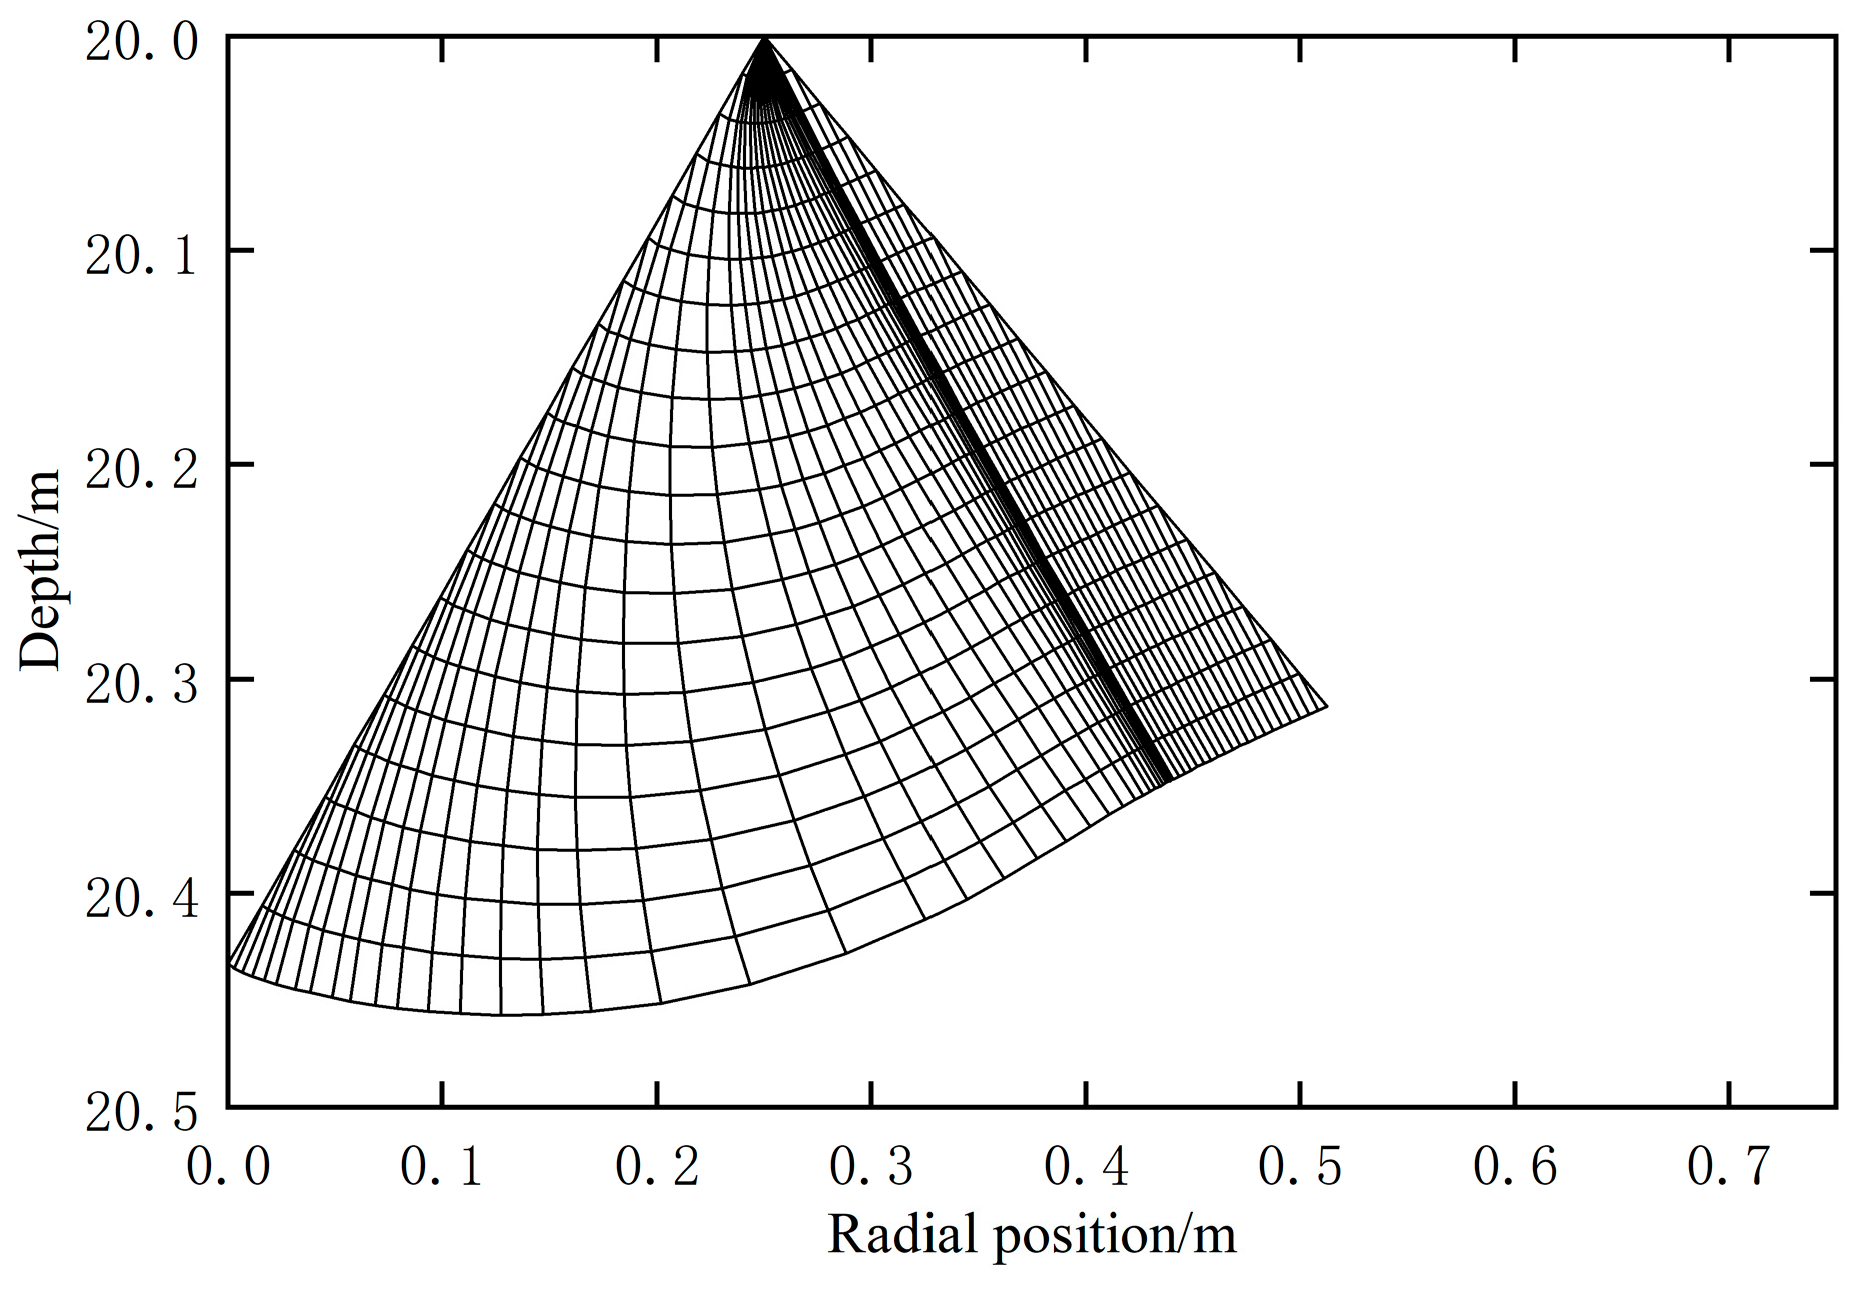
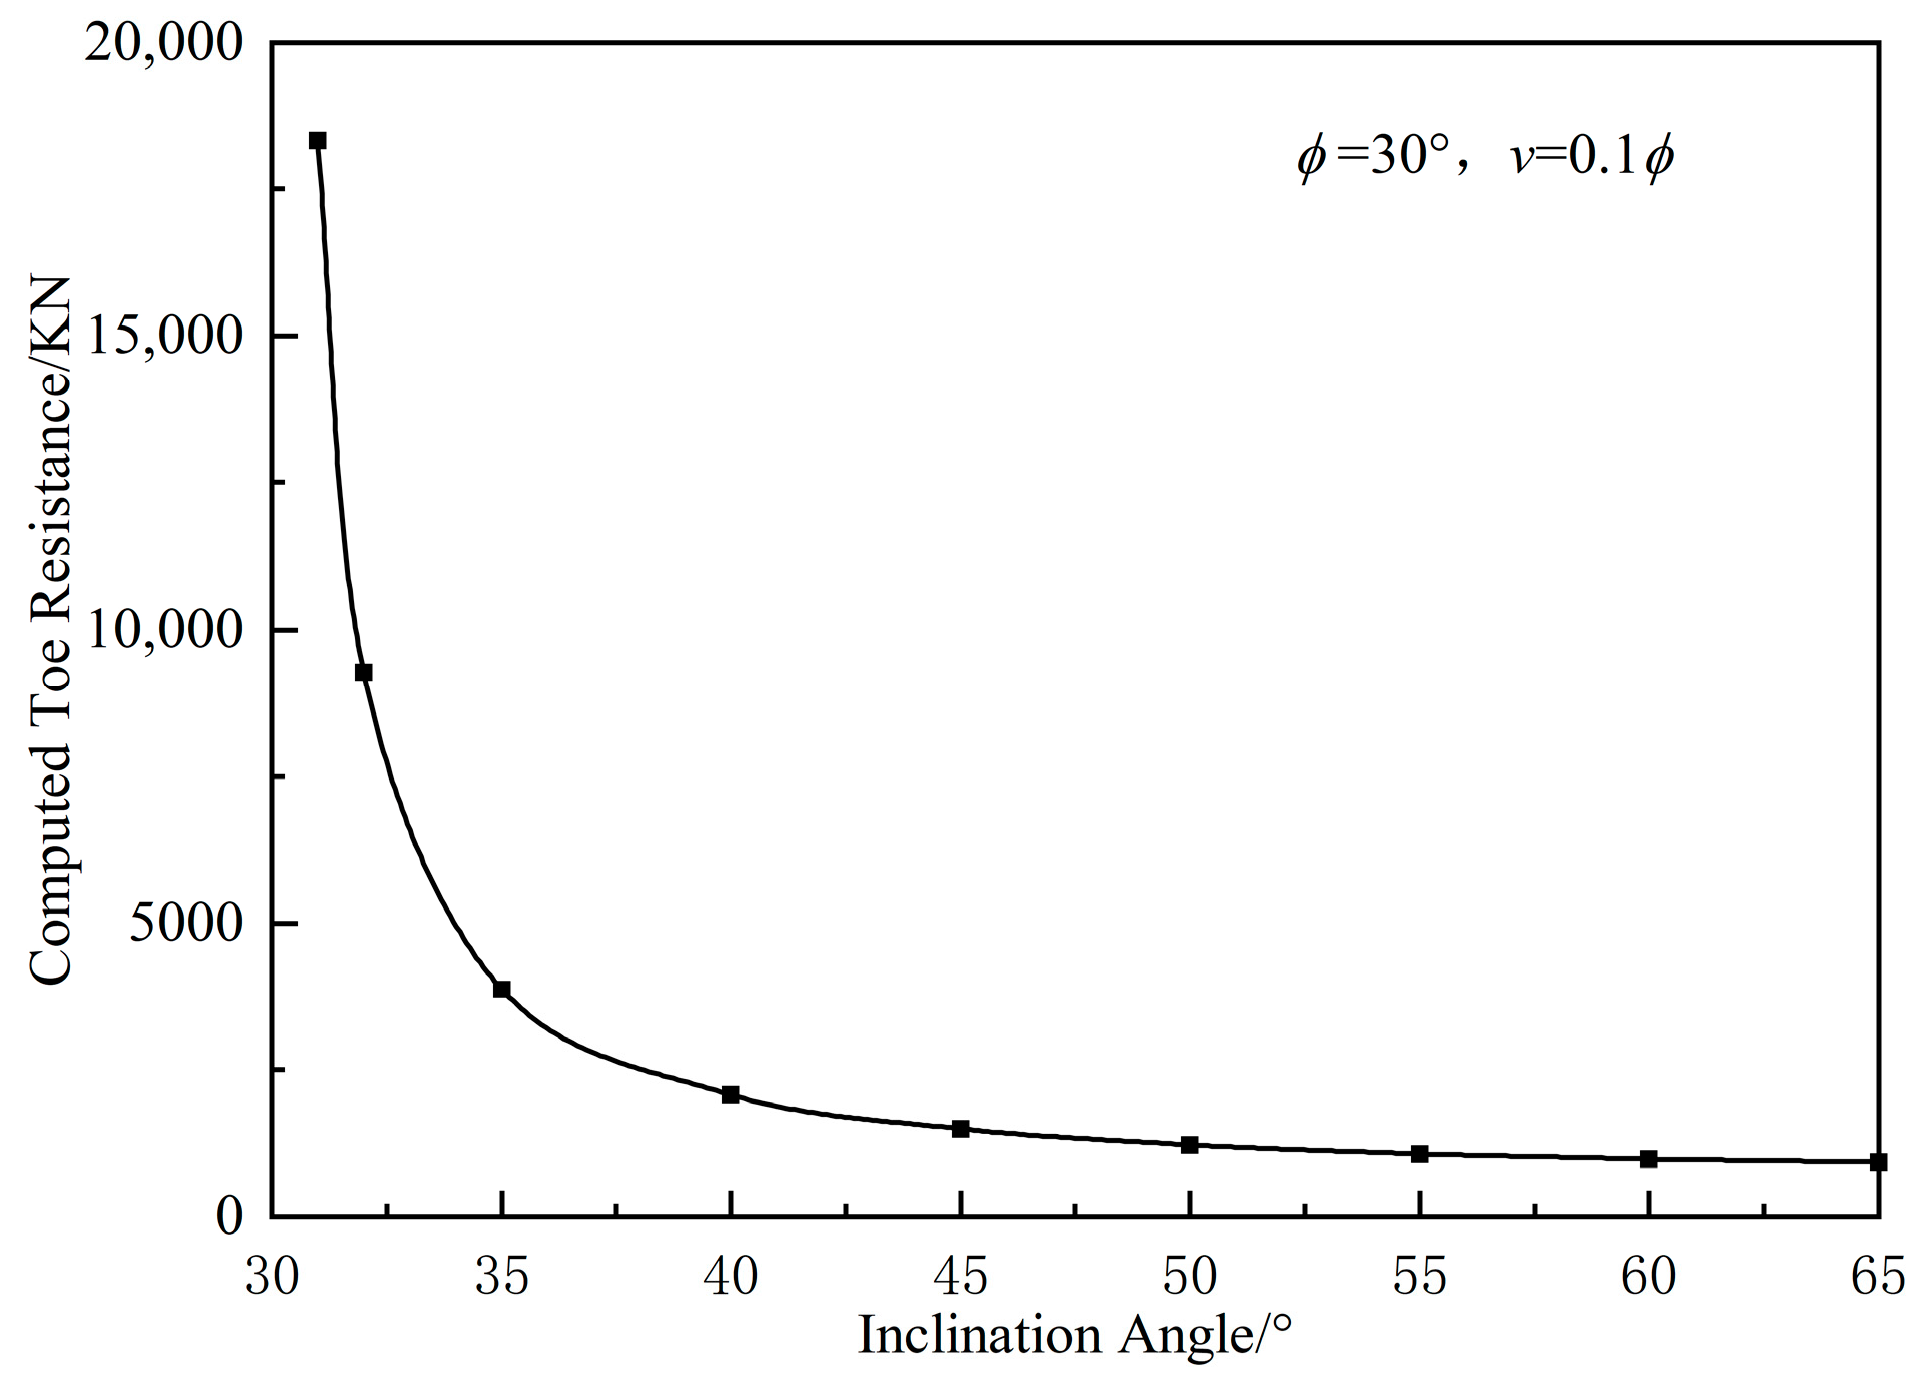
In this section, parameter analysis is conducted to analyze the influence of each parameter on the computation of the ultimate toe capacity. In order to facilitate comparison, pile length = 20 m, pile diameter = 0.5 m, and the unit weight of soil = 19 kN/m3, while groundwater is not considered. Figure 9 shows the ZEL net for an illustrative example. The influence of parameters on the computed ultimate toe capacity is shown in Figure 10, Figure 11 and Figure 12.
Figure 10 presents the influence of the inclination angle of the failure zone boundary on the computed toe capacity. Figure 10 shows that as the inclination angle of the failure zone boundary increases, the computed toe capacity rapidly decreases and trends to a stable value. This is because assuming the equivalent frictional strength is fully mobilized, the inclination angle of the failure zone boundary determines the size of the Mohr stress circle of the point at the failure zone boundary. When the inclination angle of the failure zone boundary decreases, the mean stress and the radius of the Mohr stress circle of the computing nodes at the failure zone boundary increases sharply, resulting in a sharp increase in the calculated vertical force acting on the side of the rigid cone beneath the pile tip.
There should be a specific failure zone at the boundary of which the equivalent frictional strength is fully mobilized at the ultimate state. Any inclination angle greater or less than the angle of this specific failure zone will result in significant errors in the predicted ultimate toe capacity. Therefore, the parameter inclination angle of the failure zone boundary should be further determined by fitting the measured ultimate toe capacity of engineering practice pile cases. However, Figure 10 shows that a larger inclination angle than the actual value is more acceptable because a smaller one will cause a considerable upward deviation of the computed toe capacity from the actual ultimate toe capacity. In the next section, an equation is proposed for calculating the inclination angle of the failure zone boundary and determining the range of the failure zone, in order to achieve good prediction of an engineering practice case.
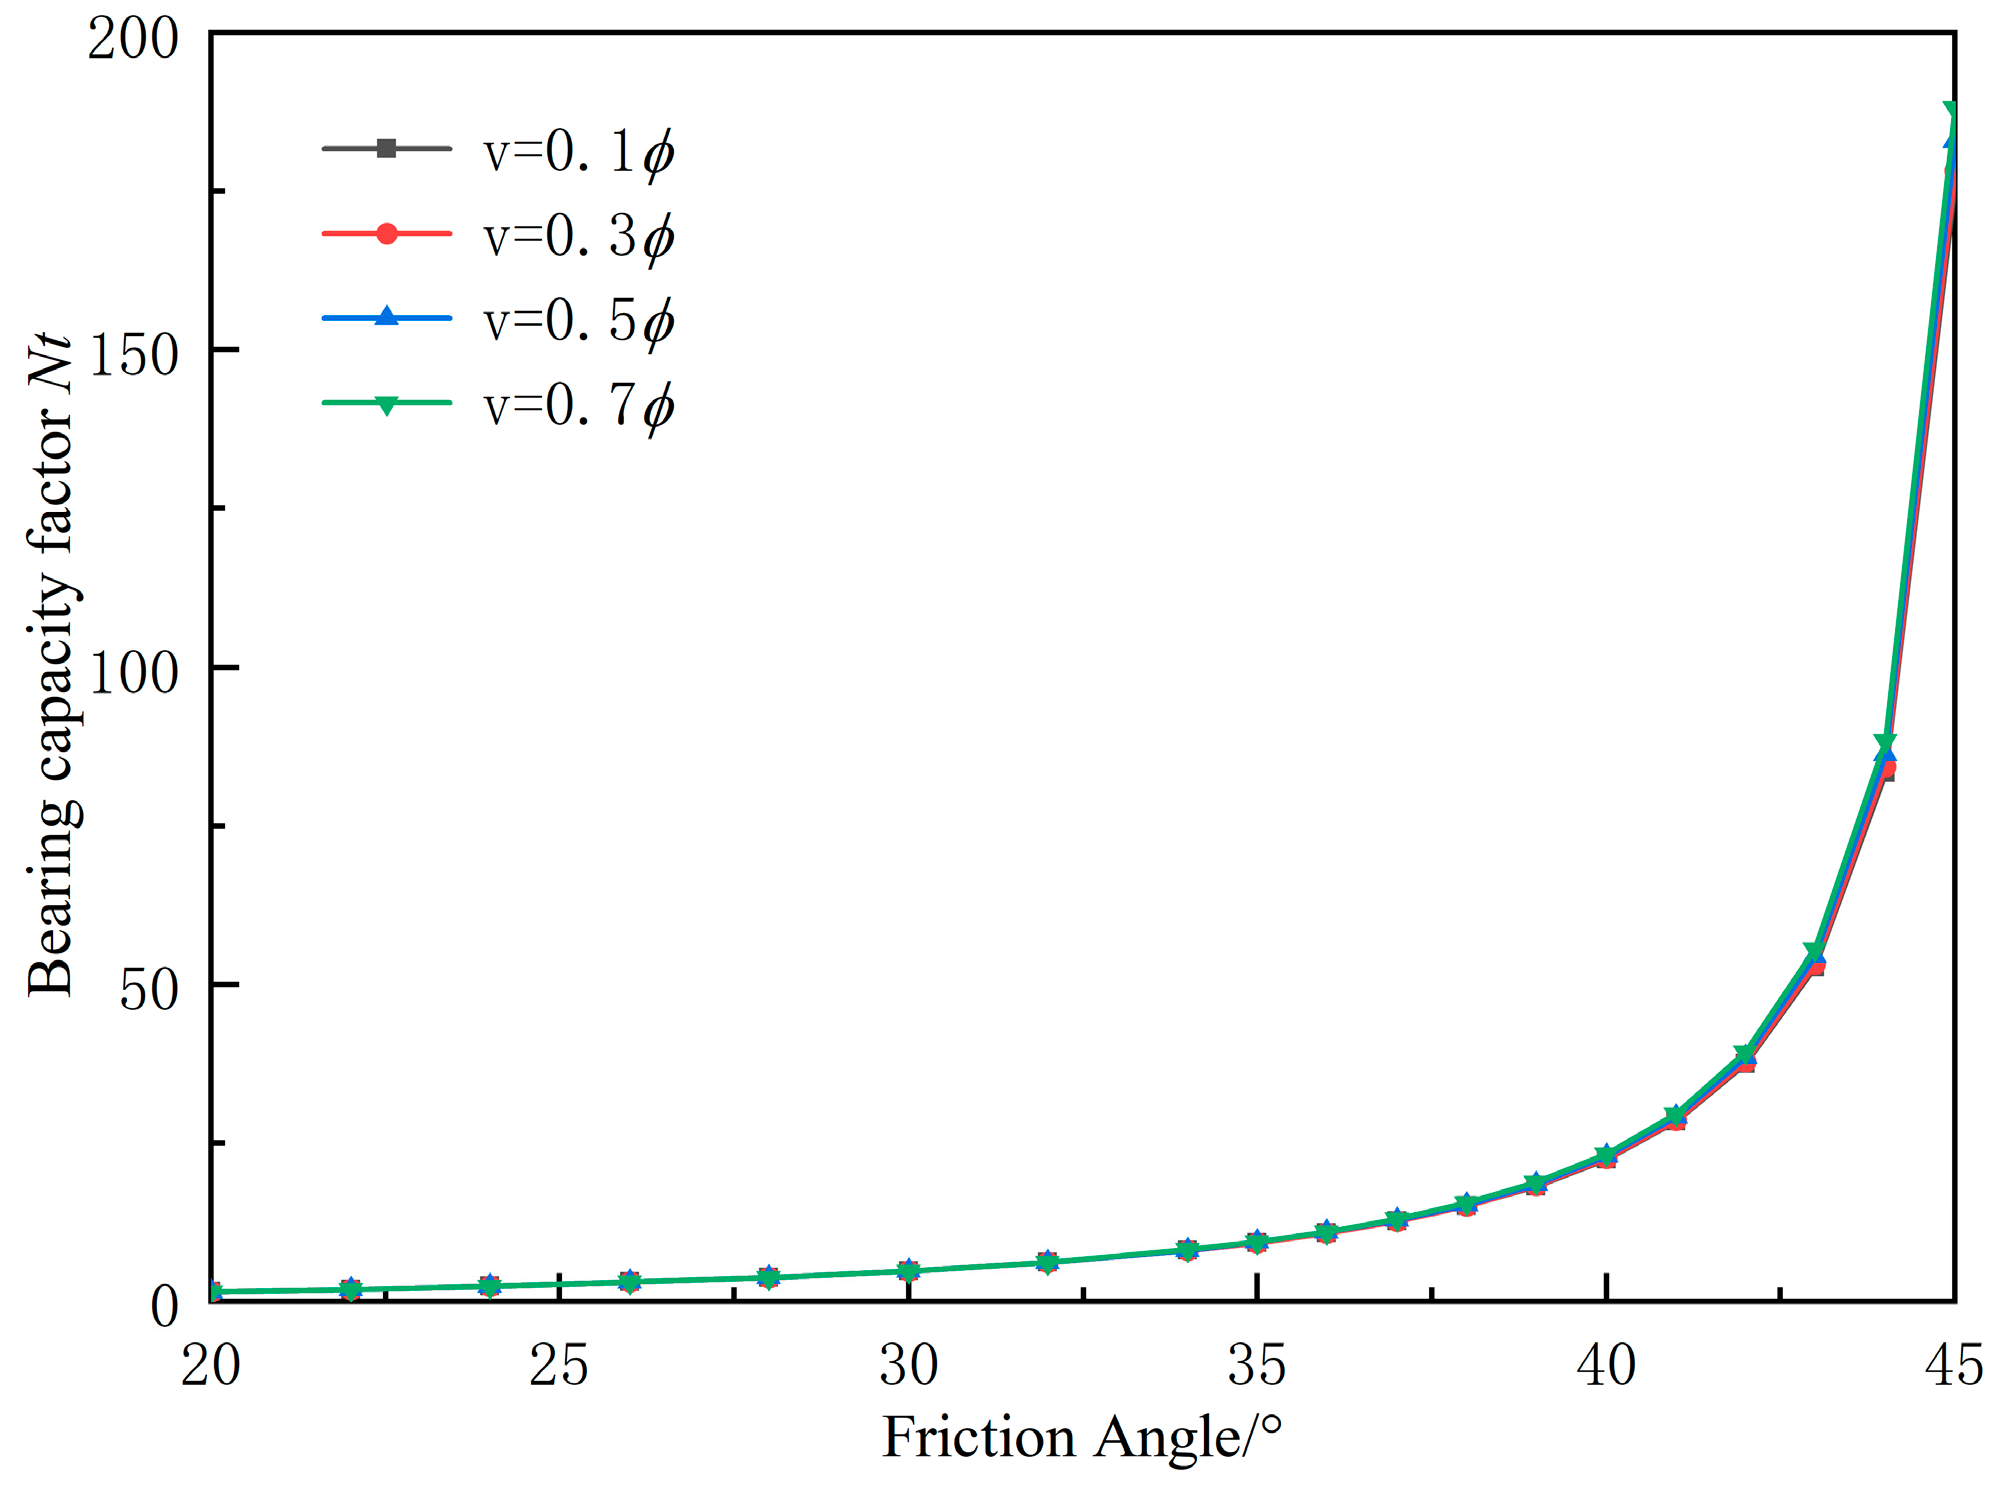
For simplicity, the dilation angle is taken as a constant in the proposed method, although the dilation angle varies in actual situations, such as soil compression processes and shear processes. Figure 11 presents the variation of the computed toe capacity when the dilation angle v is taken as 0.1 ϕ , 0.2 ϕ , 0.3 ϕ , 0.4 ϕ , 0.5 ϕ , 0.6 ϕ , and 0.7 ϕ , respectively. Figure 11 shows that the dilation angle has an impact on the computed toe capacity. As the dilation angle increases, the computed toe capacity increases to a certain extent. This is because in the proposed method, the dilation angle affects the size of the failure zone. As the dilation angle increases, the range of soil with strength fully mobilized increases, leading to a certain degree of increase in the computed toe capacity.
Figure 12 presents the influence of friction angle on the computed toe capacity. It is shown in Figure 12 that as the friction angle increases, the computed toe capacity increases, and the rate of increase becomes faster. In the case of the parameter α S A 1 = 37.5 ° , v = 0.1 ϕ , when the friction angle increases from 18° to 20°, the computed toe capacity increases by about 1.3 times (from 517 kN to 653 kN), and when the friction angle increases from 34° to 36°, the computed toe capacity increases by about 2.6 times (from 7016 kN to 18,085 kN). The strong correlation between the friction angle and the ultimate toe capacity is consistent with previous studies [11].

4.3. Numerical Analysis

In this section, numerical analysis is conducted to analyze the influence of each parameter and determine the value of the dilation angle and the inclination angle of the failure zone boundary.
The toe capacity of a pile R t in sand can be defined in the following equation:
R t = r t A t = N t σ v A t ,
where r t is the unit toe resistance, A t is the cross-sectional area of the pile, and N t is the bearing capacity factor. The bearing capacity factor N t is back-calculated from the above equation and used to analyze the relationship between the computed ultimate toe capacity, the friction angle, the inclination angle, and the dilation angle. Figure 13 gives the relationship between the bearing capacity factor N t and the friction angle under different inclination angles when the dilation angle v = 0.1 ϕ . According to Equation (14), the inclination angle should be larger than the friction angle; hence, each N t - ϕ curve in Figure 13 ends when the friction angle is equal to the inclination angle.
As shown in Figure 13, the capacity factor N t increases with friction angle and different inclination angles make for a different change rate in the bearing capacity factor. When the inclination angle is small, the bearing capacity factor increases faster with the increase in the friction angle, yielding a much higher computed ultimate toe capacity. This article suggests that the inclination angle of the failure zone boundary can be determined by Equation (17) when the influence of the friction angle on the inclination angle is taken into account:
α S A 1 = 36.13 + 4.259 × 10 7 ϕ 4.425 ,
when the friction angle is smaller than 30°, an inclination angle equal to 37.5° will not cause the predicted ultimate toe capacity to deviate too much.
Figure 14 gives the relationship between the bearing capacity factor N t and the friction angle under different dilation angles when the inclination angle α S A 1 = 46 ° . It is shown in Figure 14 that the computed toe capacity increases with dilation angle. When the friction angle is small, the difference caused by the dilation angle is not significant, but as the friction angle increases, the difference begins to increase. Reasonable prediction of the ultimate toe capacity requires an appropriate dilation angle value. For the case of ultimate toe capacity, the soil around the pile tip is actually in a high shear state, corresponding to very small volume change and dilation angle. Following Valikhah et al. [12], the dilation angle is taken as a small value equal to 0.1 ϕ in the subsequent analysis.

5. Case Verification

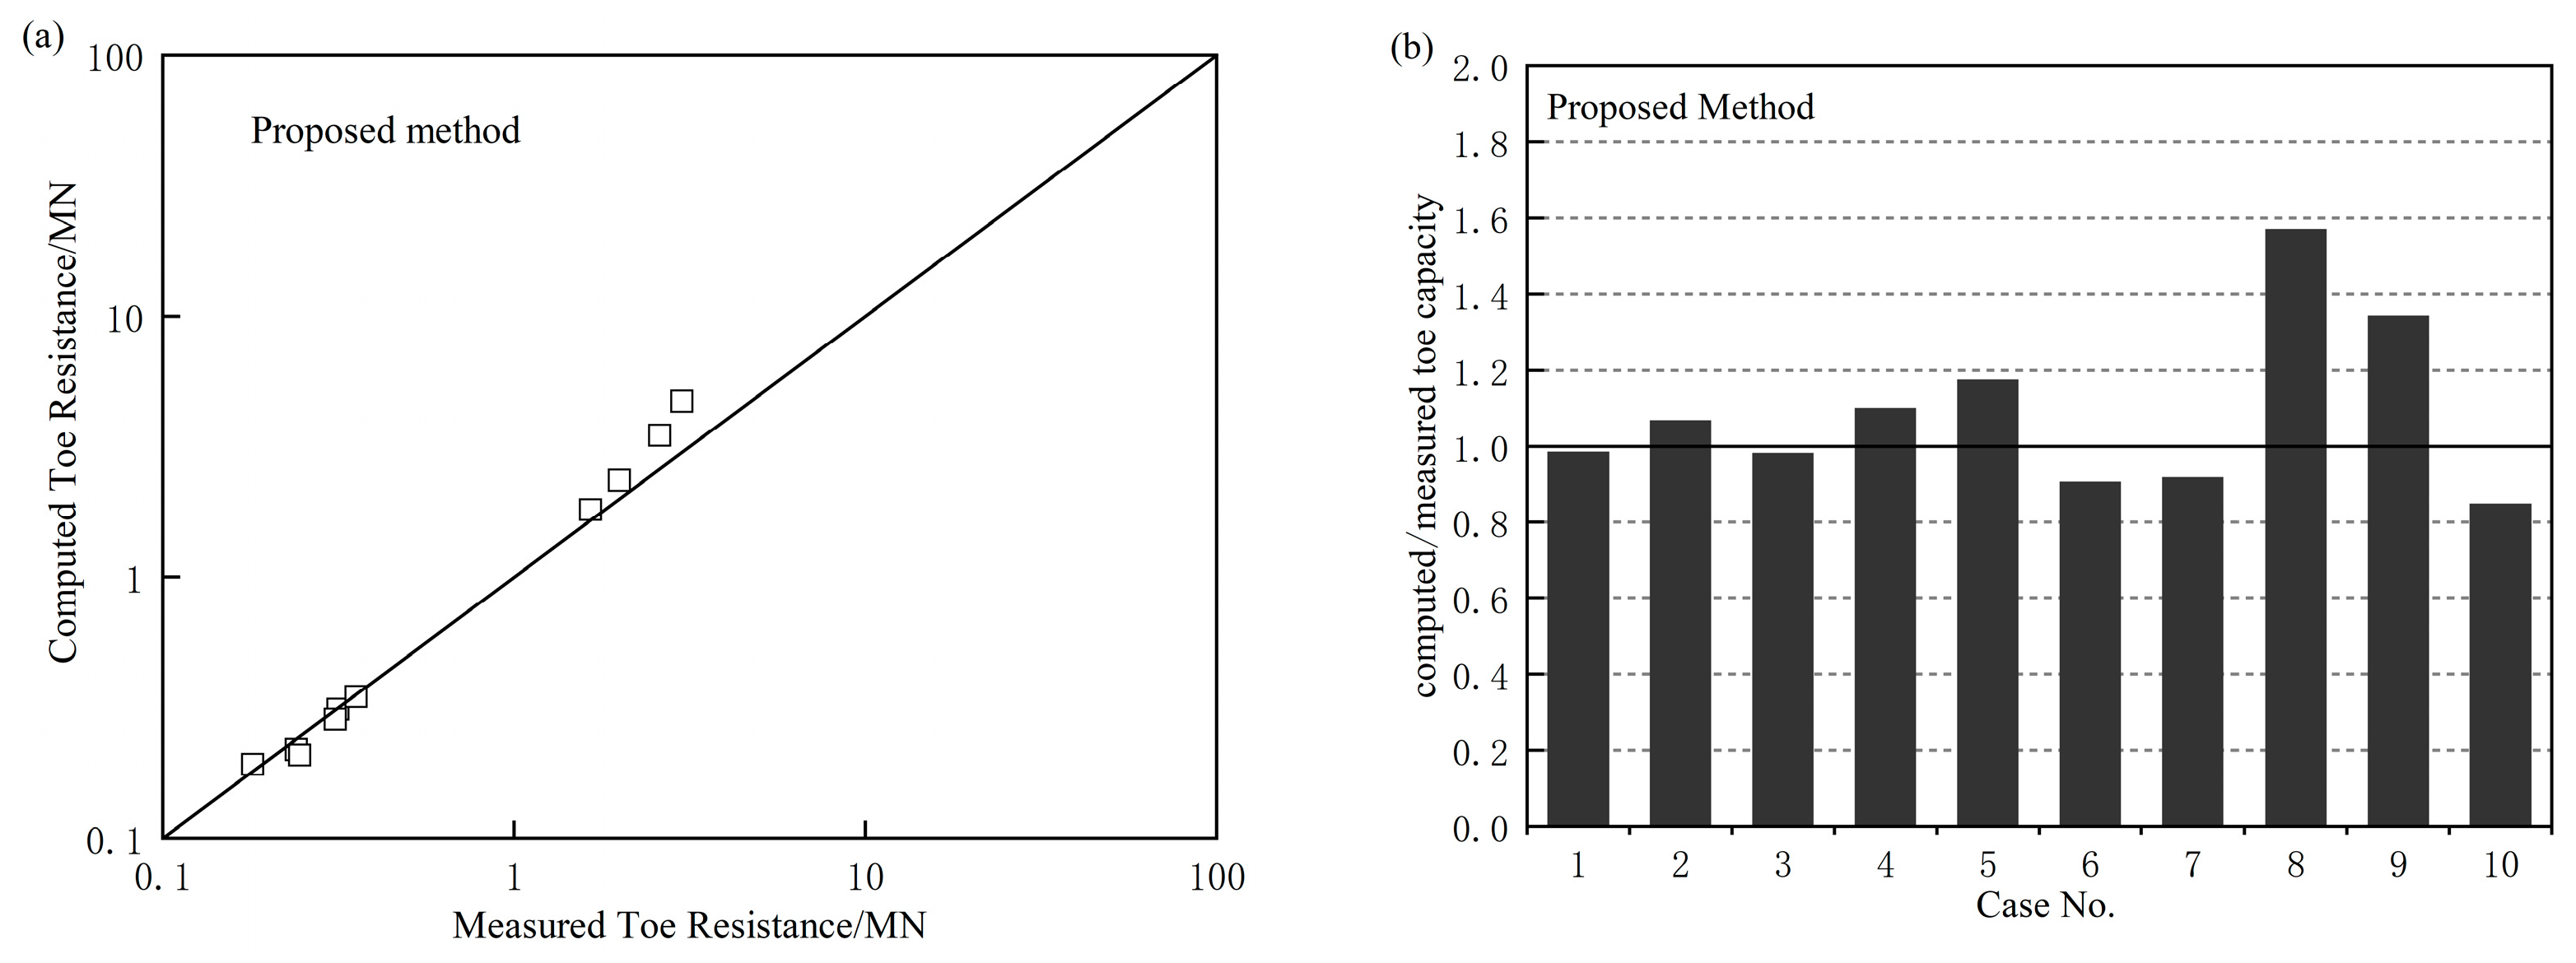
The proposed method is used to compute the end-bearing capacity of engineering pile cases in the literature. There are 10 cases used for verification, and the case record data and computed results are summarized in Table 1. The parameters used in the cases are α S A 1 = 37.5 ° , v = 0.1 ϕ .
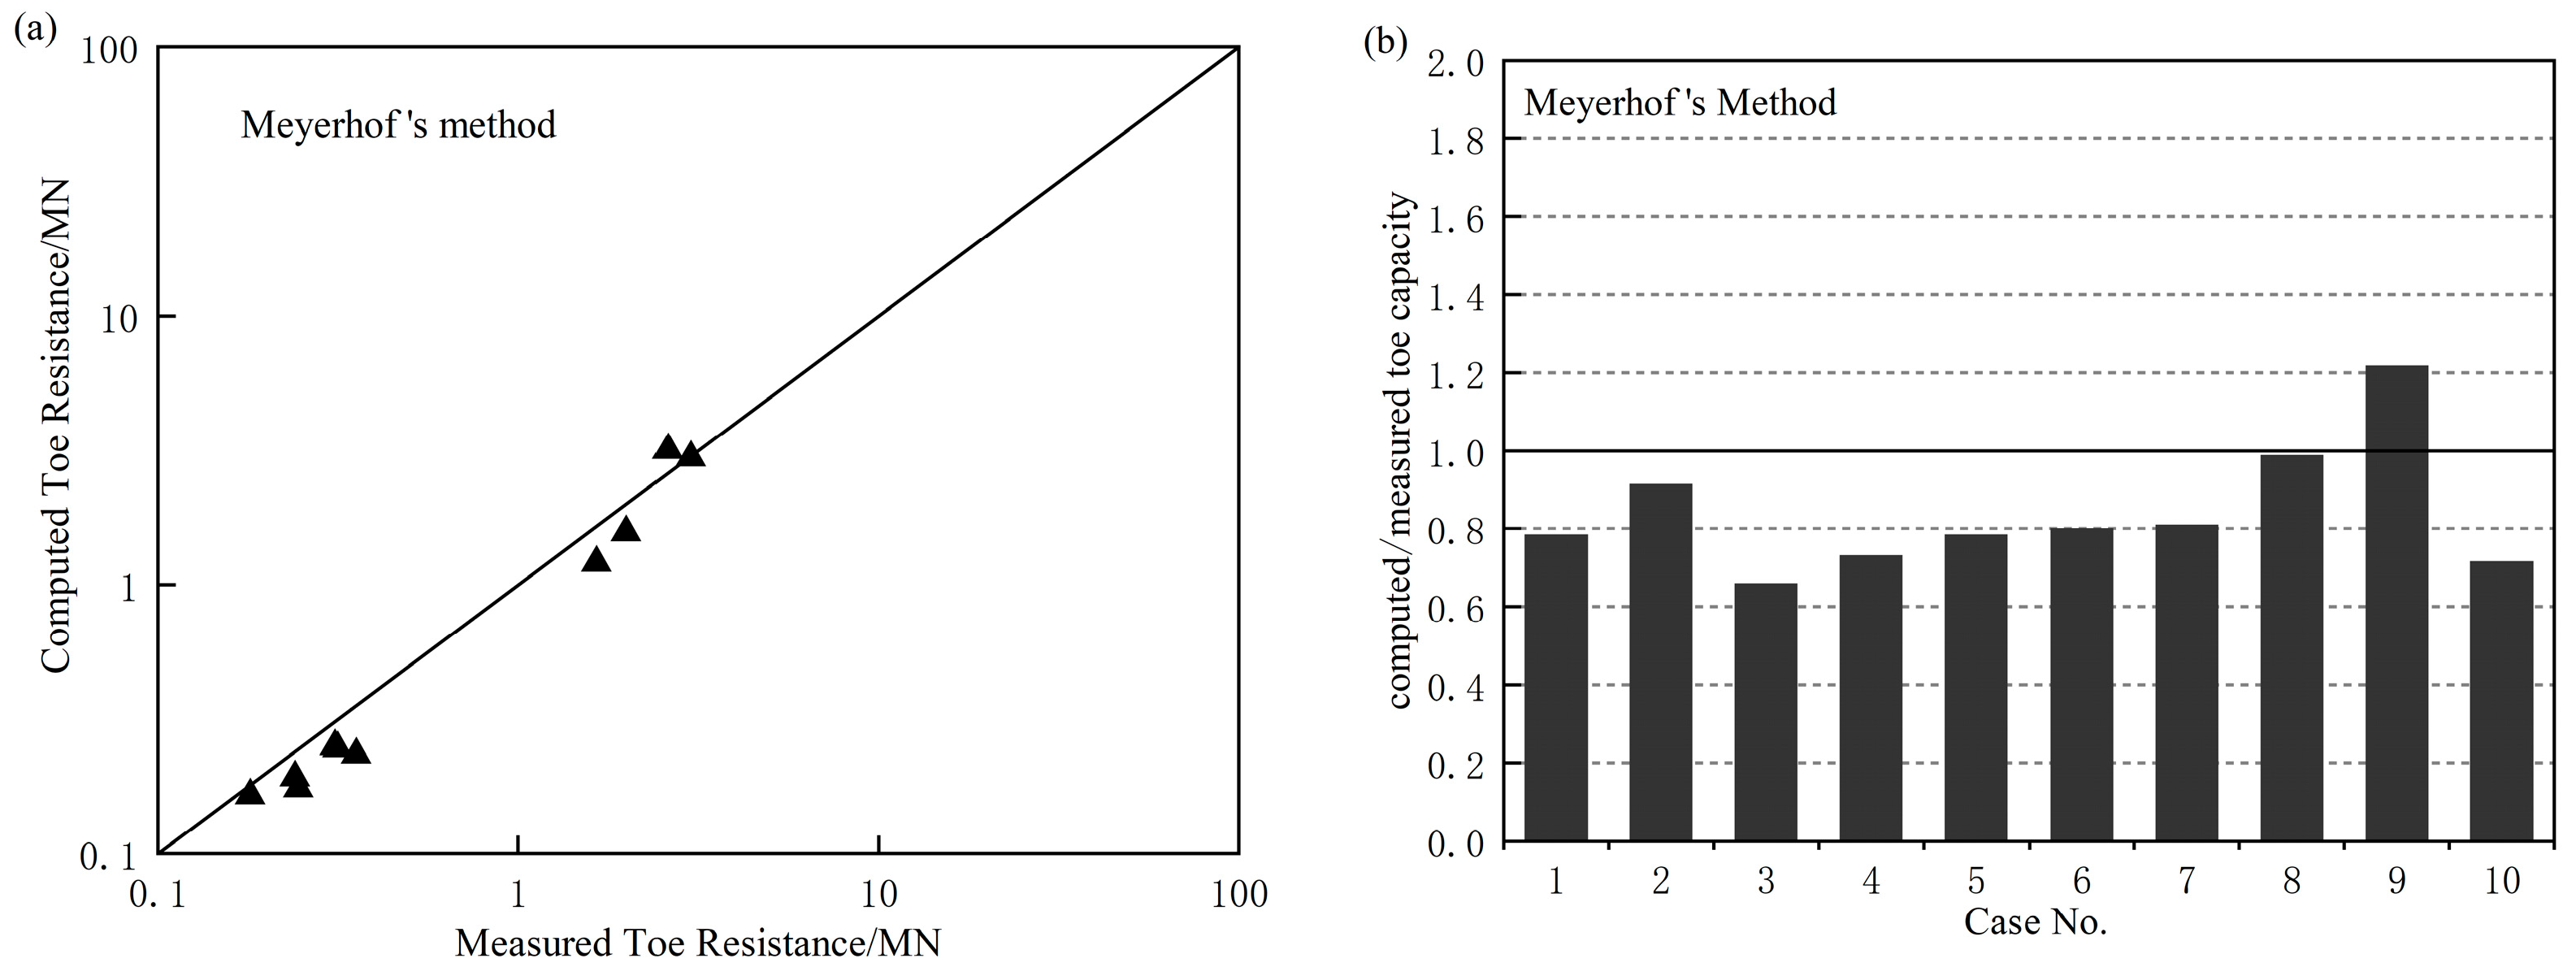
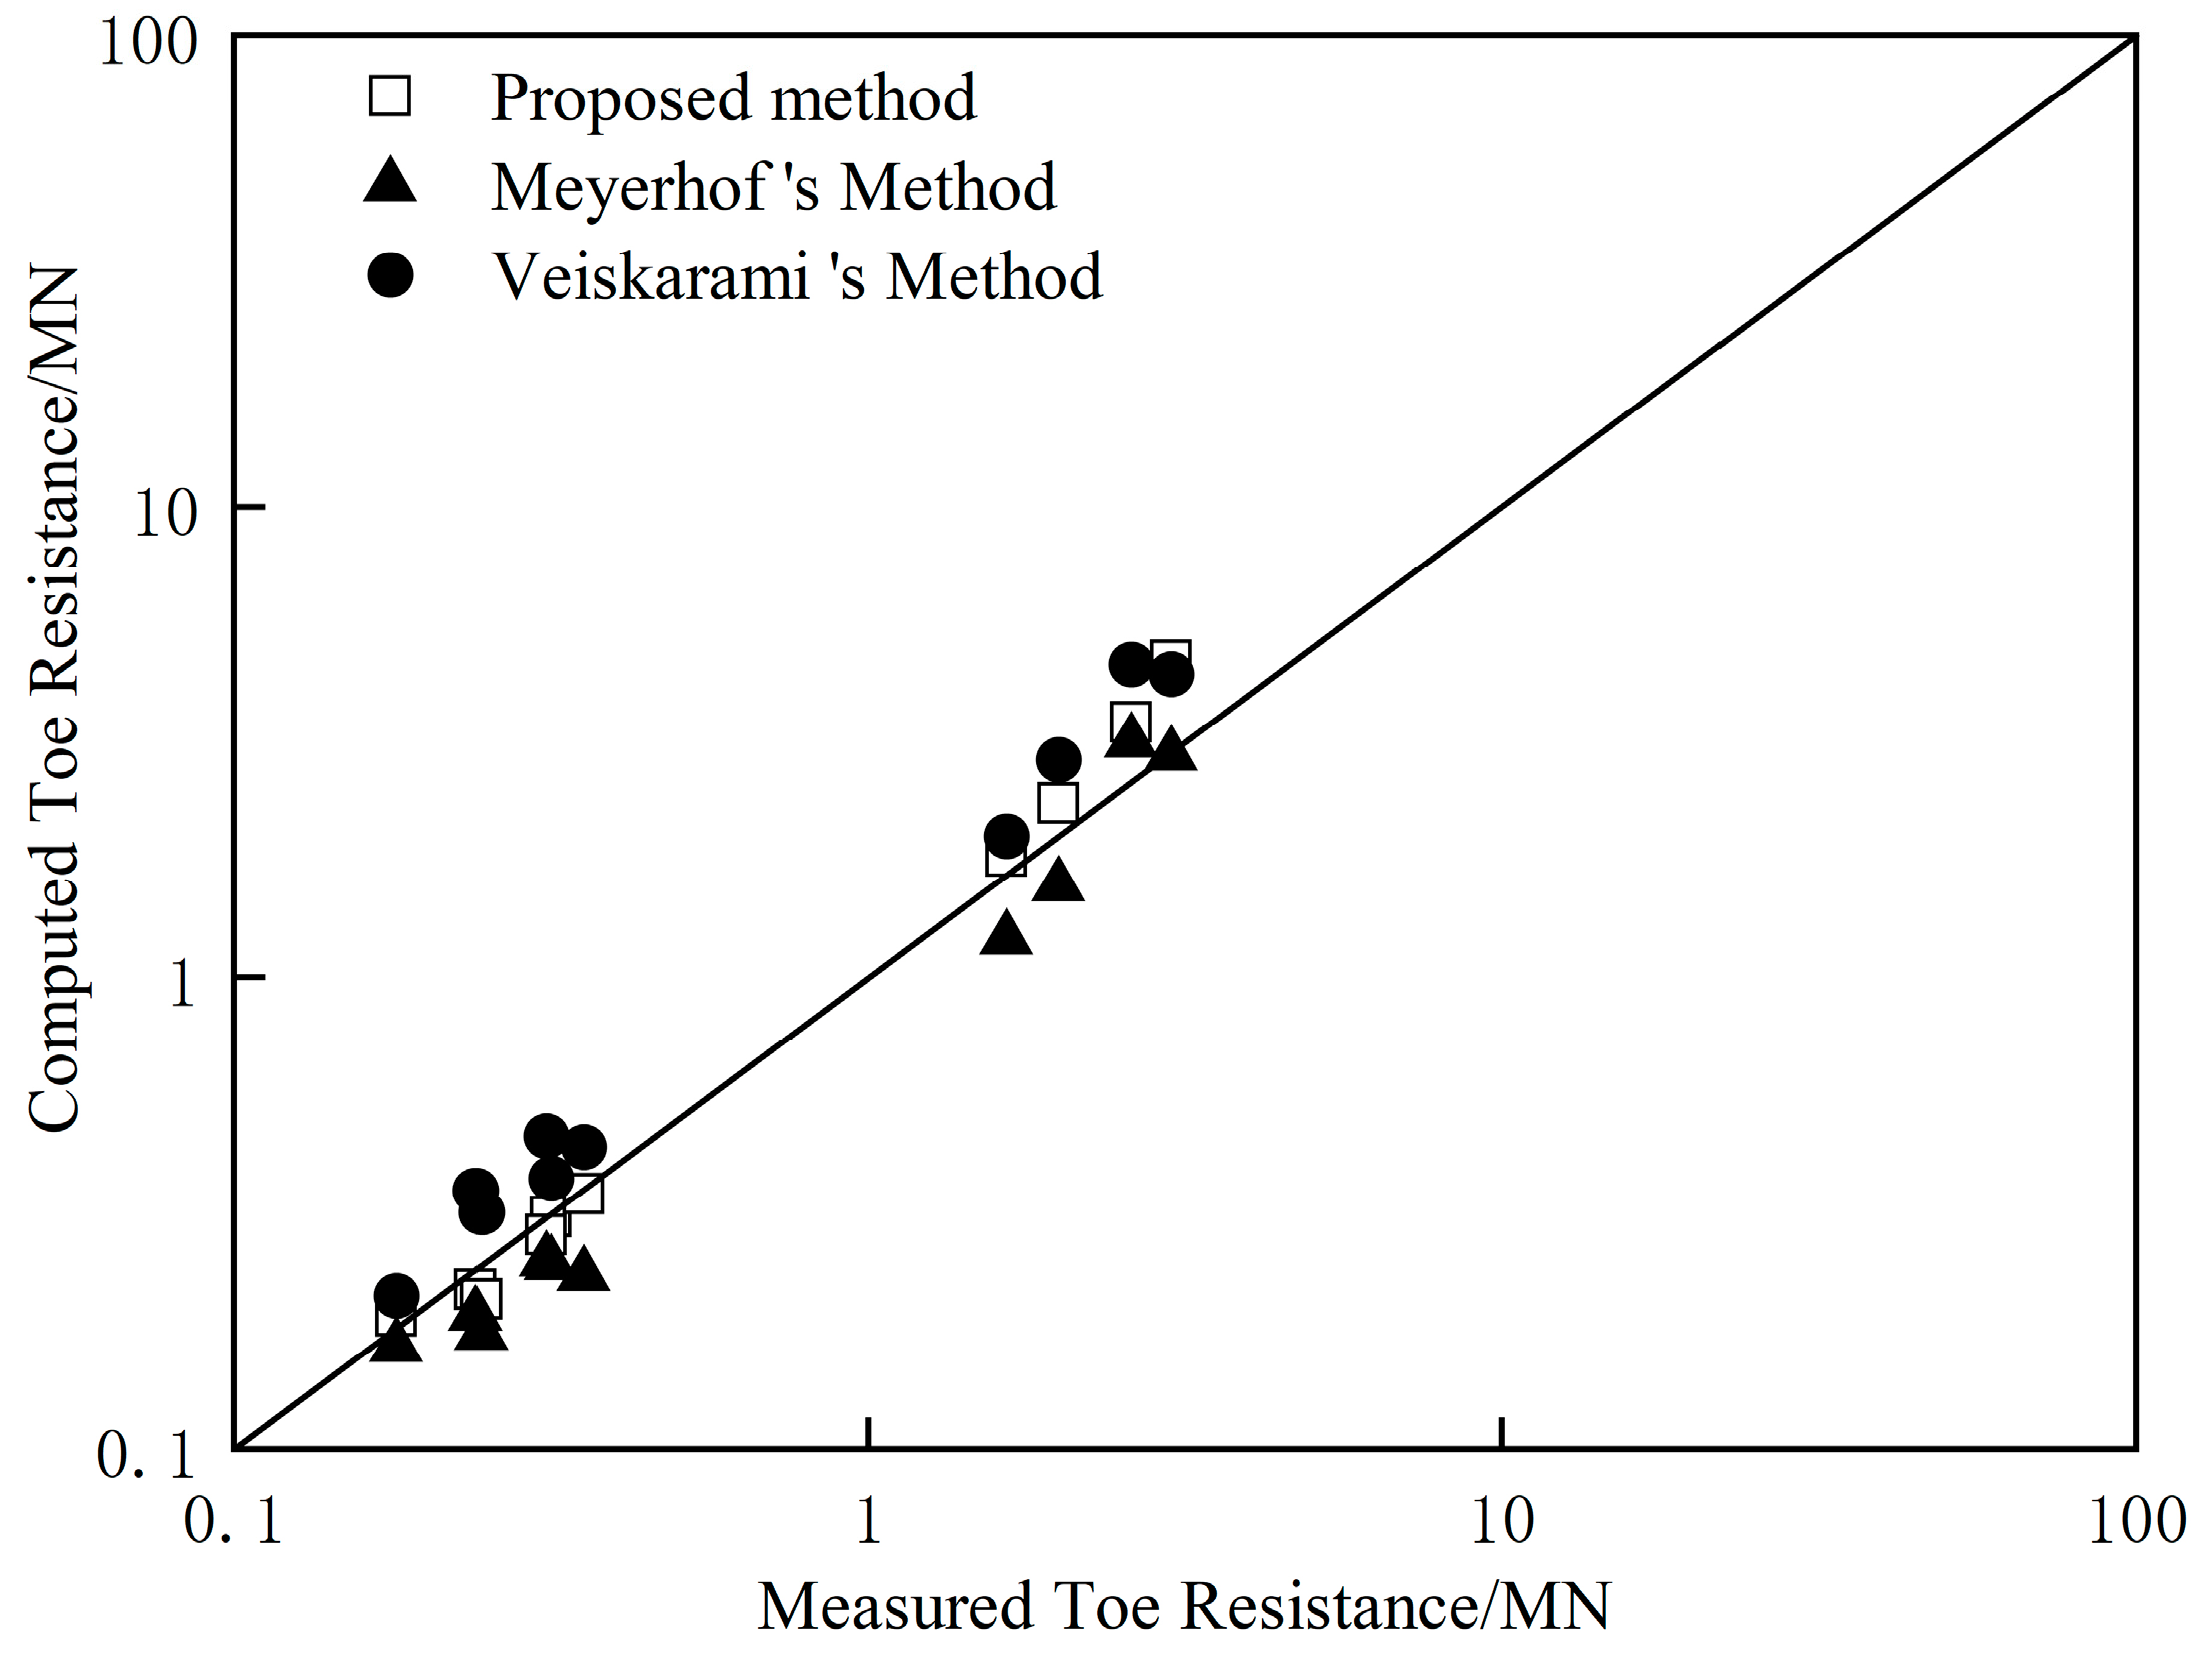
The predicted result made by the proposed method is compared with two other methods, namely, Meyerhof’s method [23] and Veiskarami’s method [11]. The accuracy of a method can be assessed by the ratio of the computed to measured values of the ultimate toe capacity. The computed versus measured end-bearing capacity of piles and the ratio of computed to measured values are shown in Figure 15, Figure 16 and Figure 17. The diagonal line in Figure 15a, Figure 16a and Figure 17a and the horizontal line in Figure 15b, Figure 16b and Figure 17b indicate perfect agreement between computed toe capacity and measured toe capacity. The combined plot of all computed results based on the three methods is shown in Figure 18.
  • Meyerhof’s method [26]: Using CPT data or standard penetration test (SPT) data, the ultimate toe capacity is estimated considering scale effects;
  • Veiskarami’s method [11]: Based on the characteristics method, the ultimate toe capacity is estimated considering the failure pattern with the failure surface reverting to the pile shaft.
From Figure 15, Figure 16 and Figure 17, it can be seen that Meyerhof’s method gives relatively underestimated values for predicting the ultimate toe capacity compared with the other two methods. In most cases, the range of the computed/measured toe capacity given by Meyerhof’s method is between 0.6 and 0.8. Although Veiskarami’s method based on the characteristics method gives results consistent with the measured values, their results generally overestimate the ultimate toe capacity by more than 20%. Compared with these two methods, the proposed method shows a good agreement with the measured values. For those cases wherein the ultimate toe capacity is low, the predicted values provided by the proposed method are quite accurate, while for the cases where the end-bearing capacity of piles is high, there is a certain degree of overestimation. This indicates that for cases where the ultimate toe capacity is high, the failure zone at the boundary of which the equivalent frictional strength fully mobilized may expand, and α S A 1 = 37.5 ° may cause deviation.

6. Summary and Conclusions

A method for predicting the ultimate toe capacity is proposed incorporating the zero-extension line concept, taking into account the failure zone limited below the pile end plane and the stress boundary condition that the equivalent frictional strength at the failure zone boundary be fully mobilized. The main conclusions can be drawn as follows:
  • The failure pattern with a failure zone limited below the pile end plane is more in line with reality. The range of the failure zone is roughly within the range of 37.5° from the vertical direction and influenced by the friction angle. The increase in friction angle leads to an increase in the range of the failure zone.
  • The ultimate toe capacity is influenced by the dilation angle and friction angle of soil. The increase in dilation angle leads to an increase in ultimate toe capacity due to its effect on enlarging the size of the failure zone. The increase in friction angle leads to an increase in ultimate toe capacity primarily due to the high boundary stress and high stress state in the failure zone.
  • Comparing the proposed method with a method directly using the CPT data and a method based on the characteristics method, it has been shown that the method directly using the CPT data always gives relatively underestimated values and the method based on characteristics generally overestimates the ultimate toe capacity. The proposed method provides good predictions in all ultimate toe capacity cases.

Author Contributions

Conceptualization, X.X. and T.G.; formal analysis, Z.W.; funding acquisition, X.X. and K.L.; investigation, T.G.; methodology, X.X. and T.G.; project administration, X.X. and T.G.; software, T.G.; supervision, X.X.; validation, X.X., T.G., Z.W., K.L. and X.Z.; writing—original draft, T.G.; writing—review and editing, X.X., Z.W., K.L. and X.Z. All authors have read and agreed to the published version of the manuscript.

Funding

This research was funded by the National Natural Science Foundation of China, grant number 52478365 and 51878619, and Zhejiang Provincial Natural Science Foundation of China, grant number LHZ23E080002.

Institutional Review Board Statement

Not applicable.

Informed Consent Statement

Not applicable.

Data Availability Statement

The original contributions presented in the study are included in the article; further inquiries can be directed to the corresponding author.

Conflicts of Interest

The authors declare no conflicts of interest.

References

  1. Yasufuku, N.; Hyde, A.F.L. Pile end-bearing capacity in crushable sands. Geotechnique 1995, 45, 663–676. [Google Scholar] [CrossRef]
  2. Yasufuku, N.; Ochiai, H.; Ohno, S. Pile end-bearing capacity of sand related to soil compressibility. Soils Found. 2001, 41, 59–71. [Google Scholar] [CrossRef] [PubMed]
  3. Randolph, M.F.; Dolwin, J.; Beck, R. Design of driven piles in sand. Geotechnique 1994, 44, 427–448. [Google Scholar] [CrossRef]
  4. Manandhar, S.; Yasufuku, N. Vertical bearing capacity of tapered piles in sands using cavity expansion theory. Soils Found. 2013, 53, 853–867. [Google Scholar] [CrossRef]
  5. Gharsallaoui, H.; Jafari, M.; Holeyman, A. Pile end bearing capacity in rock mass using cavity expansion theory. J. Rock Mech. Geotech. Eng. 2020, 12, 1103–1111. [Google Scholar] [CrossRef]
  6. Meyerhof, G.G. The ultimate bearing capacity of foundations. Geotechnique 1951, 2, 301–332. [Google Scholar] [CrossRef]
  7. Hanna, A.M.; Nguyen, T.Q. An axisymmetric model for ultimate capacity of a single pile in sand. Soils Found. 2002, 42, 47–58. [Google Scholar] [CrossRef]
  8. Zhang, Q.; Liu, J.; Dai, G.; Gong, W. Calculation methods for ultimate end bearing capacity of large diameter rock-socketed piles. J. Southeast Univ. (Nat. Sci. Ed.) 2018, 48, 118–124. [Google Scholar]
  9. Jiang, G.; Sun, J.; Wang, X. Finite element lower bound limit solutions for ultimate bearing capacity of subsoil under raft of composite piled foundations. Chin. J. Geotech. Eng. 2011, 33, 128–134. [Google Scholar]
  10. Zhang, S.; Meng, S.; Wu, T.; Wu, B.; Zhou, Z. Limit analysis for pile tip bearing capacity of grouting pile. J. PLA Univ. Sci. Technol. 2003, 4, 45–47. [Google Scholar]
  11. Veiskarami, M.; Eslami, A.; Kumar, J. End-bearing capacity of driven piles in sand using the stress characteristics method: Analysis and implementation. Can. Geotech. J. 2011, 48, 1570–1586. [Google Scholar] [CrossRef]
  12. Valikhah, F.; Eslami, A.; Veiskarami, M. Load–displacement behavior of driven piles in sand using CPT-based stress and strain fields. Int. J. Civ. Eng. 2019, 17, 1879–1893. [Google Scholar] [CrossRef]
  13. Serrano, A.; Olalla, C. Ultimate bearing capacity at the tip of a pile in rock—Part 1: Theory. Int. J. Rock Mech. Min. Sci. 2002, 39, 833–846. [Google Scholar] [CrossRef]
  14. Cai, Y.; Xu, B.; Cao, Z.; Geng, X.; Yuan, Z. Solution of the ultimate bearing capacity at the tip of a pile in inclined rocks based on the Hoek-Brown criterion. Int. J. Rock Mech. Min. Sci. 2020, 125, 104140. [Google Scholar] [CrossRef]
  15. Cao, Z.; Xu, B.; Cai, Y.; Galindo, R.A. Application of the modified Hoek-Brown criterion in the analysis of the ultimate bearing capacity at the tip of a pile in inclined rocks. Int. J. Rock Mech. Min. Sci. 2022, 160, 105276. [Google Scholar] [CrossRef]
  16. Roscoe, K.H. The influence of strain in soil mechanics. Geotechnique 1970, 20, 129–170. [Google Scholar] [CrossRef]
  17. Jahanandish, M. Development of a zero extension line method for axially symmetric problems in soil mechanics. Sci. Iran. 2003, 10, 203–210. [Google Scholar]
  18. Jahanandish, M.; Habibagahi, G.; Veiskarami, M. Bearing capacity factor, Nγ, for unsaturated soils by ZEL method. Acta Geotech. 2010, 5, 177–188. [Google Scholar] [CrossRef]
  19. Jahanandish, M.; Veiskarami, M.; Ghahramani, A. Effect of stress level on the bearing capacity factor, Nγ, by the ZEL Method. KSCE J. Civ. Eng. 2010, 14, 709–723. [Google Scholar] [CrossRef]
  20. Jahanandish, M.; Veiskarami, M.; Ghahramani, A. Prediction of the bearing capacity and load-displacement behavior of shallow foundations by the stress-level-based ZEL method. Sci. Iran. 2011, 18, 16–27. [Google Scholar]
  21. Jahanandish, M.; Veiskarami, M.; Ghahramani, A. Investigation of foundations behavior by implementation of a developed constitutive soil model in the ZEL method. Int. J. Civ. Eng. 2011, 9, 293–306. [Google Scholar]
  22. Jahanandish, M.; Ansaripour, M. Application of Particle Image Velocimetry in Establishing the Field of Zero Extension Lines in Soils. Iran. J. Sci. Technol. Trans. Civ. Eng. 2016, 40, 337–348. [Google Scholar] [CrossRef]
  23. Robinsky, E.I.; Morrison, C.F. Sand Displacement and Compaction around Model Friction Piles. Can. Geotech. J. 1964, 1, 81–93. [Google Scholar] [CrossRef]
  24. Cox, A.D.; Eason, G.; Hopkins, H.G. Axially symmetric plastic deformations in soils. Philos. Trans. R. Soc. A Math. Phys. Eng. Sci. 1961, 254, 1–45. [Google Scholar] [CrossRef]
  25. Robertson, P.K.; Campanella, R.G. Interpretation of cone penetration tests. Part I: Sand. Can. Geotech. J. 1983, 20, 718–733. [Google Scholar] [CrossRef]
  26. Meyerhof, G.G. Scale effect of ultimate pile capacity. J. Geotech. Eng. 1983, 109, 797–806. [Google Scholar] [CrossRef]
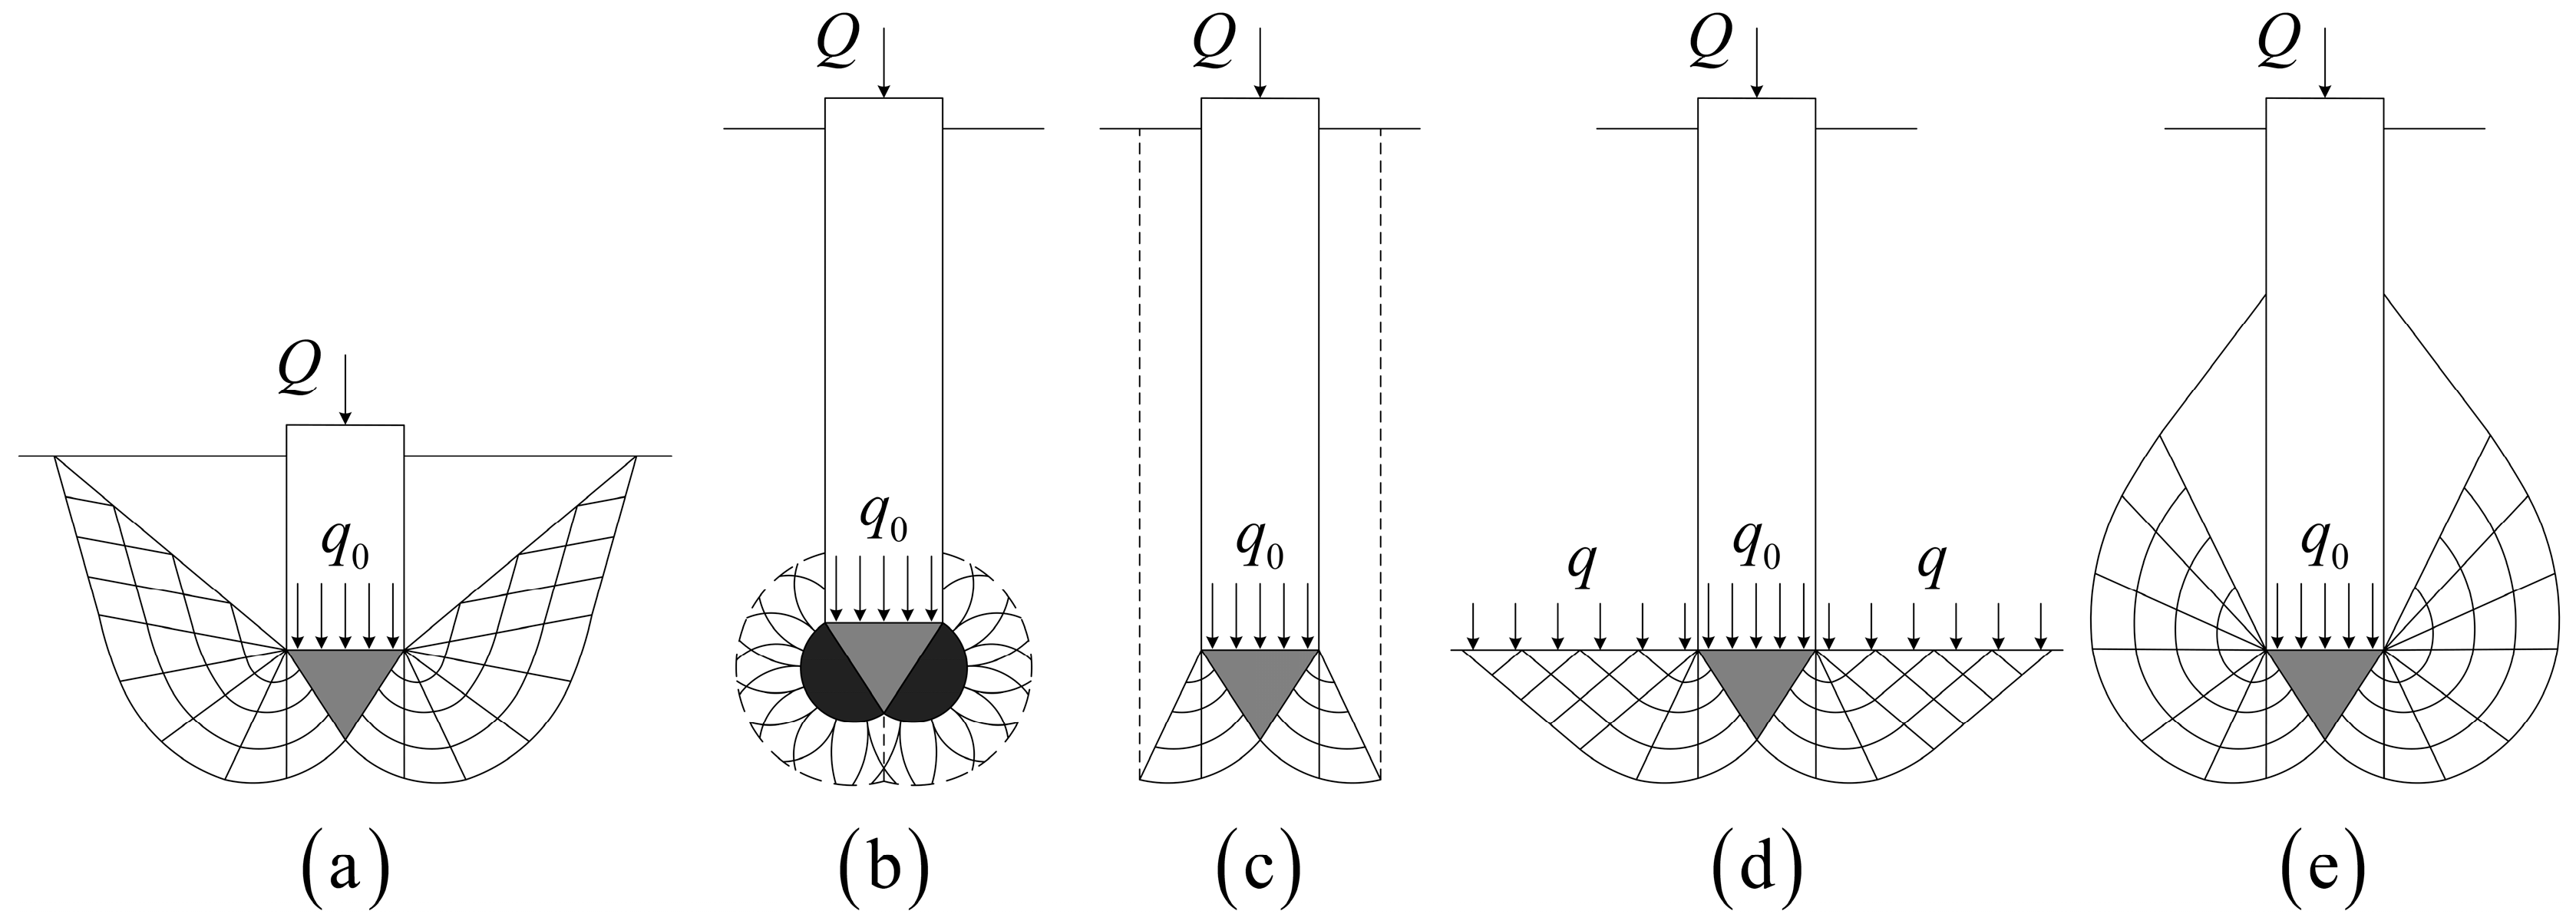
Figure 1. Different failure patterns around the pile tip: (a) general shear failure; (b) cavity expansion failure; (c) local shear failure (d) Prandtl failure mode; (e) Meyerhof failure mode.
Applsci 14 09713 g001
Figure 2. (a) The division of soil around the pile tip; (b) the load acting on the failure zone boundary.
Applsci 14 09713 g002
Figure 3. The cylindrical coordinate system and the analyzed soil element.
Applsci 14 09713 g003
Figure 4. The state of stress at a point and the directions of the stress characteristic line and zero-extension line (ZEL).
Applsci 14 09713 g004
Figure 5. Mohr stress circle at intermediate state and ultimate state.
Applsci 14 09713 g005
Figure 6. (a) Curve coordinate system at computing node A; (b) discrete computing nodes.
Applsci 14 09713 g006
Figure 7. The direction of the major principal stress at the contact boundary at the ultimate state.
Applsci 14 09713 g007
Figure 8. The stress boundary condition at the ultimate state.
Applsci 14 09713 g008
Figure 9. The zero-extension line (ZEL) net for an illustrative example: ϕ = 30 ° , v = 0.1 ϕ , α S A 1 = 40 ° .
Applsci 14 09713 g009
Figure 10. The influence of the inclination angle of the failure zone boundary on the computed toe capacity: ϕ = 30 ° , v = 0.1 ϕ .
Applsci 14 09713 g010
Figure 11. The influence of dilation angle on the computed toe capacity: ϕ = 30 ° , α S A 1 = 37.5 ° .
Applsci 14 09713 g011
Figure 12. The influence of friction angle on the computed toe capacity: α S A 1 = 37.5 ° , v = 0.1 ϕ .
Applsci 14 09713 g012
Figure 13. Bearing capacity factor–friction angle relationship under different inclination angles when v = 0.1 ϕ .
Applsci 14 09713 g013
Figure 14. Bearing capacity factor–friction angle relationship under different dilation angle when α S A 1 = 46 ° .
Applsci 14 09713 g014
Figure 15. (a) Computed versus measured toe resistance by proposed method; (b) ratio of computed to measured values of ultimate toe capacity by proposed method.
Applsci 14 09713 g015
Figure 16. (a) Computed versus measured toe resistance by Meyerhof’s method; (b) ratio of computed to measured values of ultimate toe capacity by Meyerhof’s method.
Applsci 14 09713 g016
Figure 17. (a) Computed versus measured toe resistance by Veiskarami’s method; (b) ratio of computed to measured values of ultimate toe capacity by Veiskarami’s method.
Applsci 14 09713 g017
Figure 18. Computed versus measured ultimate toe capacity by different methods.
Applsci 14 09713 g018
Table 1. Summary of pile case record data and predicted ultimate toe capacity.
Case No.Soil Type (Around the Pile Tip)Diameter
/mm
Length
/m
Measured Toe
Capacity/kN
q c /MPa ϕ Predicted Toe
Capacity/kN
Predicted to
Measured Ratio
1Medium-dense sand32416.8315327310.60.986
2Medium-dense sand32431.1180219192.11.067
3Sand2739.2355432348.60.982
4Sand60934.2516505261814.51.100
5Silty sand5008.720008332351.11.176
6Silty sand3509.4240223217.80.908
7Silty sand4009.4310223284.60.918
8Medium-dense sand50835.85300015334710.91.570
9Medium-dense sand50843260016313492.81.343
10Sandy clay27313245328208.00.849
Disclaimer/Publisher’s Note: The statements, opinions and data contained in all publications are solely those of the individual author(s) and contributor(s) and not of MDPI and/or the editor(s). MDPI and/or the editor(s) disclaim responsibility for any injury to people or property resulting from any ideas, methods, instructions or products referred to in the content.