Article

Predicting Lightweight Powders with Useful Sound Absorption Characteristics from Their Specifications

1
Department of Engineering, Niigata University, Ikarashi 2-no-cho 8050, Nishi-ku, Niigata 950-2181, Japan
2
Graduate School of Science and Technology, Niigata University, Ikarashi 2-no-cho 8050, Nishi-ku, Niigata 950-2181, Japan
*
Author to whom correspondence should be addressed.
Appl. Sci. 2024, 14(21), 9765; https://doi.org/10.3390/app14219765
Submission received: 21 August 2024 / Revised: 15 October 2024 / Accepted: 22 October 2024 / Published: 25 October 2024
(This article belongs to the Special Issue Vibration Problems in Engineering Science)

Abstract

:
Powders that absorb sound by longitudinal vibration have either a gentle or sharp sound absorption curve at the first absorption peak frequency. Experiments were performed to investigate the conditions under which longitudinal vibration occurs in powders of various grain sizes and bulk densities. The sound absorption characteristics of the powders were then classified according to their specifications, and the sound absorption coefficients predicted by derived empirical equations were compared with the measured sound absorption coefficients. A threshold value for the areal density per grain layer was identified where lightweight powders at 0.0006 g/cm2 or less demonstrated useful sound absorption characteristics via longitudinal vibration. Powders with smooth (i.e., useful) and sharp (i.e., not useful) sound absorption curves could be further identified by the half-width value at 0.0974 < log f2 − log f1 < 0.119 decade. The bulk density can also be used to identify powders with useful sound absorption characteristics at 0.0868 < ρ < 0.124 g/cm3. A regression analysis was performed to obtain empirical equations expressing the relationship between the areal density per grain layer and first sound absorption peak frequency normalized by the layer thickness.

1. Introduction

Granular materials can be used to form thin and lightweight sound-absorbing layers, which have multiple useful applications. General granular materials with grain diameters of a few millimeters exhibit acoustic properties similar to those of porous materials, where the kinetic energy of sound waves is converted into thermal energy by the boundary layer viscosity of air near the material walls, resulting in sound absorption [1]. For granular materials consisting of several millimeters in grain size, multiple theoretical analysis methods are available for estimating the sound absorption coefficient of granular materials with grain sizes of a few millimeters for both regular filling structures [2] and random filling structures [3]. For the acoustic properties of granular materials several studies have been conducted: a study comparing the accuracy of the application of three general porous prediction models [4]; a study of the relationship between sound velocity in a mixture of granular materials and the composition of the mixture [5]; a study that devised a new empirical model for the acoustic properties of loose granular media [6]; and a study that carried out an inverse estimation of non-acoustic parameters for granular absorbers and a comparison of impedance models [7]. Research on sound absorbers using granular materials includes studies on a new system of thin impermeable circular membranes made of silicone lined with cavities partially filled with granular AC [8] and the development of natural fiber–grain composites as new sustainable sound-absorbing materials made of kenaf fibers and waste rice husk grains [9]. Research has also been carried out on the use of granular materials as sound insulation materials, such as the measurement of the transmission loss in regenerated granular materials using wave decomposition with deconvolution-based impulse response extraction [10]. Research has reported examples of the measured insertion loss of wedge-shaped barriers with sand and gravel and calculations performed using empirical models [11]. At low frequencies, a high sound absorption coefficient can be obtained by using powder materials with much smaller grain sizes of several tens of micrometers. Okudaira et al. [12] explained the sound absorption mechanism of powder materials as follows: a sound wave excites the longitudinal vibration modes of the powder grains, which converts the acoustic energy into kinetic energy that is attenuated by the interaction between powder grains. Research involving powder materials includes studies on the effects of grain size on the sound absorption properties and sound velocity of powder layers [13], the acoustic behavior of powder layers comprising two different powder mixtures [14], the sound absorption properties of materials consisting of polymer grains and polyurethane foam [15], and sound absorption in aerogel powders saturated in air [16]. The acoustic behavior of the powder layer is sometimes analyzed using the Biot model [17], including studies on the influence of casing on the sound absorption properties of fine spherical granular materials [18]. Sakamoto et al. [19] estimated the sound absorption coefficient of a powder layer by treating it as a five-degrees-of-freedom forced vibration problem and calculating the acoustic impedance derived from the equation of motion. For powders with a relatively large grain size, high bulk density, or both, vibration analysis alone does not provide a sufficient calculation accuracy. Thus, Sakamoto et al. [20] derived the sound absorption coefficient of a powder layer by modeling both the longitudinal vibration of the powder and damping due to the viscosity of the boundary layer. Sakamoto et al. [21] showed that there is no clear correlation between the grain size and first sound absorption peak. They did find that a lower bulk density correlated with a higher sound absorption coefficient. However, granular materials with large grain sizes (e.g., foamed polystyrene beads with a grain size of 2 mm) did not vibrate despite the low bulk density. They concluded that the conditions under which a powder is excited to vibrate longitudinally must be determined from the grain size and bulk density, which they defined as the “areal density per grain layer”. Although there are still few studies on longitudinal vibrations of powders and therefore few examples of practical sound-absorbing devices developed using powders, there have been attempts to improve the acoustic properties of speakers [22].
Powders that absorb sound by longitudinal vibration have either a gentle or sharp sound absorption curve at the first absorption peak frequency. The former is considered favorable for sound absorption while the latter is considered less effective. In this study, the objective was to classify powders according to their sound absorption performance using only specifications such as the grain size and bulk density. If such an approach is demonstrated as viable, then powders with useful sound absorption characteristics can be identified without the need to measure their sound absorption coefficient. Experiments were performed to investigate the conditions under which longitudinal vibration occurs in powders of various grain sizes and bulk densities. The sound absorption characteristics of the powders were then classified according to their specifications, and the sound absorption coefficients predicted by derived empirical equations were compared with the measured sound absorption coefficients.

2. Materials and Methods

Samples Used for Measurements

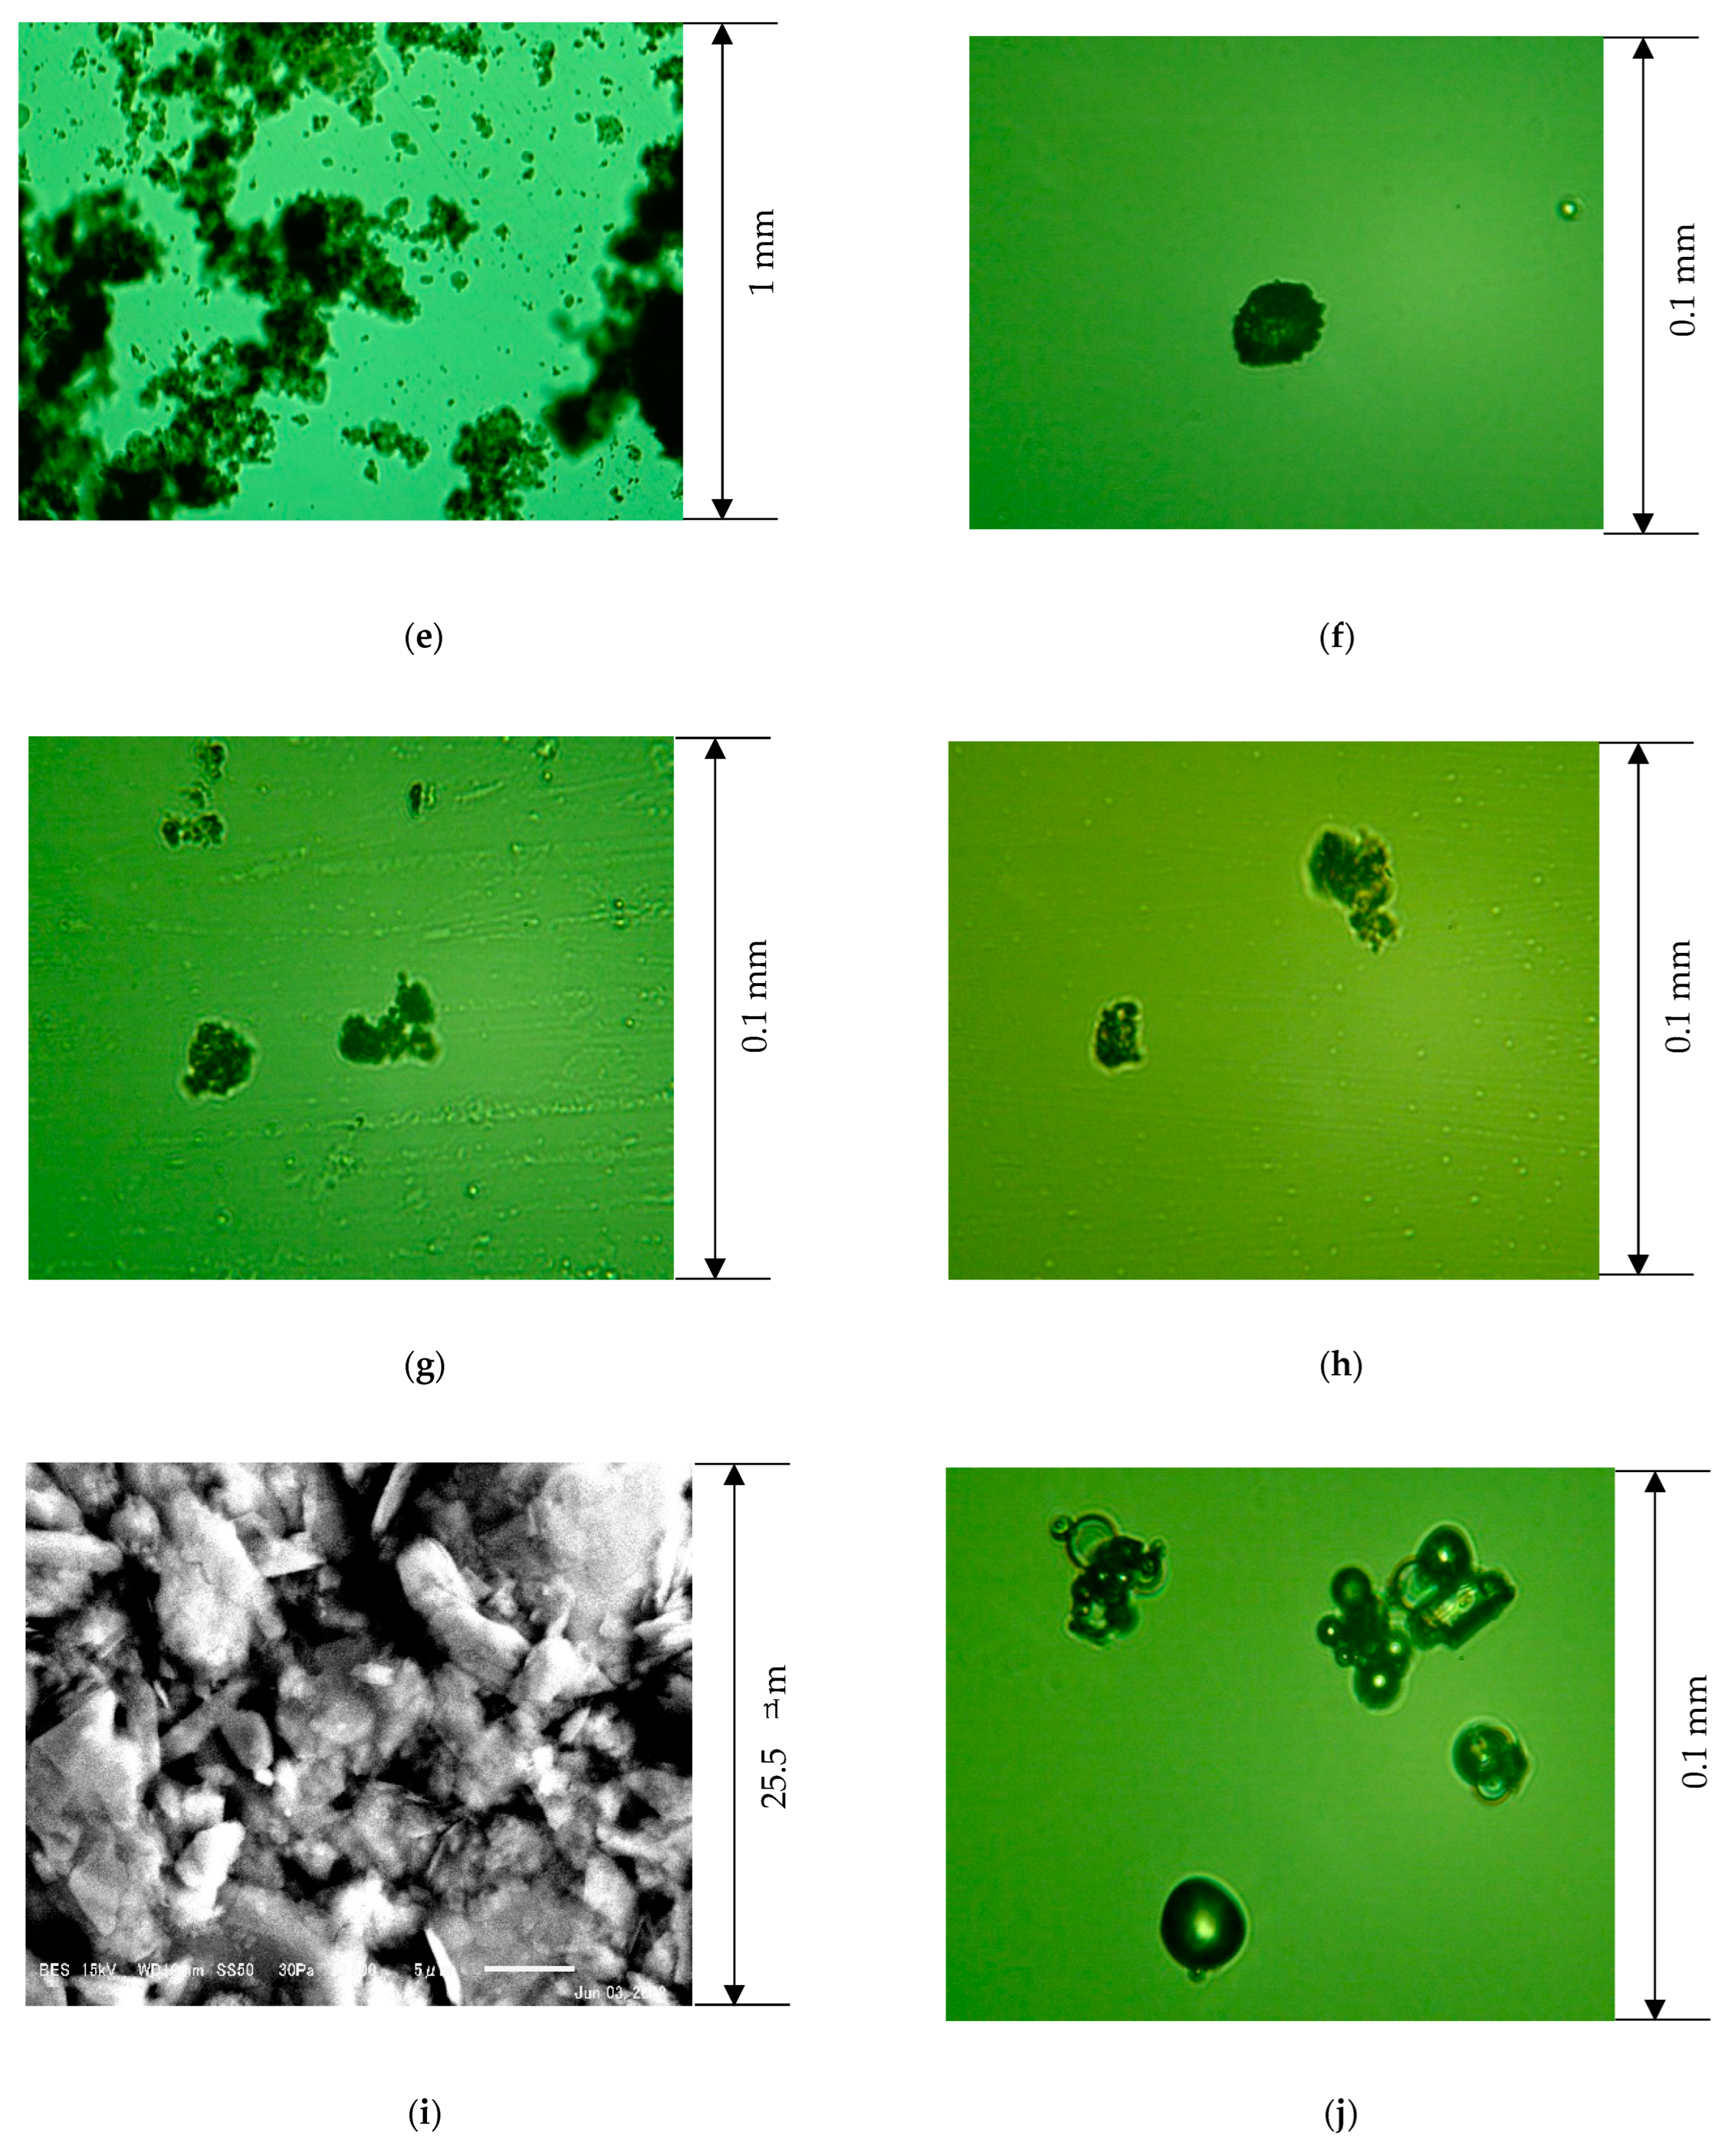
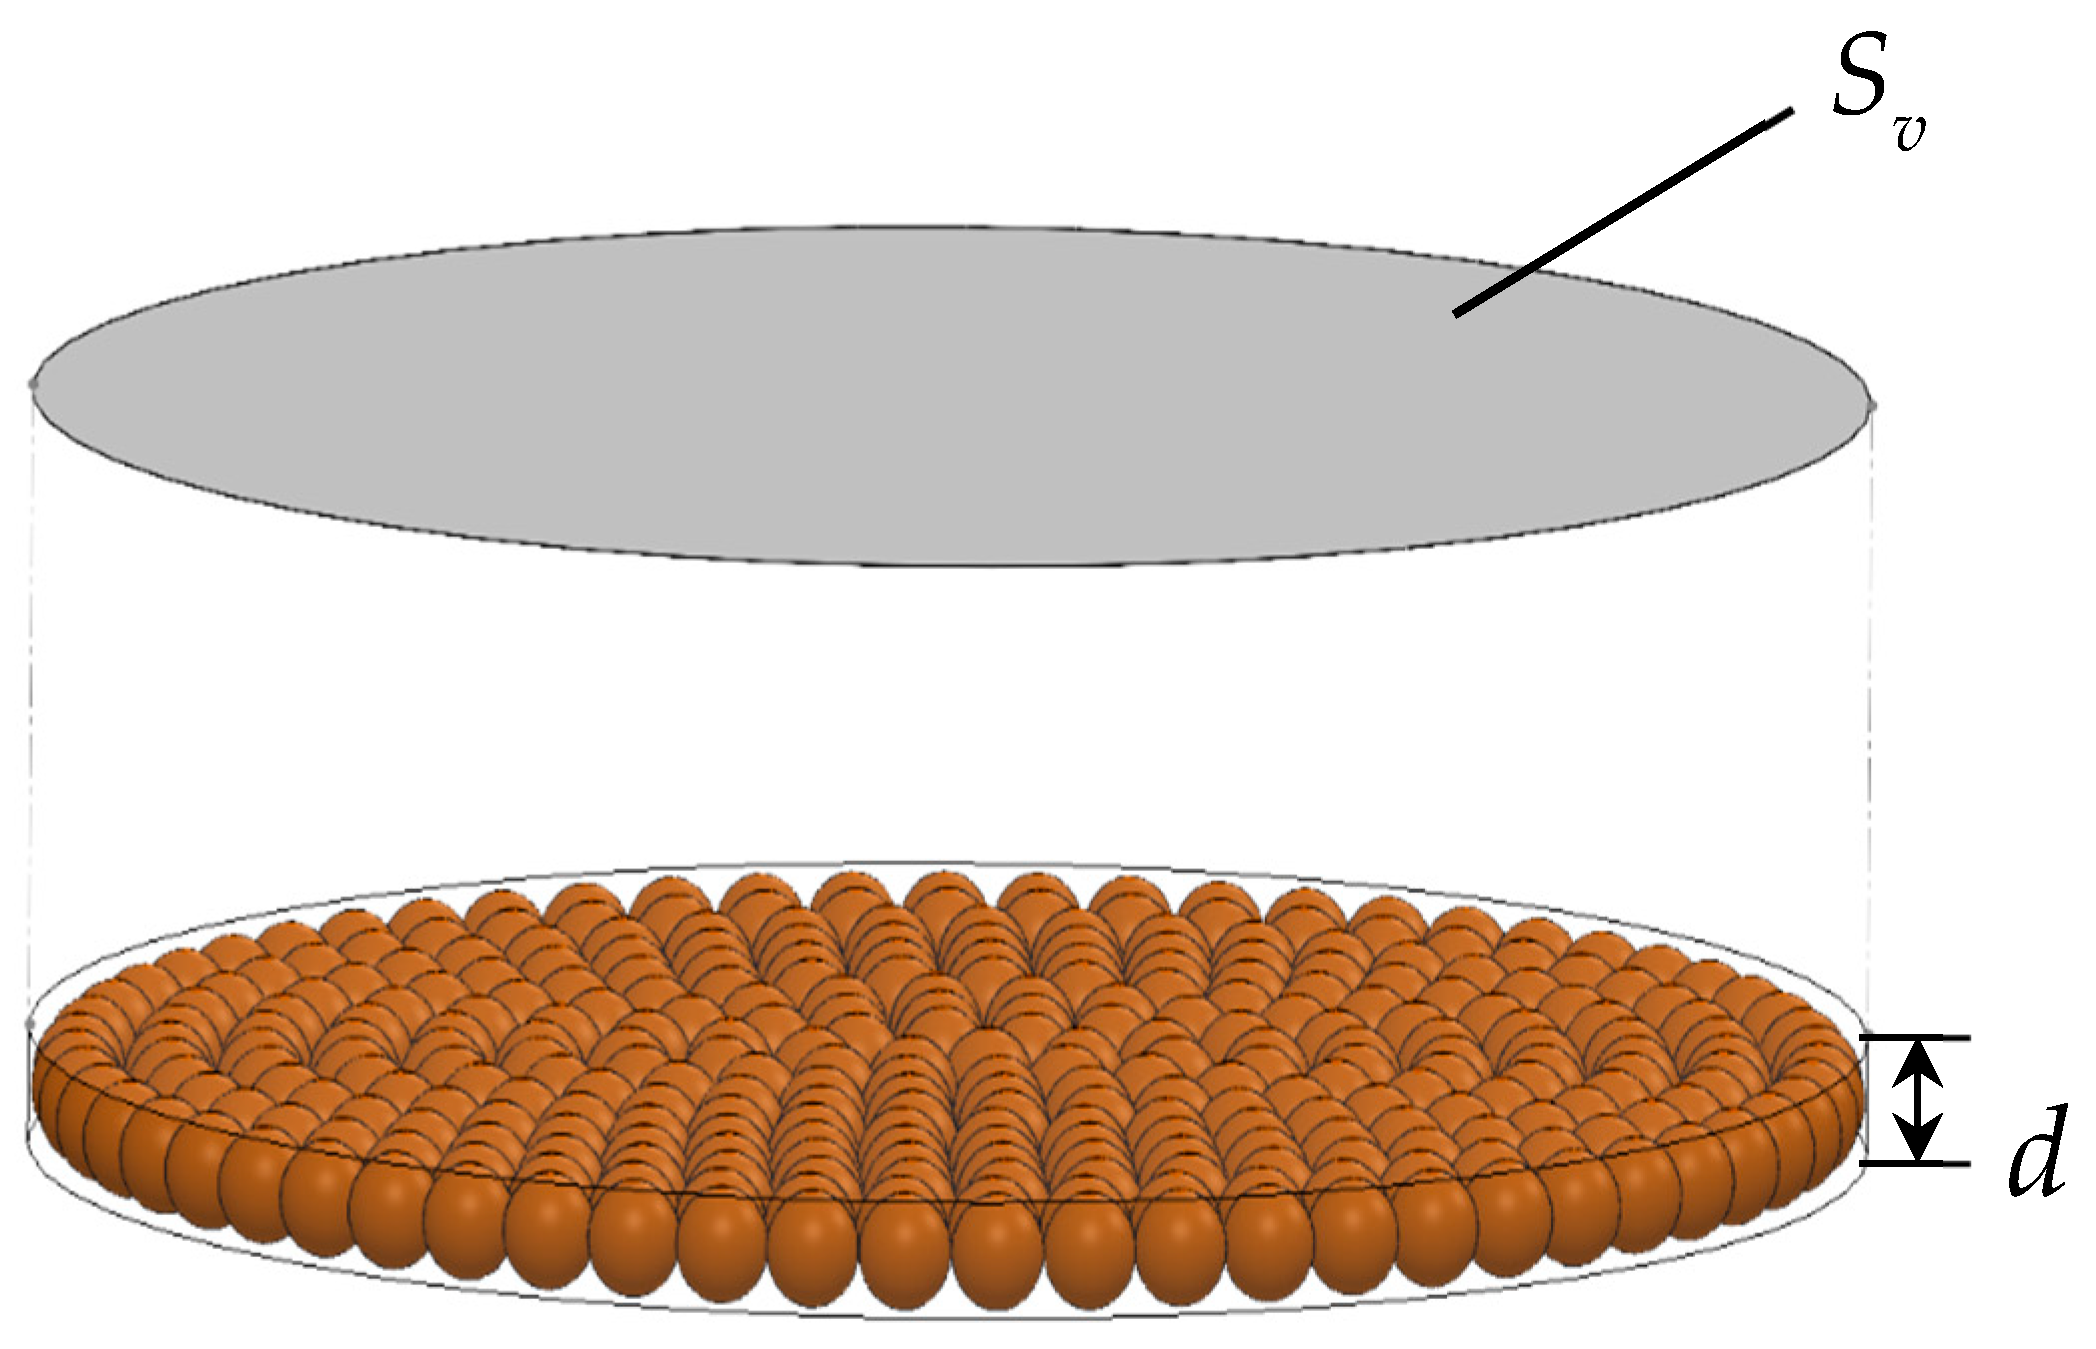
Figure 1 shows micrographs of the powders used in the experiments, and Table 1 lists their specifications. Powders with a range of grain sizes (e.g., hollow glass and plastic beads) were classified by sieving. To account for the heterogeneity of grain shapes, the constant tangential diameter (i.e., the Feret diameter) [23] of the powder grains was measured from micrographs. The average diameter was taken as the grain size of a given powder. The bulk density was determined from the average of multiple measurements of the weight per unit volume. The areal density per grain layer can be calculated by multiplying the grain size by the bulk density. Figure 2 shows a schematic diagram of a powder layer with a depth of one grain. The mass M B of a powder-filled cylinder within a grain layer is calculated as follows:
M B = V B × ρ
The volume V B of the cylinder is calculated as follows:
V B = d × S v
The mass MB of the cylinder can be divided by the cross-sectional area S V of the cylinder to obtain the areal density σ for a grain layer:
σ = M B S v
Then, Equation (7) can be rearranged by using Equations (5) and (6) to obtain the areal density per grain layer:
σ = d × ρ
The normal incident sound absorption coefficient was measured as follows. Lightweight powder layers absorb sound when a sound wave excites the longitudinal vibration modes of the powder. The elastic wave velocity in the powder layer is related to the first peak frequency of the sound absorption coefficient as follows [12]:
c p = 4 l p f p e a k
The elastic wave velocity is also related to the longitudinal elastic modulus of the powder layer as follows [12]:
c p = E ρ
Therefore, the longitudinal elastic modulus of the powder layer can be calculated as follows:
E = ρ 4 l p f peak 2
where E is the longitudinal elastic modulus, fpeak is the first peak frequency, ρ is the bulk density, and lp is the thickness of the powder layer.
As shown in Figure 3, the powders were classified into three main groups according to their sound absorption curves: group A had gentle sound absorption curves, group B had sharp sound absorption curves, and group C demonstrated only slight vibration. The sharpness of the sound absorption curves for groups A and B were quantified by the half-width method, which requires measurement of the sound absorption coefficient.
Figure 4 shows the experimental setup used to measure the sound absorption coefficient. Each sample was mounted in a Brüel & Kjær Type 4206 two-microphone impedance measuring tube (Nærum, Denmark). Powders maintained at a constant temperature of 20 °C and humidity of 35% in a storage area were placed into sample holders (inner diameter: 29 mm, aluminum alloy) and tapped until no further volume change was observed. Preliminary experiments confirmed that the acoustic properties of the sample holder were identical to those of a genuine Brüel & Kjær 4206 sample holder.
The following procedure was used to measure the sound absorption coefficient. A sinusoidal sweep signal was output from the signal generator built into the fast Fourier transform (FFT) analyzer (Ono Sokki, Kanagawa, Japan), and a sound wave was output from the loudspeaker. The transfer function between the sound pressure signals measured by two microphones attached to the impedance tube was then measured by the FFT analyzer. The distance between the microphones was 20 mm. The measured transfer function was then used to calculate the normal incident sound absorption coefficient according to ISO 10534-2 (2002) [24]. Sixteen measurements were averaged to derive the sound absorption coefficient from the transfer function. The sound pressure level in the impedance tube varied with the frequency but was approximately 100 dB. The frequency limit for the formation of plane waves differs depending on the inner diameter of the acoustic tube. The inner diameter was 29 mm, and ISO 10534-2 [24] and the tube manual specified a measurement range of 500–6400 Hz for a distance of 20 mm between microphones. In this study, experimental results are presented for a range of 300–6400 Hz for reference purposes.
The damping ratio is calculated as follows. First, a burst wave is radiated to the sample at the peak sound absorption frequency. The time waveform of the reverberation sound is transformed by the Hilbert transform, and the slope of the damping waveform |a| is calculated. This can then be used to calculate the damping ratio:
ζ = a 2 π 20 log 10 e f peak
where ζ1 and ζ2 are the damping ratios obtained at the first and second peak frequencies, respectively.

3. Results

3.1. Powder Classification

Powders were classified according to whether they absorbed sound predominantly by longitudinal vibration (i.e., groups A and B) or vibrated slightly (i.e., group C) according to the areal density per grain layer. The half-width method was used to quantify the sharpness of the sound absorption curves for groups A and B, but this method requires the measurement of the sound absorption coefficient. Thus, the experimental measurements were analyzed to determine whether the sound absorption performances of the powders could be predicted using only the powder specifications (i.e., areal density per grain layer, bulk density, and grain size) without the measurement of the sound absorption coefficient.

3.1.1. Relationship Between the Areal Density per Grain Layer and Sound Absorption Coefficient

Figure 5 plots the relationship between the areal density per grain layer and the first peak sound absorption for a layer thickness of 20 mm. Decreasing the areal density per grain layer clearly increased the sound absorption coefficient at the first frequency peak. In other words, the areal density per grain layer is an important parameter that indicates the ease of sound absorption by longitudinal vibration of the powder grains. Powder samples in groups A and B had areal densities per grain layer of 0.0006 g/cm2 or less. In contrast, powder samples in group C had an areal density per grain layer of greater than 0.0006 g/cm2. This suggests that a threshold areal density per grain layer of around 0.0006 g/cm2 dictates whether longitudinal vibration is the dominant sound absorption mode.

3.1.2. Correlation Between the Half-Width and Powder Specifications

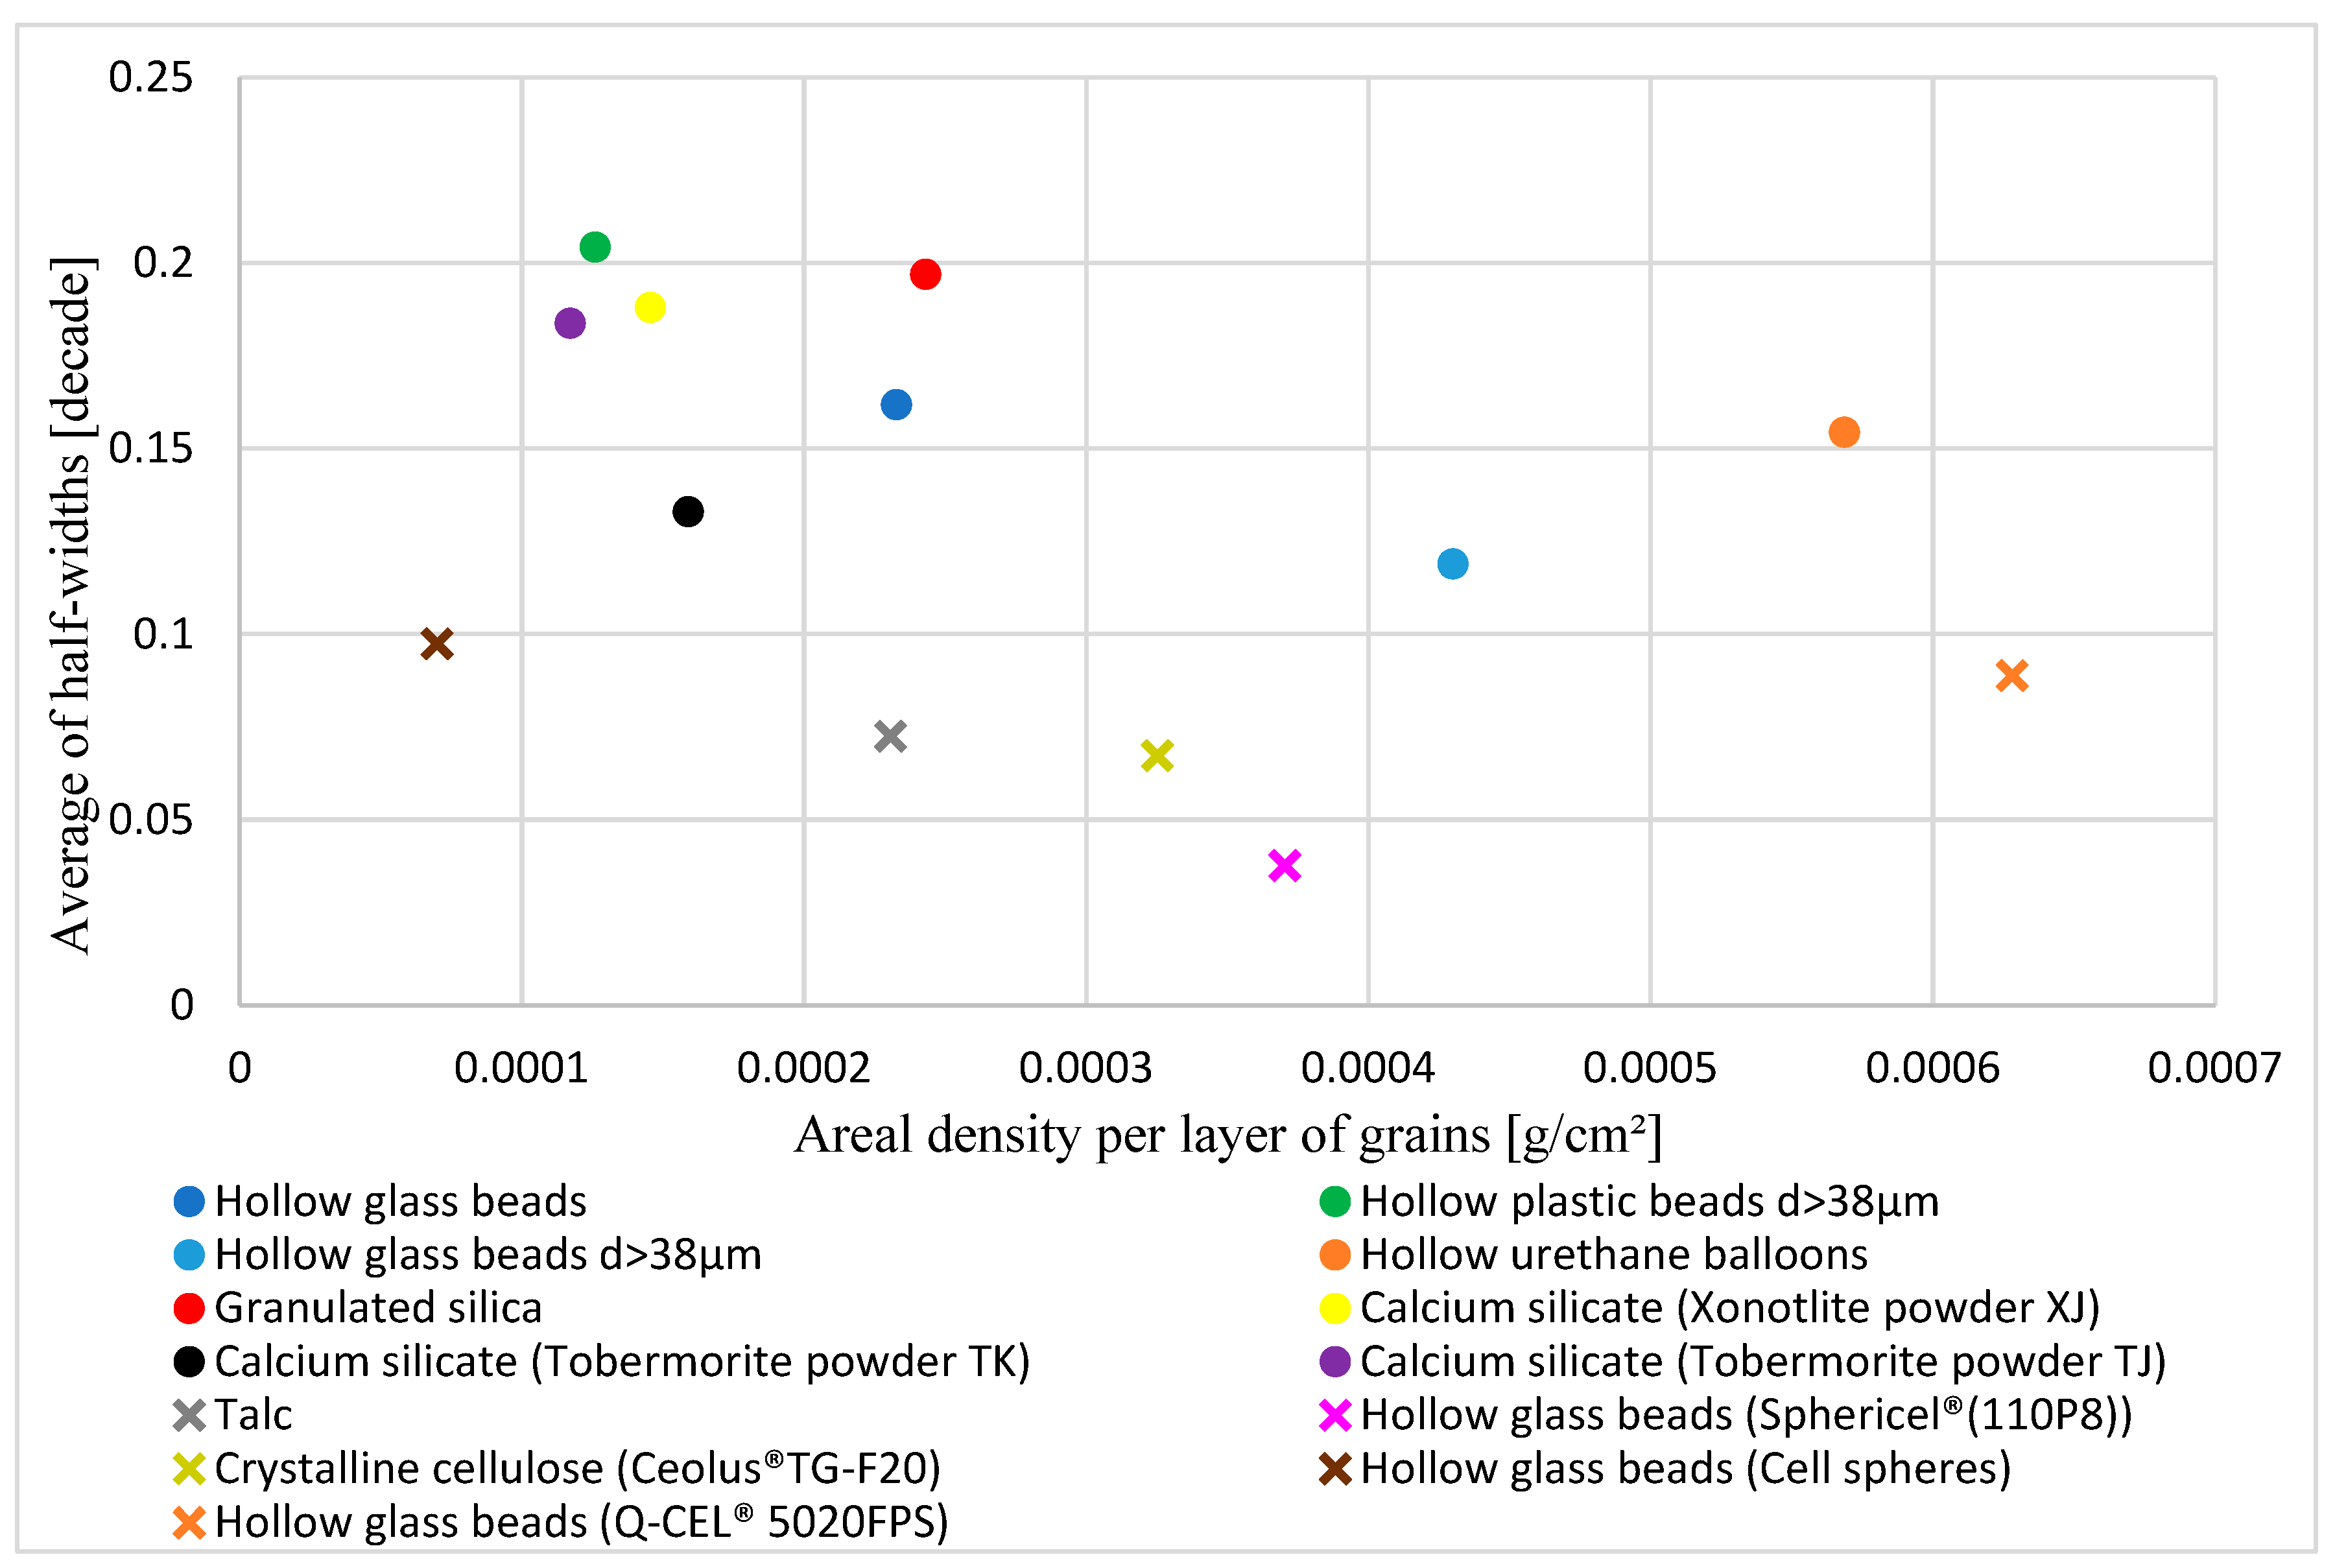
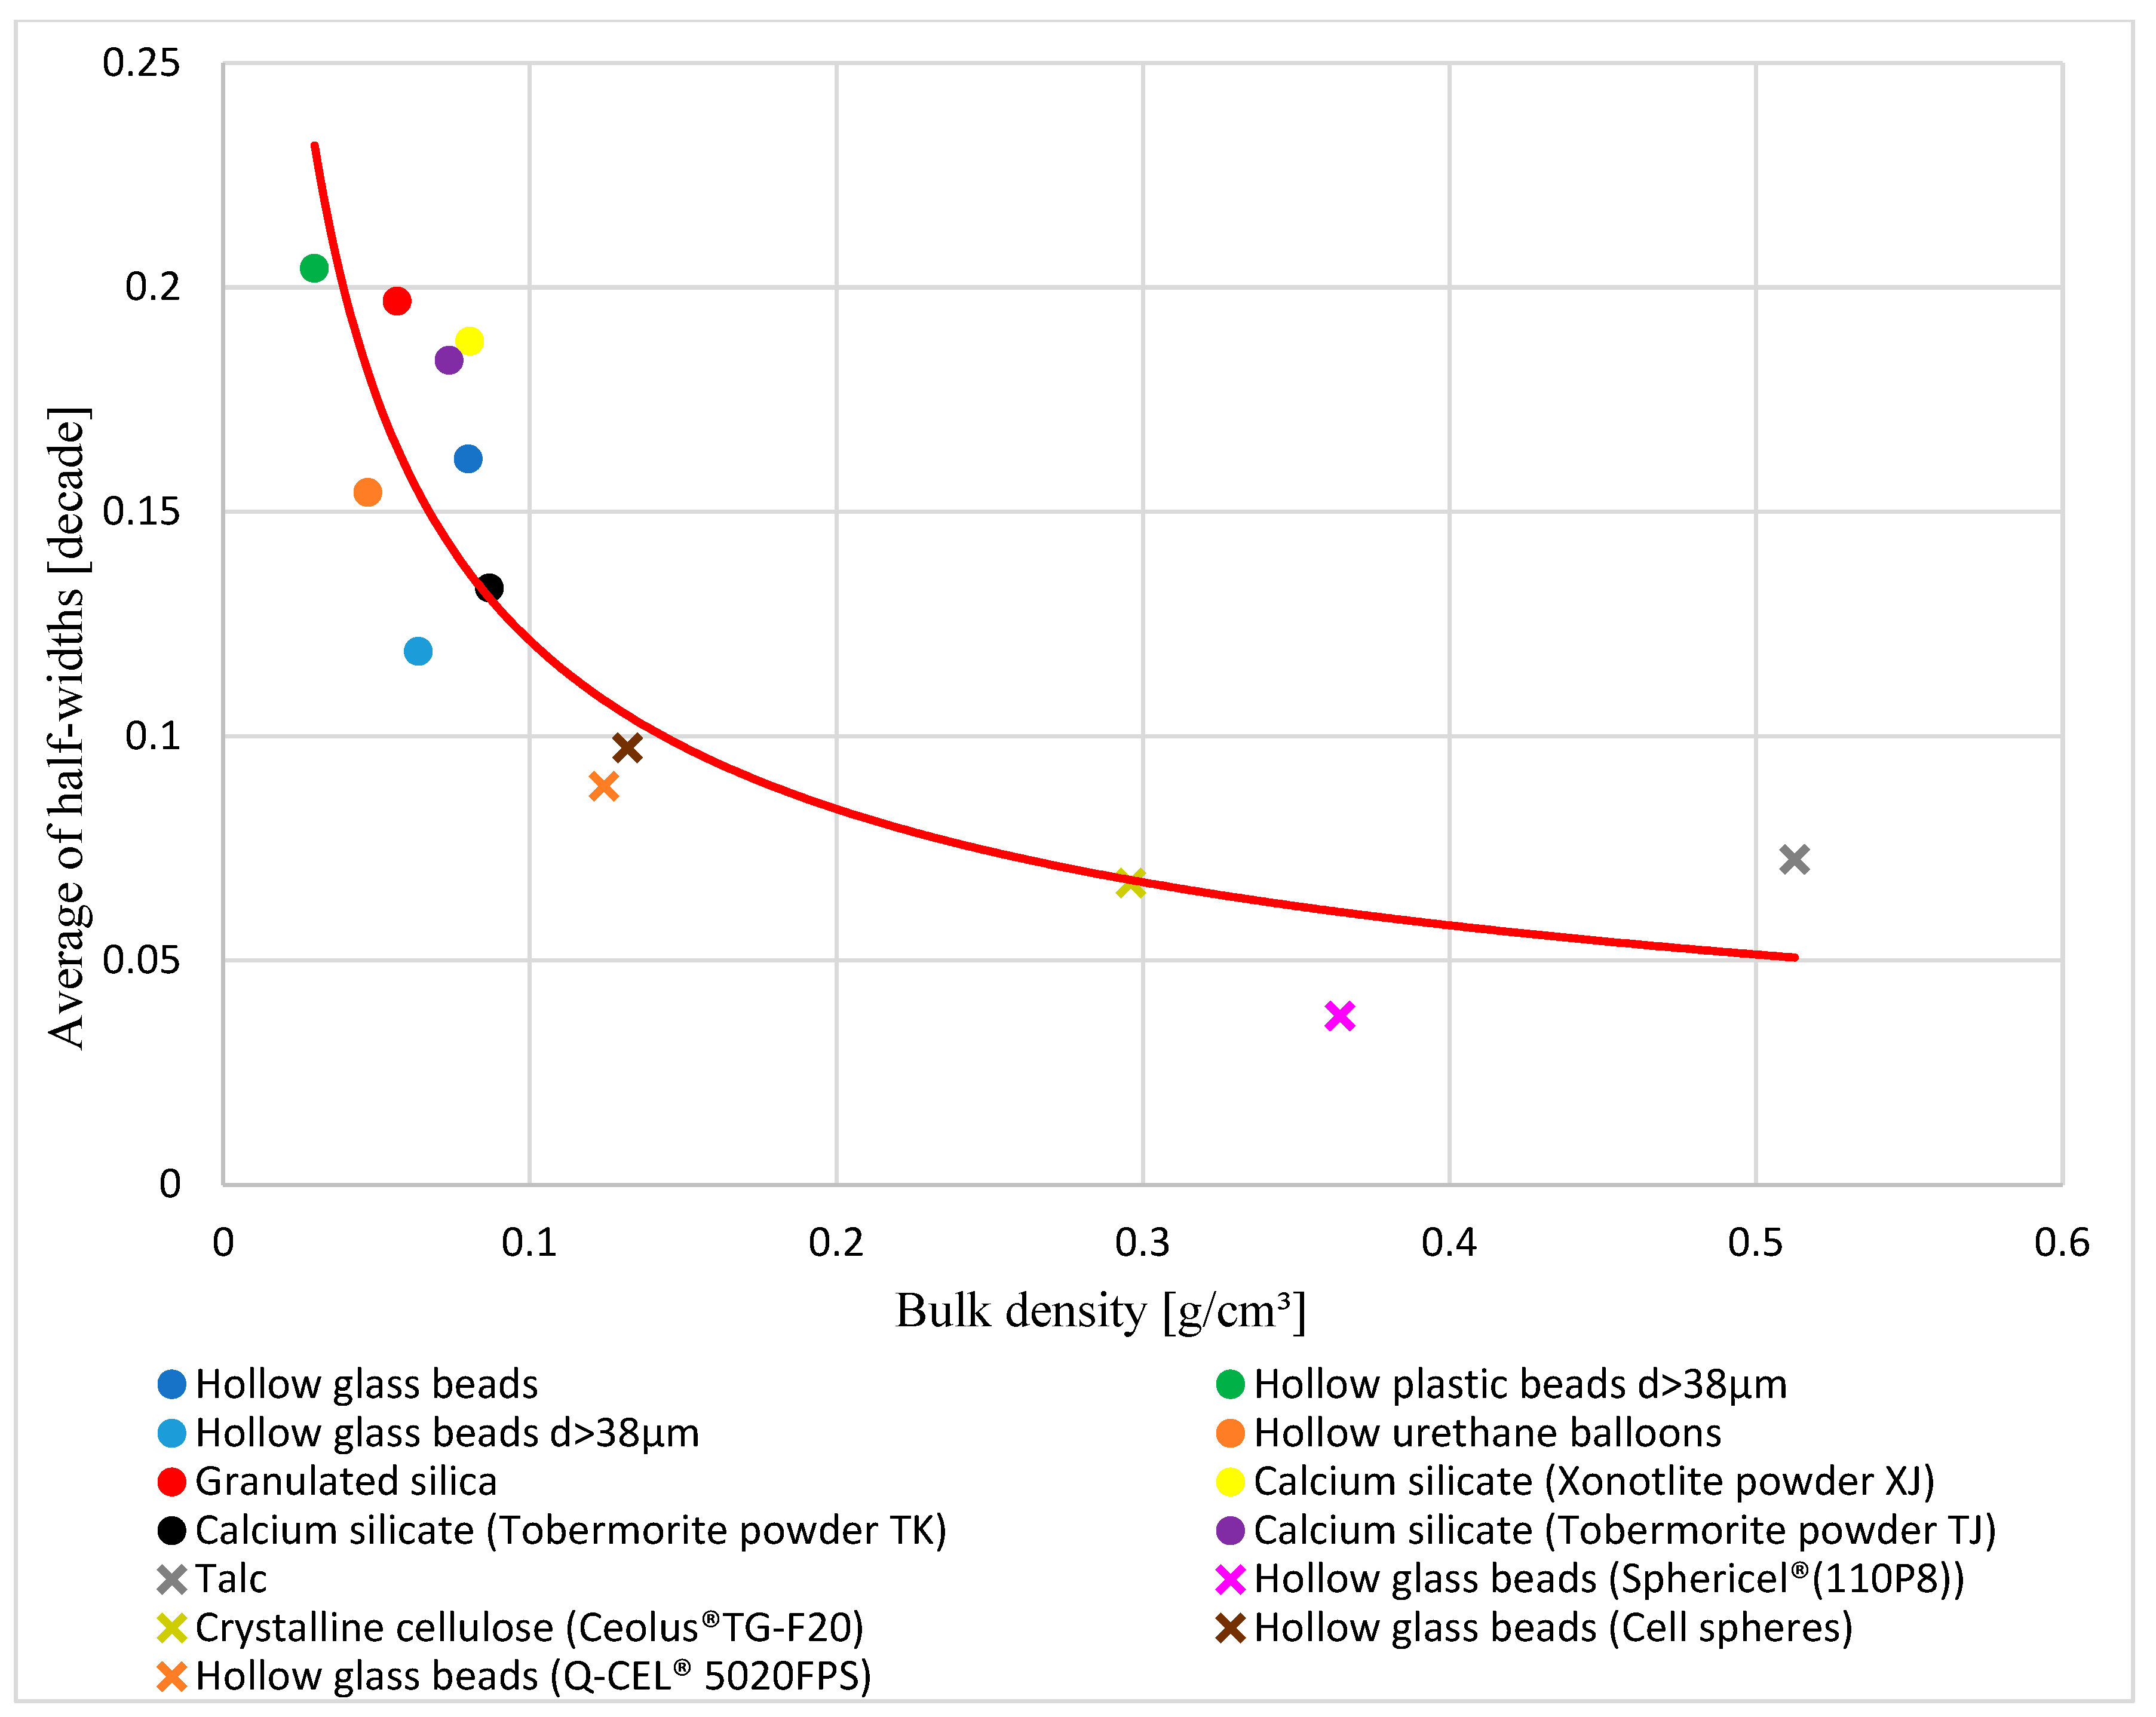
The sharpness of the sound absorption curves was quantified by using the half-width method. Group A had large half-widths while group B had small half-widths. Figure 6, Figure 7 and Figure 8 graph the correlations between the half-widths of the powders and the areal density per grain layer, bulk density, and grain size, respectively. Group A is indicated by filled circles, and group B is indicated by cross marks. A boundary can be observed between the half-widths of group A and group B, which is expressed by 0.0974 < log f2 − log f1 < 0.119 decade.

3.1.3. Classification by Powder Specifications

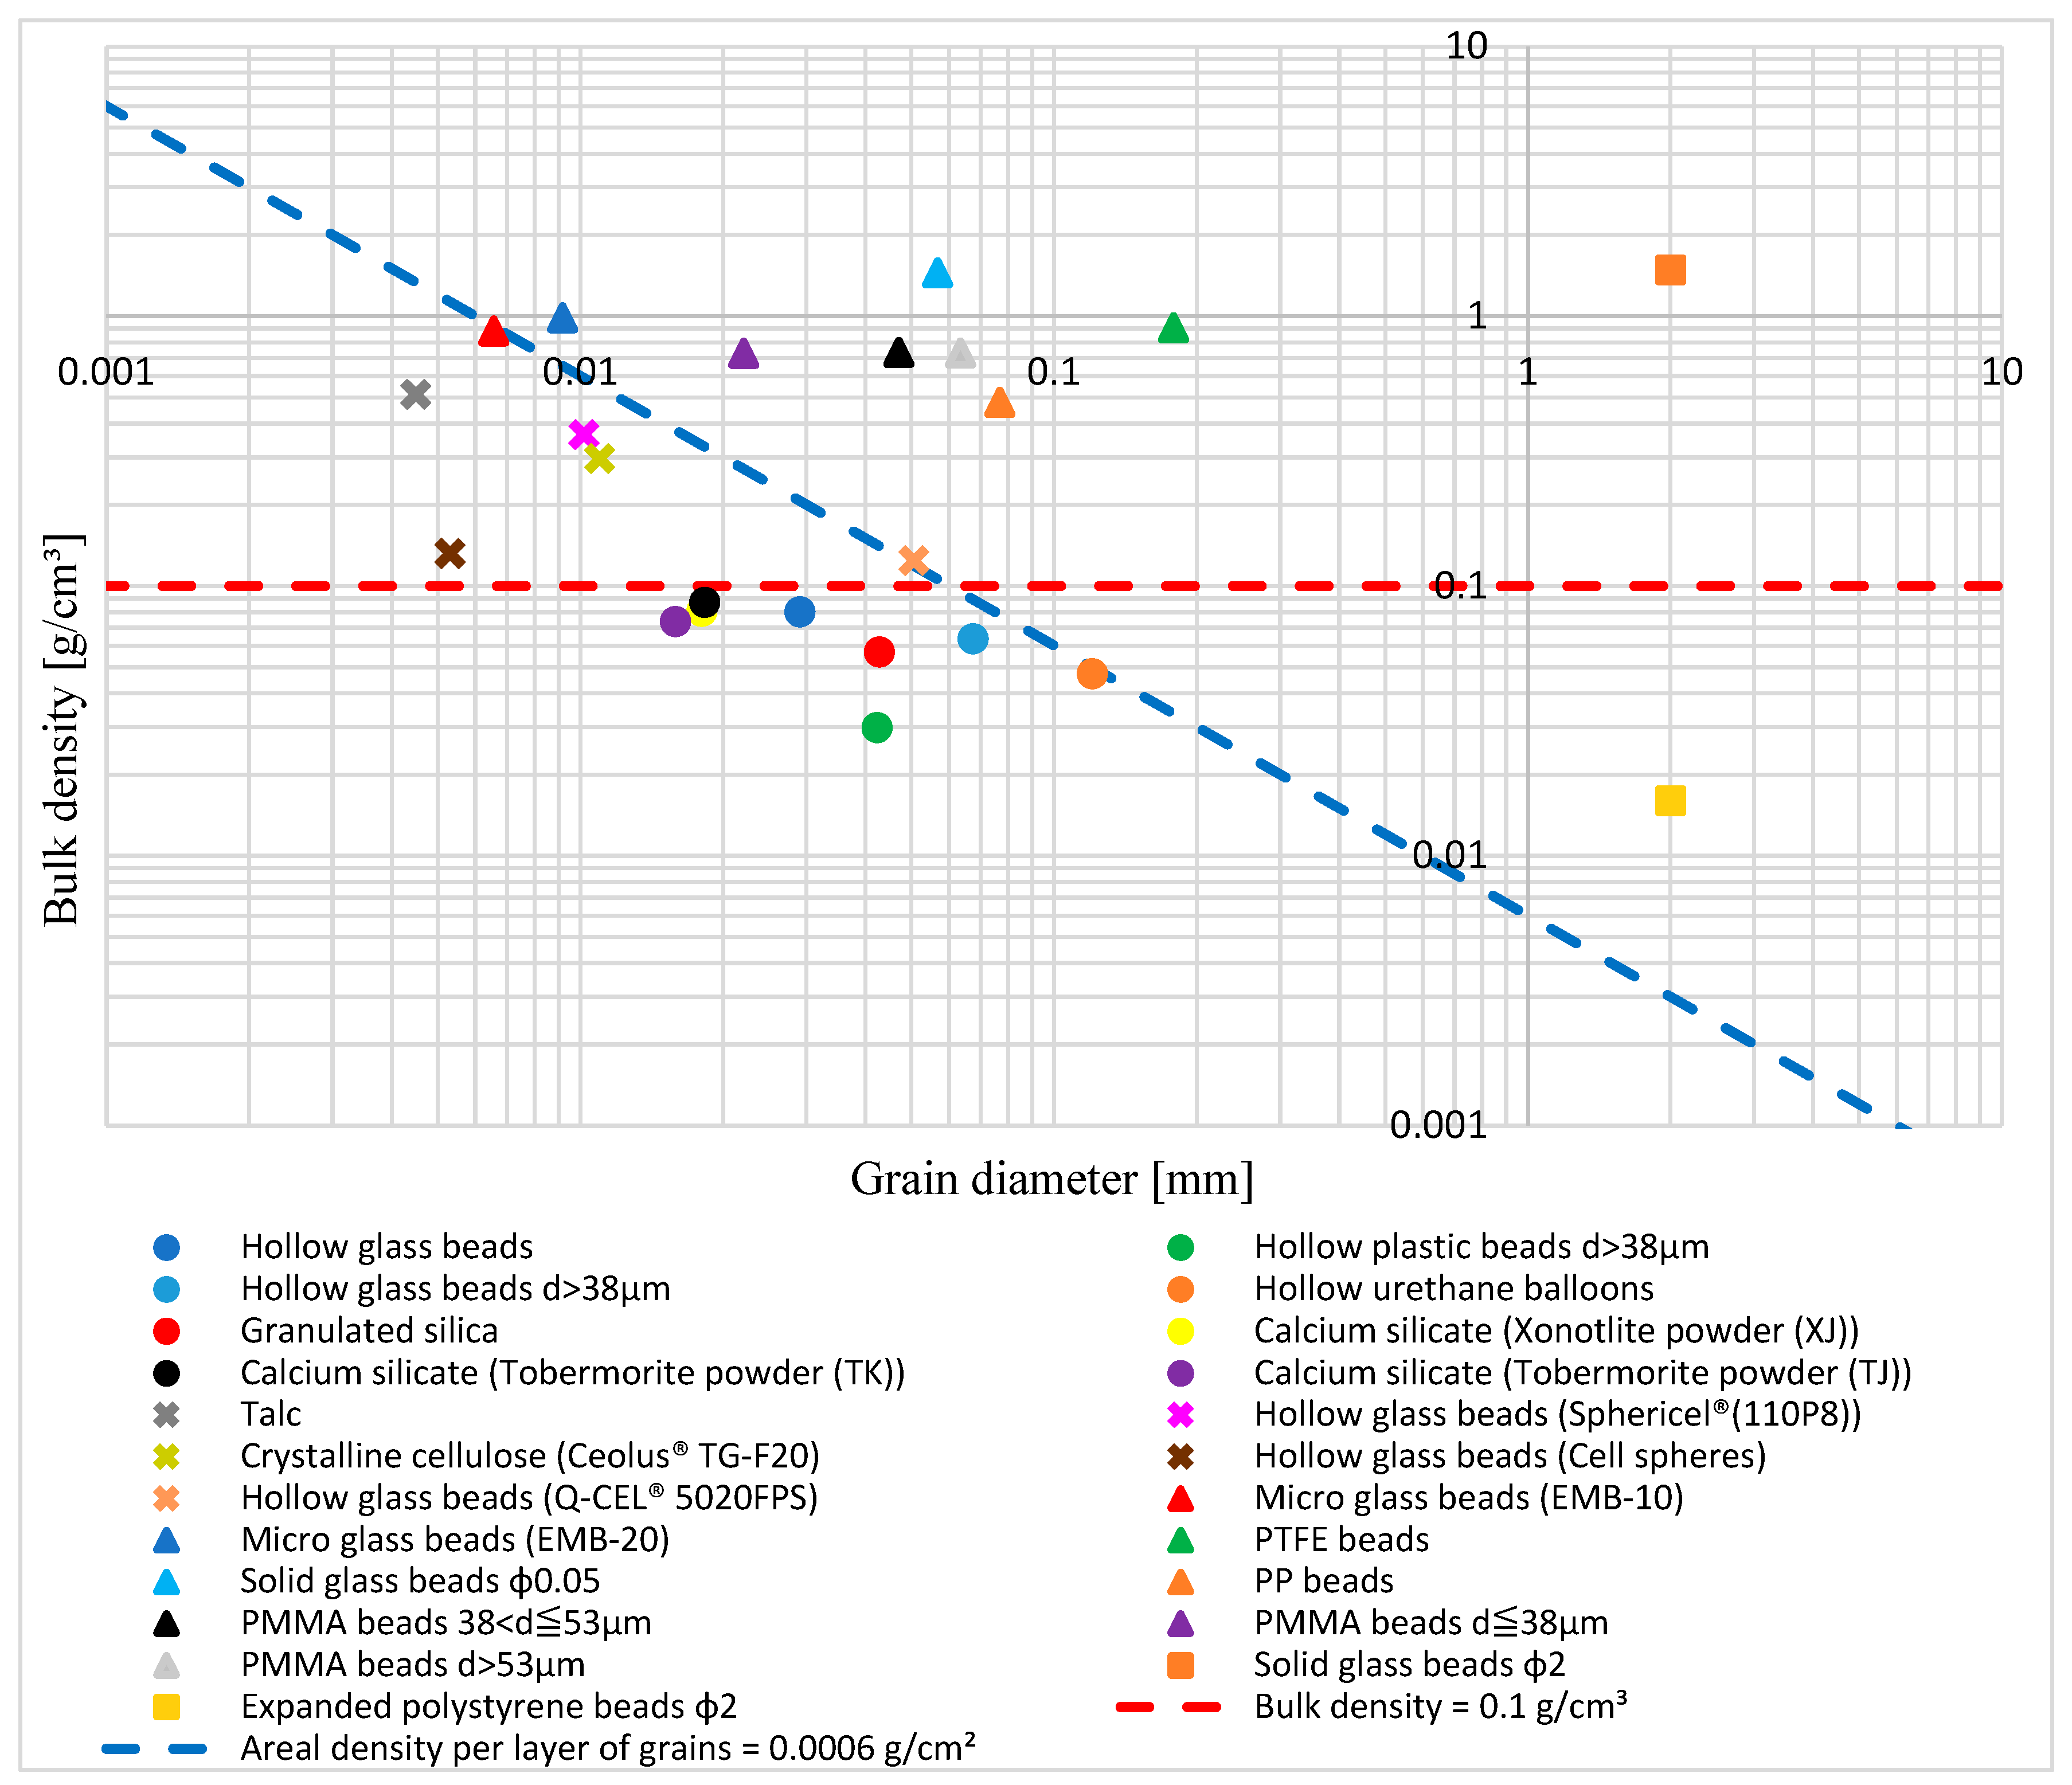
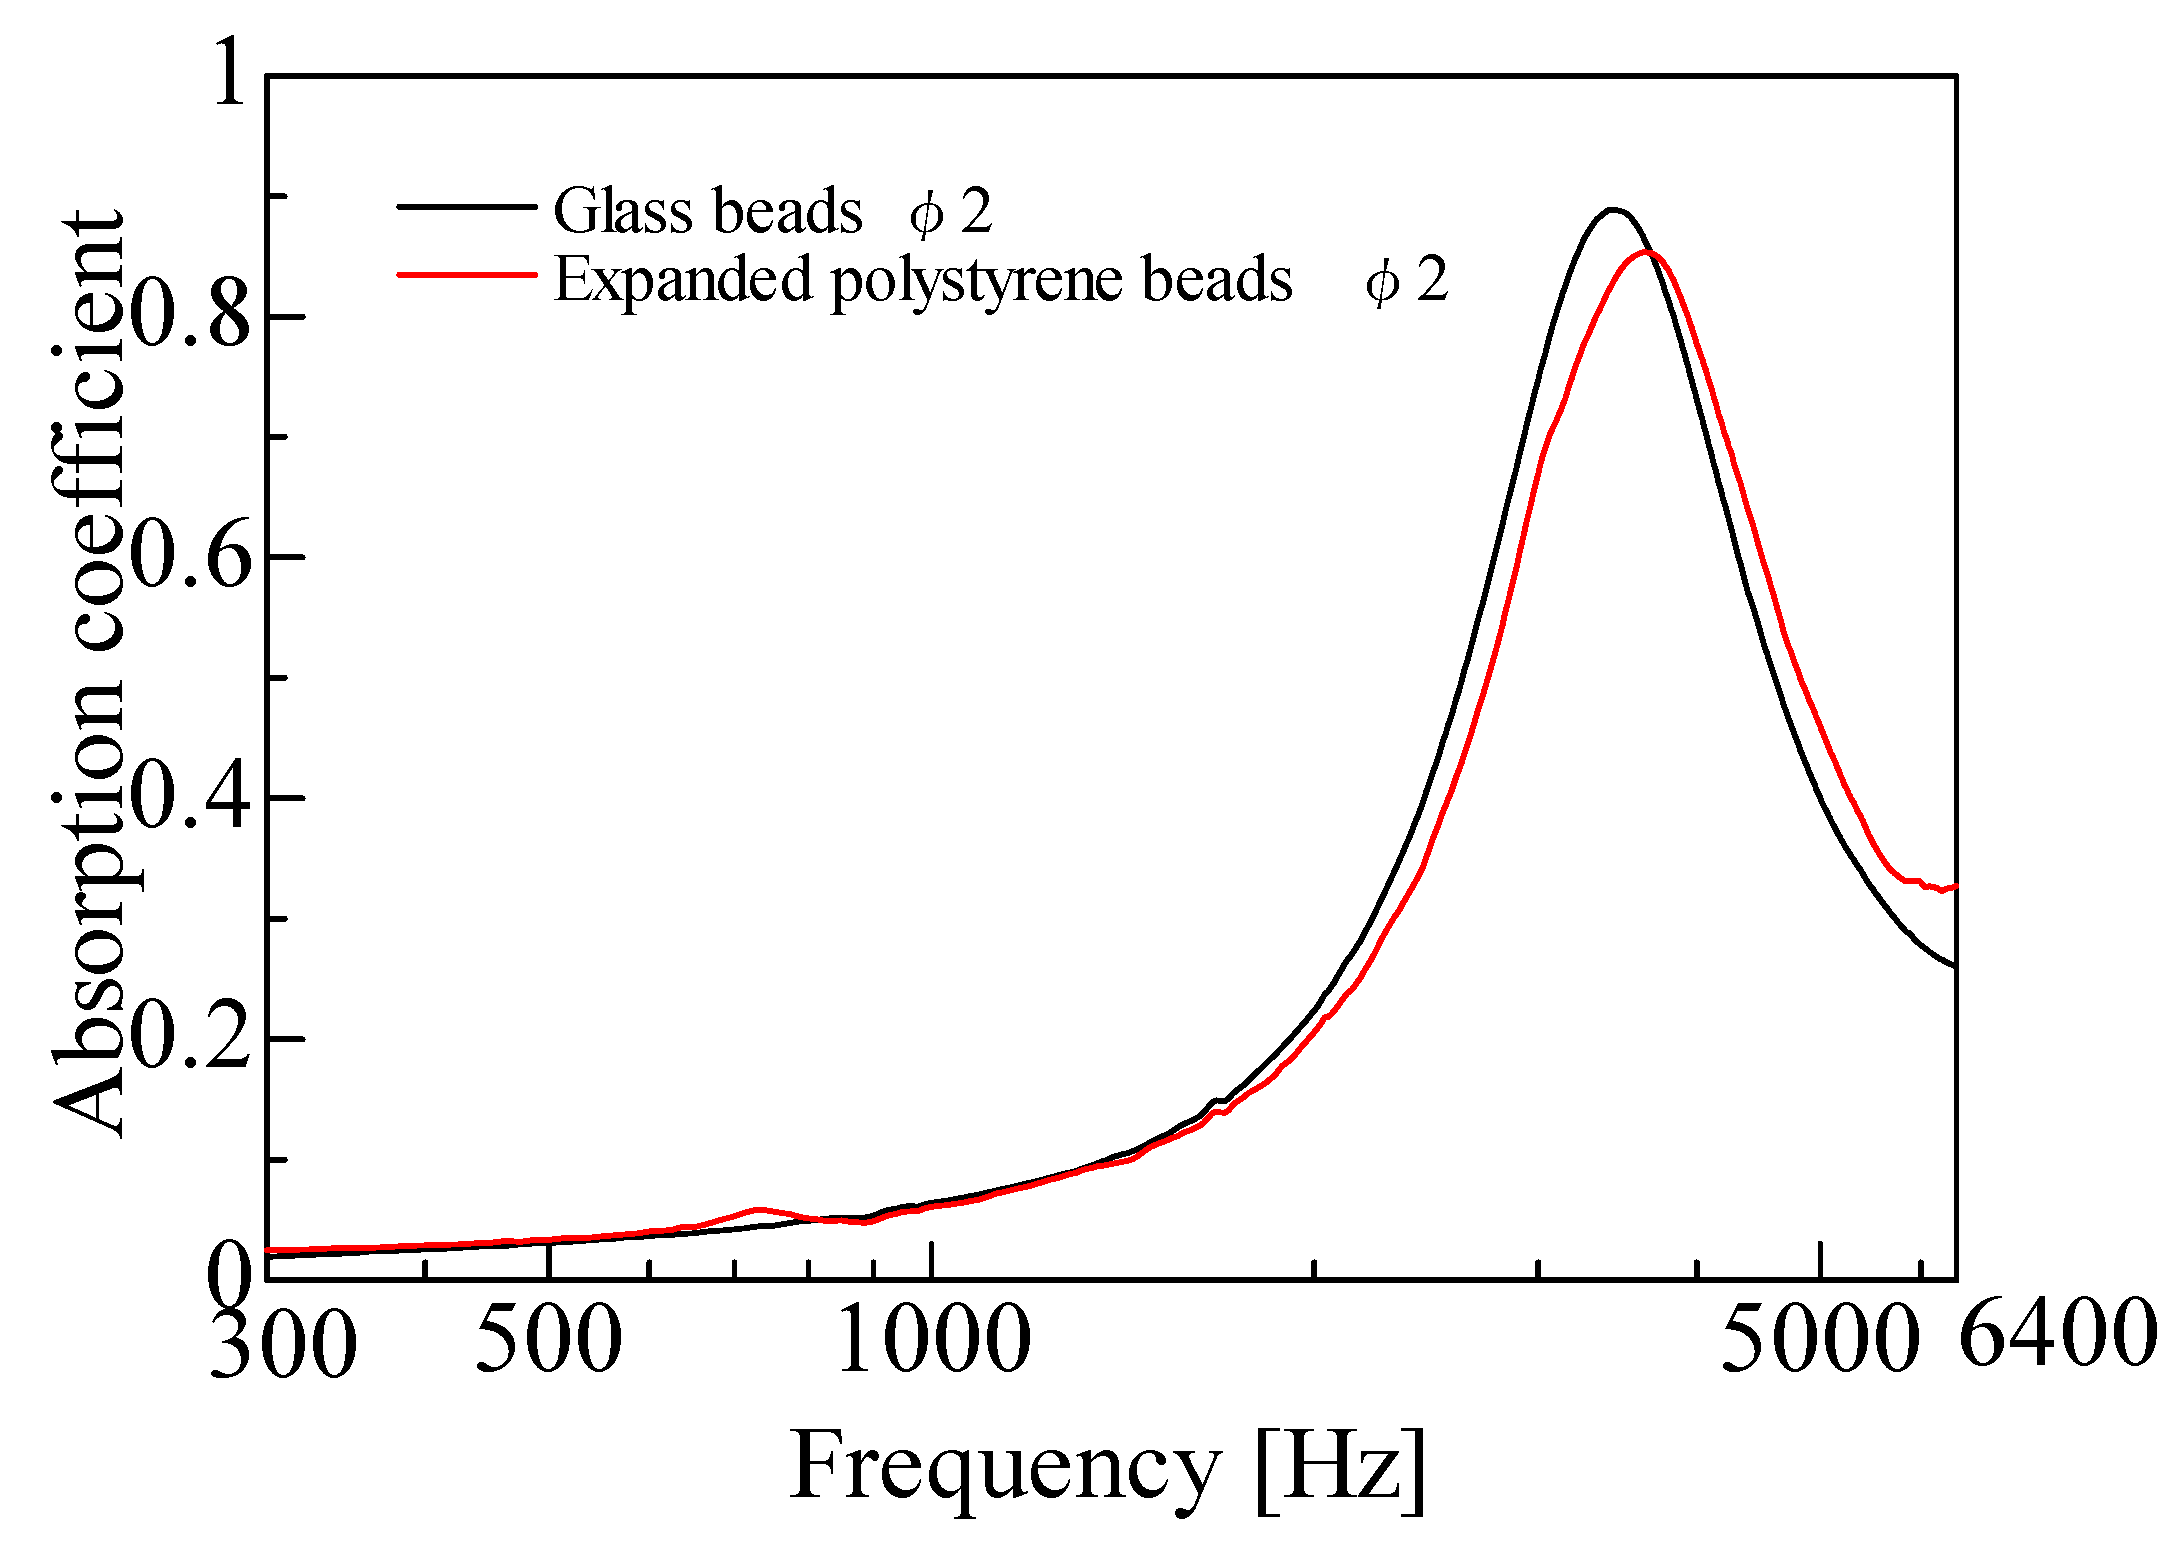
Figure 9 shows the relationship between the bulk density and grain size of the powders. Group A is indicated by filled circles, group B is indicated by cross marks, and group C is indicated by filled triangles. The filled squares indicated glass beads and expanded polystyrene beads with a diameter of 2 mm that were included as references. Figure 10 plots the measured sound absorption coefficients of these glass beads and expanded polystyrene beads. Although Figure 3 shows that the sound absorption curves of the sample powders had peaks at low frequencies, Figure 10 shows that the reference granular materials had sound absorption curves similar to those of general porous materials with peaks at high frequencies. These results were attributed to the gaps between the granular materials acting like pores. The red dashed line in Figure 9 indicates a bulk density of 0.1 g/cm3 that can be used to separate group A from groups B and C. The blue dashed line indicates an areal density per grain layer of 0.0006 g/cm2 that can be used to separate groups A and B from group C. However, Figure 9 clearly shows that individual groups cannot be classified by using the grain size. A threshold can be observed between the bulk densities of groups A and B for the first absorption peak frequency at 0.0868 < ρ < 0.124 g/cm3. However, Figure 10 shows that sound absorption due to longitudinal vibration does not occur for powders with a low bulk density if the grain size is large, such as for polystyrene beads with a diameter of 2 mm. Thus, to distinguish between groups A and B, not only the bulk density but also the grain size must be considered.
Figure 11 shows the relationship between the bulk density and areal density per grain layer of the powders. Groups A and B both had a low areal density per grain layer, and it is not possible to distinguish between the two groups using only this specification. The red and blue dashed lines can be used together as thresholds for classifying groups A and B. In other words, a lightweight powder can be predicted to be in group A (i.e., useful sound absorption characteristics) if it has a bulk density of 0.0868 g/cm3 or less and an areal density per grain layer of 0.0006 g/cm2.

3.2. Regression Analysis

Estimating the sound absorption coefficient of a powder layer requires the grain size, bulk density, damping ratio, thickness of the powder layer, and peak sound absorption frequency at that layer thickness to be given. A regression analysis was performed to derive empirical equations for determining the first peak sound absorption frequency from the various powder specifications. The sound absorption coefficient is less sensitive to the damping ratio than the peak sound absorption frequency, so the average of the measured values was used to represent the estimated damping ratio. The sound absorption coefficient was then calculated from the estimated first sound absorption peak frequency and damping ratio. Lightweight powders in groups A and B were considered.

3.2.1. Peak Sound Absorption Frequency

Figure 12 shows the relationship between the areal density per grain layer and the first sound absorption peak frequency of the lightweight powders. The peak frequency varies with the layer thickness.
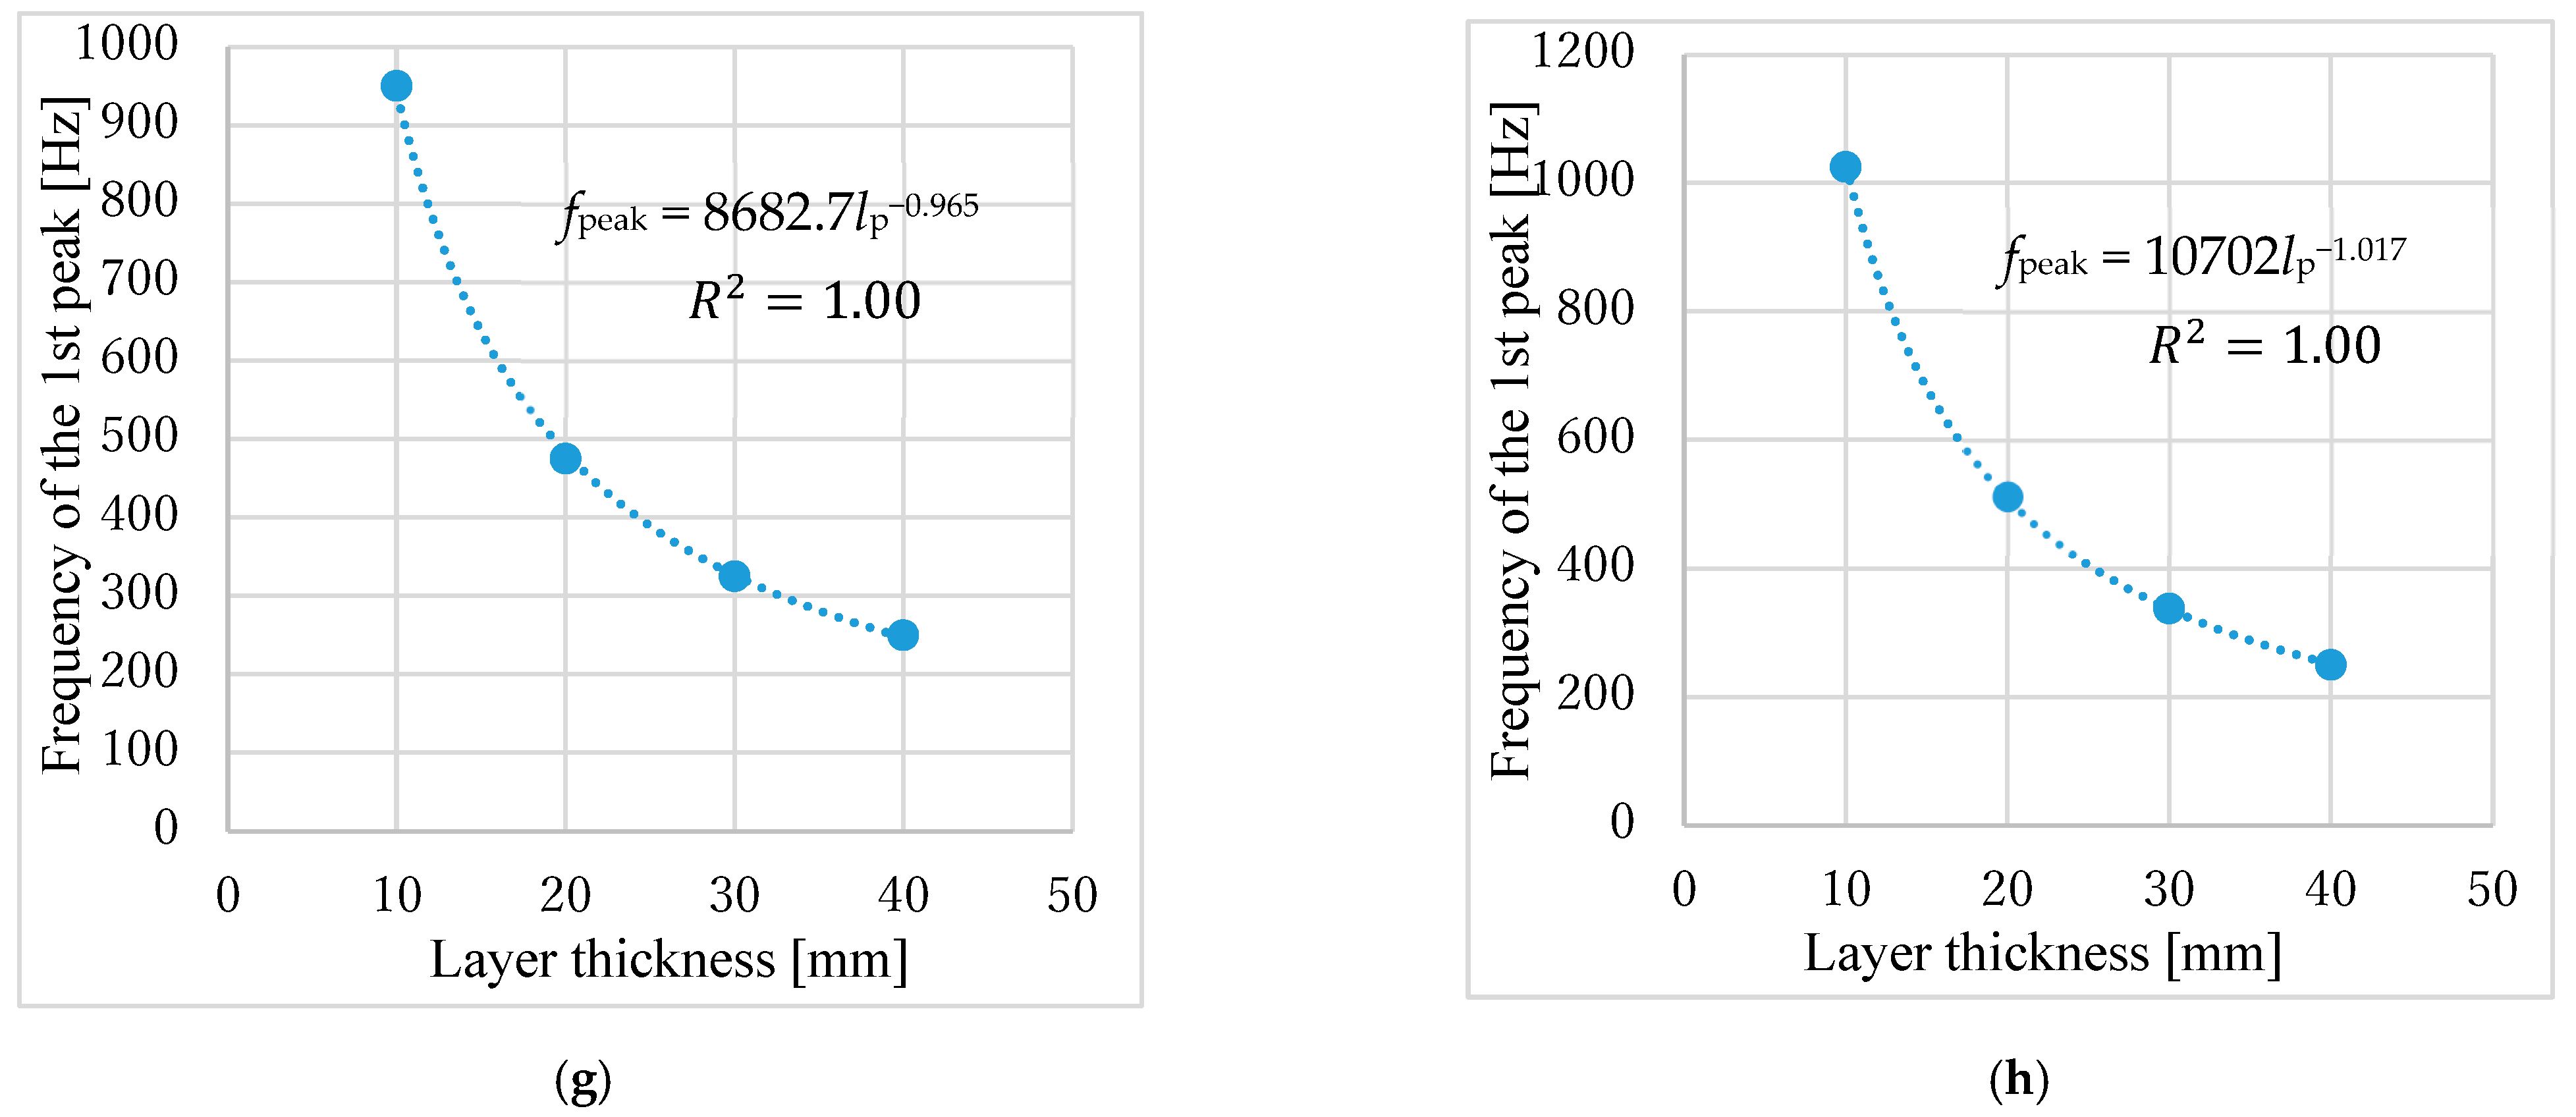
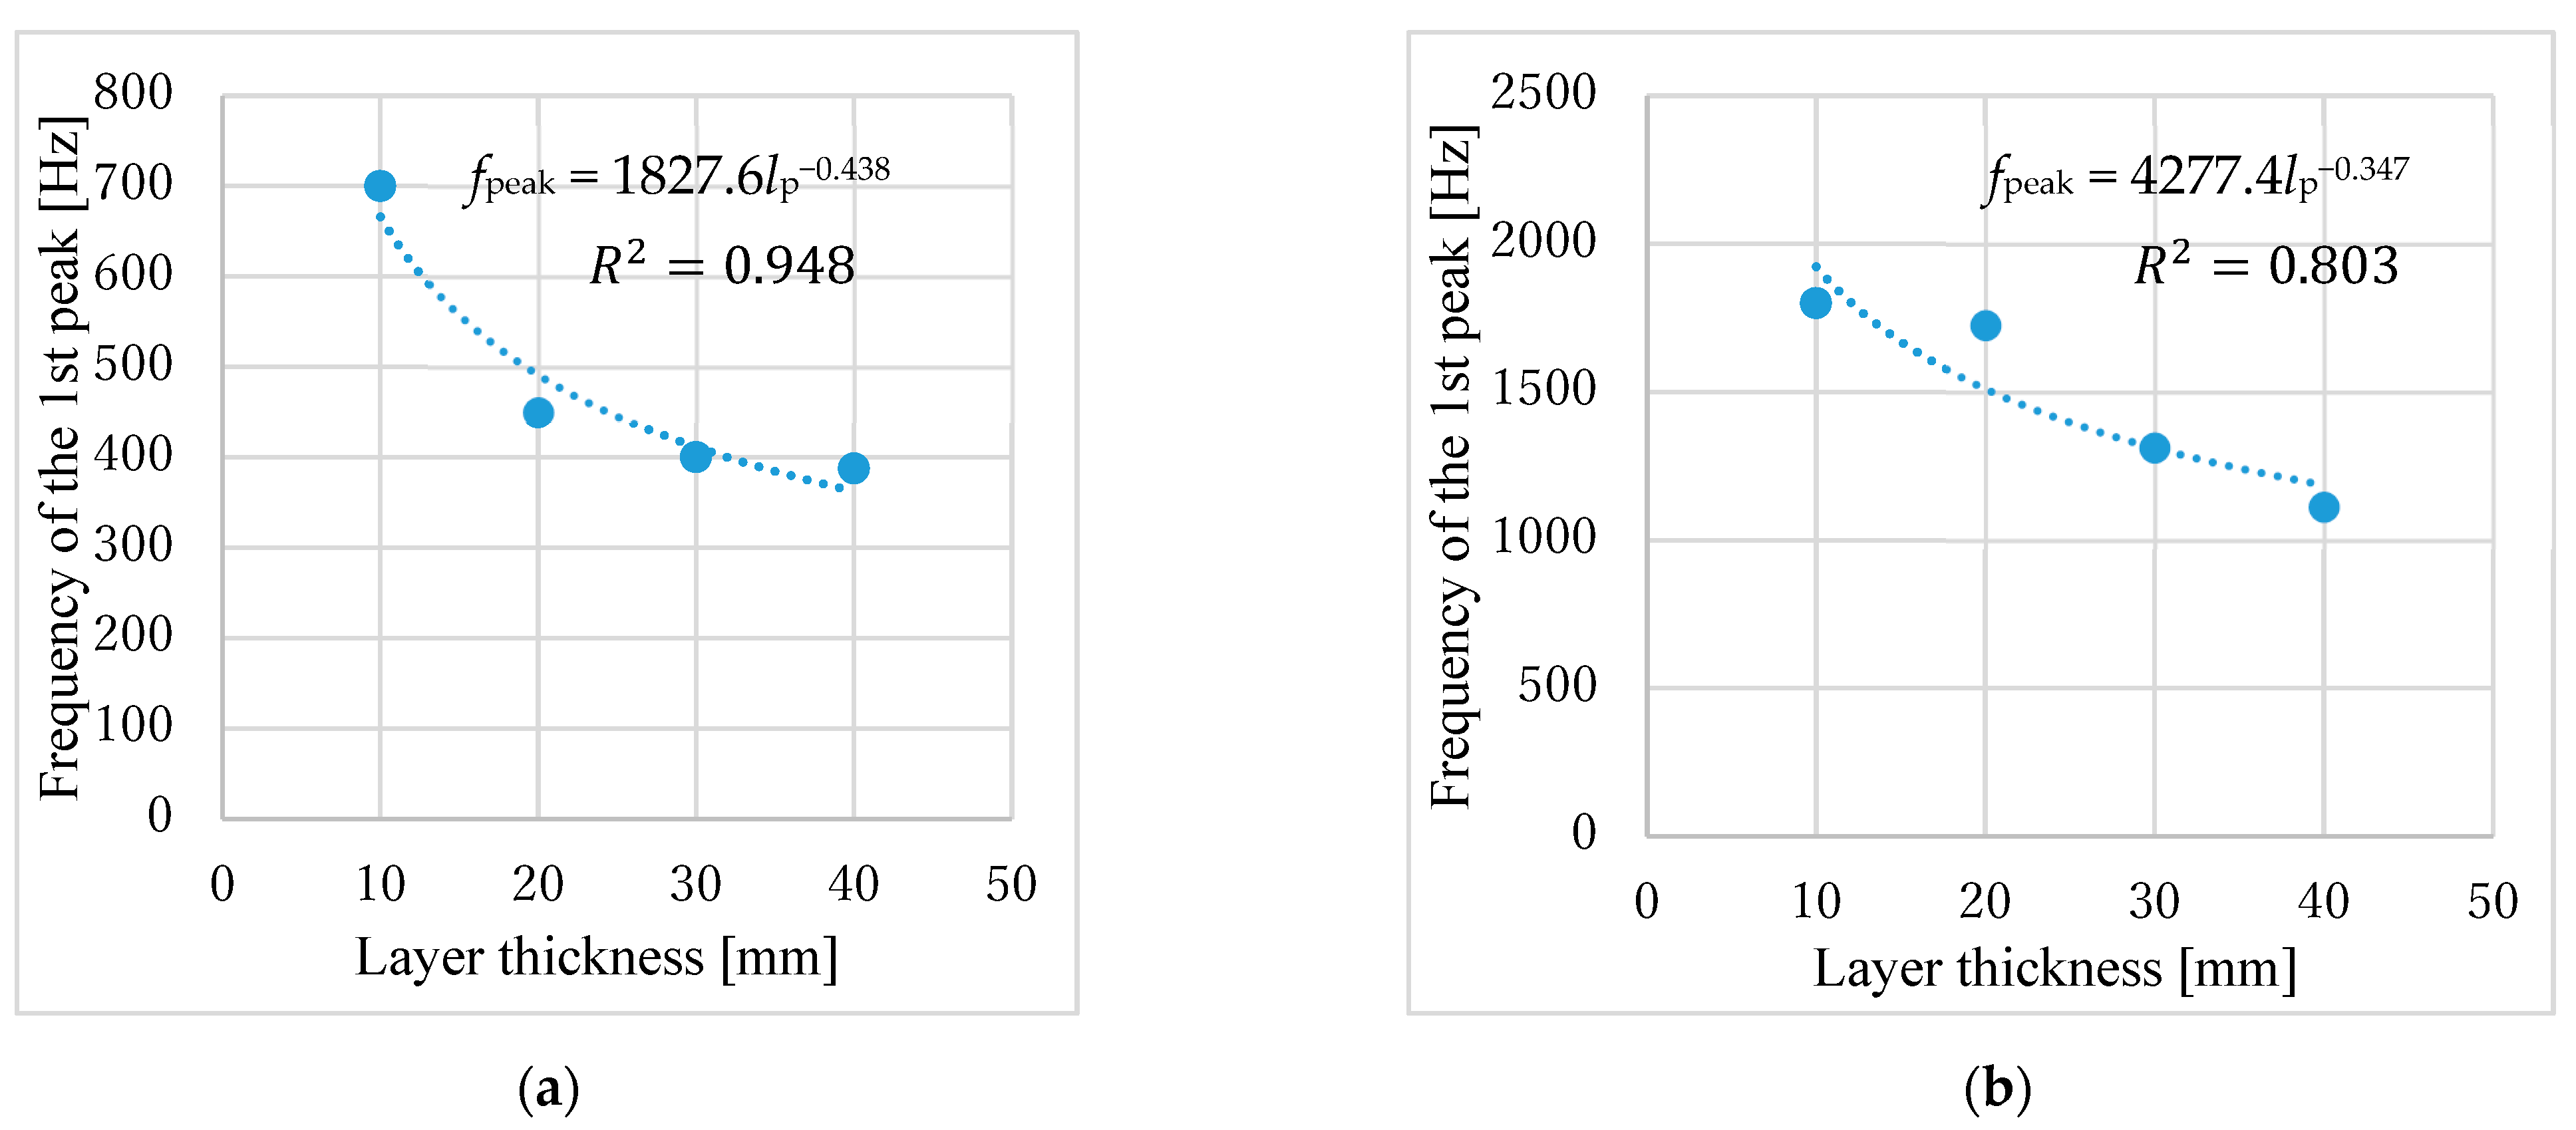
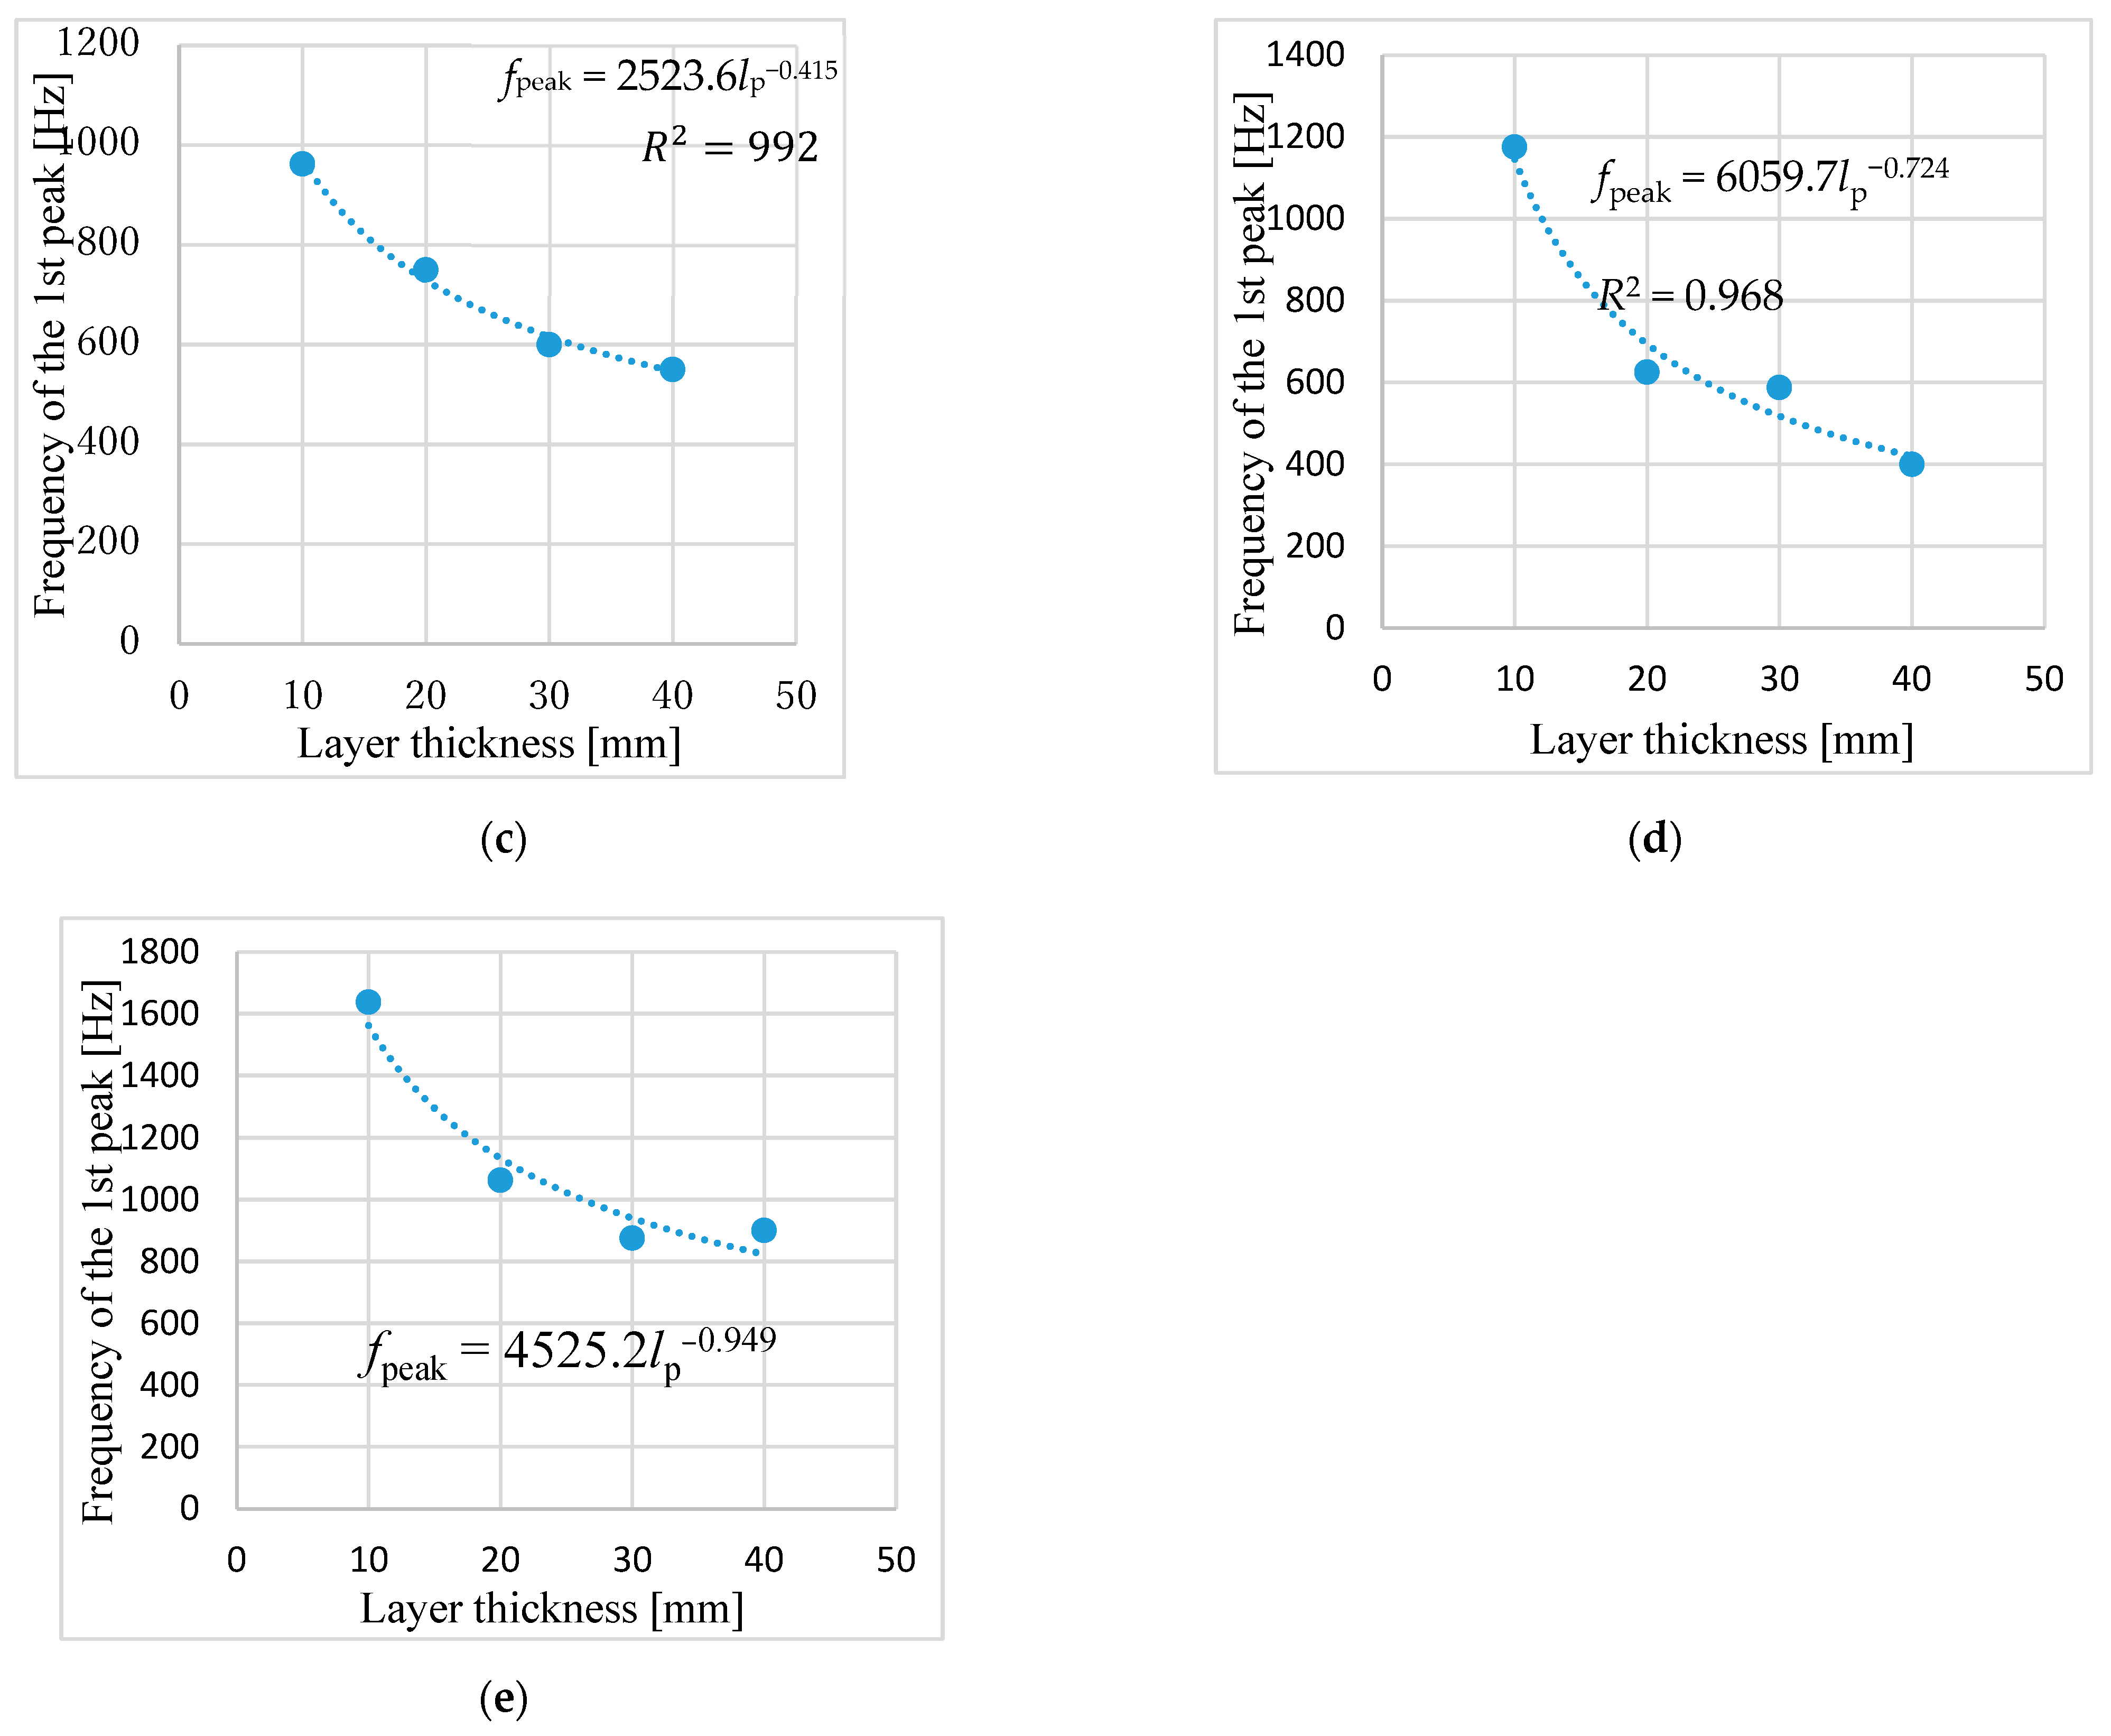
Figure 13 and Figure 14 plot the relationships between the layer thickness and the first sound absorption peak frequency of group A and group B, respectively. Increasing the layer thickness decreased the first sound absorption peak frequency. Here, R2 denotes the determination coefficient of the regression curve. In Figure 13 and Figure 14, the coefficients of determination exceed 0.8, indicating a satisfactory fit of the regression curves to the observed values. The least-squares method was applied to deriving regression equations from the plots in Figure 13 and Figure 14. For group A, the change in the first sound absorption peak frequency with the layer thickness was generally close to −1, which indicated an inversely proportional relationship that is similar to observations of the change in the peak frequency of general porous sound-absorbing materials. Thus, the first sound absorption peak frequency could be normalized by multiplying it by the layer thickness. In contrast, the exponent of the regression equation was not close to −1 for group B, and the normalization by layer thickness was not as coherent as for group A.
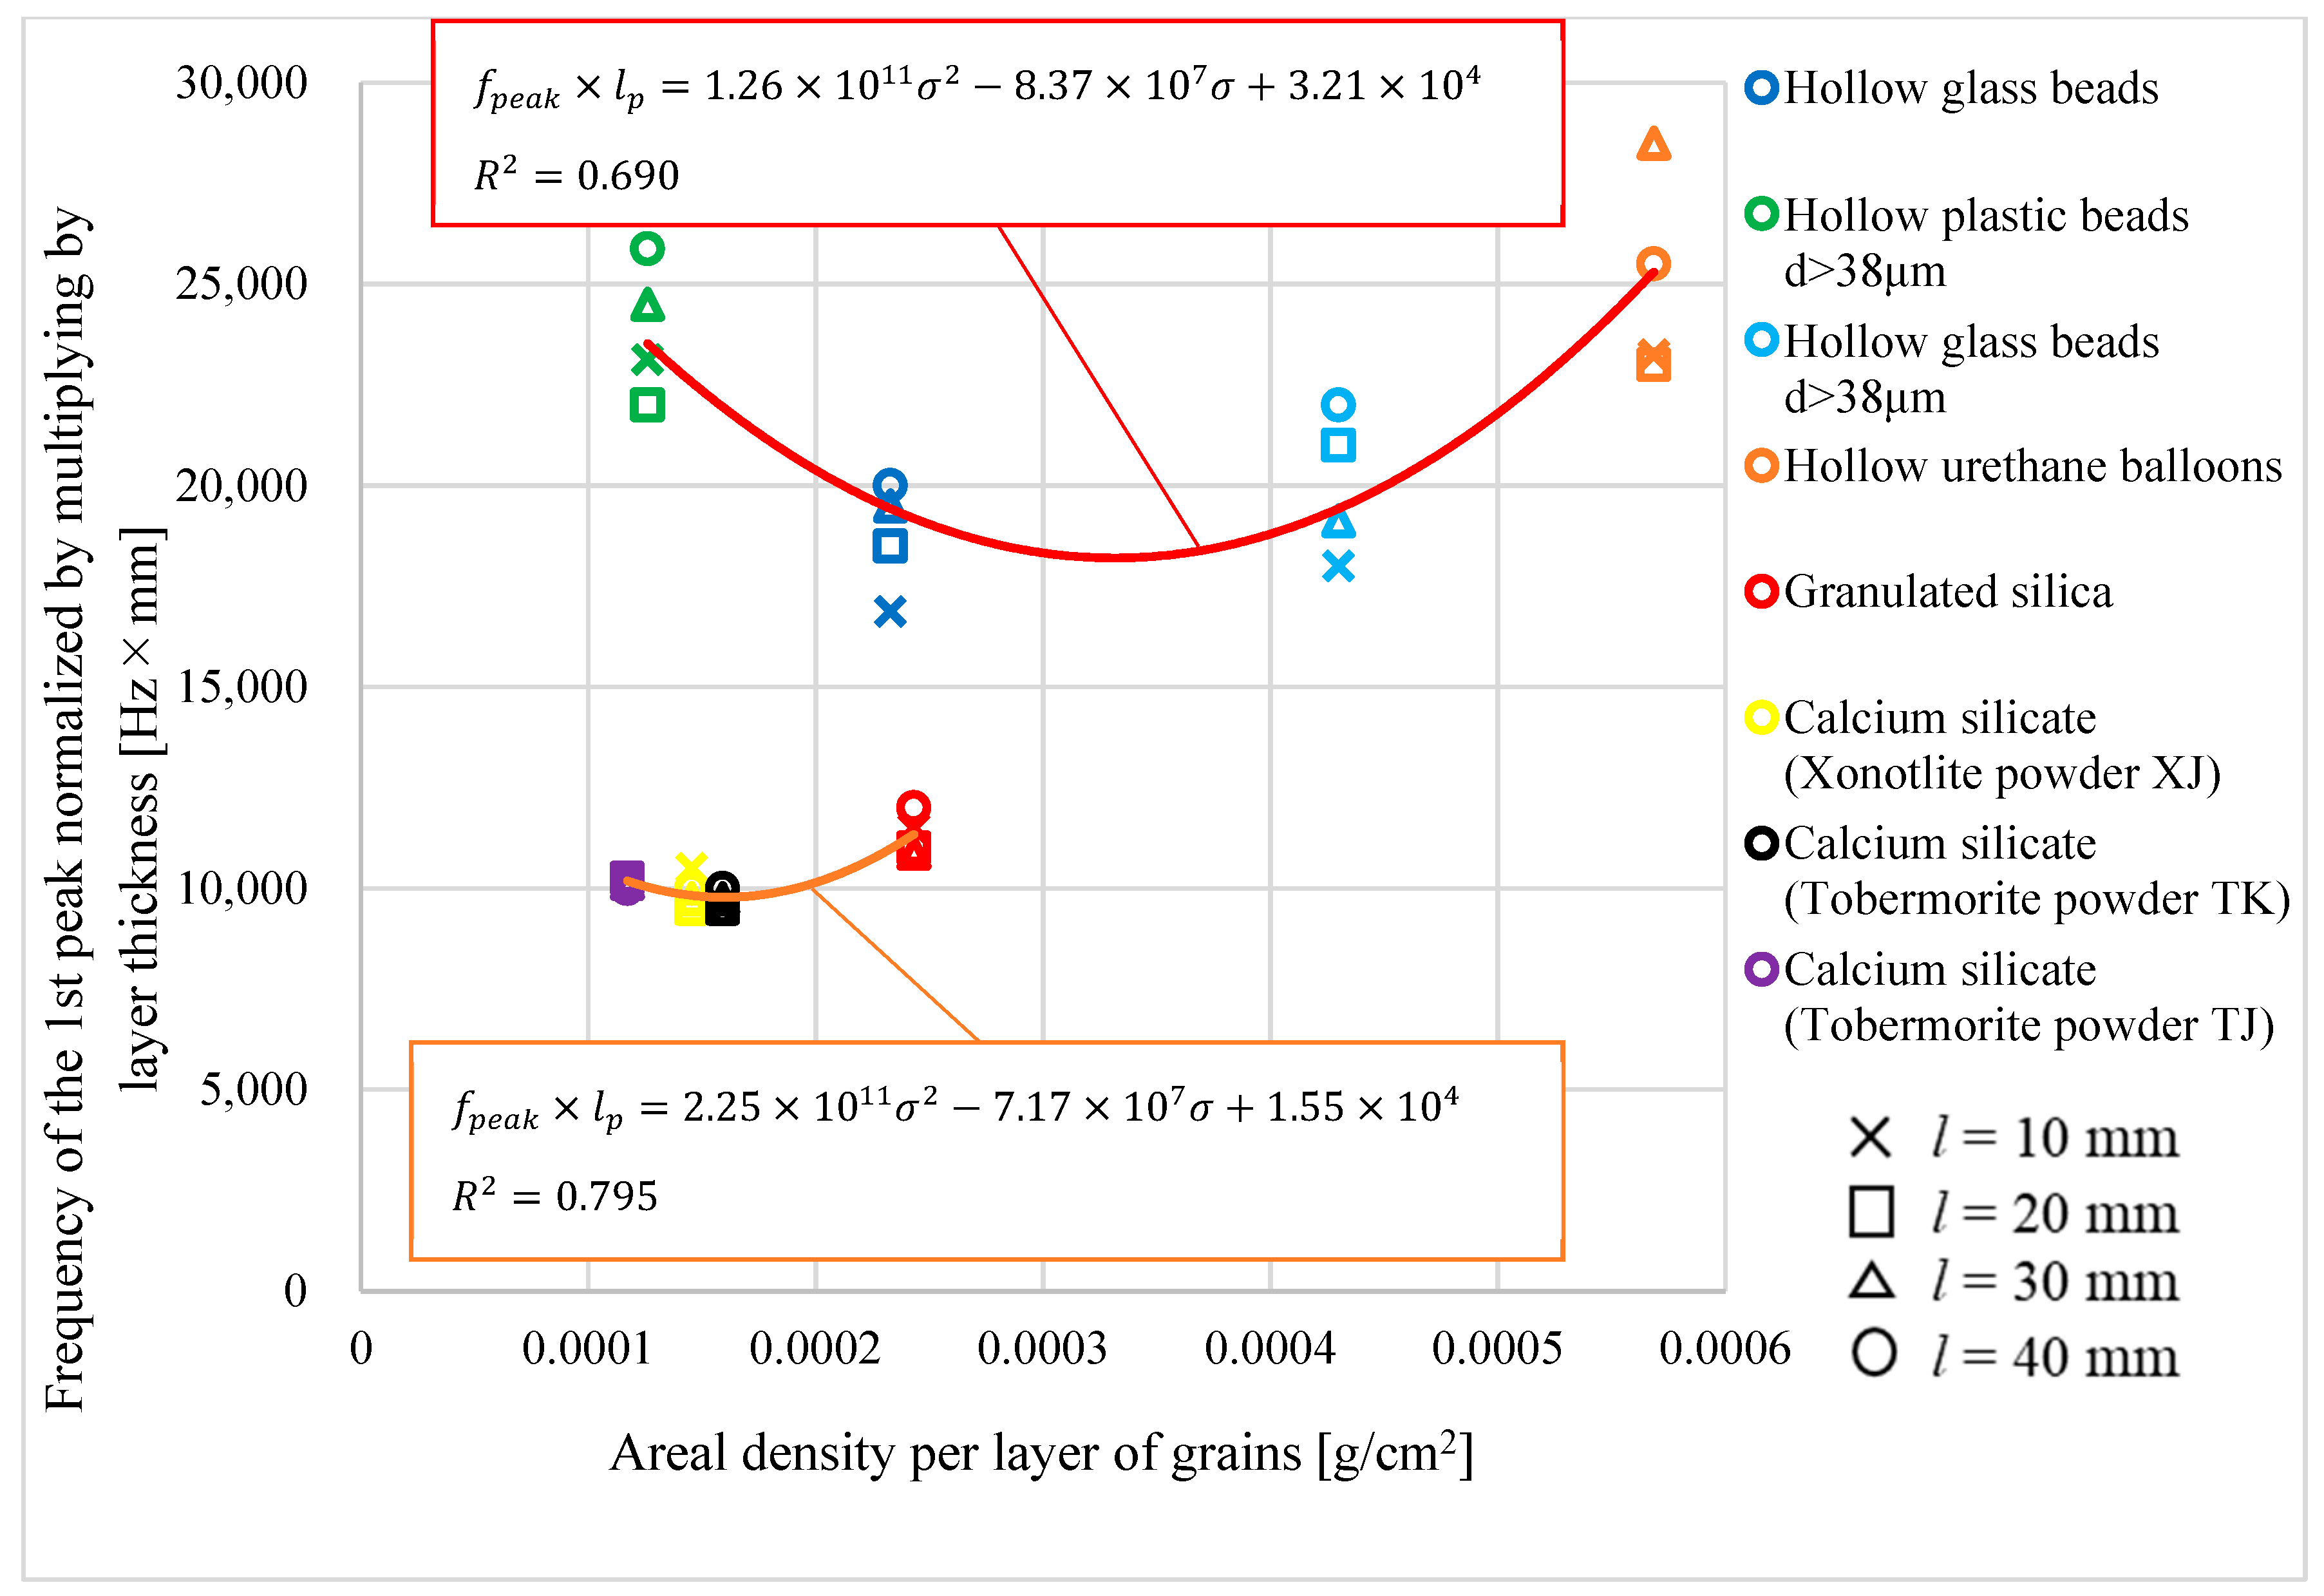
Figure 15 plots the relationship between the areal density per grain layer and the first sound absorption peak frequency normalized by the layer thickness of the group A powders. The regression curve from Figure 15 was used to derive an empirical equation for determining the first sound absorption peak frequency from the areal density per grain layer. Two quadratic curves were obtained for group A1 and had a normalized first sound absorption peak frequency of higher than 15,000, and group A2 had a normalized first sound absorption peak frequency of lower than 15,000. As illustrated in Figure 15, the determination coefficients R2 for groups A1 and A2 were approximately 0.7 and 0.8, respectively, suggesting an acceptable reproducibility of the regression curves to the actual values. This approach was not suitable for the group B powders because the normalized first sound absorption peak frequency was not well organized. In addition, no regression curves were attempted because the group B powders were not expected to be useful due to their small half-widths (Figure 7). The regression equation is applicable to areal densities per particle layer ranging from 0.000126 g/cm2 to 0.000569 g/cm2 for hollow powders, and from 0.000117 g/cm2 to 0.00024 g/cm2 for solid powders. Additional experiments with more samples are required to expand the applicability range of the regression equation.

3.2.2. Damping Ratio

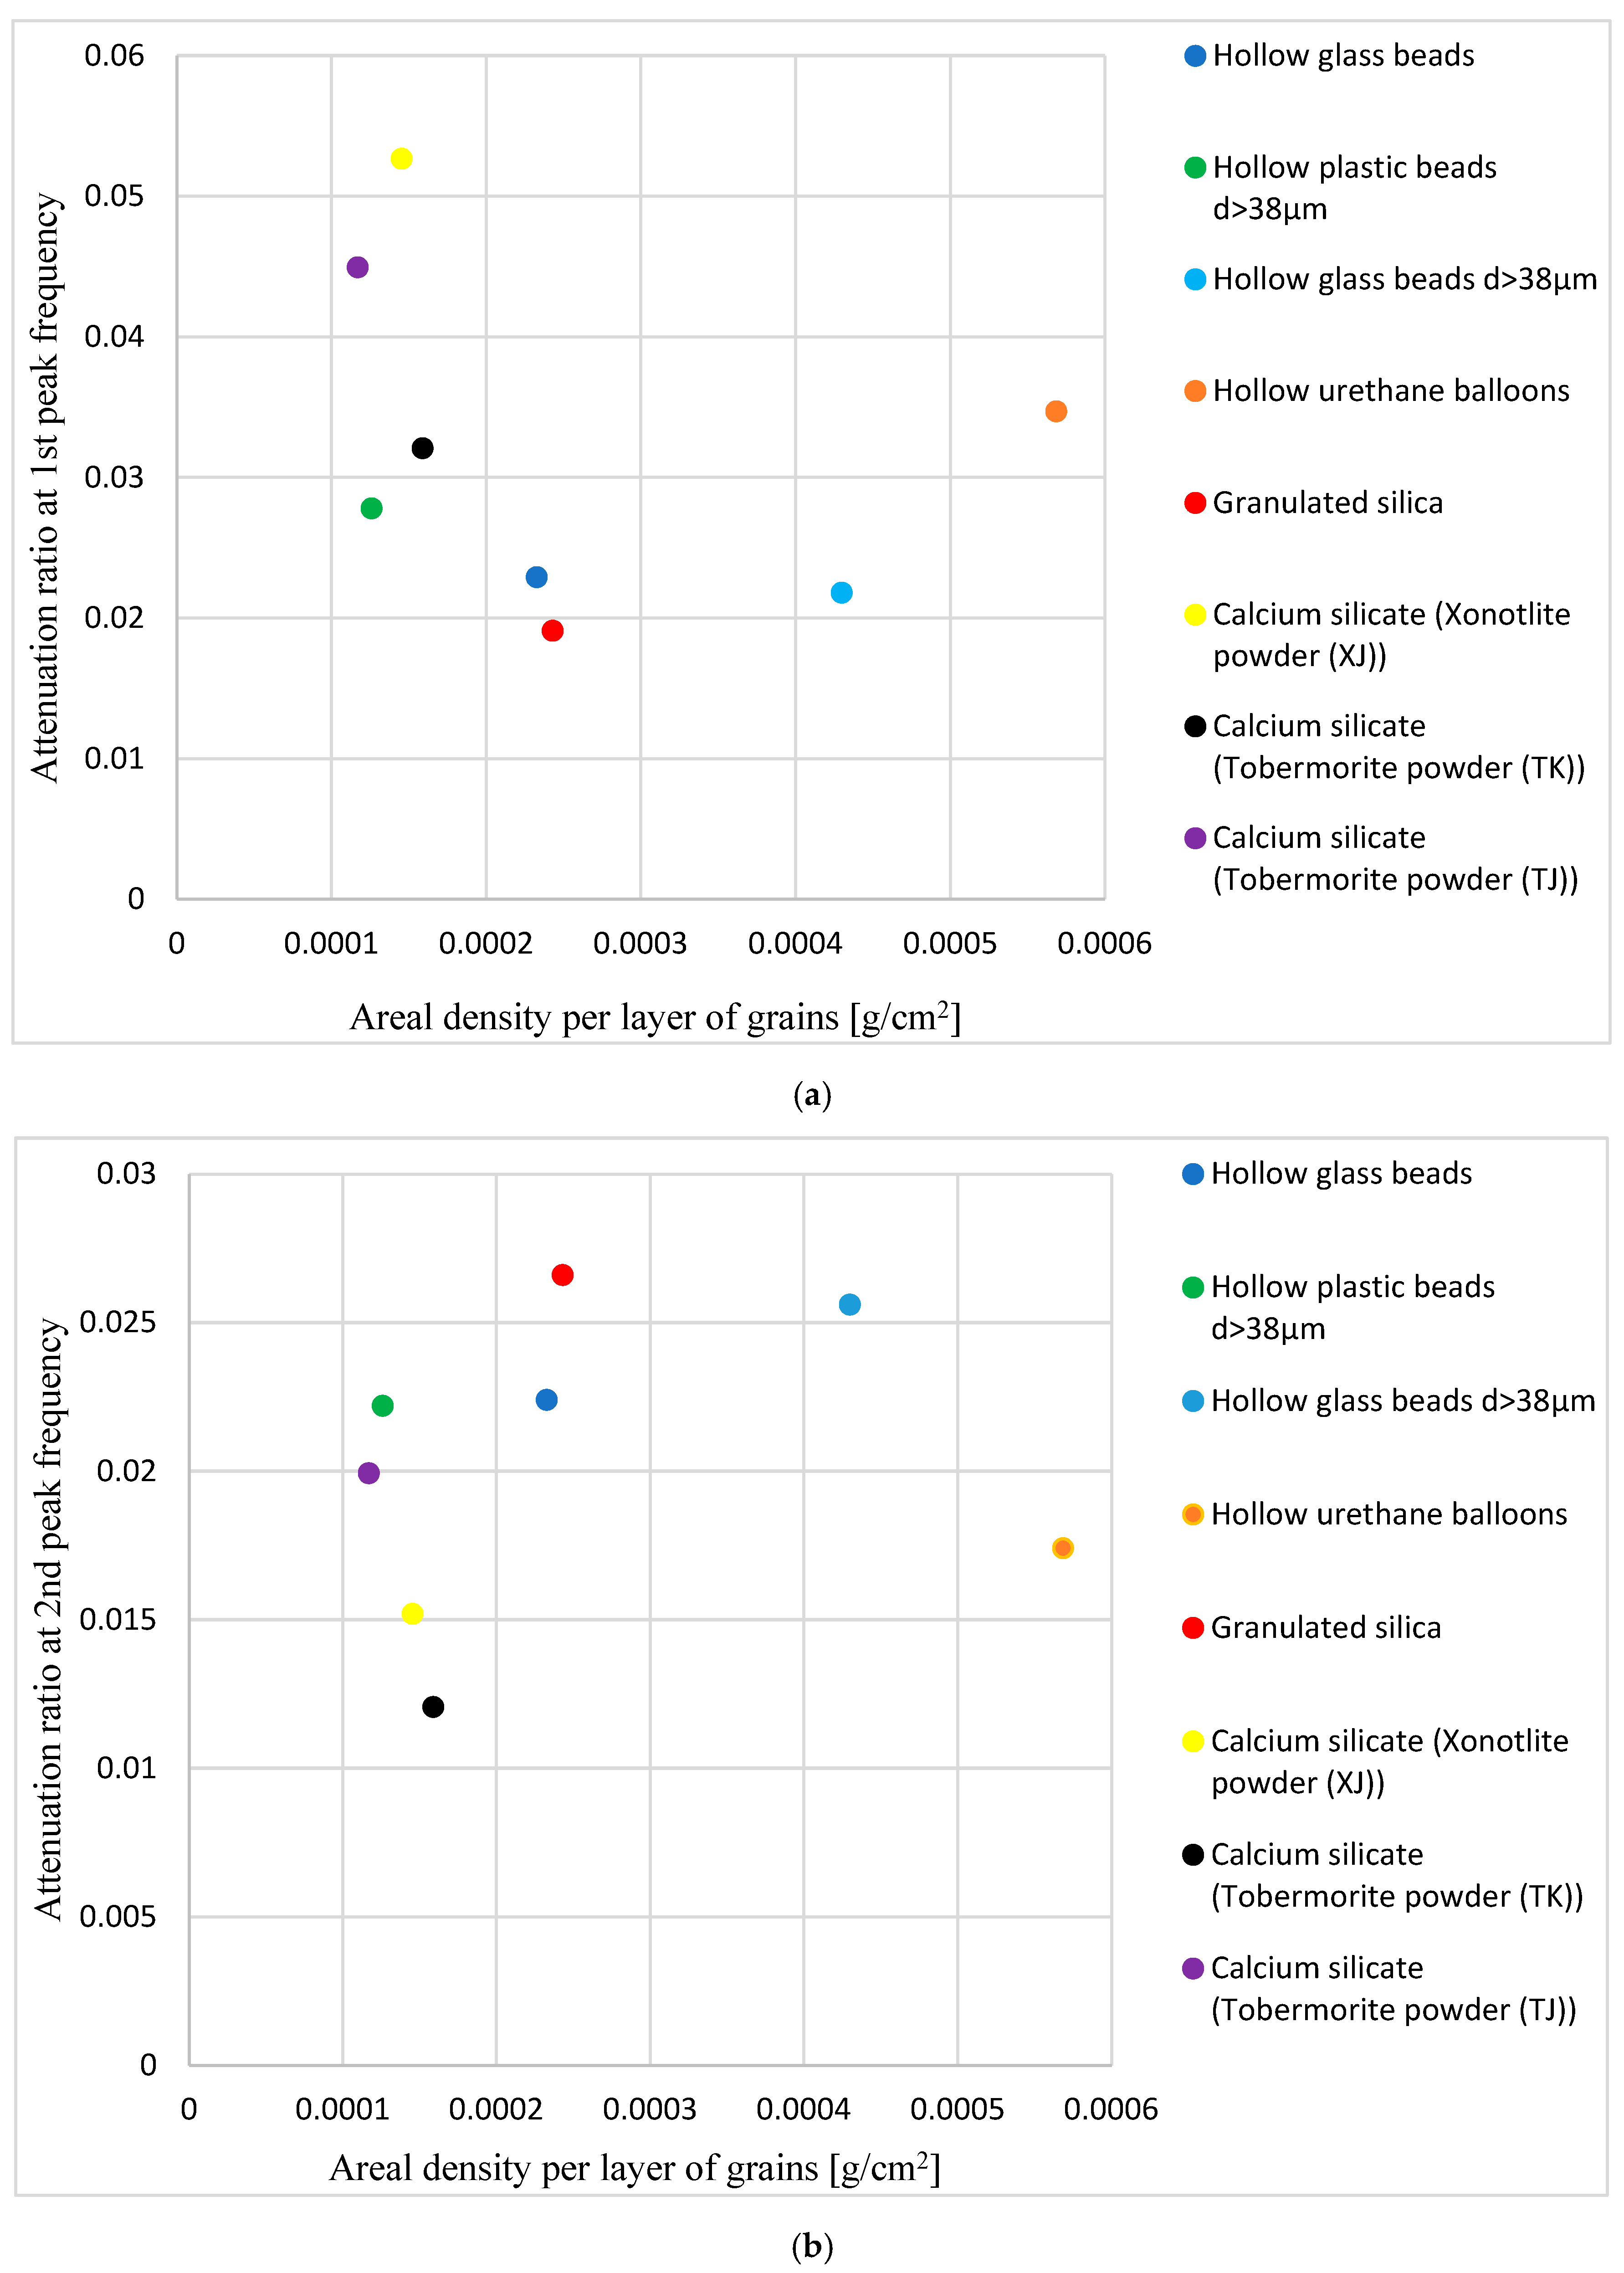
Figure 16 plots the relationship between the areal density per grain layer and the damping ratio. Figure 16a shows the damping ratio at the first peak frequency, and Figure 16b shows the damping ratio at the second peak frequency. The group A powders are indicated by filled circles, and the group B powders are indicated by cross marks. The measured and estimated damping ratios were compared.

3.2.3. Sound Absorption Coefficient

The sound absorption coefficient is not as sensitive to the damping ratio compared to the peak absorption frequency. Therefore, the sound absorption coefficient was estimated by using the average of the measured damping ratios for group A powders at the first absorption peak frequency for a layer thickness of 20 mm (ζ1 = 0.032 and ζ2 = 0.020). A similar approach was used for the group A1 powders (ζ1 = 0.027 and ζ2 = 0.022) and group A2 powders (ζ1 = 0.037 and ζ2 = 0.018).
The empirical equations for the first sound absorption peak frequency in Section 3.2.1 were used to estimate the sound absorption coefficients of the group A1 and group A2 powders at a layer thickness of 20 mm. The same model as in the previous study [7] was used to estimate the sound absorption coefficient. The following empirical equations were obtained to express the relationship between the areal density per grain layer and first peak frequency for the group A1 and A2 powders, respectively:
f p e a k × l p = 1.26 × 1 0 11 σ 2 8.37 × 1 0 7 σ + 3.21 × 1 0 4
f p e a k × l p = 2.25 × 1 0 11 σ 2 7.17 × 1 0 7 σ + 1.55 × 1 0 4
where σ is the areal density per grain layer. Table 2 and Table 3 summarize the first sound absorption peak frequencies of the group A1 and group A2 powders, respectively, calculated by Equations (9) and (10).
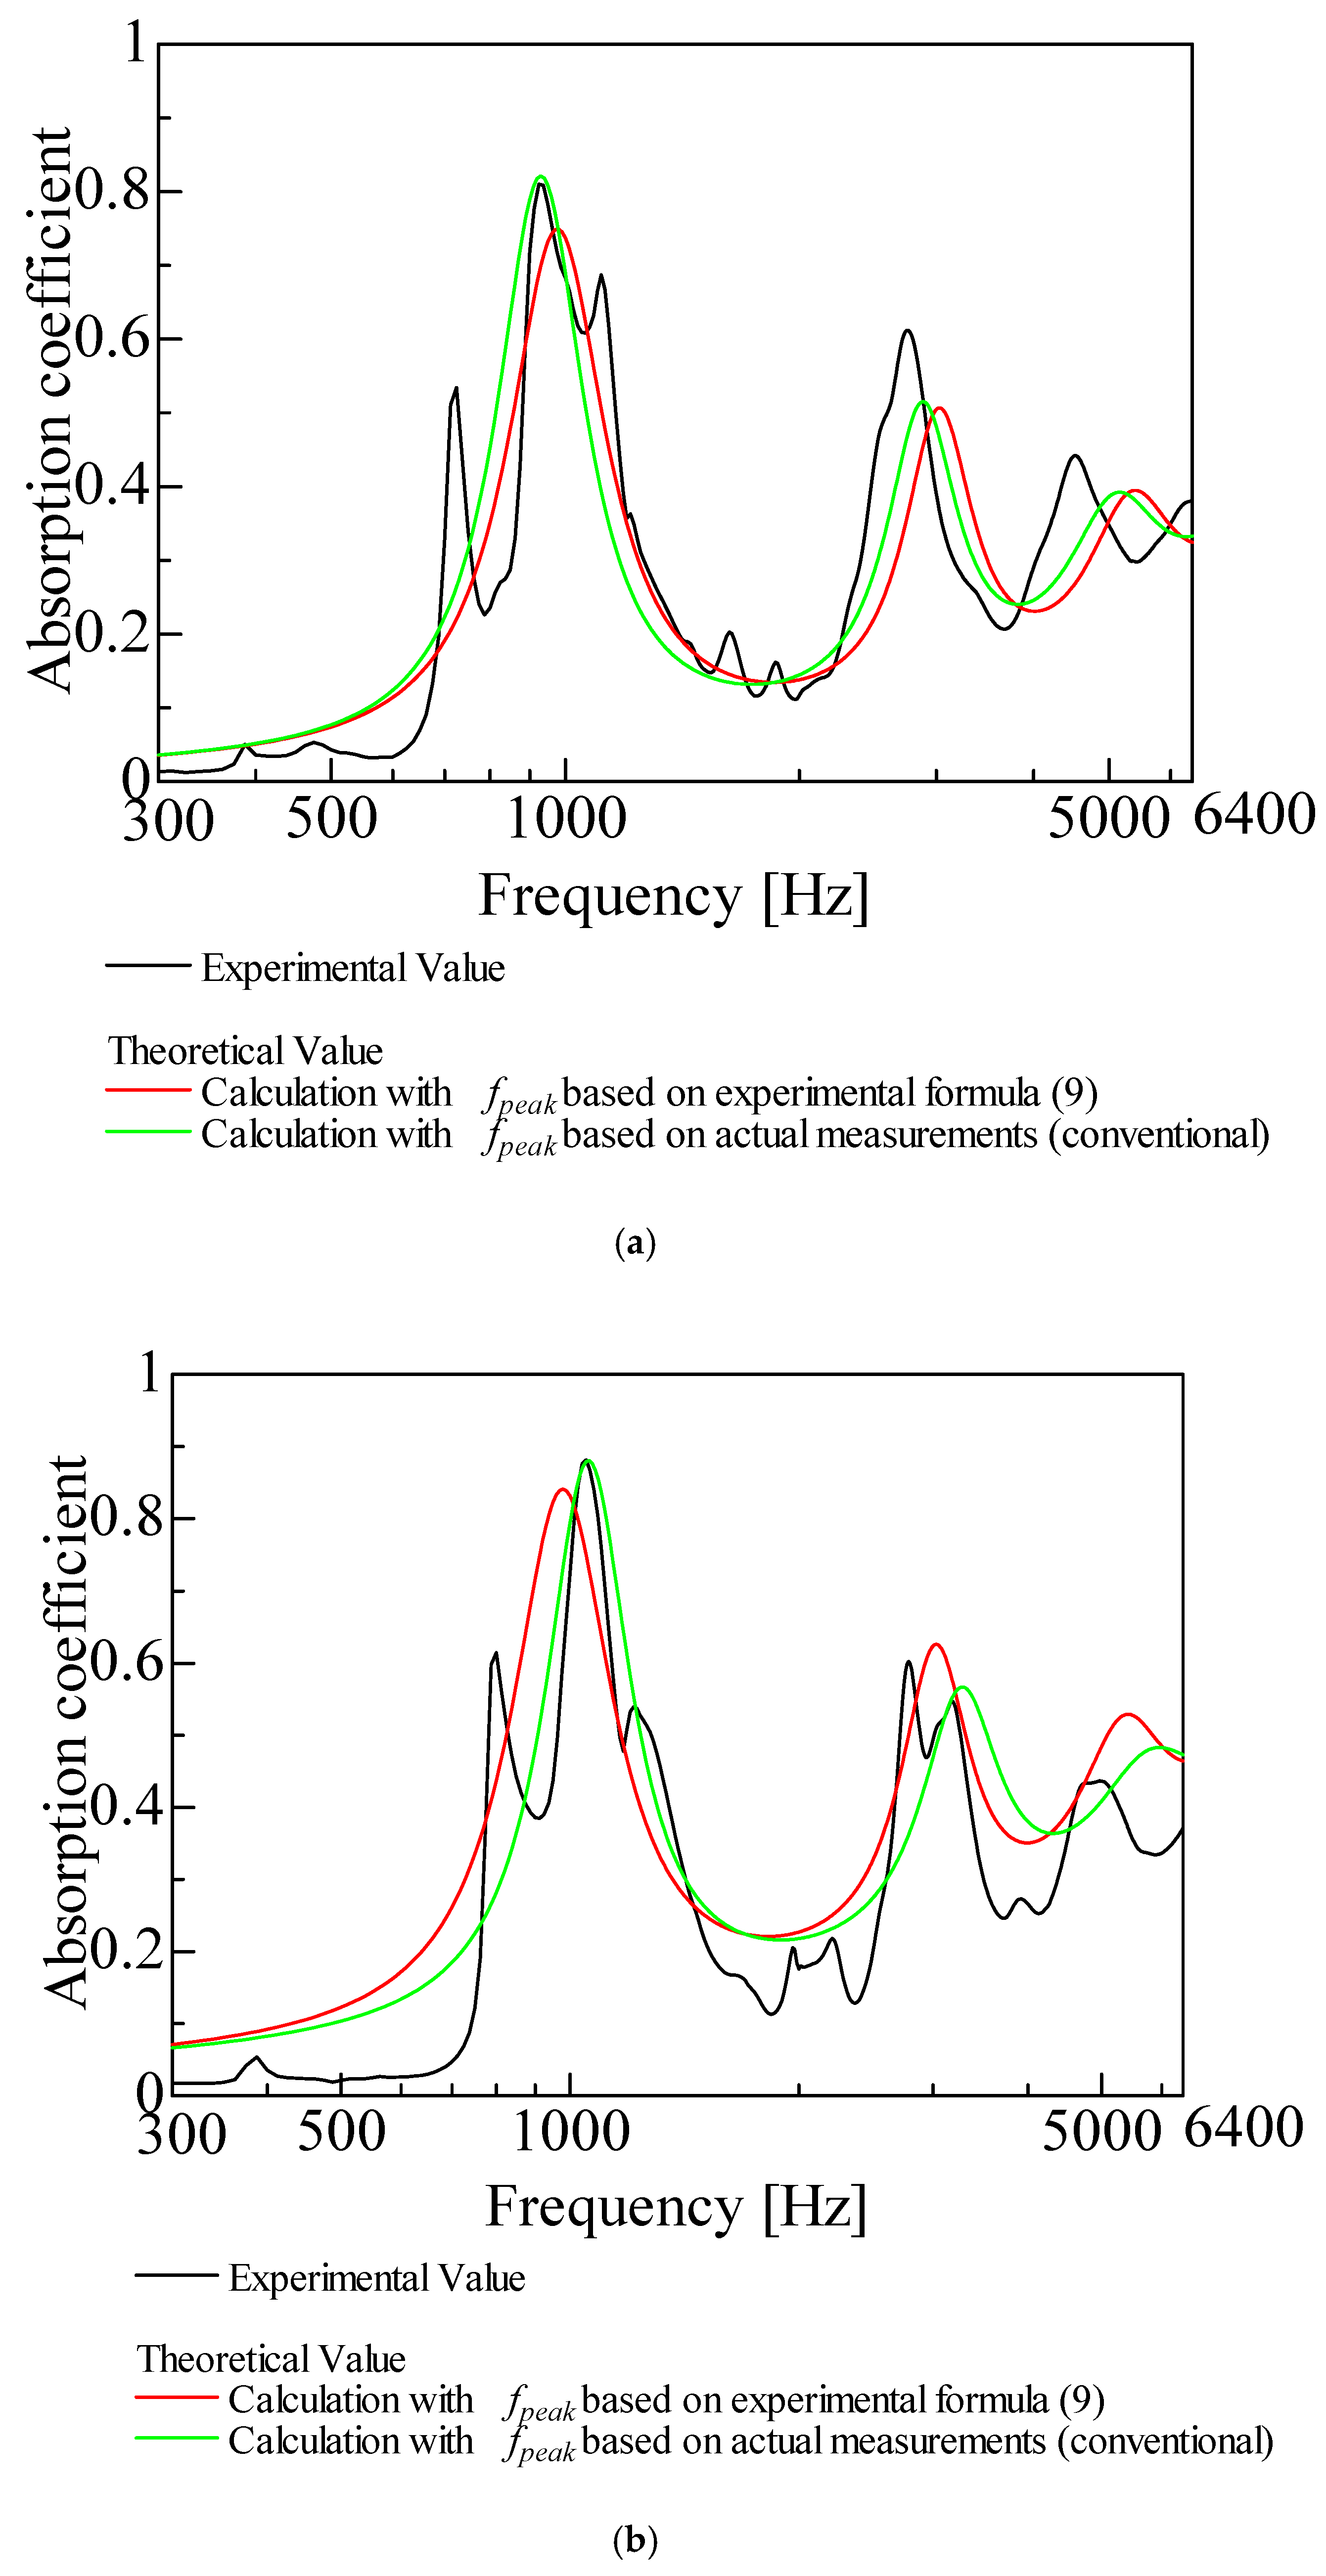
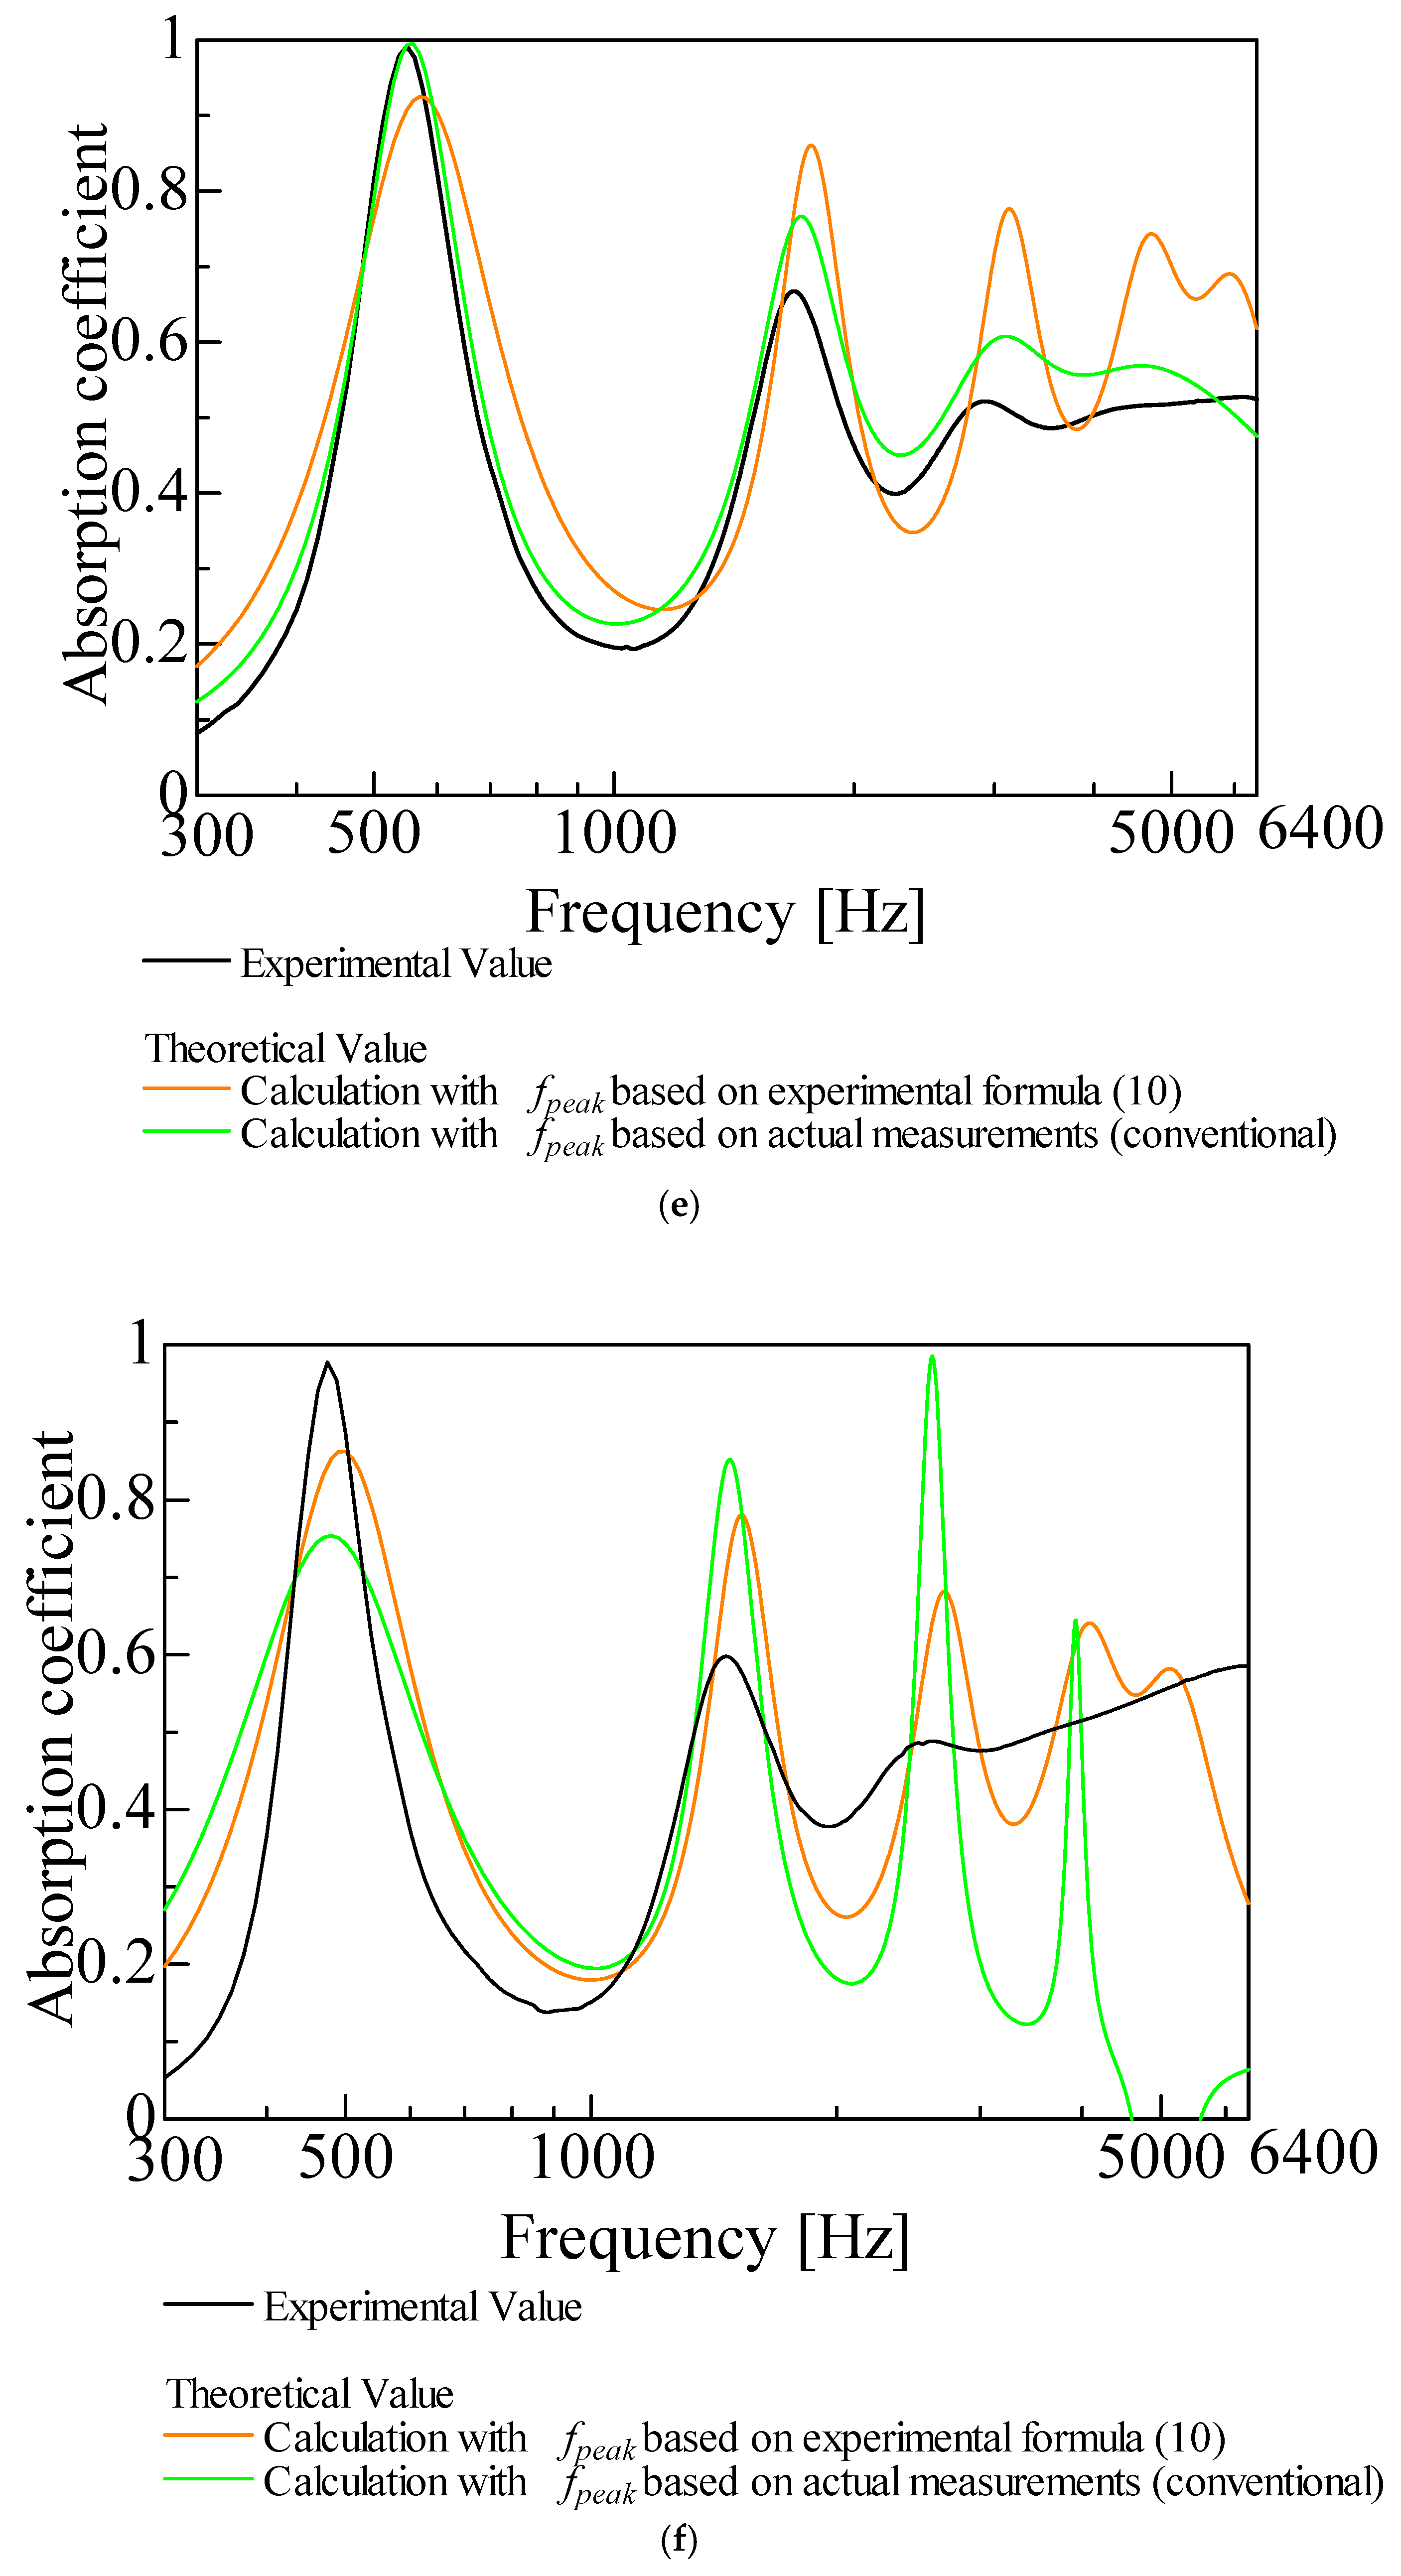
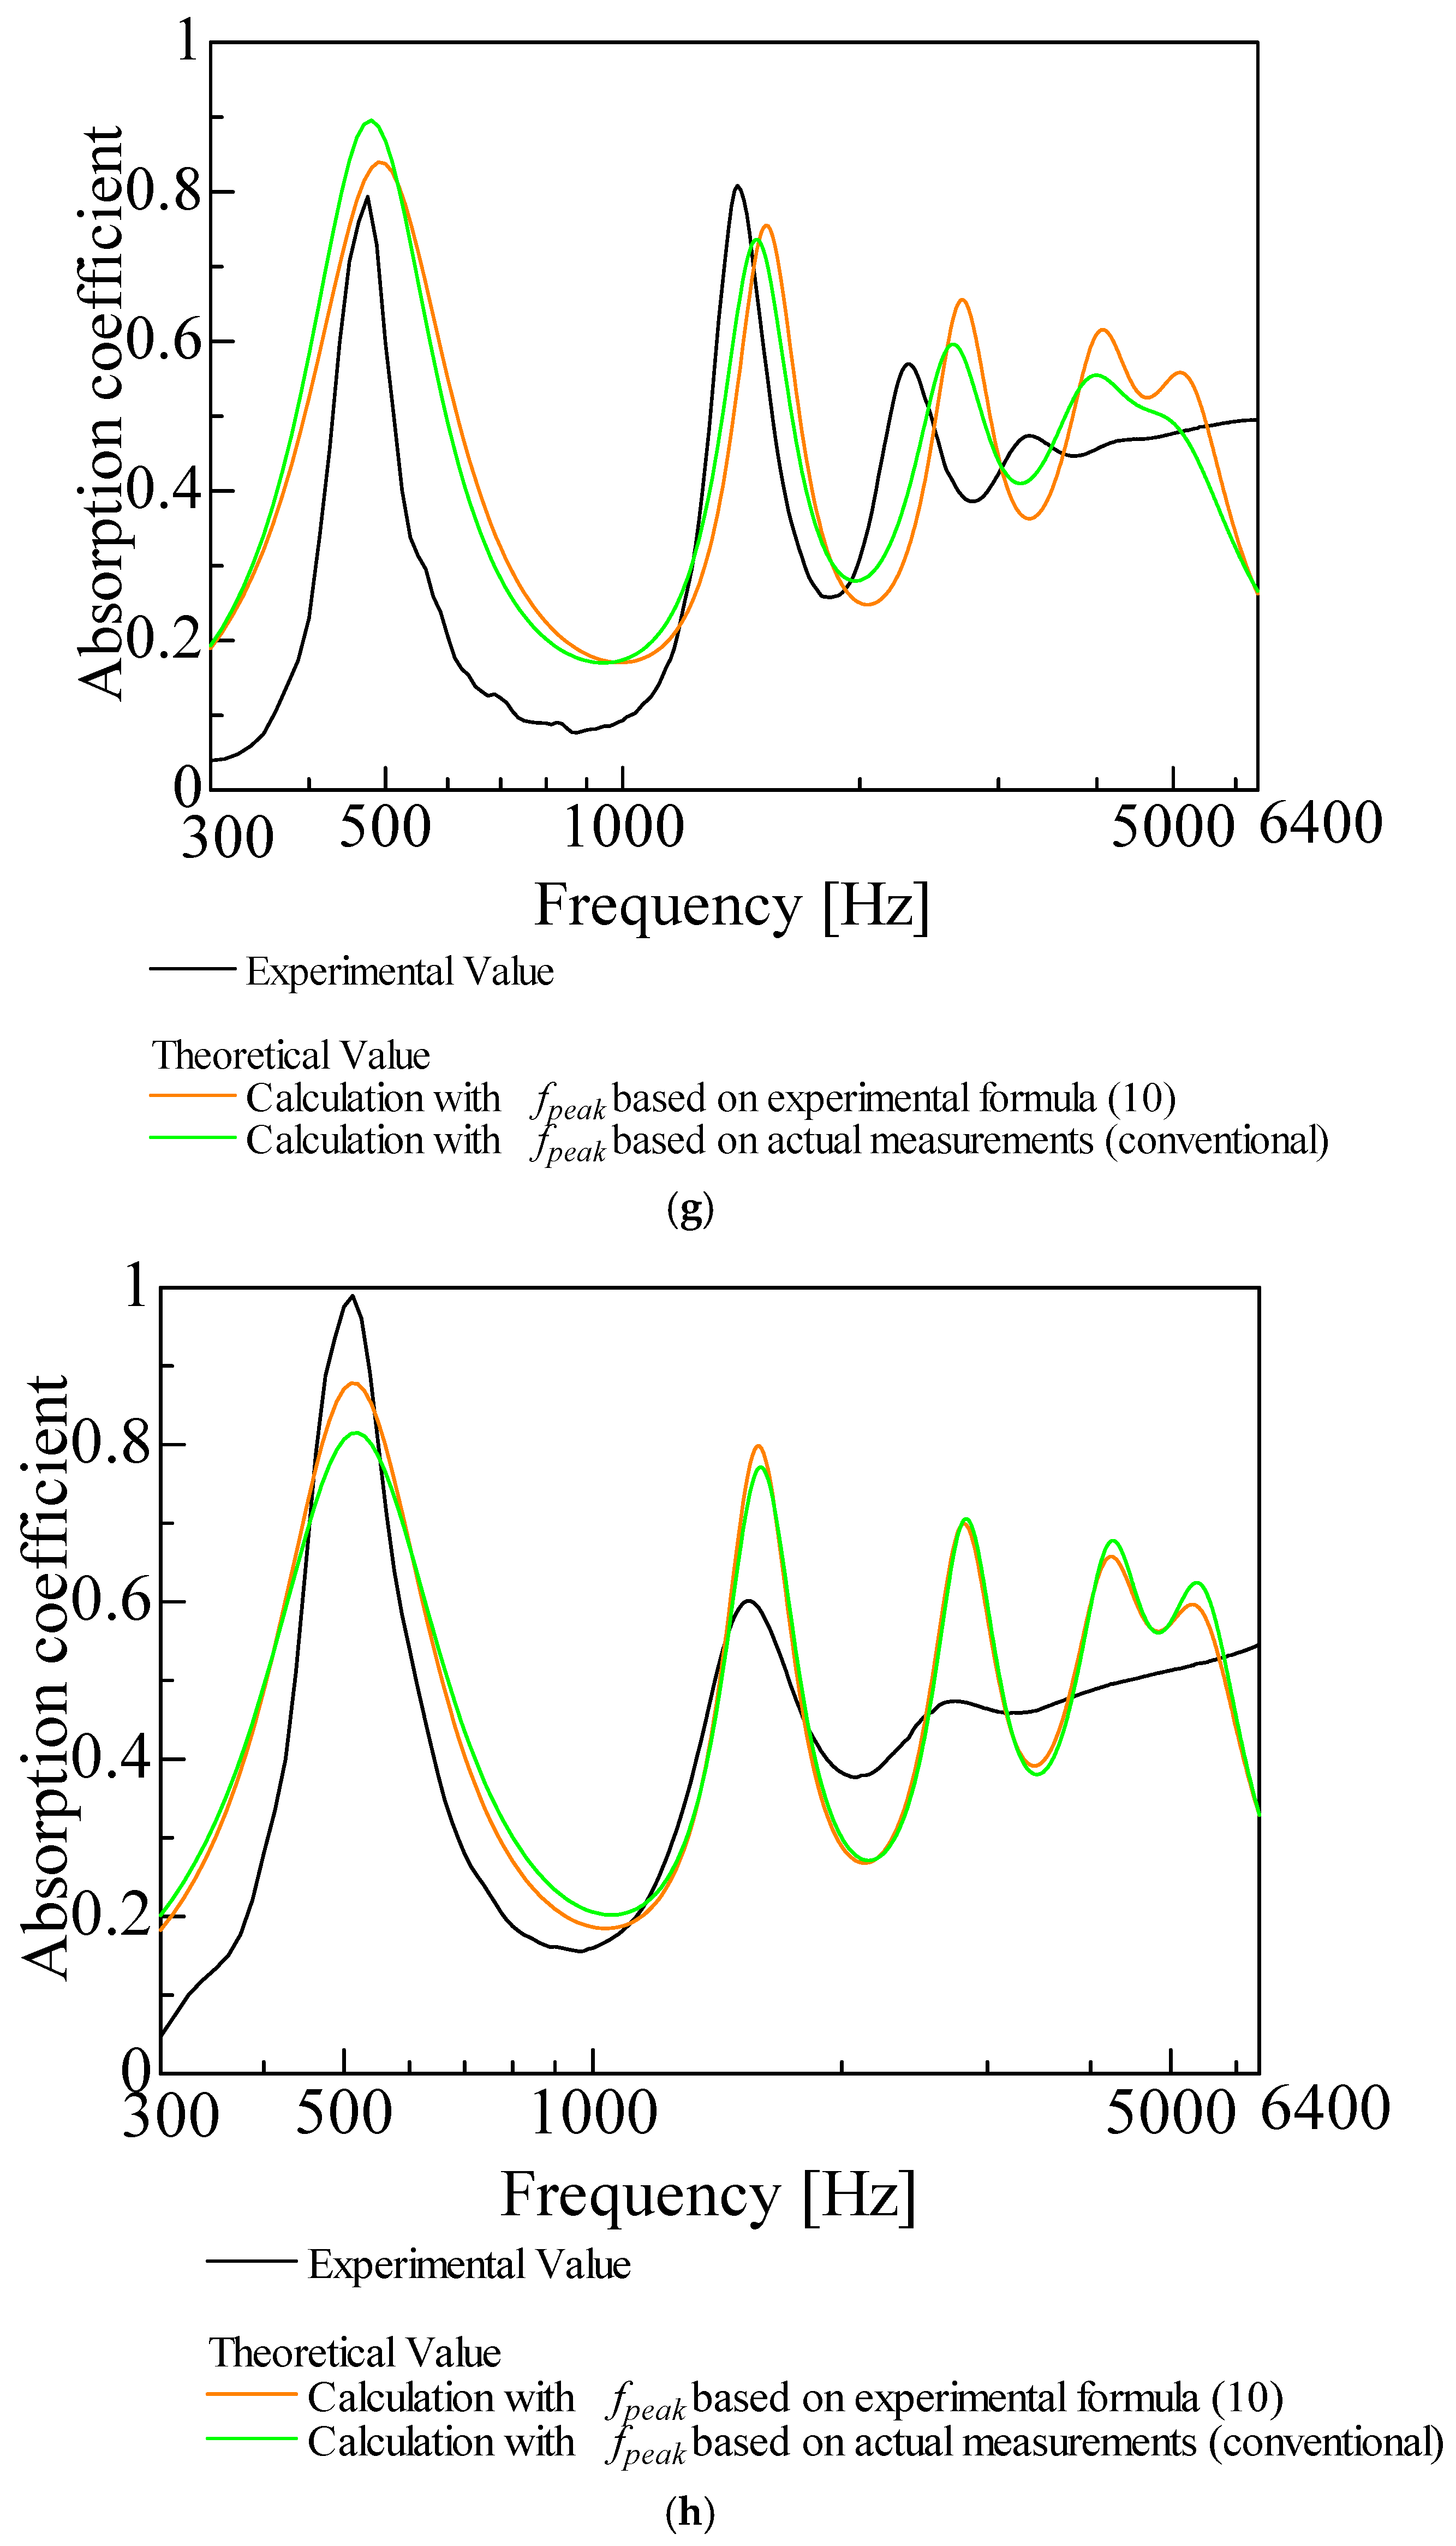
Figure 17 compares the estimated and experimental sound absorption coefficients of Figure 17a–d group A1 and Figure 17e–h group A2 powders. The estimated values (indicated by red/orange lines) were obtained as described above while the experimental values (indicated by green lines) were obtained from a previous study [19]. The results of the three experimental values (Figure 17c) indicate minimal variation in measurements. For clarity, only one experimental result is presented graphically for the other powders. The peaks and dips of the estimated sound absorption coefficients at the first and second peak frequencies were close to the experimental values. Therefore, the damping ratios were concluded to be sufficiently accurate for estimating the sound absorption coefficients. The estimated peak absorption frequencies had a difference of less than 100 Hz from the experimental peak absorption frequencies for all group A powders. These results indicate that the obtained empirical equations had a sufficient prediction accuracy and that they can be used with the above powder specifications to identify lightweight powders with useful sound absorption characteristics.

4. Conclusions

The experiments were conducted using powders of various grain sizes and bulk densities with a low areal density per grain layer. Powders were classified according to the difference in sound absorption curves at the first peak frequency of the sound absorption coefficient. Changes in the half-width, bulk density, grain size, and areal density per grain layer were investigated. The following conclusions were obtained.
A threshold value for the areal density per grain layer was identified where lightweight powders at 0.0006 g/cm2 or less demonstrated useful sound absorption characteristics via longitudinal vibration. Powders with smooth (i.e., useful) and sharp (i.e., not useful) sound absorption curves could be further identified by the half-width value at 0.0974 < log f2 − log f1 < 0.119 decade. The bulk density can also be used to identify powders with useful sound absorption characteristics less than 0.0868 g/cm3. The results demonstrated that powders with useful sound absorption characteristics can be identified based on their powder specifications. A regression analysis was performed to obtain empirical equations expressing the relationship between the areal density per grain layer and the first sound absorption peak frequency normalized by the layer thickness. Separate empirical equations were obtained for solid and hollow powders. The range of areal densities σ for which each equation is applicable is 0.000117 < σ < 0.00024 g/cm2 for solid powders and 0.000126 < σ < 0.000569 g/cm2 for hollow powders. The powder specifications and empirical equations can then be used to predict the sound absorption coefficients of lightweight powders via longitudinal vibration. The difference in the predicted and experimental peak sound absorption frequencies was <100 Hz for all group A powders.

Author Contributions

Conceptualization, S.S.; Software, K.J., K.I. and H.S.; Formal analysis, K.J., K.I. and Y.K.; Data curation, Y.K. and H.S.; Supervision, S.S.; Project administration, S.S. All authors have read and agreed to the published version of the manuscript.

Funding

This work was supported by JSPS KAKENHI Grant Number 20K04359.

Data Availability Statement

The original contributions presented in the study are included in the article, further inquiries can be directed to the corresponding author.

Acknowledgments

The authors would like to thank Japan Fillite Co., Ltd., Sekisui Kasei Co., Ltd., Japan Insulation Co., Ltd., Potters-Ballotini Co., Ltd., Asahi Kasei Corporation, Sumitomo Seika Chemicals Co., Ltd., Taiheiyo Cement Corporation, 3M Japan Ltd. for providing the powders for this study.

Conflicts of Interest

The authors declare no conflict of interest.

References

  1. Arenas, J.P.; Crocker, M.J. Recent trends in porous sound-absorbing materials. Sound Vib. 2010, 44, 12–17. [Google Scholar]
  2. Sakamoto, S.; Ii, K.; Katayama, I.; Suzuki, K. Measurement and Theoretical Analysis of Sound Absorption of Simple Cubic and Hexagonal Lattice Granules. Noise Control Eng. J. 2021, 69, 401–410. [Google Scholar] [CrossRef]
  3. Sakamoto, S.; Suzuki, K.; Toda, K.; Seino, S. Estimation of the Acoustic Properties of the Random Packing Structures of Granular Materials: Estimation of the Sound Absorption Coefficient Based on Micro-CT Scan Data. Materials 2023, 16, 337. [Google Scholar] [CrossRef] [PubMed]
  4. Satti, F.; Hoppe, K.A.; Marburg, S.; Horoshenkov, K.V. The accuracy of some models to predict the acoustical properties of granular media. Appl. Acoust. 2022, 185, 108358. [Google Scholar] [CrossRef]
  5. Zhu, Y.; Muhammed, H. The exploration and recent updates on the relation between sound speed in mixtures of granular materials and the composition of the mixtures. Appl. Acoust. 2021, 178, 107992. [Google Scholar] [CrossRef]
  6. Cobo, P.; Simón, F.A. comparison of impedance models for the inverse estimation of the non-acoustical parameters of granular absorbers. Appl. Acoust. 2016, 104, 119–126. [Google Scholar] [CrossRef]
  7. Voronina, N.N.; Horoshenkov, K.V. A new empirical model for the acoustic properties of loose granular media. Appl. Acoust. 2003, 64, 415–432. [Google Scholar] [CrossRef]
  8. Arenas, J.P.; Marin, V.; Venegas, R. Membrane sound absorber with a granular activated carbon infill. Appl. Acoust. 2023, 202, 109180. [Google Scholar] [CrossRef]
  9. Samaei, S.E.; Berardi, U.; Taban, E.; Soltani, P.; Mousavi, S.M. Natural fibro-granular composite as a novel sustainable sound-absorbing material. Appl. Acoust. 2021, 181, 108157. [Google Scholar] [CrossRef]
  10. Železnik, A.; Murovec, J.; Čurović, L.; Cerkovnik, N.; Prezelj, J. Transmission loss measurement of recycled granular material using wave decomposition by impulse response extraction based on deconvolution. Appl. Acoust. 2023, 211, 109498. [Google Scholar] [CrossRef]
  11. Dragonetti, R.; Iannace, G.; Ianniello, C. Insertion loss of a heap of gravel outdoors. Acta Acust. 2003, 89, S56–S57. [Google Scholar]
  12. Okudaira, Y.; Kurihara, Y.; Ando, H.; Satoh, M.; Miyanami, K. Sound absorption measurements for evaluating dynamic physical properties of a powder bed. Powder Technol. 1993, 77, 39–48. [Google Scholar] [CrossRef]
  13. Okudaira, Y.; Ando, H.; Satoh, M.; Miyanami, K. The effect of grain diameter on the acoustic properties of a powder bed sound absorption characteristic and sound velocity. J. Soc. Powder Technol. 1995, 32, 311–318. (In Japanese) [Google Scholar] [CrossRef]
  14. Okudaira, Y.; Kurihara, Y.; Ando, H.; Satoh, M.; Miyanami, K. Sound Absorption Characteristics of Powder Beds Comprised of Binary Powder Mixtures. J. Jpn. Soc. Powder Powder Metall. 1995, 42, 239–244. [Google Scholar] [CrossRef]
  15. Zhou, H.; Bo, L.; Guangsu, H. Sound absorption characteristics of polymer microparticles. J. Appl. Polym. Sci. 2006, 101, 2675–2679. [Google Scholar] [CrossRef]
  16. Begum, H.; Xue, Y.; Bolton, J.S.; Horoshenkov, K.V. The acoustical absorption by air-saturated aerogel powders. J. Acoust. Soc. Am. 2022, 151, 1502–1515. [Google Scholar] [CrossRef]
  17. Biot, M.A. Theory of Propagation of Elastic Waves in a Fluid-Saturated Porous Solid. I. Low-Frequency Range. J. Acoust. Soc. Am 1956, 28, 168–178. [Google Scholar] [CrossRef]
  18. Tsuruha, T.; Yamada, Y.; Otani, M.; Takano, Y. Effect of casing on sound absorption characteristics of fine spherical granular material. J. Acoust. Soc. Am. 2020, 147, 3418–3428. [Google Scholar] [CrossRef]
  19. Sakamoto, S.; Yamaguchi, K.; Ii, K.; Takakura, R.; Nakamura, Y.; Suzuki, R. Theoretical and experiment analysis on the sound absorption characteristics of a layer of fine lightweight powder. J. Acoust. Soc. Am. 2019, 146, 2253–2262. [Google Scholar] [CrossRef]
  20. Sakamoto, S.; Takakura, R.; Suzuki, R.; Katayama, I.; Saito, R.; Suzuki, K. Theoretical and experimental analyses of acoustic characteristics of fine-grain powder considering longitudinal vibration and boundary layer viscosity. J. Acoust. Soc. Am. 2021, 149, 1030–1040. [Google Scholar] [CrossRef]
  21. Sakamoto, S.; Saito, R.; Jindai, K.; Ikeda, K. Conditions for Sound Absorption Caused by Longitudinal Vibration of Lightweight Powder. Noise Control. Eng. J. 2024, 72, NCEJ-D-23-00043. [Google Scholar]
  22. Merkus, H.G. Particle Size Measurements: Fundamentals, Practice, Quality; Springer Science and Business Media: New York, NY, USA, 2019; p. 15. [Google Scholar]
  23. Saiki, S.; Matsumura, T.; Fujise, A. Speaker System. European Patent EP 2003924A1, 25 April 2012. [Google Scholar]
  24. ISO 10534-2; Acoustics—Determination of Sound Absorption Coefficient and Impedance in Impedance Tubes—Part 2: Transfer-function Method. International Organization for Standardization: Geneva, Switzerland, 2002.
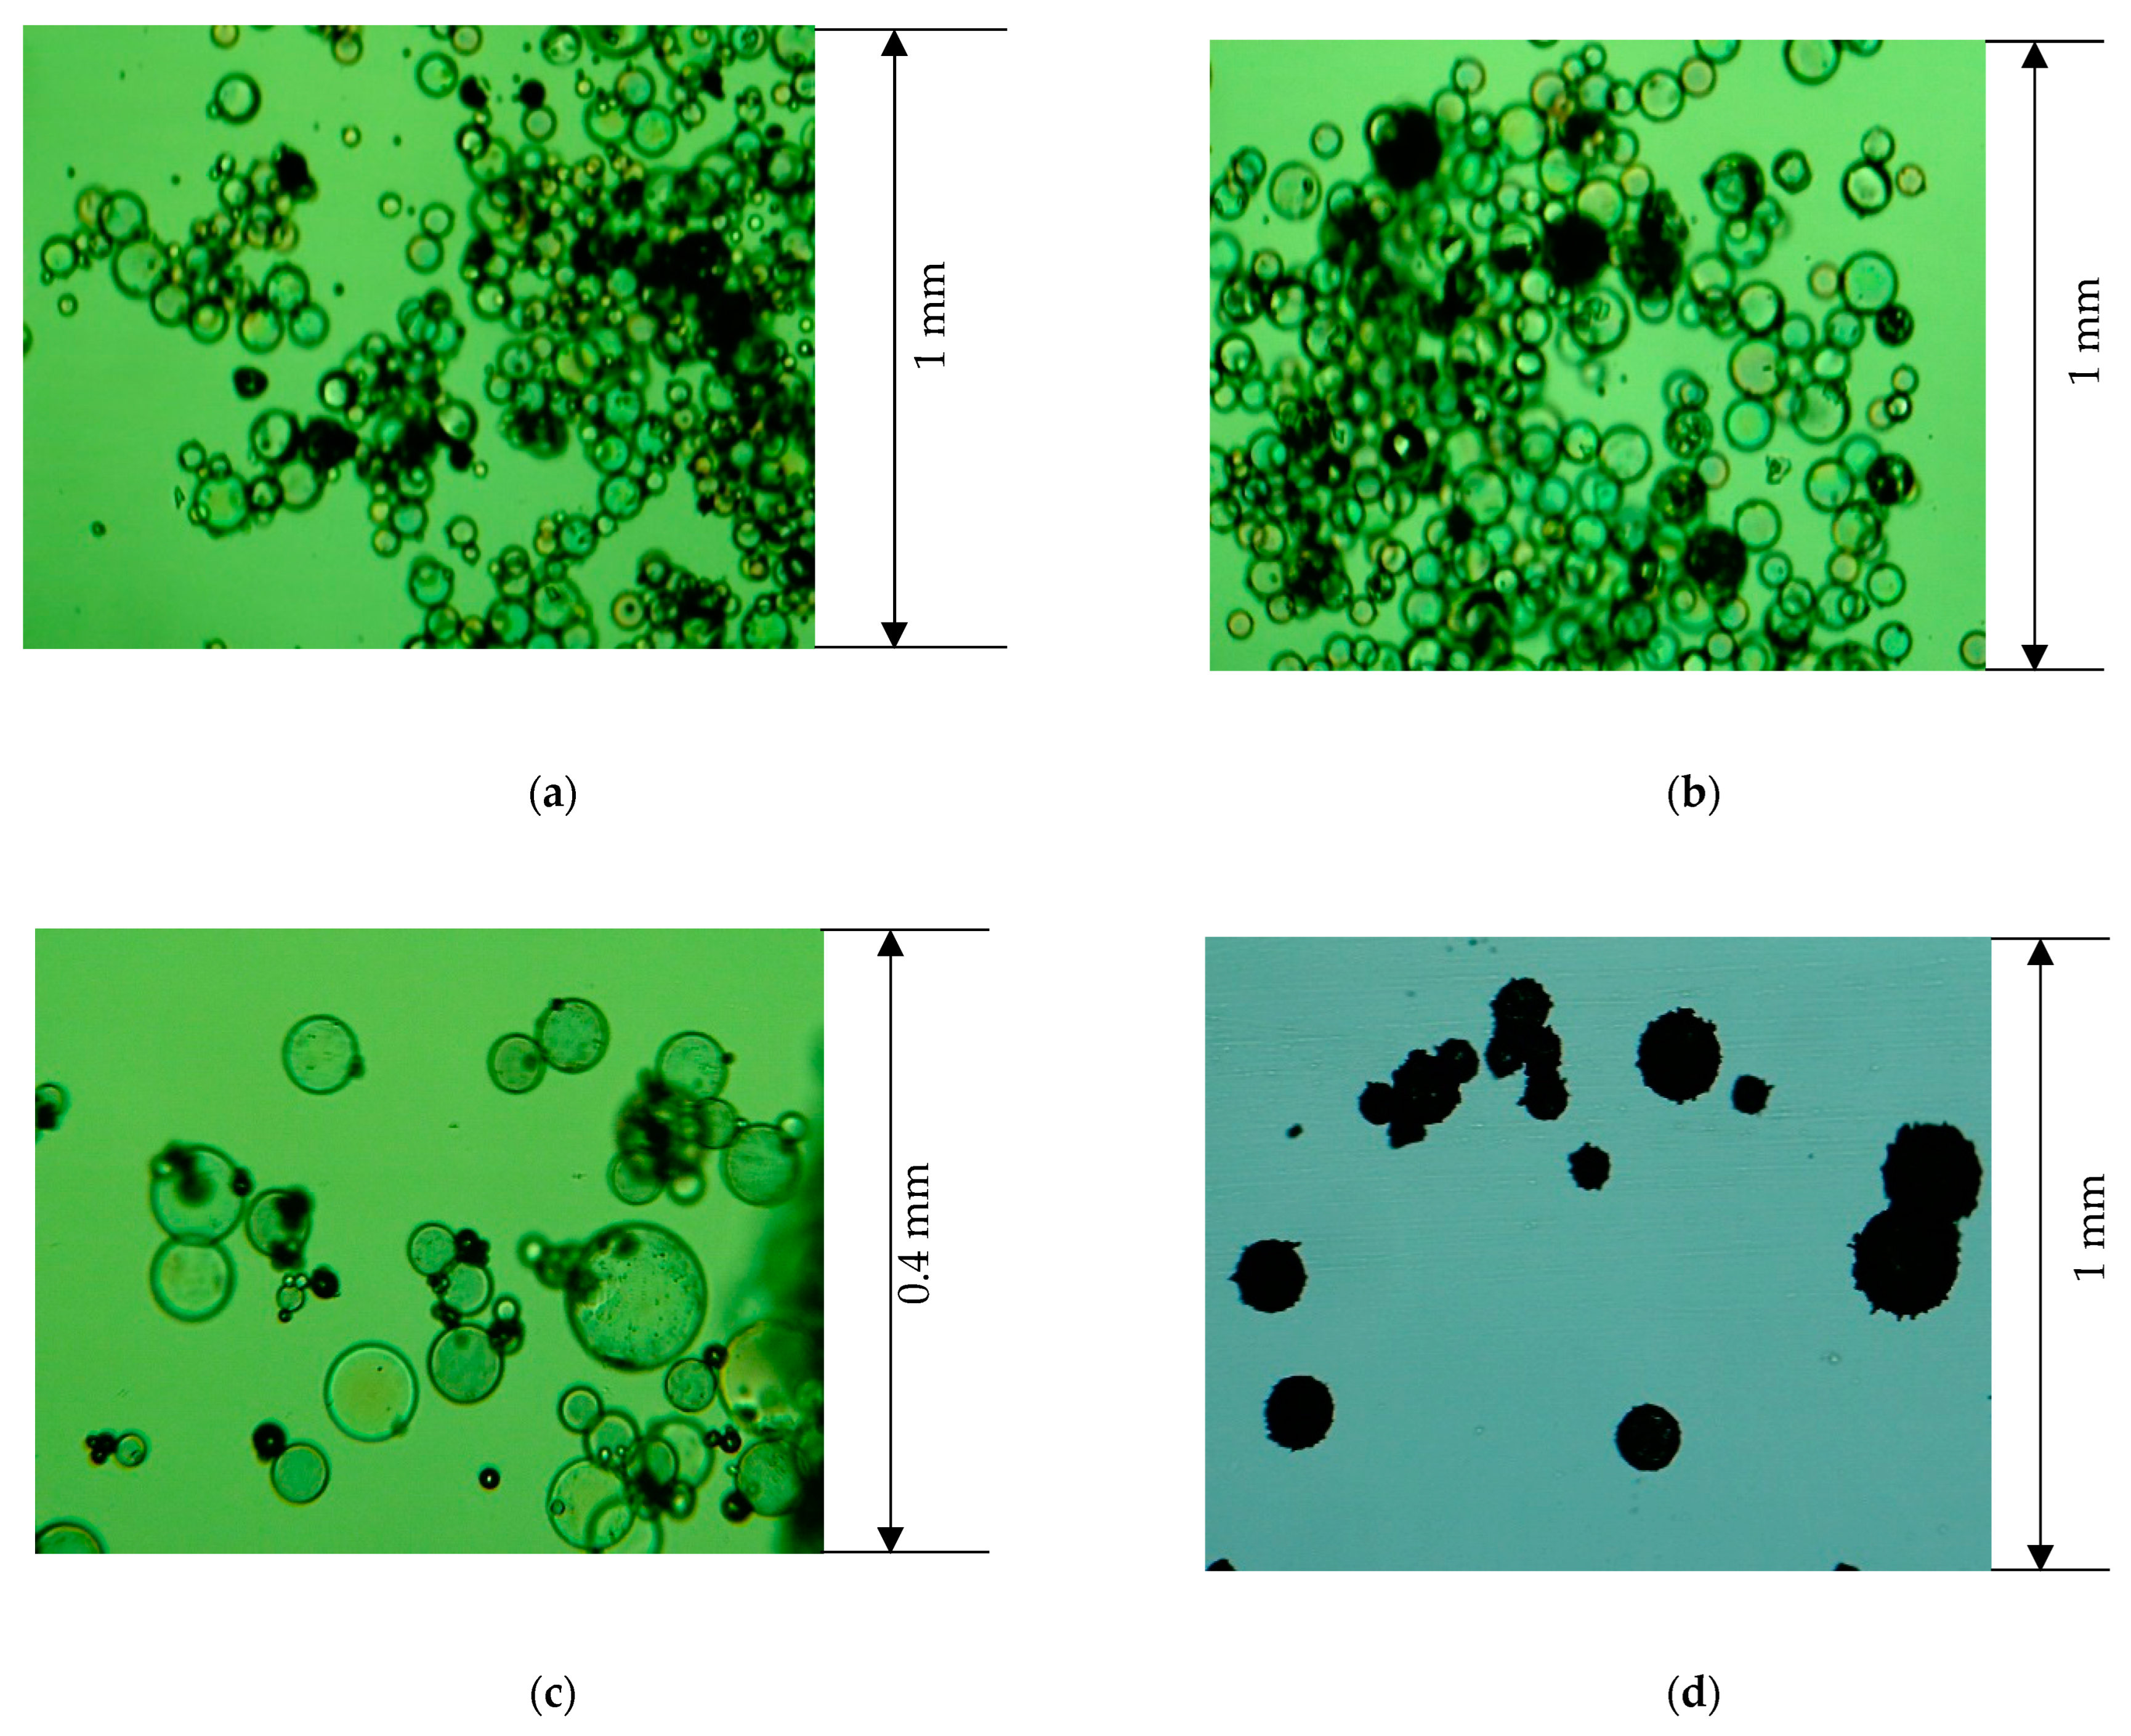
Figure 1. Micrographs of powder materials: (a) A1-1 Hollow glass beads; (b) A1-2 Hollow glass beads d > 38 μm; (c) A1-3 Hollow plastic beads d > 38 μm; (d) A1-4 Hollow urethane balloons; (e) A2-1 Granulated silica; (f) A2-2 Calcium silicate (Xonotlite powder (XJ)); (g) A2-3 Calcium silicate (Tobermorite powder (TK)); (h) A2-4 Calcium silicate (Tobermorite powder (TJ)); (i) B-1 Talc; (j) B-2 Hollow glass beads (Sphericel® (110P8)); (k) B-3 Crystalline cellulose (Ceolus® TG-F20); (l) B-4 Hollow glass beads (Cell spheres); (m) B-5 Hollow glass beads (Q-CEL® 5020FPS); (n) C-1 Micro glass beads (EMB-10); (o) C-2 Micro glass beads (EMB-20).
Applsci 14 09765 g001aApplsci 14 09765 g001bApplsci 14 09765 g001c
Figure 2. Powder layer with a depth of one grain.
Applsci 14 09765 g002
Figure 3. Examples of sound absorption curves for each powder group: gentle (A1-3 Hollow plastic beads d > 38 μm, l = 20 mm), sharp (B-2 Hollow glass beads (Sphericel® (110P8)), l = 20 mm), and slight vibration (C-4 Solid glass beads φ 0.05, l = 20 mm).
Applsci 14 09765 g003
Figure 4. Experimental setup used to measure the sound absorption coefficients of the powder samples.
Applsci 14 09765 g004
Figure 5. Relationship between areal density per grain layer and sound absorption coefficient.
Applsci 14 09765 g005
Figure 6. Relationship between the areal density per grain layer and half-width of the powders.
Applsci 14 09765 g006
Figure 7. Relationship between the bulk density and half-width of the powders.
Applsci 14 09765 g007
Figure 8. Relationship between the grain size and half-width of the powders.
Applsci 14 09765 g008
Figure 9. Relationship between the grain size and bulk density of the powders.
Applsci 14 09765 g009
Figure 10. Sound absorption coefficients of granular materials with large particle sizes used as a reference (glass beads φ2, l = 20 mm; expanded polystyrene beads φ2, l = 20 mm).
Applsci 14 09765 g010
Figure 11. Relationship between areal density per grain layer and bulk density of the powders.
Applsci 14 09765 g011
Figure 12. Relationship between the areal density per grain layer and first sound absorption peak frequency of the powders according to layer thickness.
Applsci 14 09765 g012
Figure 13. Relationship between the layer thickness and first sound absorption peak frequency for group A powders: (a) A1-1 Hollow glass beads, (b) A1-2 Hollow glass beads d > 38 µm, (c) A1-3 Hollow plastic beads d > 38 µm, (d) A1-4 Hollow urethane balloons, (e) A2-1 Granulated silica, (f) A2-2 Calcium silicate (Xonotlite powder (XJ)), (g) A2-3 Calcium silicate (Tobermorite powder (TK)), and (h) A2-4 Calcium silicate (Tobermorite powder (TJ)).
Applsci 14 09765 g013aApplsci 14 09765 g013b
Figure 14. Relationship between the layer thickness and first sound absorption peak frequency for group B powders: (a) B-1 Talc, (b) B-2 Hollow glass beads (Sphericel® (110P8)), (c) B-3 Crystalline cellulose, (d) B-4 Hollow glass beads (Cell spheres), and (e) B-5 Hollow glass beads (Q-CEL® (5020FPS)).
Applsci 14 09765 g014aApplsci 14 09765 g014b
Figure 15. Relationship between the areal density per grain layer and normalized first sound absorption peak frequency of the group A powders.
Applsci 14 09765 g015
Figure 16. Relationship between the areal density per grain layer and damping ratio of powders: (a) first peak frequency (l = 20 mm) and (b) second peak frequency (l = 20 mm).
Applsci 14 09765 g016
Figure 17. Comparison of theoretical and experimental values using estimated primary peak frequency at 20 mm powder layer. (a) A1-1 Hollow glass beads. (b) A1-2 Hollow glass beads d > 38 μm. (c) A1-3 Hollow plastic beads d > 38 μm. (d) A1-4 Hollow urethane balloons. (e) A2-1 Granulated silica. (f) A2-2 Calcium silicate (Xonotlite powder (XJ)). (g) A2-3 Calcium silicate (Tobermorite powder (TK)). (h) A2-4 Calcium silicate (Tobermorite powder (TJ)).
Applsci 14 09765 g017aApplsci 14 09765 g017bApplsci 14 09765 g017cApplsci 14 09765 g017d
Table 1. Materials used in the experiments.
Powder CodePowder NameGrain Size [mm]Bulk Density [g/cm3]Areal Density per Grain Layer [g/cm2]Standard Deviation of Grain Size [mm]PorosityPlot on Figures
A1-1Hollow glass beads (Hobbico, Inc., Champaign, IL, USA)0.02910.0802.33 × 10−41.49 × 10⁻³N/A *
A1-2Hollow glass beads d > 38 μm (Hobbico, Inc., Champaign, IL, USA)0.06750.0644.30 × 10−41.71 × 10⁻³N/A *
A1-3Hollow plastic beads d > 38 μm (Japan Fillite Co., Ltd., Osaka, Japan)0.04230.0301.26 × 10−41.41 × 10⁻²N/A *
A1-4Hollow urethane balloons (OK Model Co., Ltd., Osaka, Japan)0.12050.04725.69 × 10−43.77 × 10⁻²N/A *
A2-1Granulated silica (Featherfield Co., Ltd., Hiroshima, Japan)0.04280.0572.43 × 10−42.23 × 10−20.974
A2-2Calcium silicate (Xonotlite powder (XJ)) (Japan Insulation Co., Ltd., Osaka, Japan)0.01810.08051.46 × 10−48.29 × 10⁻³N/A *
A2-3Calcium silicate (Tobermorite powder (TK)) (Japan Insulation Co., Ltd., Osaka, Japan)0.01830.08681.59 × 10−47.09 × 10⁻³N/A *
A2-4Calcium silicate (Tobermorite powder (TJ)) (Japan Insulation Co., Ltd., Osaka, Japan)0.01590.07371.17 × 10−44.24 × 10⁻³N/A *
B-1Talc (Featherfield Co., Ltd., Hiroshima, Japan)0.004500.51262.31 × 10−43.67 × 10−30.810
B-2Hollow glass beads (Sphericel® (110P8)) (Potters-Ballotini Co., Ltd., Ibaraki, Japan)0.01020.36423.70 × 10−44.30 × 10⁻³N/A *×
B-3Crystalline cellulose (Ceolus® TG-F20) (Asahi Kasei Corporation. Tokyo, Japan)0.01100.29613.25 × 10−48.94 × 10⁻³N/A *×
B-4Hollow glass beads (Cell spheres) (Taiheiyo Cement Corporation. Tokyo, Japan)0.00530.13196.99 × 10−52.33 × 10⁻³N/A *×
B-5Hollow glass beads (Q-CEL® 5020FPS) (Potters-Ballotini Co., Ltd., Ibaraki, Japan)0.05060.12426.28 × 10−41.70 × 10⁻²N/A *×
C-1Micro glass beads (EMB-10) (Potters-Ballotini Co., Ltd., Ibaraki, Japan)0.00660.88205.78 × 10−42.79 × 10−30.661
C-2Micro glass beads (EMB-20) (Potters-Ballotini Co., Ltd., Ibaraki, Japan)0.0091580.98859.05 × 10−44.08 × 10−30.620
C-3PTFE beads (3M Japan Limited. Tokyo, Japan)0.17860.9071.62 × 10−27.16 × 10−20.578
C-4Solid glass beads φ0.05 (Toshin Riko Co., Ltd., Tokyo, Japan)0.05671.4508.22 × 10−35.37 × 10−30.42
C-5PP beads (Sumitomo Seika Chemicals Company, Limited. Tokyo, Japan)0.07670.4803.68 × 10−33.81 × 10⁻²N/A *
C-6PMMA beads 38 < d ≤ 53 μm (Sekisui Kasei Co., Ltd., Tokyo, Japan)0.04700.7353.45 × 10−38.02 × 10−30.388
C-7PMMA beads d ≤ 38 μm (Sekisui Kasei Co., Ltd., Tokyo, Japan)0.02210.7301.61 × 10−39.13 × 10−30.392
C-8PMMA beads d > 53 μm (Sekisui Kasei Co., Ltd., Tokyo, Japan)0.06340.7304.63 × 10−31.13 × 10−20.392
* Apparent porosity could not be determined for powders for which the true density of the material was unknown and for hollow powders.
Table 2. First sound absorption peak frequencies of group A1 powders calculated by Equation (9).
Powder CodeBalloon Powders (Powders with Gentle Curves)First Peak Frequency (Measurement Value) [Hz]First Peak Frequency Calculated from Experimental Equation (9) [Hz]
A1-1Hollow glass beads925971
A1-2Hollow glass beads d > 38 μm10501176
A1-3Hollow plastic beads d > 38 μm1100971
A1-4Hollow urethane balloons11501265
Table 3. First sound absorption peak frequencies of group A2 powders calculated by Equation (10).
Powder CodeNon-Balloon Powders (Powders with Gentle Waveform)First Peak Frequency (Measurement Value) [Hz]First Peak Frequency Calculated from Experimental Equation (10) [Hz]
A2-1Granulated silica550567
A2-2Calcium silicate
(Xonotlite powder (XJ))
475491
A2-3Calcium silicate (Tobermorite powder (TK))475489
A2-4Calcium silicate (Tobermorite powder (TJ))512.5509
Disclaimer/Publisher’s Note: The statements, opinions and data contained in all publications are solely those of the individual author(s) and contributor(s) and not of MDPI and/or the editor(s). MDPI and/or the editor(s) disclaim responsibility for any injury to people or property resulting from any ideas, methods, instructions or products referred to in the content.