
Compression Law and Settlement Calculation Method of Over-Wet Soil Based on Large Samples


Abstract
:1. Introduction
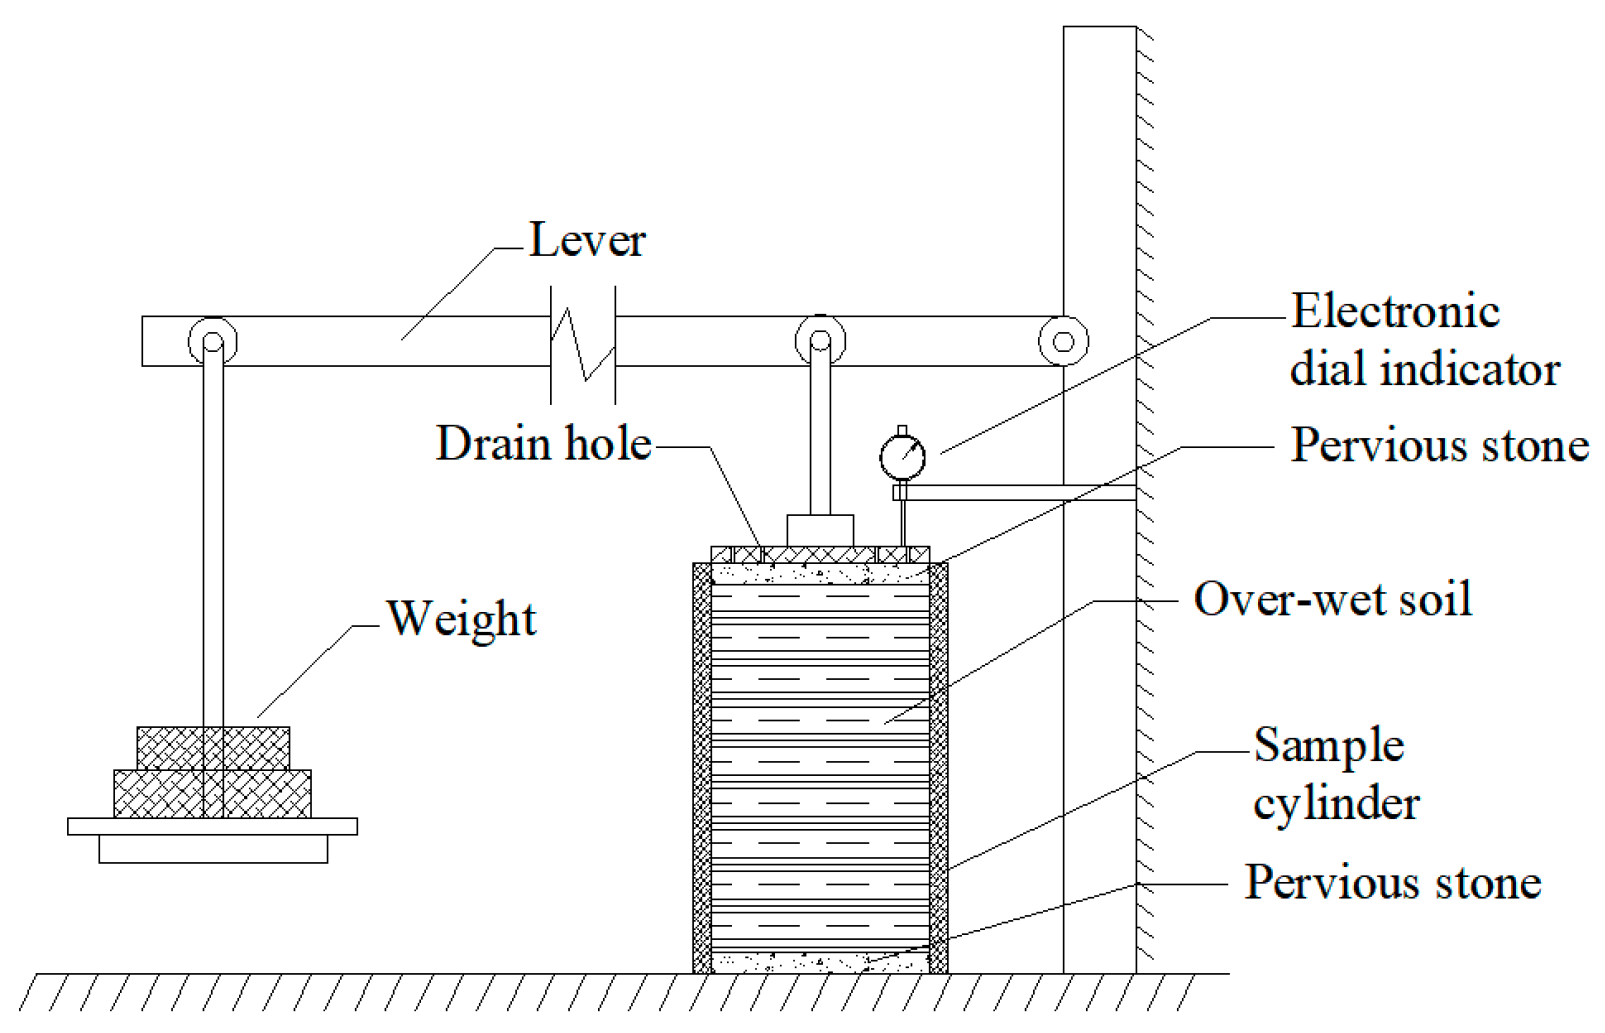
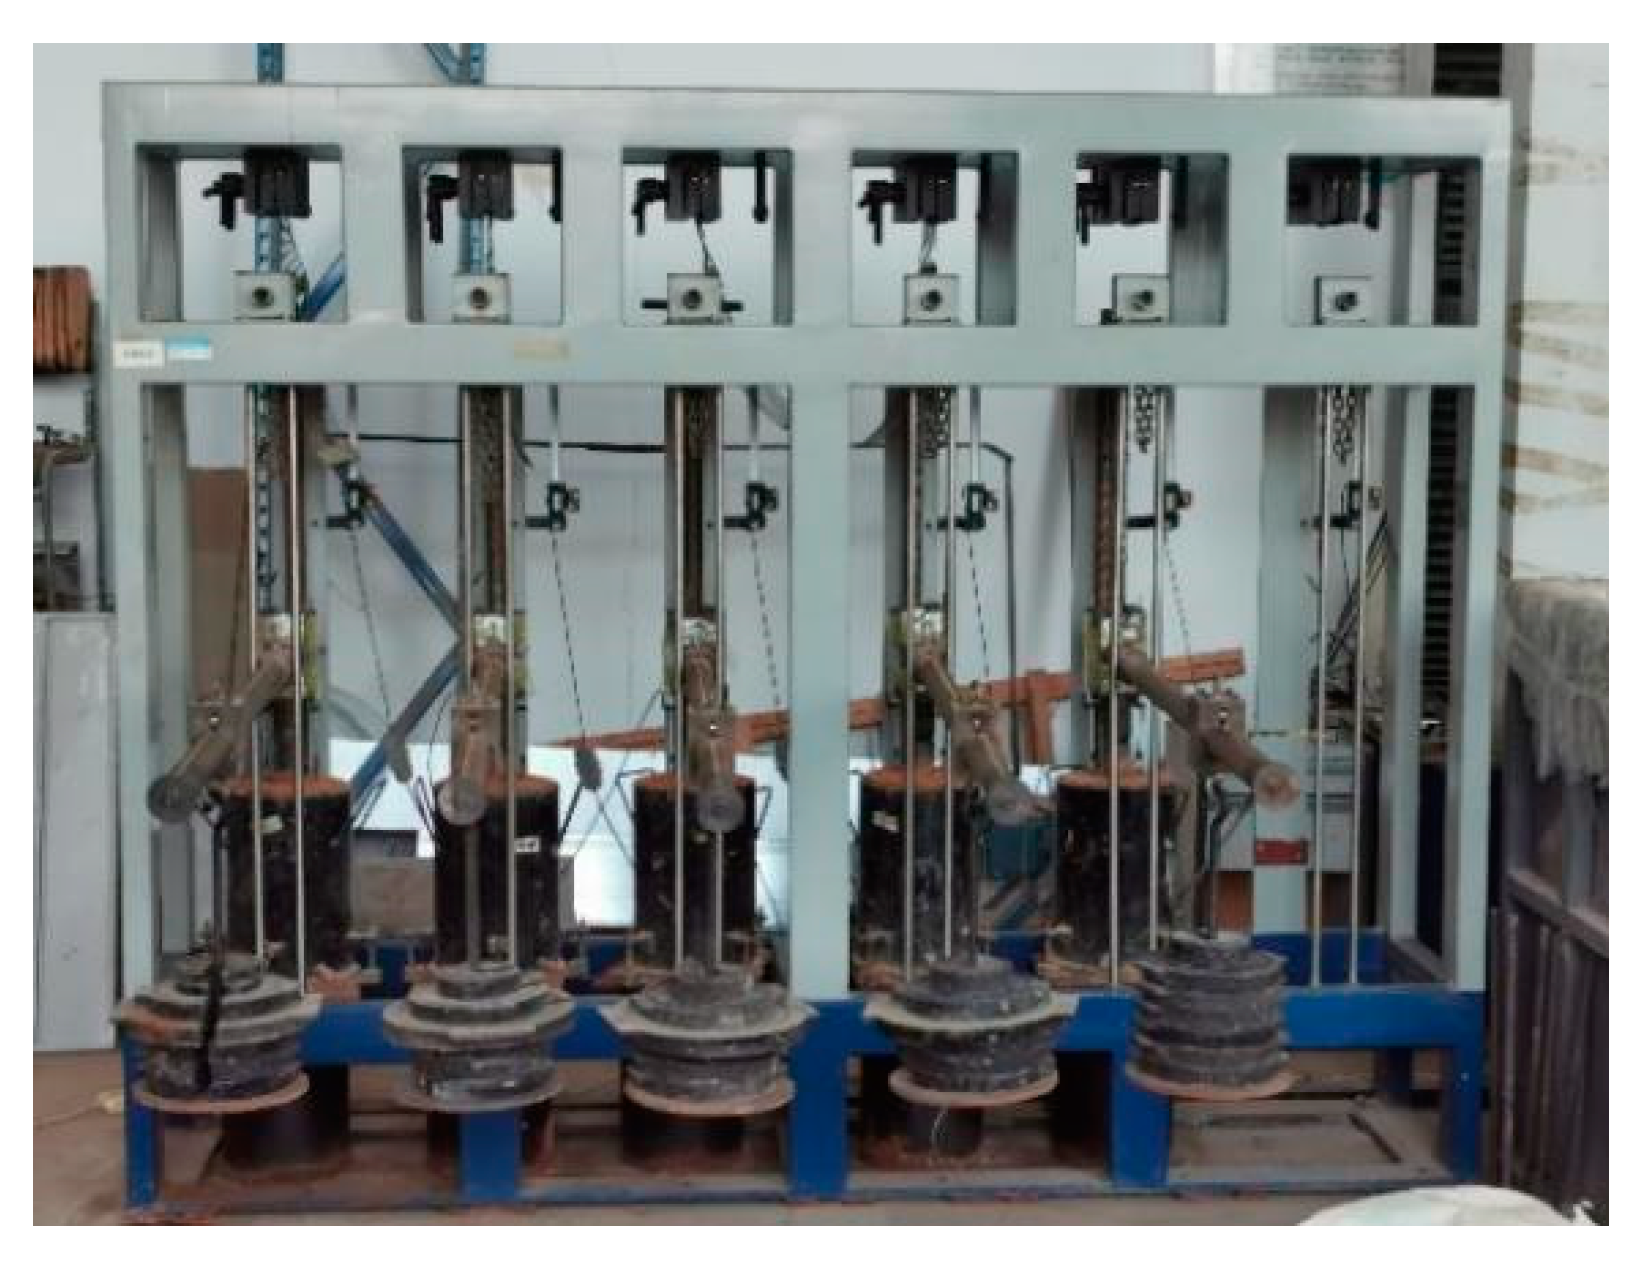
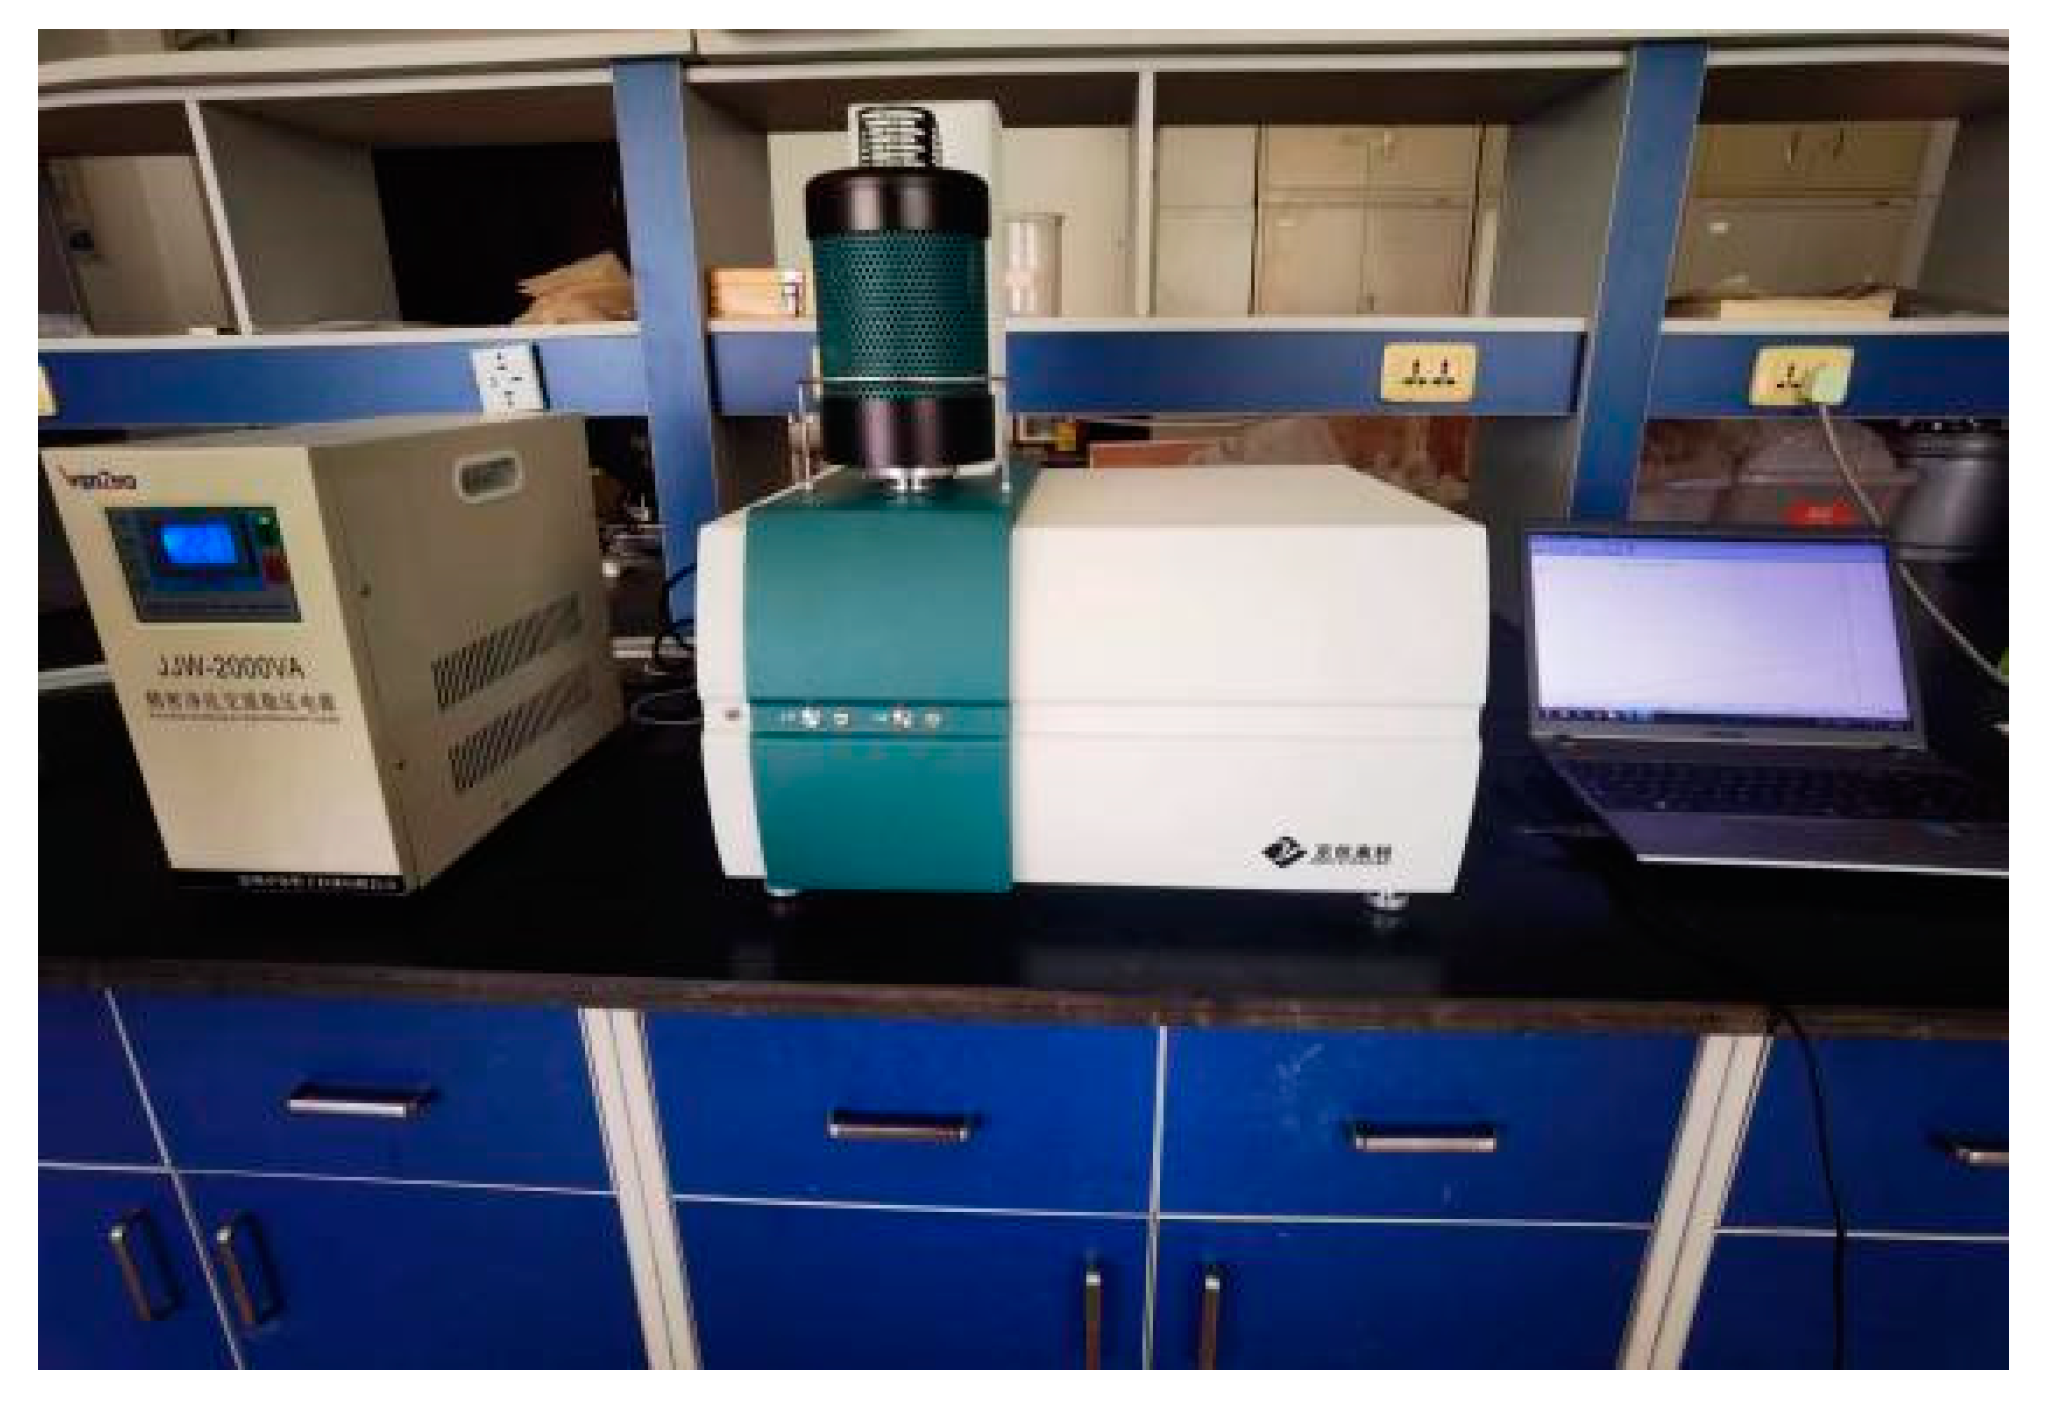
2. Materials and Methods
3. Results and Discussion
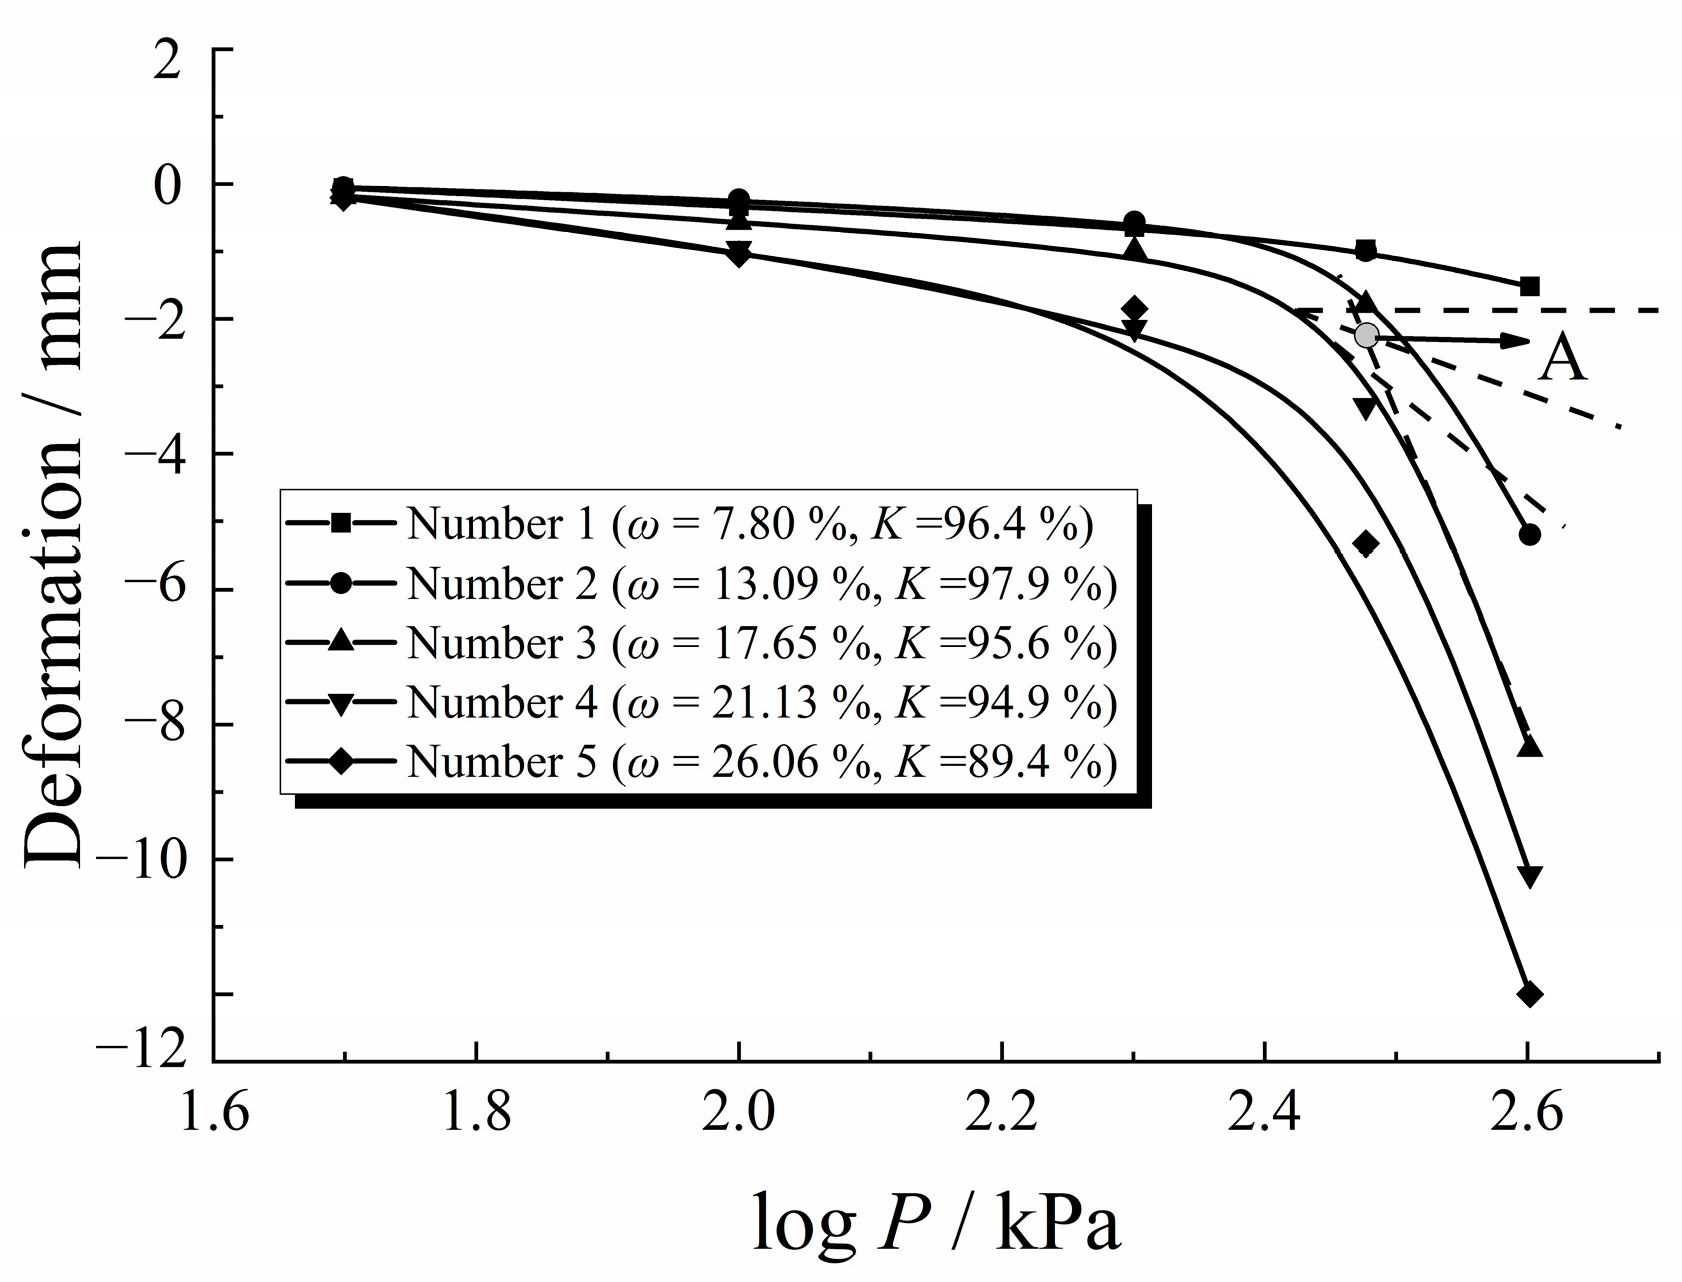
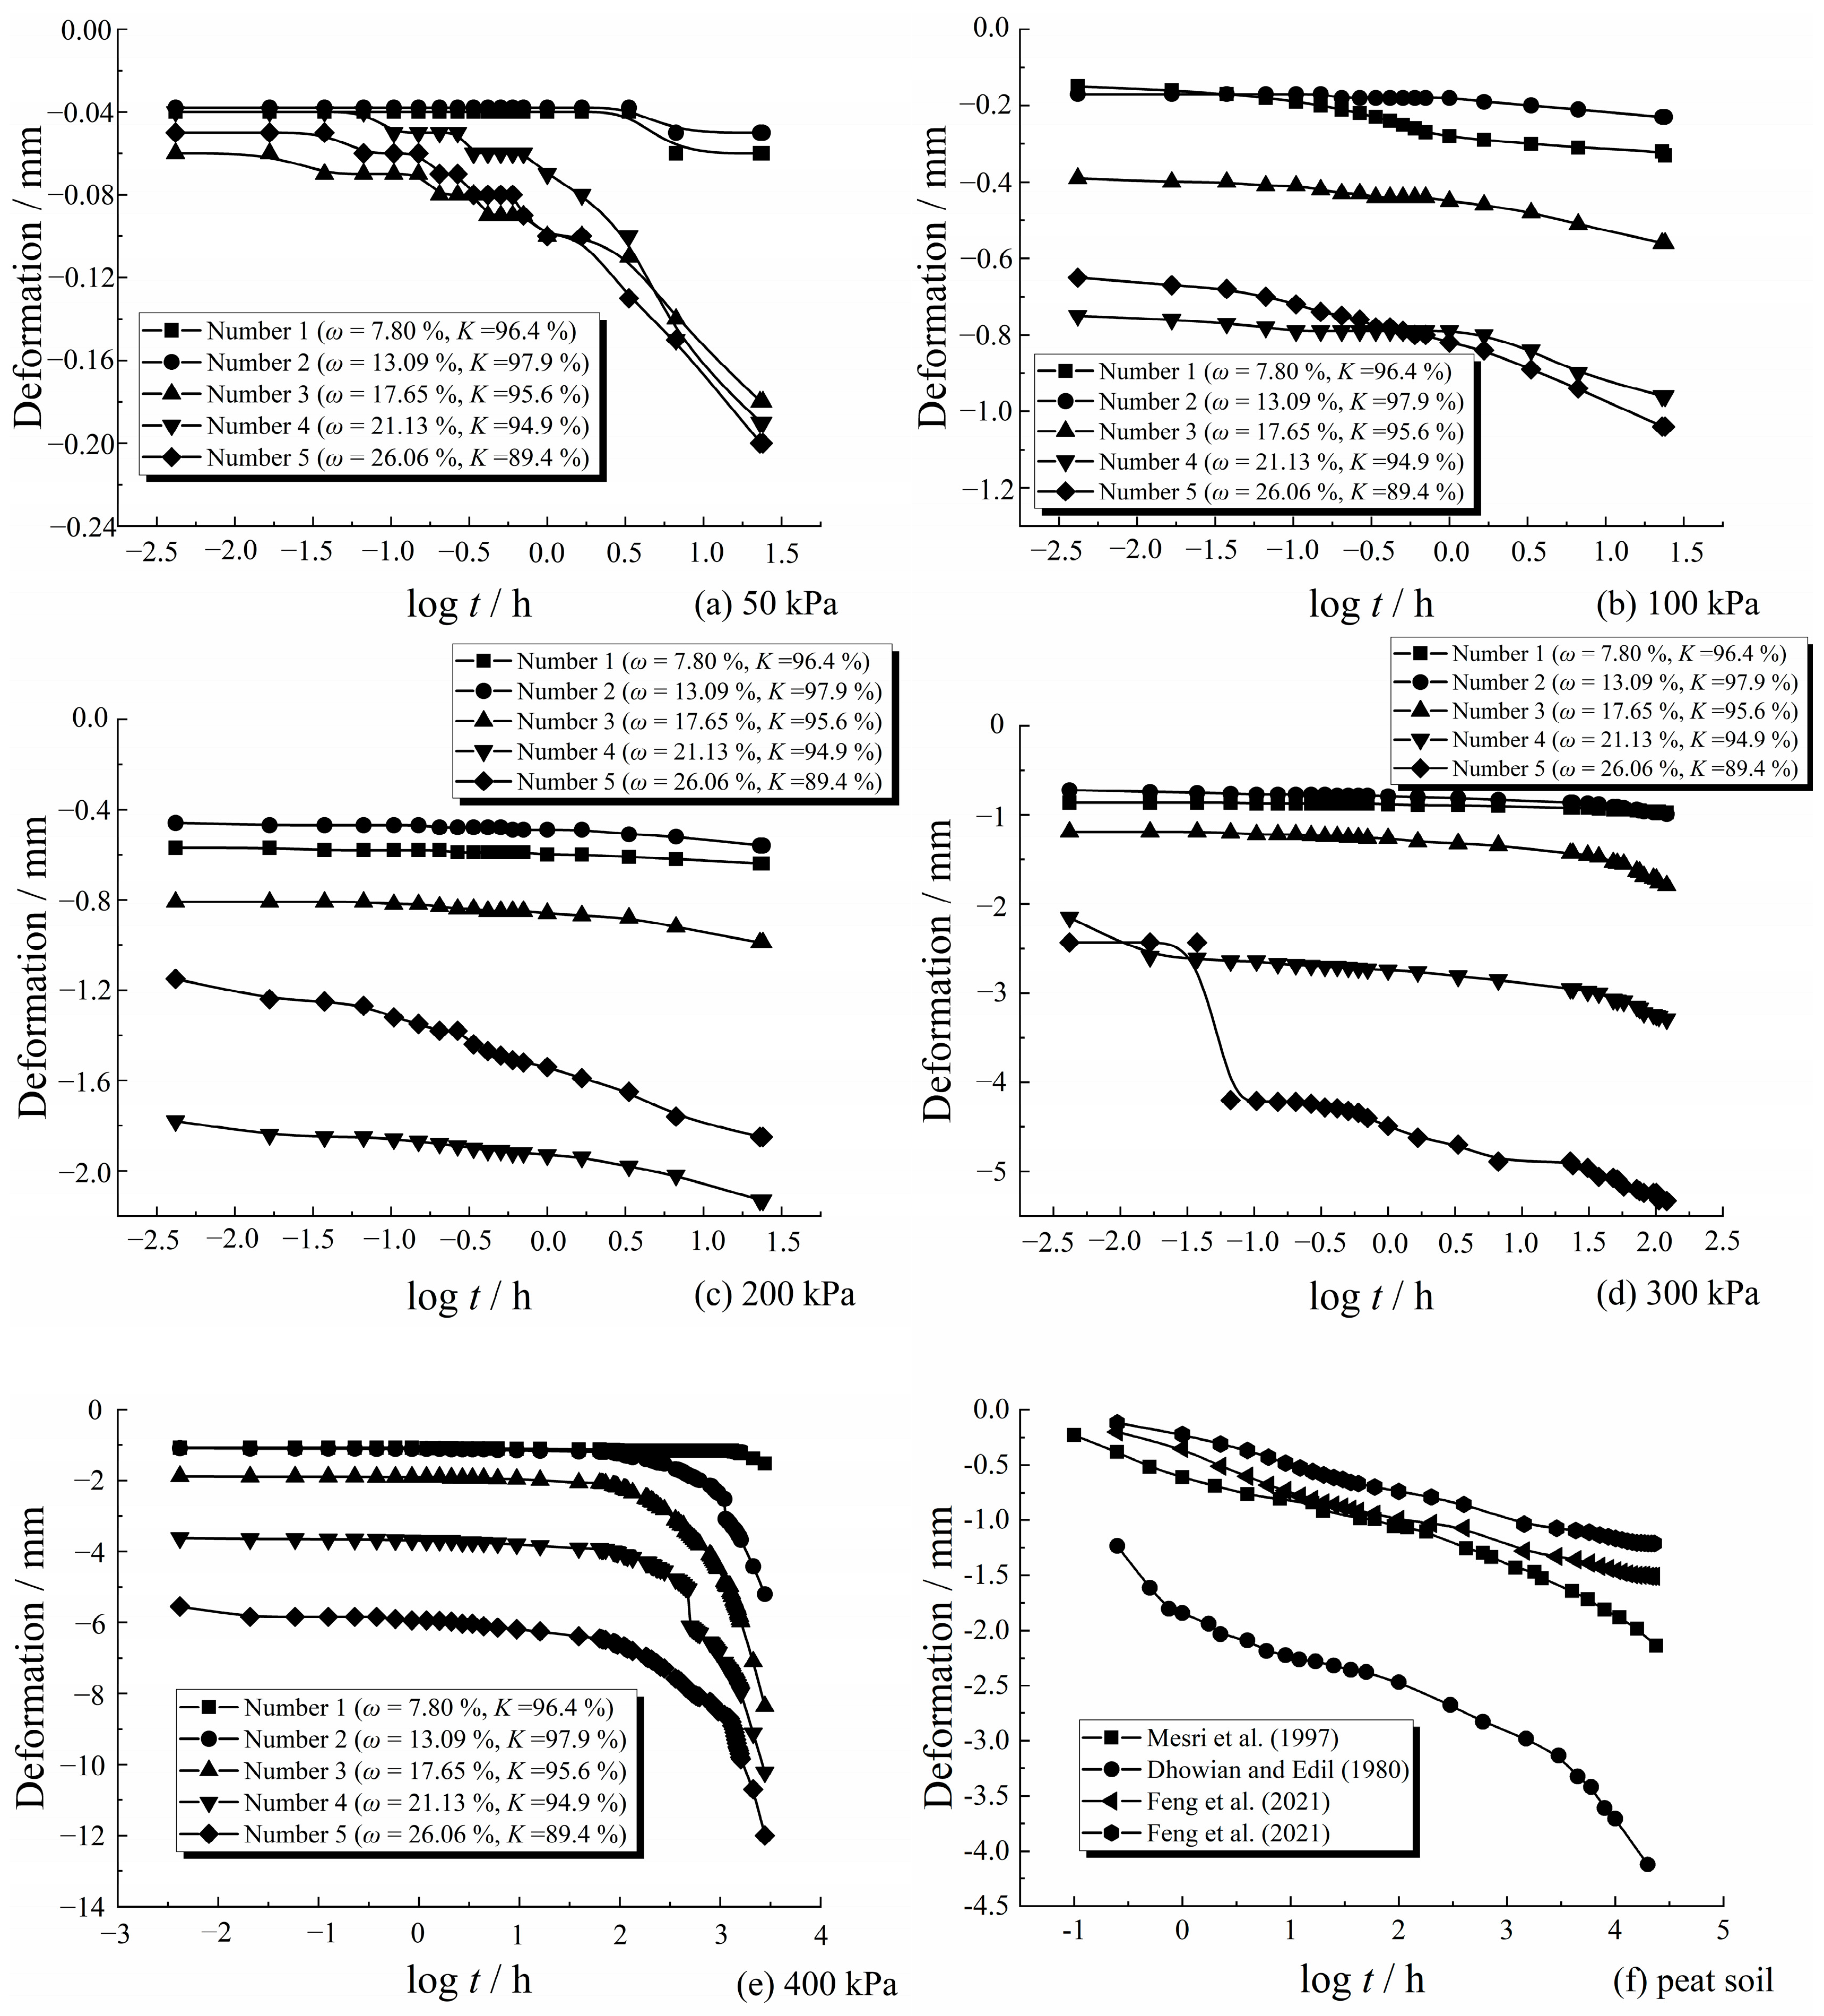
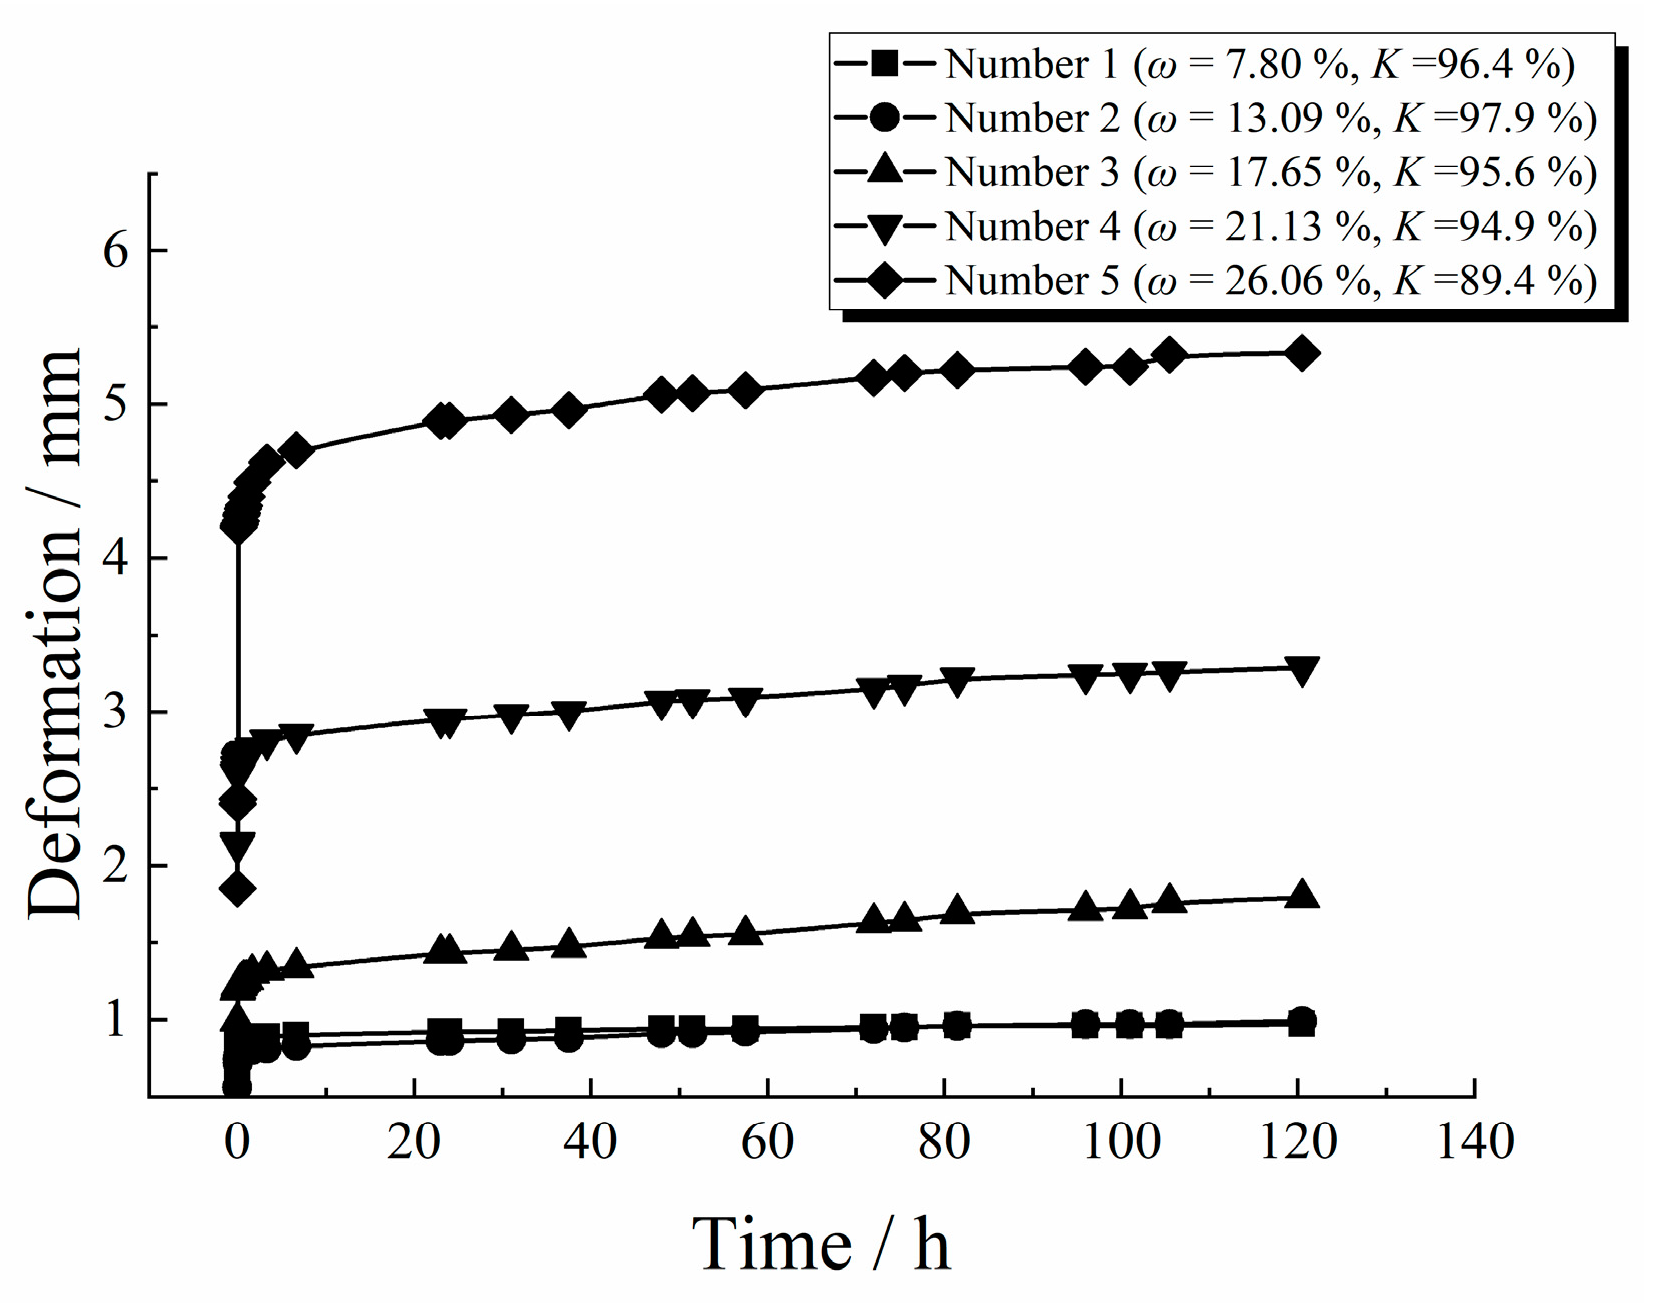
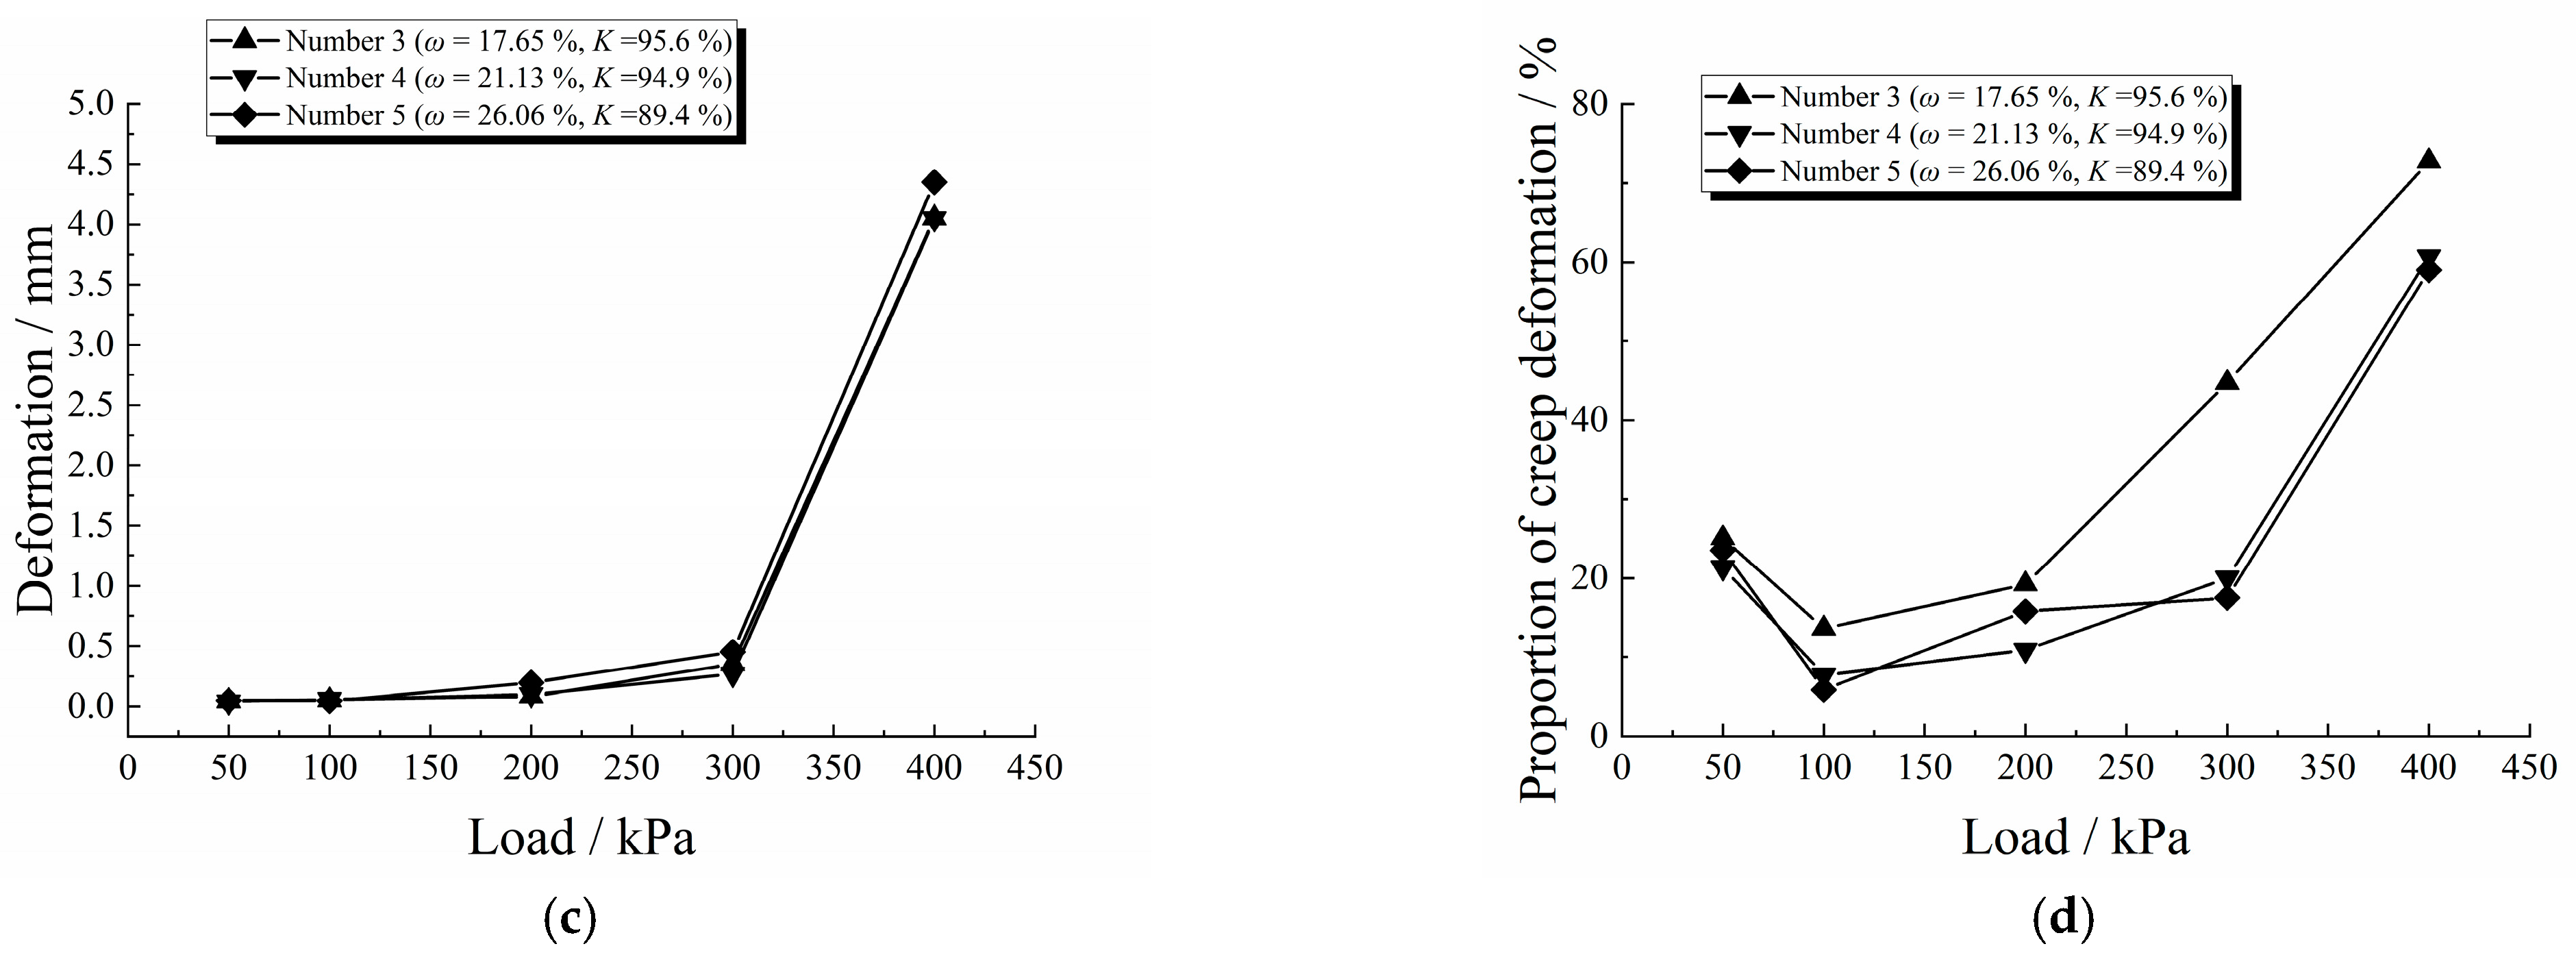
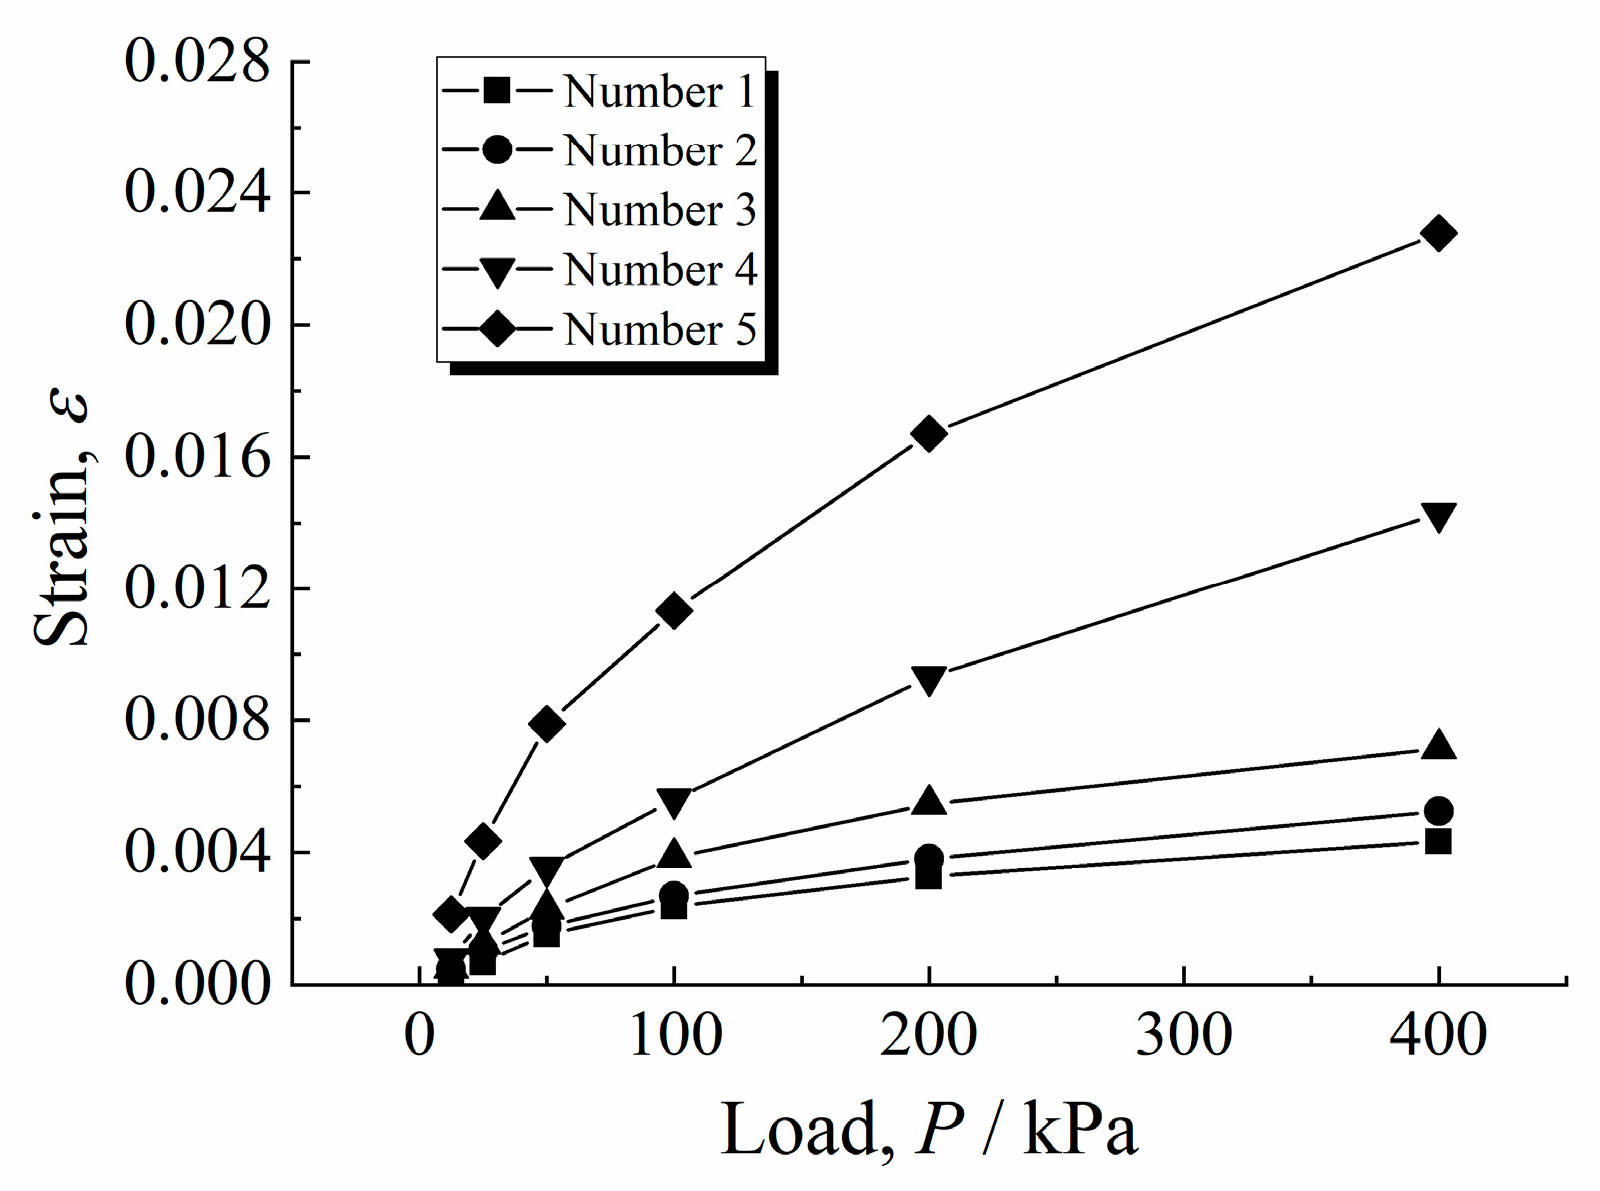
3.1. Analysis of Compression Deformation of Over-Wet Soil

| Load | ||
|---|---|---|
| 50 | ||
| 100 | ||
| 200 | ||
| 300 | ||
| 400 |
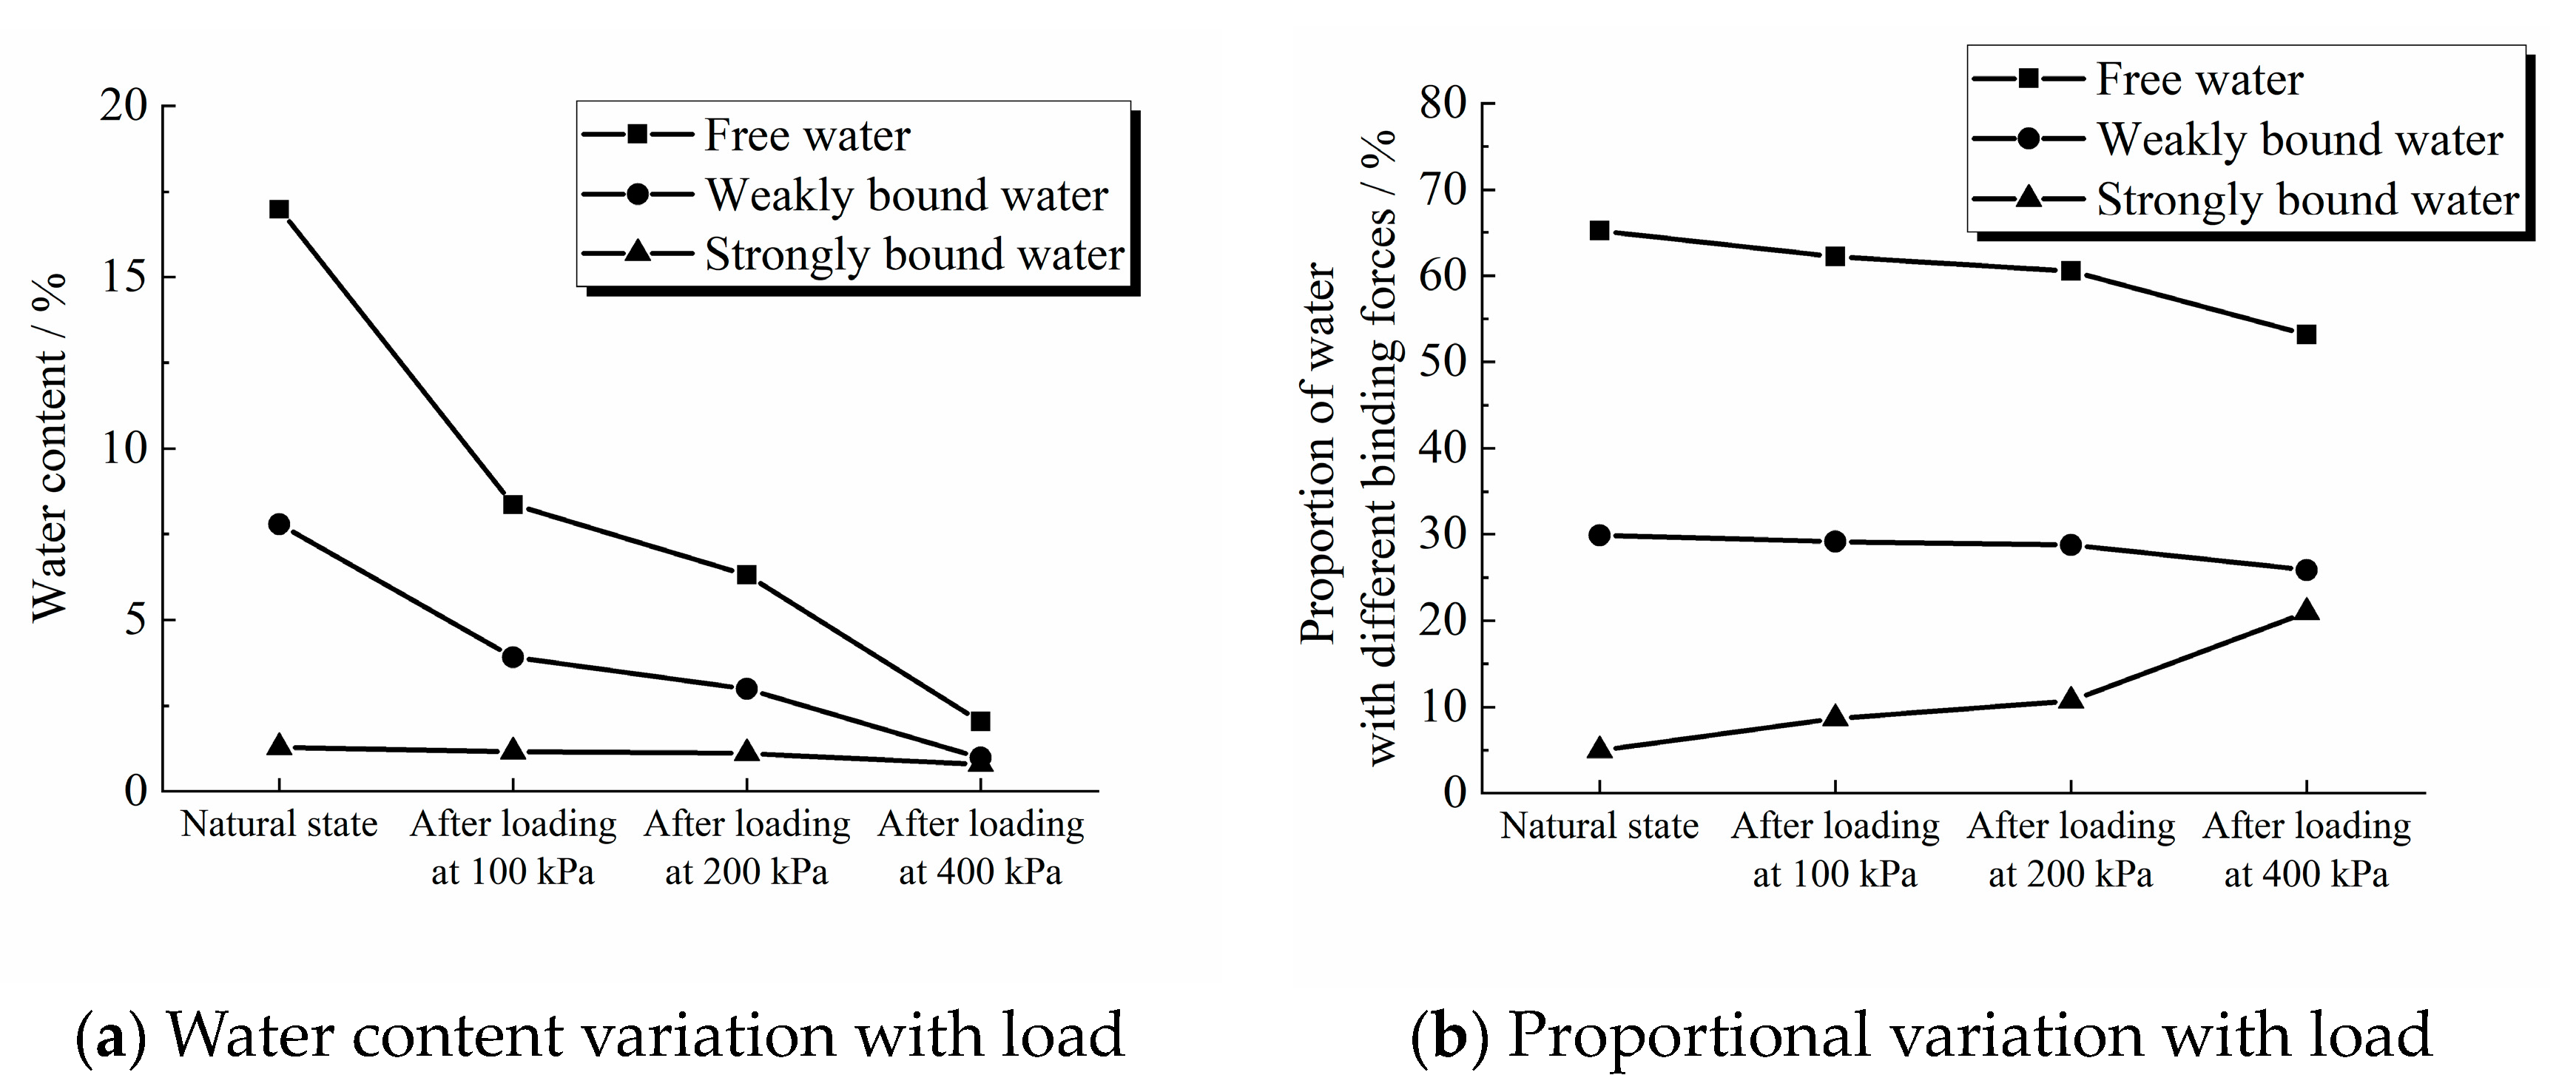
3.2. Analysis of Water Changes in Different Compression Stages of Over-Wet Soil
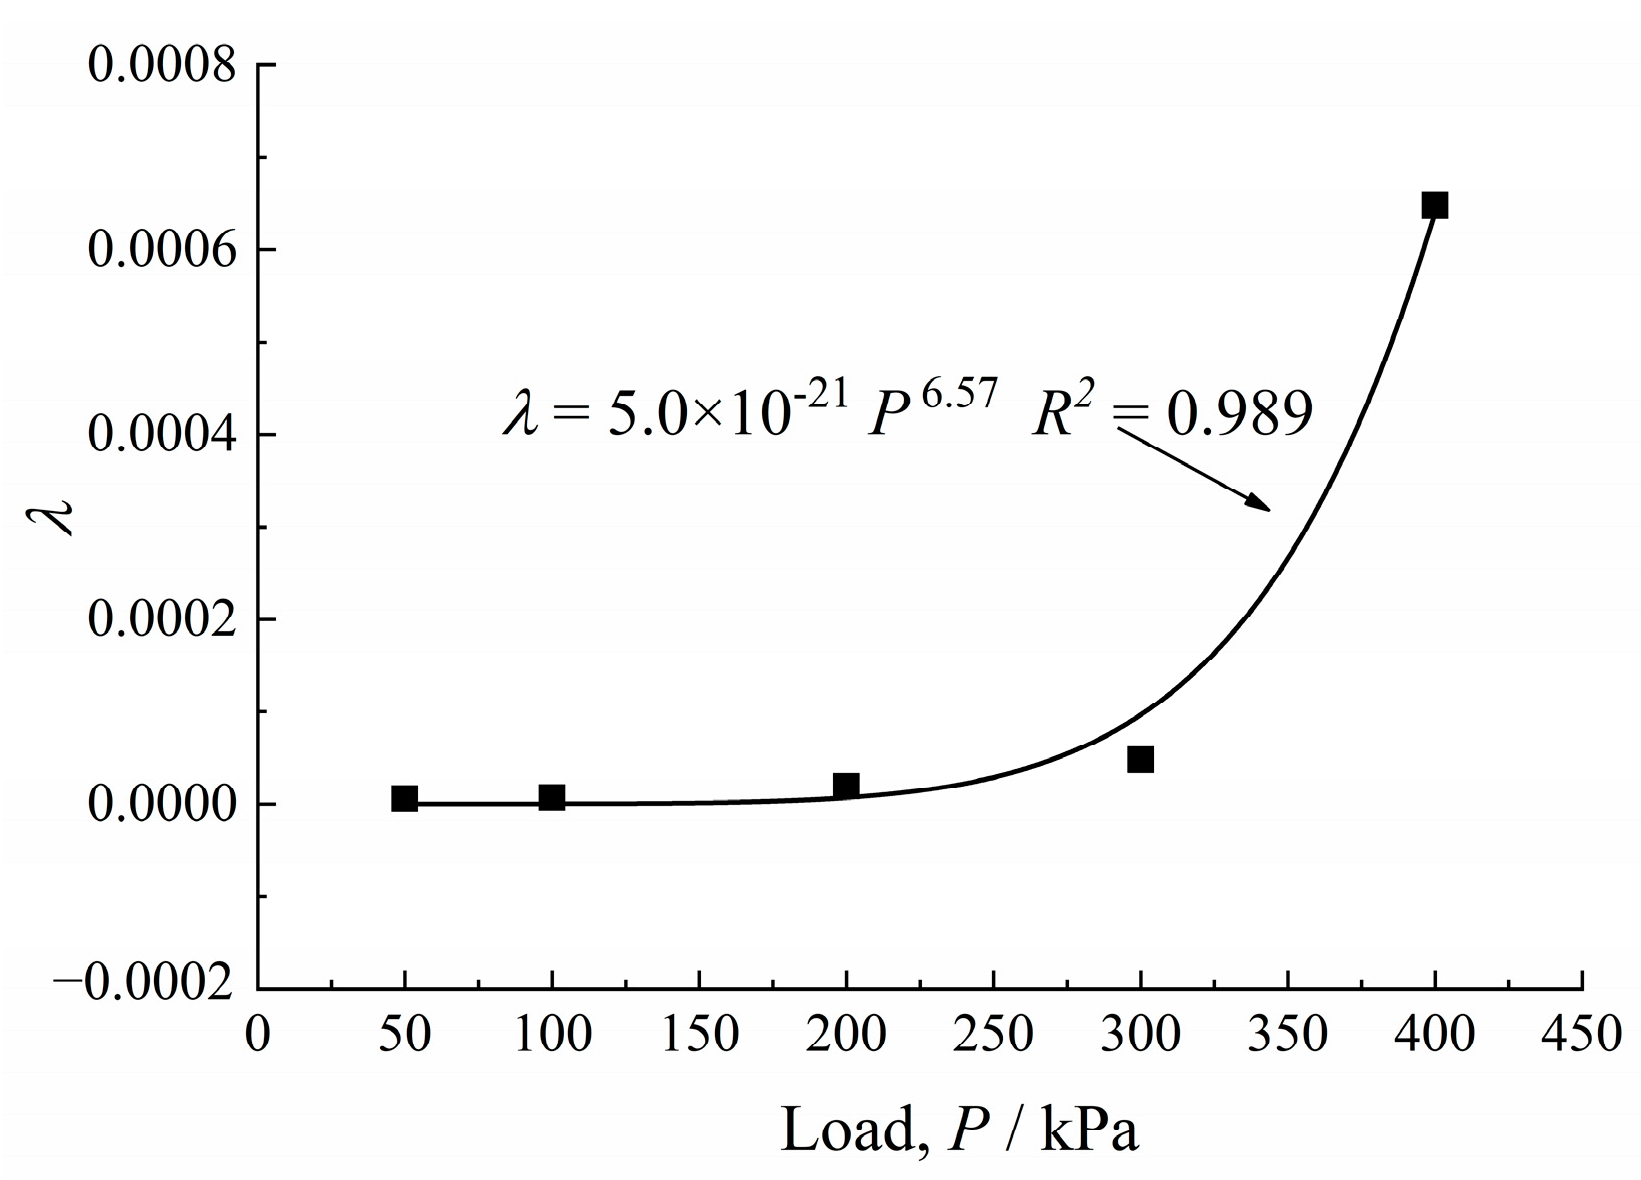
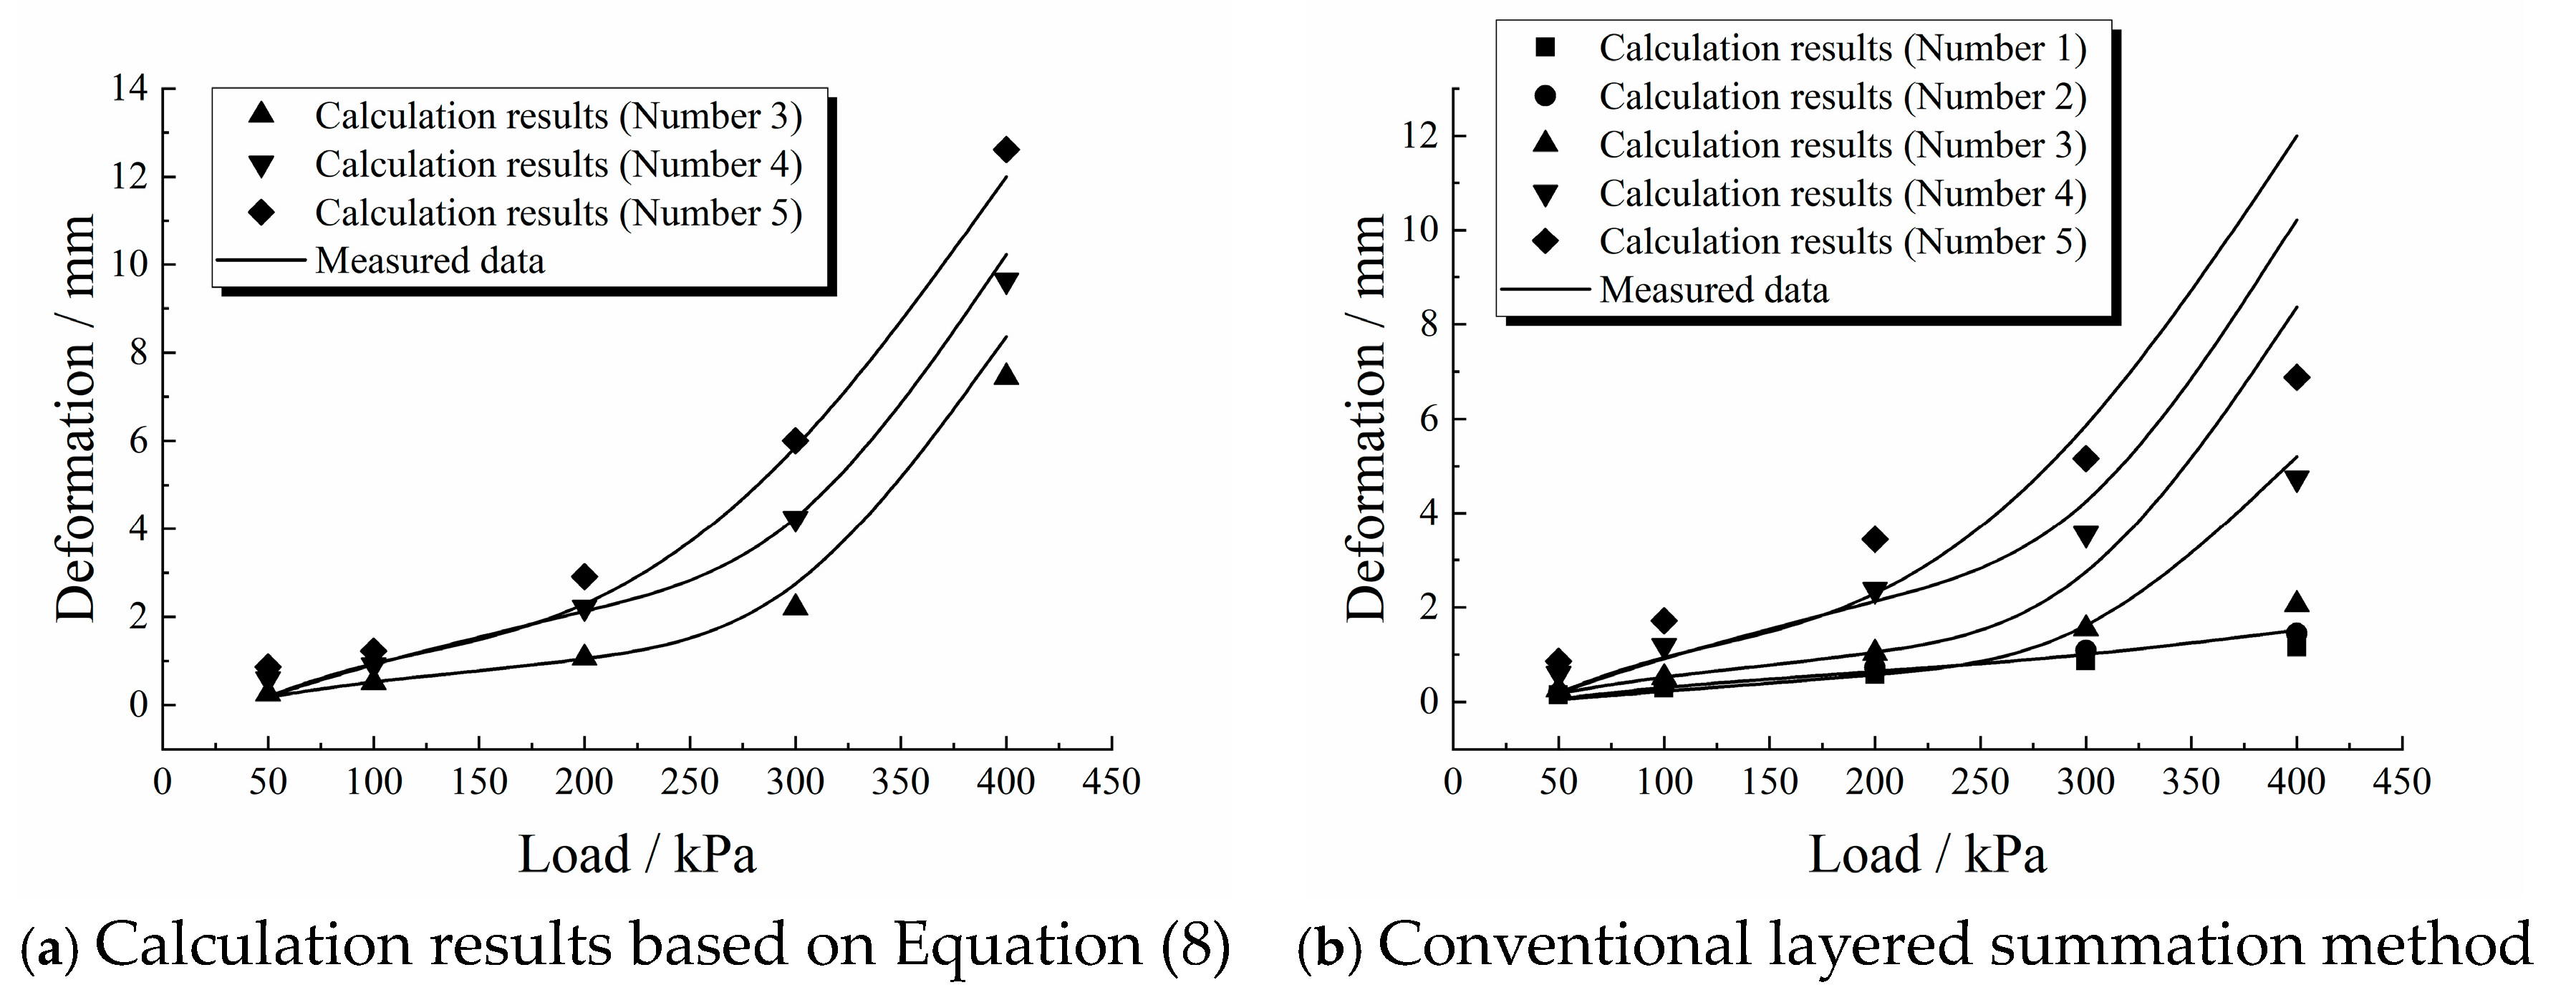
3.3. Calculation Method for Settlement of Over-Wet Soil
4. Conclusions
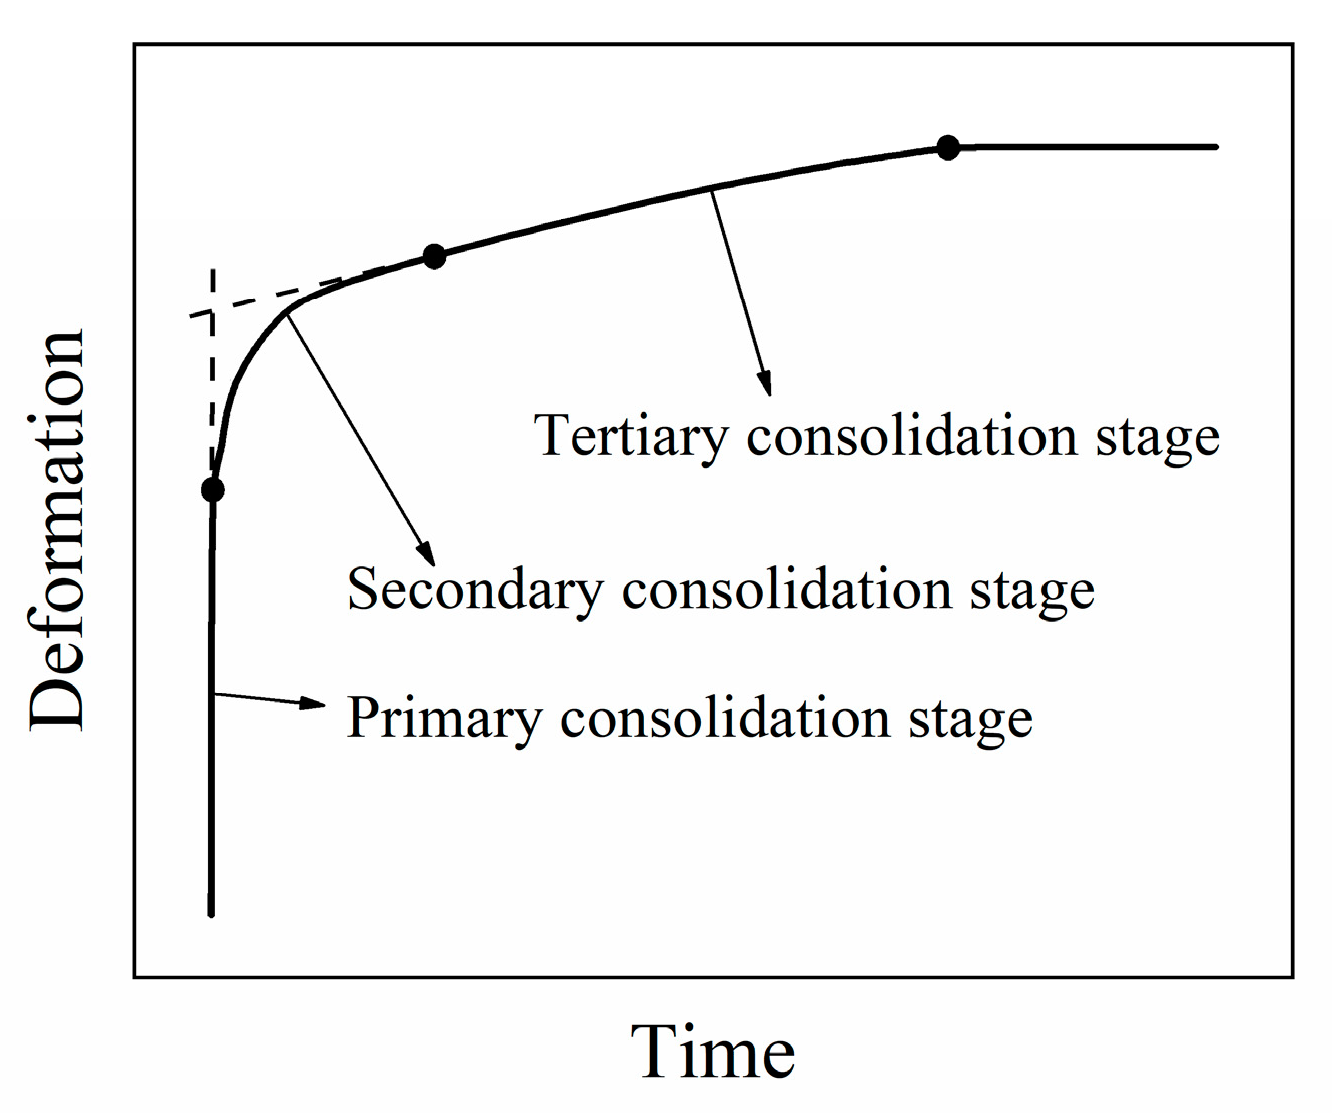
- The curve of the over-wet soil differed significantly from that of general soft soil. The deformation could not be stabilized within a short period. Employing a three-stage compression division method based on the curves is recommended.
- When the load was below the pre-consolidation pressure, the deformation of the over-wet soil increased as the compaction degree decreased, and the creep deformation was insignificant. When the load exceeded the pre-consolidation pressure, the deformation of the over-wet soil increased as the water content increased. The proportion of creep deformation exceeded 60%.
- Free water in over-wet soil was mainly discharged during the primary consolidation stage. Weakly bound water was mainly discharged during the tertiary consolidation stage, and strongly bound water remained almost unchanged. The large creep deformation of over-wet soil was caused by the discharge of weakly bound water, which was determined by comparing the drainage amounts of weakly bound water and strongly bound water.
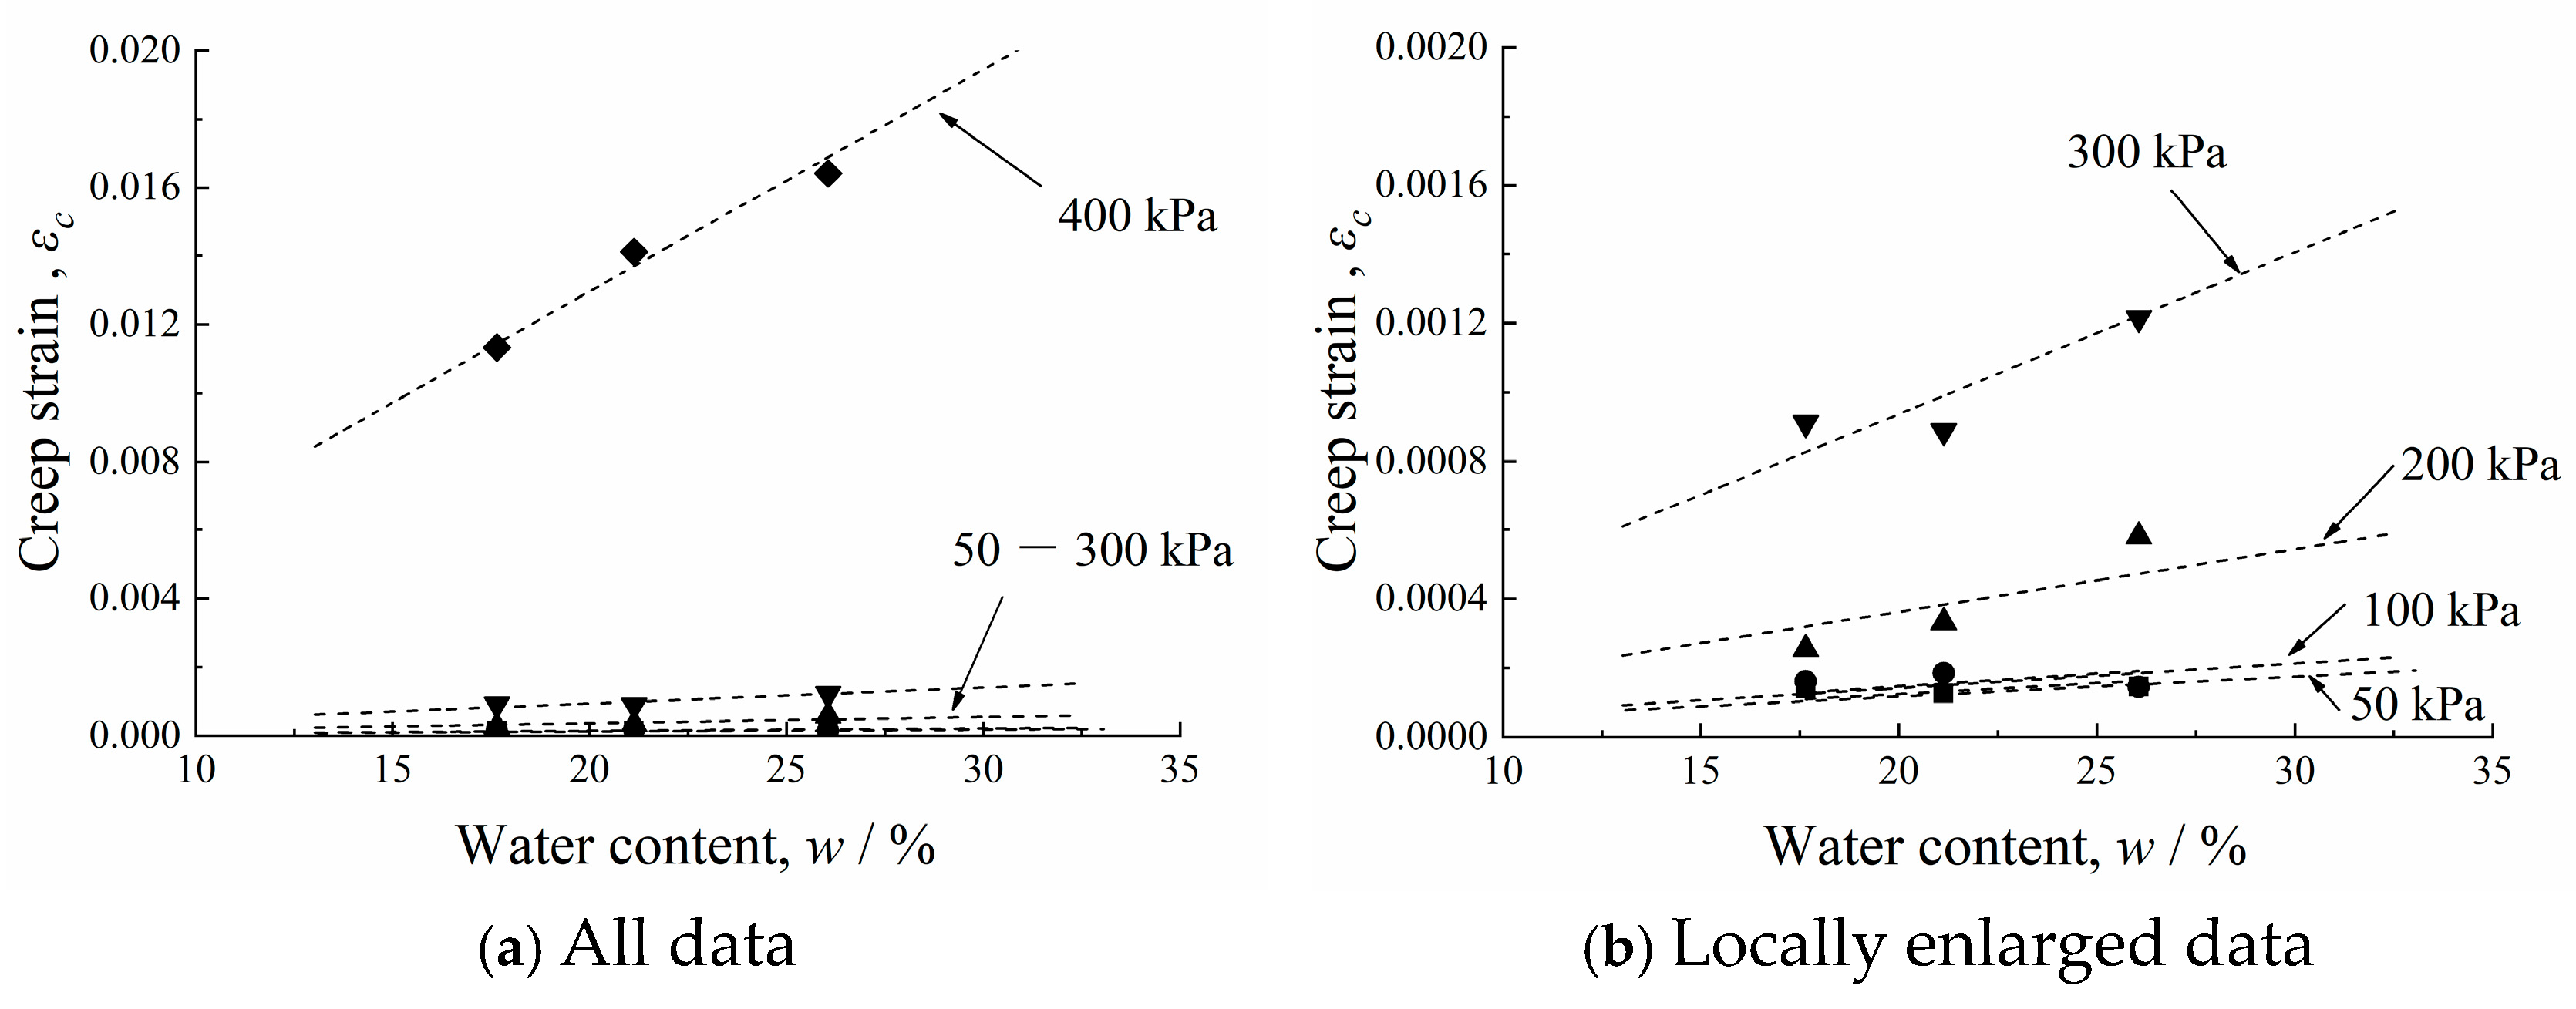
- The creep of the over-wet soil increased linearly with the water content, and its linear correlation coefficient exceeded 0.94. This law was the first to define the creep coefficient. Based on the conventional layered summation method, an exponential relationship between the creep coefficient and load was proposed. Furthermore, a calculation method for the foundation settlement of over-wet soil was established with a higher prediction accuracy than the conventional method.
Author Contributions
Funding
Data Availability Statement
Conflicts of Interest
References
- Sha, Q. Highway Compaction and Compaction Standards; China Communications Press: Beijing, China, 2000. [Google Scholar]
- Wang, S.; Zhang, L.; Wu, H.; Duan, X.; Chen, J. Parameter design of over-wet soil fill treated by electro-osmosis. Chin. J. Geotech. Eng. 2010, 32, 211–215. [Google Scholar]
- Du, Y.; Liu, S.; Wei, M.; Zhu, J. Micromechanism of over-wet clayey soils stabilized by calcium carbide residues. Chin. J. Geotech. Eng. 2014, 33, 1278–1285. [Google Scholar]
- Hu, Q.; Wen, H.; Gong, C. Model testing research on reducing water content of saturated over-wet soil. Adv. Mater. Res. 2011, 243, 3277–3284. [Google Scholar] [CrossRef]
- Wen, H.; Gu, S.; Su, Y.; Zhu, B. Field test research on treatment of over-wet soil. Adv. Mater. Res. 2011, 261, 1003–1008. [Google Scholar] [CrossRef]
- Gu, S.; Wen, H.; Su, Y.; Jia, B. Model test research on bearing behavior of improved over-wet soil. Adv. Mater. Res. 2011, 261, 1009–1013. [Google Scholar] [CrossRef]
- Qin, X.; Du, Y.; Liu, S.; Liu, M.; Zhang, Y. Experimental study on physical and mechanical properties of over-wet clayey soils stabilized by calcium carbide residues. Chin. J. Geotech. Eng. 2013, 35, 175–180. [Google Scholar]
- Li, W.; Pan, D.; Yan, Z.; Yu, W.; Zhou, Z. Study on experimental evaluation method of improvement of over-wet complex soil by cement. IOP Conf. Ser. Earth Environ. Sci. 2021, 676, 012114. [Google Scholar]
- Lai, T.; Wang, X.; Luan, H. The study of modeling experiment in loading properties for super-long single pile in over-wet loess. In Proceedings of the 2nd International Conference on Information Science and Engineering, Hangzhou, China, 4–6 December 2010; pp. 7069–7072. [Google Scholar]
- Guo, Z.; Qian, J. Permanent deformation of compacted clay with high moisture content. J. Cent. South Univ. (Sci. Technol.) 2016, 47, 1058–1064. [Google Scholar]
- Deng, X.; Wu, W.; You, J.; Jiang, R.; Li, M.; Li, J.; Tao, Y.; Cheng, H.; Zhou, W.; Deng, F.; et al. Calibration of the Edinburgh Elasto-Plastic Adhesion Contact Model for Modelling Clay-Moist Soil with High Moisture Content; Elsevier: Amsterdam, The Netherlands, 2024. [Google Scholar]
- Skuodis, S.; Dirgeliene, N.; Lekstutyte, I. Change of soil mechanical properties due to triaxial sample size. In Proceedings of the 13th International Conference Modern Building Materials, Structures and Techniques, Vilnius, Lithuania, 16–17 May 2019; pp. 470–474. [Google Scholar]
- Zieba, Z.; Krokowska, M.; Wyjadlowski, M.; Kozubal, J.; Kania, T.; Monka, J. Assessing the Scale Effect on Bearing Capacity of Undrained Subsoil: Implications for Seismic Resilience of Shallow Foundations. Materials 2023, 16, 5631. [Google Scholar] [CrossRef]
- Ahmad, A.; Sutanto, M.H.; Ahmad, N.R.; Mohamad, M.E.; Bujang, M. Microstructural Characterization of Fibric Peat Stabilized with Portland Cement and Silica Fume. Materials 2023, 16, 18. [Google Scholar] [CrossRef]
- ASTM D4318-17E1; Standard Test Methods for Liquid Limit, Plastic Limit, and Plasticity Index of Soils. American Society for Testing and Materials: West Conshohocken, PA, USA, 2017.
- Sternik, K. Elasto-plastic Constitutive Model for Overconsolidated Clays. Int. J. Civ. Eng. 2017, 15, 431–440. [Google Scholar] [CrossRef]
- Mesri, G.; Stark, T.; Ajlouni, M.; Chen, C. Secondary compression of peat with or without surcharging. J. Geotech. Engrg. 1997, 123, 411–421. [Google Scholar] [CrossRef]
- Dhowian, A.; Edil, T. Consolidation behavior of peats. Geotech. Test. J. 1980, 3, 10. [Google Scholar] [CrossRef]
- Feng, R.; Peng, B.; Wu, L.; Cai, X.; Shen, Y. Three-stage compression characteristics of highly organic peaty soil. Eng. Geol. 2021, 294, 106349. [Google Scholar] [CrossRef]
- Liu, J.; Hu, S.; Liu, G.; Zhang, J.; Lu, Z. Study of Constitutive Models of Reconstituted Clay with High Initial Water Content. Sustainability 2023, 15, 12618. [Google Scholar] [CrossRef]
- Nie, G.; Liu, Y.; Liu, Z.; Liang, Z.; Xue, J.; Liang, Y. The Effects of Drainage Conditions on the Cyclic Deformation Characteristics of Over Consolidated Clayey Soil. Int. J. Civ. Eng. 2023, 21, 603–615. [Google Scholar] [CrossRef]
- Bunker, B.; Casey, W. The structure and properties of water. In The Aqueous Chemistry of Oxides; Oxford University Press: Oxford, UK, 2016. [Google Scholar]
- Kucerik, J.; Demyan, M.; Siewert, C. Practical applications of thermogravimetry in soil science. Part 4: Relationship between clay, organic carbon and organic matter contents. J. Therm. Anal. Calorim. 2016, 123, 2441–2450. [Google Scholar] [CrossRef]
- Wang, Y.; Lu, S.; Ren, T.; Li, B. Bound water content of air-dry soils measured by thermal analysis. Soil Sci. Soc. Am. J. 2011, 75, 481–487. [Google Scholar] [CrossRef]
- Li, S.; Wang, C.; Zhang, X.; Zuo, L.; Dai, Z. Classification and characterization of bound water in marine mucky silty clay. J. Soils Sediments 2019, 19, 2509–2519. [Google Scholar] [CrossRef]
- Chen, J.; Anandarajah, A.; Inyang, H. Pore fluid properties and compressibility of kaolinite. J. Geotech. Geoenviron. Eng. 2000, 126, 798–807. [Google Scholar] [CrossRef]
- Morrow, C.; Moore, D.; Lockner, D. The effect of mineral bond strength an absorbed water on fault gouge frictional strength. Geophys. Res. Lett. 2000, 27, 815–818. [Google Scholar] [CrossRef]
- Di, H.; Zhou, S.; Xiao, J.; Gong, Q.; Luo, Z. Investigation of the long-term settlement of a cut-and-cover metro tunnel in a soft deposit. Eng. Geol. 2016, 204, 33–40. [Google Scholar] [CrossRef]
- Peng, B.; Feng, R.; Wu, L.; Wei, K.; Wang, P. Settlement Calculation Method for Peat Soil Foundations. Int. J. Geomech. 2023, 23, 04023094. [Google Scholar] [CrossRef]
- Wei, X.; Wang, G.; Wu, R. Prediction of traffic loading-induced settlement of low-embankment road on soft subsoil. Int. J. Geomech. 2017, 17, 06016016. [Google Scholar] [CrossRef]
- ASTM D2435-03; Standard Test Method for One-Dimensional Consolidation Properties of Soils. American Society for Testing and Materials: West Conshohocken, PA, USA, 2017.


| Water Content w/% | Liquid Limit wL/% | Plastic Limit wP/% | Plasticity Index IP/% | Optimum Water Content/% | Maximum Dry Density/g·cm−3 | Humidity (%) |
|---|---|---|---|---|---|---|
| 16.80 | 58.0 | 24.2 | 33.8 | 13.3 | 1.765 | 92 |
| Gradation/% | Classification | ||||
|---|---|---|---|---|---|
| 5 mm–20 mm | 2 mm–5 mm | 0.25 mm–2 mm | 0.075 mm–0.25 mm | <0.075 mm | |
| 0 | 0.17 | 1.88 | 1.03 | 96.92 | High liquid limit clay |
| Number | Target Water Content/% | Actual Water Content, w/% | Dry Density/g·cm−3 | Compaction Degree, K/% | Humidity/% |
|---|---|---|---|---|---|
| 1 | 8 | 7.80 | 1.702 | 96.4 | 112 |
| 2 | 13 | 13.09 | 1.728 | 97.9 | 100 |
| 3 | 18 | 17.65 | 1.687 | 95.6 | 90 |
| 4 | 21 | 21.13 | 1.675 | 94.9 | 82 |
| 5 | 26 | 26.06 | 1.578 | 89.4 | 71 |
| Number | Pre-Consolidation Pressure/kPa |
|---|---|
| 1 | 304 |
| 2 | 316 |
| 3 | 297 |
| 4 | 281 |
| 5 | 257 |
| Number | 3 | 4 | 5 |
|---|---|---|---|
| Water content/% | 17.65 | 21.13 | 26.06 |
| Creep deformation/mm | 4.58 | 4.51 | 5.09 |
| Creep strain | 0.014 | 0.034 | 0.016 |
| Load/kPa | Primary Consolidation Stage/h | Secondary Consolidation Stage/h | Tertiary Consolidation Stage |
|---|---|---|---|
| 200 | 1.54 | 10.3 | Until deformation stabilizes |
| 400 | 6.08 | 359.1 |
| Number | 1 | 2 | 3 | 4 | 5 |
|---|---|---|---|---|---|
| /Mpa | 110.5 | 88.2 | 62.1 | 27.0 | 18.6 |
Disclaimer/Publisher’s Note: The statements, opinions and data contained in all publications are solely those of the individual author(s) and contributor(s) and not of MDPI and/or the editor(s). MDPI and/or the editor(s) disclaim responsibility for any injury to people or property resulting from any ideas, methods, instructions or products referred to in the content. |
© 2024 by the authors. Licensee MDPI, Basel, Switzerland. This article is an open access article distributed under the terms and conditions of the Creative Commons Attribution (CC BY) license (https://creativecommons.org/licenses/by/4.0/).
Share and Cite
Peng, B.; Wu, L.; Feng, R.; Song, C.; Liu, J.; Bian, X. Compression Law and Settlement Calculation Method of Over-Wet Soil Based on Large Samples. Appl. Sci. 2024, 14, 10247. https://doi.org/10.3390/app142210247
Peng B, Wu L, Feng R, Song C, Liu J, Bian X. Compression Law and Settlement Calculation Method of Over-Wet Soil Based on Large Samples. Applied Sciences. 2024; 14(22):10247. https://doi.org/10.3390/app142210247
Chicago/Turabian StylePeng, Bo, Lijian Wu, Ruiling Feng, Changjun Song, Jiangxin Liu, and Xiaolin Bian. 2024. "Compression Law and Settlement Calculation Method of Over-Wet Soil Based on Large Samples" Applied Sciences 14, no. 22: 10247. https://doi.org/10.3390/app142210247
APA StylePeng, B., Wu, L., Feng, R., Song, C., Liu, J., & Bian, X. (2024). Compression Law and Settlement Calculation Method of Over-Wet Soil Based on Large Samples. Applied Sciences, 14(22), 10247. https://doi.org/10.3390/app142210247