Communication

Data Reconciliation for Assessing Compliance of Physicochemical Properties of Petroleum Products in Commercial Transactions

by
Rosana Medeiros Moreira
1,2,
Ariadne Mayra Silva Rocha
3 and
Elcio Cruz de Oliveira
3,4,*
1
National Institute of Technology, Rio de Janeiro 20081-312, Brazil
2
Brazilian Institute of Metrology, Quality and Technology (INMETRO), Duque de Caxias 25250-020, Brazil
3
Postgraduate Programme in Metrology, Pontifical Catholic University of Rio de Janeiro, Rio de Janeiro 22451-900, Brazil
4
Land Transportation and Storage, Measurement and Product Inventory Management, Logistics, Petrobras S.A., Rio de Janeiro 20231-030, Brazil
*
Author to whom correspondence should be addressed.
Appl. Sci. 2024, 14(22), 10295; https://doi.org/10.3390/app142210295
Submission received: 7 October 2024 / Revised: 7 November 2024 / Accepted: 7 November 2024 / Published: 8 November 2024

Abstract

:
The physicochemical properties of petroleum products in commercial transactions are crucial for quality control in the oil and gas industry. However, different laboratories often produce slightly different measurement results. These variations can be significant when approving or rejecting properties based on regulatory agency and environmental body specifications. A simple arithmetic average is typically used to determine the most probable value in disputes. This study proposed using a Data Reconciliation approach to address the disparity between the projected model and empirical data. An objective function was employed to optimize and evaluate parameters using maximum likelihood estimation, considering the experimental uncertainty values. This study found that the flash point of jet fuel, as determined by the Tag Closed Cup Tester, was within the specified range (maximum of 40 °C). The application of this tool resolved a dispute between a supplier and a customer, as the reconciled value with minimized uncertainty was determined to be 37.5 ± 2.0 °C. Additionally, the study utilized experimental results from 12 accredited laboratories to determine a single reconciled value for the final boiling point of gasoline. Despite the varying experimental uncertainties ranging from 6.0 °C to 13 °C, the reconciled uncertainty was minimized to 2.6 °C. The last case study identified that ASTM D4294 was incompatible with other test methods for evaluating the mass fraction in diesel oil. In this manner, Data Reconciliation enhanced the accuracy and effectively reduced measurement uncertainties, rendering it a potent tool for resolving legal disputes when evaluating the compliance of the physicochemical properties of petroleum products in commercial transactions.

Graphical Abstract

1. Introduction

In recent decades, the global community has expressed increasing concern about the growing number of pollutants emitted from the combustion of automotive fuels. The incomplete combustion of these fuels, which can result from engine malfunctions or the use of low-quality fuel, is a significant contributor to the generation of harmful pollutants that pose risks to the environment and human health.
To ensure that automotive fuels meet appropriate quality standards, they must adhere to various legal requirements, including limits on the sulfur content, flash point, boiling point, and other quality parameters.
During fuel combustion, sulfur combines with oxygen to form sulfur dioxide, which is released into the atmosphere along with carbon monoxide, carbon dioxide, and nitrogen oxides.
Sulfur dioxide is a highly polluting substance that poses significant environmental and human health risks. The inhalation of sulfur dioxide can irritate the respiratory tract and contribute to the development or exacerbation of cardiovascular and respiratory diseases and cancer. Additionally, when sulfur dioxide interacts with water in the atmosphere, it forms sulfuric acid, the primary contributor to acid rain. Acid rain leads to environmental devastation, including the death of trees, changes in the pH of rivers and lakes, and soil contamination [1,2,3].
Generally, the oil and gas industry optimizes its processes to produce fuels with a mass fraction of sulfur that closely aligns with the specified requirements. This optimization necessitates meticulous decision-making when assessing the compliance with current legislation regarding potential environmental and human health harm. This rigorous approach ensures that the industry operates according to environmental regulations and prioritizes the well-being of the environment and human beings.
Other quality and safety parameters inherent to fuels’ physical and chemical properties, such as the flash and boiling points, must also be carefully monitored and controlled. These parameters can impact human safety and must be within specified limits to ensure the safe handling and use of fuels.
The flash point of jet fuel refers to the minimum temperature at which it can ignite when exposed to an open flame. Jet fuel with a low flash point poses a significant fire hazard, as it has the potential for spontaneous ignition and explosion. This feature underscores the importance of ensuring that jet fuel has a sufficiently high flash point to mitigate the risk of fires [4].
The final boiling point of gasoline is the highest temperature reached during its distillation process. Variations in the distillation characteristics of gasoline can significantly impact various aspects of automotive performance, including engine start, acceleration, and the dilution of lubricant oil. Furthermore, these variations can also influence the fuel required during combustion. Significantly, a decrease in the final boiling point of gasoline leads to a decrease in the presence of heavier fuel components within the engine. This behavior indirectly contributes to a decrease in the production of pollutants during fuel combustion [5,6].
Measurements of commercial petroleum products are carried out to determine whether they meet specifications. Specifications can be related to legal compliance, commercial requirements, or internal quality control [7].
In the real world, measurements of the same attribute in a particular sample using different test methods often yield slightly different results. As a result, test methods typically discuss result precision. This variability measure indicates the reliability of the measured property value. Often, challenges in interpreting specifications arise from the inherent imprecision in testing.
Hence, it is not possible to determine a property’s exact value; instead, we must rely on measured values to estimate the likely range in which the “true value” may exist. Data Reconciliation (DR) is a powerful tool that addresses this issue. Process measurements are generally subject to random or systematic errors, often violating conservation laws [8,9].
DR in steady-state systems is an important process used in many industries to improve the accuracy and reliability of information collected from systems operating in equilibrium. In a steady-state system, variables such as flow, temperature, and pressure remain constant over time. Data from sensors and instruments may contain errors due to calibration issues or external conditions. The goal of reconciliation is to correct these errors so that the data are more accurate and useful for decision-making.
The reconciliation process involves several steps. First, a mathematical model based on physical principles must be developed to describe the relationship between the process variables. Next, measurement data are collected from different sources, such as flow meters and sensors. From these data, statistical methods are used to estimate the true values of the variables, minimizing the differences between the measured data and those predicted by the model.
After this estimation, it is essential to analyze the differences (residuals) to identify measurement errors or anomalies. Based on this analysis, the measured values are adjusted to reflect the reconciled estimates. The corrected data are then checked against known standards or additional measurements to validate their accuracy. Finally, the reconciled data are presented clearly, including the adjustments made and their implications for system performance.
The benefits of DR are significant. Increased accuracy results in more reliable data, improving system representation. In addition, data quality leads to more efficient operation control, optimizing resource allocation and reducing waste. Reliable data also increase the confidence in analysis and reporting, facilitating better decisions. Finally, the reconciliation process can reveal issues that need attention, driving continuous improvement.
In summary, DR in steady-state systems is essential to ensuring accurate and reliable data in industries such as chemical processing, oil and gas, and manufacturing. Organizations can improve their operations and achieve better results by correcting measurement errors and validating information.
On the other hand, DR in dynamic systems also involves validating consistency and completeness but focuses on information in constantly changing environments, such as monitoring platforms and databases that receive input in real time. In this context, reconciliation is essential to ensure data accuracy in operations.
DR was chosen over other filtering techniques because it utilizes process model constraints, such as the degree of statistical dependence between variables, to obtain estimates of process variables. These estimates are obtained by adjusting process measurements to satisfy the constraints.
DR improves the measurement accuracy by reducing random errors and leveraging redundant information from the system. Reconciled estimates are more accurate than experimental estimates, as DR exploits the redundancy property of measurements to minimize errors through weighted least squares optimization [10].
The reconciliation algorithms use multiple redundant measurements in experiments, which are multiple measurements that provide essentially the same information, m i e , to achieve a unique reconciled value, a reconciled measurement, m c , that better represents the population. On the other hand, the measurement uncertainty, that is, the variability associated with a measurement, is minimized, and is represented as u m c [11].
The typical procedure for implementing DR involves the following steps: (i) Definition of the reference model, i.e., a common structure and understanding of a specific system. In this step, it is assumed that the mathematical model is ideal, free from gross or systematic errors, mistakes, or inaccuracies in measurements, and follows a normal distribution. It also assumes independence between the measurements [12]. An objective function, F o b , describes it, that is, the disparity between the projected model and empirical data. (ii) The objective function, a mathematical function that measures the performance of a solution in optimization or decision-making problems, is optimized by formulating it as a multivariate Gaussian distribution, considering the experimental variances weighted by the measurement uncertainty. During this step, the goal is to minimize or maximize the probability of obtaining experimental measurements within the defined criteria. (iii) Evaluate the parameters [13] by maximum likelihood estimation (MLE), a statistical method used to find the best values for the parameters of a model. See Figure 1.
DR has been utilized in various industrial applications, specifically in energy. These include proposals for potential modifications of data validation and reconciliation methods to enhance the accuracy of the emission characteristics of fuel co-combustion processes [14], the presentation of a data processing framework for industrial process decision-making based on operating regimes [15], and the control of unaccounted-for gas in natural gas pipelines [16].
Additionally, studies are being conducted on the simulation of mixed alcohol synthesis [17], the techno-economic analysis of a CO2 capture process [18], and the forecasting of wind power for the next day [19]. These research efforts aim to improve the understanding and optimization of various industrial processes.
Furthermore, investigations are being conducted into analyzing aero engine measurement data [20] and optimizing production processes [21]. These studies focus on enhancing efficiency and performance in specific sectors.
Other areas of research include the control of thermal processes [22], the detection of anomalies in multiphase allocation systems [23], and the monitoring of industrial petrochemical plants [24]. These endeavors contribute to developing advanced monitoring and control techniques in industrial settings.
Moreover, there have been reviews that specifically examine problems related to chemical reactors [25] and explore the applications of DR (Data Reconciliation) in Analytical Chemistry [26]. These reviews provide insights into specific domains and offer potential solutions to existing challenges.
Lastly, research has been conducted on the connection of DR with the guard band concept in evaluating the conformity of fuel products [27,28], as well as the identification and treatment of outliers [29]. These studies address important aspects of data analysis and quality control.
The mentioned research efforts cover many topics, from process optimization and control to data analysis and anomaly detection. They enhance the efficiency, accuracy, and decision-making capabilities in various industrial sectors. Although DR is frequently used in engineering processes, it is rarely applied to Analytical Chemistry applications.
The objective of this study was to explore this topic as a pragmatic and applicable parameter for assessing disputes concerning the marketing of petroleum products.

2. Methodology

First, DR general statistics are presented, considering linear steady-state systems, and then, a detailed DR-specific mathematical model is detailed to be applied here.

2.1. Data Reconciliation General Statistics

The multivariate Gaussian distribution is the recommended multidimensional model for describing variations in this type of experimental data. The probability density function P(X) of this distribution, with a diagonal covariance matrix V, is given by
P X = 1 2 π N det V 1 2 exp 1 2 X μ T V 1 X μ
With the following parameters:
X = X 1 X 2 X N   μ = μ 1 μ 2 μ N   V = σ 1 2 σ 12 2 σ 1 N 2 σ 21 2 σ 2 2 σ 2 N 2 σ N 1 2 σ N 2 2 σ N 2
σ i 2 are the variability measures of the diagonal matrix of variance, V.
The reliable region of the P(X) for N points can be determined when
P X = constant = X μ T V 1 X μ
If only random errors are considered, the experimental data X   or   Z e and reconciled data μ   or   Z c must solely be attributed to the experimental uncertainties, as follows:
Error = ε = Z e Z c
Substituting Equation (3) in Equation (1), we obtain
P X = 1 2 π N det V 1 2 exp 1 2 ε T V 1 ε
P ε = P ( Z e Z c )
Replacing Equation (5) in Equation (4), we obtain
P X = 1 2 π N det V 1 2   e x p 1 2 Z e Z c T V 1 Z e Z c                                      
P Z e must be the maximum, as follows:
max P Z e Z c = F o b = max 1 2 π N det V 1 2 exp 1 2 Z e Z c T V 1 Z e Z c
Considering that applying the natural logarithm to a value and then applying the exponential function to the result yields the original value, Equation (7) becomes Equation (8):
F o b = max ln 1 2 π N det V 1 2 1 2 Z e Z c T V 1 Z e Z c
F o b = max 1 2 Z e Z c T V 1 Z e Z c
as the derivative of constants is always zero.
F o b = max Z e Z c T V 1 Z e Z c
Maximizing a negative function is the same as minimizing a positive function, so Equation (7) becomes Equation (8):
F o b = min Z e Z c T V 1 Z e Z c

2.2. Detailing Data Reconciliation to a Singular Mathematical Model

Considering the basic mathematical model, m 1 c = m 2 c = = m N c , which may be useful for applications related to the assessment of conformity of physical–chemical properties, the reconciliation of N outcomes of the same quantity is performed as follows:
Z e = m 1 e m 2 e m N e   Z c = m 1 c = m c m 2 c = m c m N c = m c = m c m c m c   Z e Z c = m 1 e m c m 2 e m c m N e m c
If the quantities are not correlated themselves, Equation (11) assumes the following:
F o b = min m 1 e m c m 2 e m c m N e m c T σ 1 2 0 0 0 σ 2 2 0 0 0 σ N 2 1 m 1 e m c m 2 e m c m N e m c
The inverse of a matrix is a special matrix that “undoes” the effects of the original matrix.
F o b = min m 1 e m c m 2 e m c m N e m c   1 σ 1 2 0 0 0 1 σ 2 2 0 0 0 1 σ N 2   m 1 e m c m 2 e m c m N e m c
The objective function can be represented as follows:
F o b = min m 1 e m c 2 σ 1 2 + m 2 e m c 2 σ 2 2 + + m N e m c 2 σ N 2
F o b m c = min F o b = 2 m 1 e m c σ 1 2 2 m 2 e m c σ 2 2 2 m N e m c σ N 2 = 0
m c = m 1 e σ 1 2 + m 2 e σ 2 2 + + m N e σ N 2 1 σ 1 2 + 1 σ 2 2 + + 1 σ N 2
m c = m i e σ i 2 1 σ i 2
Thereby, the standard uncertainty, based on GUM [30], is as follows:
u m c 2 = 1 σ 1 2 1 σ 1 2 + 1 σ 2 2 + + 1 σ N 2 × u m 1 e 2 + 1 σ 2 2 1 σ 1 2 + 1 σ 2 2 + + 1 σ N 2 × u m 2 e 2 + + 1 σ N 2 1 σ 1 2 + 1 σ 2 2 + + 1 σ N 2 × u m N e 2
Equation (18) becomes Equation (19) when σ i 2 is assumed to be equal to u m i 2 for i = 1, 2, …, N.
u m c = 1 1 σ i 2

3. Results and Discussion

This study discussed three distinct applications using DR methodology related to petroleum derivatives: (i) disputes related to a supplier and customer regarding the flash point measured by the Tag Closed Cup Tester in jet fuel [31]; (ii) an interlaboratory study applied to the final boiling point of gasoline [32]; and (iii) the comparison of three test methods for determining the mass fraction of sulfur in diesel oil [33,34,35].
The experimental part of this study was conducted in the first half of 2024, and all the instruments were calibrated.

3.1. Case Study 1: Dispute Between Supplier and Customer

Suppose the maximum flash point value allowed for jet fuel in Brazil is assumed to be 40.0 °C, based on real data from the Brazilian oil and gas industry provided in Table 1. Is it possible to commercialize this product?
Table 1 contains the flash points and their respective expanded uncertainties for the supplier and customer for this evaluation.
This case study is a typical dispute scenario within the oil and gas industry. The supplier’s results indicate that the product meets the specifications, while the customer’s results suggest that it does not.
Mathematical model: m 1 c = m 2 c
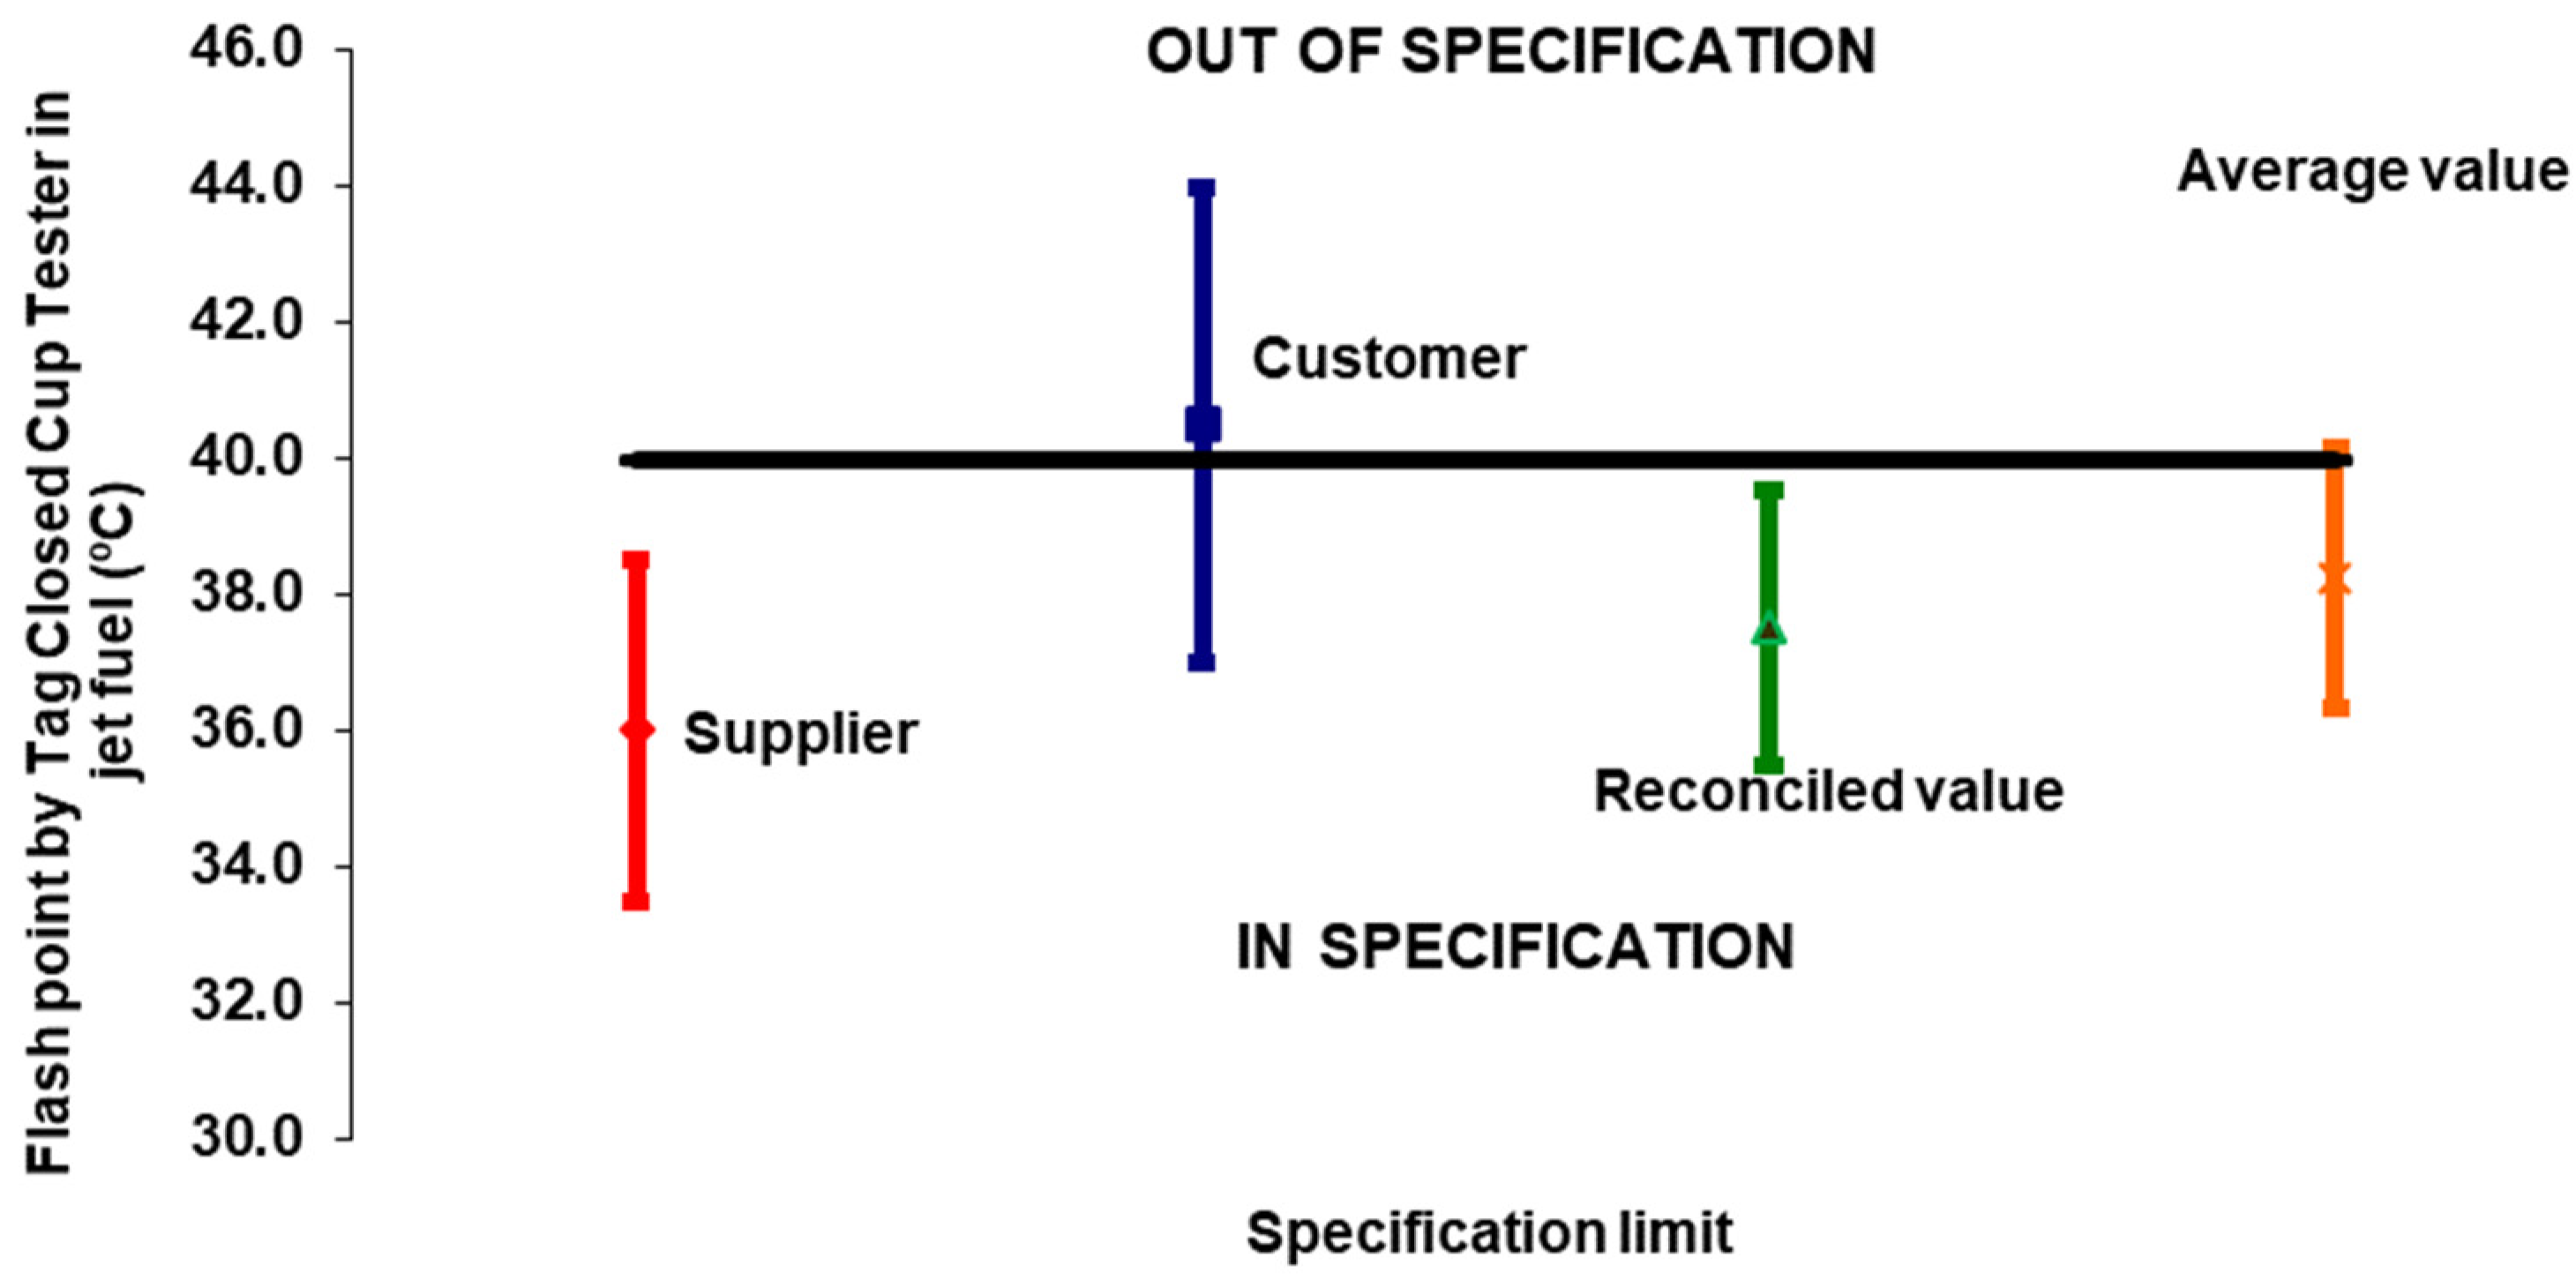
Reconciled value: From Equations (17) and (19), applying the DR technique, it is noticed that the flash point measured by Tag Closed Cup Tester is clearly beyond the specified limits; thus, the reconciled value, m c = 37.5 °C, and its minimized uncertainty, U m c = 2.0 °C, that is, 35.5 °C to 39.5 °C, fall below the allowable maximum limit, which is 40.0 °C.
m c = 36.0 2.5 2 + 40.5 3.5 2 1 2.5 2 + 1 3.5 2 = 37.5   ° C U m c = 1 1 2.5 2 + 1 3.5 2 = 2.0   ° C
In this specific case, it was noticed that the significant advantage of utilizing this approach has a negative impact on the arithmetic average and expanded uncertainty, as it is widely employed today. Considering the supplier result as 36.0 °C ± 2.5 °C and the customer result as 40.5 °C ± 3.5 °C, the arithmetic average value is 38.2 °C, and its expanded uncertainty is 2.2 °C ( 2.5 / 2 2 + 3.5 / 2 2 ), resulting in a range of 36.0 °C to 40.4 °C.
According to these conventional statistics, which did not consider the weight of the measurement uncertainty, the product fell within the specification. However, the uncertainty band partially overlapped with the specification limit, placing it outside the specification. This discrepancy led to a dispute between the parties involved, as depicted in Figure 2.

3.2. Case Study 2: Interlaboratory Study of the Final Boiling Point of Gasoline

Table 2 presents the data and their corresponding uncertainties obtained from 12 laboratories that participated in the ASTM interlaboratory study on gasoline’s final boiling point (FBP).
Mathematical model: m 1 c = m 2 c = = m 12 c .
Reconciled value: From Equations (17) and (19), respectively, the reconciled value is m c = 179.2 °C and the minimized uncertainty is U m c = 2.6 °C.
m c = 173.5 6.0 2 + 180.9 12.0 2 + 181.6 7.0 2 + 182.1 8.1 2 + 174.2 6.0 2 + 181.6 8.5 2 + 180.0 6.7 2 + 188.0 11.0 2 + 183.0 10.0 2 + 183.6 13.0 2 + 173.0 7.2 2 + 185.5 7.0 2 1 6.0 2 + 1 12.0 2 + 1 7.0 2 + 1 8.1 2 + 1 6.0 2 + 1 8.5 2 + 1 6.7 2 + 1 11.0 2 + 1 10.0 2 + 1 13.0 2 + 1 7.2 2 + 1 7.0 2
m c = 179.2   ° C
U m c = 1 1 6.0 2 + 1 12.0 2 + 1 7.0 2 + 1 8.1 2 + 1 6.0 2 + 1 8.5 2 + 1 6.7 2 + 1 11.0 2 + 1 10.0 2 + 1 13.0 2 + 1 7.2 2 + 1 7.0 2 = 2.6   ° C
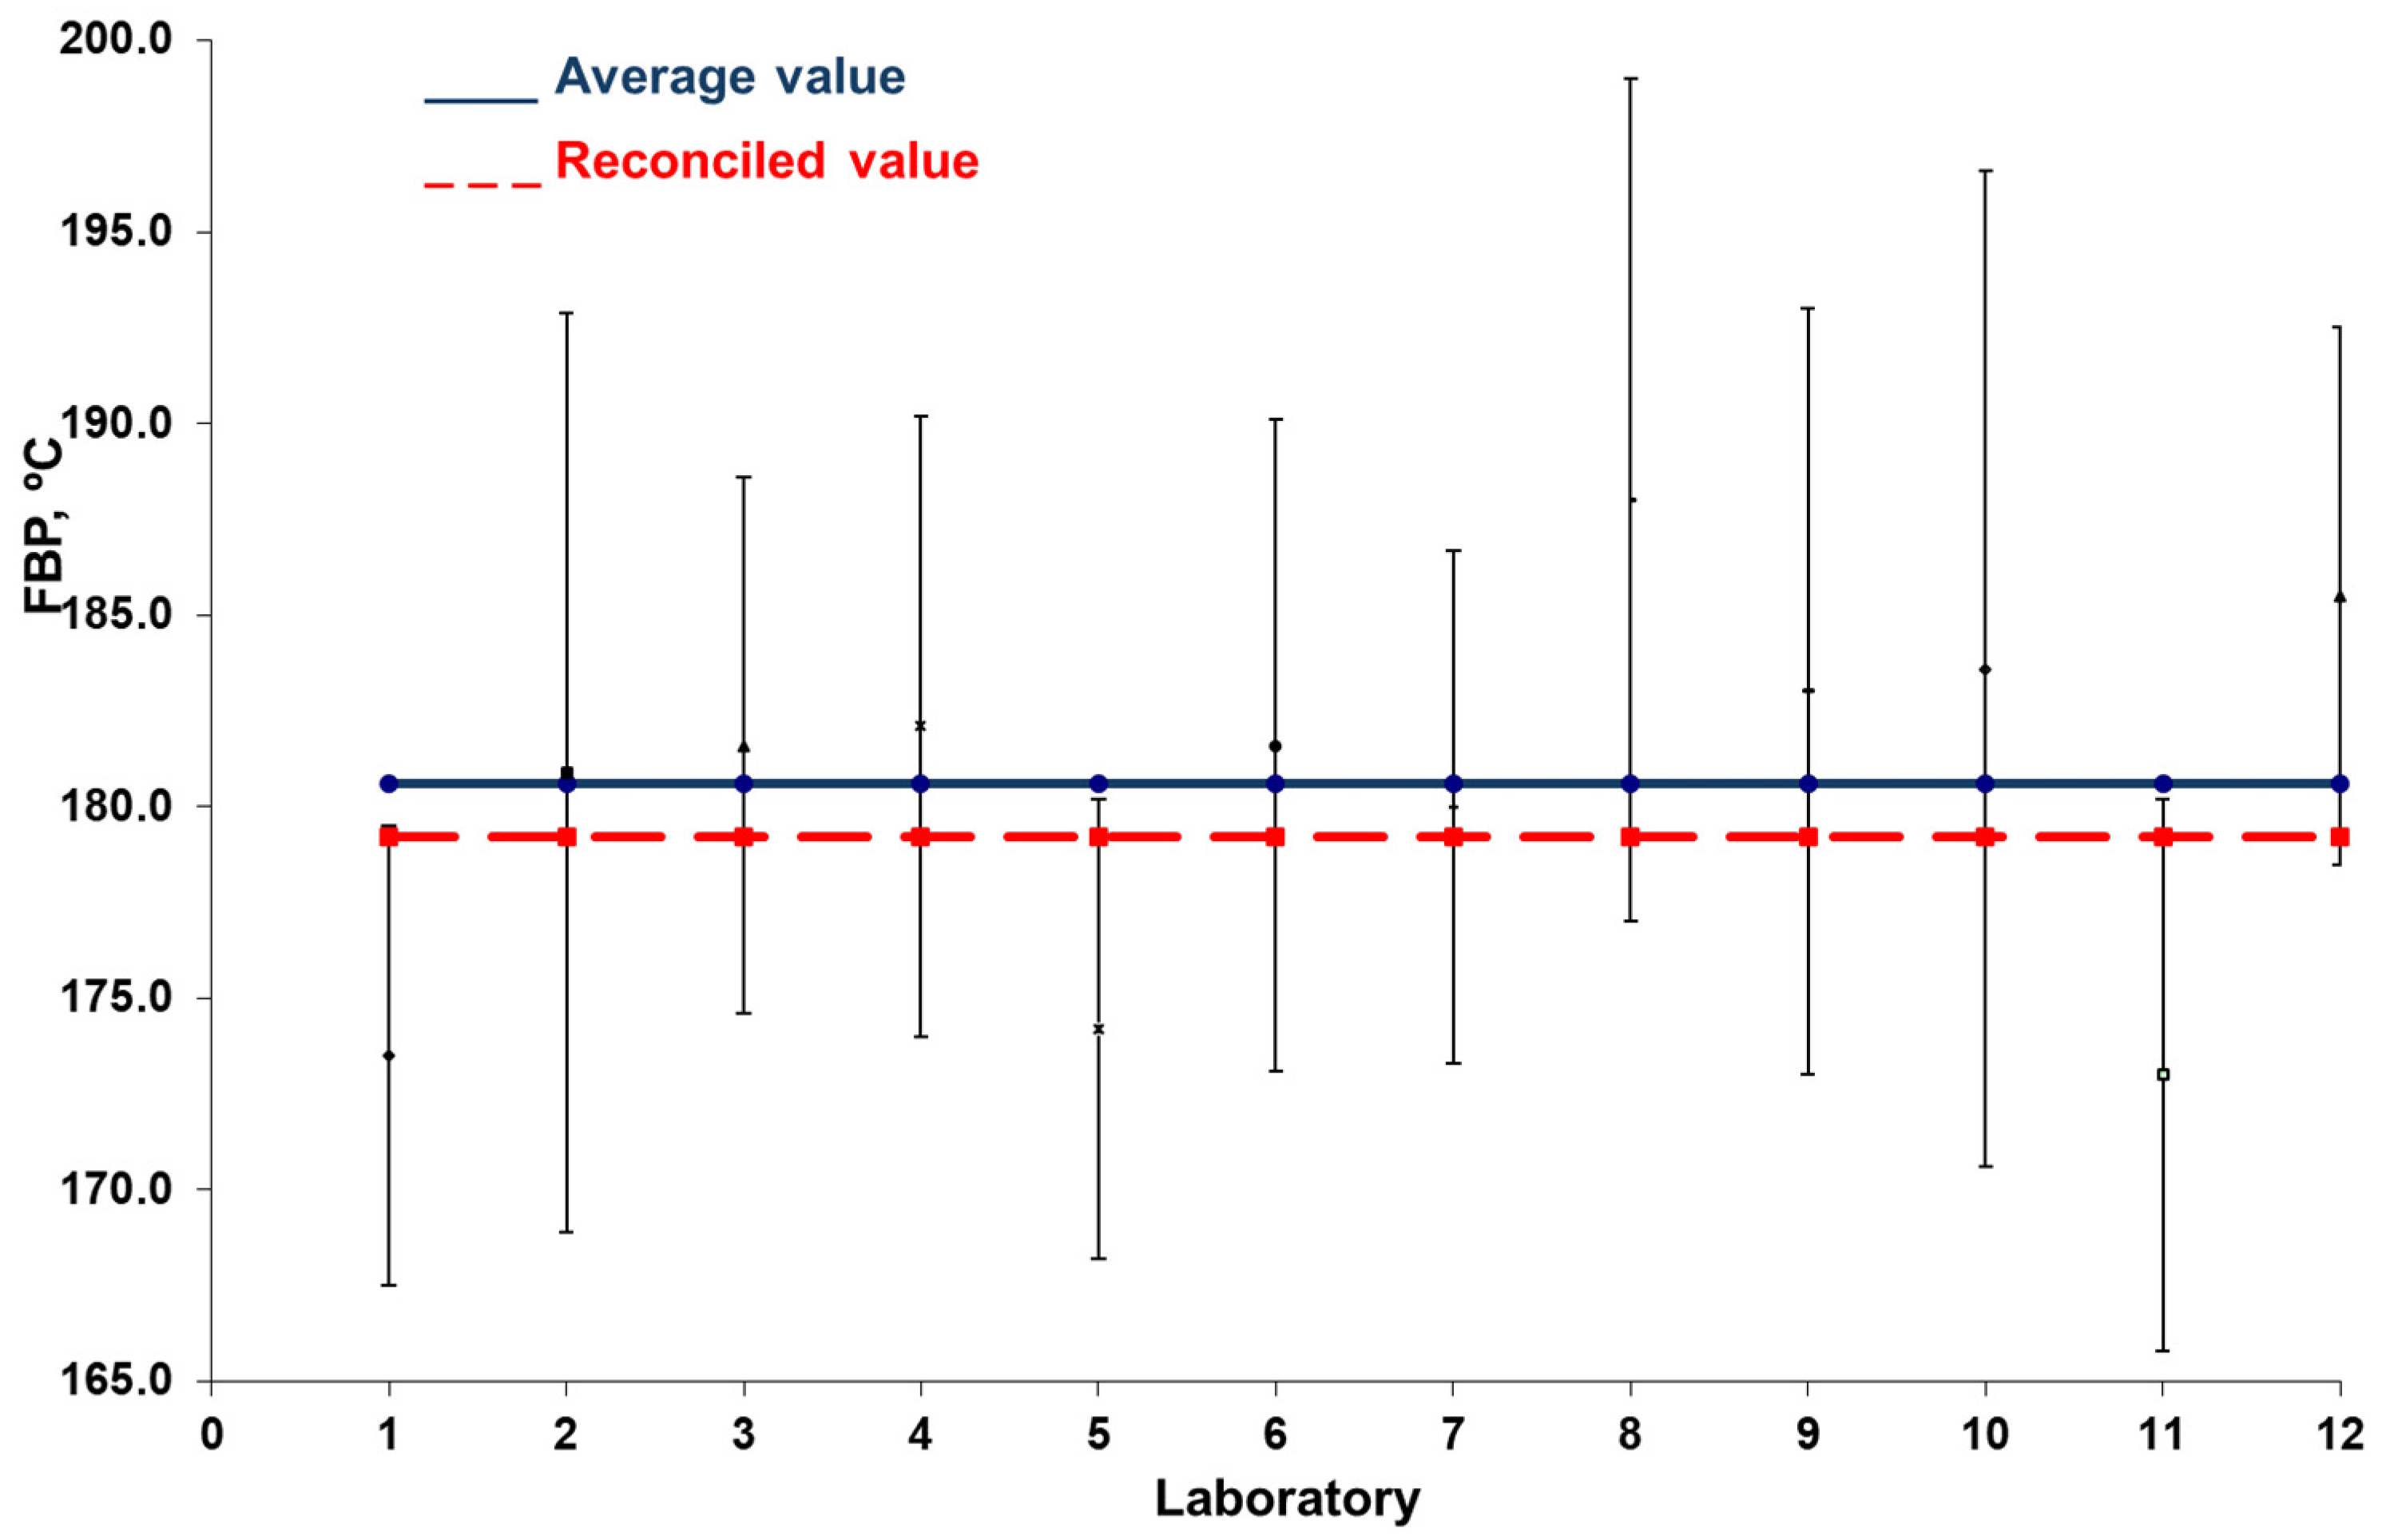
By observing Figure 3, from the FBPs and their respective expanded uncertainties, average value, and reconciled value, it became apparent that the reconciled value fell within the uncertainty range of all the laboratories. This behavior was not noticed when the arithmetic mean of all the laboratories was used to represent the best estimate of the true value.
In this case, 3 (laboratories 1, 5, and 11) of the 12 were outside the mean value and their respective uncertainty ranges. Using the reconciled values was more realistic than relying only on the mean value, as according to Grubbs’ test, none of the values were considered outliers.

3.3. Case Study 3: Metrological Evaluation of Three Distinct Test Methods to Determine Sulfur in Diesel Oil

Table 3 compares the data derived from three distinct test methods for determining the sulfur mass fraction in the same sample of diesel oil.
From the mathematical model m 1 c = m 2 c = m 3 c , and from Equations (17) and (19), respectively, the following is obtained:
m c = 6.6 0.4 6 2 + 4.9 0.60 2 + 6.3 0.6 2 2 1 0.4 6 2 + 1 0.60 2 + 1 0.6 2 2 = 6.1   mg   k g - 1 u m c = 1 1 0.4 6 2 + 1 0.60 2 + 1 0.6 2 2 = 0.30   mg   k g - 1
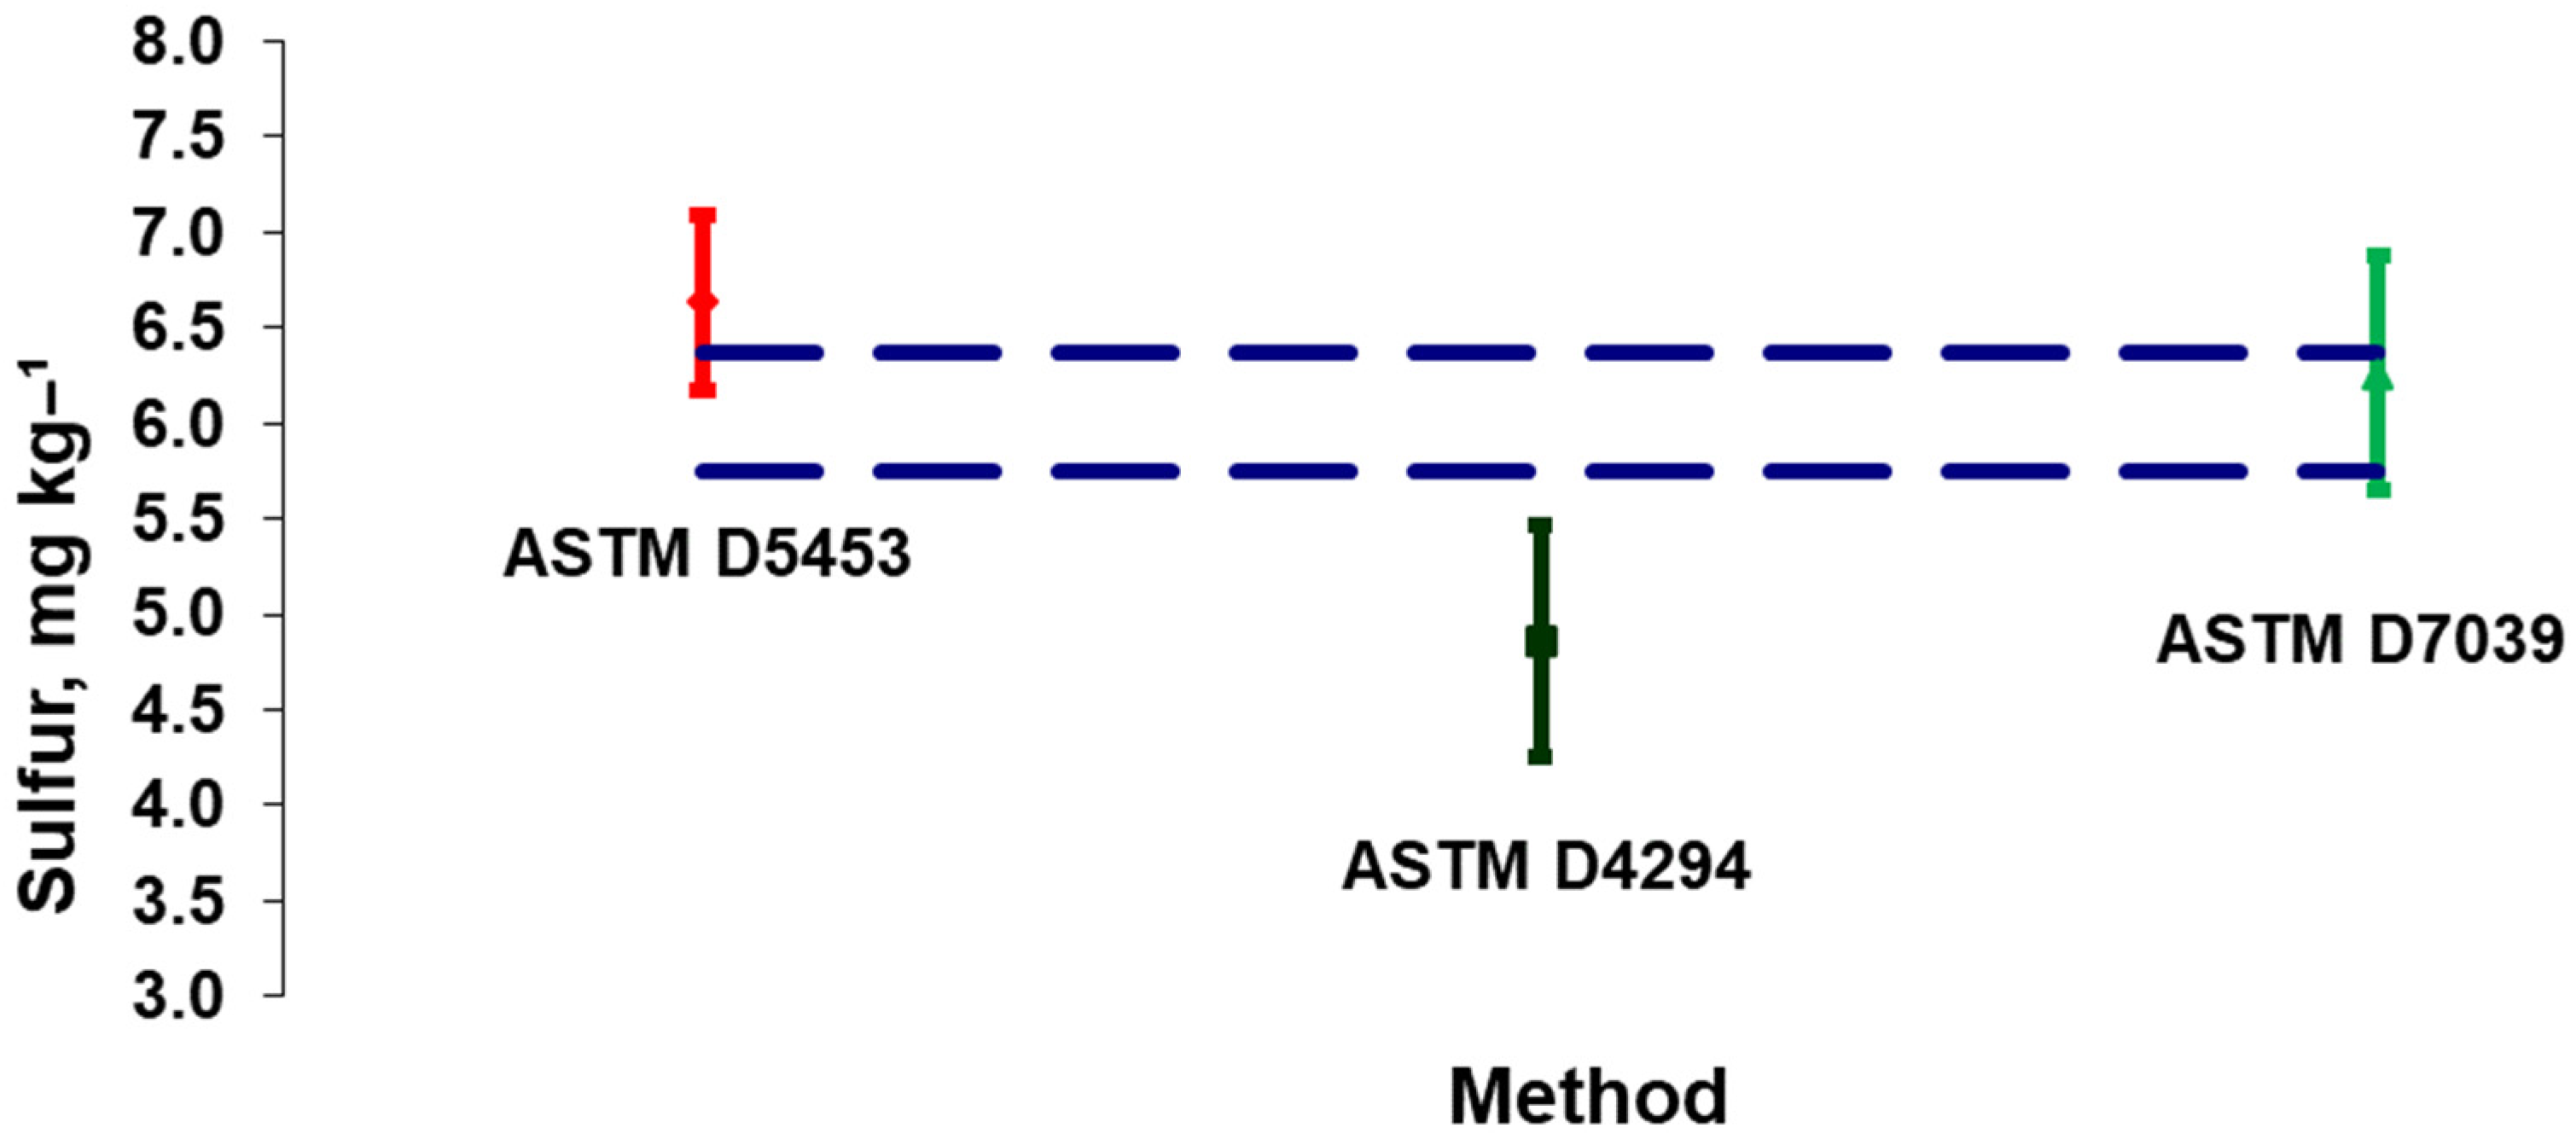
Based on these results, which were (6.6 ± 0.46) mg kg−1, (4.9 ± 0.60) mg kg−1, and (6.3 ± 0.62) mg kg−1 for each test method, and the reconciled uncertainty interval, which was (6.1 ± 0.30) mg kg−1, ASTM D4294 [33] was not statistically compatible with the other two test methods, ASTM D5454 [34] and ASTM D7039 [35], when utilizing the DR approach, as there was no partial overlap between its experimental value and the reconciled value. See Figure 4.

4. Conclusions

This study comprehensively explained the DR technique, enabling the readers to comprehend and apply it when necessary. The presented case studies demonstrated that the technique was straightforward in linear systems and more rigorous than the existing methods employed in commercializing and quality systems of petroleum products. This approach effectively reduced the measurement uncertainties, making it suitable for resolving legal disputes with meticulous examination.
In the petroleum industry, effective DR measures enable organizations to reconcile data discrepancies, identify potential risks, and take proactive steps to mitigate them, ensuring accurate and consistent data across various systems and processes. This streamlines operations and promotes a culture of transparency and accountability. The petroleum industry uses DR in its processes to ensure improved operational efficiency, legal clarity, and compliance in its commercial transactions.
In future works, DR can be applied in various areas within the applied sciences, such as engineering, materials science, environmental science, agricultural sciences, food science and nutrition, geosciences, biotechnology, and pharmaceutical sciences. By applying DR in these applied science areas, researchers and scientists can ensure accurate and reliable data analysis, improve process optimization, support evidence-based decision-making, and advance scientific knowledge and innovation.

Author Contributions

Conceptualization, R.M.M., A.M.S.R. and E.C.d.O.; methodology, R.M.M., A.M.S.R. and E.C.d.O.; software, R.M.M., A.M.S.R. and E.C.d.O.; validation, R.M.M., A.M.S.R. and E.C.d.O.; formal analysis, R.M.M., A.M.S.R. and E.C.d.O.; investigation, R.M.M., A.M.S.R. and E.C.d.O.; resources, R.M.M., A.M.S.R. and E.C.d.O.; data curation, R.M.M., A.M.S.R. and E.C.d.O.; writing—original draft preparation, R.M.M., A.M.S.R. and E.C.d.O.; writing—review and editing, R.M.M., A.M.S.R. and E.C.d.O.; visualization, R.M.M., A.M.S.R. and E.C.d.O.; supervision, R.M.M., A.M.S.R. and E.C.d.O.; project administration, R.M.M., A.M.S.R. and E.C.d.O.; funding acquisition, R.M.M., A.M.S.R. and E.C.d.O. All authors have read and agreed to the published version of the manuscript.

Funding

The authors are thankful for the financial support provided by the scholarship from the Brazilian agency CNPq (305479/2021-0). This study was financed in part by the Coordenação de Aperfeiçoamento de Pessoal de Nível Superior—Brasil (CAPES)—Finance Code 001.

Institutional Review Board Statement

Not applicable.

Informed Consent Statement

Not applicable.

Data Availability Statement

The original contributions presented in the study are included in the article, further inquiries can be directed to the corresponding authors.

Conflicts of Interest

Author Elcio Cruz de Oliveira was employed by the company Petrobras S.A. The remaining authors declare that the research was conducted in the absence of any commercial or financial relationships that could be construed as a potential conflict of interest.

References

  1. Resitoglu, I.A.; Altinisik, K.; Keskin, A. The pollutant emissions from diesel-engine vehicles and aftertreatment systems. Clean Techn. Environ. Policy 2015, 17, 15–27. [Google Scholar] [CrossRef]
  2. Lloyd, A.C.; Cackette, T.A. Diesel engines: Environmental impact and control. J. Air Waste Manag. Assoc. 2001, 51, 809–847. [Google Scholar] [CrossRef] [PubMed]
  3. Jones, A.M.; Harrison, R.; Barratt, B.; Fuller, G. A large reduction in airbone particle number concentration at the time of the introduction of “sulphur free” diesel and the London low emission zone. Atmos. Environ. 2012, 50, 129–138. [Google Scholar] [CrossRef]
  4. da Costa, L.G.; da Silveira, C.A.A.; de Aguiar, E.V.; Ugulino, R.D.F.; Lima, S.M.C.; de Oliveira, E.C. Statistical compatibility in the flash point by Pensky-Martens closed cup tester of diesel fuel. Pet. Sci. Technol. 2017, 35, 1763–1767. [Google Scholar] [CrossRef]
  5. Balabin, R.M.; Syunyaev, R.; Karpov, S. Quantitative measurement of ethanol distribution over fractions of ethanol-gasoline fuel. Energy Fuels 2007, 21, 2460–2465. [Google Scholar] [CrossRef]
  6. Liu, H.; Wang, Z.; Wang, J.; He, X. Effects of gasoline research octane number on premixed low-temperature combustion of wide distillation fuel by gasoline/diesel blend. Fuel 2014, 134, 381–388. [Google Scholar] [CrossRef]
  7. Hibbert, D.B. Compliance of analytical results with regulatory or specification limits: A probabilistic approach. Accred. Qual. Assur. 2001, 6, 346–351. [Google Scholar] [CrossRef]
  8. Narasimhan, S.; Jordache, C. Data Reconciliation and Gross Error Detection: An Intelligent Use of Process Data; Gulf Publishing Company: Houston, TX, USA, 2000; Chapter 1; pp. 1–32. [Google Scholar]
  9. Özyurt, D.B.; Pike, R.W. Theory and practice of simultaneous data reconciliation and gross error detection for chemical processes. Comput. Chem. Eng. 2004, 28, 381–402. [Google Scholar] [CrossRef]
  10. Alhaj-Dibo, M.; Maquin, D.; Ragot, J. Data reconciliation: A robust approach using a contaminated distribution. Control Eng. Pr. 2008, 16, 159–170. [Google Scholar] [CrossRef]
  11. Oliveira, E.C.; Aguiar, P.F. Data Reconciliation in the Natural Gas Industry: Analytical Applications. Energy Fuels 2009, 23, 3658–3664. [Google Scholar] [CrossRef]
  12. Mansour, M.; Ellis, J.E. Methodology of on-line optimisation applied to a chemical reactor. Appl. Math. Model. 2008, 32, 170–184. [Google Scholar] [CrossRef]
  13. Ramamurthi, Y.; Sistu, P.B.; Bequette, B.W. Control-relevant dynamic data reconciliation and parameter estimation. Comput. Chem. Eng. 1993, 17, 41–59. [Google Scholar] [CrossRef]
  14. Kozioł, M.; Kozioł, J. Application of Data Validation and Reconciliation to Improve Measurement Results in the Determination Process of Emission Characteristics in Co-Combustion of Sewage Sludge with Coal. Sustainability 2021, 13, 5300. [Google Scholar] [CrossRef]
  15. Thibault, É.; Kelly, J.D.; Lebreux Desilets, F.; Chioua, M.; Poulin, B.; Stuart, P. Industrial Data-Driven Processing Framework Combining Process Knowledge for Improved Decision Making—Part 1: Framework Development. Processes 2023, 11, 2376. [Google Scholar] [CrossRef]
  16. Oliveira, E.C.; Frota, M.N.; Barreto, G.O. Use of data reconciliation: A strategy for improving the accuracy in gas flow measurements. J. Nat. Gas. Sci. Eng. 2015, 22, 313–320. [Google Scholar] [CrossRef]
  17. Weber, G.; Di Giuliano, A.; Rauch, R.; Hofbauer, H. Developing a simulation model for a mixed alcohol synthesis reactor and validation of experimental data in IPSEpro. Fuel Process. Technol. 2016, 141, 167–176. [Google Scholar] [CrossRef]
  18. Kotamreddy, G.; Hughes, R.; Bhattacharyya, D.; Stolaroff, J.; Hornbostel, K.; Matuszewski, M.; Omell, B. Process Modeling and Techno-Economic Analysis of a CO2 Capture Process Using Fixed Bed Reactors with a Microencapsulated Solvent. Energy Fuels 2019, 33, 7534–7549. [Google Scholar] [CrossRef]
  19. Bai, L.; Pinson, P. Distributed reconciliation in day-ahead wind power forecasting. Energies 2019, 12, 112. [Google Scholar] [CrossRef]
  20. Yang, X.; Yang, Q.; Dong, W. Aeroengine data reconciliation model based on cooperative working equations. Energy 2019, 186, 115914. [Google Scholar] [CrossRef]
  21. Noriega, M.A.; Narváez, P.C. UNIFAC correlated parameters for liquid-liquid equilibrium prediction of ternary systems related to biodiesel production process. Fuel 2019, 249, 365–378. [Google Scholar] [CrossRef]
  22. Szega, M. Methodology of advanced data validation and reconciliation application in industrial thermal processes. Energy 2020, 198, 117326. [Google Scholar] [CrossRef]
  23. Badings, T.S.; van Putten, D.S. Data validation and reconciliation for error correction and gross error detection in multiphase allocation systems. J. Pet. Sci. Eng. 2020, 195, 107567. [Google Scholar] [CrossRef]
  24. Behroozsarand, A.; Afshari, S. Data reconciliation of an industrial petrochemical plant case study: Olefin plant (Hot section). Comput. Chem. Eng. 2020, 137, 106803. [Google Scholar] [CrossRef]
  25. da Cunha, A.S.; Peixoto, F.C.; Prata, D.M. Robust data reconciliation in chemical reactors. Comput. Chem. Eng. 2021, 145, 107170. [Google Scholar] [CrossRef]
  26. Medeiros, K.A.R.; de Matos, A.C.H.; de Oliveira, E.C. Shedding Light on Data Reconciliation Techniques Applied to Analytical Chemistry. Crit. Rev. Anal. Chem. 2023, 53, 975–985. [Google Scholar] [CrossRef]
  27. de Oliveira, E.C.; Lourenço, F.R. Risk of false conformity assessment applied to automotive fuel analysis: A multiparameter approach. Chemosphere 2021, 263, 128265. [Google Scholar] [CrossRef]
  28. de Oliveira, E.C.; Lourenço, F.R. Data reconciliation applied to the conformity assessment of fuel products. Fuel 2021, 300, 120936. [Google Scholar] [CrossRef]
  29. Szymanska, E. Modern data science for analytical chemical data—A comprehensive review. Anal. Chim. Acta 2018, 1018, 1–10. [Google Scholar] [CrossRef]
  30. Joint Committee for Guides in Metrology. Evaluation of Measurement Data—Guide to the Expression of Uncertainty in Measurement; International Bureau of Weights and Measures (BIPM): Sèvres, France, 2008. [Google Scholar]
  31. ASTM D-56; Standard Test Method for Flash Point by Tag Closed Cup Tester. ASTM: West Conshohocken, PA, USA, 2022.
  32. ASTM D-86; Standard Test Method for Distillation of Petroleum Products at Atmospheric Pressure. ASTM: West Conshohocken, PA, USA, 2023.
  33. ASTM D-4294; Standard Test Method for Sulfur in Petroleum and Petroleum Products by Energy Dispersive X-ray Fluorescence Spectrometry. ASTM: West Conshohocken, PA, USA, 2021.
  34. ASTM D-5453; Standard Test Method for Determination of Total Sulfur in Light Hydrocarbons, Spark Ignition Engine Fuel, Diesel Engine Fuel, and Engine Oil by Ultraviolet Fluorescence. ASTM: West Conshohocken, PA, USA, 2019.
  35. ASTM D-7039-15a; Standard Test Method for Sulfur in Gasoline and Diesel Fuel by Monochromatic Wavelength Dispersive X-ray Fluorescence Spectrometry. ASTM: West Conshohocken, PA, USA, 2020.
Figure 1. Simplified flowchart of the DR process.
Applsci 14 10295 g001
Figure 2. Reconciled value and average value.
Applsci 14 10295 g002
Figure 3. Uncertainty bars, reconciled value, and average value.
Applsci 14 10295 g003
Figure 4. Reconciled data associated with the compatibility study (----, reconciled uncertainty bars) [33,34,35].
Applsci 14 10295 g004
Table 1. Dispute between supplier and customer.
Flash PointExpanded UncertaintySpecification
Supplier36.0 °C2.5 °CIn
Customer40.5 °C3.5 °COut
Table 2. FBP and respective uncertainties.
LaboratoryFBP (°C)Expanded Uncertainty (°C)
1173.56.0
2180.912.0
3181.67.0
4182.18.1
5174.26.0
6181.68.5
7180.06.7
8188.011.0
9183.010.0
10183.613.0
11173.07.2
12185.57.0
Average value180.6
Table 3. Measurement data of sulfur mass fraction, mg kg−1.
ASTM D5453 [34]ASTM D4294 [33]ASTM D7039 [35]
6.25.46.3
6.94.95.2
6.15.36.3
6.14.65.8
7.54.96.3
7.25.86.9
7.04.95.6
6.95.96.3
6.54.96.2
6.84.77.2
6.63.86.2
6.53.97.7
6.74.45.9
6.14.65.9
6.0 6.3
7.0
Arithmetic average6.64.96.3
Standard deviation0.460.600.62
Disclaimer/Publisher’s Note: The statements, opinions and data contained in all publications are solely those of the individual author(s) and contributor(s) and not of MDPI and/or the editor(s). MDPI and/or the editor(s) disclaim responsibility for any injury to people or property resulting from any ideas, methods, instructions or products referred to in the content.