


Effect of Geometric Parameters of High-Speed Helical Gears on Friction Flash Temperature and Scuffing Load Capacity in Electric Vehicles


Abstract
1. Introduction
2. Semi-Analytical Calculation Model for Gear Surface Flash Temperature
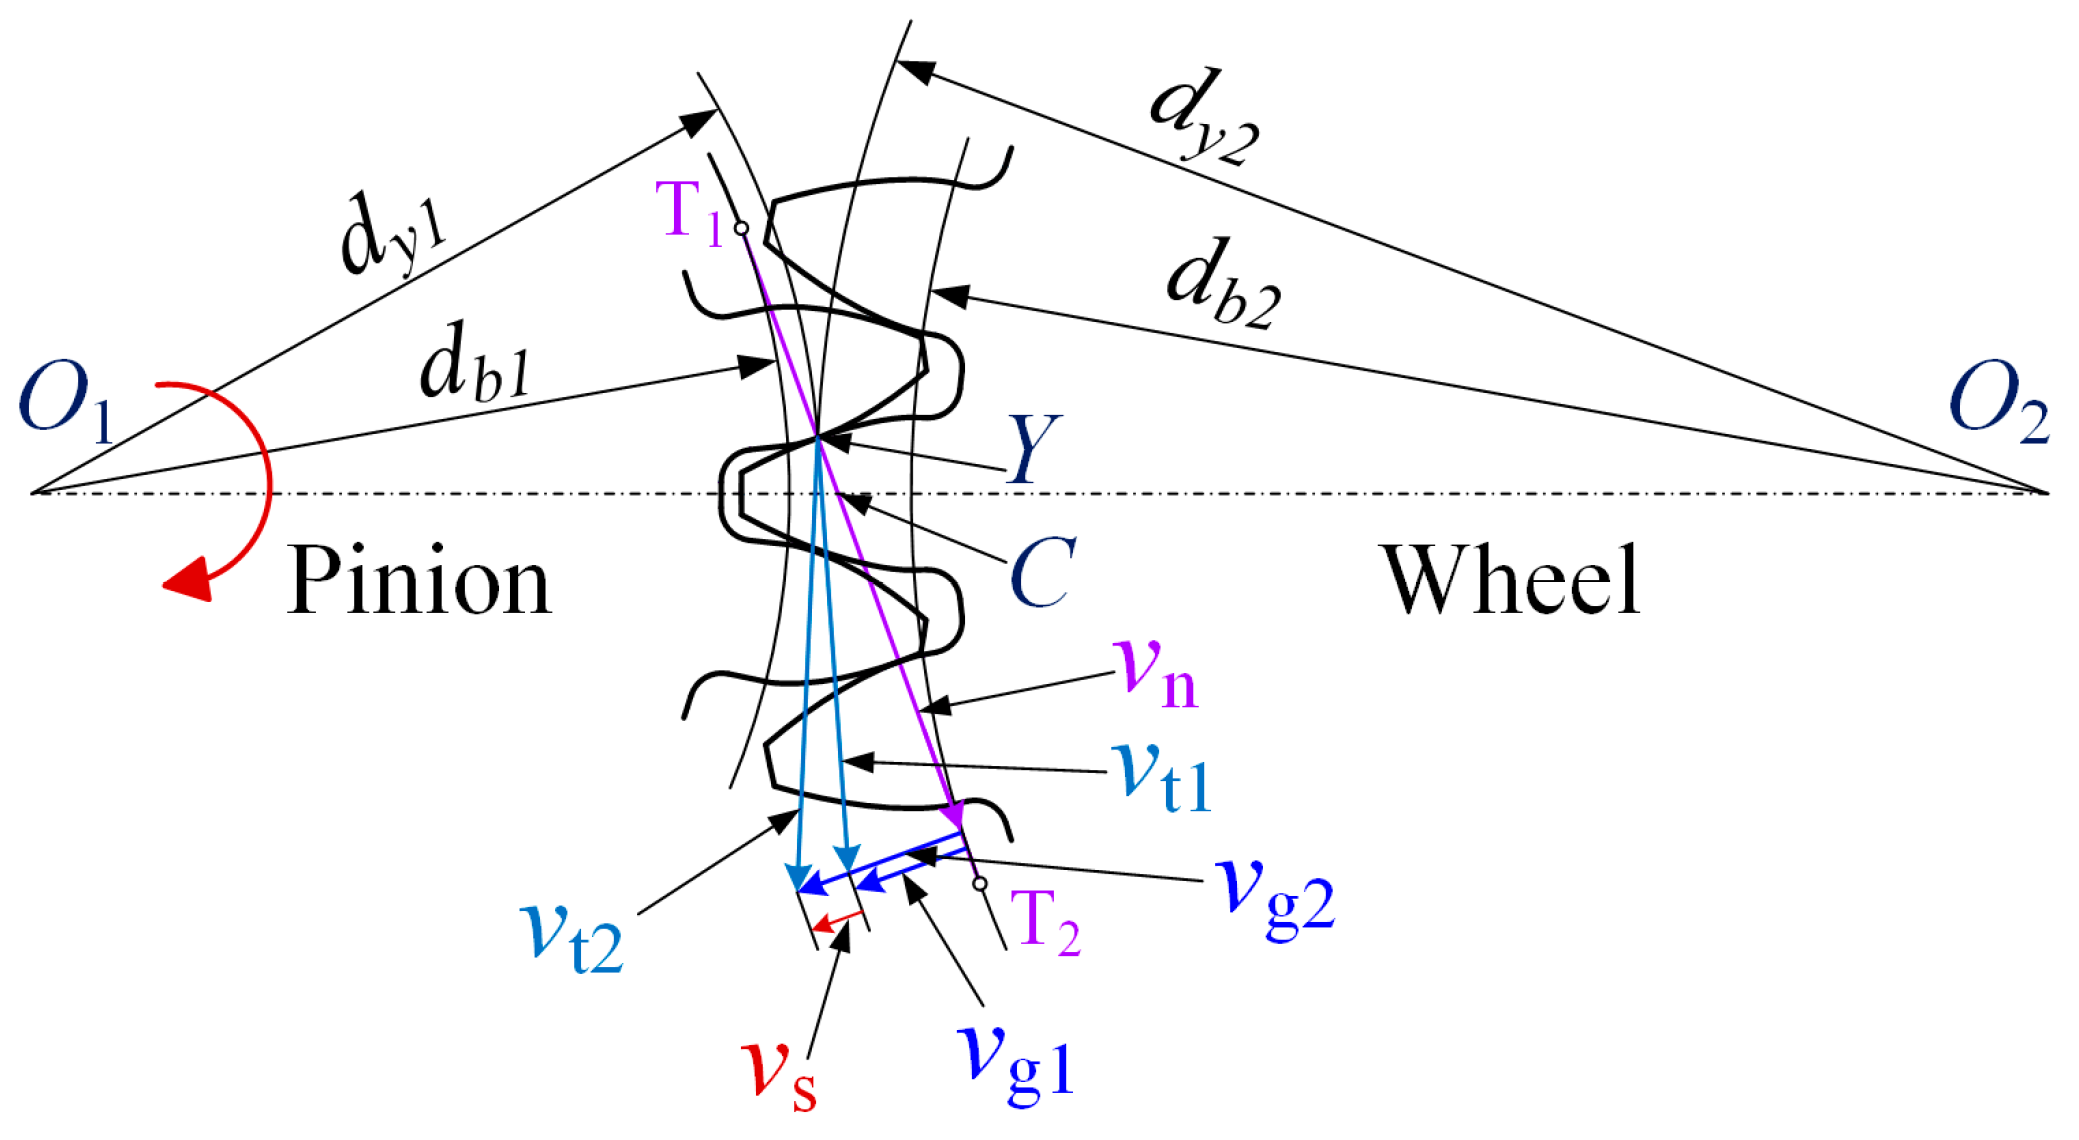
2.1. Local Geometry and Velocity Parameters of Gear Tooth Surface
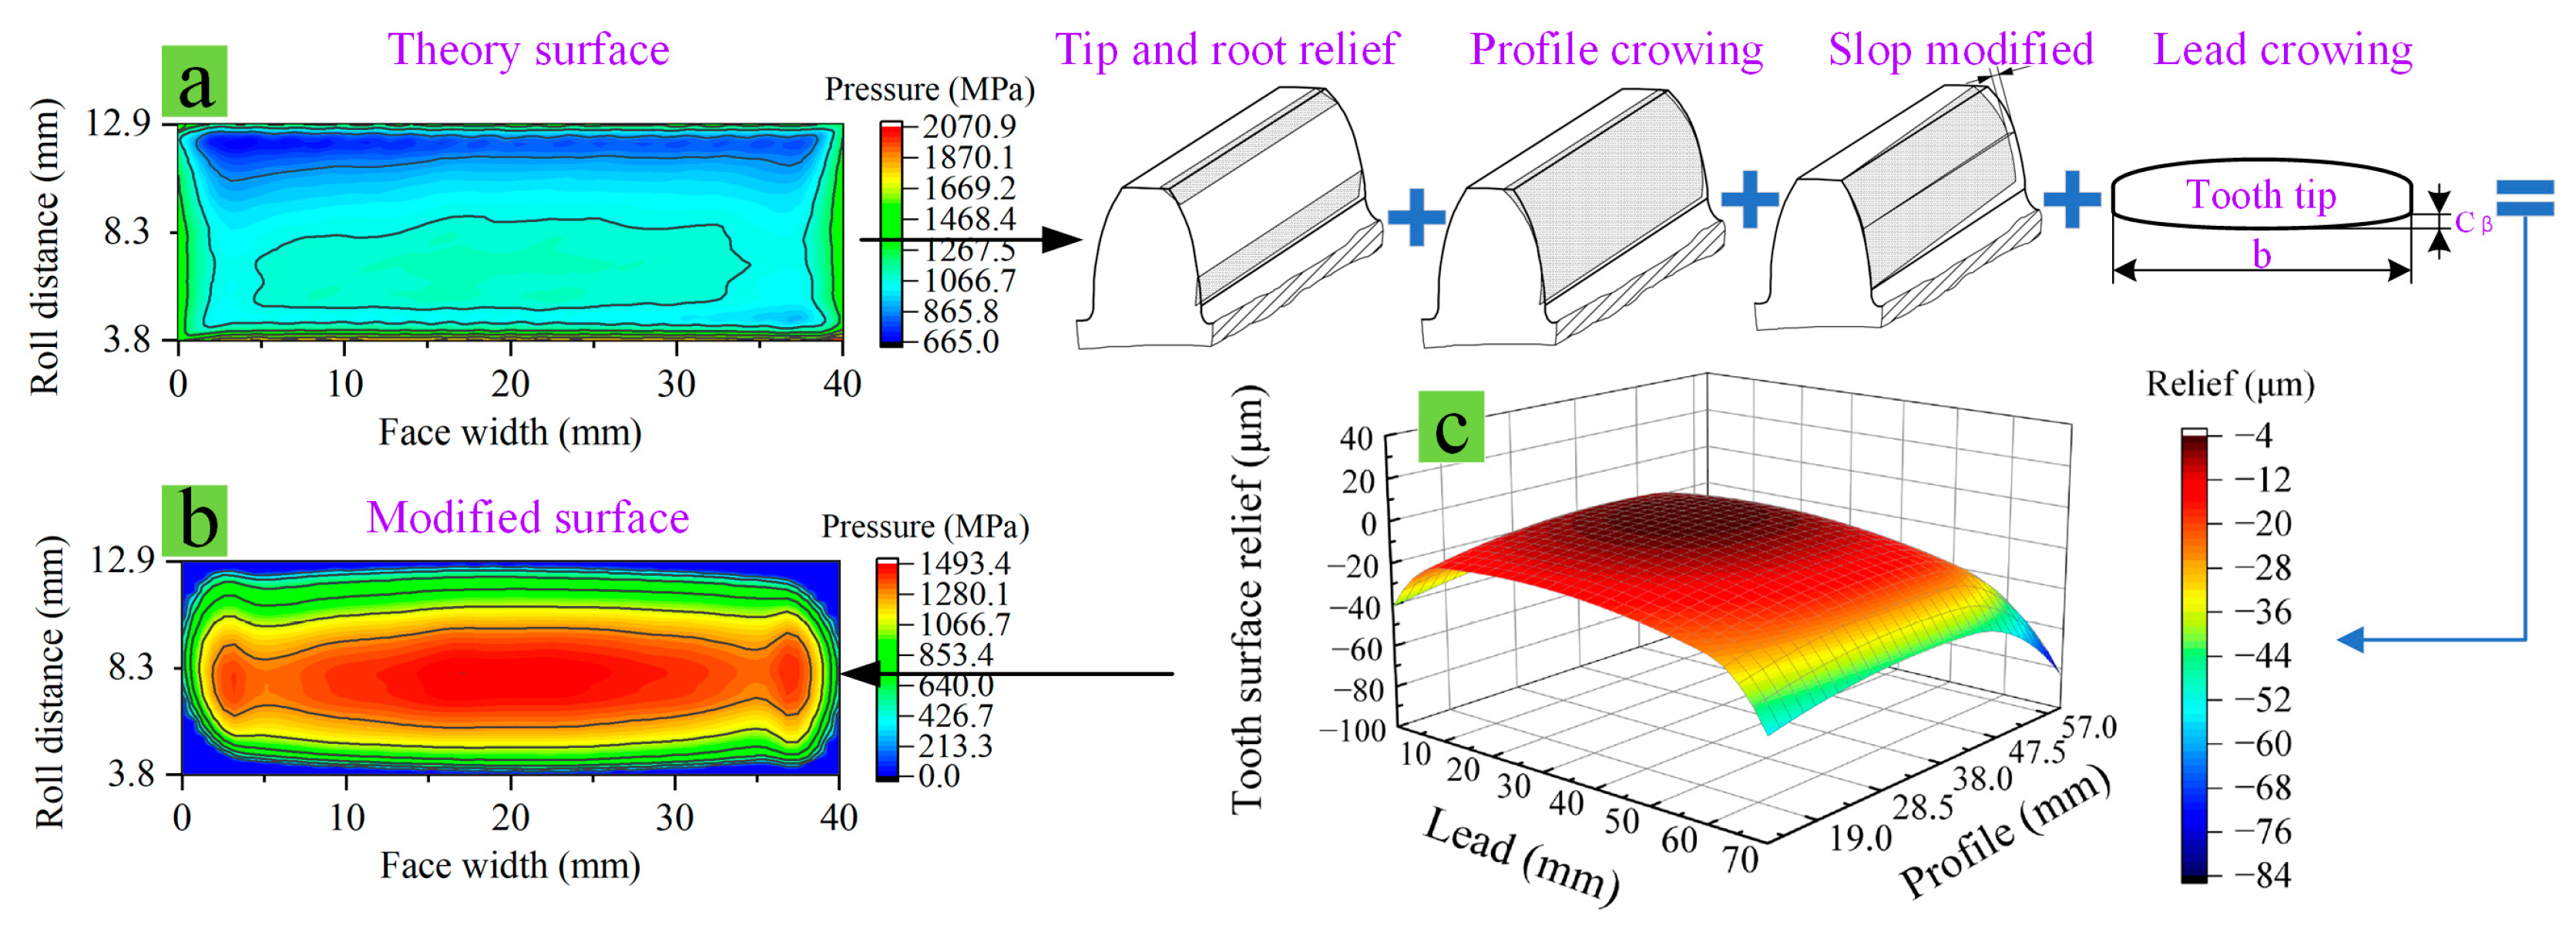
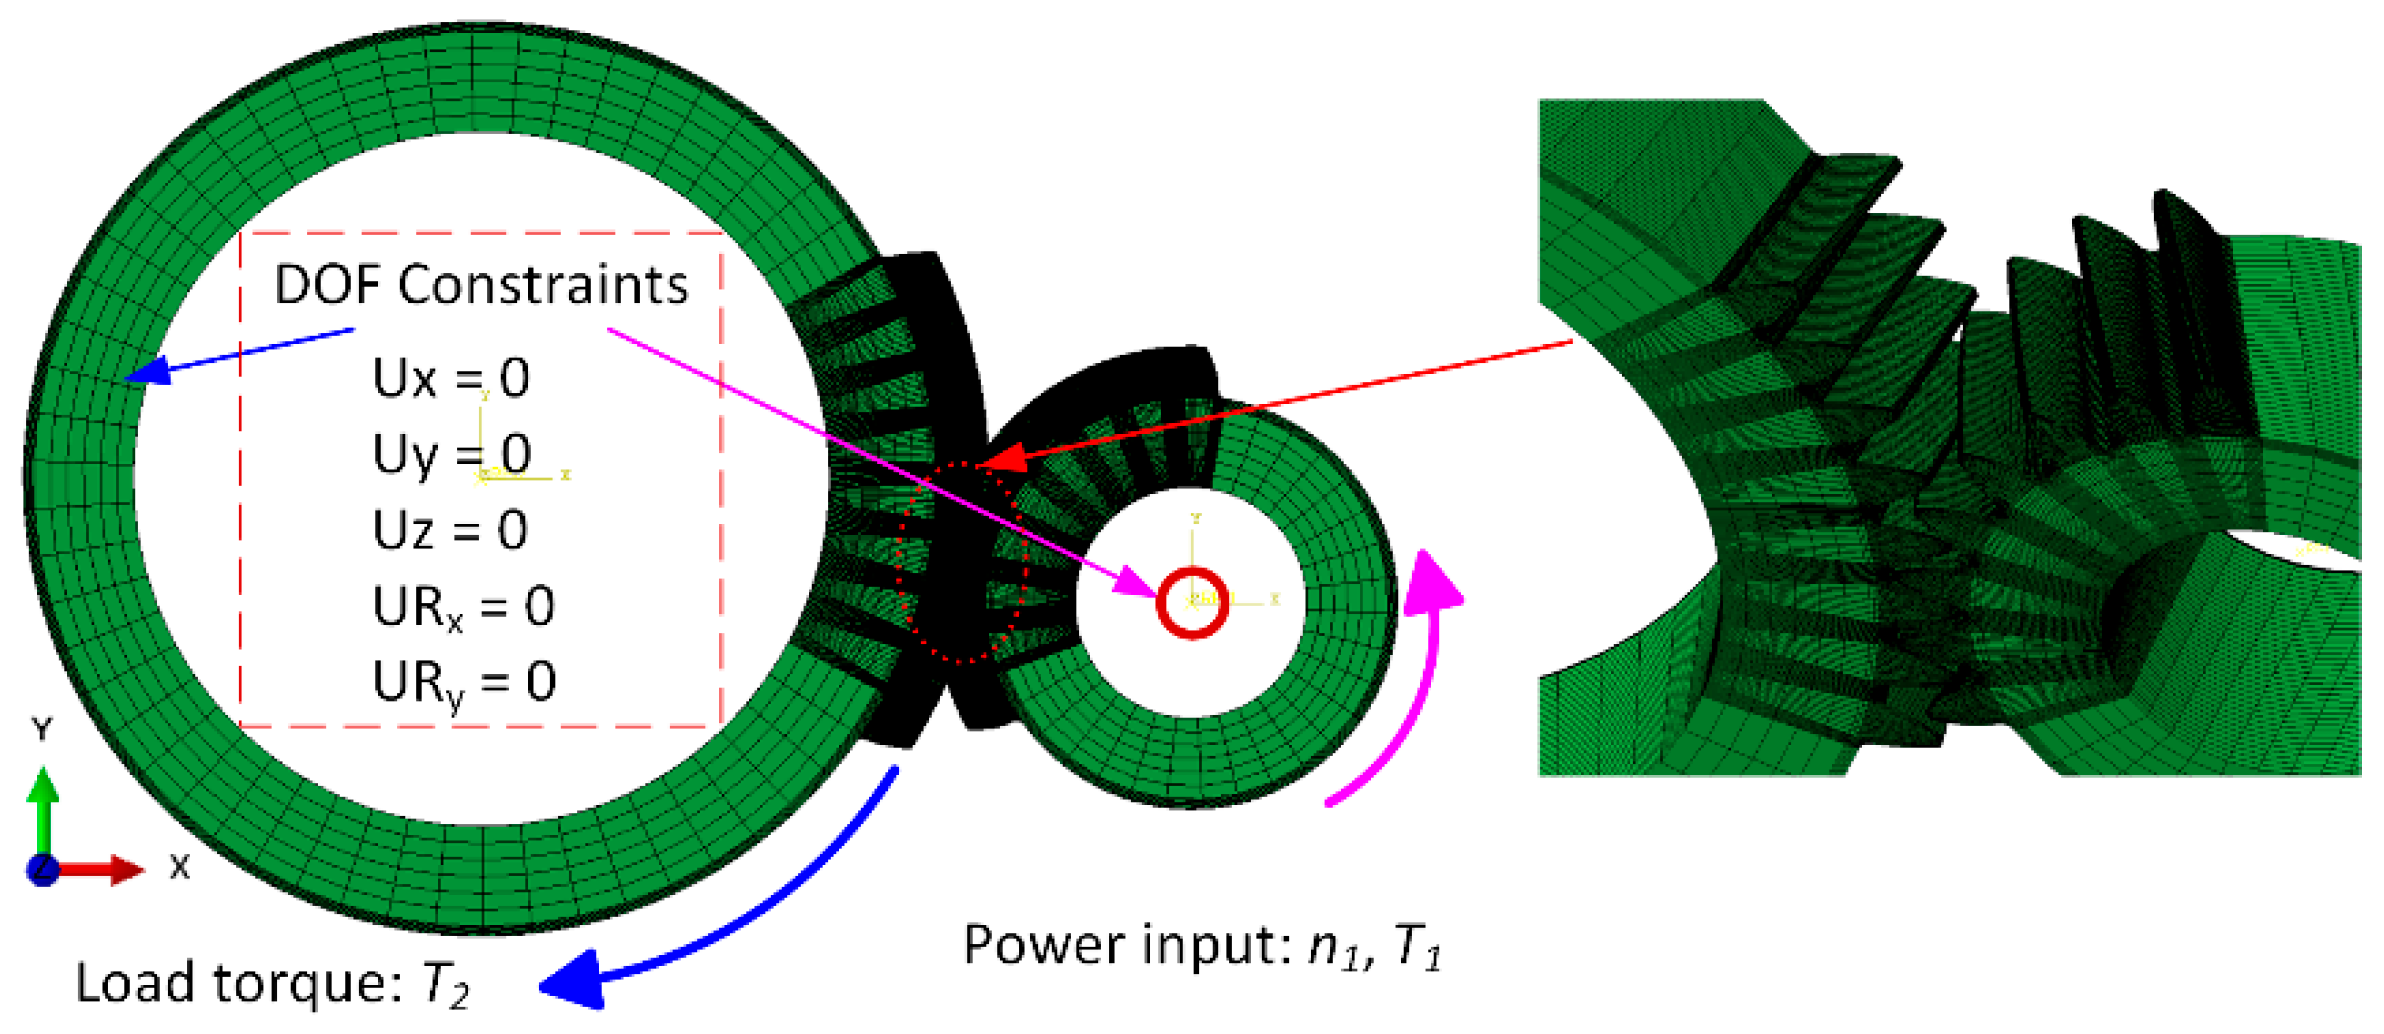
2.2. Calculation Model for Tooth Surface Load and Flash Temperature
3. Results and Discussion
3.1. The Effects of Tooth Number and Module on Scuffing Load Capacity
3.1.1. Gearsets Geometry Parameters Planning
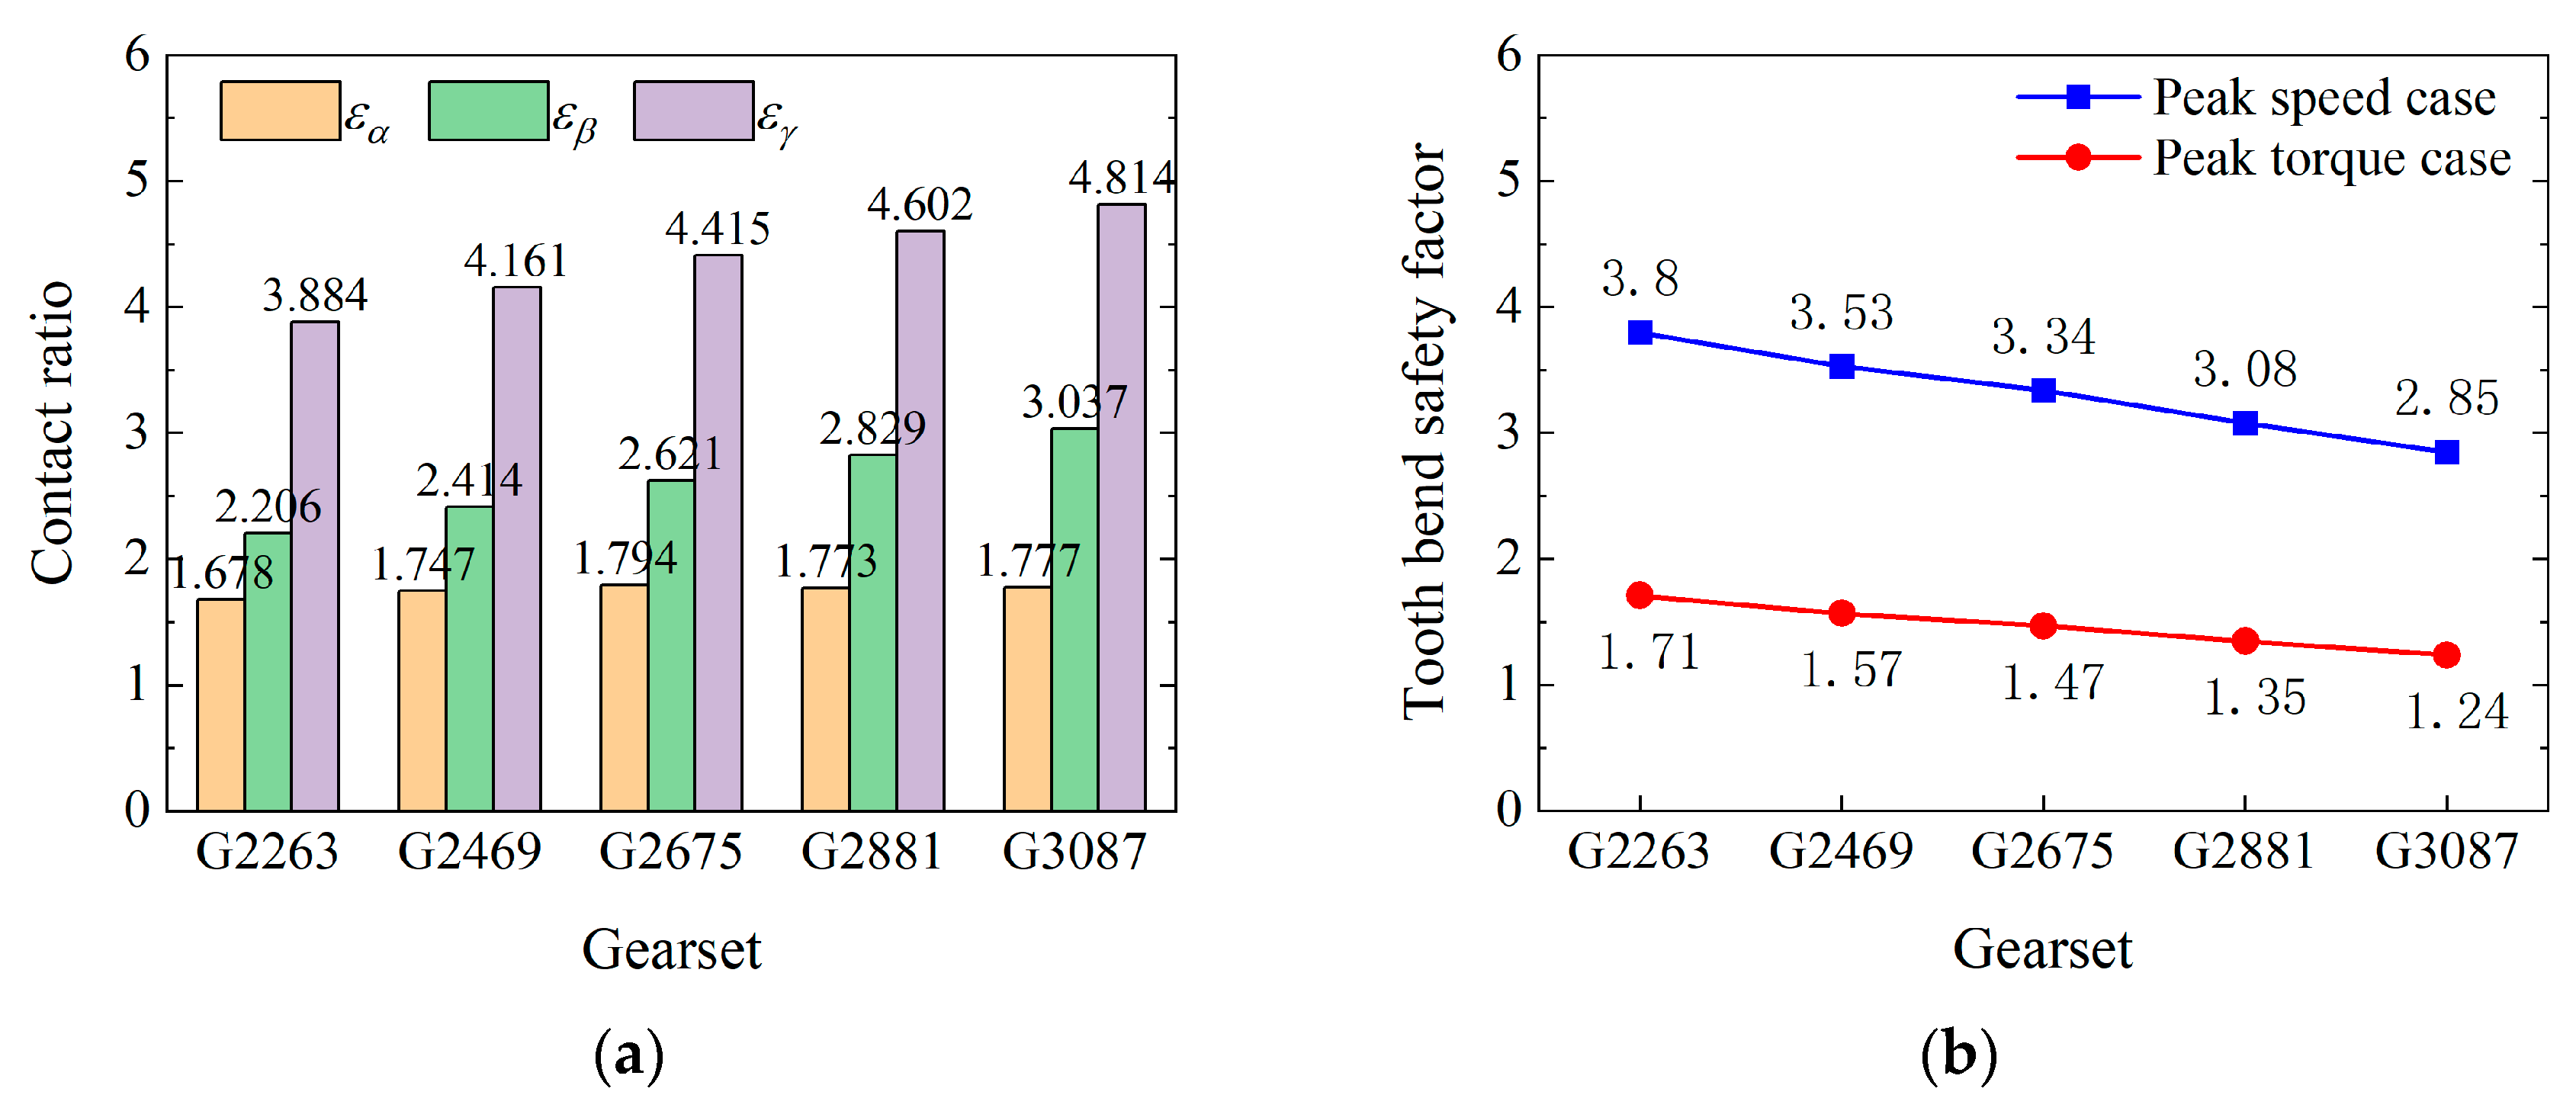
3.1.2. Comparison of Contact Ratio, Specific Sliding, and Load-Carrying Capacity
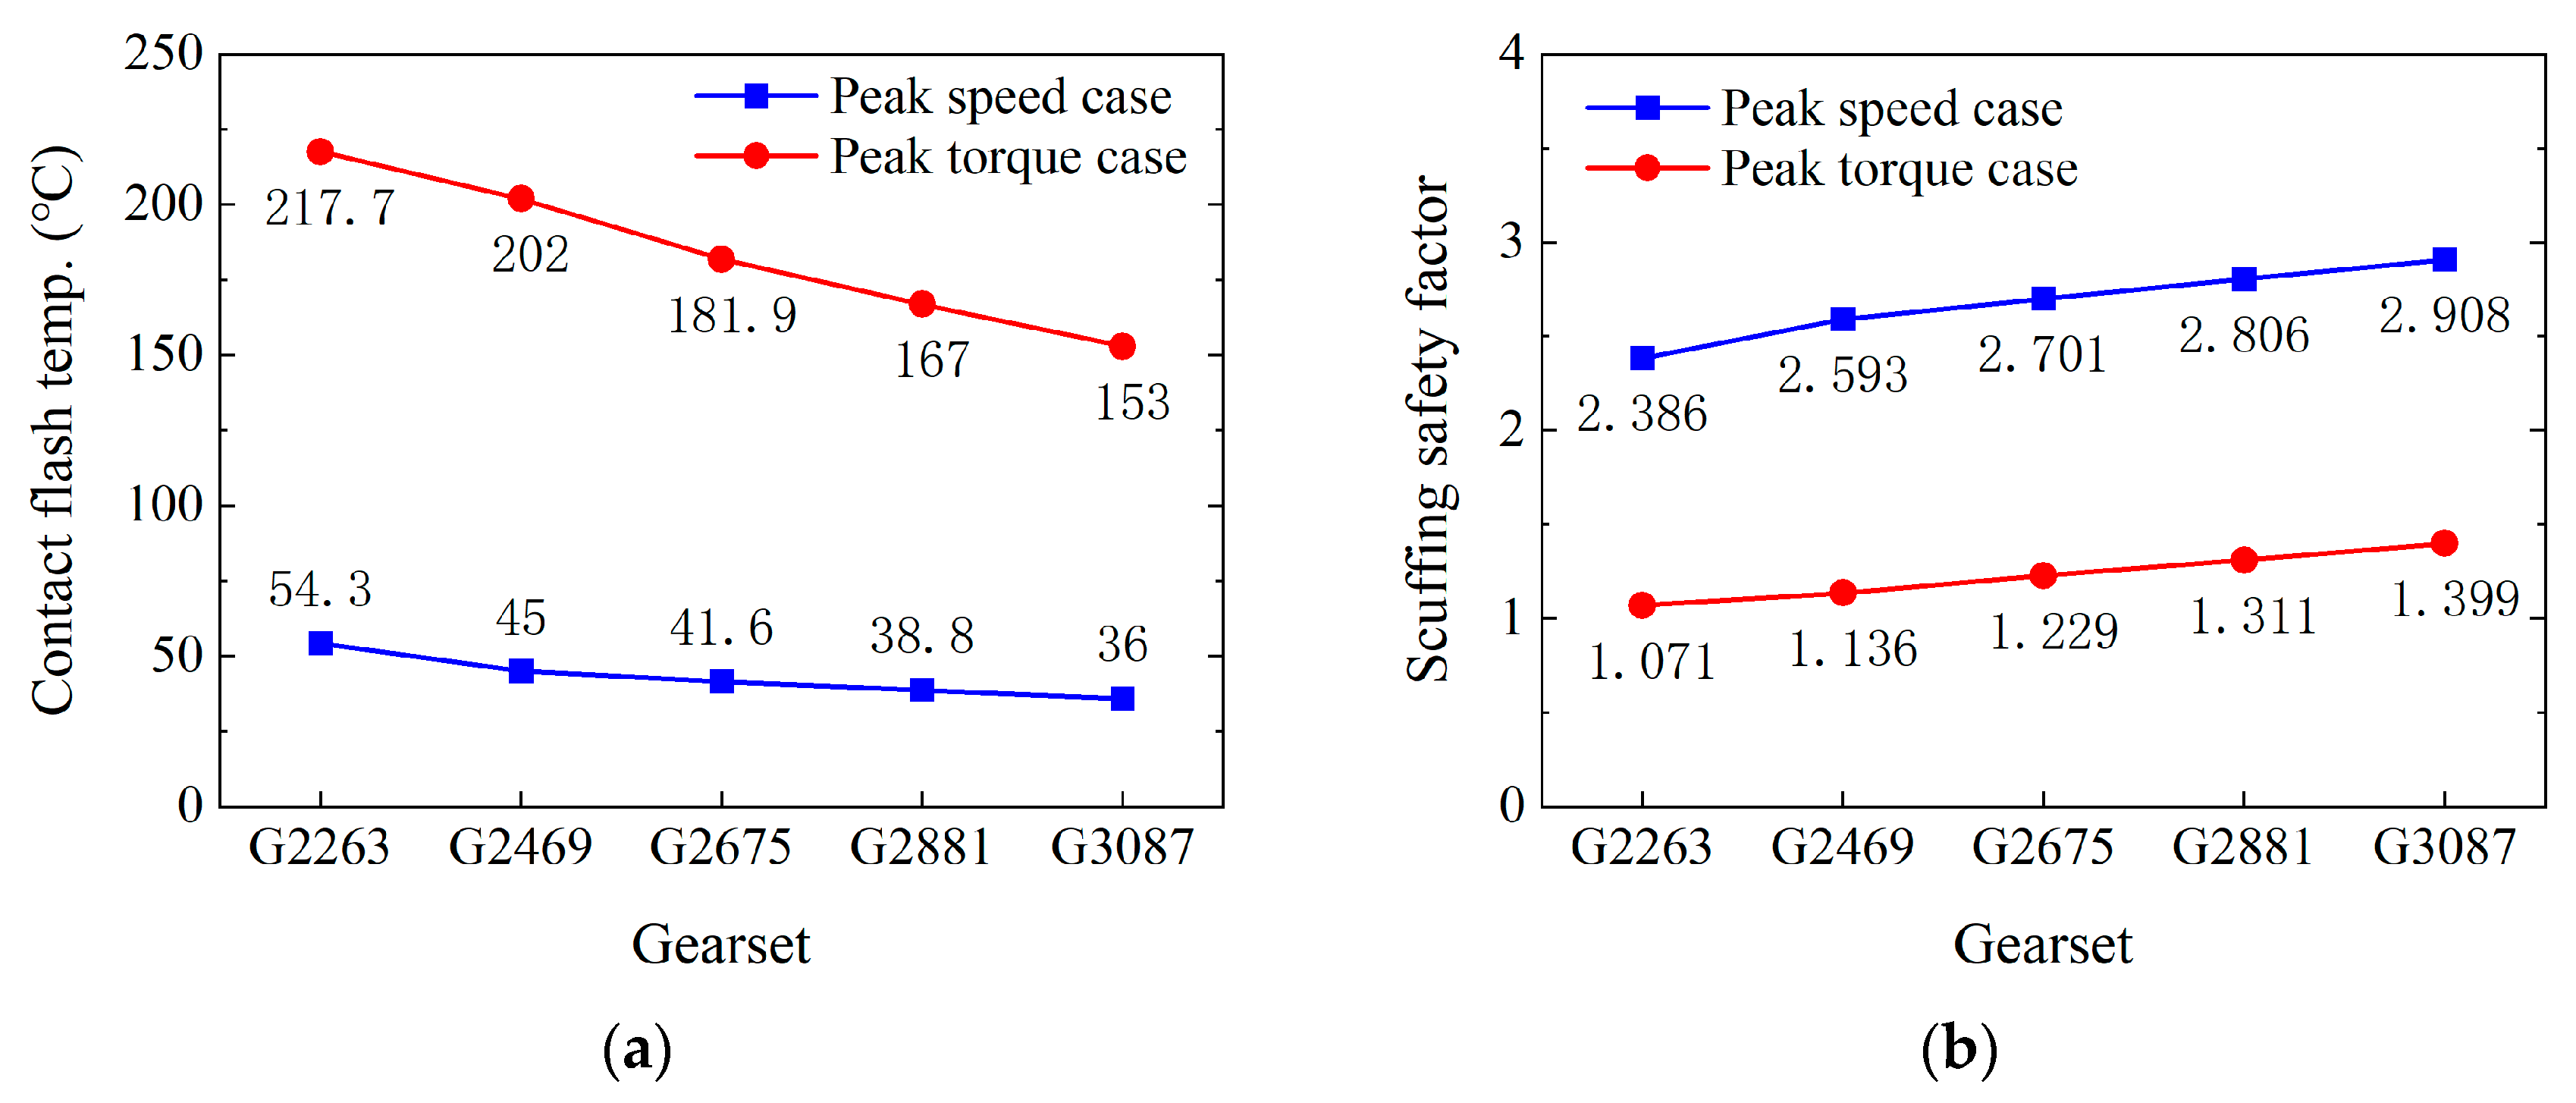
3.1.3. Tooth Flash Temperature and Scuffing Safety Assessment
3.2. The Effects of Pressure Angle on Scuffing Load Capacity
3.2.1. Gearsets Geometry Parameters Planning
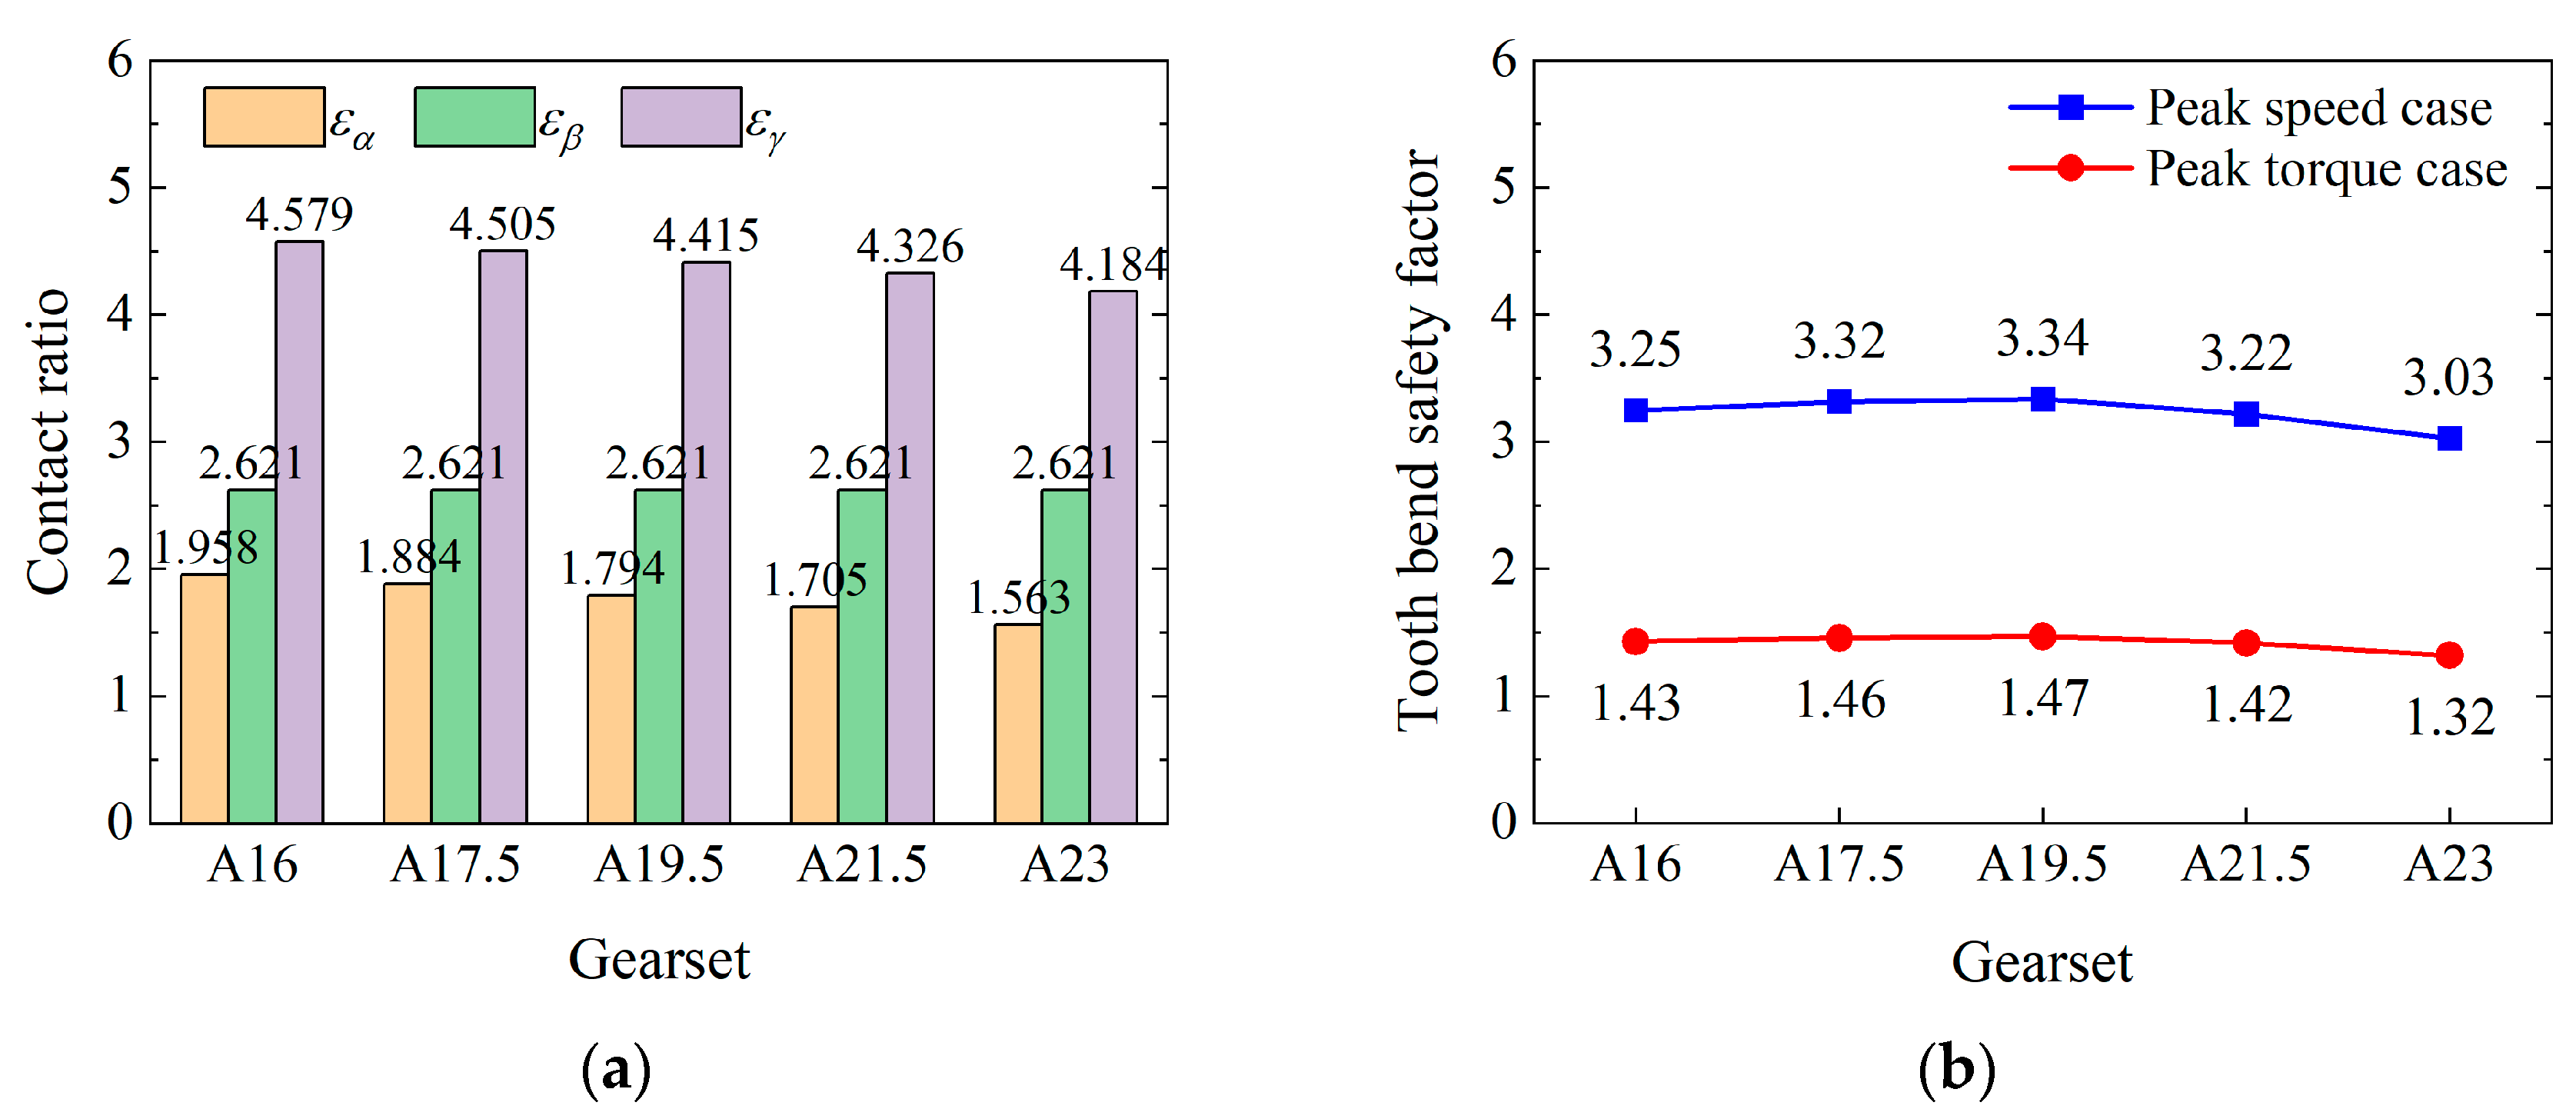
3.2.2. Comparison of Contact Ratio, Specific Sliding, and Load-Carrying Capacity
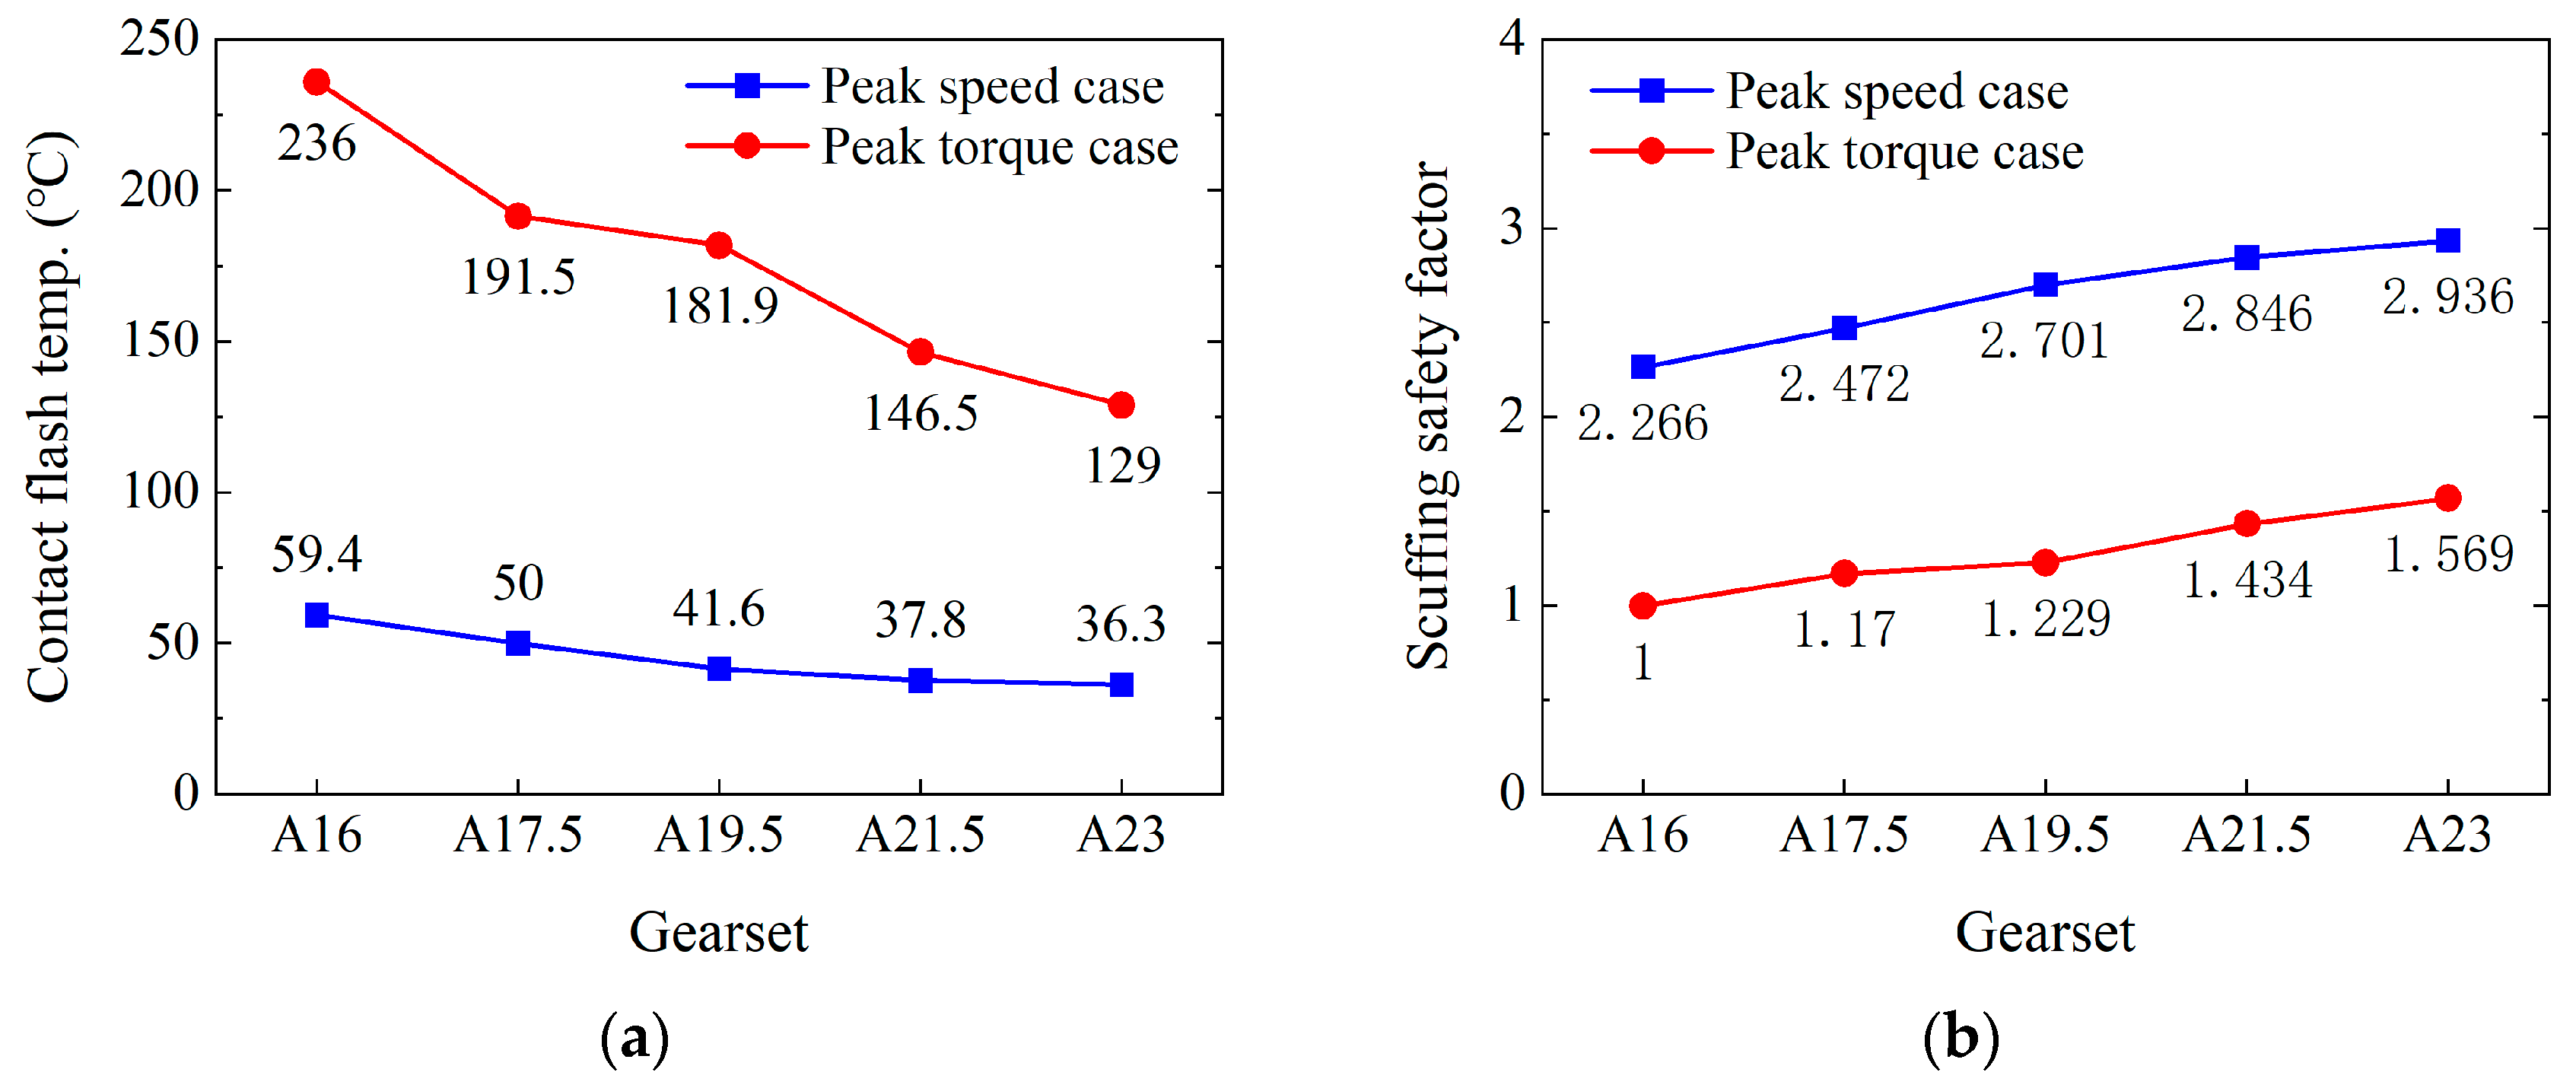
3.2.3. Tooth Flash Temperature and Scuffing Safety Assessment
3.3. The Effects of Helix Angle on Scuffing Load Capacity
3.3.1. Gearsets Geometry Parameters Planning
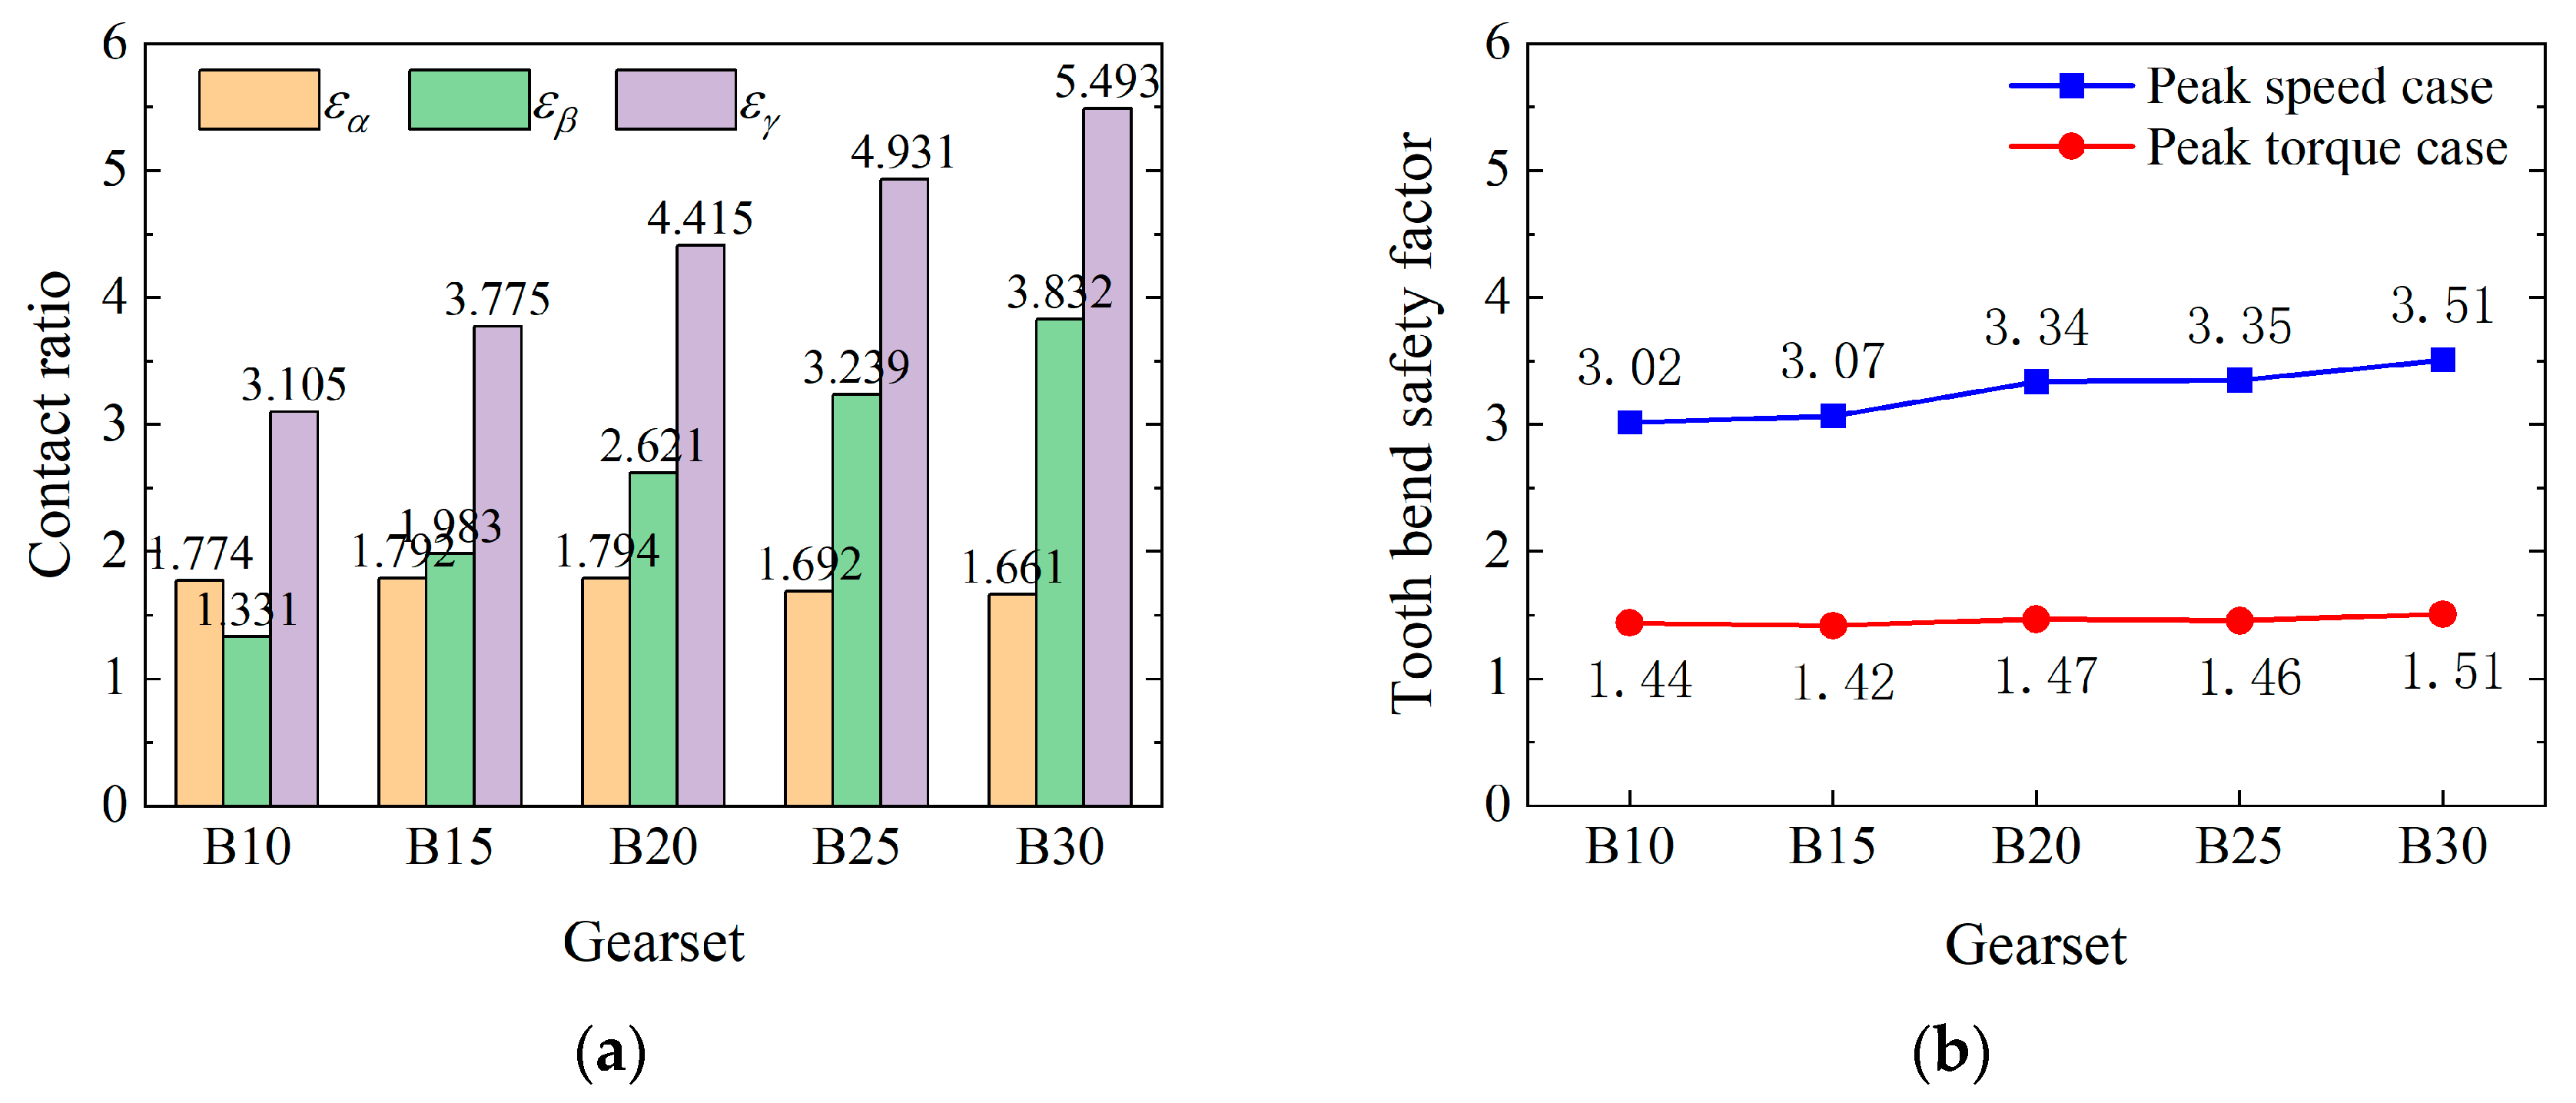
3.3.2. Comparison of Contact Ratio, Specific Sliding, and Load-Carrying Capacity
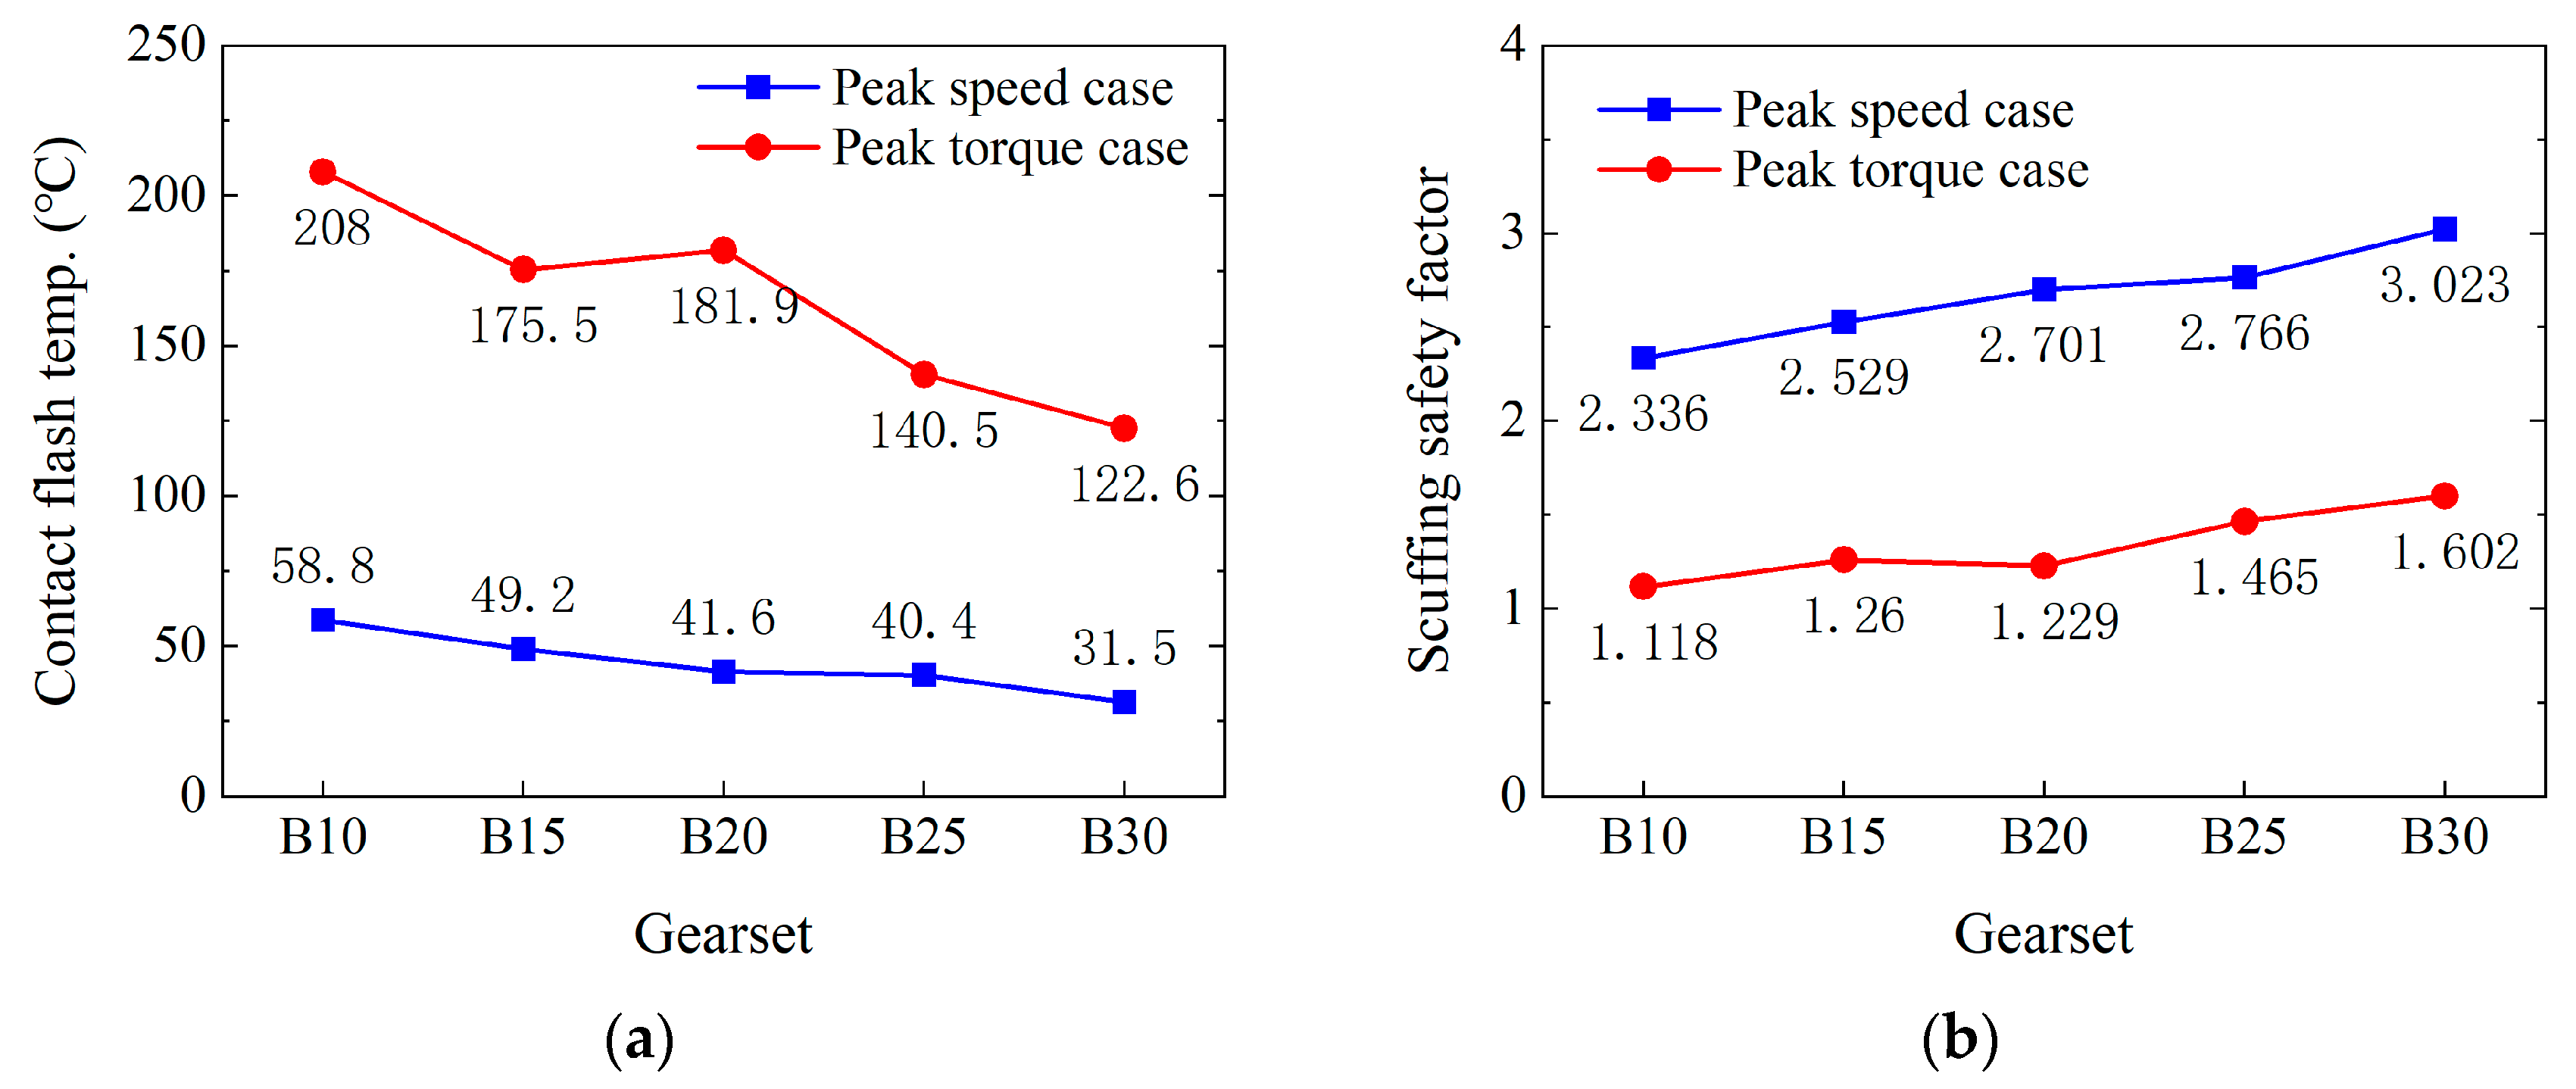
3.3.3. Tooth Flash Temperature and Scuffing Safety Assessment
4. Conclusions
- (1)
- Increasing the pressure angle decreases the contact ratio, especially affecting the transverse contact ratio. It also reduces sliding velocity and tooth-bending safety factor, potentially impacting bearing life. However, a larger pressure angle can enhance scuffing load-carrying capacity.
- (2)
- A higher helix angle significantly increases the total contact ratio, improving load-carrying capacity and contact fatigue life. It also reduces TSFT and improves the scuffing safety factor. However, higher helix angles increase axial force, which could reduce bearing life.
- (3)
- In summary, gear design significantly impacts the performance of electric vehicle gearboxes. Increasing teeth number and using larger pressure and helix angles can improve certain performance metrics, but care must be taken to balance these improvements against potential reductions in bearing life. In the next step, we will carry out a large number of experimental tests on the specific effects of the macro-parameters of the gears on the scuffing load-carrying capacity, as well as on how to design better gear parameters, to verify the reasonableness of the results obtained in this paper from theoretical analyses and numerical simulations.
Author Contributions
Funding
Institutional Review Board Statement
Informed Consent Statement
Data Availability Statement
Conflicts of Interest
References
- Morris, N.; Andreou, P.; Souza, M.R.; Mohammadpour, M.; Theodossiades, S. Electric Vehicle Tribology, 1st ed.; Elsevier: Amsterdam, The Netherlands, 2024; pp. 41–56. [Google Scholar]
- Hemanth, G.; Suresha, B.; Ananthapadmanabha. Hybrid and electric vehicle tribology: A review. Surf. Topogr. Metrol. Prop. 2021, 9, 043001. [Google Scholar]
- Nguyen, C.T.; Walker, P.D.; Zhou, S.; Zhang, N. Optimal sizing and energy management of an electric vehicle powertrain equipped with two motors and multi-gear ratios. Mech. Mach. Theory 2022, 167, 104513. [Google Scholar] [CrossRef]
- Kwon, K.; Jo, J.; Min, S. Multi-objective gear ratio and shifting pattern optimization of multi-speed transmissions for electric vehicles considering variable transmission efficiency. Energy 2021, 236, 121419. [Google Scholar] [CrossRef]
- Liang, Y.; Du, H. Multi-objective optimization of gear ratios in two-speed dual clutch transmissions for electric vehicles. Transp. Res. Procedia 2023, 70, 146–153. [Google Scholar] [CrossRef]
- Mughal, H.; Dolatabadi, N.; Rahmani, R. An integrated tribodynamic model for investigation of efficiency, durability and NVH attributes of gear mesh in electric vehicle powertrains. Tribol. Int. 2023, 189, 108977. [Google Scholar] [CrossRef]
- ISO/TS 6336-20:2022; Calculation of Load Capacity of Spur and Helical Gears, Part 20: Calculation of Scuffing Load Capacity Flash Temperature Method. International Organization for Standardization: Geneva, Switzerland, 2022.
- AGMA 925-A03; Effect of Lubrication on Gear Surface. AGMA: Alexandria, VA, USA, 2003.
- Blok, H. Theoretical study of temperature rise at surfaces of actual contact under oiliness lubricating conditions. Proc. Instn Mech. Engrs 1937, 2, 222–235. [Google Scholar]
- Blok, H. The flash temperature concept. Wear 1963, 6, 483–494. [Google Scholar] [CrossRef]
- Blok, H. Paper 3: Recent Developments in Gear Tribology. Proc. Inst. Mech. Eng. Conf. Proc. 1969, 184, 21–29. [Google Scholar] [CrossRef]
- Zhou, C.; Hu, B.; Qian, X.; Han, X. A novel prediction method for gear friction coefficients based on a computational inverse technique. Tribol. Int. 2018, 127, 200–208. [Google Scholar] [CrossRef]
- Xu, H.; Kahraman, A.; Anderson, N.E.; Maddock, D.G. Prediction of mechanical efficiency of parallel-axis gear pairs. J. Mech. Des. 2007, 129, 58–68. [Google Scholar] [CrossRef]
- Gou, X.; Zhu, L.; Qi, C. Nonlinear dynamic model of a gear-rotor-bearing system considering the flash temperature. J. Sound. Vib. 2017, 410, 187–208. [Google Scholar] [CrossRef]
- Pan, W.; Li, X.; Wang, L.; Yang, Z. Nonlinear response analysis of gear-shaft-bearing system considering tooth contact temperature and random excitations. Appl. Math. Model. 2019, 68, 113–136. [Google Scholar] [CrossRef]
- Liu, H.; Yan, P.; Gao, P. Effects of temperature on the time-varying mesh stiffness, vibration response, and support force of a multi-stage planetary gear. J. Vib. Acoust. 2020, 142, 051110. [Google Scholar] [CrossRef]
- Bai, B.; Mao, R.; Guo, W.; Mao, S. Research on Calculation and Optimization Methods for Tooth Flash Temperature and Meshing Power Loss of the Gear System in Drum Shearer. Appl. Sci. 2024, 14, 5222. [Google Scholar] [CrossRef]
- Yu, D.; Zhang, C.; Ye, S. Research on the Influence of Gear Shift and Modification on the Tooth Contact Temperature. J. Mech. Transm. 2014, 38, 5–7. [Google Scholar]
- Wei, J.; Zhang, A.; Gao, P. A Study of Spur Gear Pitting under EHL Conditions: Theoretical Analysis and Experiments. Tribol. Int. 2016, 94, 146–154. [Google Scholar] [CrossRef]
- Chen, T.; Zhu, C.; Liu, H.; Ma, K.; Zhang, W. The PVT limit for gear scuffing assessment. Wear 2024, 558–559, 205557. [Google Scholar] [CrossRef]
- Miltenović, A.; Banić, M.; Vitković, N.; Simonović, M.; Perić, M.; Rangelov, D. Investigation of the Influence of Contact Patterns of Worm-Gear Sets on Friction Heat Generation during Meshing. Appl. Sci. 2024, 14, 738. [Google Scholar] [CrossRef]
- Chen, Z.; Shao, Y. Mesh stiffness calculation of a spur gear pair with tooth profile modification and tooth root crack. Mech. Mach. Theory 2013, 62, 63–74. [Google Scholar] [CrossRef]
- Ganti, V.; Dewangan, Y.; Arvariya, S.; Madhavan, S. Influence of Micro-Geometry on Gear Scuffing. SAE Tech. Pap. 2015, 26, 0187. [Google Scholar]
- ISO 21771:2007; Gears–Cylindrical involute gears and gear pairs–Concepts and geometry. International Organization for Standardization: Geneva, Switzerland, 2007.


| Coefficients | c1 | c2 | c3 | c4 | c5 | c6 | c7 | c8 | c9 |
|---|---|---|---|---|---|---|---|---|---|
| Values | –8.916 | 1.033 | 1.036 | –0.354 | 2.812 | –0.1 | 0.753 | –0.391 | 0.62 |
| Gearset | Symbol | G2263 | G2469 | G2675 | G2881 | G3087 | |||||
|---|---|---|---|---|---|---|---|---|---|---|---|
| Gear | Z22 | Z63 | Z24 | Z69 | Z26 | Z75 | Z28 | Z81 | Z30 | Z87 | |
| Tooth number | z | 22 | 63 | 24 | 69 | 26 | 75 | 28 | 81 | 30 | 87 |
| Normal module | mn/mm | 1.925 | 1.759 | 1.62 | 1.501 | 1.398 | |||||
| Gear ratio | u | 2.864 | 2.875 | 2.885 | 2.893 | 2.9 | |||||
| Pressure angle | αn | 19.5° | |||||||||
| Helical angle | β | 20° | |||||||||
| Face width | b | 40 mm | |||||||||
| Center distance | a | 87 mm | |||||||||
| Profile shift | x | 0.208 | –0.245 | 0.208 | –0.245 | 0.208 | –0.245 | 0.208 | –0.245 | 0.208 | –0.245 |
| Tip diameter | da/mm | 50.6 | 132.7 | 50 | 132.8 | 49.6 | 132.7 | 49.1 | 132.5 | 48.7 | 132.4 |
| Root diameter | df/mm | 39.678 | 122.282 | 40 | 122.933 | 40.287 | 123.498 | 40.522 | 124.01 | 40.717 | 124.427 |
| Density | Elastic Modulus | Poisson Ratio | Thermal Conductivity | Surface Roughness | |
|---|---|---|---|---|---|
| Gear material | 7890 kg/m3 | 206 GPa | 0.3 | 49 W/m/K | Ra 0.8 µm |
| Peak speed load case | Input torque: 99 Nm | Input speed: 25,000 rpm | |||
| Peak torque load case | Input torque: 450 Nm | Input speed: 5000 rpm | |||
| Kinematic Viscosity @40 °C | Kinematic Viscosity @100 °C | Density @15 °C | FZG Scuffing Test Grade |
|---|---|---|---|
| 18 mm2/s | 4.6 mm2/s | 850 kg/m3 | 12 |
| Gearset | Tooth Surface Load Distribution Peak Speed Load Case: 99 Nm, 25,000 rpm | Tooth Surface Load Distribution Peak Torque Load Case: 450 Nm, 5000 rpm |
|---|---|---|
| G2263 | 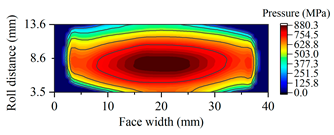 | 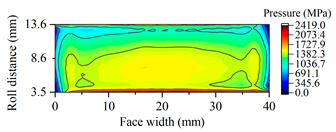 |
| G2469 | 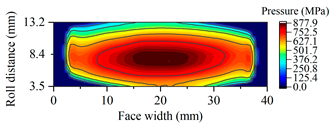 | 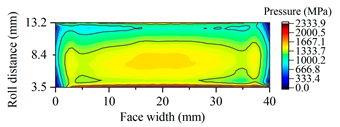 |
| G2675 | 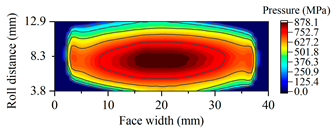 | 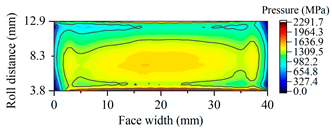 |
| G2881 | 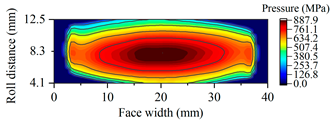 |  |
| G3087 | 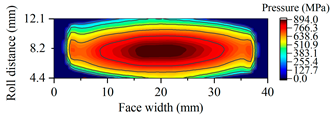 | 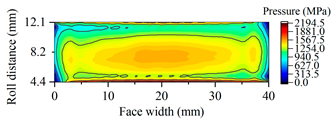 |
| Gearset | Load Case: Peak Speed 99 Nm @ 25,000 rpm | Load Case: Peak Torque 450 Nm @ 5000 rpm |
|---|---|---|
| G2263 | 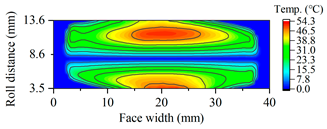 |  |
| G2469 | 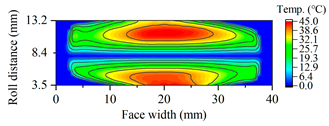 | 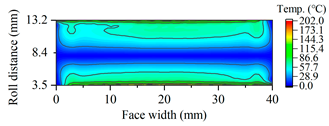 |
| G2675 |  | 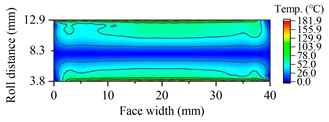 |
| G2881 | 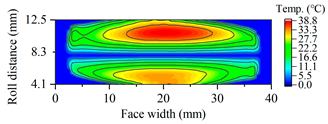 | 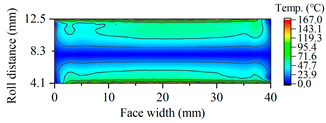 |
| G3087 |  |  |
| Gearset | Symbol | A16 | A17.5 | A19.5 | A21.5 | A23 | |||||
|---|---|---|---|---|---|---|---|---|---|---|---|
| Gear | Z26 | Z75 | Z26 | Z75 | Z26 | Z75 | Z26 | Z75 | Z26 | Z75 | |
| Tooth number | z | 26 | 75 | 26 | 75 | 26 | 75 | 26 | 75 | 26 | 75 |
| Normal module | mn/mm | 1.62 | |||||||||
| Gear ratio | u | 2.885 | |||||||||
| Pressure angle | αn | 16° | 17.5° | 19.5° | 21.5° | 23° | |||||
| Helical angle | β | 20° | |||||||||
| Face width | b | 40 mm | |||||||||
| Center distance | a | 87 mm | |||||||||
| Profile shift coefficient | x | 0.408 | –0.445 | 0.308 | –0.345 | 0.208 | –0.245 | 0.208 | –0.245 | 0.208 | –0.245 |
| Tip diameter | da/mm | 50.26 | 132.08 | 49.9 | 132 | 49.6 | 132.7 | 49.5 | 132.8 | 49.3 | 132.6 |
| Root diameter | df/mm | 40.935 | 122.785 | 40.611 | 123.142 | 40.287 | 123.498 | 40.287 | 123.563 | 40.287 | 123.563 |
| Gearset | Tooth Surface Load Distribution Peak Speed Load Case: 99 Nm, 25,000 rpm | Tooth Surface Load Distribution Peak Torque Load Case: 450 Nm, 5000 rpm |
|---|---|---|
| A16 |  |  |
| A17.5 |  |  |
| A19.5 |  |  |
| A21.5 | 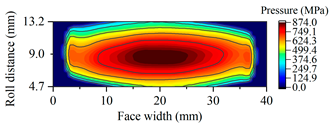 |  |
| A23 |  | 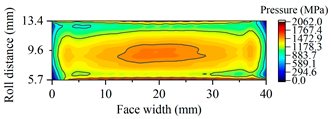 |
| Gearset | Tooth Surface Load Distribution Peak Speed Load Case: 99 Nm, 25,000 rpm | Tooth Surface Load Distribution Peak Torque Load Case: 450 Nm, 5000 rpm |
|---|---|---|
| A16 | 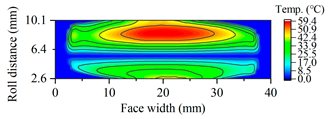 |  |
| A17.5 | 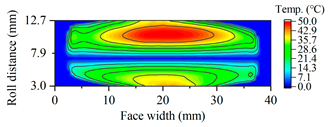 | 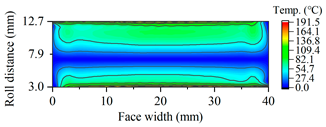 |
| A19.5 | 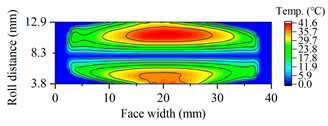 |  |
| A21.5 |  |  |
| A23 | 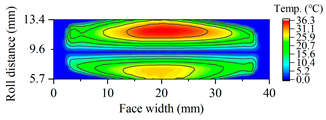 | 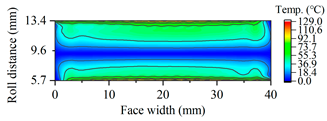 |
| Gearset | Symbol | B10 | B15 | B20 | B25 | B30 | |||||
|---|---|---|---|---|---|---|---|---|---|---|---|
| Gear | Z26 | Z75 | Z26 | Z75 | Z26 | Z75 | Z26 | Z75 | Z26 | Z75 | |
| Tooth number | z | 26 | 75 | 26 | 75 | 26 | 75 | 26 | 75 | 26 | 75 |
| Normal module | mn/mm | 1.62 | |||||||||
| Gear ratio | u | 2.885 | |||||||||
| Pressure angle | αn | 19.5° | |||||||||
| Helical angle | β | 10° | 15° | 20° | 25° | 30° | |||||
| Face width | b | 40 mm | |||||||||
| Center distance | a | 83 mm | 85 mm | 87 mm | 90.2 mm | 94.4 mm | |||||
| Profile shift coefficient | x | 0.239 | –0.283 | 0.375 | –0.185 | 0.208 | –0.245 | 0.316 | –0.357 | 0.196 | –0.237 |
| Tip diameter | da/mm | 47.5 | 126.25 | 48.7 | 129.5 | 49.6 | 132.7 | 51.5 | 137.2 | 53.5 | 143.9 |
| Root diameter | df/mm | 38.61 | 117.65 | 39.576 | 120.484 | 40.287 | 123.498 | 42.25 | 128.03 | 44.025 | 134.47 |
| Gearset | Tooth Surface Load Distribution Peak Speed Load Case: 99 Nm, 25,000 rpm | Tooth Surface Load Distribution Peak Torque Load Case: 450 Nm, 5000 rpm |
|---|---|---|
| B10 |  | 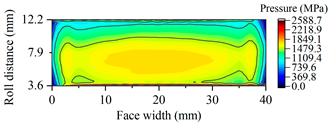 |
| B15 | 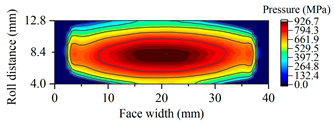 | 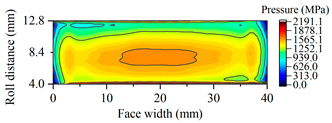 |
| B20 |  |  |
| B25 |  | 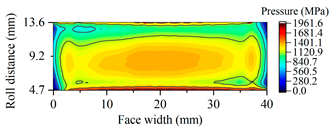 |
| B30 | 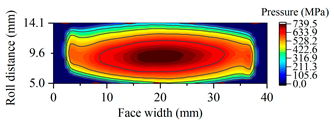 | 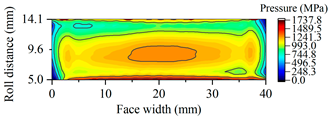 |
| Gearset | Tooth Surface Load Distribution Peak Speed Load Case: 99 Nm, 25,000 rpm | Tooth Surface Load Distribution Peak Torque Load Case: 450 Nm, 5000 rpm |
|---|---|---|
| B10 | 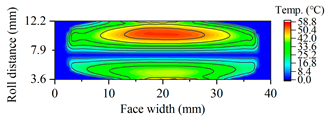 | 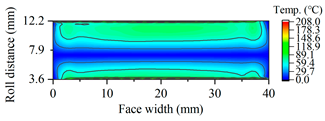 |
| B15 |  |  |
| B20 |  |  |
| B25 |  |  |
| B30 |  |  |
Disclaimer/Publisher’s Note: The statements, opinions and data contained in all publications are solely those of the individual author(s) and contributor(s) and not of MDPI and/or the editor(s). MDPI and/or the editor(s) disclaim responsibility for any injury to people or property resulting from any ideas, methods, instructions or products referred to in the content. |
© 2024 by the authors. Licensee MDPI, Basel, Switzerland. This article is an open access article distributed under the terms and conditions of the Creative Commons Attribution (CC BY) license (https://creativecommons.org/licenses/by/4.0/).
Share and Cite
Bai, B.; Li, X.; Guo, W.; Mao, S. Effect of Geometric Parameters of High-Speed Helical Gears on Friction Flash Temperature and Scuffing Load Capacity in Electric Vehicles. Appl. Sci. 2024, 14, 10326. https://doi.org/10.3390/app142210326
Bai B, Li X, Guo W, Mao S. Effect of Geometric Parameters of High-Speed Helical Gears on Friction Flash Temperature and Scuffing Load Capacity in Electric Vehicles. Applied Sciences. 2024; 14(22):10326. https://doi.org/10.3390/app142210326
Chicago/Turabian StyleBai, Bo, Xianping Li, Wenchao Guo, and Shimin Mao. 2024. "Effect of Geometric Parameters of High-Speed Helical Gears on Friction Flash Temperature and Scuffing Load Capacity in Electric Vehicles" Applied Sciences 14, no. 22: 10326. https://doi.org/10.3390/app142210326
APA StyleBai, B., Li, X., Guo, W., & Mao, S. (2024). Effect of Geometric Parameters of High-Speed Helical Gears on Friction Flash Temperature and Scuffing Load Capacity in Electric Vehicles. Applied Sciences, 14(22), 10326. https://doi.org/10.3390/app142210326