Article

Vehicle Collision Analysis of the Reinforced Concrete Barriers Installed on Bridges Using Node-Independent Model

1
Korea National Railway, Daejeon 34618, Republic of Korea
2
School of General Education, Yeungnam University, Gyeongsan 38541, Republic of Korea
*
Author to whom correspondence should be addressed.
Appl. Sci. 2024, 14(22), 10518; https://doi.org/10.3390/app142210518 (registering DOI)
Submission received: 10 October 2024 / Revised: 8 November 2024 / Accepted: 13 November 2024 / Published: 15 November 2024
(This article belongs to the Section Civil Engineering)

Abstract

:
This paper focuses on improving vehicle collision simulations using finite element analysis (FEA) to examine interactions between reinforced concrete barriers and bridge decks. Three scenarios are explored: treating the barrier as a rigid body, analyzing reinforcement with a fixed base, and including the bridge deck’s cantilever portion beneath the barrier. Except for the rigid body model, a node-independent approach models the complex interactions between reinforcement and concrete in barriers on the bridge deck. This study evaluates barrier strength, occupant risk, and post-collision vehicle safety. Strength is assessed by examining stress in reinforcement and concrete, while occupant risk is measured using Theoretical Head Impact Velocity (THIV) and Post-impact Head Deceleration (PHD). Vehicle trajectory during collisions is also analyzed for stability. The results show significant differences in stress distribution and failure patterns when the bridge deck is considered compared to scenarios without it. Occupant risk evaluations suggest more flexible responses when the bridge deck is included. However, vehicle trajectory post-collision showed no significant differences across scenarios. These findings indicate that modeling efficiency varies based on evaluation criteria, suggesting a more realistic and effective approach for assessing barriers on bridges.

1. Introduction

Reinforced concrete barriers on bridges play a crucial role in ensuring the safety of vehicle occupants during collisions. As essential components of bridge structures, these barriers absorb and dissipate collision energy to prevent vehicles from veering off the road [1]. However, traditional design approaches often simplify the interaction between the bridge deck and the barrier by assuming that the deck acts as a rigid body, which can lead to inaccurate assessments of barrier performance [2,3]. The connectivity between the deck and the barrier was studied in [2,4,5]. Specifically, the research in [4] involved experimental investigations under static loading. In contrast, the authors of [5] compared experimental results with numerical analysis outcomes concerning stiffness, crack damage, and failure modes under static loading. In [2], the study modeled the deck and barrier to conduct a collision analysis involving truck vehicles, focusing on the failure patterns of the barrier. With increasing traffic volumes and vehicle speeds, the risk of collisions on bridges has escalated, necessitating a more precise understanding of barrier design and performance evaluation. Recognizing the flexibility of the bridge deck in analyzing barrier performance is essential for developing safer and more efficient barrier designs.
Various numerical analysis methods and experimental approaches [6,7,8] were used in the performance evaluation of reinforced concrete barriers. In applying numerical analysis techniques, many studies frequently utilize the LS-DYNA software (https://lsdyna.ansys.com/manuals/, access on 1 October 2024), which is specialized for collision analysis and offers a variety of material models capable of representing concrete. In [2], the continuous surface cap model was utilized, whereas in [9], the Mat_Johnson_Holmquist model, which is primarily used for brittle materials like ceramics, was applied to concrete. In contrast, the authors of [7,10] treated concrete barriers as rigid bodies; specifically, the authors of [7] evaluated the risk to occupants of lightweight vehicles and compared it with experimental results, while those of [10] examined the effects of friction between the vehicle and concrete. In vehicle collision analysis, the authors of [11] utilized the Mat_Brittle_Damage model to perform collision analyses for passenger cars, pickup trucks, and large trucks. Moreover, the authors of [12] conducted an analysis comparing the K&C model and the Winfrith concrete model and the authors of [13] used the K&C model to derive various parameter values that are difficult to obtain in large-scale crash tests. Additionally, the authors of [14] applied the K&C model to rubberized concrete barriers. These studies demonstrate that advanced material models in finite element analysis (FEA) for concrete barriers have significant potential in predicting barrier performance across various collision scenarios.
Numerical analysis methods for reinforced concrete barriers, including material models related to concrete, fundamentally rely on finite element modeling techniques for reinforced concrete. Although numerous numerical models have been proposed for the analysis of reinforced concrete structures, none have effectively combined the desired levels of accuracy, robustness, and computational efficiency needed to predict the behavior of these structures [15]. One-dimensional beam elements based on concentrated plasticity [16] or distributed plasticity [17] struggle to predict the mechanical behavior of three-dimensional frame structures because they fail to capture local phenomena that affect shear behavior and the overall structural response. The use of two-dimensional plane stress finite elements [18,19] can avoid some of the simplified assumptions inherent in one-dimensional beam elements, such as the effects of shear stress, but they are unsuitable for full-scale three-dimensional structural analysis as they do not capture out-of-plane responses. Three-dimensional analyses based on triaxial stress–strain relationships and embedded reinforcement offer the highest quality approximations, but they still face limitations due to high computational costs and a lack of robustness in some cases [20,21]. These challenges have led various researchers to use different material models and other elements to conduct analyses of large-scale reinforced concrete structures with sufficient accuracy and numerical stability [15].
Several methods have been proposed to represent the interaction between the concrete and reinforcement. The first approach, which is the simplest, assumes reinforcement is distributed in appropriate directions within concrete elements using a smeared or distributed representation [19]. For reinforced concrete barriers, the authors of [11] used the smeared model but it has limitations in representing cracks in the concrete areas around the reinforcement and the local behavior of the reinforcement. The second approach models the reinforcement and concrete separately and shares the nodes between the reinforcement and the concrete [22]. In [23], regarding reinforced concrete barriers, a similar method was used for modeling. While this modeling approach does not present significant issues in small-scale modeled barriers and simple beam tests, achieving the appropriate element ratio in actual concrete structures can take considerable time, and in some cases, modeling may not be feasible at all. Due to these challenges, sometimes, the rebar arrangement is ignored, and only the concrete of the barrier is modeled as a rigid body [10]. Additionally, reinforced concrete barriers can be modeled by connecting solid elements and rebar as rigid elements [2,9] or with interface elements to represent rebar–concrete friction [5]. However, this also requires significant time to model complex rebar arrangements. To address these issues, methods have been proposed that involve independently meshing rebar and concrete elements and applying additional constraints between them. However, these methods still require substantial time to connect the two elements. To resolve the issue of the time required for modeling with additional constraints between rebar and concrete, the researchers in [12,13] used the Constrained_Lagrange_In_Solid model provided by LS-DYNA to represent the interaction between rebar and concrete, conducting crash analyses of reinforced concrete barriers. This method, primarily based on fluid–structure coupling analysis to represent interactions between different elements, improves the convenience of modeling reinforced concrete structures. However, it remains highly dependent on mesh quality and density [24].
When designing reinforced concrete barriers on bridges, they are often assumed to be rigid bodies, which distinguishes them from flexible barriers made of steel, aluminum, or composite materials [25,26]. Additionally, the bridge deck is often not considered in some cases [26]. Therefore, this study models three cases for comparative analysis: treating the barrier as a rigid body, analyzing the reinforcement with the lower section fixed, and modeling the cantilever bridge deck portion beneath the barrier foundation. Key considerations in barrier design include the strength of the barrier, occupant risk, and vehicle trajectory. This study investigates the interaction between the reinforced concrete barrier and the bridge deck. It compares the results of the three models concerning these design considerations and proposes a rational modeling approach. This research provides a more precise understanding of the interaction between reinforced concrete barriers and bridge decks, contributing to the development of safer and more efficient bridge barriers. The insights gained may be incorporated into future design standards, helping to meet the growing demand for safe bridge infrastructure.

2. Materials and Methods

2.1. Node-Independent Model for Reinforced Concrete

When modeling reinforced concrete barriers using the finite element method, the most intuitive approach is to share nodes for the reinforcement and concrete elements. Concrete is specifically modeled using solid elements, and reinforcement using beam elements. Reinforcement can also be modeled with truss elements. If bending is minimal and axial behavior is predominant, truss elements are sufficient; however, beam elements are preferable for capturing the bending or shear behavior of the reinforcement. Figure 1 illustrates an example of modeling reinforced concrete using solid and beam elements. To represent the interaction between reinforcement and concrete, nodes are simply shared without additional constraints. It is important to note that the degrees of freedom for nodes used in solid elements differ from those in beam elements; so, only translational degrees of freedom are shared. In Figure 1, the points marked in purple indicate the nodes connecting the beam and solid elements.
Both the bridge deck and the barriers installed on the bridge feature a complex arrangement of a significant amount of reinforcement in both longitudinal and transverse directions. Thus, considerable time is required for mesh design to share the nodes of beam elements representing reinforcement and solid elements representing concrete, making the finite element discretization process quite cumbersome. Additionally, in such processes, the aspect ratio of concrete elements may deteriorate to satisfy node sharing. This poor aspect ratio can reduce the accuracy of the numerical solution. To improve the aspect ratio, a very fine mesh design is necessary, which increases computational costs and results in a large number of elements. To address these issues, a node-independent model that allows for interaction without matching the nodes of different elements is required. In this study, the node-independent model using the CBIS (Constrained Beam In Solid) model provided by LS-DYNA [24,27] is applied to reinforced concrete barriers. In the node-independent model, nodes of elements corresponding to reinforcement and concrete do not need to match. Reinforcement and concrete are modeled as beams and solids, respectively. The beam mesh is submerged in the solid mesh, and each possesses independent motion. The node-independent model utilizes a master–slave concept to define the interaction between solid and beam elements. The master for concrete regions is responsible for calculating strains, stresses, and displacements. The slave for reinforcement derives its strains from the master and calculates its stresses accordingly. In the current analysis, both velocity and acceleration need to be constrained to ensure momentum conservation and force balance. The detailed process is as follows: In the first step, beam nodes distribute their nodal mass (m), velocity (v), and momentum (mv) to solid nodes (M, V, MV). Next, the master nodal velocity (V′) is calculated by dividing the new momentum by the new mass. Finally, the velocity (v′) interpolated by suitable functions N is assigned to the slave nodes. The slave nodes can move exactly the same way as master nodes. This process is shown in Figure 2. Each beam node is known to have not only its nodal mass derived from the mesh discretization process but also its nodal velocity. However, artificially generated coupling points lack these properties. Therefore, the velocity at a coupling point should be interpolated from the beam end nodes.

2.2. Modeling of Reinforced Concrete Barriers

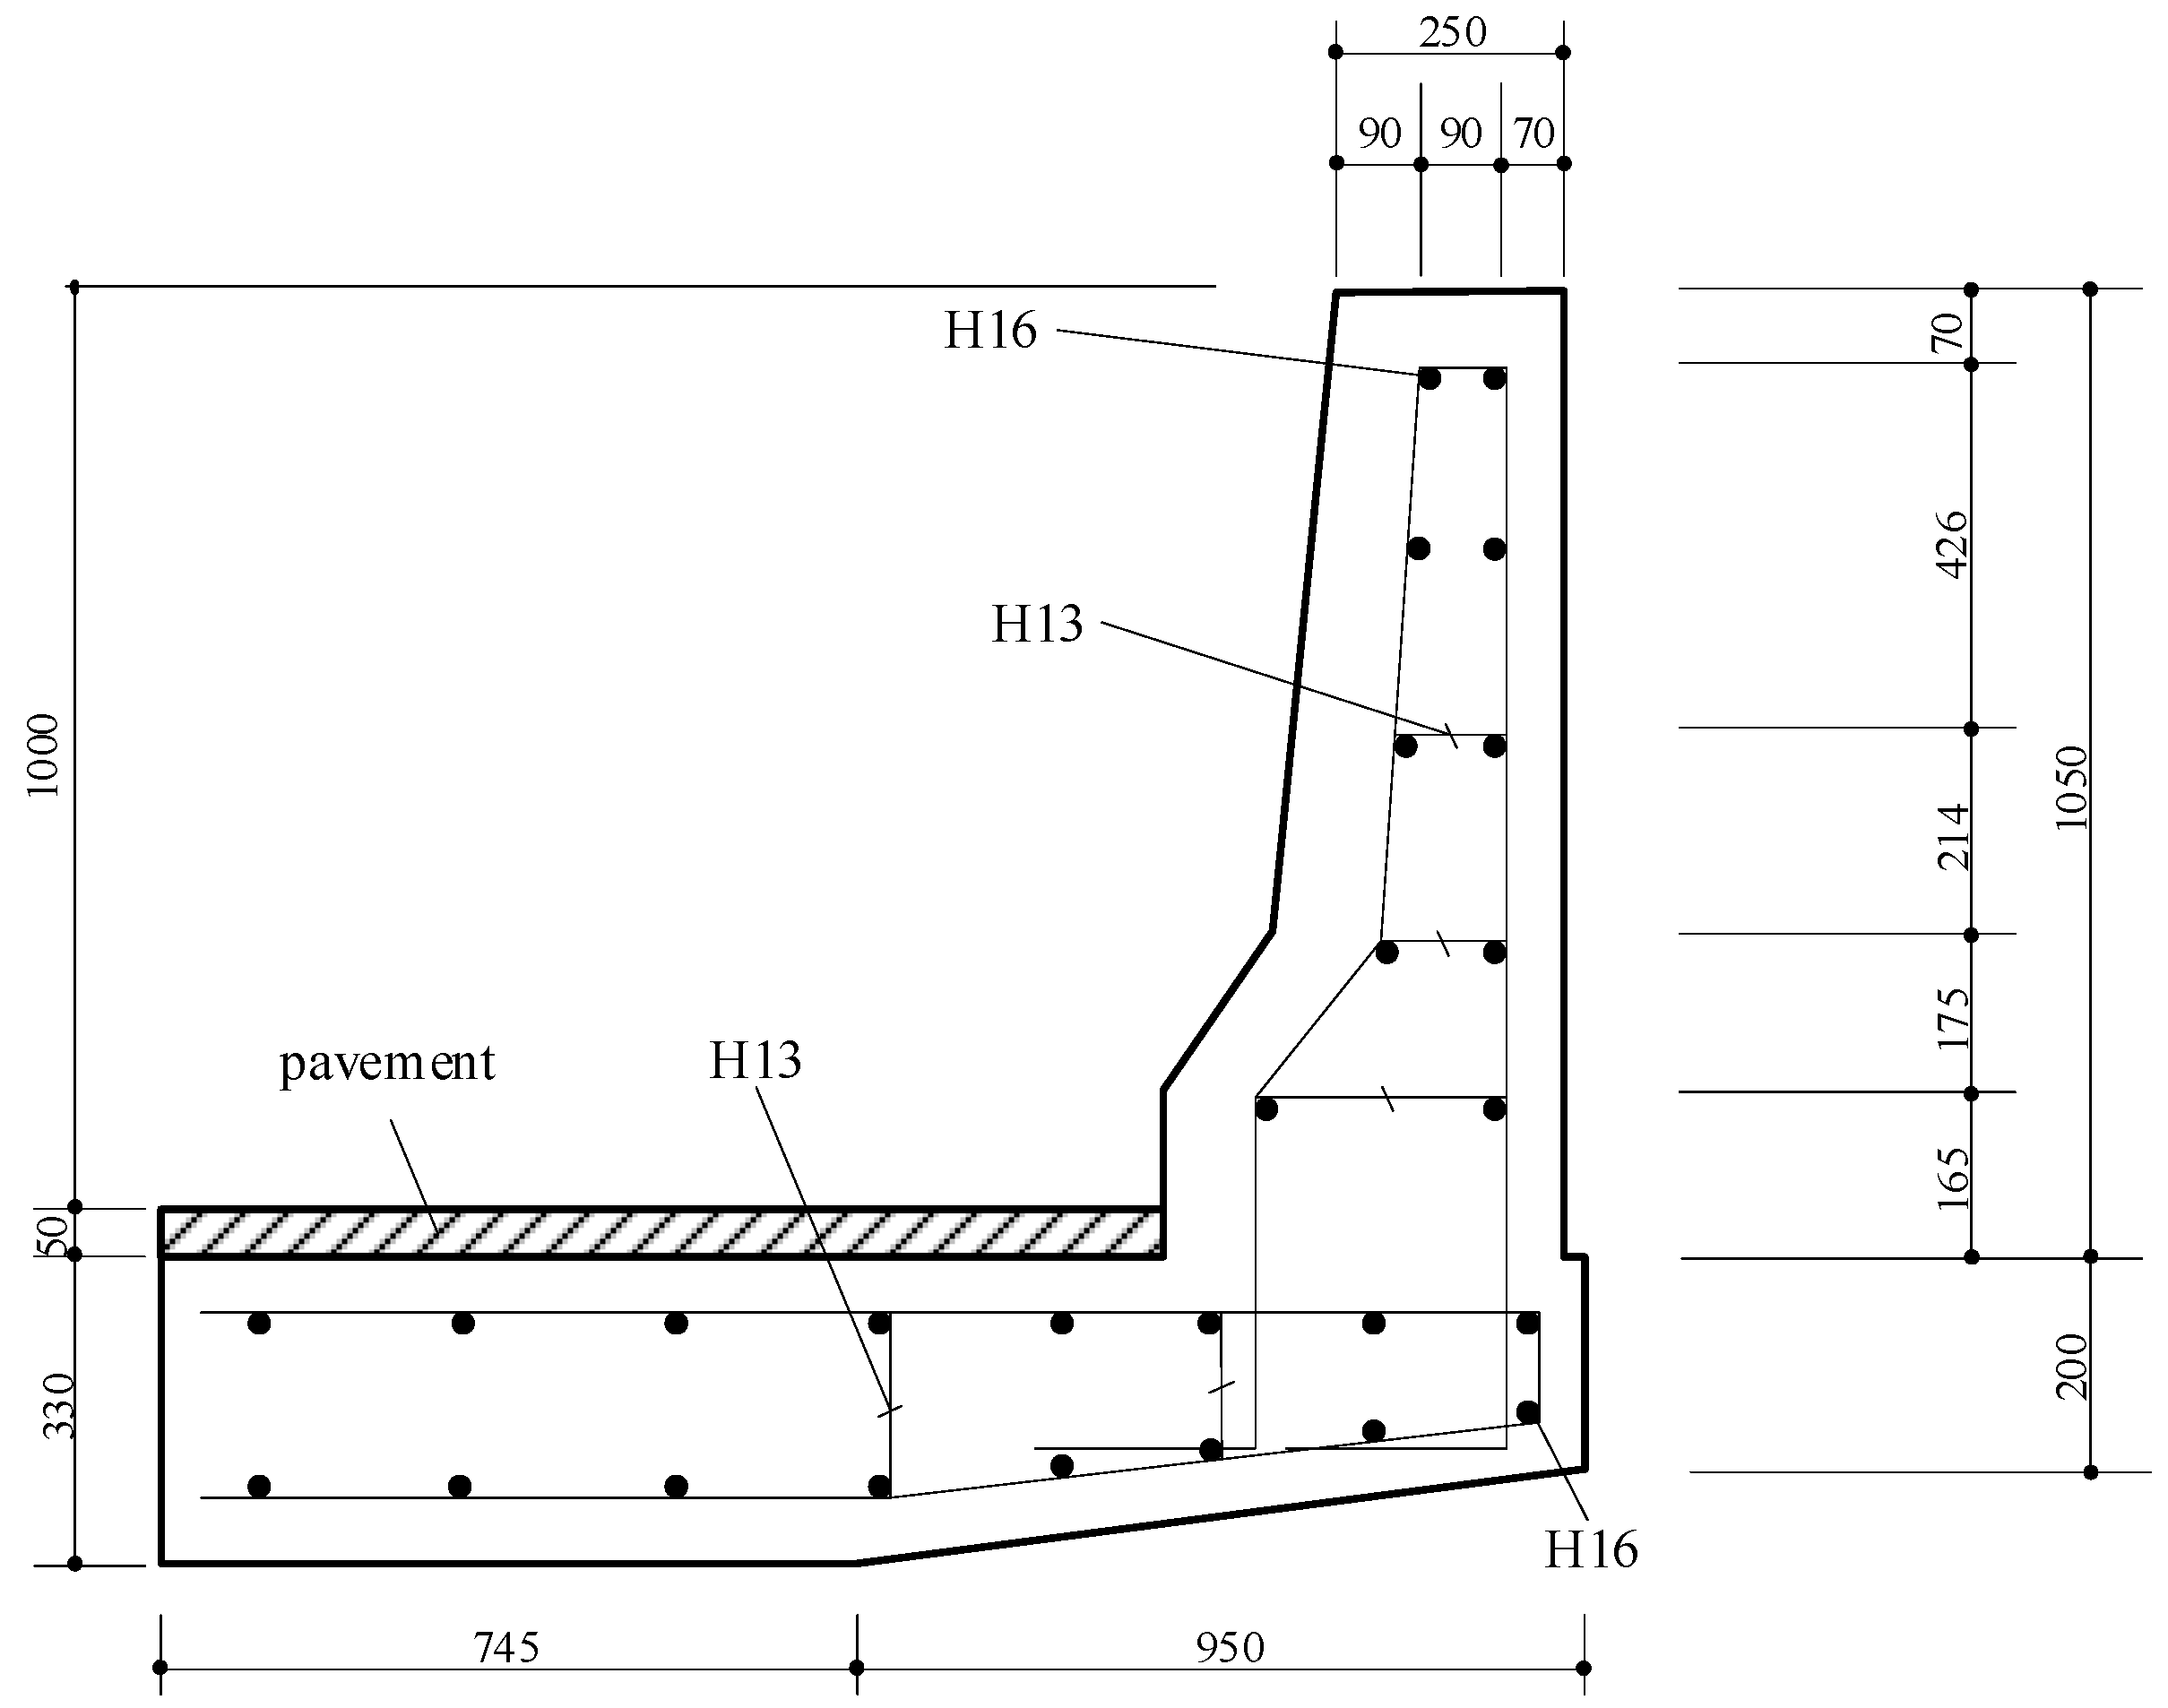
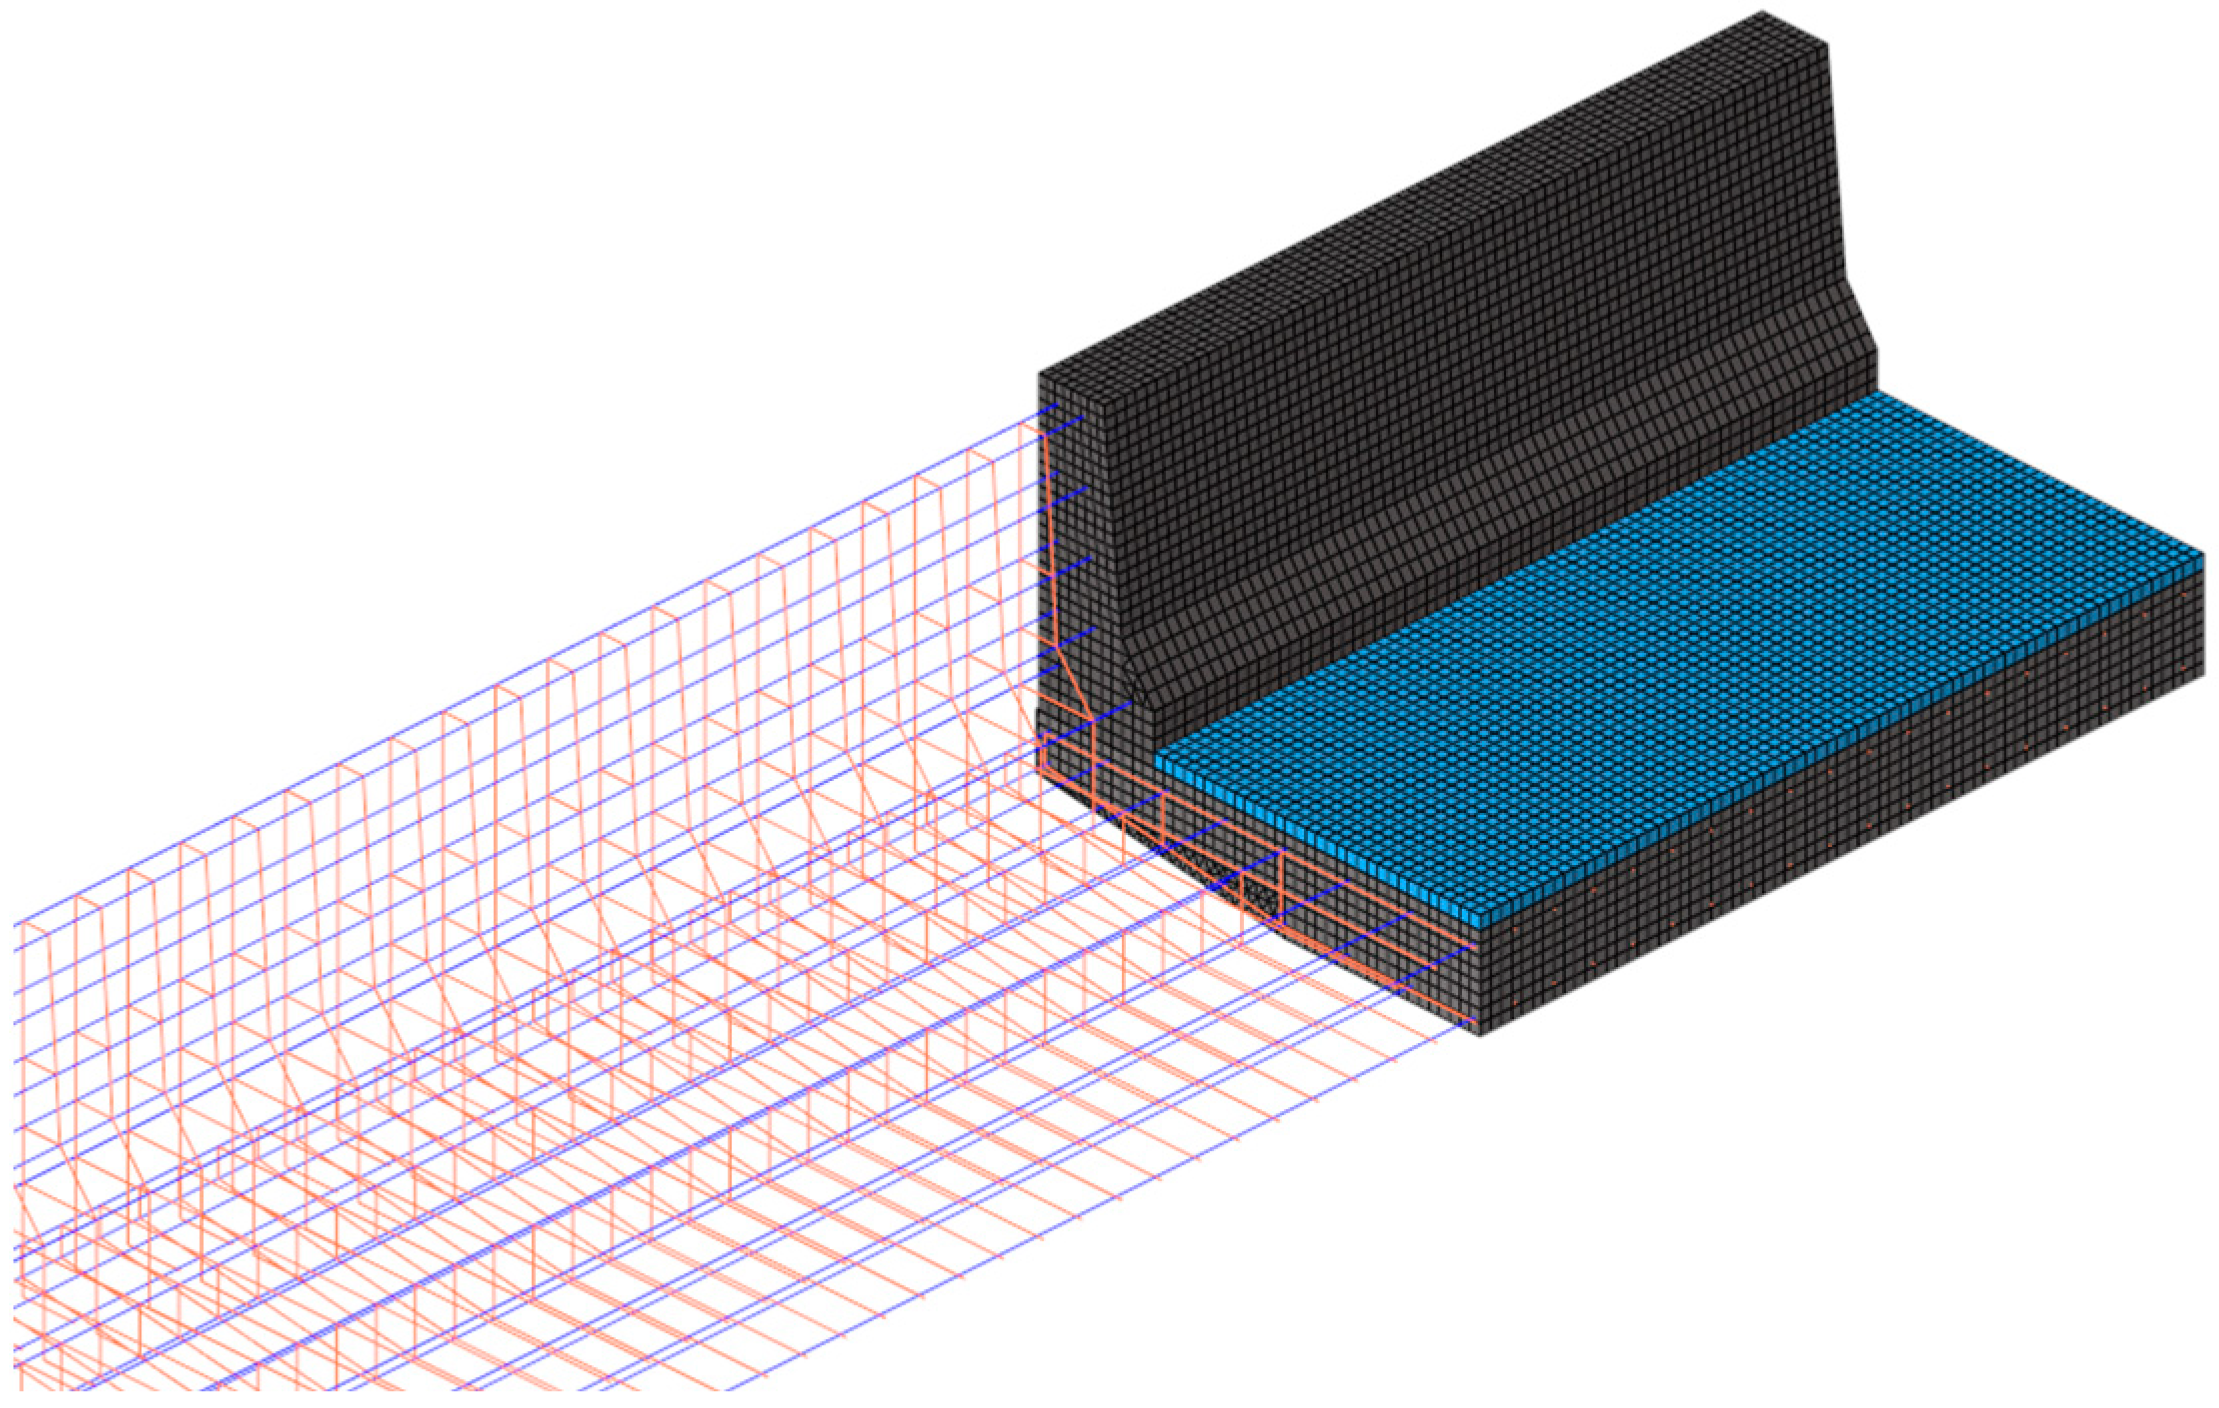
The classification of safety barriers is based on the strength of the facility and is defined by the impact severity, which is the kinetic energy of a vehicle upon collision. In South Korea, safety barriers are categorized into nine grades. This study focuses on SB5 (Safety Barrier 5), which is commonly used in highway bridge sections. Figure 3 shows the standard cross-section of the SB5 grade used by the Korea Expressway Corporation [28]. H13 and H16 indicate reinforcing bars with diameters of 13 mm and 16 mm, respectively. The total length of the reinforced concrete safety barrier is assumed to be 40 m. The shape, material model, and meshing of the concrete safety barrier and reinforcing bars were implemented using LS-PrePost software (R11) [29]. This software is specialized to effectively perform pre-processing and post-processing for LS-DYNA analysis. Through this software, the finite element model, which includes the cantilever part of the bridge deck and the safety barrier, is depicted considering this standard cross-section and is shown in Figure 4.
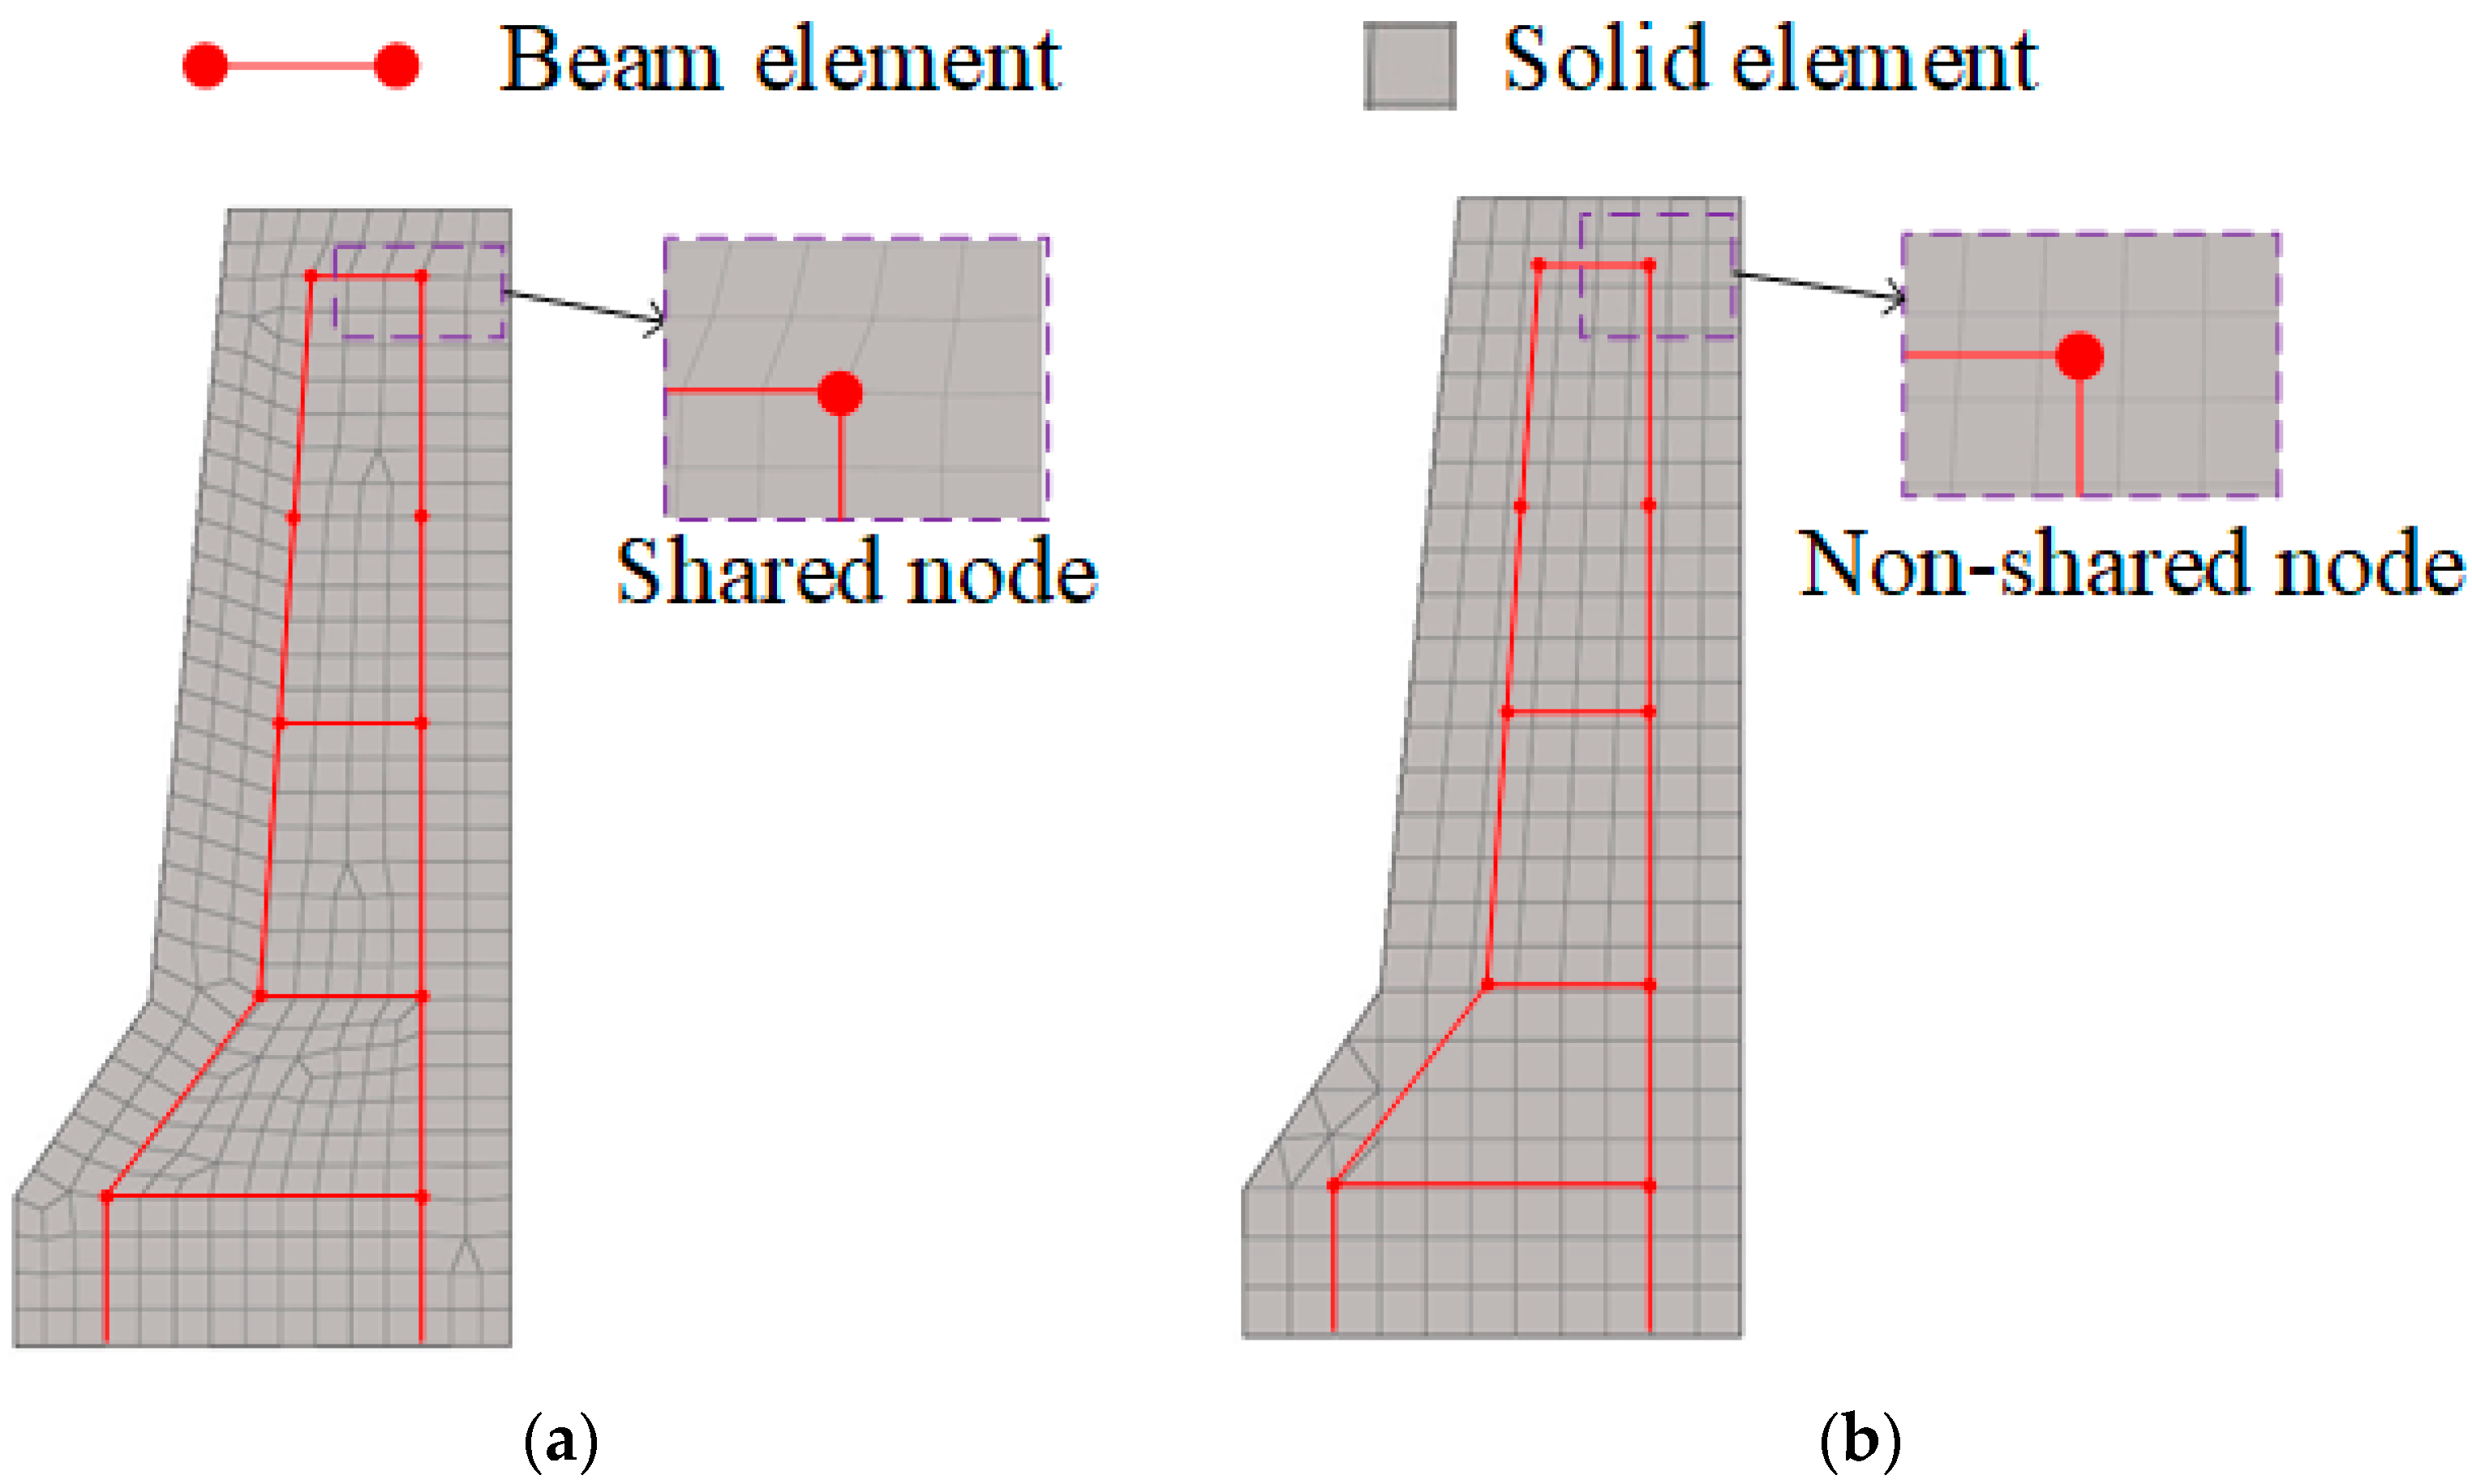
The concrete was modeled using 8-node hexahedral elements with one-point Gauss integration. An hourglass control formulation was used to prevent spurious modes considering one-point Gauss integration. The reinforcement bars were modeled using Hughes–Liu beam elements, which provide two nodes, one integration point, an integrated cross-section, and shear deformation effects. Each node of the beam element has six degrees of freedom, including three translations and three rotations. Figure 5 compares the cases using the node-sharing model and the node-independent model. When modeling with a similar number of elements in both methods, the aspect ratio in the node-sharing model was about 1.7, whereas it was about 1.2 in the node-independent model. The node-independent model appears closer to 1 which has numerically more reliable results. Additionally, in the node-sharing model, the shape of the elements in the concrete barrier where the inclination angle changes can be distorted without maintaining a rectangular shape, which could degrade the accuracy of numerical analysis. Moreover, the node-sharing model can be very cumbersome because it requires matching the positions of the nodes of the reinforcement bars and concrete. Since both models have similar accuracy under sufficient mesh refinement [30], the node-independent model, which is more efficient in modeling and analysis time, was adopted in this study.
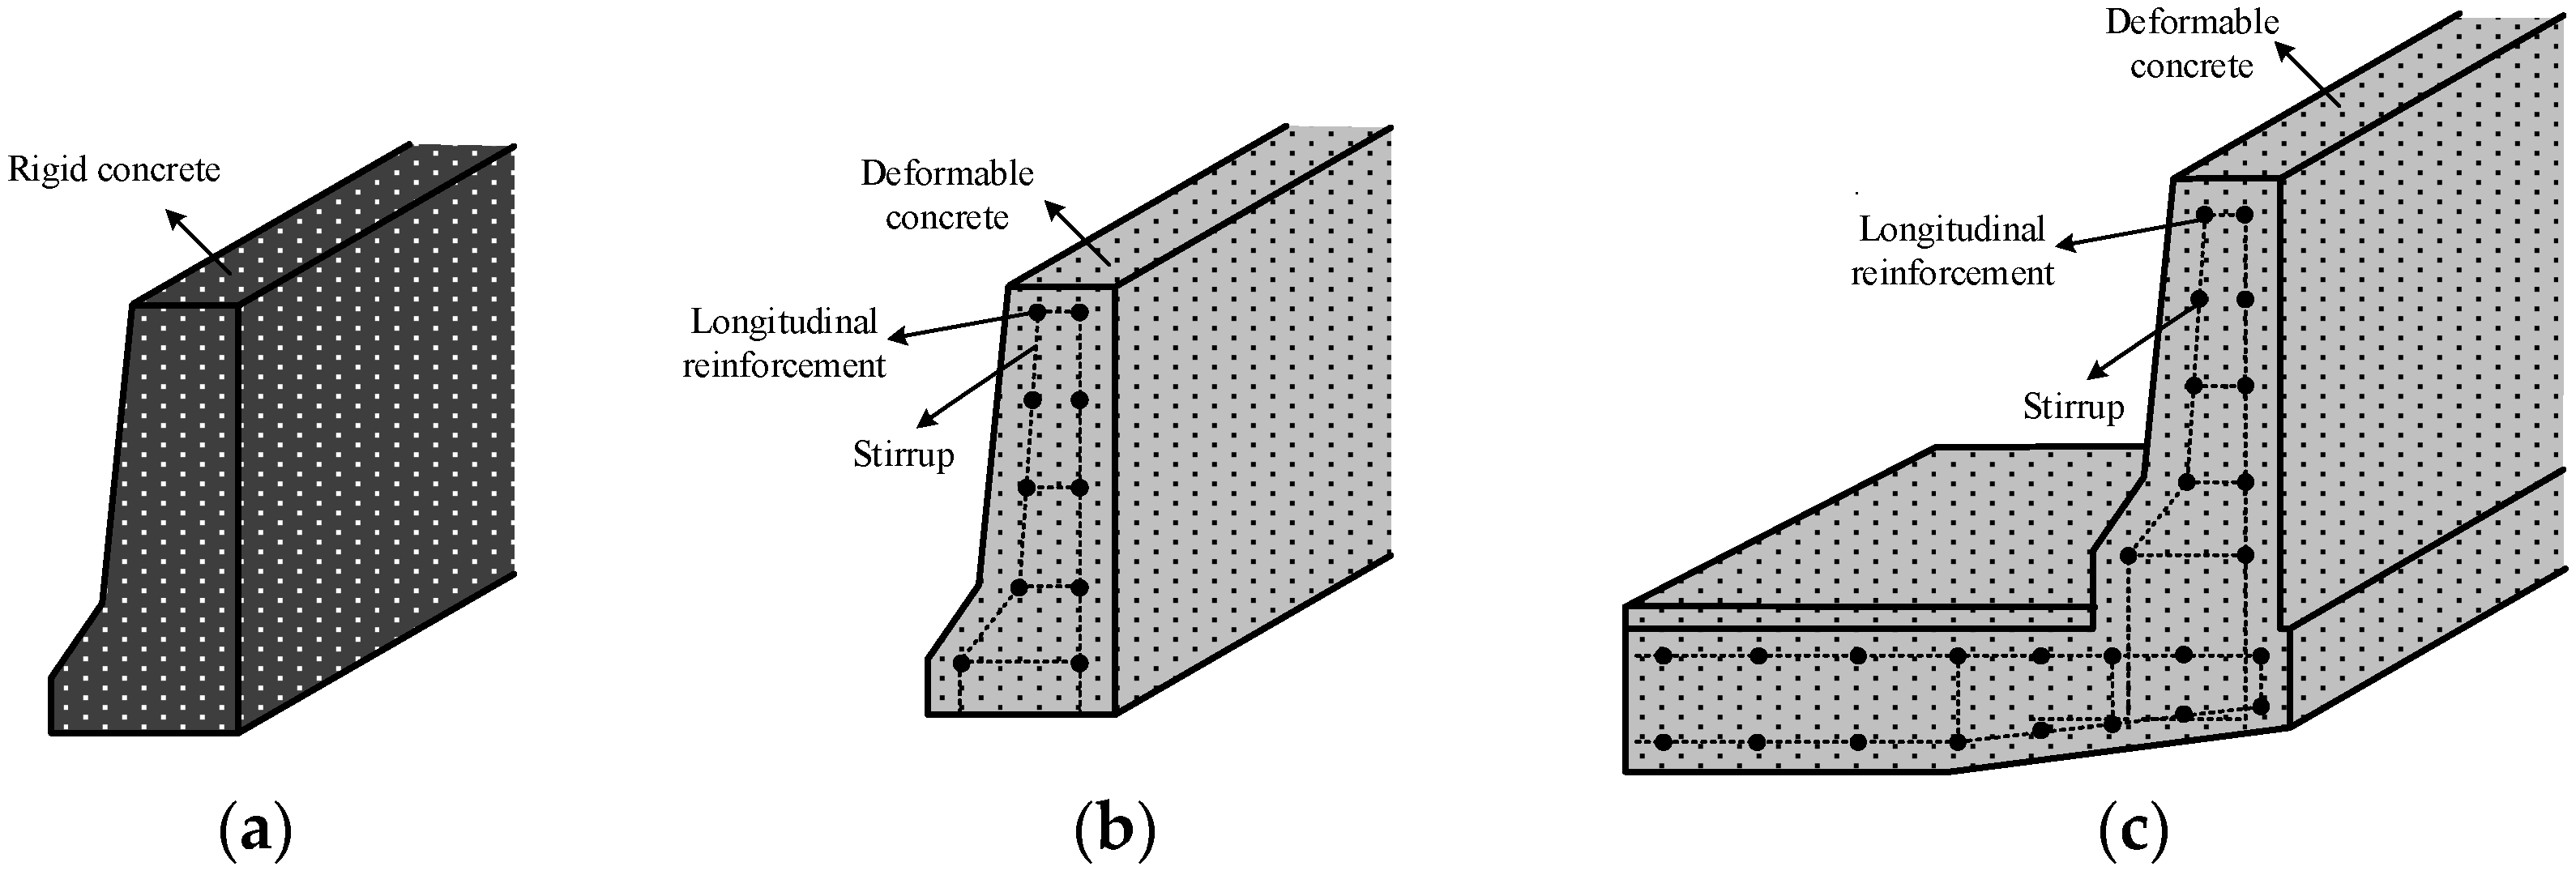
Three test models are considered for finite element analysis of reinforced concrete barriers, as shown in Figure 6. The first model (Case 1) is the simplest and has been used in several studies [31,32] to model barriers by assuming the reinforced concrete barrier as a rigid body with infinite stiffness. The second model (Case 2) is based on the node-independent model, considering the reinforcing bars placed inside the concrete barrier but not taking into account the bridge deck. In other words, it ignores the deformation of the bridge deck, thus fixing the displacement at the bottom of the barrier. The third model (Case 3) is the most realistic, taking into account both the reinforced concrete barrier and the reinforcing bar arrangement of the bridge deck.

2.3. Vehicle Model

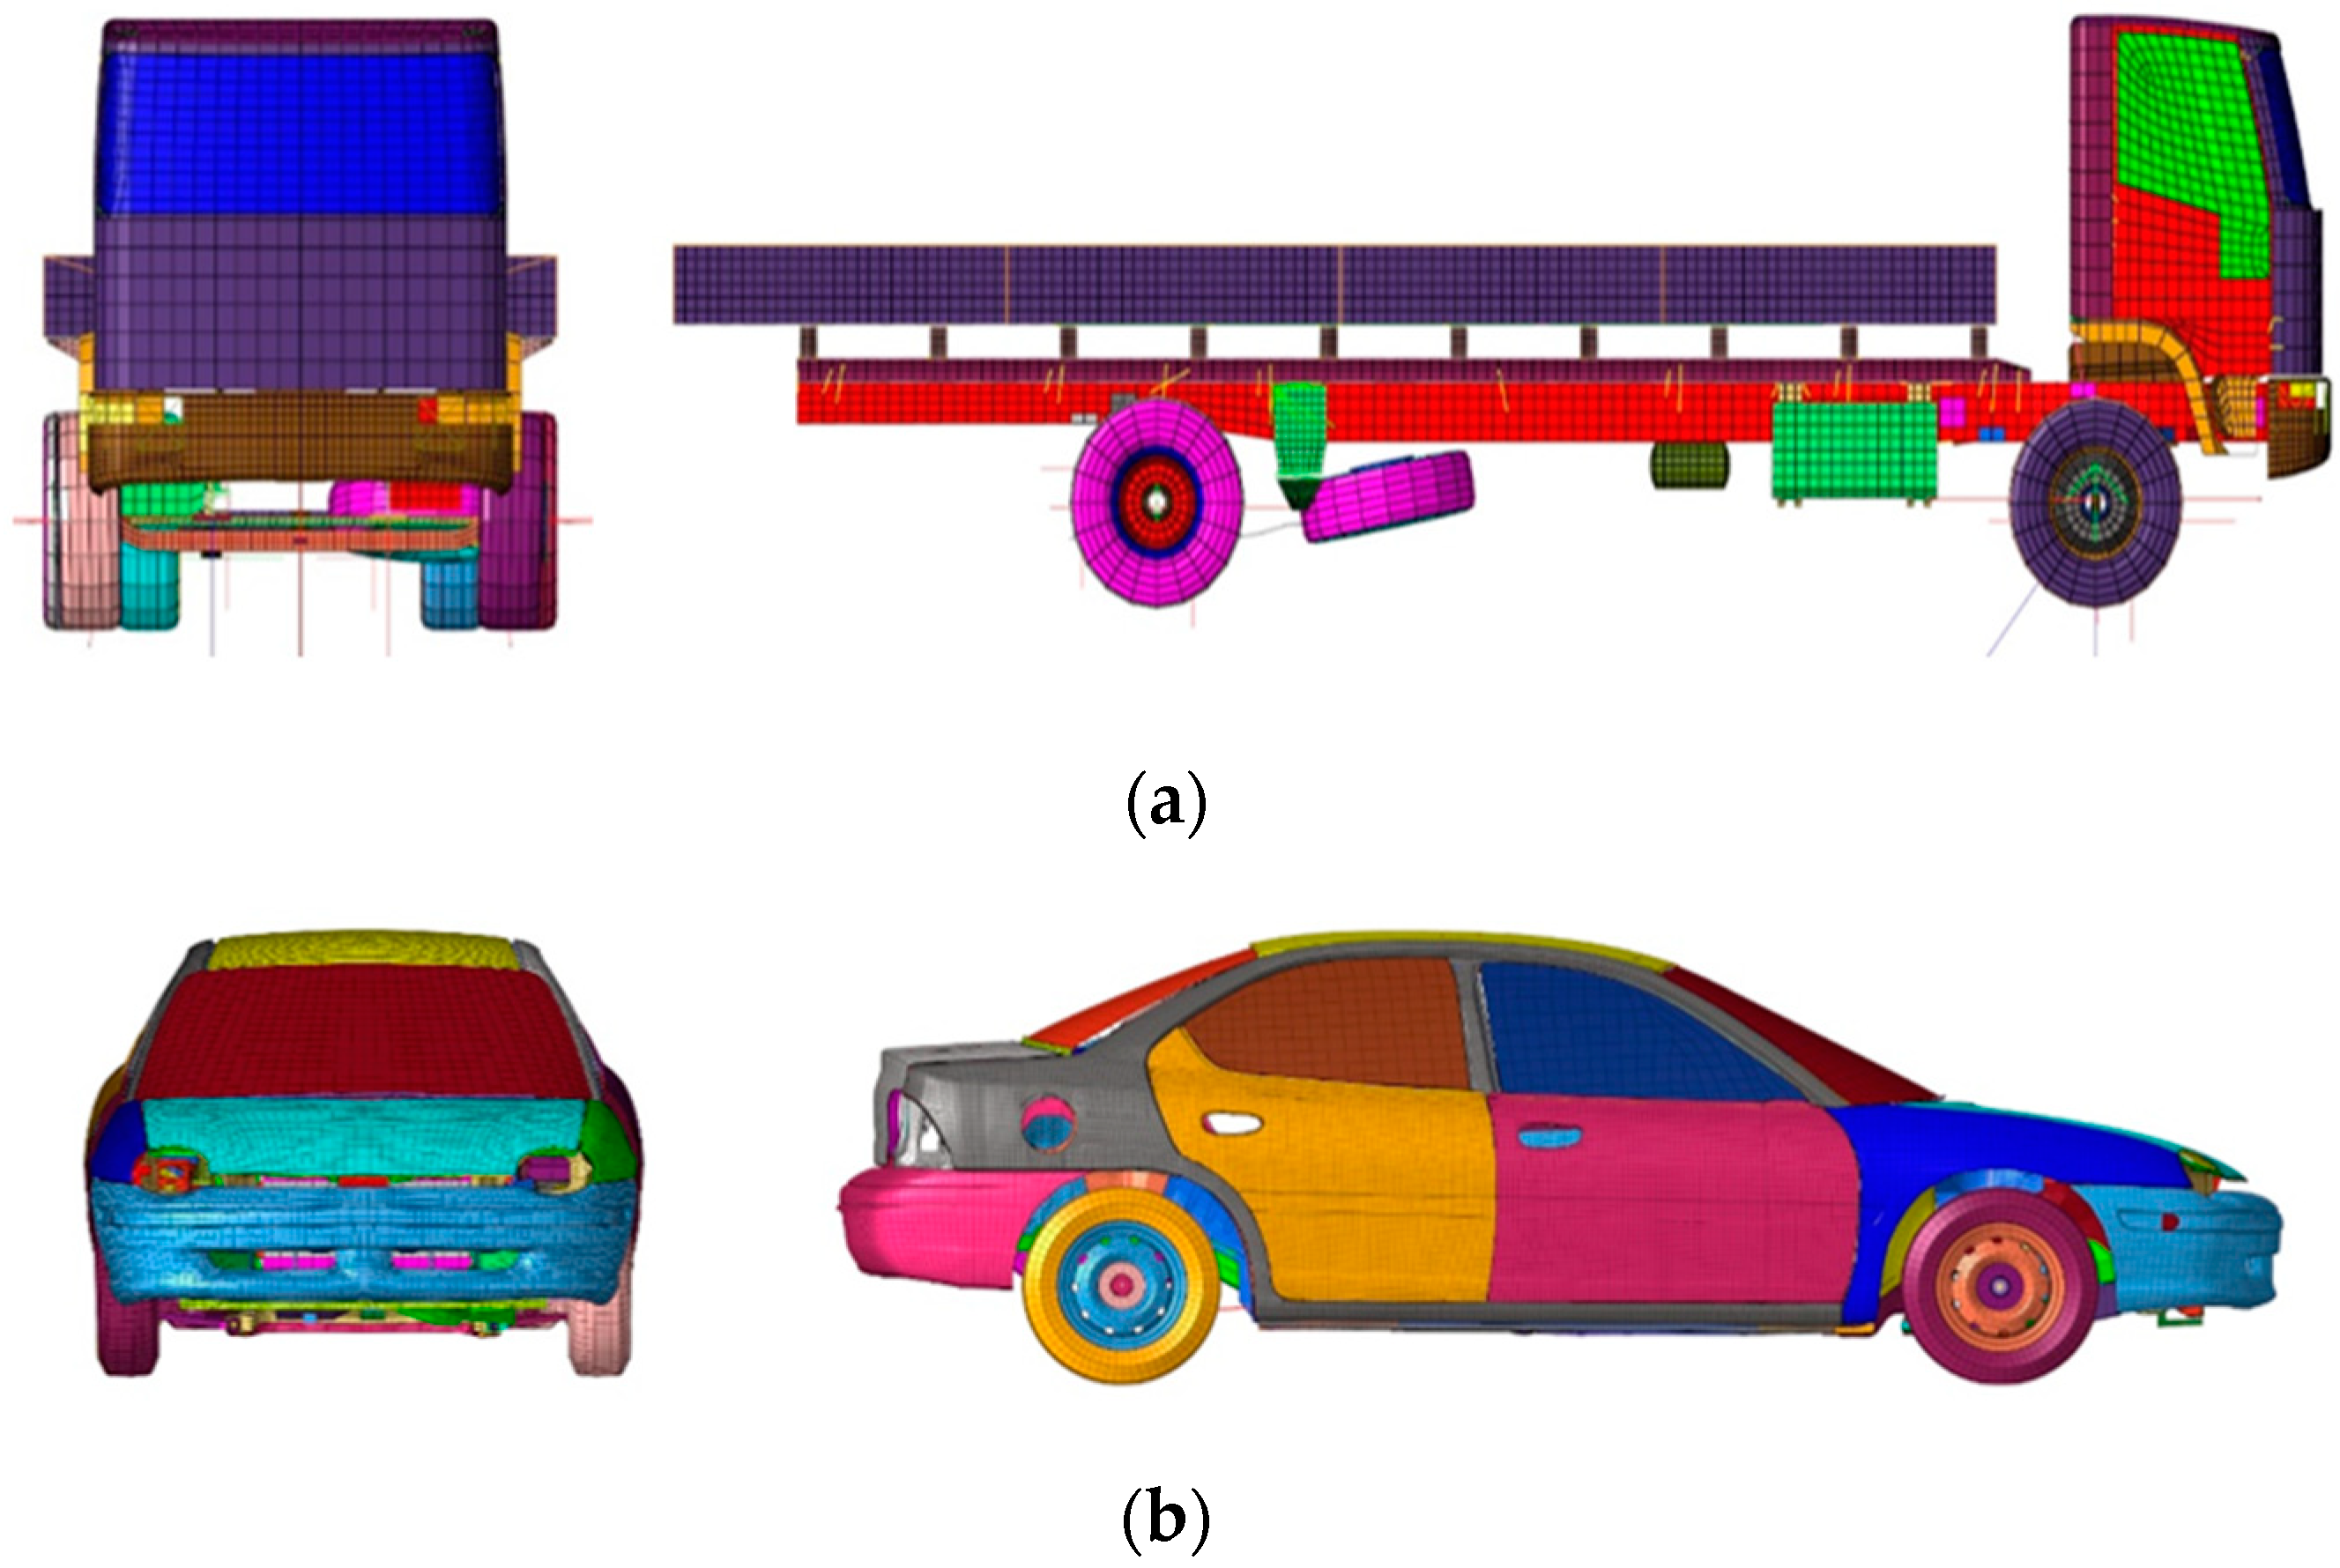
The performance of reinforced concrete barriers is evaluated from three perspectives: the strength performance of the reinforced concrete barrier, the assessment of occupant risk, and post-collision vehicle safety. For this purpose, two vehicle finite element models provided by the National Crash Analysis Center (NCAC) at George Washington University were used. These virtual models were specifically designed for evaluating barrier performance. The strength performance evaluation typically uses heavy trucks weighing between 8 t and 36 t, while the models for assessing occupant risk range from 0.9 t to 1.5 t in passenger cars. The reinforced concrete barrier considered in this study was designed as a rigid body, using a 16 t truck for the strength performance evaluation and a 0.9 t passenger car for occupant risk assessment [26,28]. Therefore, in this study, an analysis was performed on three reinforced concrete barriers using the 16 t truck and 0.9 t passenger car model. Figure 7a shows a truck model weighing 14 t, and Figure 7b shows a passenger car model weighing 0.9 t. Post-collision vehicle safety is evaluated for both vehicle types. As shown in Table 1, the impact conditions for each vehicle are presented, where the impact angle refers to the angle between the longitudinal direction of the barrier and the direction of the vehicle’s motion.

2.4. Material Models for Concrete and Reinforced Steel

In Case 1, since the concrete barrier is considered a rigid body, the rigid material model, Material Type 20 [33], provided by LS-DYNA is used. Although the elastic modulus of concrete needs to be input for this model, it is not because the concrete barrier is considered deformable, but rather to calculate the friction during the collision between the barrier and the vehicle. For Case 2 and Case 3, the Material 159 model [34] provided by LS-DYNA is used to represent the concrete damage behavior. A key feature of this model is the Continuous Surface Cap Model (CSCM), where the shear failure and compressive surface are “blended” to form a smooth or continuous surface. The material rate effect is modeled as visco-plasticity, and when the damage accumulation reaches unity, the element loses both strength and stiffness. An advantage of this model is that it is not sensitive to mesh size, maintaining consistent fracture energy regardless of element size [35]. To represent the interaction between the solid elements of the concrete and the beam elements of the reinforcement, the Constrained_Beam_In_Solid (CBIS) option is used. Table 2 shows the material properties of concrete and reinforcement.

2.5. Overview of the Research Methodology

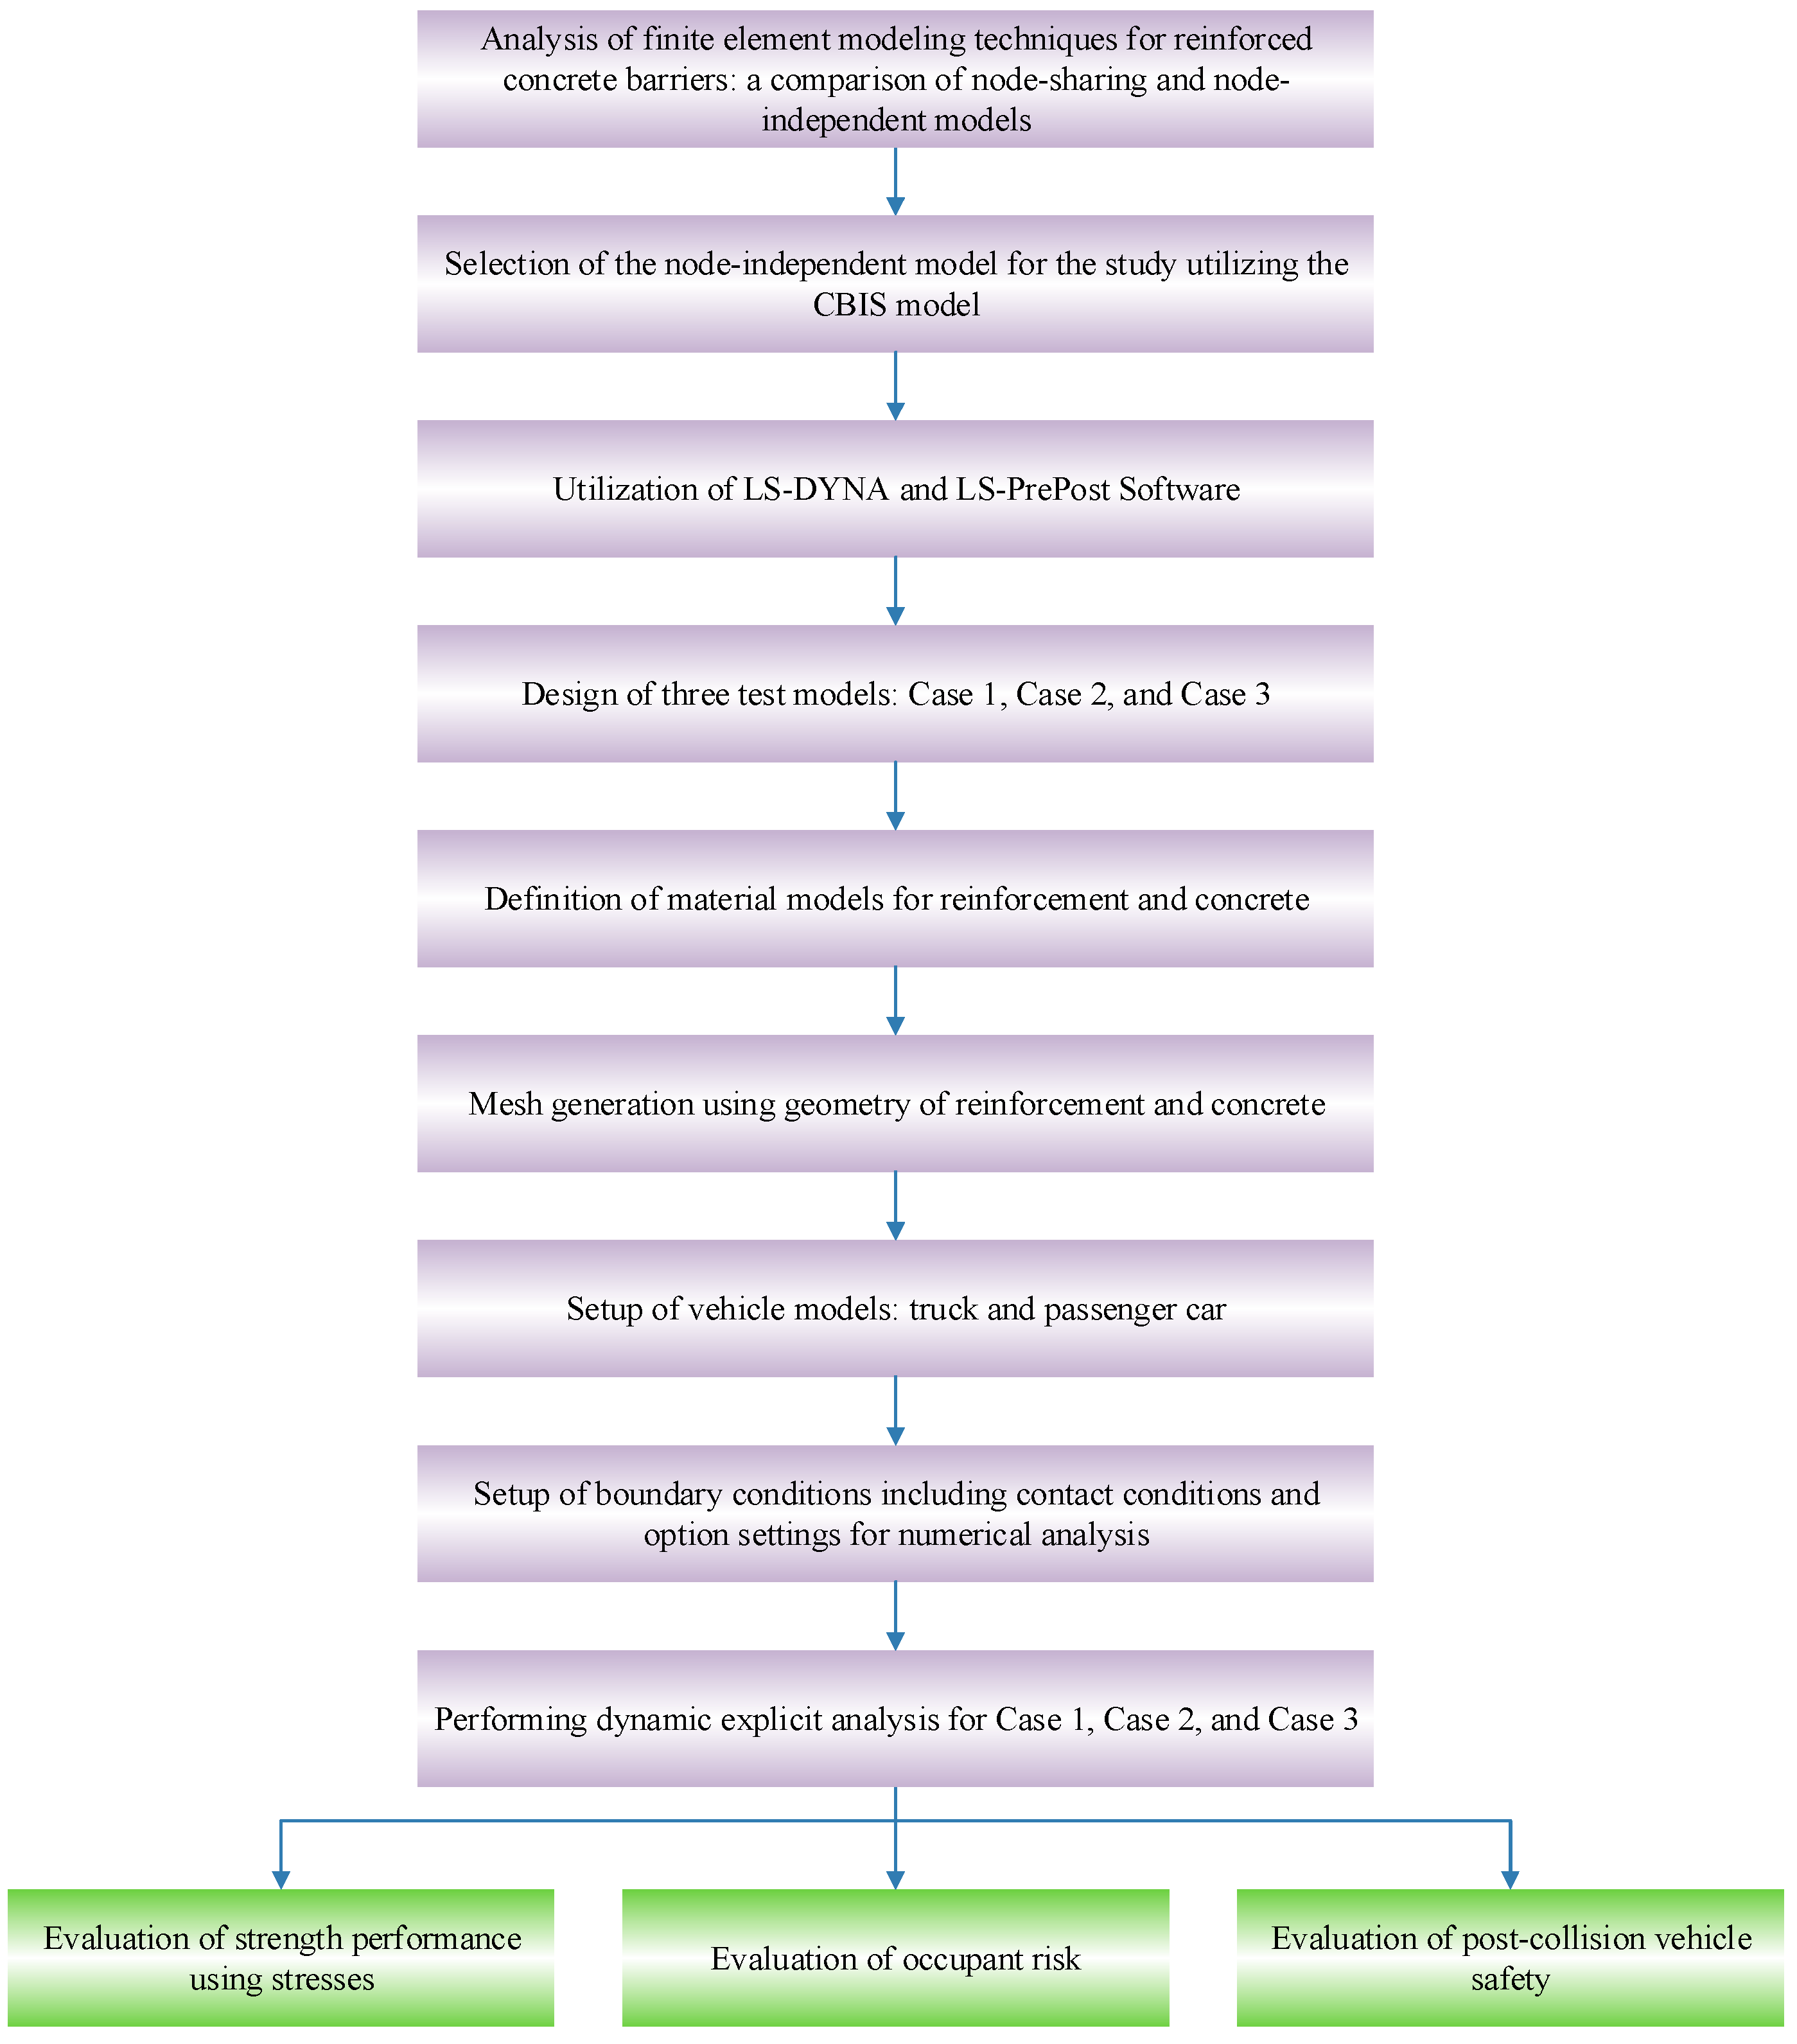
The methodology of this study comprises a systematic series of steps aimed at analyzing finite element modeling techniques for reinforced concrete structures and evaluating various scenarios based on these techniques. Each step is structured as illustrated in Figure 8. Through this systematic approach, this study comprehensively evaluates the performance and safety of reinforced concrete barriers installed on bridges.

3. Results

3.1. Evaluation of Strength Performance

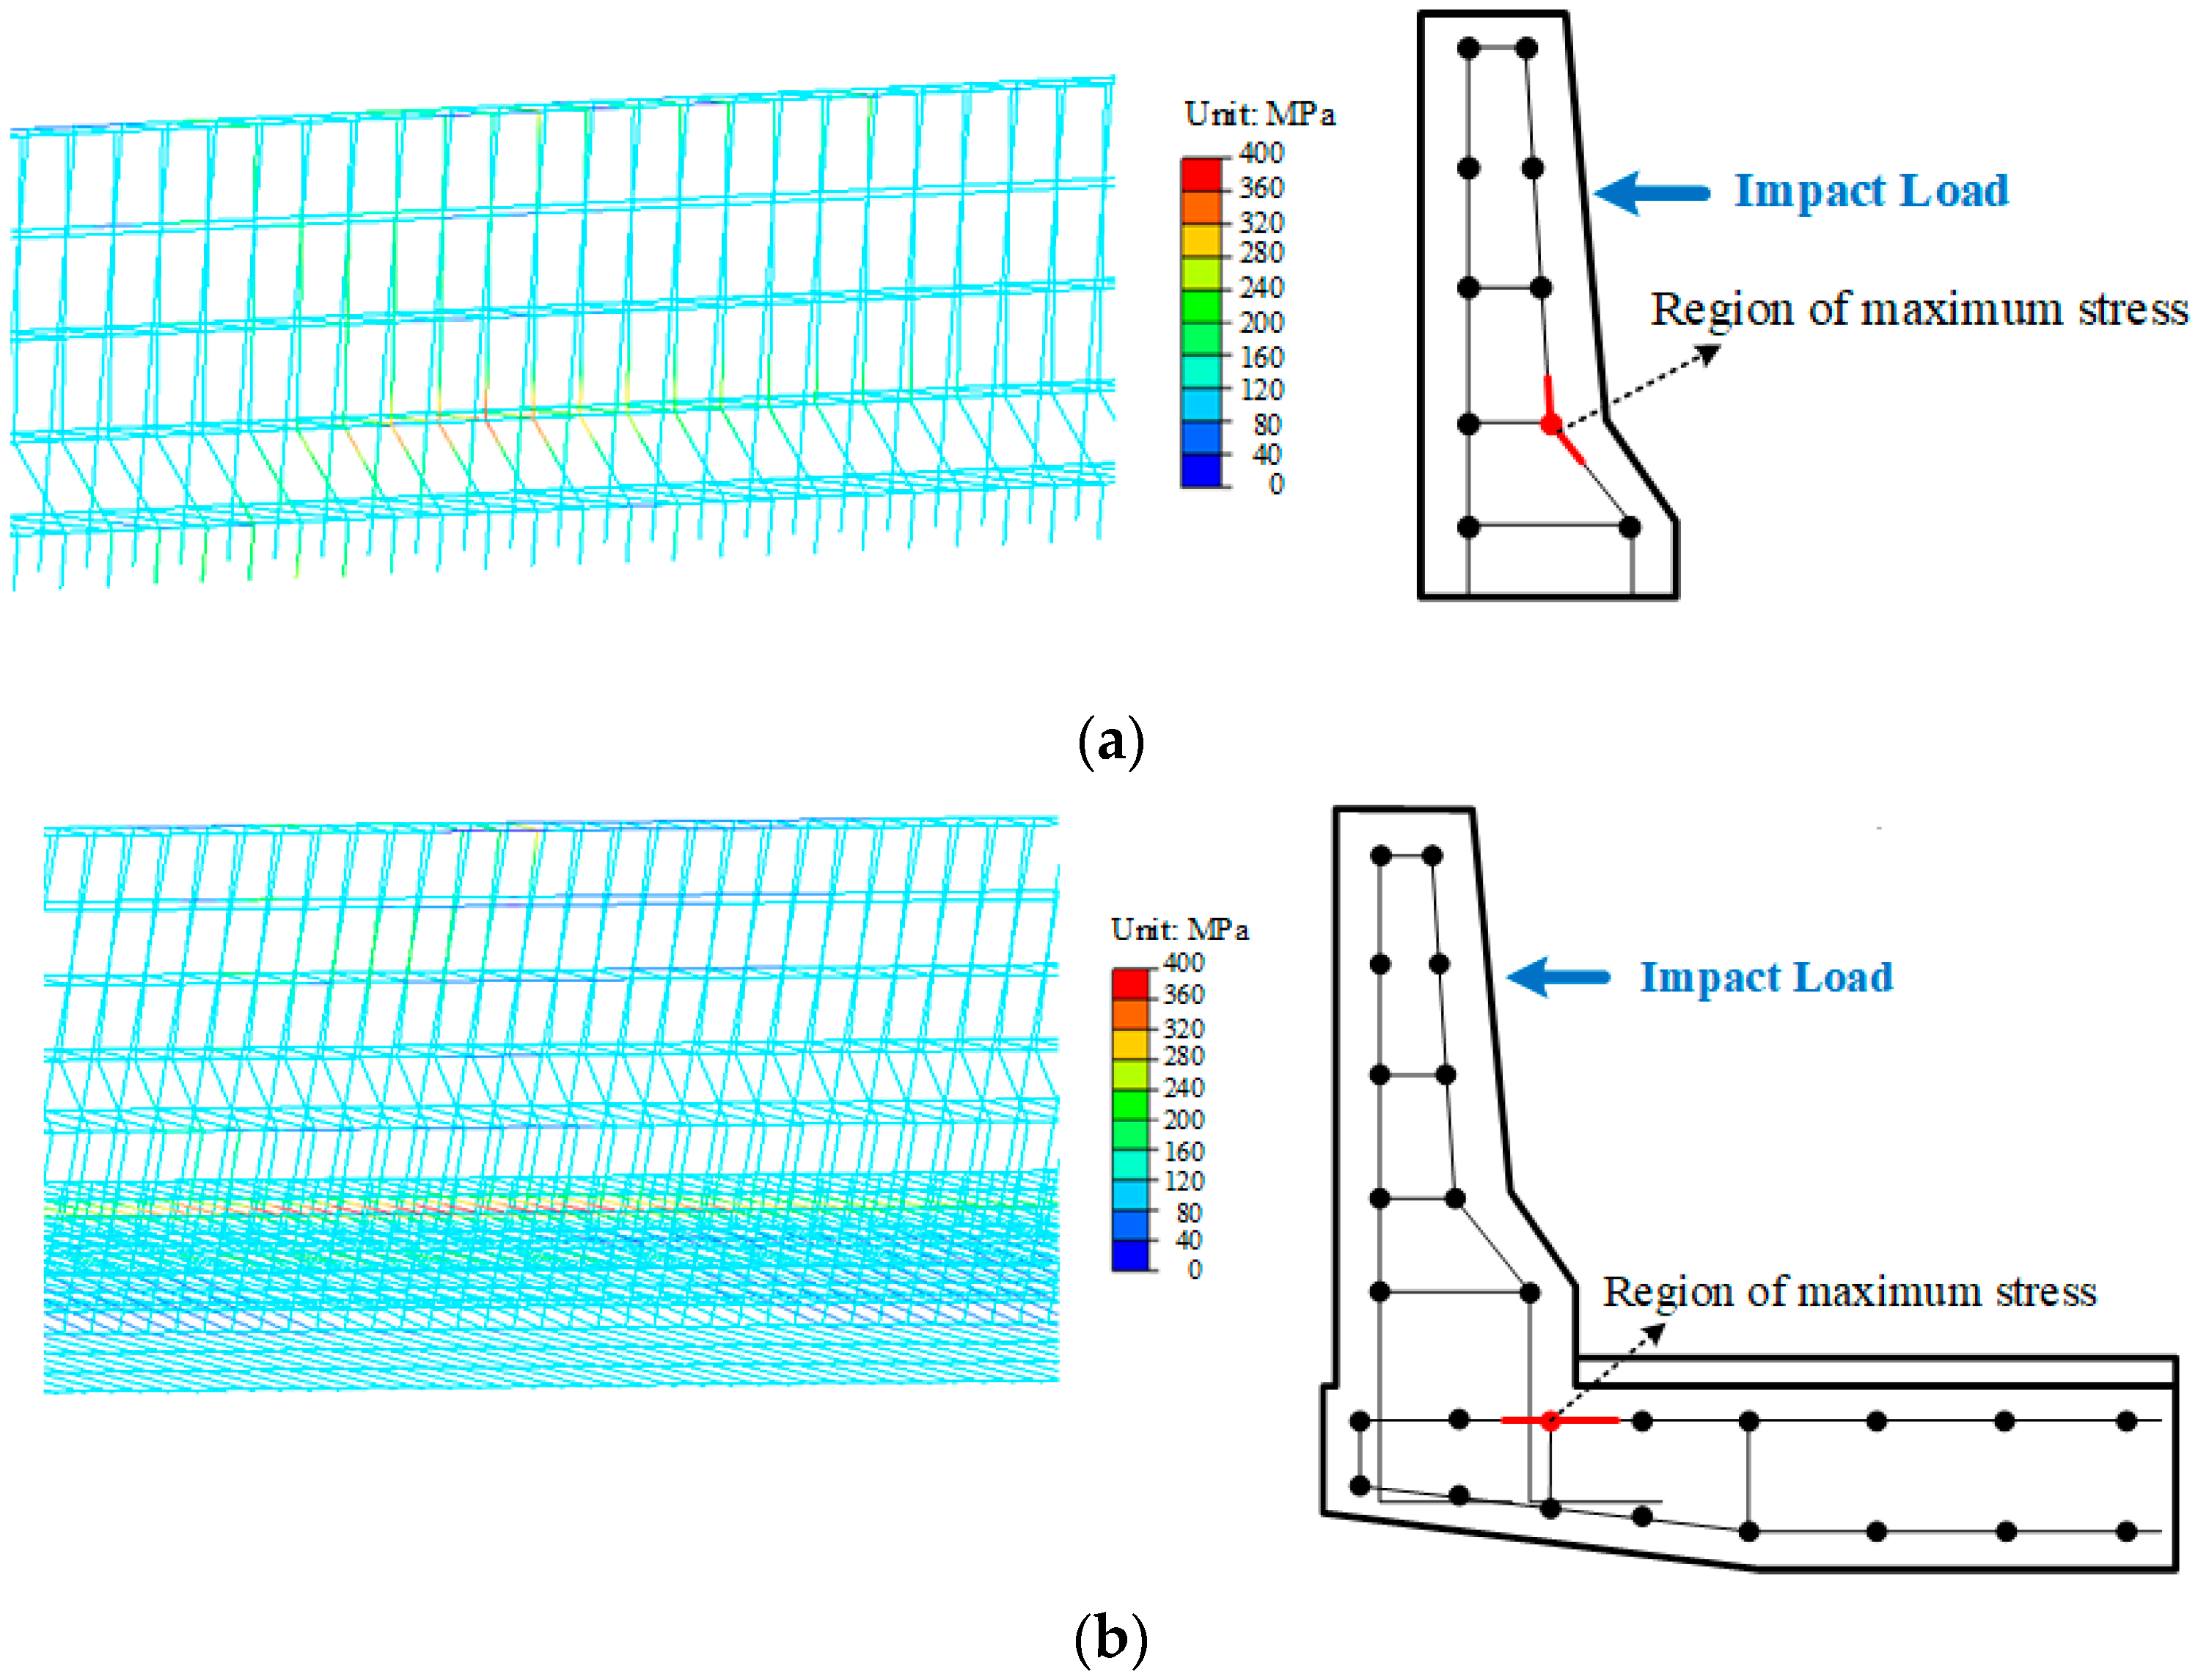
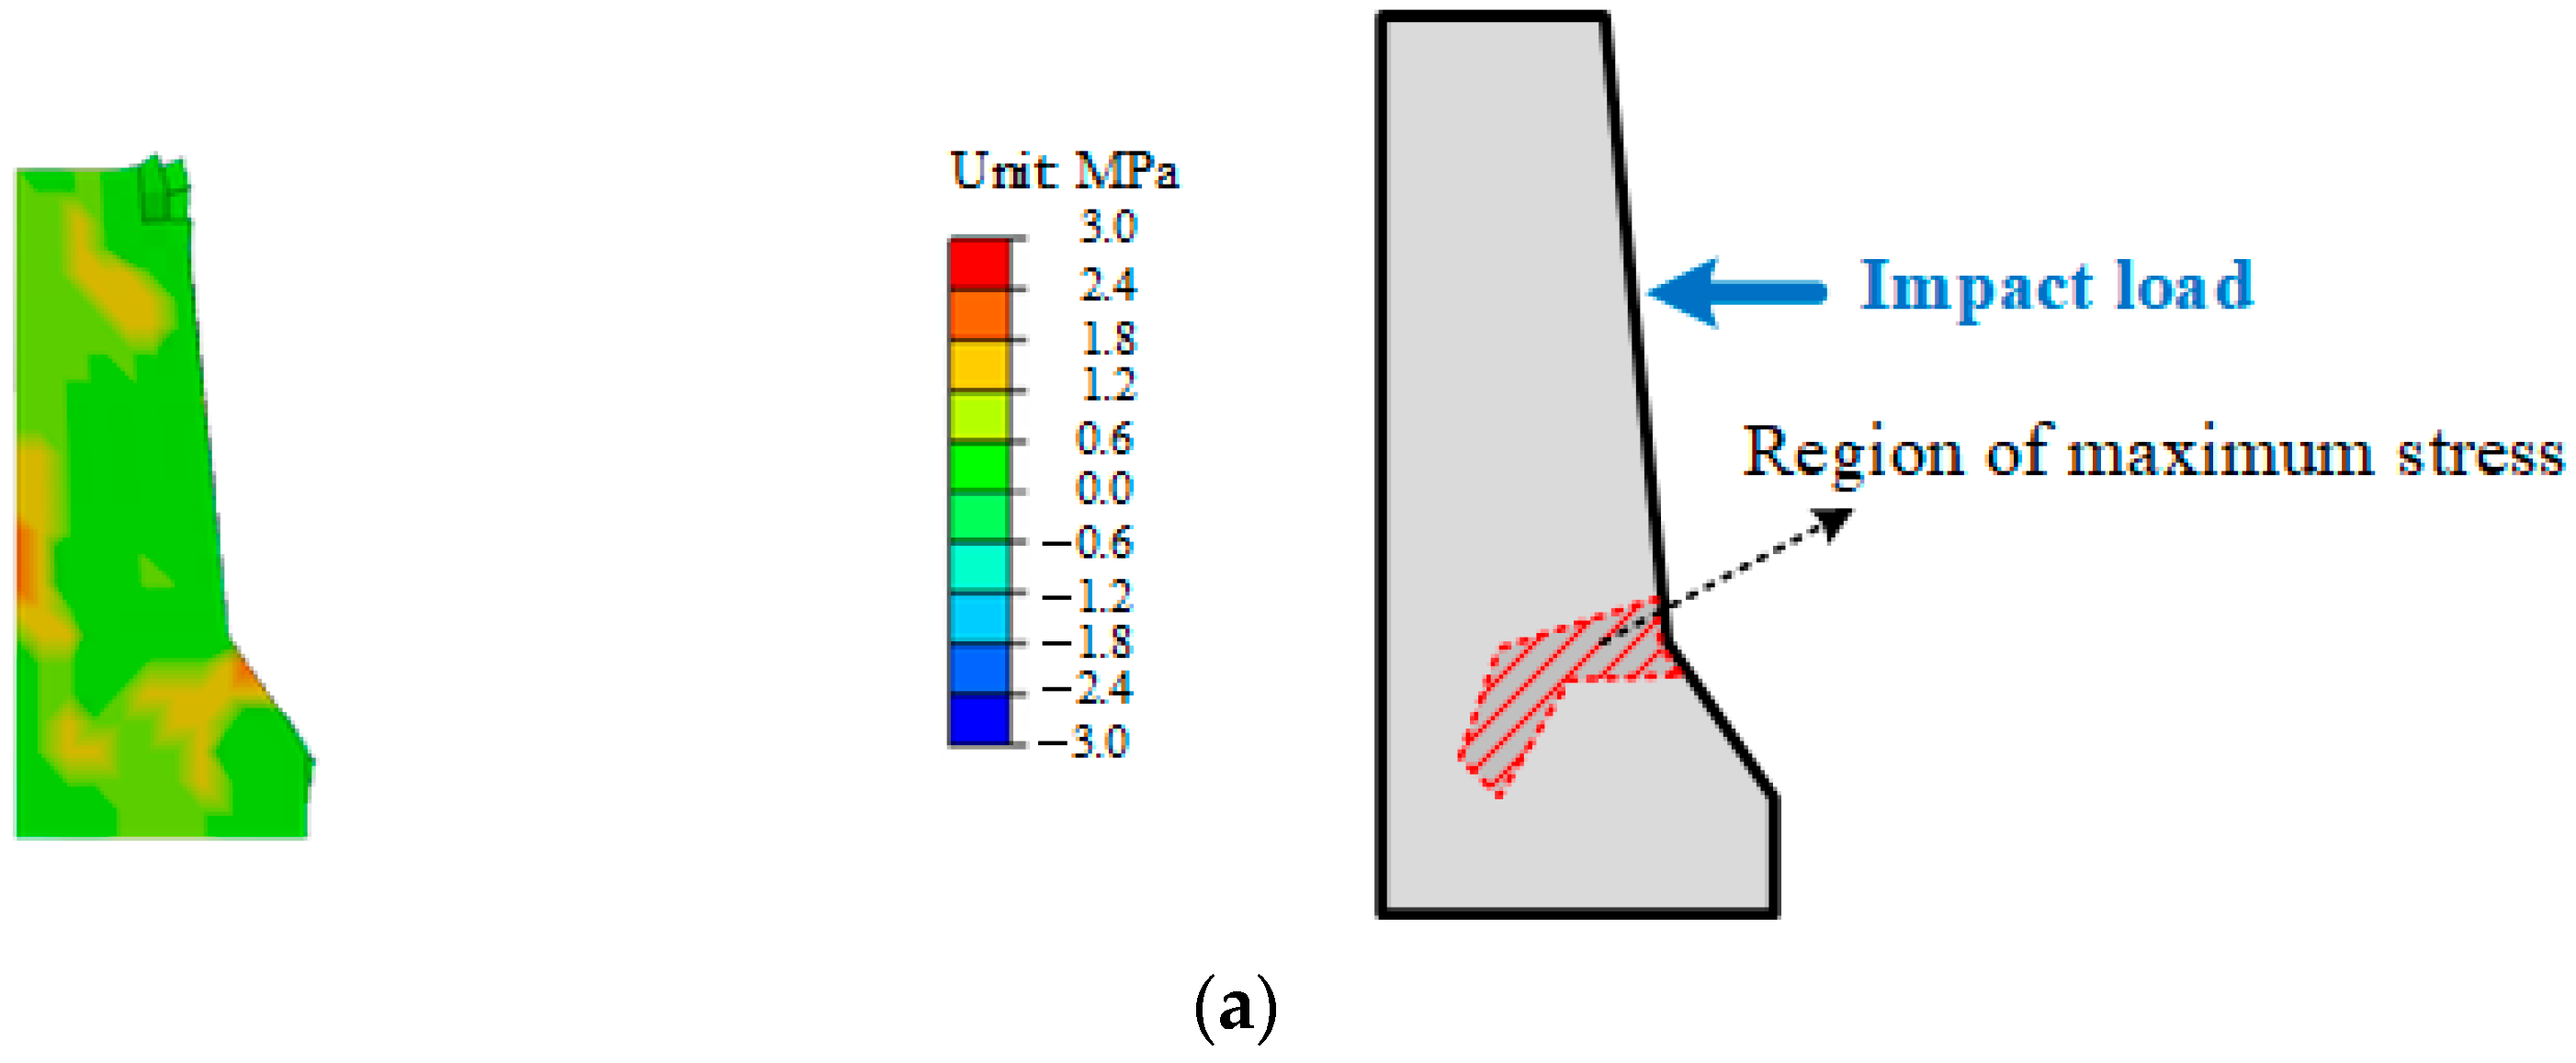
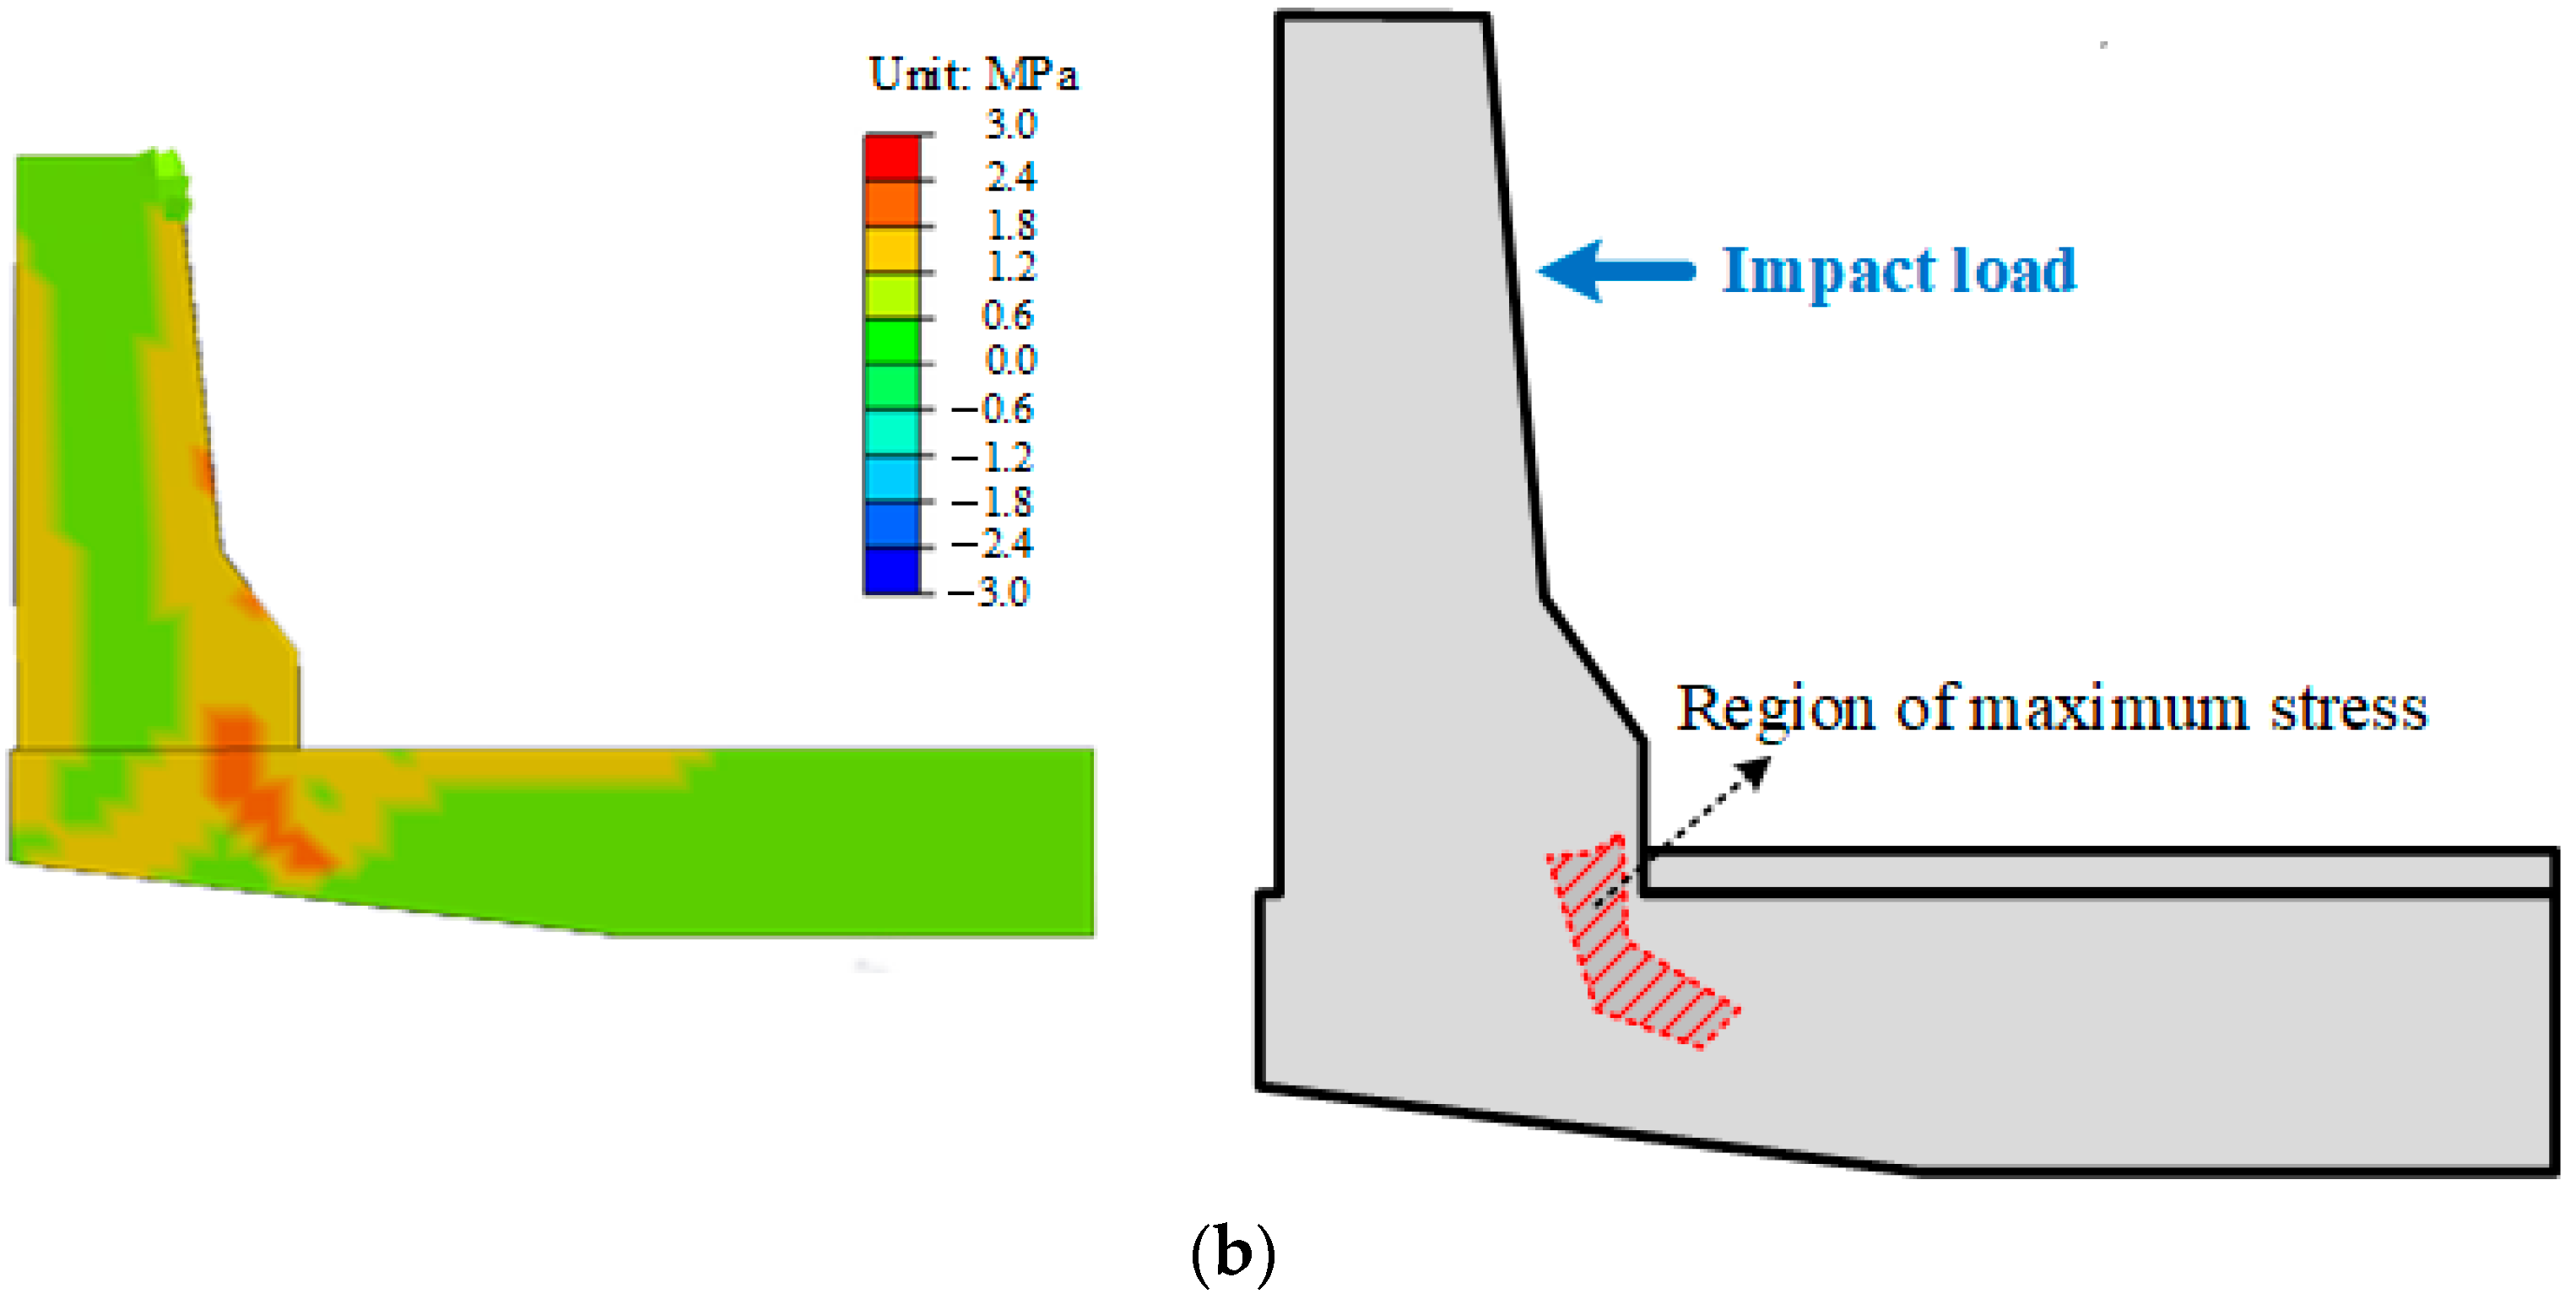
In evaluating the strength performance of the barriers, only the results from Case 2 and Case 3, where a truck collision is simulated, are considered. Case 1 is excluded because it assumes the concrete barrier as a rigid body, resulting in no stress or deformation in the analysis. In Case 2 and Case 3, the von Mises stress in the steel reinforcement and the maximum principal stress in the concrete are compared. Figure 9 shows the von Mises stress distribution in the steel reinforcement. In Case 2, the maximum von Mises stress is 382 MPa, occurring on the inclined surface of the concrete barrier. In contrast, in Case 3, the maximum von Mises stress appears in the deck reinforcement with a value of 399 MPa. It is also observed that the locations of maximum von Mises stress differ between Case 2 and Case 3, with the stress distribution being more extensive along the length of the barrier in Case 3. Figure 10 illustrates the maximum principal stress in the concrete. In Case 2, the maximum principal stress is approximately 2 MPa, occurring diagonally at the point where the angle of the inclined surface changes, and at the junction between the concrete barrier and the bridge deck.

3.2. Evaluation of Occupant Risk

To assess occupant risk for the reinforced concrete barrier, a passenger car was used as the collision vehicle to obtain THIV (Theoretical Head Impact Velocity) and PHD (Post-impact Head Deceleration) values. When evaluating the risk to occupants after a vehicle collision with a barrier, both THIV and PHD are considered because they complement each other. THIV indicates the intensity of the initial impact on the occupant’s head during the collision, while PHD relates to the sustained force on the head afterward. By assessing both factors, one can evaluate the initial impact and subsequent deceleration process comprehensively, leading to a better understanding of the potential risks to occupants and informing barrier design. The collision event lasted approximately 0.2 s, after which the vehicle returned to its original lane. For the THIV calculation, the moment of collision was set as time zero, and data collected from 0 to 0.2 s were used. The maximum THIV value within this interval was used for evaluation. Figure 11 shows the THIV values over time for each case, with the maximum value between 0 and 0.2 s being designated as the THIV value. Case 1 recorded 33.0 km/h, Case 2 recorded 30.6 km/h, and Case 3 recorded 27.8 km/h. Case 1 had a THIV that was 8% higher than that of Case 2, and that of Case 3 was 9% lower. Similarly, PHD values were calculated over the same time interval, and Figure 12 illustrates the changes in PHD values over time. For evaluation purposes, the maximum values were used: Case 1 reached 19.7 g, Case 2 reached 17.4 g, and Case 3 reached 16.4 g, with g representing the gravitational acceleration of 9.8 m/s2. The PHD of Case 1 was approximately 13% higher than that of Case 2, while that of Case 3 was 6% lower. It was observed that the THIV values showed little change near their maximum after approximately 0.1 s post-collision, whereas PHD values reached their maximum between the collision and 0.06 s, subsequently converging towards zero. Figure 11 and Figure 12 show fluctuations in values because, during a collision, multiple parts of the vehicle impact over a very short period rather than at a single point. The vehicle model consists of hundreds of material models, which can result in varying levels of energy absorption depending on the collision. These processes are reflected in the changes in THIV and PHD values over time. Case 1 shows a greater range of value changes compared to Cases 2 and 3 due to its lower flexibility. Consequently, the maximum value is also the largest. Around 0.1 s in Figure 12, the higher values for Case 1 compared to the other cases may be attributed to more severe damage to its bumper in a previous collision, resulting in greater force exerted on the occupant as the vehicle impacts other components.

3.3. Evaluation of Post-Collision Vehicle Safety

To verify the stable behavior of vehicles after a collision, the trajectories of the truck and passenger car before and after the collision were examined. Figure 13 shows the vehicle trajectories before and after the collision with the barrier for Case 1, Case 2, and Case 3, indicating that in all cases, the vehicles return to their original lanes after 0.8 s. Similarly, Figure 14 illustrates the vehicle trajectories for the passenger car in Case 1, Case 2, and Case 3, showing that the vehicles return to their original lanes after 0.3 s. In terms of post-collision stability evaluation for both the truck and the passenger car, there are no significant differences among the three models.

4. Discussion

The node-sharing model has a slight advantage in terms of computation time compared to the node-independent model, as it does not require additional constraint equations related to the interaction between concrete and reinforcement. However, for the node-sharing model, as the complexity of the system’s geometry to be analyzed increases, the time required for the preprocessing phase can significantly increase. Additionally, using the node-sharing model can lead to poor aspect ratios of solid elements, which negatively affect the accuracy and reliability of numerical analysis results. In other words, as the nonlinearity and complexity of the geometry represented in the system increase, the complexity of modeling and the magnitude of increase in analysis time can also become greater. Therefore, while the computation time for the node-independent model may slightly increase, using the node-independent model for the impact analysis of reinforced concrete barriers can avoid the major issues associated with the node-sharing model. The node-independent model adopted in this study provides a simplified modeling approach for actual reinforced concrete barriers.
Next, the strength performance of the reinforced concrete barrier was evaluated by comparing scenarios with and without the bridge deck. Due to the differing material properties of reinforced concrete structures, distinct criteria are needed to assess stresses in the steel reinforcement and the concrete. For steel reinforcement, von Mises stress is applied to predict yielding under multiaxial stress conditions in ductile materials. This approach provides a scalar value indicating potential yielding under complex loading conditions. Excluding the bridge deck, the stress reached 382 MPa, and with the deck, it reached 399 MPa, approaching the yield stress of 400 MPa. Consequently, some reinforcement may yield as a result of the collision. Notably, the yielding location varied: without the bridge deck, yielding occurred in the sloped section at the barrier’s lower part, whereas with the deck, significant stress was observed at the connection between the barrier and the deck. Additionally, considering the bridge deck resulted in significant stress at the connection and larger stresses over an extended area along the barrier’s length. Concrete, being inherently brittle, shows reduced strength under axial stress. Therefore, the maximum principal stress was evaluated against the compressive strength of 35 MPa to verify any exceedance. In both scenarios, the maximum principal stress was approximately 2 MPa, indicating no significant difference in concrete strength evaluation between the models.
Passenger impact severity was evaluated using a passenger car as the impact vehicle, with THIV and PHD serving as indicators. THIV is calculated as the instantaneous relative velocity between the vehicle and the passenger’s head during the collision with the barrier, causing the head to impact an imaginary surface freely within the vehicle’s interior. This indicator assesses the impact energy received during the collision, predicts the severity of head injuries, and indicates potential passenger injury levels. PHD is based on the assumption that after the passenger’s head impacts an imaginary surface within the vehicle’s interior, it directly experiences the vehicle’s deceleration. It is calculated as the maximum average deceleration over 10 milliseconds. This indicator plays a crucial role in assessing head and neck injury risks and verifying the effectiveness of vehicle safety devices. In the Republic of Korea, the allowable standard for THIV is 33 km/h or less, and for PHD, it is 20 g or less [26]. The values for a rigid model are 33.0 km/h and 19.7 g, respectively; for a deformable model without the bridge deck, they are 30.6 km/h and 17.4 g; and for a deformable model with the bridge deck, they are 27.8 km/h and 16.4 g. This suggests that rigid body modeling may lead to a more conservative assessment of passenger impact severity, which could be less economically advantageous, while including the bridge deck might allow for a more economical design.
In terms of vehicle movement post-collision, when a vehicle collides with a barrier, the movement of the colliding vehicle can affect following vehicles depending on the distance between them and the available lateral space for avoidance. In such cases, the colliding vehicle should not abruptly stop or overturn and must remain on the roadway. Additionally, the vehicle’s center of gravity should not cross the centerline of the deformed barrier. It should change direction smoothly without significant snagging, minimizing impact on oncoming or parallel vehicles. All three models showed similar results in terms of vehicle safety. This suggests that assuming the barrier as a rigid body without considering the bridge deck and treating the barrier foundation as a fixed point may be a more efficient and practical modeling approach than conducting complex modeling analyses when verifying vehicle stability before and after collisions.
One limitation of this study is that the evaluation was based on the standard cross-section of the SB 5 grade reinforced concrete barrier proposed by the Korea Expressway Corporation. Since vehicle barriers installed on bridges come in various grades, further studies on different barrier grades are necessary to substantiate the results of this research. Additionally, to ensure passenger safety, further research is required to consider various parameters, such as the direction and magnitude of impact loads.

5. Conclusions

The conclusion of this study can be summarized in the following key points:
  • This study demonstrates that utilizing a node-independent model for collision analysis of reinforced concrete barriers effectively eliminates the need for node sharing, reducing the time and complexity involved in the modeling process.
  • The strength performance comparison between steel reinforcement and concrete revealed differences based on the presence of the bridge deck. Higher stress occurs over a larger area when the bridge deck is included, which is crucial for considering economic efficiency in the design process.
  • The assessment of passenger impact severity using THIV and PHD indicators showed that the deformable model with the bridge deck provides more favorable results in terms of passenger safety. This suggests that including the bridge deck in the design may be more advantageous, particularly from an economic standpoint.
  • In terms of vehicle stability post-collision, all three models produced similar results. This indicates that an approach assuming the barrier as a rigid body without considering the bridge deck and treating the barrier foundation as a fixed point may be practical. It suggests the potential to efficiently verify vehicle stability without complex modeling analyses.
  • These findings provide important guidelines for the design and evaluation of reinforced concrete barriers. Future research should include additional experiments and analyses under various conditions to further validate these results.

Author Contributions

J.J.K.: analysis and review; J.S.A.: analysis, writing—review and editing. All authors have read and agreed to the published version of the manuscript.

Funding

This research was funded by the Basic Science Research Program through the National Research Foundation of Korea, NRF-2020R1I1A3061349.

Institutional Review Board Statement

Not applicable.

Informed Consent Statement

Not applicable.

Data Availability Statement

The data presented in this study are available on request from the corresponding author. The data are not publicly available due to privacy.

Conflicts of Interest

Author Jeong J. Kim was employed by the company Korea National Railway. The remaining authors declare that the research was conducted in the absence of commercial or financial relationships that could be construed as a potential conflict of interest.

References

  1. Xu, X.; Zhang, H.; Du, X.; Liu, Q. Vehicle Collision with RC Structures: A State-of-the-Art Review. Structures 2022, 44, 1617–1635. [Google Scholar] [CrossRef]
  2. Cao, R.; Agrawal, A.K.; El-Tawil, S.; Wong, W. Numerical Studies on Concrete Barriers Subject to MASH Truck Impact. J. Bridge Eng. 2020, 25, 04020035. [Google Scholar] [CrossRef]
  3. Cao, R.; Agrawal, A.K.; El-Tawil, S.; Wong, W. Performance-based design framework for concrete barriers subjected to truck collision. J. Bridge Eng. 2021, 26, 04021047. [Google Scholar] [CrossRef]
  4. Zhao, L.; Karbhari, V.M.; Hegemier, G.A.; Seible, F. Connection of Concrete Barrier Rails to FRP Bridge Decks. Compos. Part B Eng. 2004, 35, 269–278. [Google Scholar] [CrossRef]
  5. Namy, M.; Charron, J.P.; Massicotte, B. Structural Behavior of Bridge Decks with Cast-in-Place and Precast Concrete Barriers: Numerical Modeling. J. Bridge Eng. 2015, 20, 04015014. [Google Scholar] [CrossRef]
  6. Sennah, K.; Khederzadeh, H.R. Development of Cost-Effective PL-3 Concrete Bridge Barrier Reinforced with Sand-Coated Glass Fibre Reinforced Polymer (GFRP) Bars: Vehicle Crash Test. Can. J. Civ. Eng. 2014, 41, 357–367. [Google Scholar] [CrossRef]
  7. Neves, R.R.; Fransplass, H.; Langseth, M.; Driemeier, L.; Alves, M. Performance of Some Basic Types of Road Barriers Subjected to the Collision of a Light Vehicle. J. Braz. Soc. Mech. Sci. Eng. 2018, 40, 274. [Google Scholar] [CrossRef]
  8. Raj, A.; Nagarajan, P.; Aikot Pallikkara, S. Application of Fiber-Reinforced Rubcrete for Crash Barriers. J. Mater. Civ. Eng. 2020, 32, 04020358. [Google Scholar] [CrossRef]
  9. Wang, S.; Lei, Z.; Zhao, J.; Li, Y.; Lei, M.; Liu, Y. A Research of Similarity Design of Collision Guardrails under the Overpass. In Proceedings of the 2011 Second International Conference on Mechanic Automation and Control Engineering, Hohhot, China, 15–17 July 2011; IEEE: Piscataway, NJ, USA, 2011; pp. 1903–1906. [Google Scholar] [CrossRef]
  10. Trajkovski, J.; Ambrož, M.; Kunc, R. The Importance of Friction Coefficient between Vehicle Tyres and Concrete Safety Barrier to Vehicle Rollover: FE Analysis Study. Stroj. Vestn. 2018, 64, 753–762. [Google Scholar] [CrossRef]
  11. Yang, J.; Xu, G.; Cai, C.S.; Kareem, A. Crash Performance Evaluation of a New Movable Median Guardrail on Highways. Eng. Struct. 2019, 182, 459–472. [Google Scholar] [CrossRef]
  12. Heng, K.; Li, R.; Li, Z.; Wu, H. Dynamic Responses of Highway Bridge Subjected to Heavy Truck Impact. Eng. Struct. 2021, 232, 111828. [Google Scholar] [CrossRef]
  13. Karunarathna, S.; Linforth, S.; Kashani, A.; Liu, X.; Ngo, T. Numerical Investigation on the Behaviour of Concrete Barriers Subjected to Vehicle Impacts Using Modified K&C Material Model. Eng. Struct. 2024, 308, 117943. [Google Scholar] [CrossRef]
  14. Pan, L.; Hao, H.; Cui, J.; Pham, T.M. Numerical Study on Impact Resistance of Rubberised Concrete Roadside Barrier. Adv. Struct. Eng. 2023, 26, 17–35. [Google Scholar] [CrossRef]
  15. Kotsovos, M.D. Finite-Element Modelling of Structural Concrete: Short-Term Static and Dynamic Loading Conditions; CRC Press: Boca Raton, FL, USA, 2015. [Google Scholar]
  16. Mergos, P.E.; Kappos, A.J. A Distributed Shear and Flexural Flexibility Model with Shear-Flexure Interaction for R/C Members Subjected to Seismic Loading. Earthq. Eng. Struct. Dyn. 2008, 37, 1349–1370. [Google Scholar] [CrossRef]
  17. Saritas, A.; Filippou, F.C. Numerical Integration of a Class of 3D Plastic-Damage Concrete Models and Condensation of 3D Stress–Strain Relations for Use in Beam Finite Elements. Eng. Struct. 2009, 31, 2327–2336. [Google Scholar] [CrossRef]
  18. Kwak, H.G.; Kim, D.Y. Cracking Behavior of RC Panels Subject to Biaxial Tensile Stresses. Comput. Struct. 2006, 84, 305–317. [Google Scholar] [CrossRef]
  19. Ahn, J.S.; Woo, K.S.; Basu, P.K.; Park, J.H. p-Version Nonlinear Analysis of RC Beams and Slabs Strengthened with Externally Bonded Plates. Finite Elem. Anal. Des. 2006, 42, 726–739. [Google Scholar] [CrossRef]
  20. Papanikolaou, V.K.; Kappos, A.J. Numerical Study of Confinement Effectiveness in Solid and Hollow Reinforced Concrete Bridge Piers: Analysis Results and Discussion. Comput. Struct. 2009, 87, 1440–1450. [Google Scholar] [CrossRef]
  21. Mourlas, C.; Markou, G.; Papadrakakis, M. Accurate and Computationally Efficient Nonlinear Static and Dynamic Analysis of Reinforced Concrete Structures Considering Damage Factors. Eng. Struct. 2019, 178, 258–285. [Google Scholar] [CrossRef]
  22. Jawdhari, A.; Harik, I. Finite Element Analysis of RC Beams Strengthened in Flexure with CFRP Rod Panels. Constr. Build. Mater. 2018, 163, 751–766. [Google Scholar] [CrossRef]
  23. Cusson, D.; Repette, W.L. Early-Age Cracking in Reconstructed Concrete Bridge Barrier Walls. ACI Mater. J. 2000, 97, 438–446. [Google Scholar] [CrossRef]
  24. Chen, H. An Introduction to CONSTRAINED_BEAM_IN_SOLID. FEA Inf. 2016, 5, 79–83. Available online: https://ftp.lstc.com/anonymous/outgoing/hao/cbis/tutorials/CBIS1.pdf (accessed on 1 September 2024).
  25. Pena, O.; Faller, R.K.; Rasmussen, J.D.; Steelman, J.S.; Rosenbaugh, S.K.; Bielenberg, R.W.; Duren, J.T. Development of a MASH Test Level 4 Steel, Side-Mounted, Beam-and-Post, Bridge Rail; Report No. TRP-03-410-20; Nebraska Transportation Center: Lincoln, NE, USA, 2020. Available online: https://rosap.ntl.bts.gov/view/dot/58330 (accessed on 1 September 2024).
  26. Ministry of Land, Infrastructure and Transport of the Republic of Korea. Guidelines for Installation and Management of Road Safety Facilities—Vehicle Protection Safety Facilities Section. 2022. Available online: https://www.law.go.kr (accessed on 15 August 2024). (In Korean)
  27. Hayashi, S.; Chen, H.; Hu, W. Compression Molding Analysis of Long Fiber Reinforced Plastics Using Coupled Method of Beam and 3D Adaptive EFG in LS-DYNA. In Proceedings of the 11th European LS-DYNA Conference, Salzburg, Austria, 9–11 May 2017; Available online: https://ftp.lstc.com/anonymous/outgoing/hao/cbis/tutorials/01_Hayashi_JSOL.pdf (accessed on 15 August 2024).
  28. Korea Expressway Corporation. Standard Drawings for Highway Construction; Publication No. AN01145-000132-10; Korea Expressway Corporation: Gimcheon-si, Republic of Korea, 2019. (In Korean) [Google Scholar]
  29. LSTC. LS-PrePost User’s Manual; Version 4.8; Livermore Software Technology Corporation: Livermore, CA, USA, 2023. [Google Scholar]
  30. Yang, S.H.; Woo, K.S.; Kim, J.J.; Ahn, J.S. Finite Element Analysis of RC Beams by the Discrete Model and CBIS Model Using LS-DYNA. Adv. Civ. Eng. 2021, 2021, 8857491. [Google Scholar] [CrossRef]
  31. Li, N.; Fang, H.; Zhang, C.; Gutowski, M.; Palta, E.; Wang, Q. A Numerical Study of Occupant Responses and Injuries in Vehicular Crashes into Roadside Barriers Based on Finite Element Simulations. Adv. Eng. Softw. 2015, 90, 22–40. [Google Scholar] [CrossRef]
  32. Esfahani, E.S.; Marzougui, D.; Opiela, K.S. Safety Performance of Concrete Median Barriers Under Updated Crashworthiness Criteria; No. NCAC 2008-W-002; The National Crash Analysis Center: Ashburn, VA, USA, 2008; Available online: https://citeseerx.ist.psu.edu/document?repid=rep1&type=pdf&doi=d420a3b55f0ae4e4b9463dfd463f4265797d0ac1 (accessed on 15 August 2024).
  33. LSTC. LS-DYNA Keyword User’s Manual, Volume II; Version 11 R11.0.0; Livermore Software Technology Corporation: Livermore, CA, USA, 2019. [Google Scholar]
  34. Murray, Y.D.; Abu-Odeh, A.Y.; Bligh, R.P. Evaluation of LS-DYNA Concrete Material Model 159; No. FHWA-HRT-05-063; U.S. Department of Transportation, Federal Highway Administration, Research, Development, and Technology Turner-Fairbank Highway Research Center: McLean, VA, USA, 2007. Available online: https://rosap.ntl.bts.gov/view/dot/38728/dot_38728_DS1.pdf (accessed on 15 August 2024).
  35. Mohammed, T.A.; Parvin, A. Vehicle bridge pier collision validation analysis and parametric study using multiple impact data. In Proceedings of the 2010 FHWA Bridge Engineering Conference: Highways for LIFE and Accelerated Bridge Construction, Orlando, FL, USA, 8–9 April 2010; Volume 89, pp. 287–294. [Google Scholar]
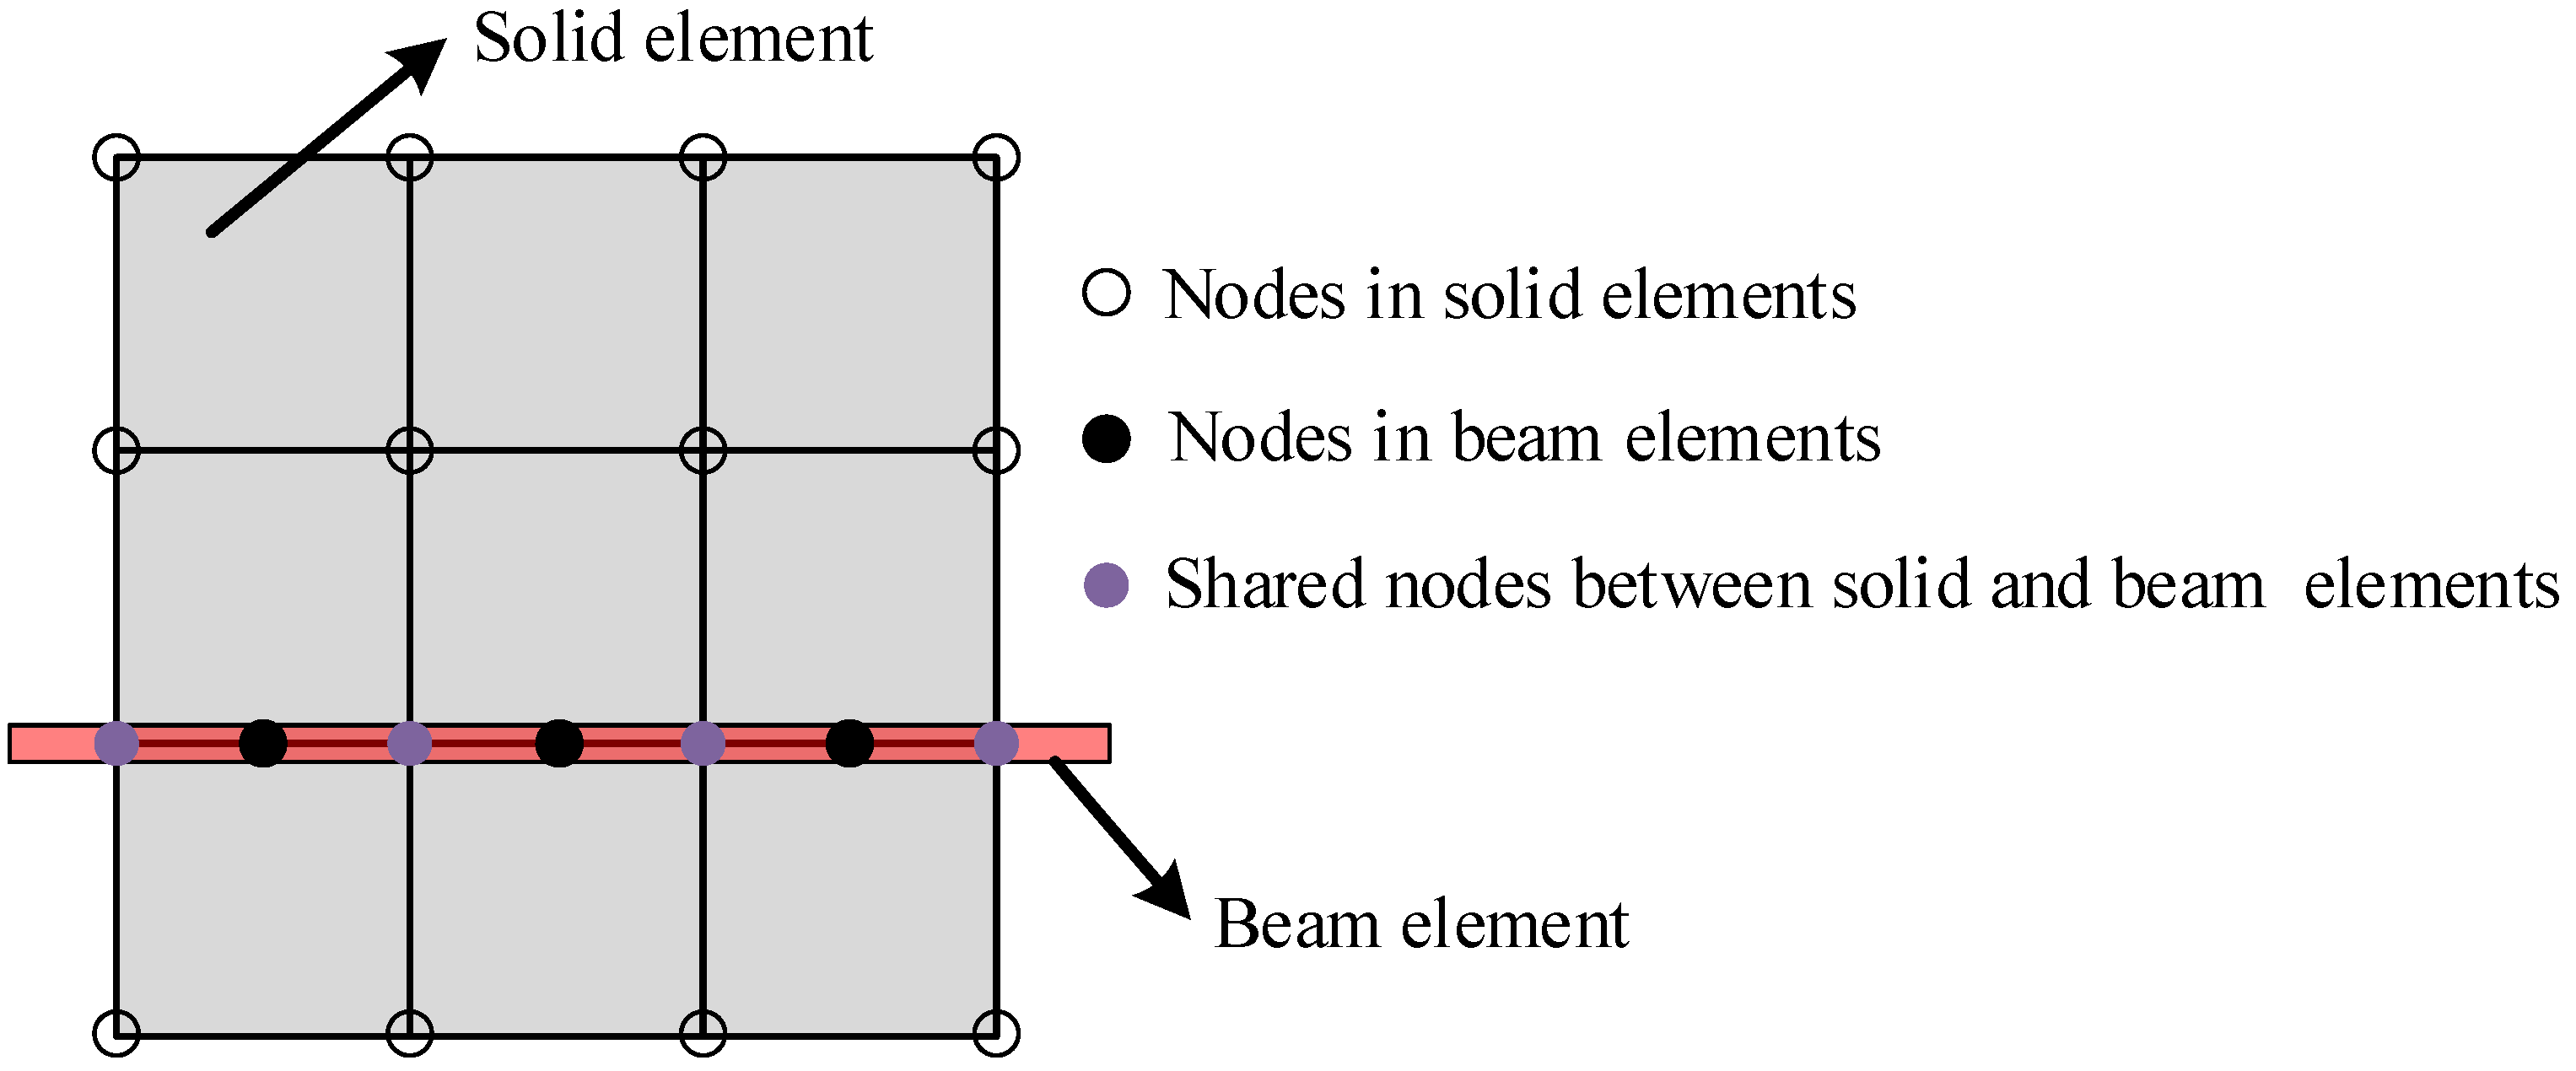
Figure 1. Node-sharing method to connect solid elements and beam elements.
Applsci 14 10518 g001
Figure 2. Concept of node-independent model.
Applsci 14 10518 g002
Figure 3. The geometry and rebar arrangement of the reinforced concrete barrier (unit: mm).
Applsci 14 10518 g003
Figure 4. Mesh design for concrete barriers consisting of concrete and reinforcement bars.
Applsci 14 10518 g004
Figure 5. Comparison of node-sharing method and node-independent model for reinforced concrete barriers: (a) node-sharing method and (b) node-independent model.
Applsci 14 10518 g005
Figure 6. Three test models for the reinforced concrete barriers: (a) Case 1; (b) Case 2; (c) Case 3.
Applsci 14 10518 g006
Figure 7. Finite element models for vehicles: (a) truck model; (b) passenger car model.
Applsci 14 10518 g007
Figure 8. Flowchart illustrating research methodology.
Applsci 14 10518 g008
Figure 9. Von-Mises stresses of steel reinforcement: (a) Case 2; (b) Case 3.
Applsci 14 10518 g009
Figure 10. Principal stresses of concrete: (a) Case 2; (b) Case 3.
Applsci 14 10518 g010aApplsci 14 10518 g010b
Figure 11. Variation in THIV with respect to time for different cases.
Applsci 14 10518 g011
Figure 12. Variation in PHD with respect to time for different cases.
Applsci 14 10518 g012
Figure 13. Post-impact trajectory of trucks: (a) Case 1; (b) Case 2; (c) Case 3.
Applsci 14 10518 g013
Figure 14. Post-impact trajectory of passenger cars: (a) Case 1; (b) Case 2; (c) Case 3.
Applsci 14 10518 g014
Table 1. Impact conditions for different vehicle types.
Vehicle TypeImpact Speed (km/h)Impact Angle (°)
Truck8015
Passenger car10020
Table 2. Material properties of concrete and reinforced steel.
PropertyConcreteReinforced Steel
Density (t/mm3)2.35 × 10−97.8 × 10−9
Elastic modulus (MPa)28,800200 × 10³
Poisson’s ratio0.250.3
Yield strength (MPa)-400
Compressive strength (MPa)35-
Maximum aggregate (mm)19-
Disclaimer/Publisher’s Note: The statements, opinions and data contained in all publications are solely those of the individual author(s) and contributor(s) and not of MDPI and/or the editor(s). MDPI and/or the editor(s) disclaim responsibility for any injury to people or property resulting from any ideas, methods, instructions or products referred to in the content.