Article

Spatiotemporal Pattern of Vegetation Coverage and Its Response to LULC Changes in Coastal Regions in South China from 2000 to 2020

School of Geography Sciences, South China Normal University, Guangzhou 510631, China
*
Authors to whom correspondence should be addressed.
Appl. Sci. 2024, 14(22), 10694; https://doi.org/10.3390/app142210694
Submission received: 22 October 2024 / Revised: 10 November 2024 / Accepted: 15 November 2024 / Published: 19 November 2024

Abstract

:
Analyzing vegetation coverage and land-use and land cover (LULC) characteristics helps to understand the interaction between human activities and the natural environment. The coastal regions of the Guangdong Province are economically active areas with frequent human activities, located in the advantageous natural environment of South China. This study analyzed the spatiotemporal characteristics of the normalized difference vegetation index (NDVI) and LULC from 2000 to 2020, to explore the response of NDVI changes to LULC changes. The results show that (1) the overall NDVI is relatively high, with a proportion of 85.37% to 89.48% of areas with higher coverage and above categories, mainly distributed in the east and west. Vegetation coverage showed an increasing trend. (2) The LULC in this area is mainly composed of forest land (46.5% to 47.5%) and cultivated land (30.7% to 33.4%), with forest land mainly distributed in relatively high-altitude regions and cultivated land mainly distributed in the plains. The changes in LULC from 2015 to 2020 were relatively significant, mainly due to the mutual transfer of cultivated land and forest land. In addition, built-up land continued to expand from 2000 to 2020, mainly in the Pearl River Delta. (3) The NDVI decreases come from the transfer of various types of land to built-up land, mainly in the Pearl River Delta region, while the NDVI increase comes from the stability and mutual transfer of cultivated land. The net contribution rate of forest land change to vegetation cover change is the most significant (−38.903% to 23.144%). This study has reference significance for the spatiotemporal characteristics of vegetation cover changes in coastal areas and their response to land-use changes, as well as coastal management and sustainable development.

1. Introduction

Vegetation is an important link connecting the relationship between atmosphere, water, and soil at the micro level, and vegetation coverage is an important indicator for measuring the ecological environment at the macro level [1,2]. Vegetation, as an important ecological barrier in a region, plays an irreplaceable role in regional ecological security and sustainable development. As an important ecological climate parameter, the extraction and change analysis of regional surface vegetation coverage is of great significance for revealing changes in the ecosystem environment, vegetation restoration, and reconstruction layout [3]. Especially with the support of timely satellite remote sensing data, large-scale monitoring of ecosystem and regional vegetation changes has been achieved [4,5]. Land-use and land cover (LULC) changes reveal the spatiotemporal dynamics of surface landscapes and can also reflect the degree of disturbance to ecosystems caused by human activities [6,7,8]. Coastal regions are one of the most concentrated areas for human activities, with mostly favorable natural environments, abundant marine resources, convenient land–sea transportation, and a long history of development [9,10]. At the same time, they are also places with rapid urbanization and enormous economic and environmental pressures, posing serious challenges to coastal management and sustainable development [11,12,13]. However, compared to other regions, coastal areas are more risk-prone in terms of floods [14], droughts [15], and sea level rise [16], thus they require sufficient attention. There is a certain interplay between vegetation coverage change and LULC changes [17,18]. Analyzing the response of vegetation coverage change to LULC changes can help deepen the understanding of the impact of human activities on vegetation coverage change, guiding humans to achieve sustainable cities and communities through harmonious coexistence with nature.
Vegetation coverage is usually expressed using the Normalized Difference Vegetation Index (NDVI) and Enhanced Vegetation Index (EVI) [19,20], as well as the newly proposed nonlinear Vegetation Index (kNDVI) [21]. The NDVI has been used to describe vegetation cover for a long time [22,23], as well as geographical phenomena such as aridification [24]. The NDVI quantifies the growth status of vegetation by calculating the difference between near-infrared and red bands, which can reflect the health and growth of vegetation and allow for widespread used in fields such as agriculture, forestry, and ecological environments [25,26,27]. The NDVI is based on the effectiveness in capturing vegetation and land-use dynamics under urban pressure, which would better support the choice of methodology. An important research perspective is that trend analysis, stability analysis, Hurst exponent analysis, and partial correlation analysis have been widely used to explore the spatiotemporal characteristics of continuous changes in vegetation cover. Research has shown that the vegetation change trends in northwest and northern China are not consistent, with the NDVI decreasing from 2000 to 2012, increasing from 2013 to 2018, decreasing in the northwest, and increasing in the east of northern China [28]. More studies have shown an increasing trend in NDVI change. The NDVI of the Shiyang River Basin in the arid northwest region shows an increasing trend of 0.034/10a in interannual variation [29]. The vegetation NDVI in Ordos City, a semi-arid region in the north, shows a clear growth trend, with 0.0075/a of the interannual growth rate [30]. The NDVI of the Shanxi section of the Yellow River Basin shows an overall increasing trend, with an annual growth rate of 1.82% [31]. Between 2000 and 2022, the vegetation coverage on the Loess Plateau increased by an average of 0.86% per year [32]. During the same period, it was also found that 73.69% and 73.86% of the vegetation conditions in the Luohe River Basin and Shaanxi Province had been improved, respectively [33,34]. The Minjiang River Basin in the southwest is also showing a stable upward trend [35]. The NDVI of the entire southwestern region is growing at a rate of 0.02 per decade, with a regional increase of approximately 85.59% of the vegetation area [36]. A more significant improvement has been observed in the Tarim River Basin in the arid northwest region, where 90.1% of the area shows an increase in NDVI, with an overall trend of 0.032/decade, although the overall level is still relatively poor [37,38]. Located in the eastern monsoon region of the Shandong Province, vegetation coverage is generally on the rise, especially in areas where human activities are concentrated [39]. The average NDVI value of vegetation in Central China and the Hubei Province from 2000 to 2022 was 0.762, fluctuating and increasing at a rate of 0.01/10a [40]. These studies explored the dynamics of vegetation cover in different regions, but most of them focused on overall trend analysis and prediction, neglecting detailed investigations of vegetation cover changes on different land types. Further research is needed on the relationship between vegetation cover change and land-use change, in order to quantify the contribution of land-use change to vegetation cover change [41,42]. In addition, existing studies have also lacked attention to vegetation cover changes in coastal areas.
There are many reasons for changes in vegetation coverage, which is also a research perspective of great concern. Natural factors such as the climate, terrain, and soil are usually the causes of large-scale vegetation coverage changes [43,44,45,46,47,48,49], and the impact of human activities cannot be ignored [50]. Different terrain conditions, in addition to the spatiotemporal differences in vegetation coverage caused by climate and hydrology differences due to different slope orientations [51,52], are also important non-climatic factors for human activities [53,54]. The drastic changes in the LULC in plain regions may indicate significant human activities, especially the urbanization process [55]. In Nanchang City, located in the Poyang Lake Plain in South China, LULC change is the dominant factor in vegetation coverage change, with construction and expansion of the city leading to the occupation of cultivated land, forest land, and grassland. Large-scale land activities such as abandonment and deforestation alsocontribute to more than 50% of vegetation coverage degradation, while returning farmland to forests and grasslands, reclamation of abandoned land, and the development of reserve resources are the main reasons for increases in vegetation coverage [56]. There is also a response relationship between vegetation coverage change and land-use change in the Guangdong Province. The map of transformation to urban and rural, industrial and mining, and residential land significantly overlaps with vegetation in highly degraded areas, indicating that the transformation of cultivated land and forest land to urban and rural, industrial and mining, and residential land is the main reason for the degradation of vegetation cover, with the Pearl River Delta region being the most significant example [57]. In northwestern India, it was found that increasing farmland is also beneficial for expanding green space [58]. In the arid regions of Central Asia, human activities are prone to causing vegetation degradation [44,59]. The reason for the decrease in forest vegetation in the coastal regions of Tanzania is that most livelihoods in the region rely on agriculture and harvesting of forest products such as firewood, wood, and charcoal [60]. Therefore, evaluating the factors influencing vegetation coverage changes under different terrain conditions is of great value. Plain regions, especially warm and humid river deltas and coastal areas such as the coastal regions of South China, are frequently disturbed by humans, which may be an undeniable factor causing the changes in vegetation coverage in these regions.
South China has superior natural conditions and is one of the regions of China with good vegetation coverage, but the expansion of human activities has been particularly evident in recent decades. The Guangdong Province is one of the most economically active provinces in China, with the fastest population growth and one of the fastest urban construction rates. Therefore, strengthening the monitoring of vegetation coverage in this region plays an important role in theoretically exploring the coordination between social development and ecological environment protection in economically developed regions, as well as meeting the practical needs of ecological environment restoration. This study takes the coastal regions of the Guangdong Province in South China as an example, based on five periods of NDVI and LULC data with a 5-year interval from 2000 to 2020, to analyze (a) the spatiotemporal characteristics of NDVI change, (b) the spatiotemporal characteristics of LULC change, and (c) quantify the contribution of NDVI changes inresponse to the LULC changes. This study has reference significance for the spatiotemporal characteristics of vegetation cover changes in coastal areas and their response to land-use changes, as well as for coastal management and sustainable development.

2. Materials and Methods

2.1. Study Area

The Guangdong Province is located on the coast of southern China (Figure 1a), from which the Pearl River flows into the South China Sea. The climate is mainly affected by the East Asian summer monsoon, as well as the East Asian winter monsoon and the South Asian summer monsoon [61,62]. The coastal regions of Guangdong are mainly plains, the vast majority of which are below 200 m (Figure 1b). The climate is dominated by subtropical and subtropical monsoon climates [61,62], making it warm and humid, especially from April to September. The average annual temperature is about 15.5–24.5 °C, showing a latitude gradient of high temperature in the south and low temperature in the north (Figure 1c). The annual precipitation is about 1650–2150 mm, a relatively large amount overall (Figure 1d). The central part of the Guangdong Province is the Pearl River Delta, where the terrain is flat, the water source is sufficient, the soil is fertile, the traffic is dense, and the population is dense. The Guangdong–Hong Kong–Macao Bay Area formation is one of the four largest bay areas in the world. Cities such as Guangzhou and Shenzhen are major megacities in China [6,63,64]. In addition, Hong Kong and Macao are adjacent to Guangdong and are also located in coastal regions, so they were included in this study.

2.2. Research Framework and Data Processing

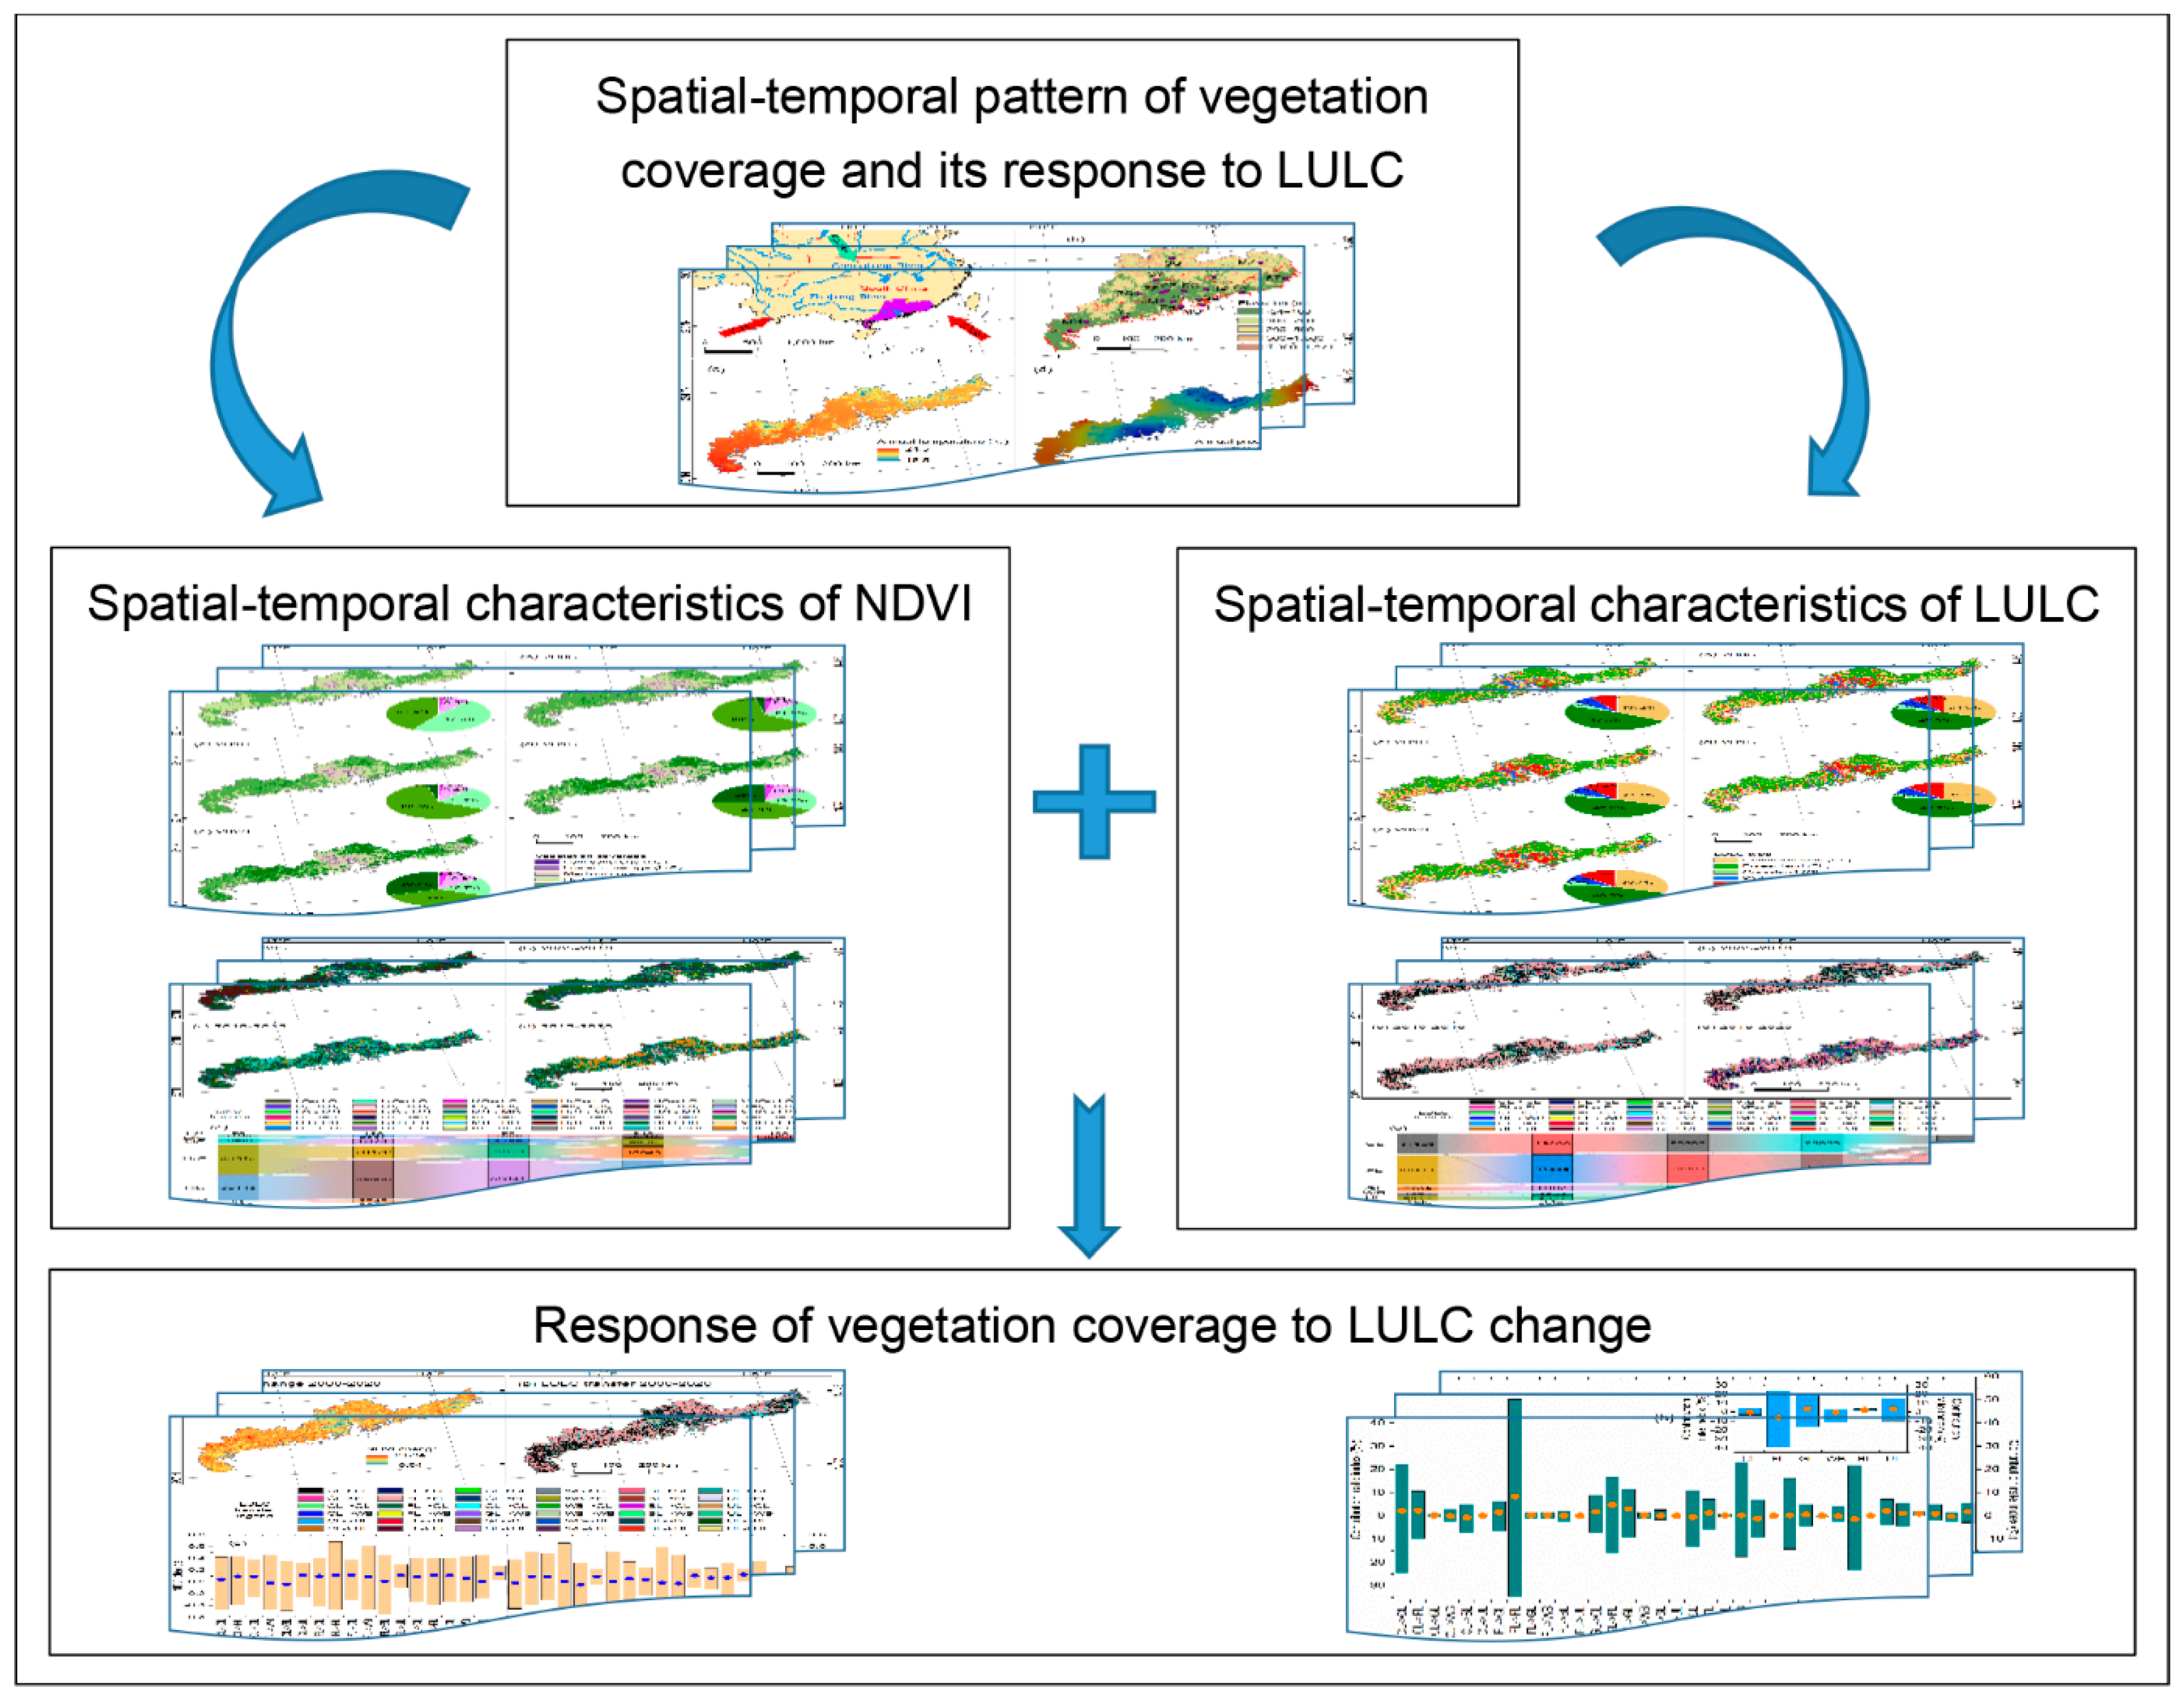
There were three stages to be completed in this study (Figure 2): (1) analyzing the changing characteristics of the NDVI, (2) analyzing the changing characteristics of the LULC, and (3) exploring the response of NDVI changes to LULC changes.
There are 5 years worth of data (2000, 2005, 2010, 2015, and 2020) on vegetation coverage (Normalized Difference Vegetation Index, NDVI) and land-use/land cover (LULC), which were obtained from the National Earth System Science Data Center (http://www.geodata.cn/ accessed on 1 March 2024). The NDVI data are a part of China’s Annual Normalized Difference Vegetation Index Spatial Distribution Dataset, which effectively reflects the distribution and changes of vegetation cover in various regions of the country on both spatial and temporal scales, based on continuous time series SPOT/VEGETATION NDVI satellite remote sensing data and generated using the maximum value synthesis method [65,66]. The LULC data consist of 6 primary classifications and 23 subcategories and are a part of the China Multi-Period Land Use and Land Cover Remote Sensing Monitoring Dataset (CNLUCC), which uses Landsat remote sensing images from the United States as the main information source to construct a national scale of multi-period land-use/land cover in a thematic database in China through manual visual interpretation [67,68,69].
The projection coordinate system of Asia_Lambert_Conformal_Conic was used for the data display in the ArcGIS 10.8 platform. Origin2024 was used to draw other statistical charts.

2.3. Spatiotemporal Characteristics Analysis

2.3.1. Classification of NDVI and LULC

The study area is located in south China, where the vegetation coverage is generally good. The NDVI data were divided into 6 categories: low coverage (0–0.1, LC, code 1), low coverage (0.1–0.3, LrC, code 2), medium coverage (0.3–0.5, MC, code 3), high coverage (0.5–0.7, HrC, code 4), high coverage (0.7–0.85, HC, code 5), and very high coverage (0.85–1, VHC, code 6).
The LULC data were divided into 6 categories: cultivated land (CL, code 1), forest land (FL, code 2), grassland (GL, code 3), water body (WB, code 4), built-up land (BL, code 5), and unused land (UL, code 6). These are the first level categories in the classification system of the China Multi-Period Land Use and Land Cover Remote Sensing Monitoring Dataset (CNLUCC).

2.3.2. Sankey Diagram for NDVI and LULC Change Matrix Visualization

The transfer matrix reflects the area changes of the NDVI and LULC types in different periods in the form of a matrix, and the calculation formula is as follows:
S = S 11 S 12 S 21 S 22 S 1 n S 2 n S n 1 S n 2 S n n
where S is the area, n is the number of types of NDVI or LULC, and i and j are the NDVI or LULC in the early and late stages of the study, respectively.
In this study, a Sankey diagram was used instead of a transfer matrix to present the structure of regional NDVI and LULC types, express the amount of data exchange between NDVI or LULC types, and distinguish data size by the width of flow branches, facilitating data visualization analysis [70]. Its effect is similar to a chord diagram [71].

2.3.3. Dynamic Degree of NDVI and LULC Change

The single dynamic degree of NDVI and LULC change was used to analyze the quantitative changes of certain NDVI and LULC types during different periods. The formula is [72,73] as follows:
D = S b S a S a × 1 T × 100 %
where D represents the single dynamic degree of NDVI and LULC change, Sa and Sb represent the area of a certain NDVI and LULC type in the early and late stages of the study, respectively, and T is the duration of the study.
The comprehensive dynamic degree of NDVI and LULC change was used to analyze the overall quantitative changes of NDVI and LULC types in the study area. The formula is [72,74] as follows:
C D = i = 1 n D S i j 2 i = 1 n D S i × 1 T × 100 %
where CD represents the comprehensive dynamic degree of NDVI and LULC change, DSi represents the area of the i-th type of NDVI and LULC in the early stage of the study, ΔDSi−j is the absolute value of the area converted from the i-th type of NDVI and LULC to non i-th type of NDVI and LULC during the research period, and T is the duration of the study.

2.4. Analysis Method for Response of Vegetation Coverage to LULC Change

2.4.1. Analysis Method for Response Distribution

The response distribution means visualizing the response of the NDVI changes to the LULC changes. Firstly, subtract the year 2000 NVDI from the 2020 NDVI to obtain the NDVI changes from 2000 to 2020. Then, calculate the LULC transfer map from 2000 to 2020. Finally, calculate the NDVI changes corresponding to each LULC transfer region.

2.4.2. Analysis Method for Contribution Rate Index

When analyzing the response index of the NDVI to LULC changes, the LULC transfer matrix from 2000 to 2020 is first calculated, then the corresponding vegetation coverage transfer matrix response to the LULC change is calculated.
The vegetation coverage in different LULC transfer regions was calculated using the weighted average method, and the calculation formula is as follows:
V C = i = 1 n V C i × S i S t × 100 %
where, VC represents the vegetation coverage in different LULC transfer regions; n is the number of types transferred from a certain LULC type to another type; St is the area where a certain LULC type; VCi is the NDVI of the region where a certain LULC type is transferred to another LULC type; Si is the area where a certain LULC type is transferred to another LULC type.
The response of vegetation coverage to LULC change refers to the vegetation coverage change caused by LULC change. The calculation formula is as follows:
V C = V C t V C n
where ∆VC is the response value of vegetation coverage to LULC change, VCt is the vegetation coverage corresponding to regions where a certain type of LULC is transferred to another LULC type, and VCn is the vegetation coverage corresponding to regions with non-transferable type of LULC.

3. Results

3.1. Spatiotemporal Characteristics of NDVI

3.1.1. NDVI Spatiotemporal Distribution

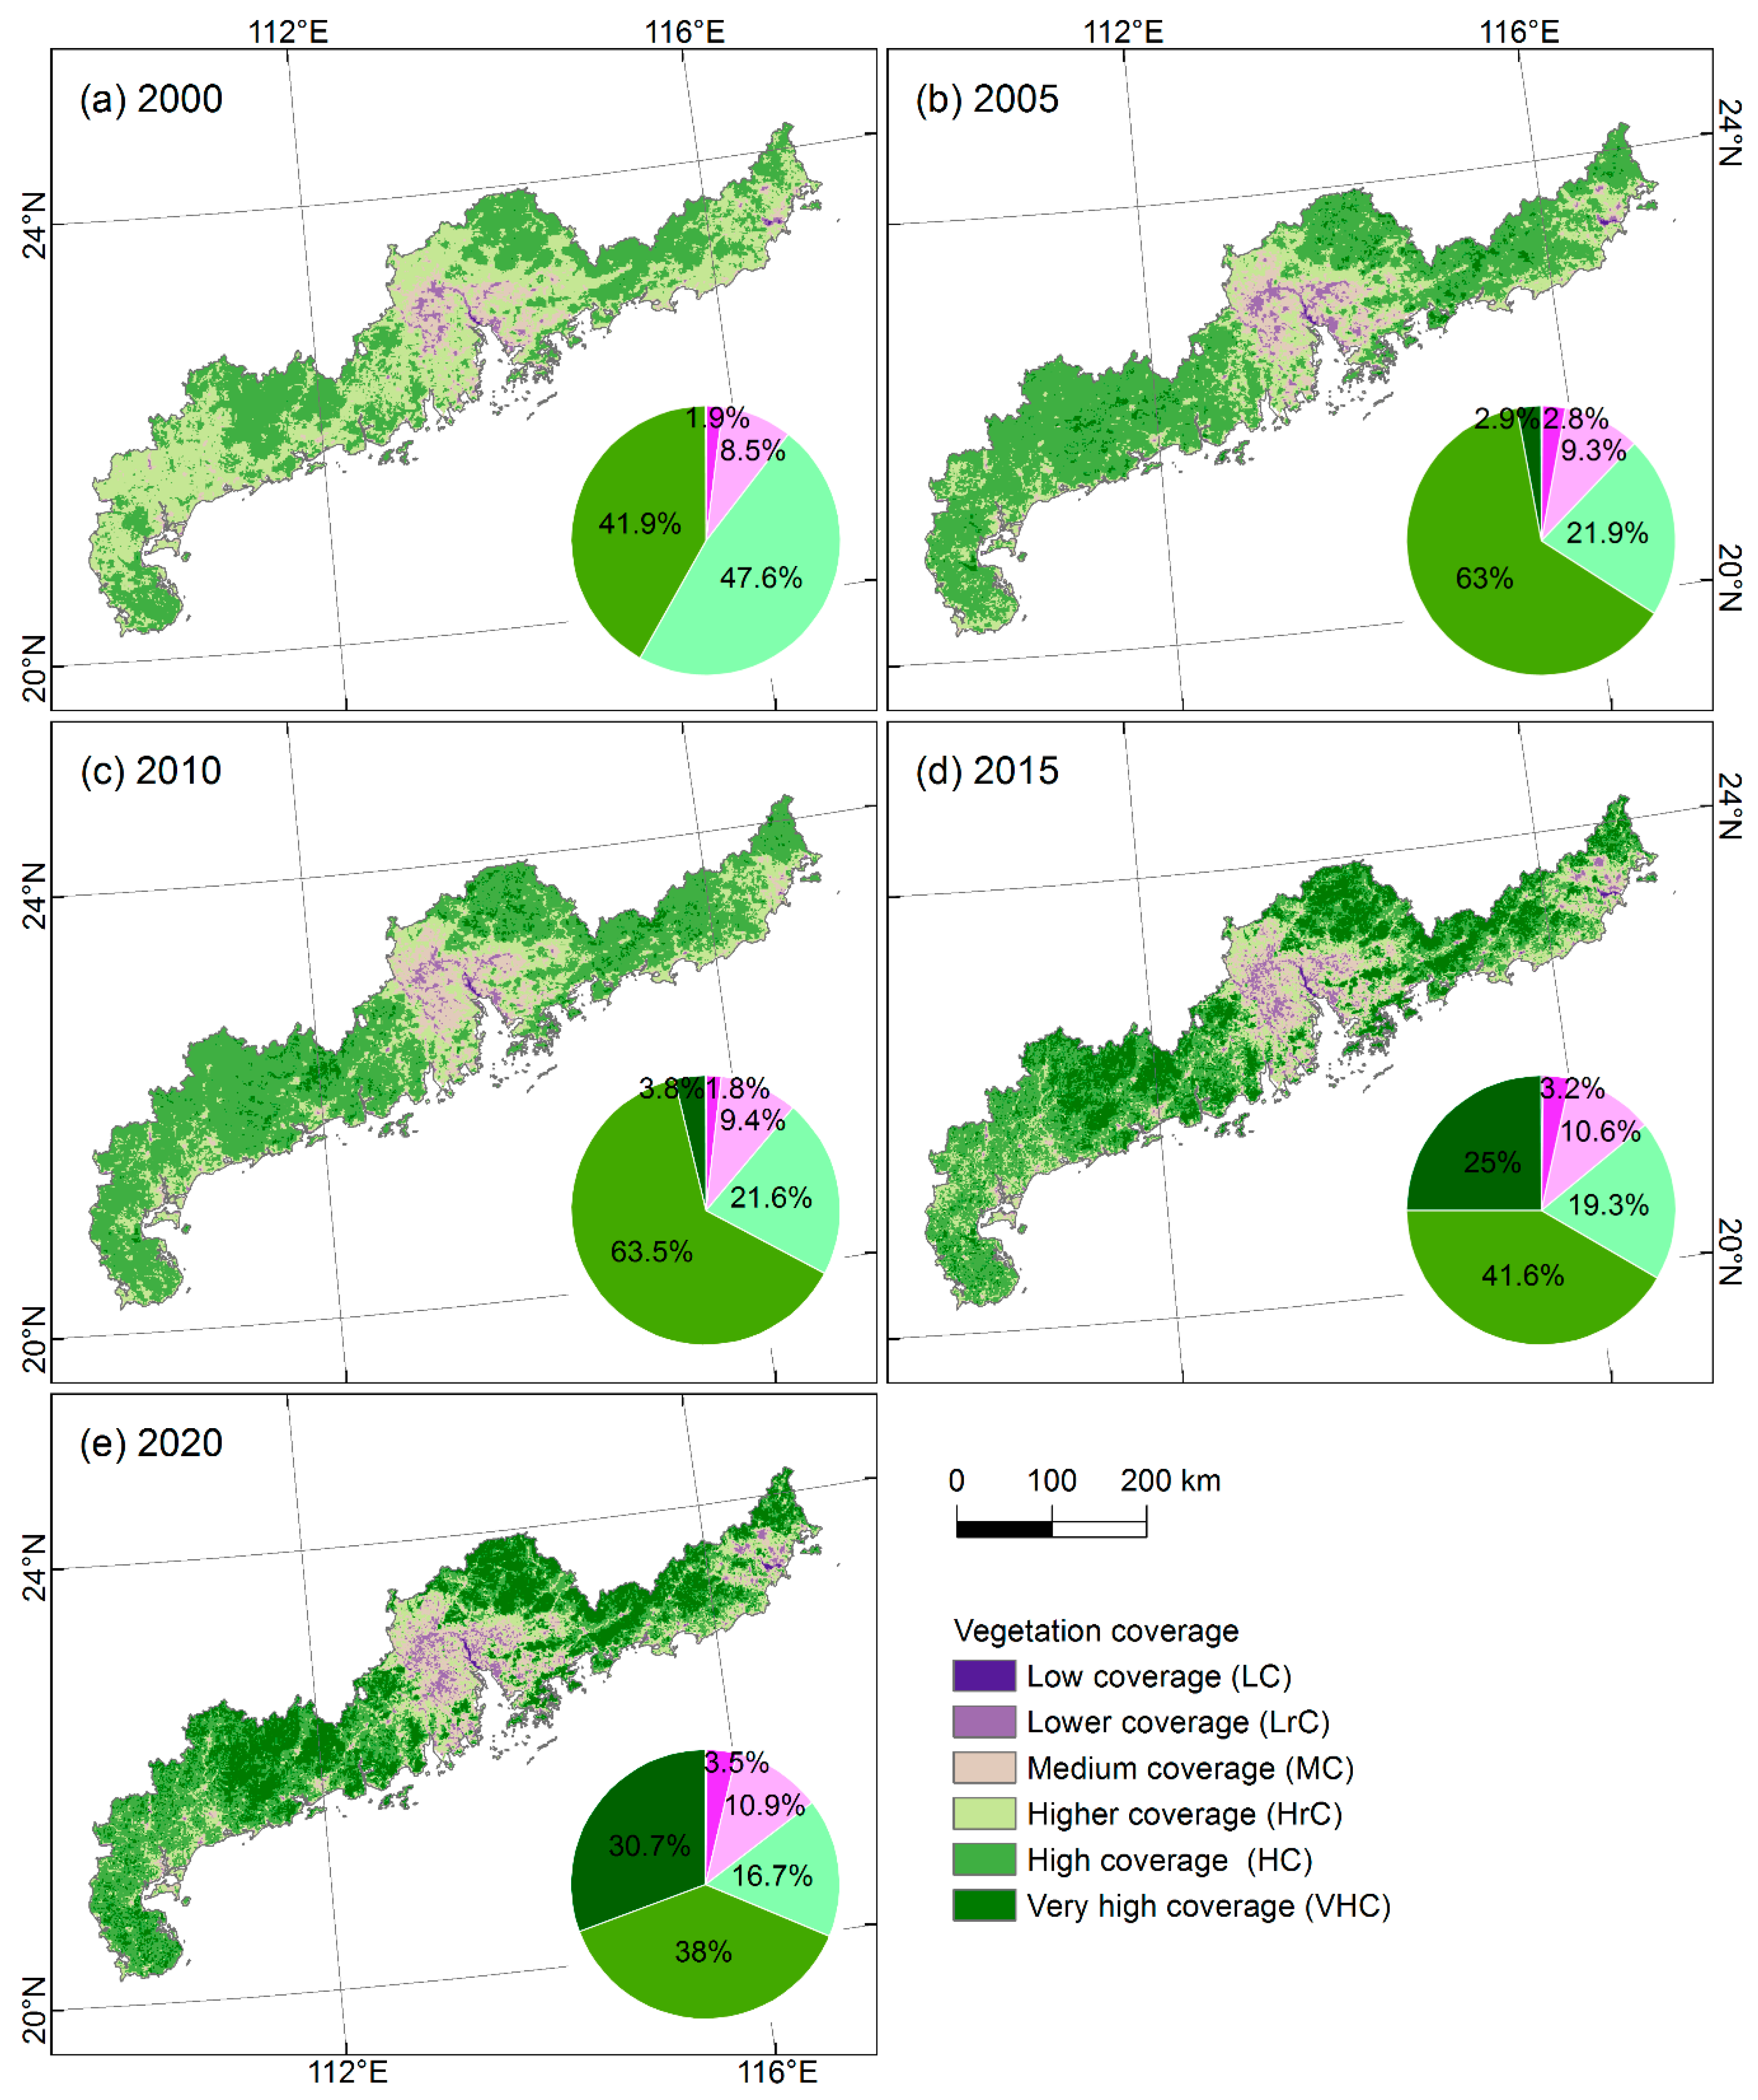
The overall NDVI in the coastal region of the Guangdong Province is relatively high, with a proportion of 85.37% to 89.48% of the areas with higher coverage and above categories, mainly distributed in the east and west, while the NDVI in the central region is relatively low (Figure 3). According to the area statistics of different levels of the NDVI, the area with higher coverage accounted for the highest proportion (47.61%) in 2000, and the area with higher coverage accounted for the highest proportion (37.98% to 63.46%) from 2005 to 2020. The proportion of areas with low coverage was the smallest (0.07% to 0.23%), followed by the proportion of areas with low coverage (1.77% to 3.54%) and medium coverage (8.52% to 10.89%), the proportion of areas with high coverage (16.7% to 47.61%) and high coverage (37.98% to 63.46%), and the proportion of areas with extremely high coverage increased rapidly (0.01% to 30.69%).

3.1.2. NDVI Spatiotemporal Change

The vegetation coverage in the coastal region of the Guangdong Province gradually increased. From 2000 to 2020, the average NDVI increased from 0.65 to 0.73, but showed regional differences, with a decrease in the NDVI in the central region and increases in the NDVI in the eastern and western regions (Figure 3). The proportion of areas with higher coverage and above categories decreased from 89.48% to 85.37%. The area with higher coverage continued to rapidly decrease, with the highest proportion decreasing from 47.61% to 16.7%. The area with extremely high coverage continued to increase rapidly, from the lowest proportion of 0.01% to 30.69% (Figure 3).
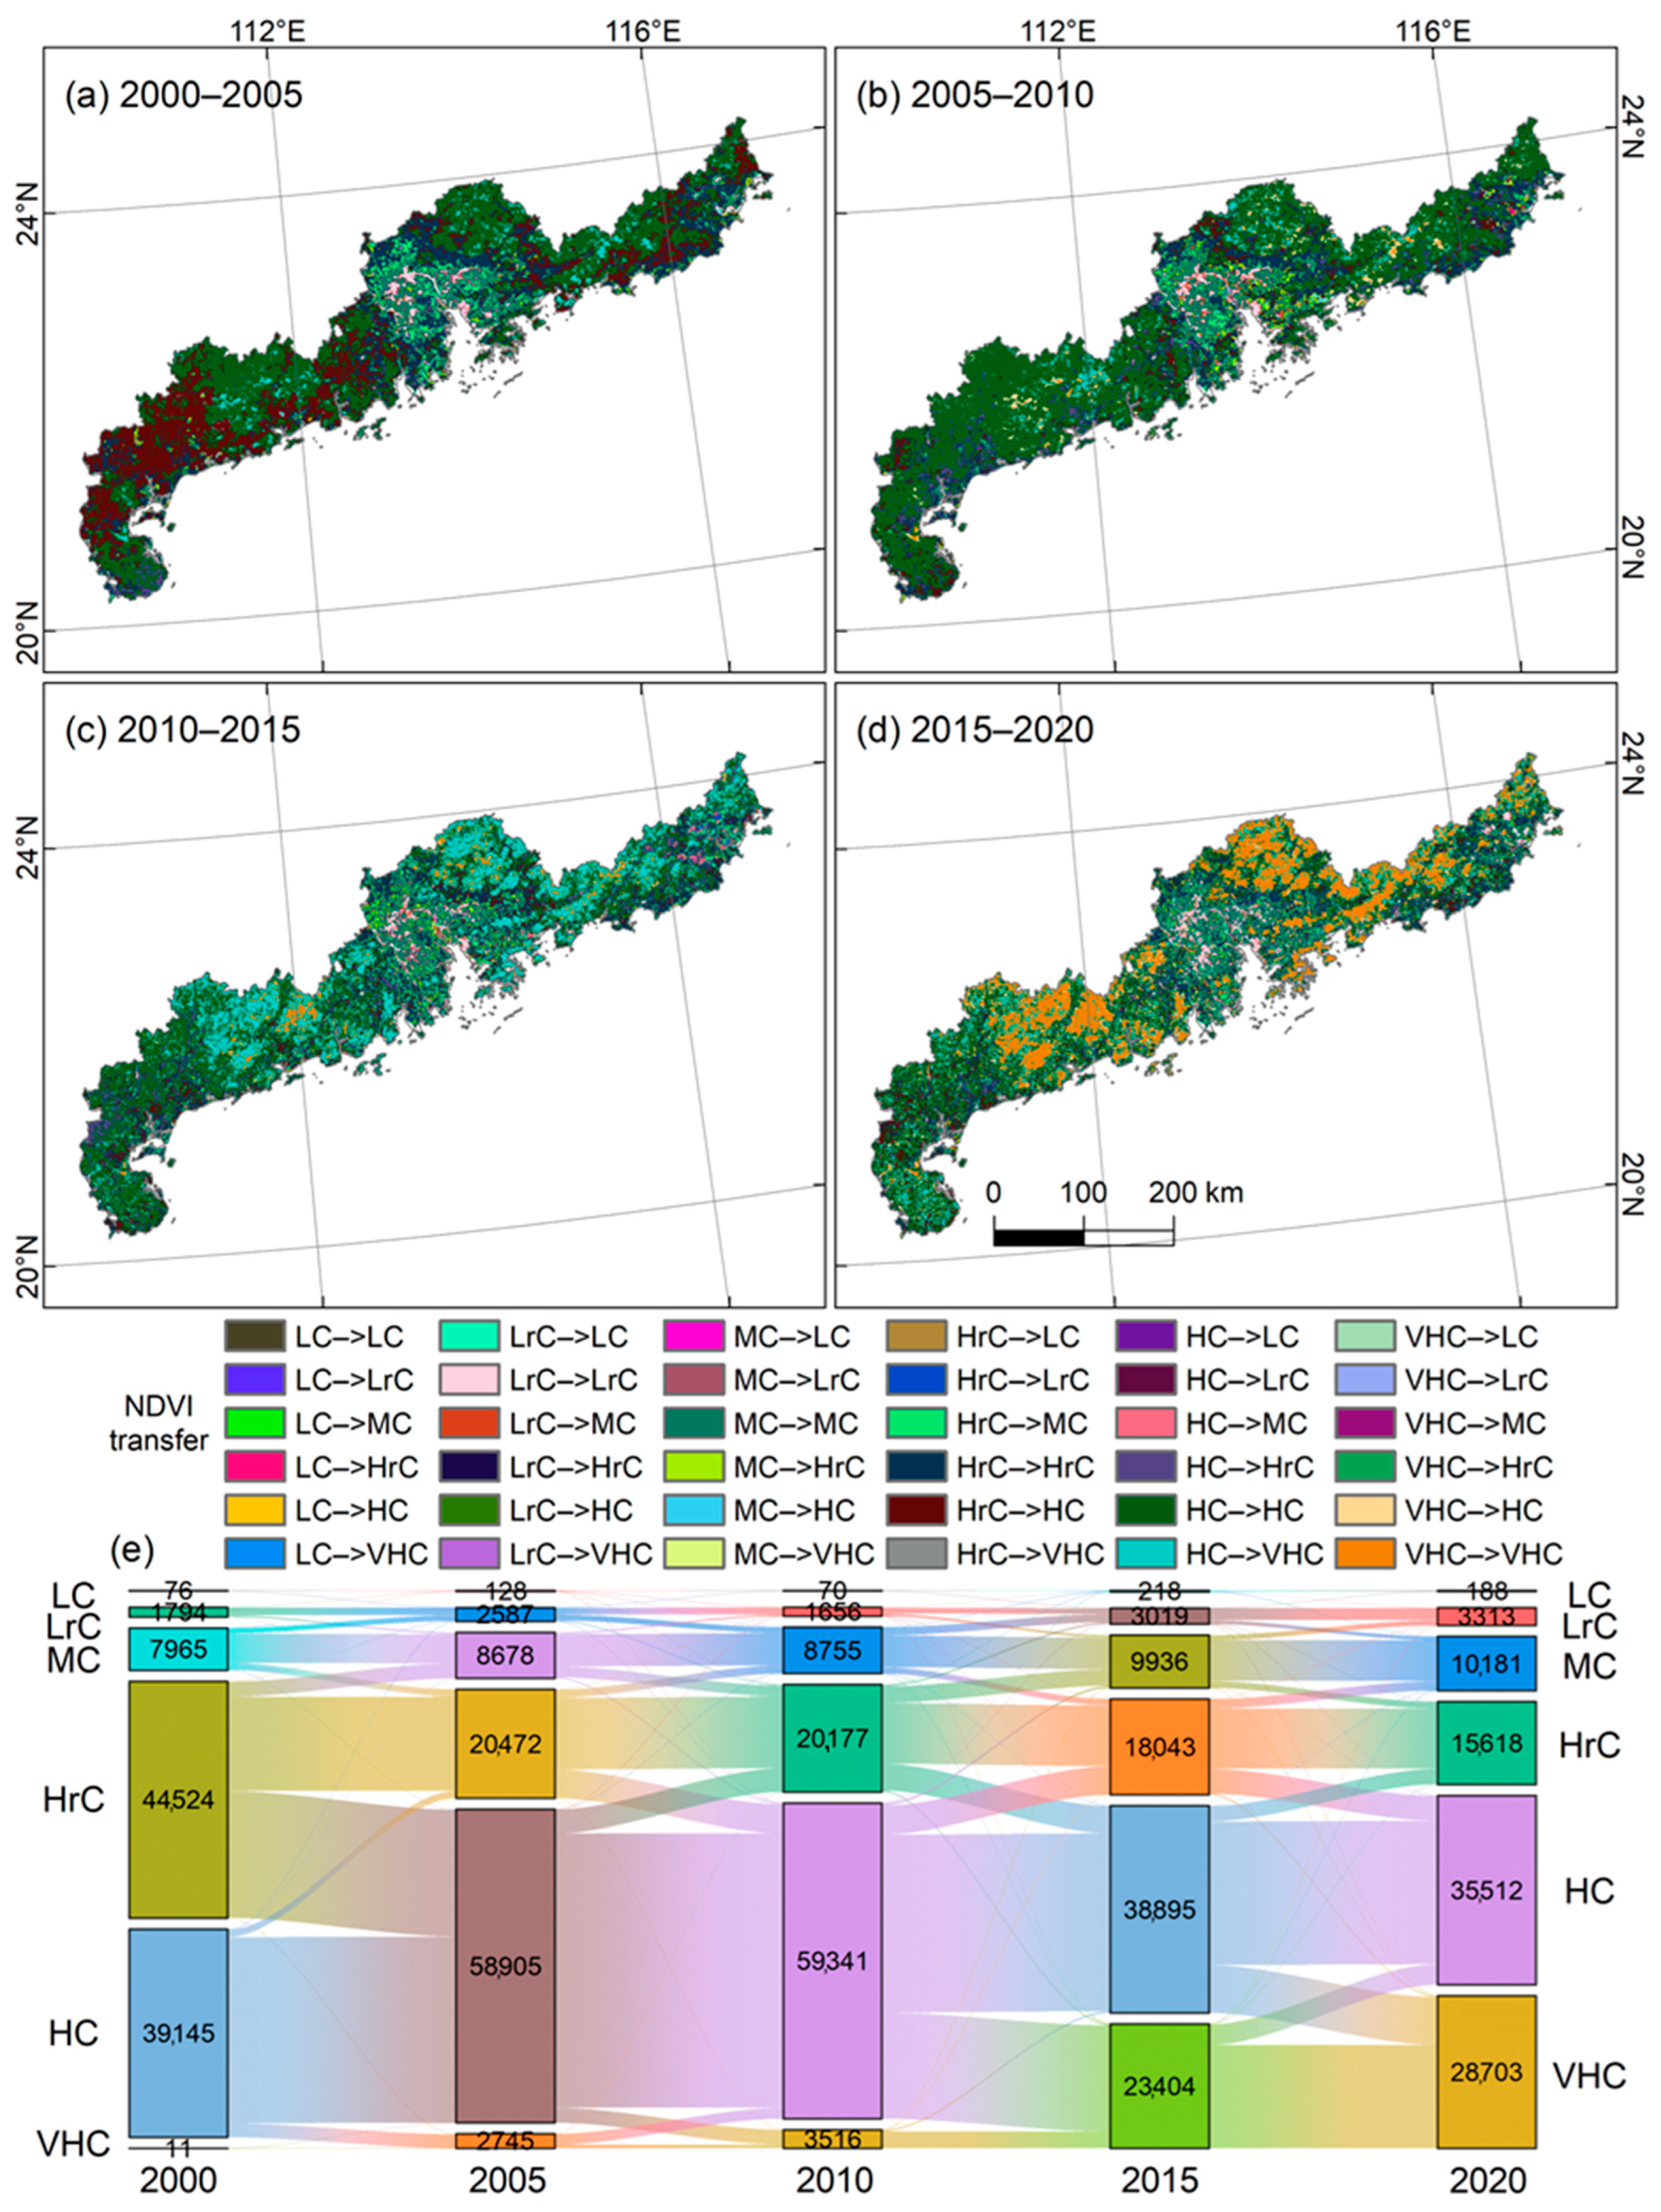
There are spatiotemporal differences in the transfer of different vegetation coverage levels and, over time, the transfer became increasingly frequent (Figure 4). The transfer of vegetation coverage in the central region was mainly between the moderate and below categories, while the transfer of vegetation coverage in the eastern and western regions was mainly between higher and above categories.
The largest type of transfer area from 2000 to 2005 was the transfer of higher coverage to high coverage (23,791 km2), which exceeded the unchanged area of high coverage. Other types of transfer areas with larger transfer areas included medium coverage to low coverage (1081 km2), medium coverage to high coverage (1321 km2), high coverage to medium coverage (2842 km2), high coverage to higher coverage (1421 km2), and high coverage to extremely high coverage (2654 km2).
From 2005 to 2010, the types of vegetation coverage transfer with larger areas included lower cover transfer to medium cover (1093 km2), medium cover transfer to higher cover (2046 km2), higher cover transfer to medium cover (1541 km2), higher cover transfer to high cover (5424 km2), high cover transfer to higher cover (4459 km2), higher cover transfer to extremely high cover (2828 km2), and extremely high cover transfer to high cover (2059 km2).
From 2010 to 2015, the types of vegetation coverage transfer with larger areas included medium cover transfer to lower cover (1531 km2), medium cover transfer to higher cover (1215 km2), higher cover transfer to medium cover (3110 km2), higher cover transfer to high cover (5043 km2), high cover transfer to higher cover (5374 km2), and higher cover transfer to extremely high cover (19978 km2).
From 2015 to 2020, the types of vegetation coverage transfer with larger areas included medium coverage transfer to higher coverage (1291 km2), higher coverage transfer to medium coverage (1789 km2), higher coverage transfer to high coverage (4677 km2), high coverage transfer to higher coverage (2910 km2), higher coverage transfer to extremely high coverage (9020 km2), and extremely high coverage transfer to high coverage (3874 km2).
The dynamic degree of NDVI changes shows that higher coverage is always negative, indicating a continuous decrease in area, but the decrease rate has been relatively slow since 2005 and the dynamic degree of medium and extremely high coverage is always positive, indicating a continuous increase in area (Table 1). The single dynamic degree of NDVI changes shows that among the changes from 2000 to 2005, the dynamic degree of extremely high coverage is particularly high (5840), indicating that the area expansion rate of this level is the fastest at this stage. The rate of decrease in low coverage areas was relatively large from 2005 to 2010 (with a dynamic degree of −10). In the changes from 2010 to 2015, the dynamic degree of extremely high coverage was the highest (113.138), followed by the dynamic degree of low coverage (45.714), indicating that areas of high and low coverage increased during this stage, with significant regional differences. Compared to the previous research stage, the dynamic degree of changes at each level of the NDVI from 2015 to 2020 is relatively small, indicating that vegetation coverage was relatively stable. Throughout the entire research period from 2000 to 2020, the single dynamic degree of NDVI changes indicates that in the past 20 years, the NDVI changes in the study area have been characterized by a slow decrease in higher coverage and high coverage areas, a slow increase in areas with moderate coverage and below, with the fastest expansion rate in areas with extremely high coverage. The comprehensive dynamic degree of NDVI changes shows that the comprehensive dynamic degree of the different stages in the study period is also relatively high, indicating that the NDVI changes are relatively significant.

3.2. Spatiotemporal Characteristics of LULC

3.2.1. LULC Spatiotemporal Distribution

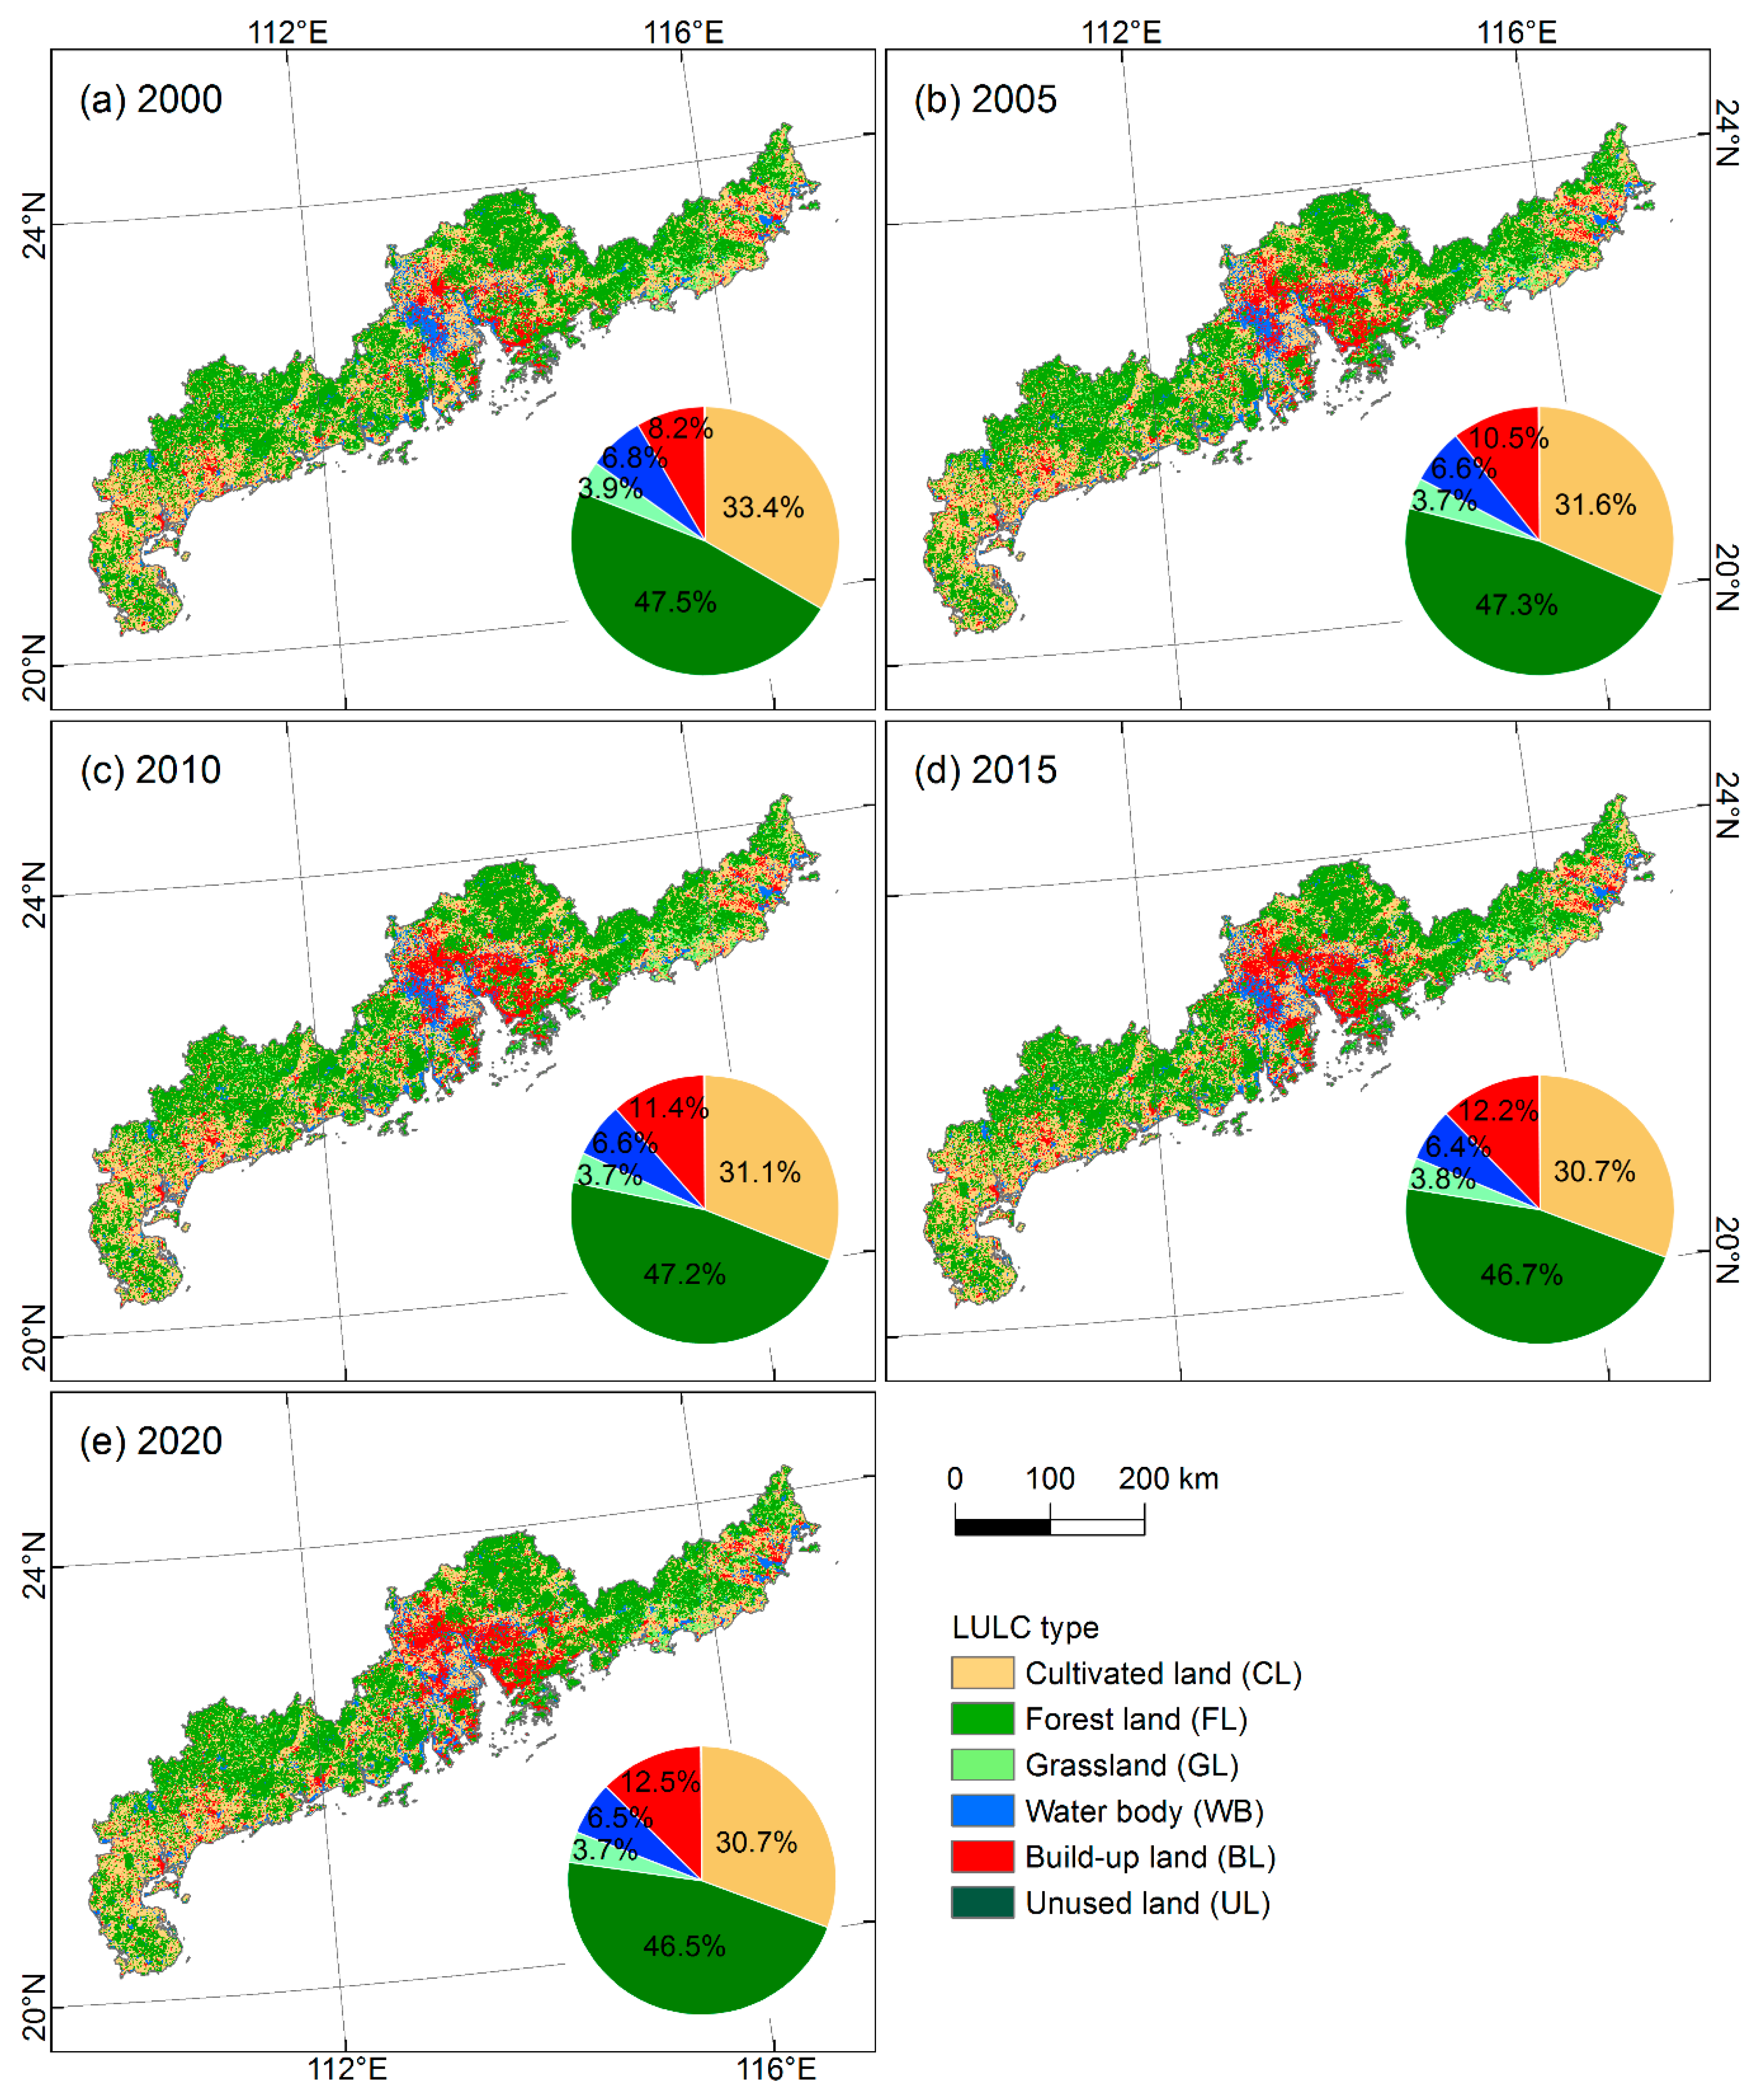
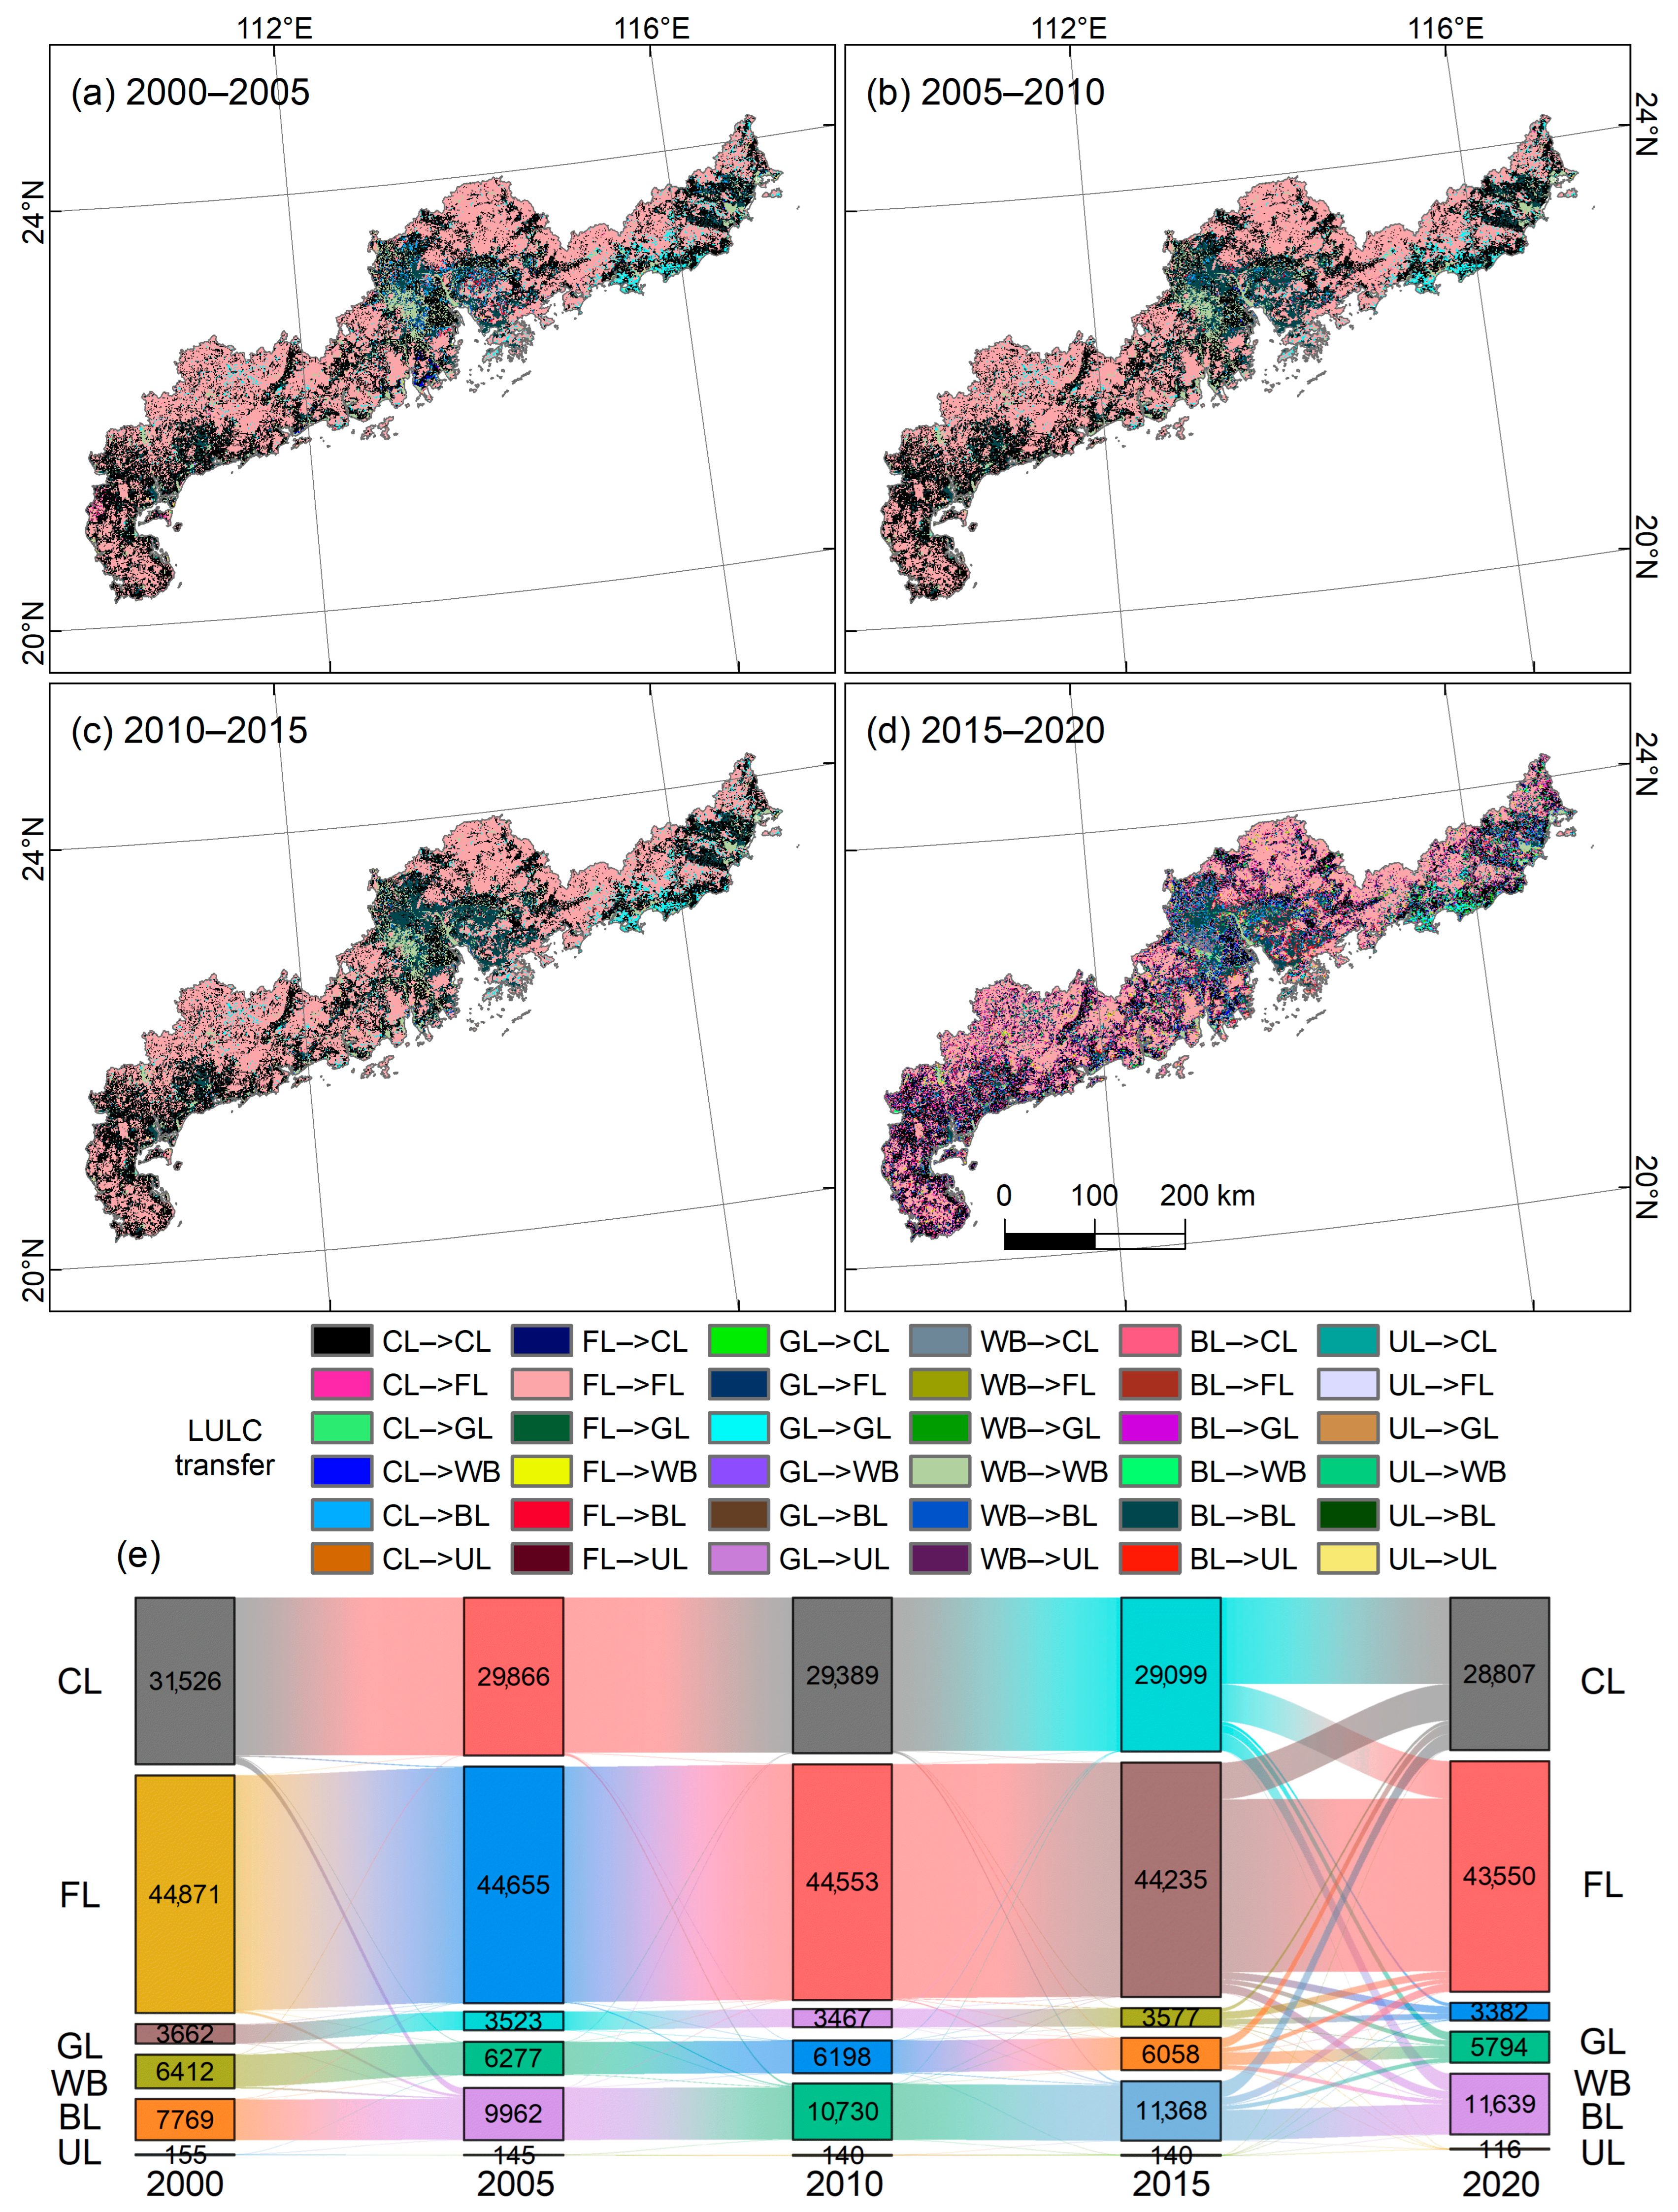
The coastal regions of the Guangdong Province have a relatively stable LULC structure, mainly consisting of forest land (46.5% to 47.5%) and arable land (30.7% to 33.4%), with an area ratio of over 77%. Forest land is mainly distributed in areas with relatively high altitudes, while arable land is mainly distributed in plains, which is in line with the basic law of LULC distribution (Figure 5). The water body region is mainly distributed in the Pearl River Delta, followed by the coastal region. The built-up land is concentrated in the Guangdong–Hong Kong–Macao Greater Bay Area and is scattered across the east and southwest (Figure 5).

3.2.2. LULC Spatiotemporal Change

The LULC changes in the coastal region of the Guangdong Province show a phased pattern (Figure 6). The transfer map shows that forest land remains dominant, especially in the west and north (Figure 6a–d). The second is the Pearl River Delta and the southwest plain, where the cultivated land remained relatively unchanged. The temporal periodicity is reflected in the relatively small changes in the LULC from 2000 to 2015, and the relatively drastic changes from 2015 to 2020, which did not change the LULC structure (Figure 6e). The LULC transfer area from 2015 to 2020 was relatively large, with arable land transferred to forest land (7090 km2) and forest land transferred to arable land (6914 km2). In addition, the transfer of arable land to built-up land (3279 km2) and the transfer of built-up land to arable land (3040 km2) also had a relatively large area.
The dynamic degree of LULC changes shows that only built-up land maintained a positive value, indicating that the built-up land area continues to increase, but the increase rate gradually slows down (Table 2). The single dynamic degree of LULC changes shows that from 2000 to 2005, the dynamic degrees of forest land (−0.105), grassland (−0.773), and water bodies (−0.412) were within −1, while the dynamic degrees of cultivated land (−1.06) and unused land (−1.25) exceeded −1, indicating relatively significant changes in the LULC. Compared to the previous stage, the dynamic degree of LULC changes from 2005 to 2010 was relatively low, manifesting in lower dynamic changes (below −0.5) in cultivated land (−0.329), forest land (−0.055), grassland (−0.322), and water bodies (−0.271). From 2010 to 2015 and 2015 to 2020, in addition to built-up land, grassland (0.599) and water bodies (0.187) also had positive values, respectively. The dynamic degree of other LULC types in these two stages was still relatively low (below −0.5). Throughout the entire research period from 2000 to 2020, the single dynamic degree of LULC changes indicates that in the past 20 years, the LULC changes in the study area have been characterized by a sustained and rapid increase in built-up land, a rapid decrease in cultivated and unused land, and a moderate decrease in grassland and water bodies, with the slowest decrease seen in forest land. The comprehensive dynamic degree of the LULC changes from 2015 to 2020 (97.887) was significantly higher than from 2000 to 2015 (below 2.614), and the overall dynamic degree of the entire study period was relatively high (106.306), indicating that the LULC changes here are intense.

3.3. Response of Vegetation Coverage to LULC Change

3.3.1. Response Distribution of Vegetation Coverage to LULC Changes

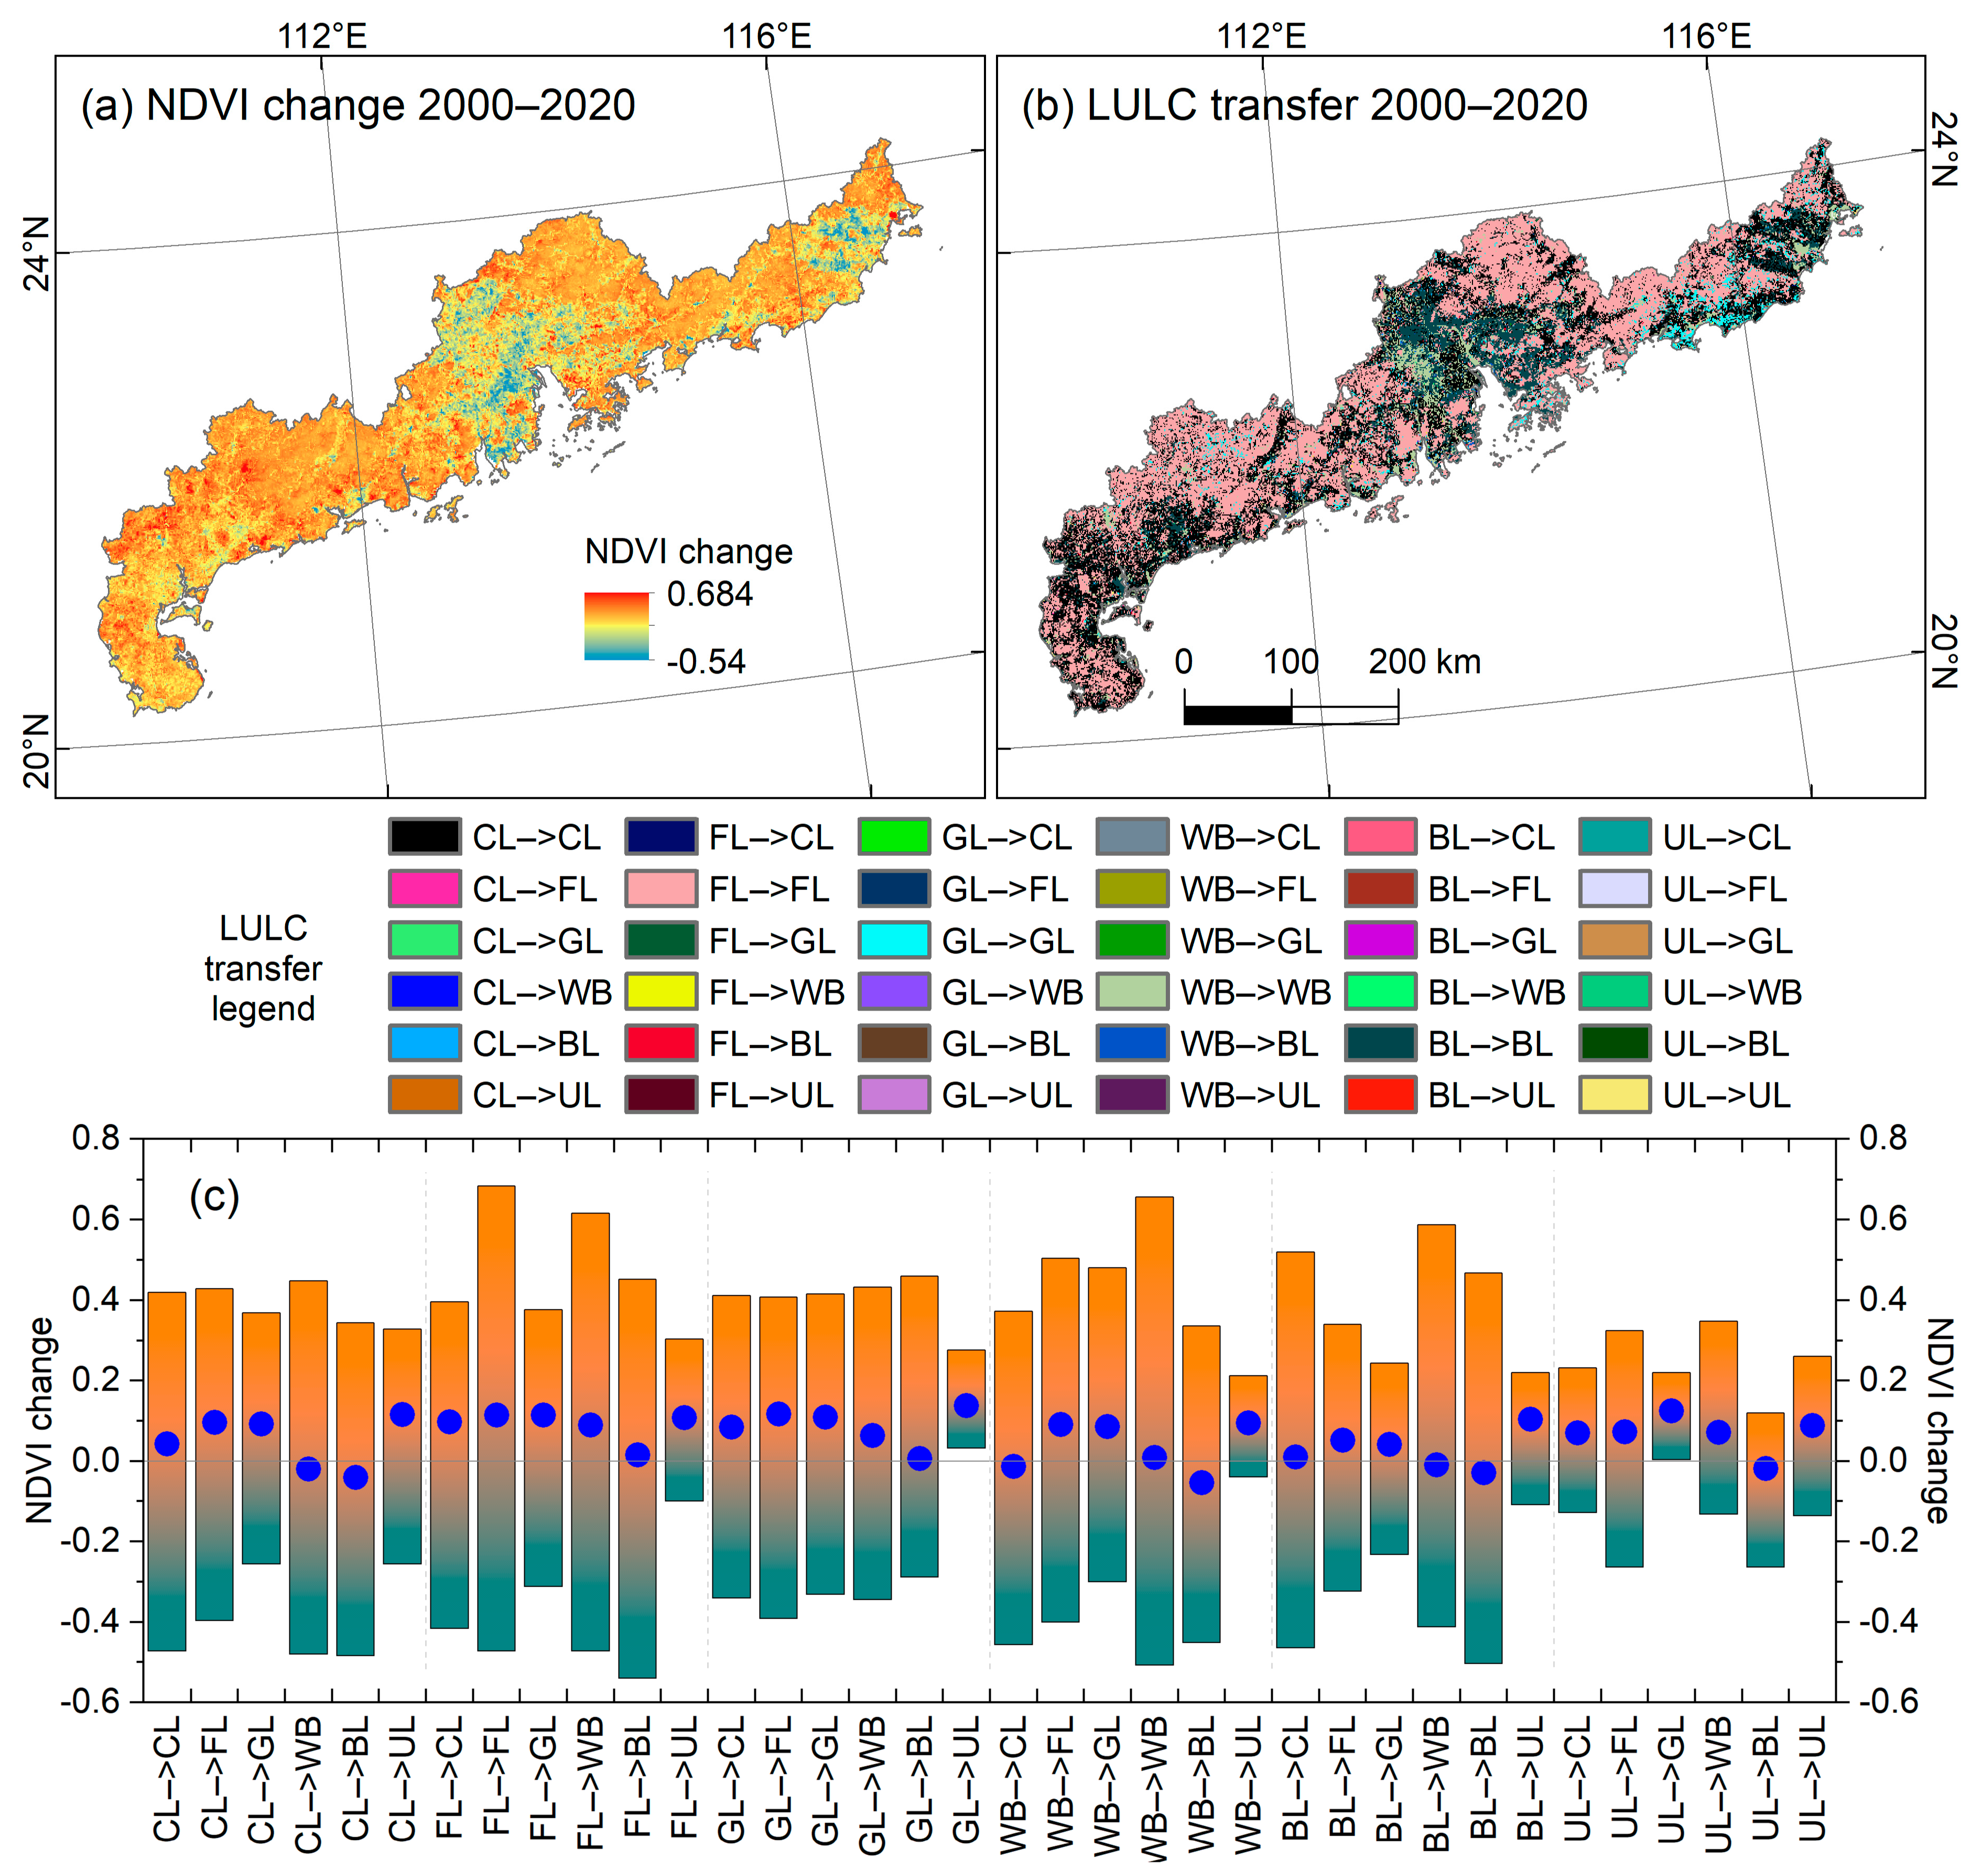
The NDVI changes from 2000 to 2020 show that the vegetation coverage change in the coastal region of the Guangdong Province generally had positive values (improving), especially in the mountainous and hilly areas in the west and north, and the Pearl River Delta in the middle had a larger negative value (deterioration) (Figure 7a). Corresponding to the deterioration of vegetation coverage, the LULC change in the Pearl River Delta from 2000 to 2020 was characterized by the mutual transfer of cultivated land, built-up land and water bodies, as well as the mutual transfer with other LULCs (Figure 7b). The LULC types in regions with improved vegetation coverage in the north and west were mainly forest land, with relatively few changes.
The response of the NDVI changes to LULC changes indicates that in almost all LULC transfers and NDVI changes, both improvement and deterioration coexist (Figure 7c). The transfer of cultivated land to other LULC types resulted in NDVI changes ranging from −0.484 to 0.428 (mean −0.041 to 0.115). The NDVI change caused by the transfer of forest land to other LULC types was the most significant, reaching −0.54–0.684 (mean 0.015–0.115), while the NDVI change caused by the transfer of cultivated land to built-up land was higher than that of all other LULC transfers. The transfer of grassland to other LULC types resulted in NDVI changes ranging from −0.392 to 0.46 (mean 0.006 to 0.138). The transfer of water bodies to other LULC types resulted in NDVI changes ranging from −0.508 to 0.656 (mean −0.053 to 0.095). The transfer of built-up land to other LULC types resulted in NDVI changes ranging from −0.504 to 0.588 (mean −0.01 to 0.104), and the transfer of unused land to other LULC types resulted in NDVI changes ranging from −0.264 to 0.348 (mean −0.019 to 0.088).

3.3.2. Contribution Rate Index

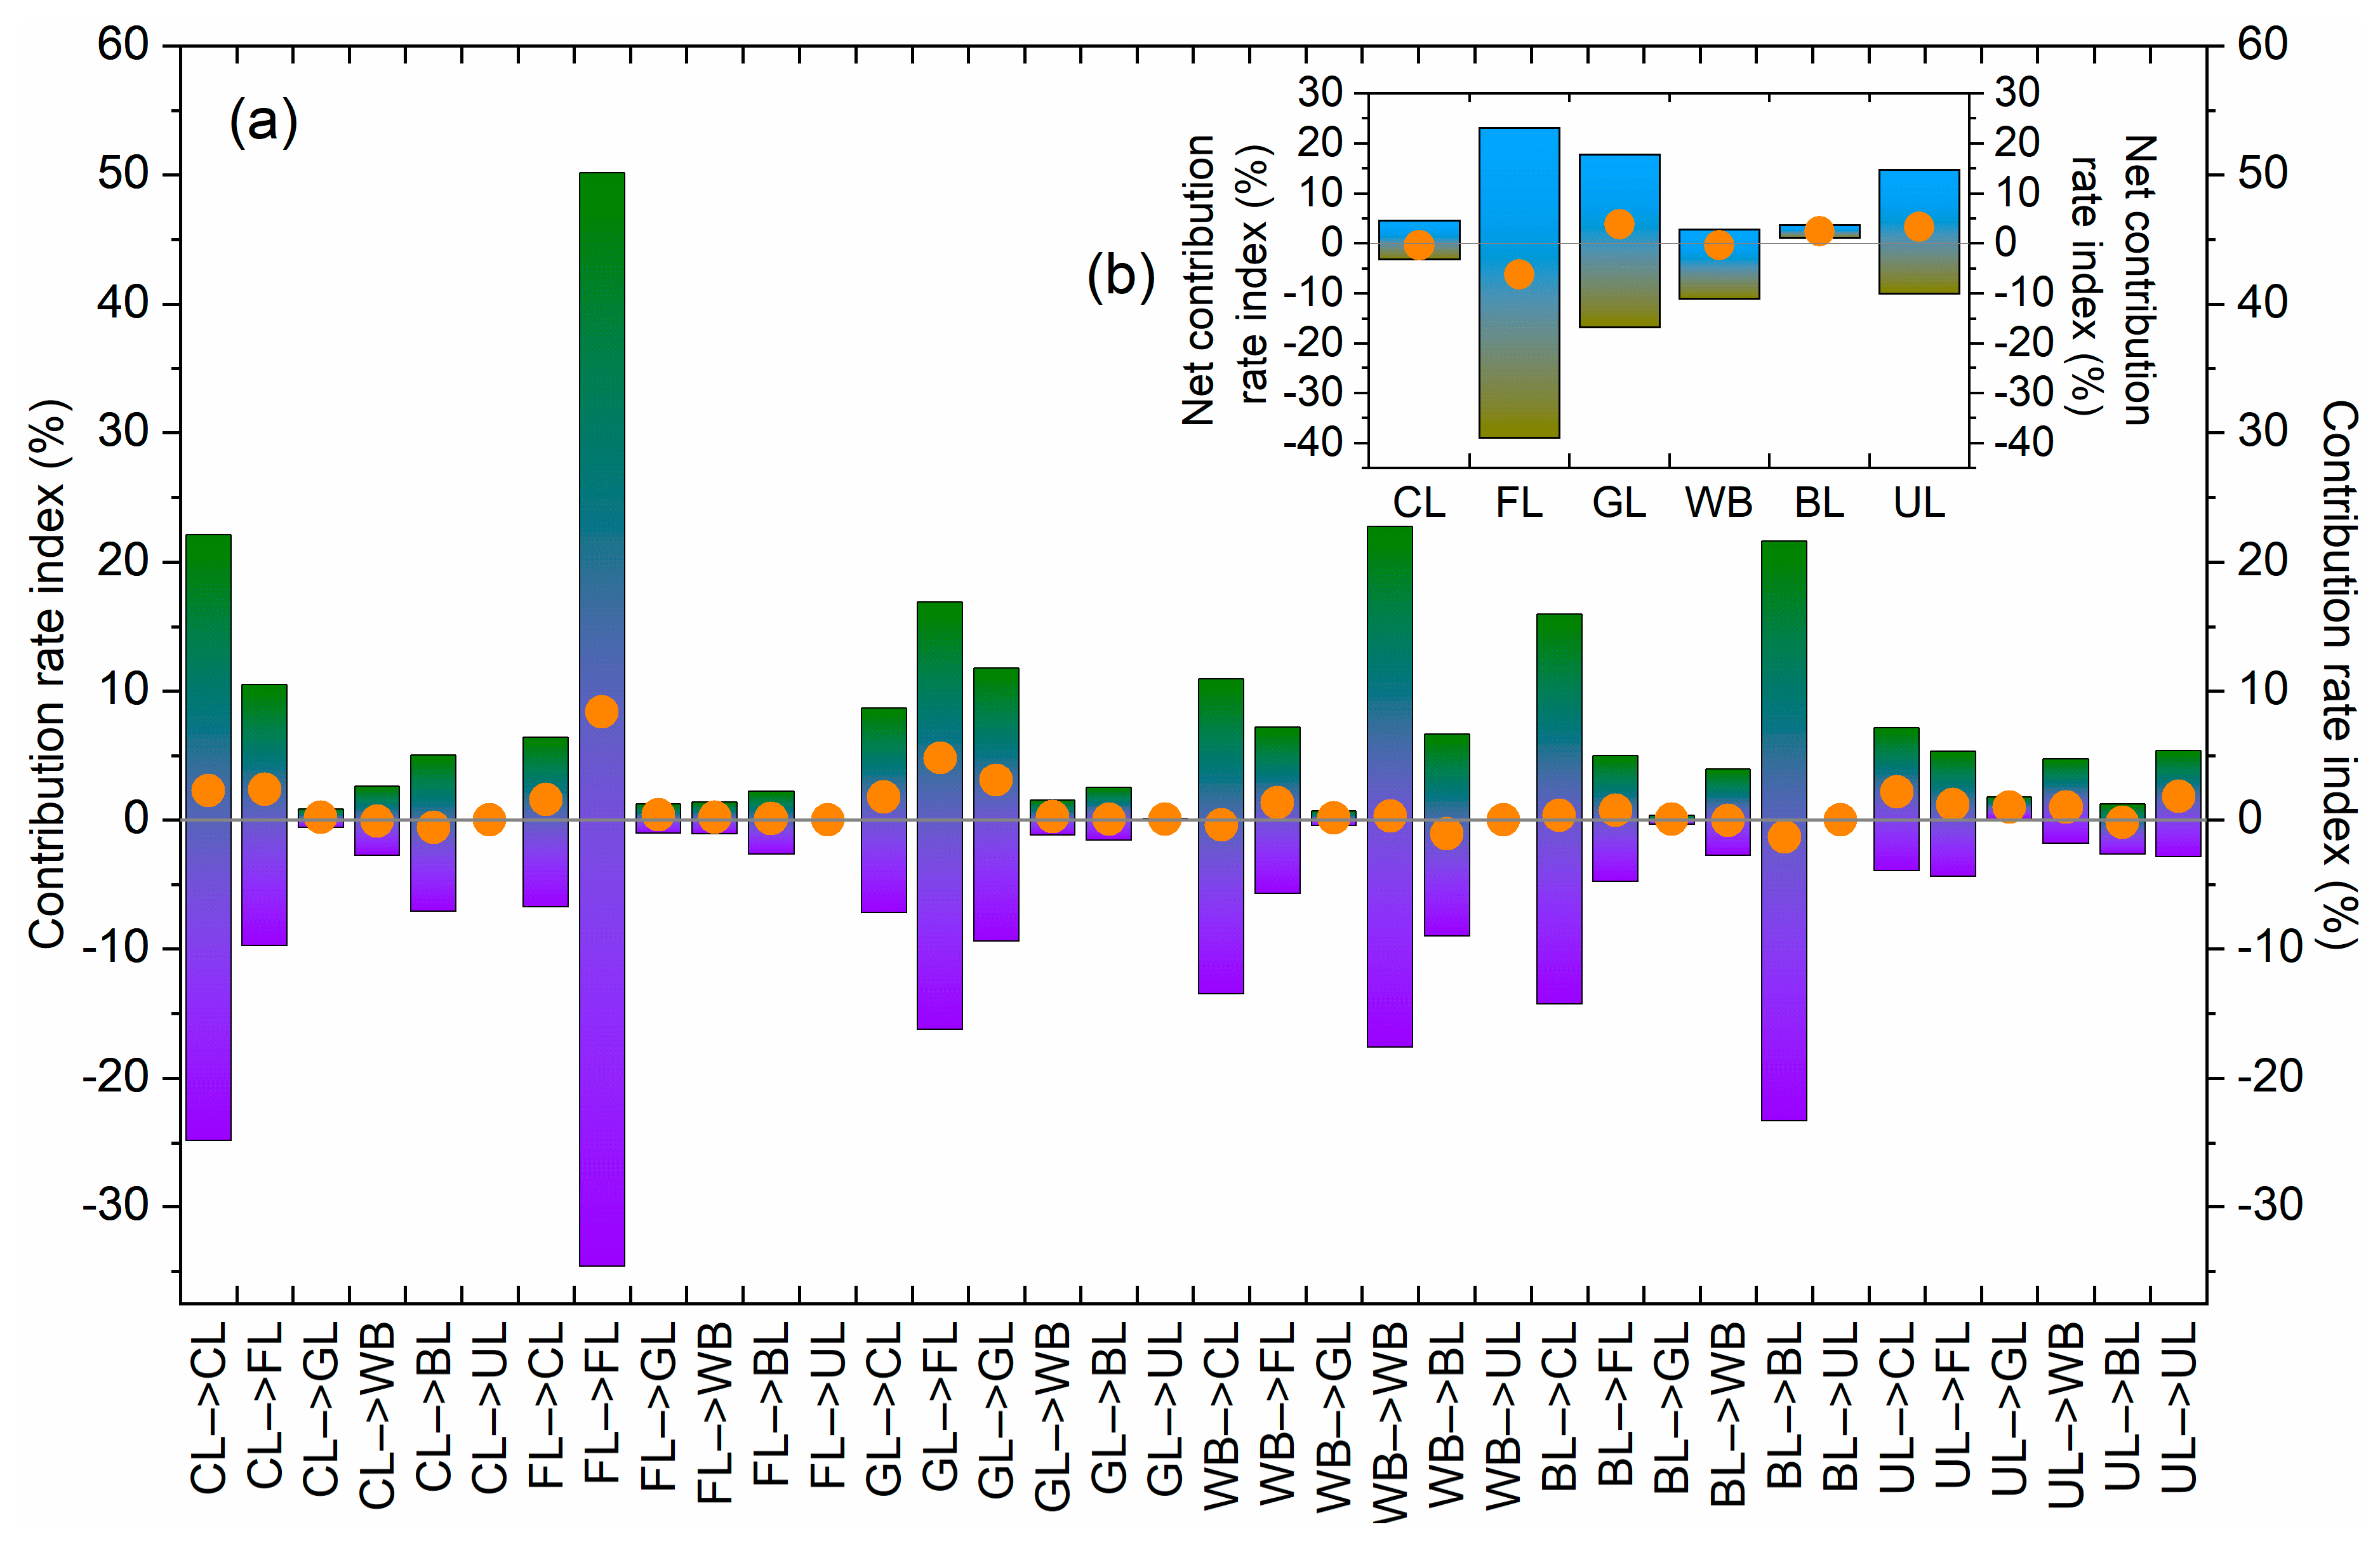
The contribution rate index indicates that the contribution of vegetation coverage changes in regions where farmland, forest land, water bodies, and built-up land remain unchanged is greater than the transfer of corresponding LULC types to other types (Figure 8a). The contribution rate of cultivated land change to vegetation coverage change is −24.837% to 22.1% (mean −0.597% to 2.372%), while the contribution rate of cultivated land transfer to water bodies (−0.116%) and built-up land (−0.597%) is lower than 0%, indicating the deterioration of vegetation coverage. Among all LULC transfer types, the region with unchanged forest land has the largest variation in contributions to vegetation coverage change (−34.614% to 50.16%), with the highest average of 8.414%. The contribution rate of forest land transfer to other LULC types and vegetation coverage change is relatively small. The contribution rate of grassland change to vegetation coverage change is −16.239% to 16.902% (mean 0.035% to 4.82%). The contribution rate of water body changes to vegetation coverage changes is −13.446% to 22.747% (mean −1.063% to 1.306%). The contribution rate of changes in built-up land to vegetation coverage is −23.305% to 21.641% (mean −0.066% to 0.756%). The contribution rate of unused land change to vegetation coverage change is −4.368% to 7.177% (mean −0.19% to 2.173%).
The net contribution rate index shows that there are differences in the net contribution rate of different LULC change types to vegetation coverage change (Figure 8b). The net contribution rate of cultivated land change to vegetation coverage change is −3.086% to 4.628% (mean −0.39%), while the net contribution rate of forest land change to vegetation coverage change has the largest variation range (−38.903% to 23.144%), but the average is the lowest (−6.179%). The net contribution rate of grassland change to vegetation coverage change is smaller than that of forest land (−16.73% to 17.85%), but the average is the highest (3.805%). The net contribution rate of water body changes to vegetation coverage change is −10.996% to 2.858% (mean −0.292%). The net contribution rate of built-up land change to vegetation cover change has the smallest range (1.162% to 3.669%, mean 2.428%), all of which are positive values. The net contribution rate of unused land change to vegetation cover change is −9.922% to 14.82% (mean 3.309%).

4. Discussion

4.1. Changing Trends of NDVI and LULC

The spatiotemporal characteristics of vegetation coverage in the coastal regions of the Guangdong Province reflected by the NDVI showed that although there were fluctuations in areas and regions with different levels of vegetation coverage over time, the high coverage and above categories still occupied the majority of the region (Figure 3). The vegetation coverage changes were mainly in the plain regions, especially in urban agglomerations, which may reflect the impact of human activities on vegetation coverage (Figure 4). As it is a transitional region from the south subtropical zone to the north tropic zone [61,62], the natural environment here is relatively favorable, with widespread distribution of evergreen broad-leaved forests [75,76,77] resulting in high vegetation coverage. The reason for the improvement of vegetation coverage in the Guangdong Province, in addition to climate factors, may also be related to the greater emphasis on protecting the ecological environment.
The spatiotemporal characteristics of the LULC in the coastal areas of the Guangdong Province indicate that plain areas are conducive to urban construction. Here, manifests more in the conversion of cultivated land to built-up land, and the area of construction land is gradually expanding (Figure 5). The Guangdong–Hong Kong–Macao Greater Bay Area (GHMGBA) is a core development region of the Guangdong Province, and one of the main urban agglomerations in China. The LULC in this region also strongly demonstrates an increase in built-up land [6]. In addition, over time, different types of LULC transfer to each other more frequently. At the same time, it can also be observed that ecological environment protection has received attention, manifesting in the gradual slowing down of the dynamic increase inbuilt-up land changes, as well as the gradual slowing down of the dynamic decrease in cultivated land and the increase in grasslands and water bodies after 2010 (Table 2).

4.2. Response of NDVI Changes to LULC Changes

The NDVI improvement regions from 2000 to 2020 were mainly distributed in the northern and western mountainous and hilly regions, where the natural environment is good and levels of human activity are relatively low. The response characteristics indicate that the improved regions of the NDVI are more consistent with the unchanged regions of forest land, which may indicate that the protection of green spaces such as forest land has brought about an improvement in vegetation coverage. The deterioration of the NDVI mainly occured in the plains, which is consistent with the expansion of built-up land and may indicate human activities, especially the expansion of urban regions and the conversion of cultivated land and forest land into built-up land, thereby reducing the green space in the region. Therefore, attention should be paid to protecting vegetation during the construction process of urban agglomerations.
Anyway, the increase in vegetation coverage has become a reality in recent years. Since the Chinese government officially proposed “vigorously promoting ecological civilization construction” in 2012, ecological environment protection has been fully valued and actively implemented by governments and departments at all levels. The Land Space Plan of Guangdong Province in 2023 (2021–2035) and the Land Space Ecological Restoration Plan of Guangdong Province (2021–2035) were issued successively, aiming to optimize the land development pattern, repair the ecological environment problems arising from past development, coordinate development and security, promote the harmonious coexistence of humans and nature, and provide Guangdong with practices for the solid promotion of a Chinese path to modernization.

4.3. Limitations and Prospects

There are two main shortcomings in this study. One is the analysis of NDVI changes mainly in the context of LULC, which may not accurately describe all the reasons for the changes. There are many factors that affect vegetation coverage change, such as climate, which is an important factor. However, this is not the starting point of this study. The second is that the NDVI data are not made up consecutive annual data, but rather selected for the years 2000, 2005, 2010, 2015, and 2020. The advantage is that they correspond to the LULC data, but the disadvantage is that they may not be able to describe in detail the NDVI changes during the transition period or seasonal or shorter-term vegetation responses, and some levels may show sudden increases or decreases.
In the future, it is possible to consider (a) collecting continuous NDVI and LULC data for research, taking into account the impact of comprehensive factors such as climate. (b) At the same time, a more detailed analysis of the internal differences in coastal areas is needed, such as between rural and urban areas where there are different economic and environmental dynamics. (c) In addition, it is necessary to strengthen research on the effects of NDVI and LULC changes, such as their impact on the land surface temperature [78,79,80].

5. Conclusions

The purpose of this study was to explore the response characteristics of vegetation coverage changes in coastal regions to LULC changes. NDVI and LULC data from 2000, 2005, 2010, 2015, and 2020 were divided into six categories and the distribution characteristics of the NDVI and LULC were analyzed in sequence. The change characteristics during the transition period were analyzed using a Sankey diagram and dynamic analysis. Finally, the spatial response characteristics and contribution index were used to quantify the response of vegetation coverage changes to LULC changes. The main results are as follows.
(1)
The overall vegetation coverage in the coastal regions of the Guangdong Province is relatively high, with higher coverage and above being the main categories (accounting for 85.37% to 89.48%) and high coverage mainly distributed in the east and west. From 2000 to 2020, the vegetation coverage in this region gradually increased overall, but decreased in the central region. There were spatiotemporal differences in the transfer of different vegetation coverage levels, and over time, the transfer became increasingly frequent;
(2)
The LULC structure mainly comprises forest land (46.5% to 47.5%) and cultivated land (30.7% to 33.4%), with forest land mainly distributed in relatively high-altitude regions and cultivated land mainly distributed in the plains. In terms of space, forest land and cultivated land remain dominant. In terms of time, the changes in LULC from 2015 to 2020 were relatively significant, especially the mutual transfer of cultivated land and forest land. The built-up land continued to increase from 2000 to 2020, but the speed gradually slowed down;
(3)
The change in vegetation coverage showed a trend of improvement on the whole, especially in the western and central mountainous and hilly regions, but in the central the Pearl River Delta there was a large regional deterioration. The NDVI change caused by the transfer of forest land to other land was the most significant. The net contribution rate of forest land change to vegetation coverage change had the largest range (−38.903% to 23.144%), but the average was the lowest (−6.179%).

Author Contributions

Z.C.: conceptualization, data curation, methodology, writingߞoriginal draft preparation; S.X.: writingߞreview and editing, supervision, funding. All authors have read and agreed to the published version of the manuscript.

Funding

This work was supported by the National Natural Science Foundation of China (Grants 42376226 and 41877411).

Institutional Review Board Statement

Not applicable.

Informed Consent Statement

Not applicable.

Data Availability Statement

All data supporting the findings of this study are included within the article. Data will be made available from authors on reasonable request.

Conflicts of Interest

The authors declare no conflict of interest.

References

  1. Chen, J.; Shao, Z.; Deng, X.; Huang, X.; Dang, C. Vegetation as the catalyst for water circulation on global terrestrial ecosystem. Sci. Total Environ. 2023, 895, 165071. [Google Scholar] [CrossRef] [PubMed]
  2. Ding, Y.; Feng, Y.; Chen, K.; Zhang, X. Analysis of spatial and temporal changes in vegetation cover and its drivers in the Aksu River Basin, China. Sci. Rep. 2024, 14, 10165. [Google Scholar] [CrossRef] [PubMed]
  3. Recuero, L.; Litago, J.; Pinzón, J.E.; Huesca, M.; Moyano, M.C.; Palacios-Orueta, A. Mapping periodic patterns of global vegetation based on spectral analysis of NDVI time series. Remote Sens. 2019, 11, 2497. [Google Scholar] [CrossRef]
  4. Fensholt, R.; Langanke, T.; Rasmussen, K.; Reenberg, A.; Prince, S.D.; Tucker, C.; Scholes, R.J.; Le, Q.B.; Bondeau, A.; Eastman, R.; et al. Greenness in semi-arid areas across the globe 1981–2007—An Earth Observing Satellite based analysis of trends and drivers. Remote Sens. Environ. 2012, 121, 144–158. [Google Scholar] [CrossRef]
  5. Jiang, F.; Deng, M.; Long, Y.; Sun, H. Spatial pattern and dynamic change of vegetation greenness from 2001 to 2020 in Tibet, China. Front. Plant Sci. 2022, 13, 892625. [Google Scholar] [CrossRef]
  6. Wang, X.; Liu, G.; Xiang, A.; Qureshi, S.; Li, T.; Song, D.; Zhang, C. Quantifying the human disturbance intensity of ecosystems and its natural and socioeconomic driving factors in urban agglomeration in South China. Environ. Sci. Pollut. Res. 2022, 29, 11493–11509. [Google Scholar] [CrossRef]
  7. Zhang, T.; Cheng, C.; Wu, X. Mapping the spatial heterogeneity of global land use and land cover from 2020 to 2100 at a 1 km resolution. Sci. Data 2023, 10, 748. [Google Scholar] [CrossRef]
  8. Yang, L.; Shi, L.; Li, J.; Kong, H. Spatio-temporal pattern change of LULC and its response to climate in the Loess Plateau, China. Sci. Rep. 2024, 14, 23202. [Google Scholar] [CrossRef]
  9. He, Q.; Silliman, B.R. Climate change, human impacts, and coastal ecosystems in the Anthropocene. Curr. Biol. 2019, 29, R1021–R1035. [Google Scholar] [CrossRef]
  10. Allan, H.; Levin, N.; Kark, S. Quantifying and mapping the human footprint across Earth’s coastal areas. Ocean Coast. Manag. 2023, 236, 106476. [Google Scholar] [CrossRef]
  11. Barragán, J.M.; De Andrés, M. Analysis and trends of the world’s coastal cities and agglomerations. Ocean Coast. Manag. 2015, 114, 11–20. [Google Scholar] [CrossRef]
  12. Day, J.W.; Gunn, J.D.; Burger, J.R. Diminishing opportunities for sustainability of coastal cities in the anthropocene: A review. Front. Environ. Sci. 2021, 9, 663275. [Google Scholar] [CrossRef]
  13. Wei, S.; Zhang, H.; Xu, Z.; Lin, G.; Lin, Y.; Liang, X.; Ling, J.; Wee, A.K.S.; Lin, H.; Zhou, Y.; et al. Coastal urbanization may indirectly positively impact growth of mangrove forests. Commun. Earth Environ. 2024, 5, 608. [Google Scholar] [CrossRef]
  14. Tapas, M.R.; Do, S.K.; Etheridge, R.; Lakshmi, V. Investigating the impacts of climate change on hydroclimatic extremes in the Tar-Pamlico River basin, North Carolina. J. Environ. Manag. 2024, 363, 121375. [Google Scholar] [CrossRef]
  15. Lakshmi, V.; Lakshmi, V. Enhancing human resilience against climate change: Assessment of hydroclimatic extremes and sea level rise impacts on the Eastern Shore of Virginia, United States. Sci. Total Environ. 2024, 947, 174289. [Google Scholar] [CrossRef]
  16. Tapas, M.R.; Etheridge, R.; Finlay, C.G.; Peralta, A.L.; Bell, N.; Xu, Y.; Lakshmi, V. A methodological framework for assessing sea level rise impacts on nitrate loading in coastal agricultural watersheds using SWAT+: A case study of the Tar-Pamlico River basin, North Carolina, USA. Sci. Total Environ. 2024, 951, 175523. [Google Scholar] [CrossRef]
  17. da Silva, V.S.; Salami, G.; da Silva, M.I.O.; Silva, E.A.; Monteiro Junior, J.J.; Alba, E. Methodological evaluation of vegetation indexes in land use and land cover (LULC) classification. Geol. Ecol. Landsc. 2020, 4, 159–169. [Google Scholar] [CrossRef]
  18. Liu, Y.; Wang, X.; Guo, M.; Tani, H.; Matsuoka, N.; Matsumura, S. Spatial and temporal relationships among NDVI, climate factors, and land cover changes in Northeast Asia from 1982 to 2009. GISci. Remote Sens. 2011, 48, 371–393. [Google Scholar] [CrossRef]
  19. Li, P.; Wang, J.; Liu, M.; Xue, Z.; Bagherzadeh, A.; Liu, M. Spatio-temporal variation characteristics of NDVI and its response to climate on the Loess Plateau from 1985 to 2015. Catena 2021, 203, 105331. [Google Scholar] [CrossRef]
  20. Qu, S.; Wang, L.; Lin, A.; Yu, D.; Yuan, M. Distinguishing the impacts of climate change and anthropogenic factors on vegetation dynamics in the Yangtze River Basin, China. Ecol. Indic. 2020, 108, 105724. [Google Scholar] [CrossRef]
  21. Camps-Valls, G.; Campos-Taberner, M.; Moreno-Martínez, Á.; Walther, S.; Duveiller, G.; Cescatti, A.; Mahecha, M.D.; Muñoz-Marí, J.; García-Haro, F.J.; Guanter, L.; et al. A unified vegetation index for quantifying the terrestrial biosphere. Sci. Adv. 2021, 7, eabc7447. [Google Scholar] [CrossRef] [PubMed]
  22. Jacquin, A.; Sheeren, D.; Lacombe, J.P. Vegetation cover degradation assessment in Madagascar savanna based on trend analysis of MODIS NDVI time series. Int. J. Appl. Earth Obs. Geoinf. 2010, 12, S3–S10. [Google Scholar] [CrossRef]
  23. Jin, H.; Chen, X.; Wang, Y.; Zhong, R.; Zhao, T.; Liu, Z.; Tu, X. Spatio-temporal distribution of NDVI and its influencing factors in China. J. Hydrol. 2021, 603, 127129. [Google Scholar] [CrossRef]
  24. Hosen, M.K.; Alam, M.S.; Chakraborty, T.; Golder, M.R. Monitoring spatiotemporal and seasonal variation of agricultural drought in Bangladesh using MODIS-derived vegetation health index. J. Earth Syst. Sci. 2023, 132, 188. [Google Scholar] [CrossRef]
  25. Li, S.; Xu, L.; Jing, Y.; Yin, H.; Li, X.; Guan, X. High-quality vegetation index product generation: A review of NDVI time series reconstruction techniques. Int. J. Appl. Earth Obs. Geoinf. 2021, 105, 102640. [Google Scholar] [CrossRef]
  26. Huang, S.; Tang, L.; Hupy, J.P.; Wang, Y.; Shao, G. A commentary review on the use of normalized difference vegetation index (NDVI) in the era of popular remote sensing. J. For. Res. 2021, 32, 1–6. [Google Scholar] [CrossRef]
  27. Xu, Y.; Yang, Y.; Chen, X.; Liu, Y. Bibliometric analysis of global NDVI research trends from 1985 to 2021. Remote Sens. 2022, 14, 3967. [Google Scholar] [CrossRef]
  28. Chen, Y.; Ma, L.; Liu, T.; Huang, X.; Sun, G. The Synergistic Effect between Precipitation and Temperature for the NDVI in Northern China from 2000 to 2018. Appl. Sci. 2023, 13, 8425. [Google Scholar] [CrossRef]
  29. Li, X.; Wang, Y.; Zhao, Y.; Zhai, J.; Liu, Y.; Han, S.; Liu, K. Research on the Impact of Climate Change and Human Activities on the NDVI of Arid Areas—A Case Study of the Shiyang River Basin. Land 2024, 13, 533. [Google Scholar] [CrossRef]
  30. Li, J. Responses of Vegetation NDVI to Climate Change and Land Use in Ordos City, North China. Appl. Sci. 2022, 12, 7288. [Google Scholar] [CrossRef]
  31. Chai, H.; Guan, P.; Hu, J.; Geng, S.; Ding, Y.; Xu, H.; Zhao, Y.; Xu, M. Temporal and Spatial Variations in the Normalized Difference Vegetation Index in Shanxi Section of the Yellow River Basin and Coal Mines and Their Response to Climatic Factors. Appl. Sci. 2023, 13, 12596. [Google Scholar] [CrossRef]
  32. Huang, Y.; Jin, Y.; Chen, S. The Spatiotemporal Dynamics of Vegetation Cover and Its Response to the Grain for Green Project in the Loess Plateau of China. Forests 2024, 15, 1949. [Google Scholar] [CrossRef]
  33. Qiao, X.; Zhang, J.; Liu, L.; Zhang, J.; Zhao, T. Spatiotemporal Changes in Vegetation Cover during the Growing Season and Its Implications for Chinese Grain for Green Program in the Luo River Basin. Forests 2024, 15, 1649. [Google Scholar] [CrossRef]
  34. Li, Y.; Sun, J.; Wang, M.; Guo, J.; Wei, X.; Shukla, M.K.; Qi, Y. Spatiotemporal variation of fractional vegetation cover and its response to climate change and topography characteristics in Shaanxi Province, China. Appl. Sci. 2023, 13, 11532. [Google Scholar] [CrossRef]
  35. Liu, S.; Gu, Y.; Wang, H.; Lin, J.; Zhuo, P.; Ao, T. Response of Vegetation Coverage to Climate Drivers in the Min-Jiang River Basin along the Eastern Margin of the Tibetan Plat-Eau, 2000–2022. Forests 2024, 15, 1093. [Google Scholar] [CrossRef]
  36. Qi, G.; Cong, N.; Luo, M.; Qiu, T.; Rong, L.; Ren, P.; Xiao, J. Contribution of Climatic Change and Human Activities to Vegetation Dynamics over Southwest China during 2000–2020. Remote Sens. 2024, 16, 3361. [Google Scholar] [CrossRef]
  37. Jin, K.; Jin, Y.; Li, C.; Li, L. Spatial and Temporal Dynamics in Vegetation Greenness and Its Response to Climate Change in the Tarim River Basin, China. ISPRS Int. J. Geo-Inf. 2024, 13, 304. [Google Scholar] [CrossRef]
  38. Han, Q.; Xue, L.; Qi, T.; Liu, Y.; Yang, M.; Chu, X.; Liu, S. Dynamic Spatiotemporal Evolution and Driving Mechanisms of Vegetation in the Lower Reaches of the Tarim River, China. Water 2024, 16, 2157. [Google Scholar] [CrossRef]
  39. Dong, D.; Zhao, Z.; Gao, H.; Zhou, Y.; Gong, D.; Du, H.; Fujioka, Y. Analysis of Spatiotemporal Evolution and Driving Forces of Vegetation from 2001 to 2020: A Case Study of Shandong Province, China. Forests 2024, 15, 1245. [Google Scholar] [CrossRef]
  40. Chen, P.; Pan, H.; Xu, Y.; He, W.; Yao, H. Spatial-Temporal Evolution Characteristics and Driving Force Analysis of NDVI in Hubei Province, China, from 2000 to 2022. Forests 2024, 15, 719. [Google Scholar] [CrossRef]
  41. Zhang, D.; Yi, M.; Sun, Z.; Wang, Y.; Sui, K. Changes in Vegetation Greenness and Responses to Land Use Changes in the Yongding River Basin (in North China) from 2002 to 2022. Agronomy 2024, 14, 2292. [Google Scholar] [CrossRef]
  42. Huang, Y.; Li, X.; Liu, D.; Duan, B.; Huang, X.; Chen, S. Evaluation of vegetation restoration effectiveness along the Yangtze River shoreline and its response to land use changes. Sci. Rep. 2024, 14, 7611. [Google Scholar] [CrossRef] [PubMed]
  43. Sun, W.; Song, X.; Mu, X.; Gao, P.; Wang, F.; Zhao, G. Spatiotemporal vegetation cover variations associated with climate change and ecological restoration in the Loess Plateau. Agric. For. Meteorol. 2015, 209, 87–99. [Google Scholar] [CrossRef]
  44. Jiang, L.; Bao, A.; Guo, H.; Ndayisaba, F. Vegetation dynamics and responses to climate change and human activities in Central Asia. Sci. Total Environ. 2017, 599, 967–980. [Google Scholar] [CrossRef]
  45. Liu, G.; Xiang, A.; Wan, Z.; Lv, H.; Liu, H.; Hu, Z.; Chen, L. Phenological changes of woody plants in the southern and northern regions of Nanling Mountains and their relationship with climatic factors. Forests 2023, 14, 2363. [Google Scholar] [CrossRef]
  46. Yu, S.; Du, W.; Zhang, X.; Hong, Y.; Liu, Y.; Hong, M.; Chen, S. Spatiotemporal changes in NDVI and its driving factors in the Kherlen River Basin. Chin. Geogr. Sci. 2023, 33, 377–392. [Google Scholar] [CrossRef]
  47. Liu, H.; Zheng, L.; Yin, S. Multi-perspective analysis of vegetation cover changes and driving factors of long time series based on climate and terrain data in Hanjiang River Basin, China. Arab. J. Geosci. 2018, 11, 509. [Google Scholar] [CrossRef]
  48. Do, S.K.; Nguyen, B.Q.; Tran, V.N.; Grodzka-Łukaszewska, M.; Sinicyn, G.; Lakshmi, V. Investigating the Future Flood and Drought Shifts in the Transboundary Srepok River Basin Using CMIP6 Projections. IEEE J. Sel. Top. Appl. Earth Obs. Remote Sens. 2024, 17, 7516–7529. [Google Scholar] [CrossRef]
  49. Sun, W.; Shao, Q.; Liu, J. Soil erosion and its response to the changes of precipitation and vegetation cover on the Loess Plateau. J. Geogr. Sci. 2013, 23, 1091–1106. [Google Scholar] [CrossRef]
  50. Fokeng, R.M.; Fogwe, Z.N. Landsat NDVI-based vegetation degradation dynamics and its response to rainfall variability and anthropogenic stressors in Southern Bui Plateau, Cameroon. Geosyst. Geoenviron. 2022, 1, 100075. [Google Scholar] [CrossRef]
  51. Deng, S.F.; Yang, T.B.; Zeng, B.; Zhu, X.F.; Xu, H.J. Vegetation cover variation in the Qilian Mountains and its response to climate change in 2000–2011. J. Mt. Sci. 2013, 10, 1050–1062. [Google Scholar] [CrossRef]
  52. Le, M.H.; Zhang, R.; Nguyen, B.Q.; Bolten, J.D.; Lakshmi, V. Robustness of gridded precipitation products for Vietnam basins using the comprehensive assessment framework of rainfall. Atmos. Res. 2023, 293, 106923. [Google Scholar] [CrossRef]
  53. Tran, T.N.D.; Nguyen, B.Q.; Grodzka-Łukaszewska, M.; Sinicyn, G.; Lakshmi, V. The role of reservoirs under the impacts of climate change on the Srepok River basin, Central Highlands of Vietnam. Front. Environ. Sci. 2023, 11, 1304845. [Google Scholar] [CrossRef]
  54. Nguyen, B.Q.; Vo, N.D.; Le, M.H.; Nguyen, Q.D.; Lakshmi, V.; Bolten, J.D. Quantification of global Digital Elevation Model (DEM)–A case study of the newly released NASADEM for a river basin in Central Vietnam. J. Hydrol. Reg. Stud. 2023, 45, 101282. [Google Scholar] [CrossRef]
  55. Nguyen, B.Q.; Van Binh, D.; Tran, T.N.D.; Kantoush, S.A.; Sumi, T. Response of streamflow and sediment variability to cascade dam development and climate change in the Sai Gon Dong Nai River basin. Clim. Dyn. 2024, 62, 7997–8017. [Google Scholar] [CrossRef]
  56. Zhao, L.; Wang, P.; Ouyang, X.; Wu, Z. An analysis of the spatio-temporal variation in fractional vegetation cover and its relationship with non-climate factors in Nanchang City, China. Acta Ecol. Sin. 2016, 36, 3723–3733. (In Chinese) [Google Scholar]
  57. Wang, S.; Zhang, L.; Lin, W.; Huang, Q.; Song, Y.; Ye, M. Study on vegetation coverage land-use change of Guangdong Province based on MODIS-NDVI. Acta Ecol. Sin. 2022, 42, 2149–2163. (In Chinese) [Google Scholar] [CrossRef]
  58. Bhimala, K.R.; Rakesh, V.; Prasad, K.R.; Mohapatra, G.N. Identification of vegetation responses to soil moisture, rainfall, and LULC over different meteorological subdivisions in India using remote sensing data. Theor. Appl. Climatol. 2020, 142, 987–1001. [Google Scholar] [CrossRef]
  59. Nguyen, B.Q.; Tran, T.N.D.; Grodzka-Łukaszewska, M.; Sinicyn, G.; Lakshmi, V. Assessment of urbanization-induced land-use change and its impact on temperature, evaporation, and humidity in central Vietnam. Water 2022, 14, 3367. [Google Scholar] [CrossRef]
  60. Machiwa, H.; Tian, B.; Sengupta, D.; Chen, Q.; Meadows, M.; Zhou, Y. Vegetation dynamics in response to human and climatic factors in the Tanzanian Coast. Front. Earth Sci. 2021, 15, 595–605. [Google Scholar] [CrossRef]
  61. Wang, X.; Zhong, W.; Li, T.; Quan, M.; Wang, B.; Wei, Z. A 16.2-kyr lacustrine sediment record of mercury deposition in Dahu Swamp, eastern Nanling Mountains, southern China: Analysis of implications for climatic changes. Quat. Int. 2021, 592, 12–21. [Google Scholar] [CrossRef]
  62. Wang, X.; Zhong, W.; Quan, M.; Li, T.; Lin, D.; Zhang, C. Asynchronous variations of mercury accumulation since the last deglaciation in the eastern and western Nanling mountains in South China. Quat. Sci. Rev. 2024, 325, 108490. [Google Scholar] [CrossRef]
  63. Wang, X.; Zhong, W.; Wang, B.; Quan, M.; Li, T.; Lin, D.; Shang, S.; Zhu, C.; Zhang, C.; Liao, Y. Spatial–temporal variations and pollution risks of mercury in water and sediments of urban lakes in Guangzhou City, South China. Environ. Sci. Pollut. Res. 2022, 29, 80817–80830. [Google Scholar] [CrossRef]
  64. Wang, X.; Liu, G.; Zhang, C.; Liao, Y. Spatial-temporal pattern and urban-rural gradient of comprehensive ecological security in urban agglomeration in South China from 2000 to 2020. Environ. Sci. Pollut. Res. 2023, 30, 102474–102489. [Google Scholar] [CrossRef]
  65. Xu, X. China Annual Normalized Difference Vegetation Index (NDVI) Spatial Distribution Dataset. Data Regist. Publ. Syst. Resour. Environ. Sci. Data Cent. Chin. Acad. Sci. 2018. (In Chinese) [Google Scholar] [CrossRef]
  66. Jiang, L.; Liu, Y.; Wu, S.; Yang, C. Analyzing ecological environment change and associated driving factors in China based on NDVI time series data. Ecol. Indic. 2021, 129, 107933. [Google Scholar] [CrossRef]
  67. Xu, X.; Liu, J.; Zhang, S.; Li, R.; Yan, C.; Wu, S. China multi period land use/land cover remote sensing monitoring dataset (CNLUCC). Data Regist. Publ. Syst. Resour. Environ. Sci. Data Cent. Chin. Acad. Sci. 2018. (In Chinese) [Google Scholar] [CrossRef]
  68. Li, S.; Su, S.; Liu, Y.; Zhou, X.; Luo, Q.; Paudel, B. Effectiveness of the Qilian Mountain nature reserve of China in reducing human impacts. Land 2022, 11, 1071. [Google Scholar] [CrossRef]
  69. Wang, X.; Liu, G.; Lin, D.; Lin, Y.; Lu, Y.; Xiang, A.; Xiao, S. Water yield service influence by climate and land use change based on InVEST model in the monsoon hilly watershed in South China. Geomat. Nat. Hazards Risk 2022, 13, 2024–2048. [Google Scholar] [CrossRef]
  70. Liu, G.; Xiang, A.; Huang, Y.; Zha, W.; Chen, Y.; Mao, B. Landscape changes and optimization in an ecological red line area: A case study in the Upper Reaches of the Ganjiang River. Int. J. Environ. Res. Public Health 2022, 19, 11530. [Google Scholar] [CrossRef]
  71. Wang, X.; Liu, G.; Xiang, A.; Xiao, S.; Lin, D.; Lin, Y.; Lu, Y. Terrain gradient response of landscape ecological environment to land use and land cover change in the hilly watershed in South China. Ecol. Indic. 2023, 146, 109797. [Google Scholar] [CrossRef]
  72. Liu, G.; Wang, X.; Xiang, A.; Wang, X.; Wang, B.; Xiao, S. Spatial heterogeneity and driving factors of land use change in the middle and upper reaches of Ganjiang River, southern China. Chin. J. Appl. Ecol. 2021, 32, 2545–2554. (In Chinese) [Google Scholar] [CrossRef]
  73. Yousafzai, S.; Saeed, R.; Rahman, G.; Farish, S. Spatio-temporal assessment of land use dynamics and urbanization: Linking with environmental aspects and DPSIR framework approach. Environ. Sci. Pollut. Res. 2022, 29, 81337–81350. [Google Scholar] [CrossRef] [PubMed]
  74. Yang, X.; Wang, J.; Qiao, N.; Bai, Z. Spatiotemporal variation pattern of production-living-ecological space and land use ecological risk and their relationship analysis: A case study of Changzhi City, China. Environ. Sci. Pollut. Res. 2023, 30, 66978–66993. [Google Scholar] [CrossRef]
  75. Zhong, W.; Cao, J.; Xue, J.; Ouyang, J. Last deglacial and Holocene vegetation evolution and climate variability in the subalpine western Nanling Mountains in South China. Holocene 2015, 25, 1330–1340. [Google Scholar] [CrossRef]
  76. Quan, M.; Zhong, W.; Wang, X.; Wang, B.; Li, T. Late-Holocene changes in vegetation composition and fire regimes in the subalpine western Nanling Mountains in subtropic China. Holocene 2023, 33, 707–717. [Google Scholar] [CrossRef]
  77. Du, Y.; Zhong, W.; Shang, S.; Wang, Z.; Wang, X.; Quan, M.; Li, T. Environmental magnetic records derived from lacustrine sediments in the Western Guangdong Province, China: Implications for Late-Holocene climatic/environmental changes. Holocene 2024, 34, 1534–1547. [Google Scholar] [CrossRef]
  78. Fu, P.; Weng, Q. A time series analysis of urbanization induced land use and land cover change and its impact on land surface temperature with Landsat imagery. Remote Sens. Environ. 2016, 175, 205–214. [Google Scholar] [CrossRef]
  79. Mehmood, M.S.; Rehman, A.; Sajjad, M.; Song, J.; Zafar, Z.; Zhai, S.; Qin, Y. Evaluating land use/cover change associations with urban surface temperature via machine learning and spatial modeling: Past trends and future simulations in Dera Ghazi Khan, Pakistan. Front. Ecol. Evol. 2023, 11, 1115074. [Google Scholar] [CrossRef]
  80. Ashraf, T.; Aslam, J.; Mehmood, M.S.; Ahamad, M.I.; Rehman, A. Geospatial assessment of built environment on land surface temperature in district Sheikhupura, Punjab Pakistan. Discov. Geosci. 2024, 2, 30. [Google Scholar] [CrossRef]
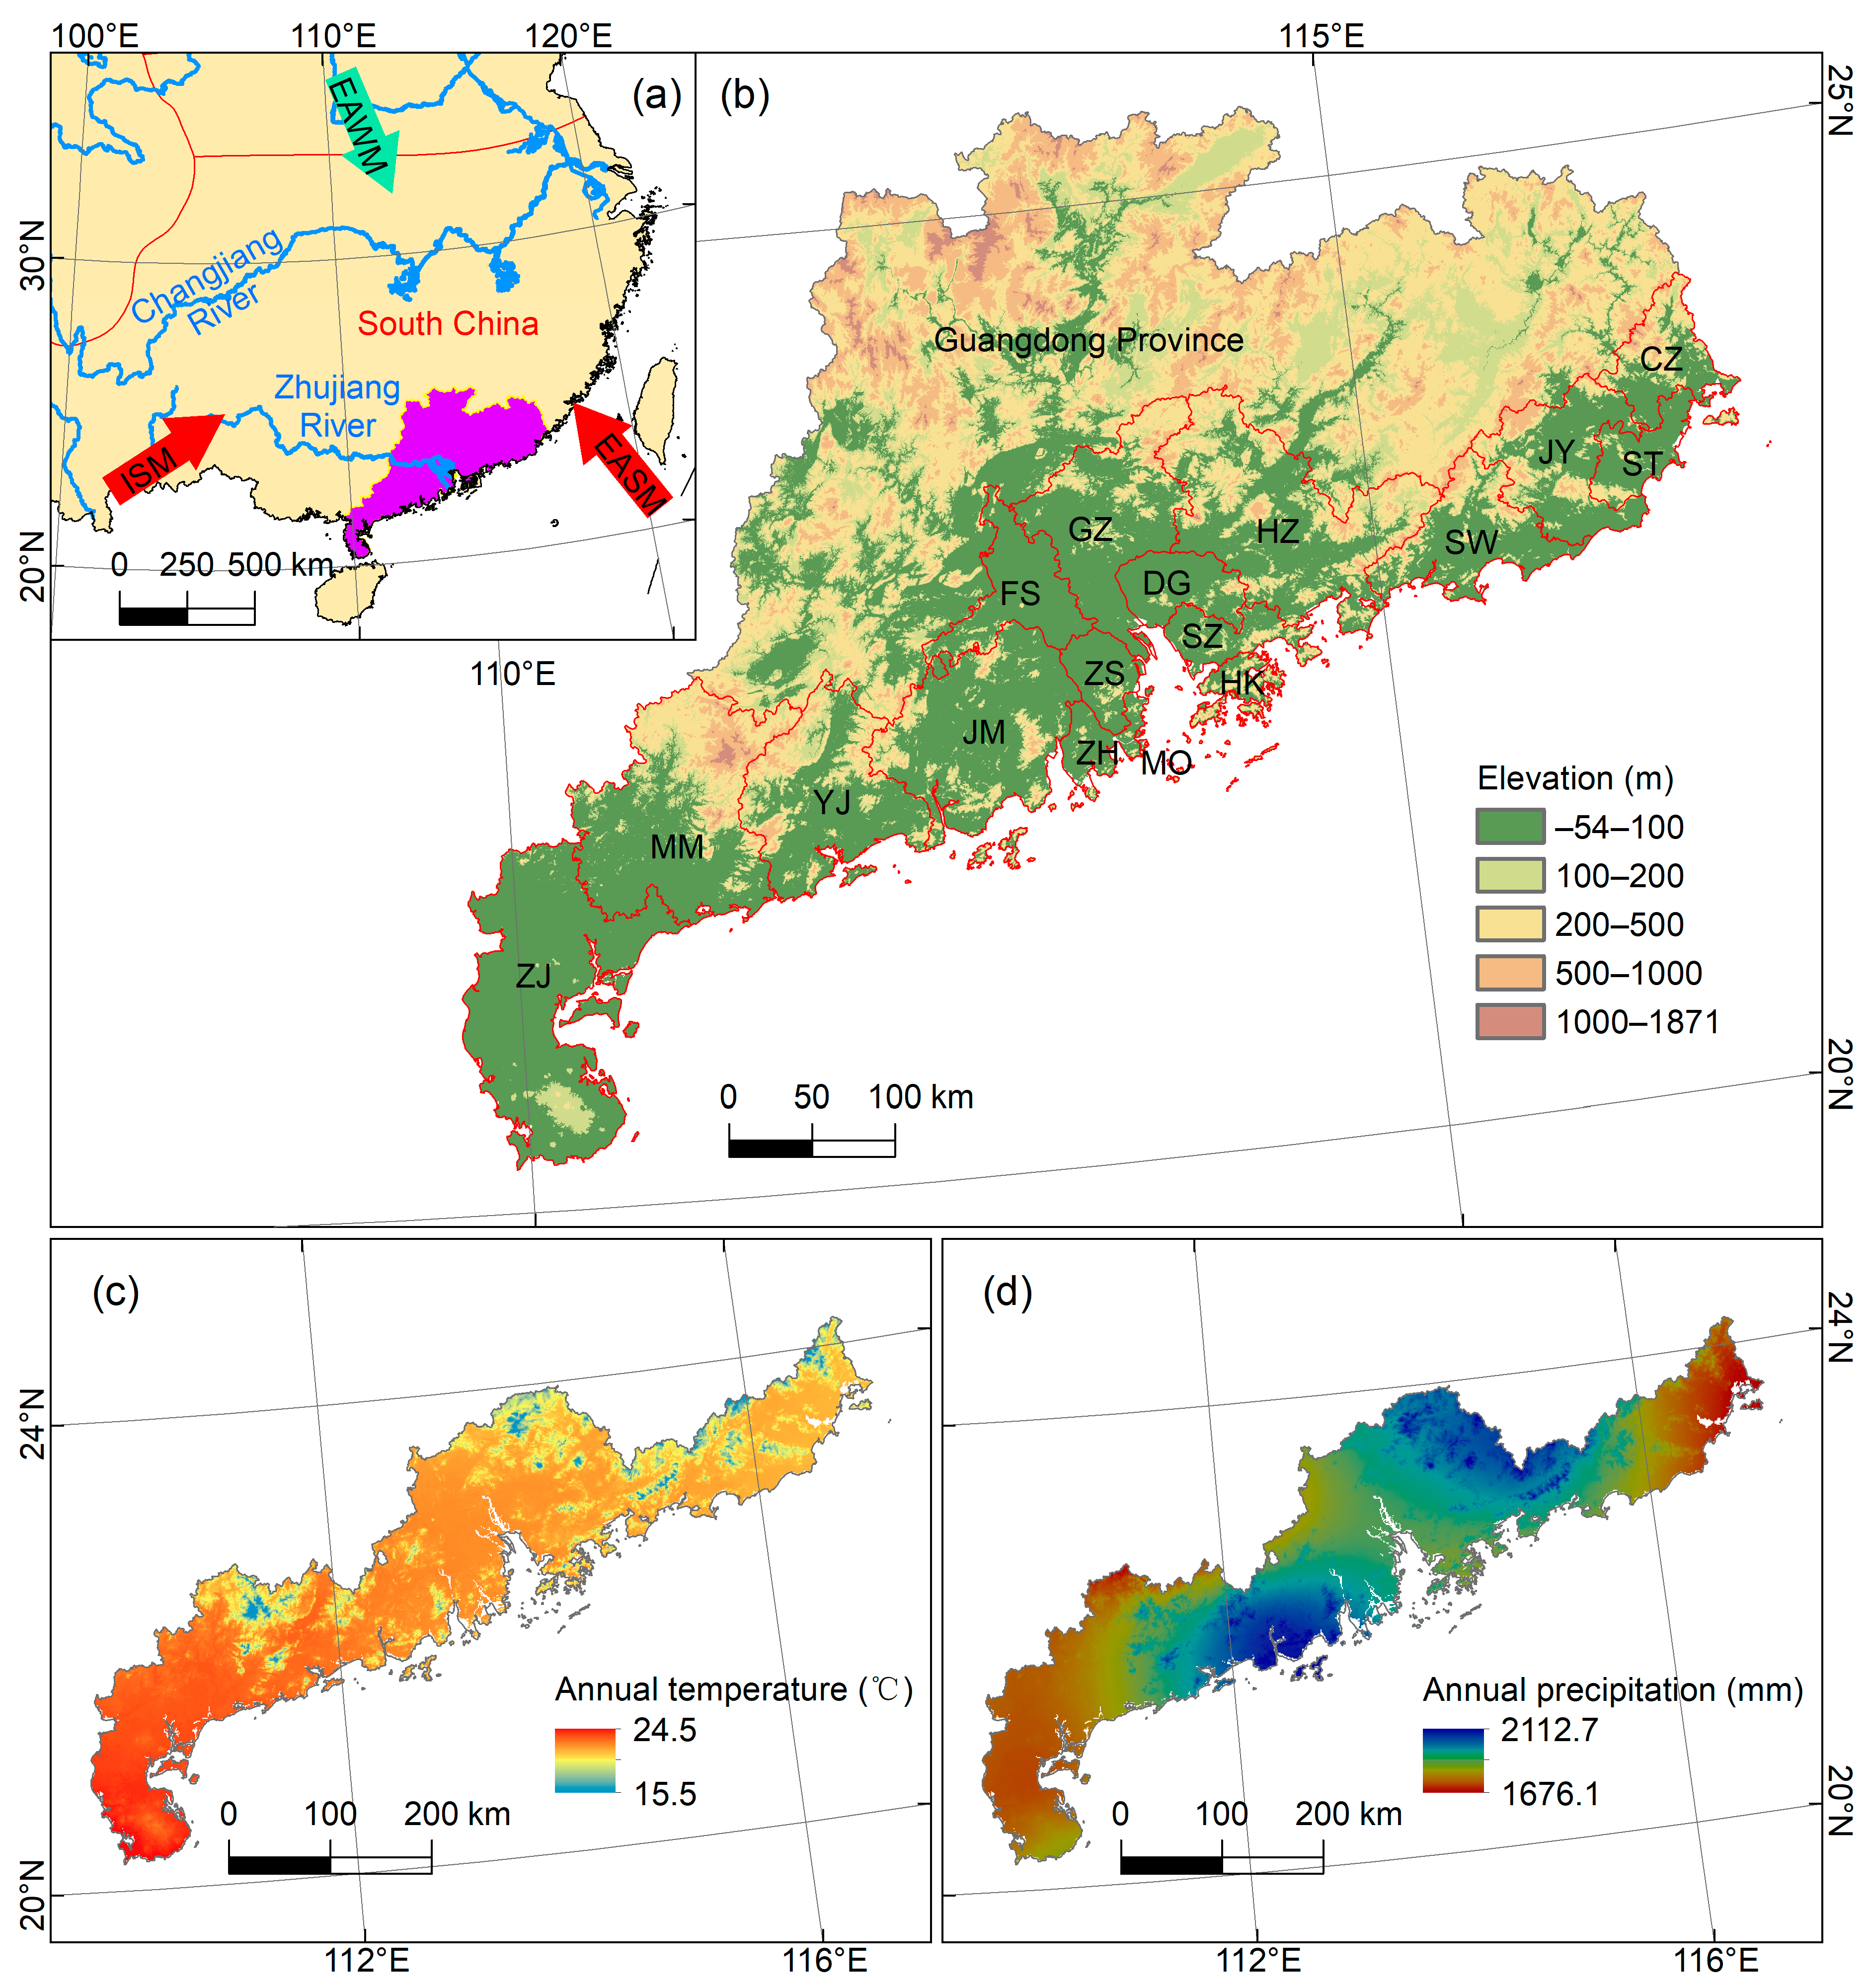
Figure 1. Study area. (a) Location of Guangdong Province in China, where ISM, EASM, and EAWM represent Indian summer monsoon, East Asian summer monsoon and East Asian winter monsoon, respectively [61,62]. (b) Elevation of Guangdong Province; (c,d) annual average temperature and precipitation in coastal cities of Guangdong Province.
Applsci 14 10694 g001
Figure 2. Research framework.
Applsci 14 10694 g002
Figure 3. NDVI spatiotemporal distribution from 2000 to 2020. (a) NDVI distribution and area proportion in 2020; (b) 2005; (c) 2010; (d) 2015; (e) 2020. The pie chart represents the area ratio, the same below.
Applsci 14 10694 g003
Figure 4. NDVI spatiotemporal change from 2000 to 2020. (a) Distribution of NDVI changes from 2000 to 2005, (b) 2005–2010, (c) 2010–2015, and (d) 2015–2020. (e) Sankey diagram visualizes the NDVI transition matrix.
Applsci 14 10694 g004
Figure 5. LULC spatiotemporal distribution from 2000 to 2020. (a) LULC distribution and area proportion in 2020, (b) 2005, (c) 2010, (d) 2015, and (e) 2020.
Applsci 14 10694 g005
Figure 6. LULC spatiotemporal change from 2000 to 2020. (a) Distribution of LULC changes from 2000 to 2005, (b) 2005–2010, (c) 2010–2015, and (d) 2015–2020. (e) Sankey diagram visualizes the LULC transition matrix.
Applsci 14 10694 g006
Figure 7. The distribution of vegetation coverage responses to LULC changes. (a) Distribution of NDVI change from 2000 to 2020. (b) Distribution of LULC transfer from 2000 to 2020. (c) Range and mean NDVI changes under different land-use transfers, where the upper and lower ends of the column represent the range of NDVI changes and the blue points represent the mean NDVI changes.
Applsci 14 10694 g007
Figure 8. The contribution rate index of vegetation coverage response to LULC changes. (a) The statistics of the contribution rate index of the LULC transfer to NDVI changes (b) Net contribution rate index of certain LULC types to other types (contribution rate index of total minus invariant region), where the upper and lower ends of the column represent the range of the contribution rate index, and the orange points represent the mean contribution rate index.
Applsci 14 10694 g008
Table 1. Dynamic degree of NDVI change (%).
2000–20052005–20102010–20152015–20202000–2020
NDVILC15−1045.714−2.6097.5
levelsLrC8.854−7.2216.4971.924.219
MC1.7840.1722.7140.4891.391
HrC−10.804−0.283−2.122−2.685−3.246
HC10.0960.149−6.893−1.736−0.463
VHC58405.666113.1384.52315340
CD34.48663.53627.11322.11167.936
Table 2. Dynamic degree of LULC change (%).
2000–20052005–20102010–20152015–20202000–2020
LULCCL−1.06−0.329−0.231−0.046−0.407
typesFL−0.105−0.055−0.178−0.09−0.106
GL−0.773−0.3220.599−0.635−0.284
WB−0.412−0.271−0.4570.187−0.236
BL5.6381.5361.4260.5922.612
UL−1.2500−1.333−0.625
CD2.6140.9790.90497.887106.306
Disclaimer/Publisher’s Note: The statements, opinions and data contained in all publications are solely those of the individual author(s) and contributor(s) and not of MDPI and/or the editor(s). MDPI and/or the editor(s) disclaim responsibility for any injury to people or property resulting from any ideas, methods, instructions or products referred to in the content.