Article

A Coordinated Bidding Strategy of Wind Power Producers and DR Aggregators Using a Cooperative Game Approach

1
College of Automation Engineering, Shanghai University of Electric Power, Shanghai 201399, China
2
School of Electric Power Engineering, Nanjing Institute of Technology, Nanjing 211167, China
*
Author to whom correspondence should be addressed.
Appl. Sci. 2024, 14(22), 10699; https://doi.org/10.3390/app142210699
Submission received: 13 October 2024 / Revised: 11 November 2024 / Accepted: 15 November 2024 / Published: 19 November 2024
(This article belongs to the Special Issue State-of-the-Art of Power Systems)

Abstract

:
The purpose of this paper is to analyze the profitability of wind energy and demand response (DR) resources participating in the energy and frequency regulation markets. Since wind power producers (WPPs) must reduce their output to provide up-regulation and DR aggregators (DRAs) have to purchase additional power to facilitate down-regulation, this may result in revenue loss. If WPPs coordinate with DRAs, these two costs could be reduced. Thus, it would be profitable for WPPs and DRAs to form a coalition to participate in the regulation market. To better utilize the frequency response characteristics of wind and DR resources, this paper proposes a cooperation scheme to optimize the bidding strategy of the coalition. Furthermore, cooperative game theory methods, including Nucleolus- and Shapley-value-based models, are employed to fairly allocate additional benefits among WPPs and DRAs. The uncertainties associated with wind power and the behavior of DR customers are modeled through stochastic programming. In the optimization process, the decision-maker’s attitude toward risks is considered using conditional value at risk (CVaR). Case studies demonstrate that the proposed bidding strategy can improve the performance of the coalition and lead to higher benefits for both WPPs and DRAs. Specifically, the expected revenue of the coordinated strategies increased by 12.1% compared to that of uncoordinated strategies.

1. Introduction

In recent years, the penetration of renewable energy has grown rapidly, and this may pose significant challenges in the frequency regulation (FR) of power systems [1]. Traditionally, frequency regulation has been largely offered by conventional power plants, i.e., thermal generators and hydropower plants. However, conventional power plants are gradually being displaced by renewable resources. The recent advancement of new technologies, i.e., wind power and demand response (DR) resources, presents new opportunities for regulation services [2]. According to recent research, wind power and DR have been demonstrated as promising approaches in offering FR [3].
However, there are several obstacles for the participation of wind energy and DR resources in the FR market, such as technical constraints, multiple uncertainties, and the difficulty of risk control. For example, wind generators must operate at a sub-optimal level to provide the up-regulation and DR aggregators (DRA) have to purchase additional power to allow for the down-regulation, which may result in a loss of revenue. Furthermore, the presence of multiple uncertainties including wind power and DR customers makes the problem more challenging. To this effect, this paper first analyzes the frequency response characteristics of wind and DR resources and then by taking advantage of their different frequency response characteristics, an appropriate coordinated trading strategy is developed to improve their potential benefits in the energy and FR markets.
Several studies have explored the use of wind power and demand response (DR) resources for frequency regulation (FR) services [4]. Ref. [5] developed a bidding strategy for wind power and large-scale EVs in the day-ahead energy and FR market. The Federal Energy Regulatory Commission (FERC) Order 755 encouraged DR resources to submit bids and offers in ancillary services markets [6]. Additionally, China’s National Grid issued a notice promoting large industrial loads, such as steel plants, to participate in the frequency regulation market [7]. Recent research has shown that DR resources can effectively track automatic generation control (AGC) signals [8]. In [9], an optimal bidding strategy for a virtual power plant (VPP) was proposed to maximize the profits of an aggregator of renewable energy, EVs, and flexible loads in energy, reserve, and regulation markets. In [10], a set of mixed-integer linear programming (MILP) models are proposed, and a bi-objective scheduling framework is introduced for the corresponding problem to obtain alternative solutions under each strategy. Ref. [11] introduces the economic theory of conceptualizing the benefits of environmental research and provides a framework for estimating these benefits. At the same time, it discusses environmental science assessments aimed at benefiting society by providing information for policy decisions. In [12], thermal systems in buildings are considered as a source of dynamic flexibility for frequency regulation and an optimization model was deployed to model the interactions among the ISO, aggregators, and the end users. In [13], an optimal model of electric vehicle (EV) load and wind utilities is formulated for joint day-ahead energy and regulation markets.
The above literature focused on evaluating the economics of wind energy and DR resources considering their participation in the FR market. However, few studies have investigated the frequency response characteristics of wind and DR resources for FR provision in detail. Notably, wind power and DR resources exhibit complementary features in frequency regulation: (a) Up-regulation means increasing generation or reducing load. For wind farms, this requires reducing their scheduled output, leading to regulation costs due to spilled power. In contrast, for DR resources, this translates into lower costs, such as reduced consumption. Hence, it is more cost-effective to dispatch DR resources for upward regulation. (b) Down-regulation means reducing generation or increasing load. For DR resources, this can lead to additional costs due to increased consumption. However, WPPs can benefit by reducing their generation, making them more suitable for downward regulation. Intuitively, cooperation between wind power and DR resources can reduce regulation costs and increase profits by leveraging their complementary characteristics in frequency regulation.
Additionally, the uncertainty of wind power output can lead to discrepancies between predicted and actual scheduled values, resulting in economic penalties. Similarly, the unpredictable behavior of customers introduces uncertainty in DR participation, which can further increase financial risks for market participants. Therefore, it is essential to incorporate uncertainty into the decision-making process. One common method to solve this problem is using stochastic programming to manage the uncertainties. Stochastic optimization has been employed in various studies to determine optimal bidding strategies under uncertain conditions. For example, Ref. [14] proposed a novel multi-objective optimization framework for uncertain integrated energy systems planning that includes demand response, where the uncertainty of regulation signals was addressed using a stochastic algorithm. Following this approach, we tackle the uncertainties associated with wind power and DR customers by utilizing a scenario-based stochastic optimization method.
Though numerous studies focus on the coordinated bidding strategy of wind power producers and DR aggregators, the following aspects deserve further investigation. (1) The recent literature does not comprehensively consider the complementary characteristics of wind energy and DR resources in the application of frequency regulation. (2) There is a scarcity of studies examining the incremental benefits derived from the collaboration between wind and DR resources, which leverages their complementary nature. Furthermore, limited research has been conducted on revenue allocation among different market participants, with previous studies often neglecting payoff distributions.
In view of the above, to better investigate the complementary characteristics of wind and DR resources, and enhance their performance in the market, an optimal coordinated bidding strategy and a fair allocation scheme are essential. In this paper, a coordinated framework for WPP and DR aggregators through the cooperative game theory method is developed. Within this framework, WPPs and DR aggregators form a coalition to participate in the combined day-ahead and real-time energy and frequency regulation markets, leveraging their complementary characteristics.
Overall, the main contributions of the paper are shown below:
  • Considering the complementary characteristics of wind power and DR resources, an appropriate coordinated bidding strategy using cooperative game theory is developed. Compared to existing studies on coordinated trading strategy for wind power and other resources, as proposed in this paper, wind power and DR resources can strategically perform regulation provision by taking advantage of their complementary characteristics.
  • Based on cooperative game theory, WPPs and DRAs form a coalition and strategically bid in both energy and regulation markets to achieve maximum benefits. Then, two different profit allocation methods are deployed to reasonably allocate the additional profits of the coalition to each player.
  • Uncertainties associated with wind outputs and DR are considered and represented by multiple scenarios. The conditional value-at-risk (CVaR) is employed to quantify the risks attributed to collaborative bidding decisions.
The rest of the paper is organized as follows. Section 2 presents a detailed description of the problem, including DR and uncertainty modeling and analysis of the complementary characteristics of wind and DR resources. The optimal bidding strategies are formulated in Section 3. Case studies and relevant results are performed in Section 4 and in Section 5, some conclusions are drawn.

2. Problem Description

In this paper, common settings of power market mechanisms are considered, which include energy and regulation markets [15]. We assume that WPPs and DR aggregators submit bids in the day-ahead energy and regulation markets and clear deviations in the real-time market. Since their capacities are relatively small compared to the conventional power plants, they are assumed to act as price-takers. Two trading strategies are explored: in the individual bidding scheme, WPPs and DR aggregators submit quantity-only bids to maximize their revenue, while in the coordinated bidding scheme, they form a coalition to bid strategically in both markets.

2.1. Complementary Characteristics of Wind and DR Resources

Wind power and DR resources have shown the ability to efficiently provide frequency regulation by tracking AGC signals. Wind generators are ideal for downward regulation due to their fast ramping and low costs when reducing generation, while up-regulation requires them to operate below full capacity, reducing profits. Conversely, DR resources profit more from up-regulation, reducing consumption, but incur added costs for downward regulation. Wind and DR resources complement each other, and a coordinated mechanism can optimize their use, reducing the cost of frequency regulation services.

2.2. Cooperation Scheme of Wind Power and DR Resource

Leveraging the complementary characteristics of wind and DR resources, a coordinated trading strategy for WPPs and DR aggregators providing energy and frequency regulation is proposed and the scheme is presented in Figure 1. To achieve higher revenue, WPPs and DR aggregators are formed as a coalition, to participate in the energy and regulation markets. For the energy part, the coalition submits bids to the day-ahead energy market and clear imbalance in the real-time market. For the regulation part, the coalition can strategically respond by using wind energy or DR resources when the regulation signals are updated to maximize total expected profits. Specifically, in the cooperation scheme, the up-regulation is provided by DR resources through measures like reducing electricity consumption among consumers under its management, while the down-regulation is offered from wind power by adjusting the power output of wind turbines within the allowed range.

2.3. DR Modeling

By participating in DR programs, the customers’ power consumption can be adjusted in response to the electricity prices or incentives. To maximize profits, it is necessary for DR aggregators to evaluate the potential of customers’ demand responsiveness. In this paper, an economic model based on the concept of price elasticity is presented, and the aggregated DR model can be expressed as follows [16]:
P t = η P 0 , t 1 + E t , t ρ t ρ 0 , t + c e n t ρ 0 , t + t = 1 t i t 24 E t , t ρ t ρ 0 , t + c e n t ρ 0 , t
where P 0 , t and P t represent the responsive loads before and after participation in the demand response program, respectively. E t , t denotes the dynamic self-coefficient, while E t , t signifies the cross-elasticity coefficients. ρ t and ρ t are the electricity price of the valley periods and off-peak periods, respectively. The incentive for demand response is represented by c e n t , and η signifies the participation factor of the customers.

2.4. Uncertainty Modeling

To manage uncertainties associated with the optimization problem, including the wind power output and DR participation factors, the stochastic programming method is deployed in this paper. Stochastic programming is one of the popular means to derive optimal decisions under uncertainties. In our developed stochastic model, uncertainties are represented by a set of scenarios. Furthermore, conditional value-at-risk (CVaR) is incorporated to control the risk of optimization problems. For a specified probability level α, CVaR indicates the expected value of the 1 α × 100 % worst-case scenarios, which can be stated as [17]:
CVa R α , s = max { θ 1 1 α π s η s } , η = max { θ P F s , 0 }
where π s denotes the probability of a scenario and η s is defined as an auxiliary variable, which equals the maximum value between 0 and the difference between the auxiliary variable θ and the profit of market participants. P F s denotes the total revenue.

3. Mathematical Formulation

In this section, the decision-making models of WPPs and DR aggregators participating in the energy and frequency regulation markets are formulated. To consider the uncertainties associated with wind power and demand response, the scenario-based stochastic method is deployed and optimized according to the realistic market data. In addition, the risks associated with uncertainties are controlled through the CVaR method.

3.1. Individual Bidding Strategies for a WPP

For a WPP, the objective of the optimal bidding strategy is to maximize the expected revenue resulting from the energy and regulation markets, as stated in Equations (3)–(5). Equation (4) expresses the revenue obtained from the energy market, which includes the payoff for bidding in the day-ahead and real-time energy markets. Equation (5) shows the revenue coming from the regulation market. In the proposed model, the performance-based regulation scheme is developed, which is referenced from the PJM market [15]. The market participant receives a two-part revenue that includes the capacity (the first term in Equation (5)) and performance payment (the second term in Equation (5)). The third term denotes the loss of revenue from spilled wind power, which occurs when the wind generator has to reduce its output to provide upward regulation. Note that the operation cost of wind generators is very small compared to the total profit, and thus ignored in the optimization model.
P F w s = P F w E , s + P F w R , s
P F w E , s = s N s π s t T λ t D A P w , t D A , s + λ t R T Δ P w , t + , s λ t R T Δ P w , t , s
P F w R , s = s N s π s t T λ r e g , t c a p C w , t r e g , s S t + λ r e g , t p e r f C w , t r e g , s R t m i l S t C w , t u p , s λ t w , s
The total profit of a wind generator is denoted by P F w s , which comprises the energy profit P F w E , s and the regulation profit P F w R , s ; the clearing prices for the regulation market capacity and performance are denoted by λ r e g , t c a p and λ r e g , t p e r f , respectively. Δ P w , t + , s and Δ P w , t , s represent the positive and negative imbalances, respectively. C w , t r e g , s and C w , t u p , s denote the regulation capacity bid and the up-regulation bid; P w , t D A , s refers to the energy bid from the day-ahead market; λ t w , s is the wind power price. The regulation performance score is represented by S t , and R t m i l signifies the mileage ratio. λ t D A and λ t R T represent the market price for the day-ahead and real-time markets.
For a bidding horizon, the optimal bidding model for a WPP is given as (6)–(16). The purpose of the proposed model is to maximize the expected benefit function shown in (3) and the CVaR risk calculated in (2) multiplied by a weighting factor β . The weighting factor ranges from 0 to 1, which represents the decision maker’s risk preference. The power limits of the wind are described in (7)–(10). Equation (7) states the electricity balance of the wind. P w , t s represents the total bid of the wind generator in the market. Equation (8) indicates the regulation bid, including both up- and down-regulation ( C w , t u p , s and C w , t d n , s ). Equations (9) and (10) enforce that the power of the wind for energy plus the regulation capacity cannot exceed available output or fall below zero. Due to the ramping limits of the wind generator, Equation (11) shows up- and down-capacity constraints for the regulation bidding. κ denotes the maximum ratio of the qualified wind power capacity for regulation to the rated capacity W . Equations (12) and (13) express the imbalance Δ P w , t s caused by forecasted errors. P w , t a c , s represents the actual wind output. Equation (14) enforces that the positive imbalances should not exceed the actual wind power output while Equation (15) limits the negative imbalances within the maximum capacity of wind energy. Equation (16) shows the restriction on the CVaR of profit for the WPP.
max P F w + β ( θ w 1 1 α s N i π S η w s )
P w , t s = P w , t D A , s + C w , t r e g , s
C w , t r e g , s = C w , t u p , s + C w , t d n , s
P w , t D A , s + C w , t u p , s P t max
P w , t D A , s C w , t d n , s 0
C w , t u p , s , C w , t d n , s κ W
Δ P w , t s = P w , t a c , s P w , t s
Δ P w , t s = Δ P w , t + , s Δ P w , t , s
0 Δ P w , t + , s P w , t a c , s
0 Δ P w , t , s W
P F w + η w θ w 0

3.2. Individual Bidding Strategies for a DR Aggregator

The problem of the optimal bidding strategy of a DR aggregator is formulated as follows:
max     P F D R s + β θ w 1 1 α s N s π s η w s
P F D R = s N s t T π s P D R , t s λ D R , t + λ r e g , t c a p C D R , t r e g , s S t + λ r e g , t p e r f C D R , t r e g , s R t m i l S t E t λ t
C D R , t s = P 0 , t P t s
C D R , t r e g , s = C D R , t u p , s + C D R , t d n , s
P D R , t s + C D R , t u p , s C D R , t s
P D R , t s C D R , t d n , s 0
P D R , t s , C D R , t u p , s , C D R , t d n , s C D R , t s
P F D R + η w θ w 0
The aggregator aims to maximize the total profit P F D R s from demand response involvement and regulation market participation minus the cost of energy purchased from markets. P D R , t s and C D R , t r e g , s refer to the amount of responsive load that participates in the energy market and regulation capacity bid. λ D R , t signifies the price or incentive offered to customers for their participation in DR. E t is the increased consumption for participating in down-regulation and λ t is the corresponding price that customers pay for the market. Equation (19) expresses the available DR capacity C D R , t s for market bids. The up- and down-capacity limits for regulation bidding are shown in Equations (20)–(22). C D R , t u p , s and C D R , t d n , s represent the up-regulation and down-regulation bids. Equation (22) enforces that the difference between the energy and the up-regulation should be larger than 0. In Equation (23), the market bid of the DR aggregator is restricted by the forecast of available DR capacity. Equation (24) denotes the constraint associated with CVaR.

3.3. Integrated Bidding Strategies for Coordinated Wind-DR Power Plant

When a WPP and a DR aggregator become a coalition, the WPP can provide low- priced energy to the DR aggregator to reduce customers’ purchase costs and obtain DR capacities to minimize its imbalance penalty. Based on the appropriate cooperation, revenues of WPPs and DR aggregators can be improved. The detailed trading strategy can be described as follows:
(1)
In the coalition, we assume that the WPP provides low-priced energy to the DR aggregator. The benefit received by the WPP equals the purchase cost of DR aggregators. Therefore, within the coalition, the energy provided by a WPP to a DR aggregator is free. In return, DR aggregators can offer DR capacity for mitigating wind output imbalances caused by forecasting errors. Similarly, within the coalition, the DR capacity provided by the DR aggregator to the WPP is free.
(2)
As described in Section 2, wind power and DR resources are complementary when providing frequency regulation. Therefore, through the coordinated bidding strategy, the coalition can optimize the operation states of wind generation and DR resources to respond to regulation signals more economically.
The purpose of the joint bidding model is to optimize the coalition’s decision to maximize its participation in the markets. The objective function and corresponding constraints are formulated as follows:
max     P F W R s + β θ w 1 1 α s N s π s η w s
P F W R s = s N s t T π s ( P t D A , s λ t D A + P D R , t s λ D R , t + λ r e g , t c a p C W R , t r e g , s S t + λ r e g , t p e r f C W R , t r e g , s R t m i l S t + λ t R T Δ P t + , s λ t R T Δ P t , s )
The market benefit of the coalition P F W R s includes four parts as presented in Equation (26): (1) the revenue from participating in the day-ahead energy market, (2) the revenue from participating in the DR programs, (3) the revenue from bidding in the regulation market, (4) the imbalance revenue resulting from the real-time market.
C W R , t r e g , s = C W R , t u p , s + C W R , t d n , s
C W R , t u p , s = C D R , t r e g , s
C W R , t d n , s = C w , t r e g , s
0 C W R , t u p , s C D R , t s
0 C W R , t d n , s P t max
Δ P t s = P w , t a c , s P w , t s P D R , t s
Δ P t s = Δ P w , t + , s Δ P w , t , s P D R , t s
0 Δ P t + , s P w , t a c , s
0 Δ P t , s W
P F W R + η w θ w 0
Equations (28) and (29) indicate the up- and down-regulation capacities ( C W R , t u p , s and C W R , t d n , s ) that are individually supplied by different operators. C W R , t r e g , s represents total regulation capacity bids. The up-regulation capacity is offered from DR resources, whereas the down-regulation capacity is provided by wind generation. Equations (30) and (31) express the limits for submitted regulation capacity. Equations (32)–(35) show the constraints for system imbalance Δ P t s . In Equation (36), the CVaR constraint is modeled.

3.4. Cooperative Game-Theory Profit Allocation Method

In individual bidding, wind power producers (WPPs) and demand response (DR) aggregators use their own strategies to respond to regulation signals, which may lead to financial losses. However, when they coordinate, the coalition can optimize operations and submit joint bids to maximize profits. This collaborative approach lowers costs for frequency regulation and increases market participants’ profits compared to individual strategies. The additional revenue is fairly distributed using cooperative game theory methods, such as the Nucleolus- and Shapley-value methods. However, both the Nucleolus- and Shapley-value-based methods have drawbacks. The Shapley-value method focuses on utilitarian distribution, disadvantaging entities with unstable contributions like wind and photovoltaic power, and lacks adaptability to special cases. The Nucleolus method fails to reflect marginal contributions, which may cause unfair incentives, reducing the enthusiasm of large-contribution entities and making small-contribution ones lack the motivation to improve.

3.4.1. Nucleolus-Based Method

The goal of the nucleolus allocation method is to minimize the maximum regret, i.e., the worst-case profit increment   δ among all coalitions. Suppose   X = x 1 , x 2 , , x n denotes the set of allocated profit for each player in the game,   Y = y 1 , y 2 , , y n denotes the set of given profit allocations, and   V S denotes the profit increment produced by the alternation of players in the coalition   S . The detailed formulation is shown as follows [18]:
min δ s . t .       V ( S ) = i S 1 y i
V ( S ) i S 2 y i δ
Finally, the profit allocation for each player can be calculated by the following:
x i = v ( i ) + y i

3.4.2. Shapley-Value Method

For the Shapley-value method, the allocated profit of each player can be calculated based on two cases. First, player   i is not part of the coalition. Second, player   i is within the coalition. Then, the Shapley-value   x i can be determined by Equation (40) [19].
x i ( v ) = S N \ i m ! ( n m 1 ) ! n ! [ v ( S { i } ) v ( S ) ]
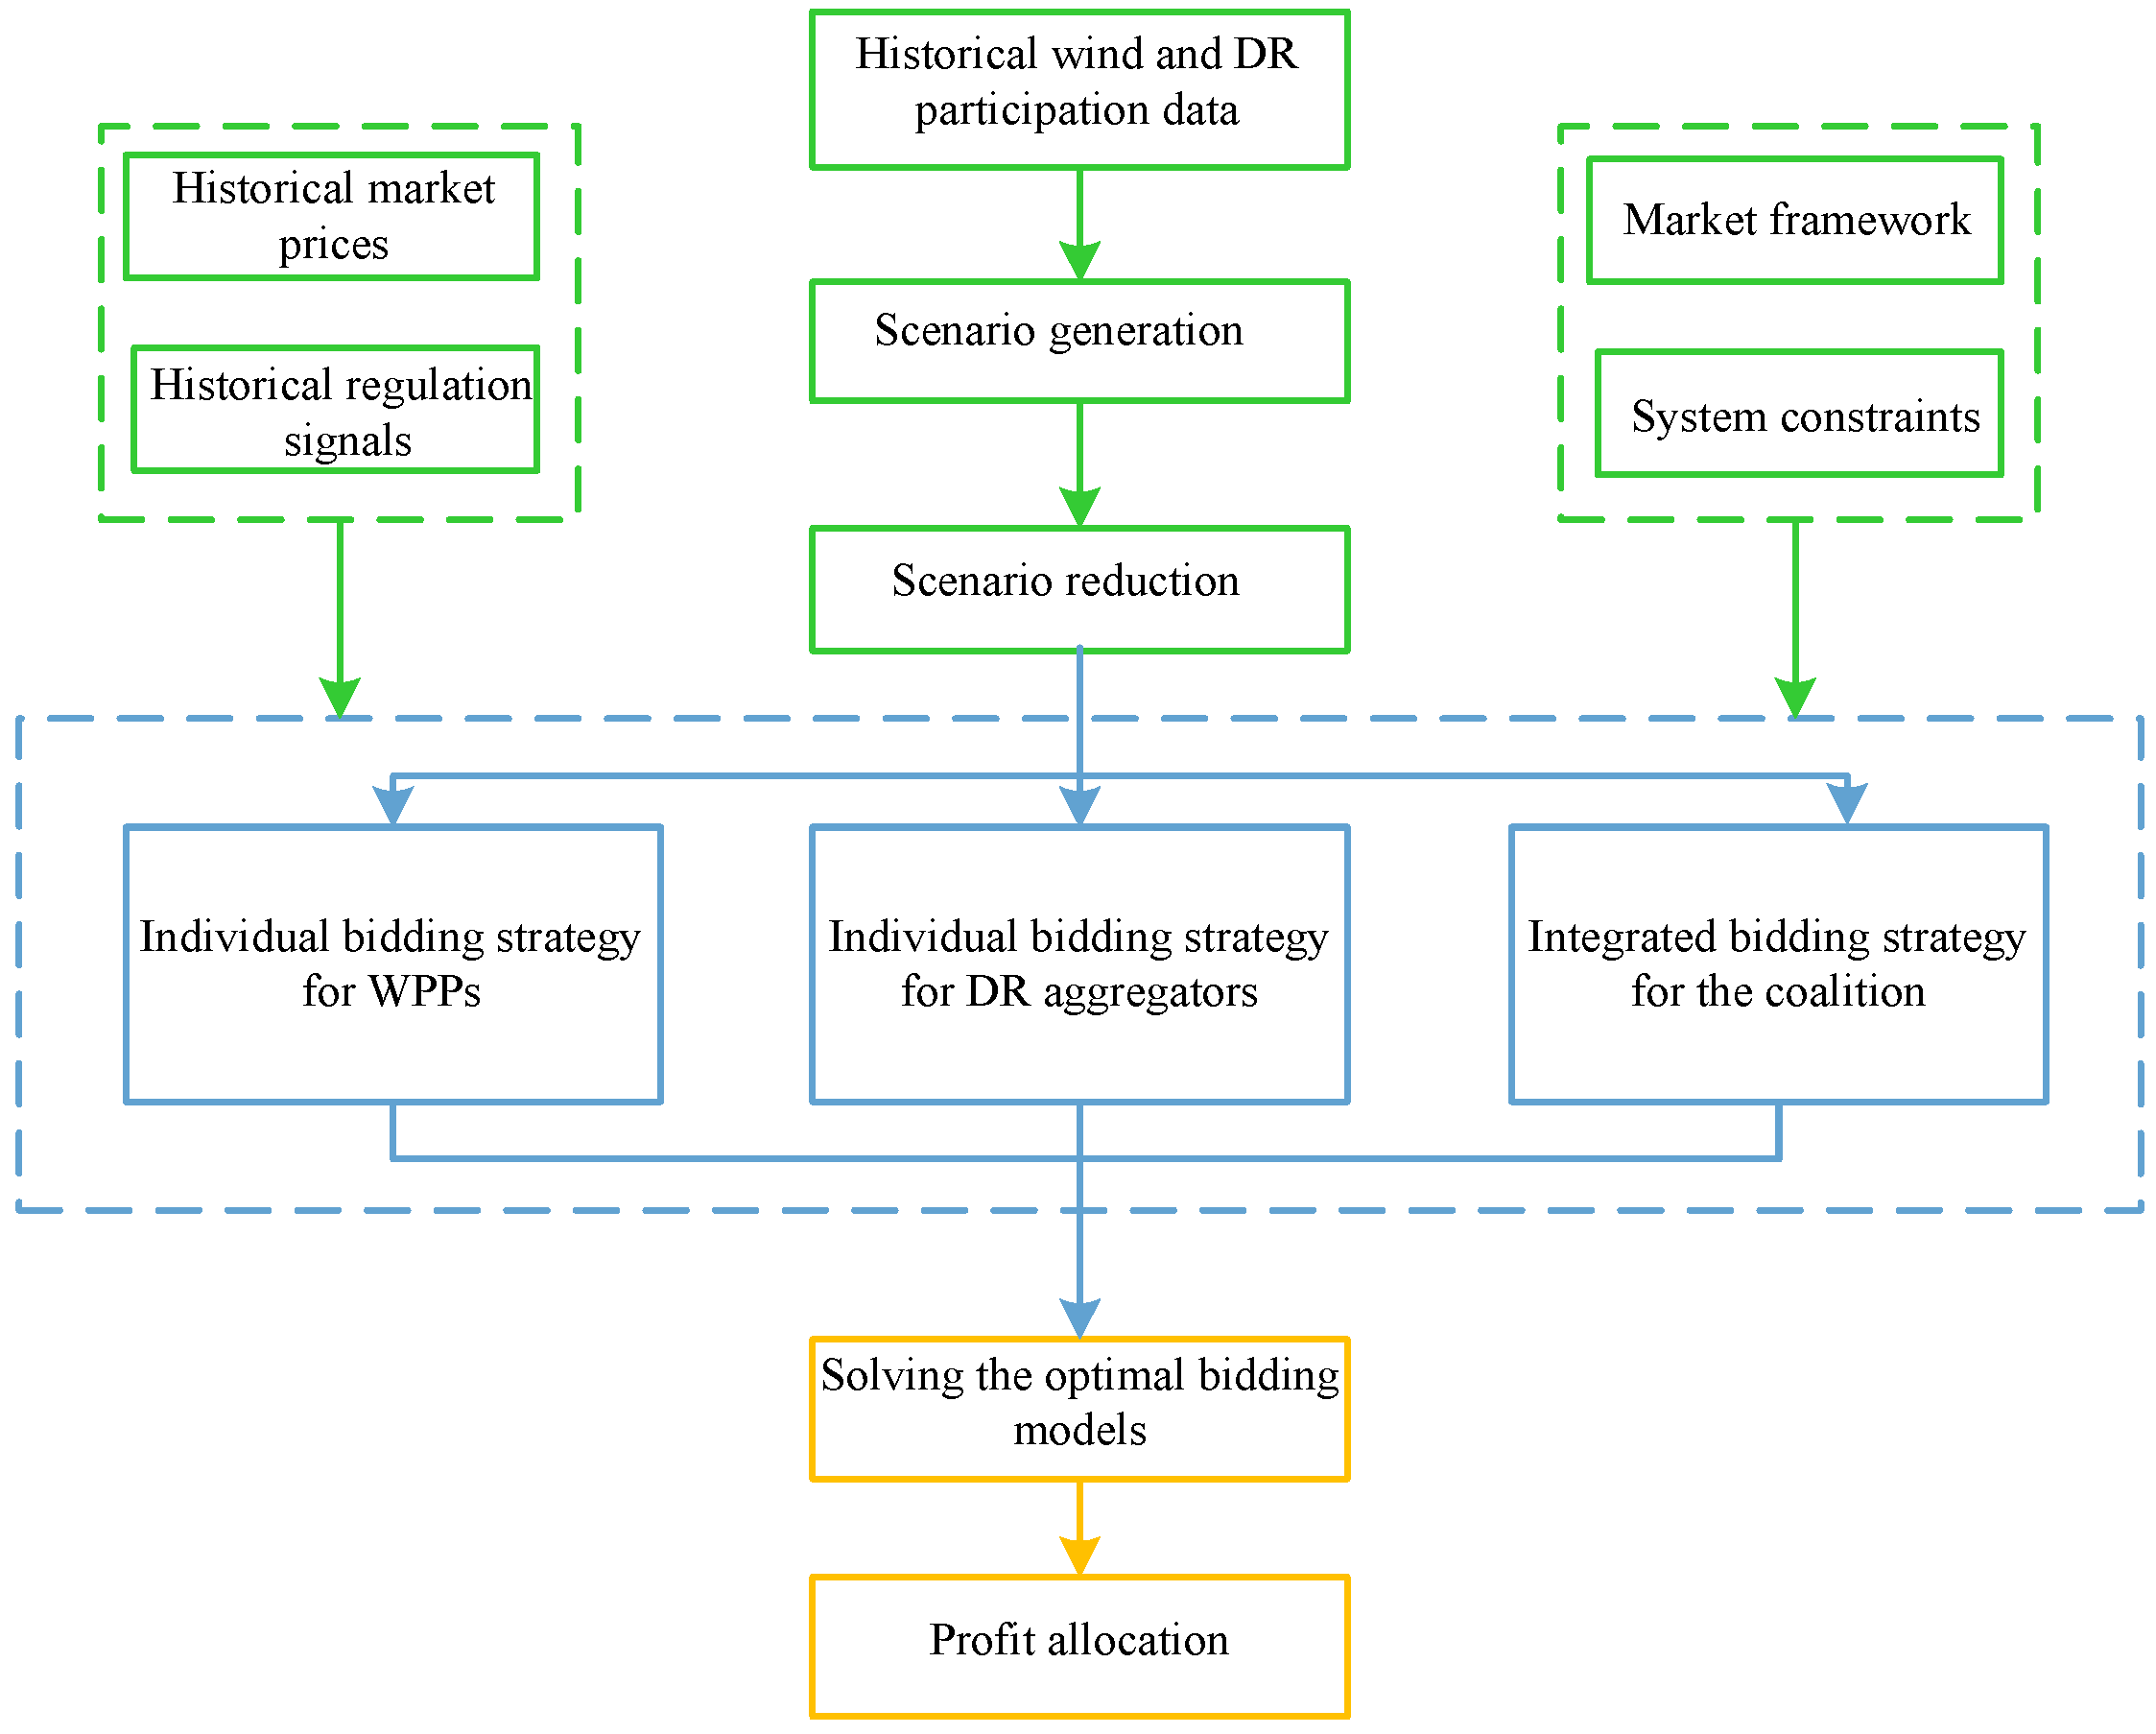
In summary, the flowchart for the proposed bidding strategies is shown in Figure 2.

4. Case Study

In this section, the performance of the proposed approach is evaluated based on the realistic market data. We use MATLAB and CPLEX to simulate the day-ahead and real-time operation and solve the decision-making model.

4.1. Data

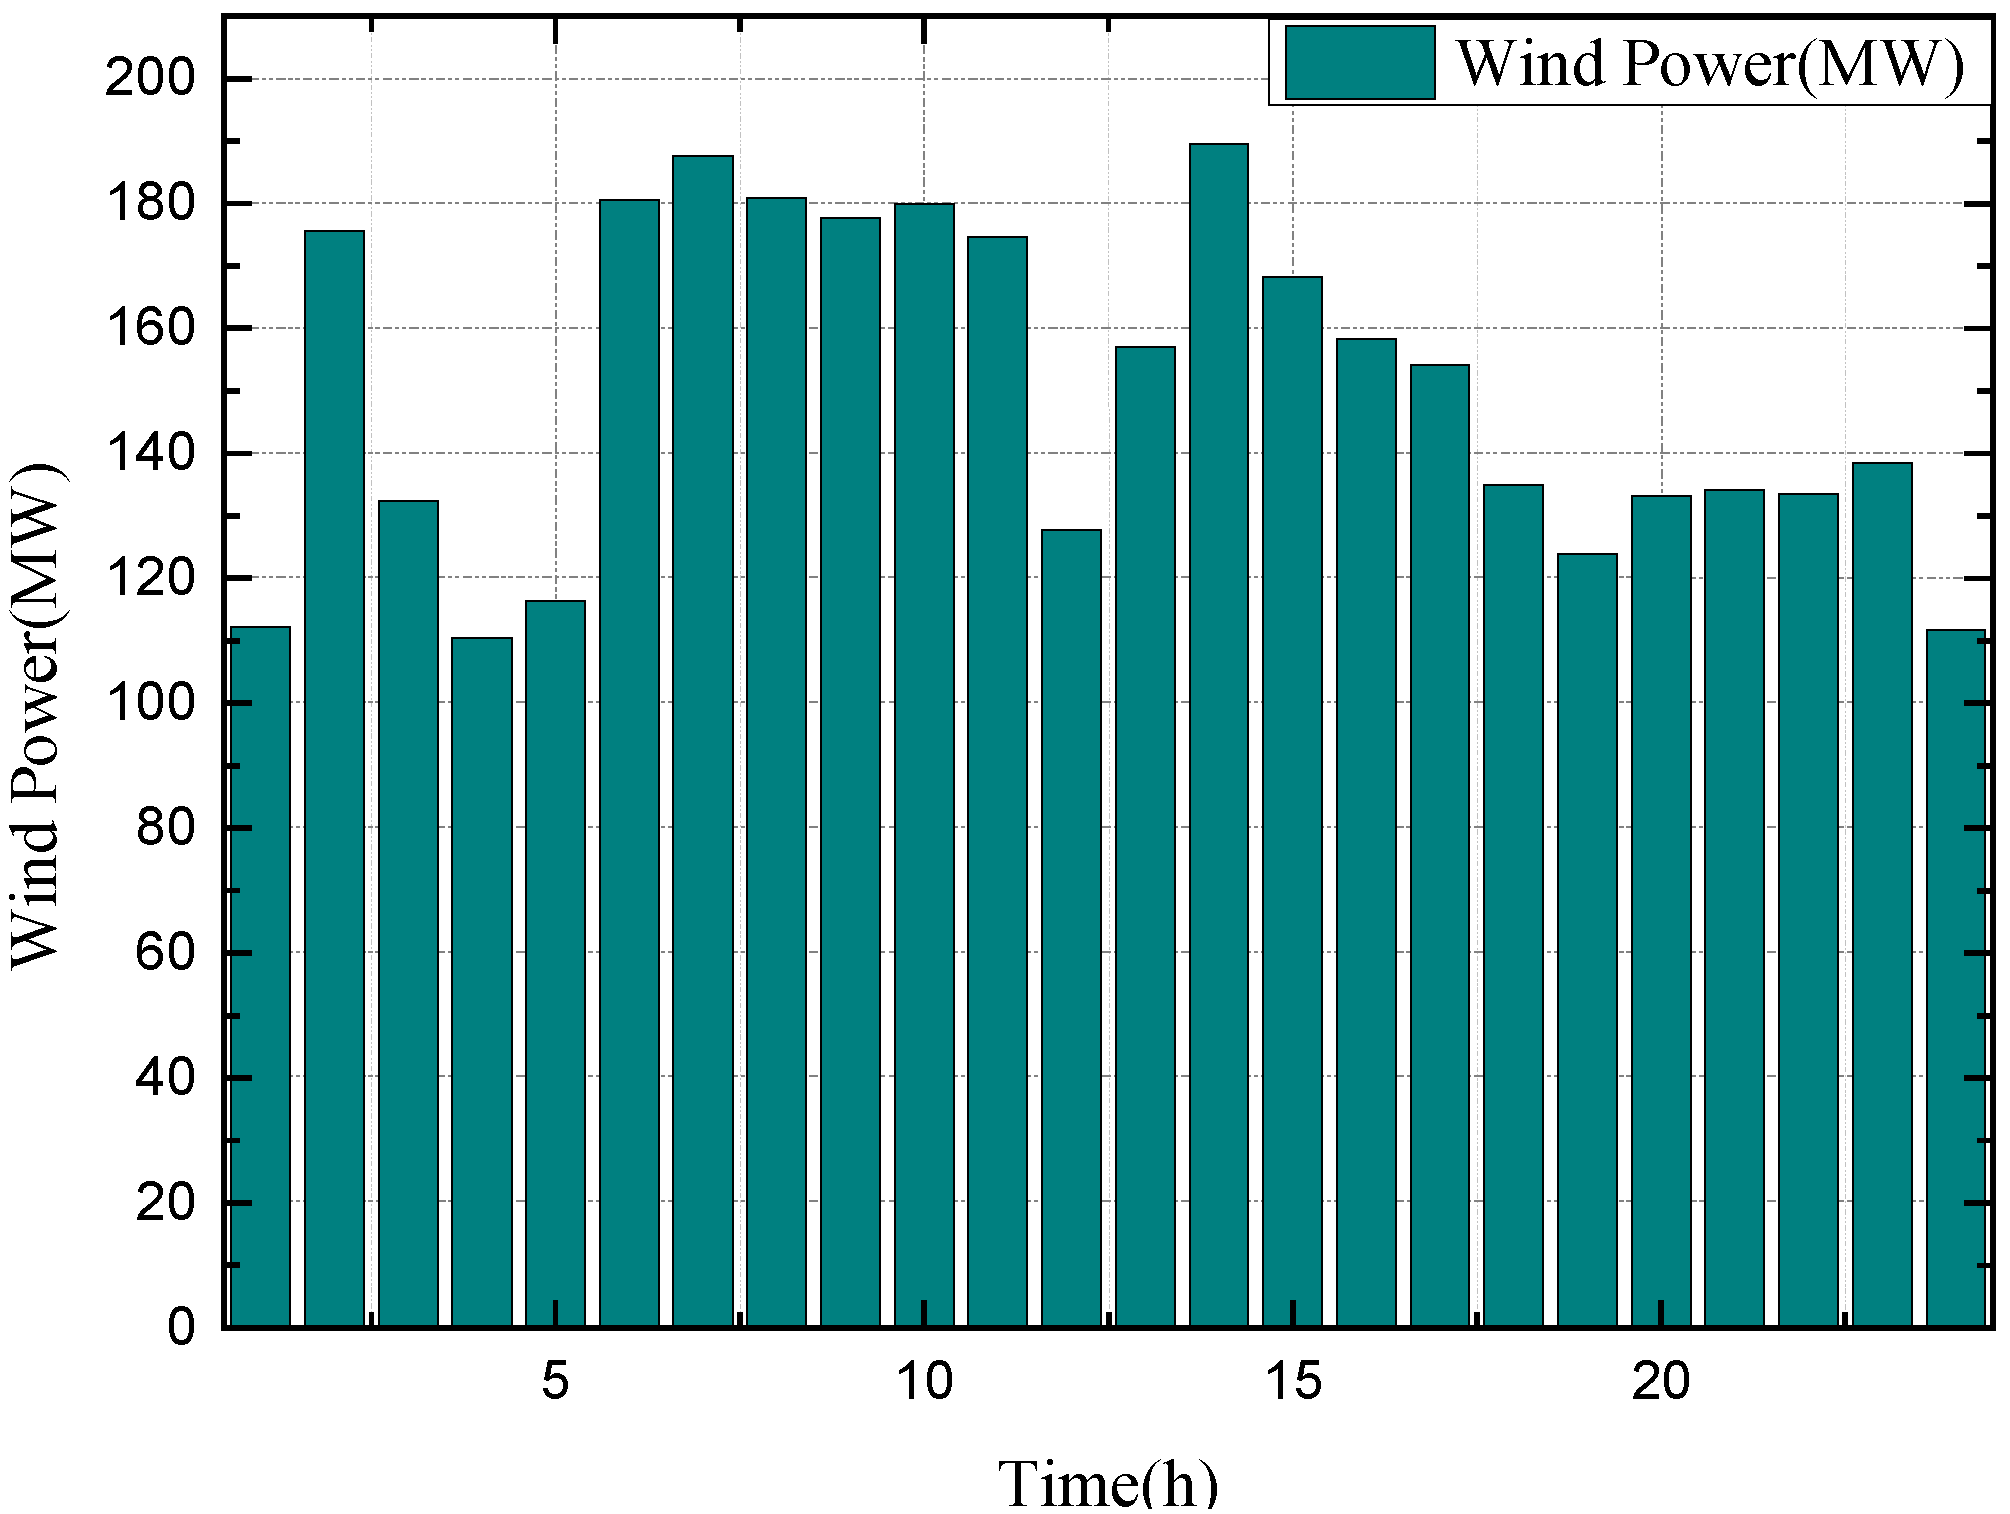
We use historical wind power data from the PJM market to generate wind scenarios, using common scenario-generating methods [20]. Figure 3 shows the wind power curve, which is obtained by averaging the wind power data over various scenarios for a sample day. This averaging process helps to present the trend of the wind power during that day. The maximum ratio of the qualified wind power capacity for regulation to the rated capacity ( κ ) is 30%, indicating the upper limit of the wind power available for regulation purposes within the given conditions. The anticipated energy prices, encompassing day-ahead and real-time market prices, as well as regulation market capacity clearing prices and performance clearing prices, are sourced from the PJM market [21] and are illustrated in Figure 4. The average mileage ratio of RegD and the performance score are computed based on their historical performance. Given that the interruptible/curtailable (I/C) program is among the most commonly implemented demand response programs currently, this paper uses the I/C program as an example. The incentive is derived from the PJM market as indicated in [22]. For CVaR, the confidence level is set to be 0.9, which is a commonly used value.

4.2. Bidding Results

To show the effectiveness of the proposed trading strategy, a two-play game is as follows: one wind power producer (WPP 1) and one DR aggregator (DRA) are considered. The following three bidding cases are proposed for comparison. The bidding strategies and market participation details of different entities in various cases are presented in Table 1.
The profit for different bidding strategies is shown in Figure 5, along with the additional costs for market participants in the regulation market. Specifically, the orange bar depicts the revenue loss incurred by WPPs when providing upward regulation services, whereas the green bar indicates the additional purchase costs incurred by DRAs when enabling downward regulation. The cyan bar, on the other hand, represents the overall profits. If the WPP and DRA form a coalition, these costs can be avoided. The profit in the coordinated case is higher than in the uncoordinated cases. For example, the expected profit of the coalition in Case S6 is USD 85,375.4, a 5.0% increase compared to the combined profits of Cases S2 and S4. The expected profits from each market are plotted in Figure 6. Specifically, the green bars depict the percentage of the expected profit derived from the energy market, while the cyan bars represent the percentage of the expected profit originating from the regulation market. Additionally, the red bars indicate the imbalance costs incurred in the real-time energy market. Note that the energy imbalance represents the profit loss caused by the wind forecast error. Comparing Case S1 and Case S5, by coordinating with DR resources, the energy imbalances of the WPP decreased by 6%. In addition, by strategically allocating the resources in different markets, the coalition obtains the market profits with 70.36% energy, 46.54% frequency regulation, and 5.9% energy imbalance in Case S6. It indicates that the coalition obtains significant profits from frequency regulation provision, thus it is beneficial for market participators to bid in both the energy and regulation markets. Comparing Case S2, S4, and S6, the market profit of the cooperation case resulting from the regulation market is larger than the sum of revenues in independent cases. The results show that the proposed coordinated trading strategy can bring higher benefits for WPPs and DR aggregators, taking advantage of their complementary characteristics when participating in the regulation market.
The comparison of cooperative case (S6) based on the profits allocation methods and individual cases (Case S2 and Case S4) is presented in Table 2. The results show that the expected profit for the WPP in the coordinated case is USD 57,563.95, a 3.7% increase compared to the uncoordinated case. The total surplus profit amounts to USD 4058.9, clearly indicating that effective coordination between the WPP and a DR aggregator can generate additional profits, highlighting the potential benefits of collaborative strategies in this context. Note that in the two-player game, the additional revenue is allocated equally based on cooperative game theory methods.
The deployed bidding strategies for WPPs and DR aggregators in the energy and regulation markets (Case S2, Case S4, and Case S6) are shown in Figure 7. Compared with the individual bidding strategies of WPPs and DRAs, the operation of the coalition dispatches wind energy or DR resources to track the regulation signal with the aim of maximizing the total profit. In the cooperation scheme, the up-regulation is provided by the DR resource while the down-regulation is provided by wind power. Figure 7a shows that the WPP provides less capacity in the up-regulation market. The reason is that the wind generator has to reduce its schedule to allow for the up-regulation service, which leads to a loss of revenue. To achieve maximum benefits, most of its capacity is submitted to the energy market. From Figure 7c, it can be seen that the coalition actively participates in the regulation market during 6–9 and 15–24, since during these hours, the regulation market price is higher compared to the other time periods. Comparing Figure 7a–c, more resources are allocated to the regulation market in Case S6 compared to Case S2 and Case S4. The reason is that the cooperation scheme can optimize the operation states of wind generator and DR resources to respond to regulation signals more economically. In this way, the operator can provide regulation capacity by dispatching wind power or DR resources at lower costs.

4.3. Three-Player Game

To further show the performance of the proposed trading strategy, a cooperative case for two WPPs and a DRA is considered.
With the coordination, the payoff of the WPP and DRA can be significantly improved. Through the cooperative game theory methods, the profits of WPPs and DRAs are allocated and shown in Table 3. As presented in Table 3, the extra profits of WPPs and DRAs are higher than the values in the cases of section A, which verifies again that cooperation can result in more profits. Note that in the cases of Section 4.2, the extra profit is allocated equally. For the three-player game, more profit is allocated to the WPP1 whether through the Nucleolus-based or Shapley-value method.
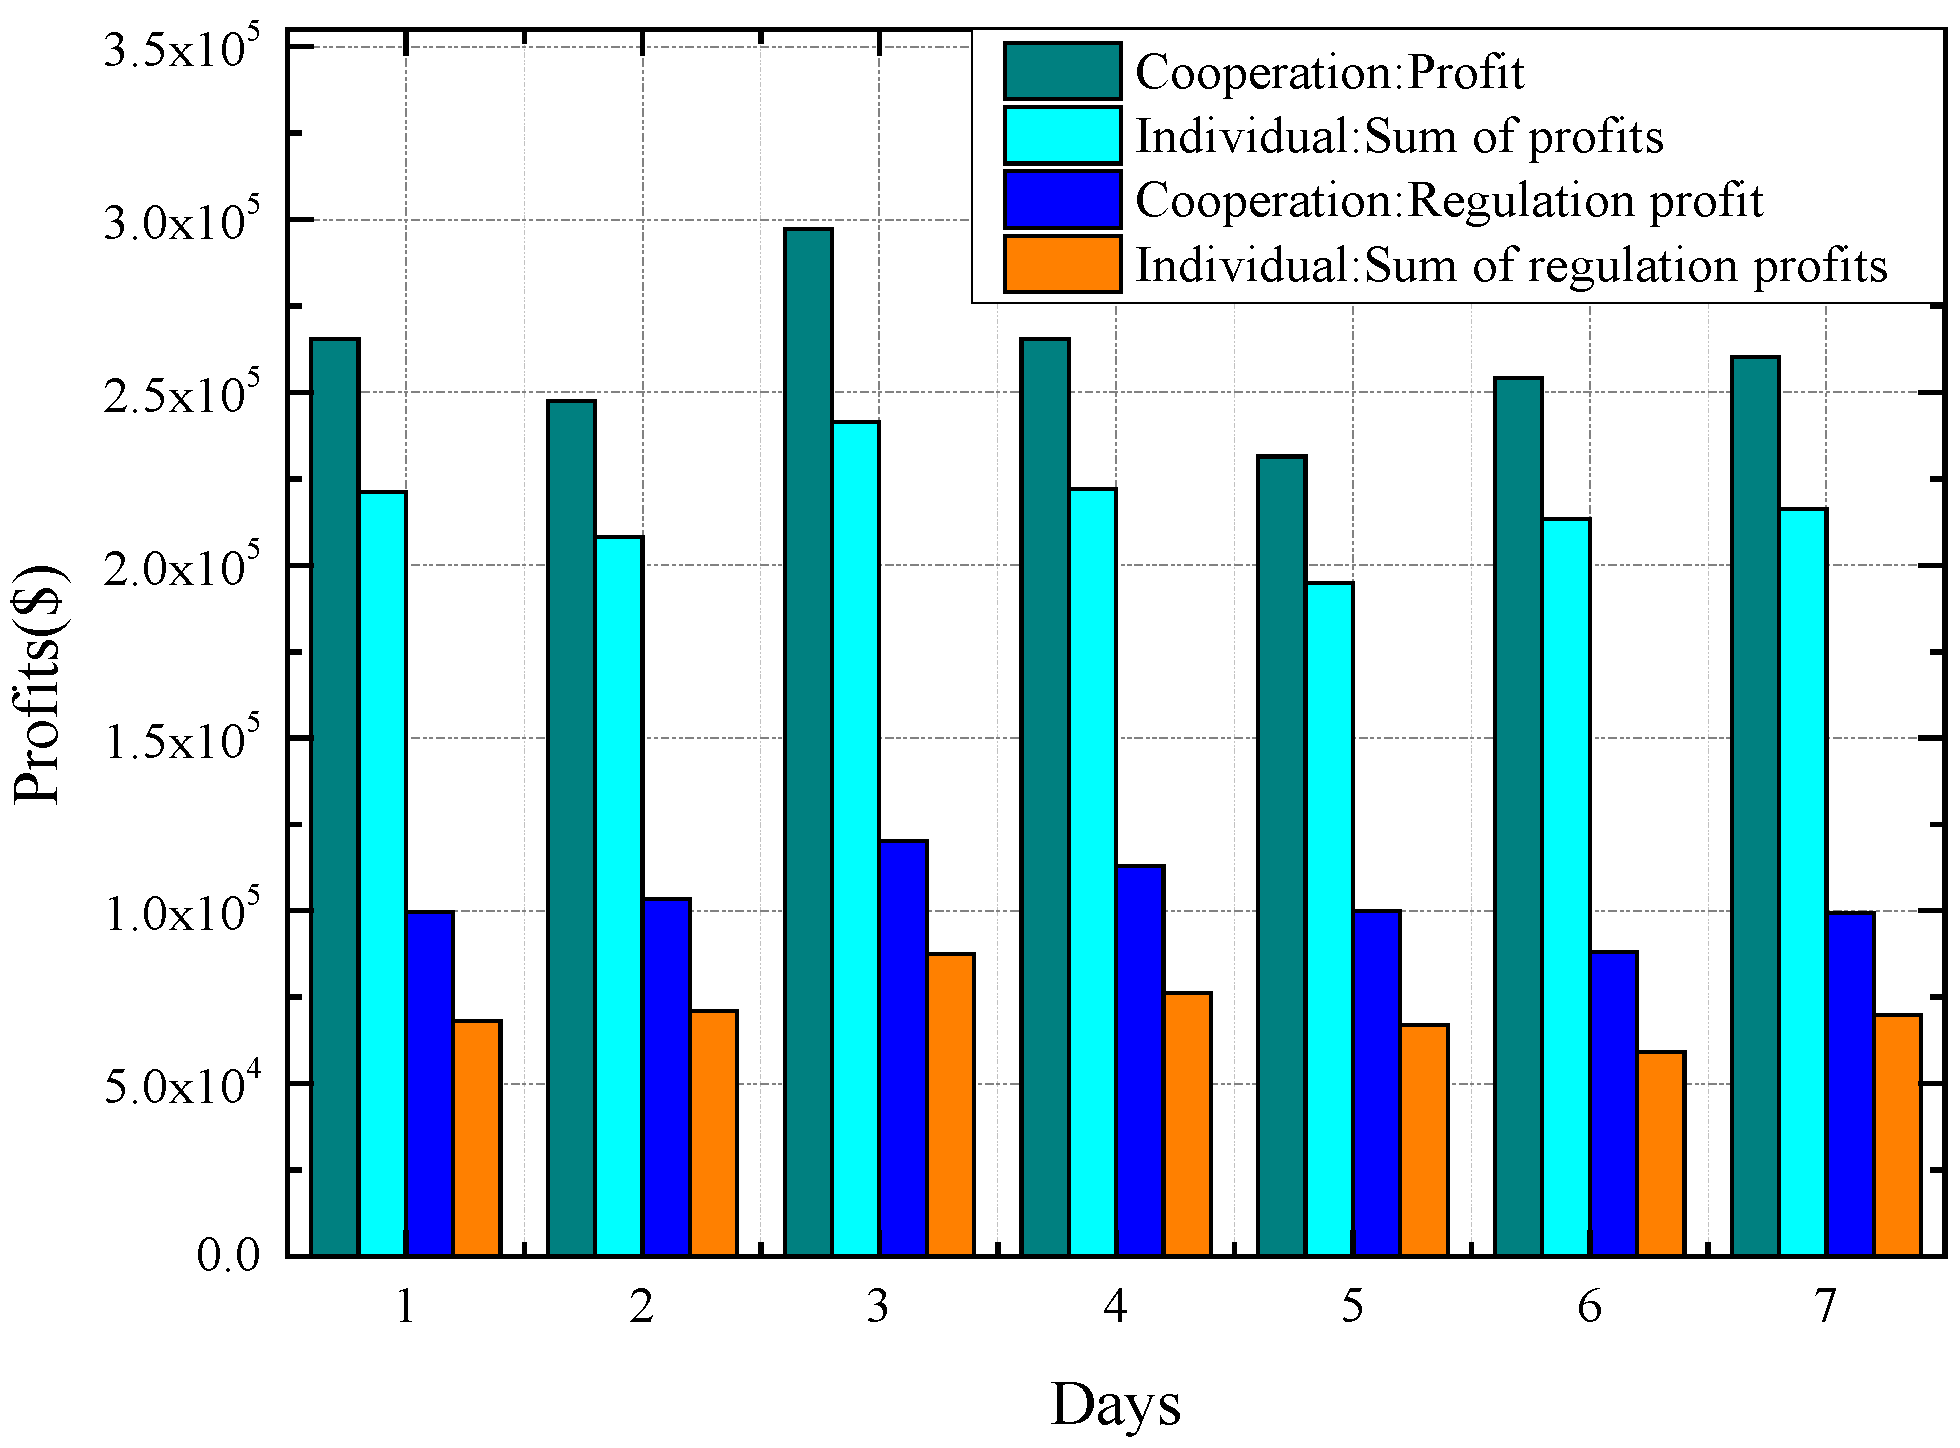
To further explore the capabilities of the proposed trading scheme, simulations over 1 week (1–7 May 2020) have been implemented and the daily profits are shown in Figure 8. The green and cyan bars represent the market profit for the cooperation case and sum of profits for independent cases, respectively, whereas the blue and orange bars denote the expected profit of coordinated power plants and uncoordinated power plants obtained from the regulation market. Although the daily profit fluctuates, it can also conclude that the market profit of the coordinated case is higher than the sum of profits in individual cases. The average regulation-related profit is also remarkable, accounting for 39.73% of the total profit of the cooperation case. More specifically, the average regulation-related revenue in the coordinated case increased by 31.0% with respect to that in the uncoordinated case.

4.4. Impact of Risk Management

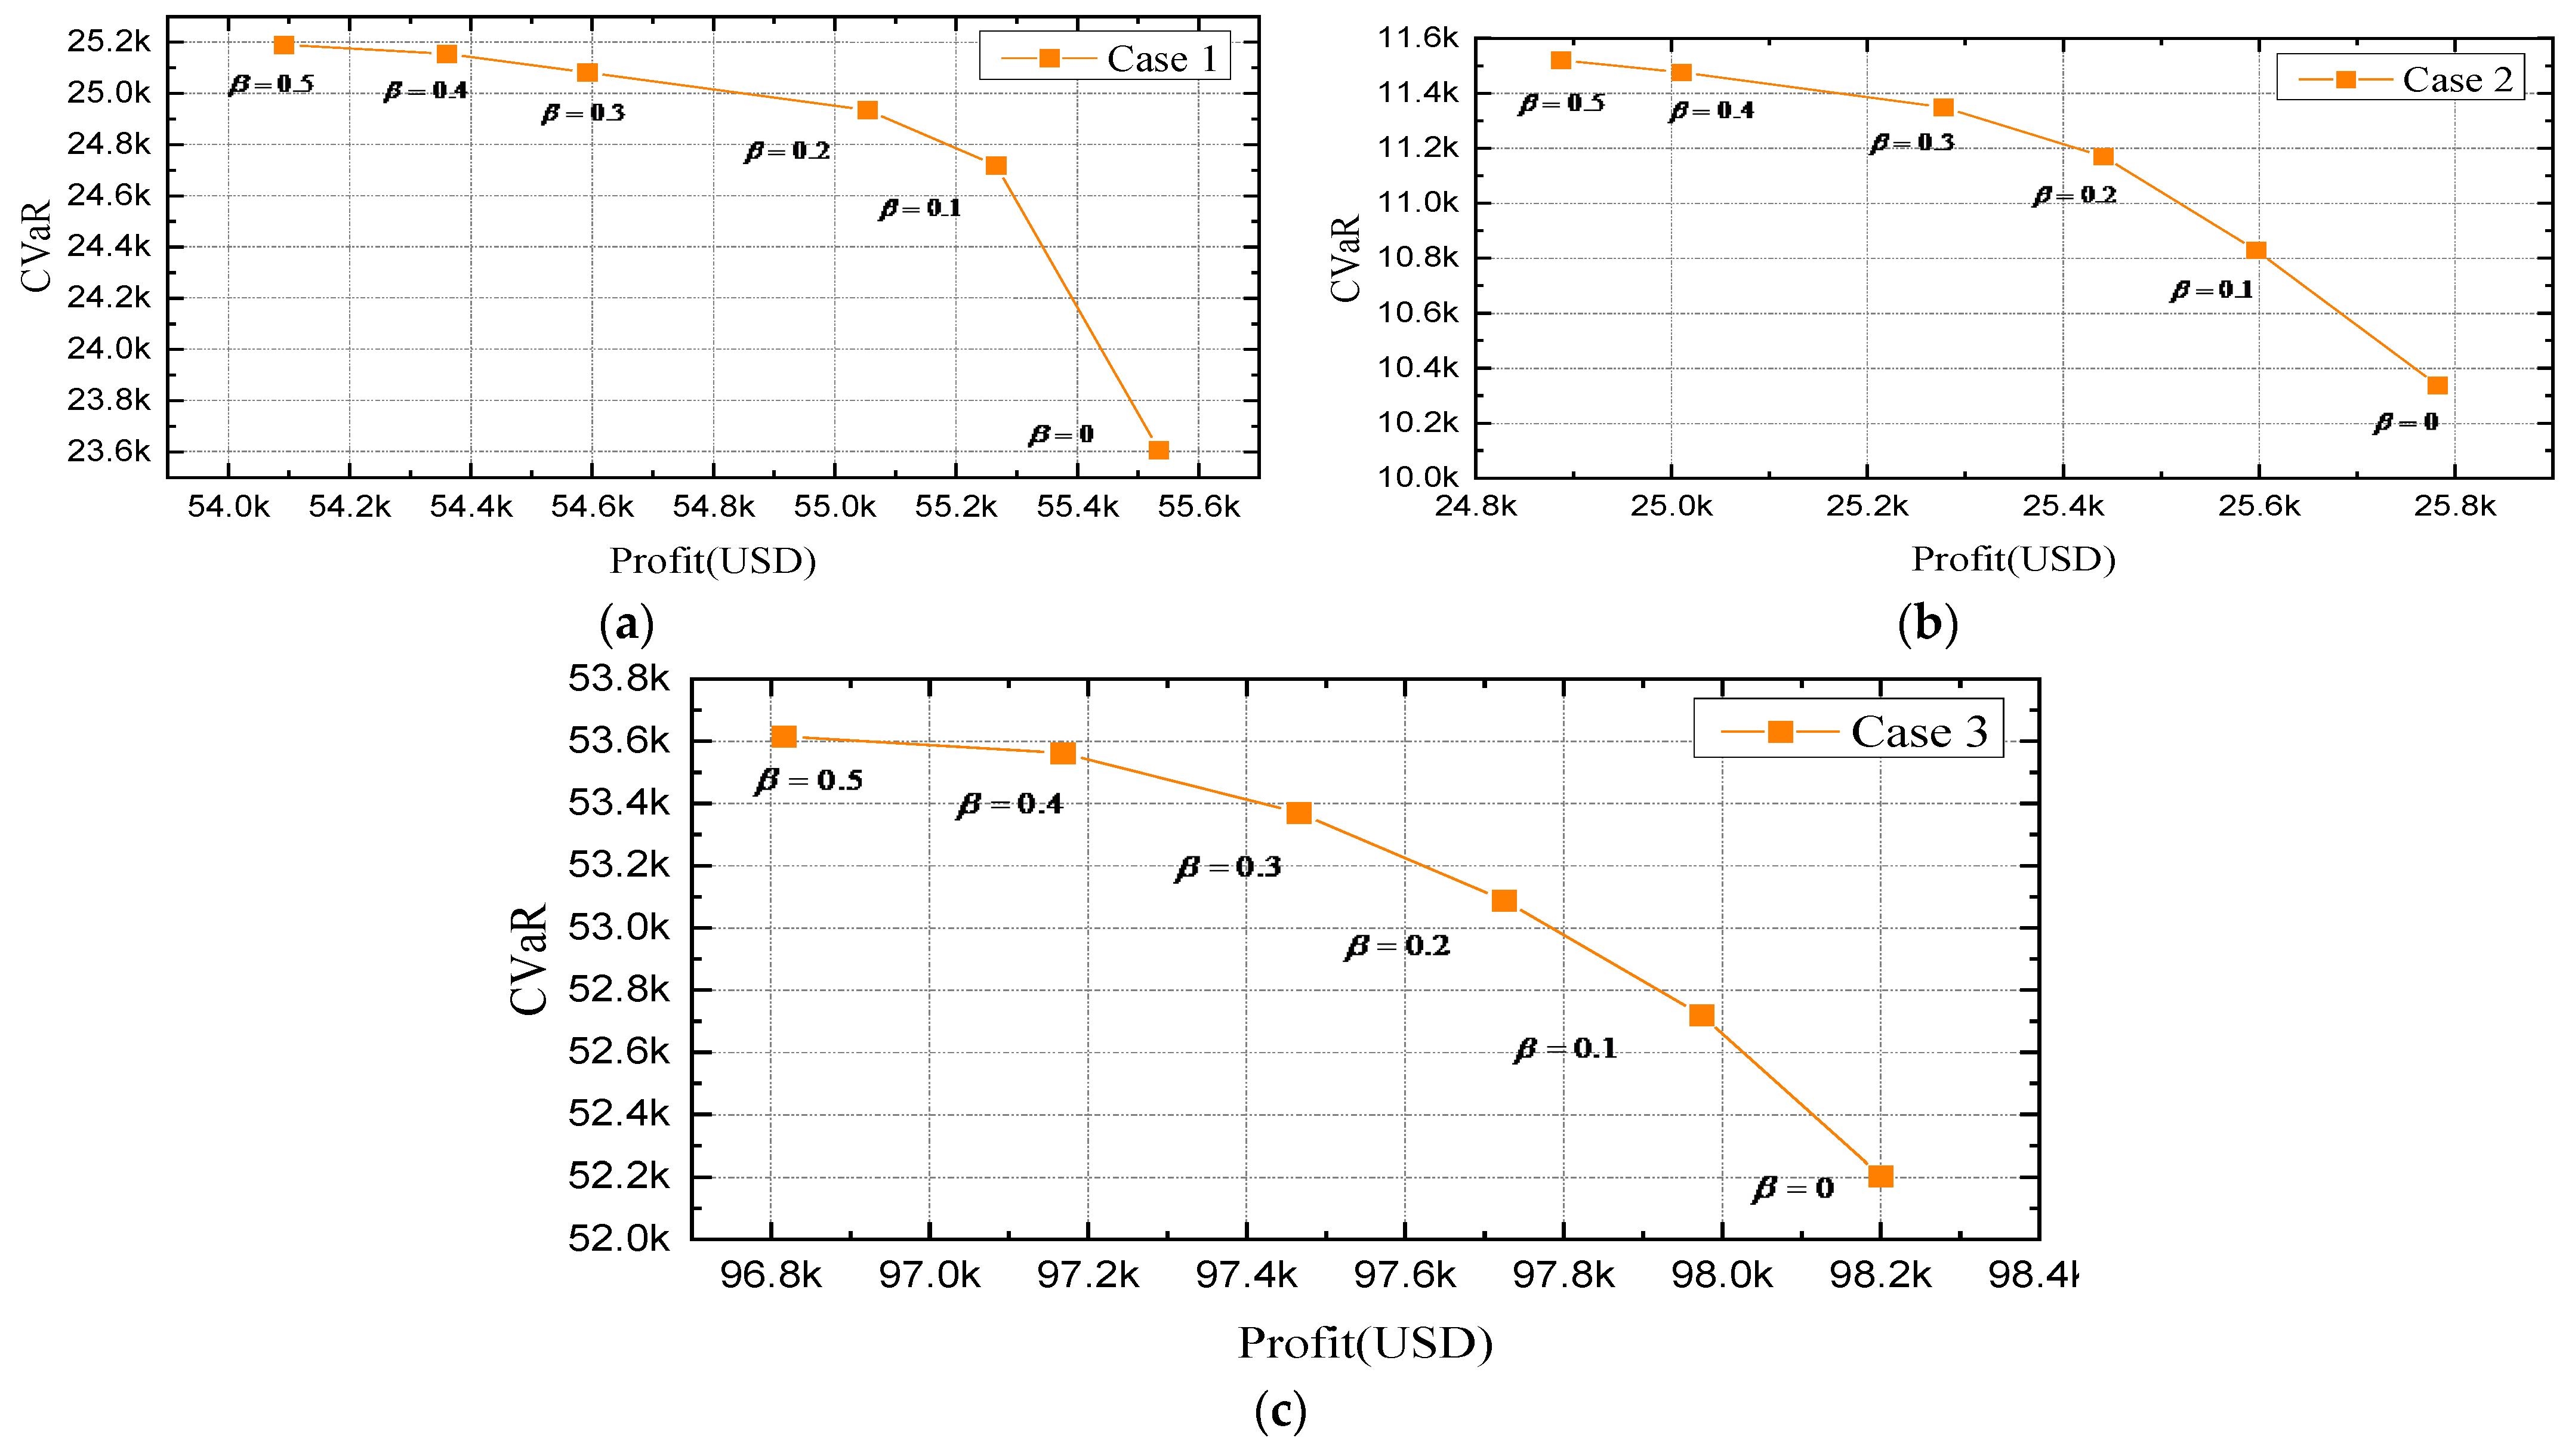
To analyze the impact of the risk aversion, take cases S2, S4, and S6 as examples: the expected revenue of the market participants and the CVaR for different risk-averse parameters of β are calculated and presented in Figure 8. It can be seen that the three curves show the same trend. When β increases, the CVaR increases, while the revenue of market participants decreases. For example, in Case S2, when β increases from 0 to 0.5, the value of CVaR is increased by 6.7% while the market revenue is decreased from USD 55,534.5 to USD 54,029. For Case S4, the CVaR increased by 11.4% while the market revenue decreased by 3.47%. In addition, the results show that with a slight decrease in market revenue, the CVaR is highly reduced. This indicates that the variation in the CVaR is bigger than that of the market revenue. Furthermore, comparing Figure 9a–c, with increasing risk-averse parameter β, the rate of decrease in market profit in the cooperative case is lower than that of individual cases. From the result, the decision maker can make an appropriate bidding strategy based on the tradeoff between expected profit and CVaR, because CVaR not only effectively measures the potential downside risk but also provides a clear risk-return trade-off benchmark in various market conditions, enabling decision makers to better balance profit-seeking and risk-controlling.

5. Discussions and Conclusions

5.1. Integrated Discussion of Results

This paper develops a coordinated decision-making model for WPPs and DR aggregators participating in the energy and frequency regulation markets. The objective of the developed model is to optimize the bidding strategies for market participants. Nucleolus- and Shapley-value-based methods are deployed to fairly distribute the combined revenues to each player. In addition, to demonstrate the effectiveness of the proposed trading structure, different trading schemes, which include coordinated and uncoordinated bidding strategies, are presented and compared in the case studies. The key findings of this paper can be summarized as follows:
  • A cooperative framework is proposed for wind power and DR resources, aiming to explore their complementary characteristics in the provision of frequency regulation. Furthermore, leveraging these complementary attributes, an optimal bidding strategy is developed for WPPs and DR aggregators. Notably, the coalition formed between WPP 1 and the DRA results in a significant increase in total profit by 5.0%, when compared to a scenario where the DRA operates without the participation of wind power producers;
  • CVaR is deployed to control the revenue volatility associated with uncertainties. The results of the case study demonstrate that as β increases, the CVaR rises and the market revenue declines. Specifically, in Case S2 (where β ranges from 0 to 0.5), CVaR increases by 6.7%, resulting in a revenue reduction from USD 55,534.5 to USD 54,029. Similarly, in Case S4, CVaR rises by 11.4%, leading to a 3.47% decline in revenue;
  • The coordinated bidding strategy can bring higher benefits for both WPPs and DR aggregators. The results show that the proposed trading scheme results in the highest market benefits in both two-player and three-player games. In addition, the regulation-related profits become a larger fraction of the overall profits. Specifically, in Case S6, the coalition achieved market profits with 46.54% from frequency regulation and 5.9% from energy imbalance, highlighting the significant contribution of regulation-related activities to the total earnings.

5.2. Future Prospects

In the future, we plan to consider various flexible resources, including electric vehicles, for the purpose of frequency regulation. Furthermore, we will delve into both coordinated and uncoordinated bidding strategies within multi-player scenarios.

Author Contributions

The research presented in this paper was a collaborative effort among all authors. Methodology, S.Z.; Writing, original draft, X.D.; Validation, H.C.; Supervision, W.B.; Data collection, W.B. All authors have read and agreed to the published version of the manuscript.

Funding

This work is supported by the Shanghai Sailing Program (No. 22YF1414800) and College Students’ Innovative Entrepreneurial Training Plan Program (No. X2024221).

Institutional Review Board Statement

Not applicable.

Informed Consent Statement

Not applicable.

Data Availability Statement

The original contributions presented in the study are included in the article, further inquiries can be directed to the corresponding author.

Conflicts of Interest

The authors declare no conflicts of interest.

References

  1. Kang, W.; Guan, Y.; Arbab-Zavar, B.; Guerrero, J.M. Distributed Event-Triggered Secondary Frequency Regulation by Sharing HESS Power in Microgrids. IEEE Trans. Smart Grid 2024, 15, 3375–3389. [Google Scholar] [CrossRef]
  2. Ding, Z.; Yuan, K.; Qi, J.; Wang, Y.; Hu, J.; Zhang, K. Robust and cost-efficient coordinated primary frequency control of wind power and demand response based on their complementary regulation characteristics. IEEE Trans. Smart Grid 2022, 13, 4436–4448. [Google Scholar] [CrossRef]
  3. Li, L.; Zhu, D.; Zou, X.; Hu, J.; Kang, Y.; Guerrero, J.M. Review of frequency regulation requirements for wind power plants in international grid codes. Renew. Sustain. Energy Rev. 2023, 187, 113731. [Google Scholar] [CrossRef]
  4. Zhang, Q.; Wu, X.; Deng, X.; Huang, Y.; Li, C.; Wu, J. Bidding strategy for wind power and Large-scale electric vehicles participating in Day-ahead energy and frequency regulation market. Appl. Energy 2023, 341, 121063. [Google Scholar] [CrossRef]
  5. Schledorn, A.; Junker, R.G.; Guericke, D.; Madsen, H.; Dominković, D.F. Frigg: Soft-linking energy system and demand response models. Appl. Energy 2022, 317, 119074. [Google Scholar] [CrossRef]
  6. Federal Energy Regulatory Commission (FERC). FERC Order 755: Frequency Regulation Compensation in the Organized Wholesale Power Markets; Federal Energy Regulatory Commission (FERC): Washington, DC, USA, 2011.
  7. National Development and Reform Commission of China, National Energy Administration of China. Notice on Further Improving the Trading Mechanism of Electric Power Market Transaction. 2018. Available online: https://www.ndrc.gov.cn/fzggw/jgsj/yxj/sjdt/201807/t20180718_986995.html (accessed on 14 November 2024). (In Chinese)
  8. Sarnaduti, B.; Adil, K.; Hamid, O.; Mads, A. Optimal frequency regulation using packetized energy management. IEEE Trans. Smart Grid 2022, 14, 341–353. [Google Scholar]
  9. Yang, C.; Du, X.; Xu, D.; Tang, J.; Lin, X.; Xie, K.; Li, W. Optimal bidding strategy of renewable-based virtual power plant in the day-ahead market. IEEE Trans. Power Energy Syst. 2023, 144, 108557. [Google Scholar] [CrossRef]
  10. Mehdi, F.; Kate, S. The impact of various carbon reduction policies on green flowshop scheduling. Appl. Energy 2019, 249, 300–315. [Google Scholar]
  11. Pannell, D.J.; Alston, J.M.; Jeffrey, S.; Buckley, Y.M.; Vesk, P.; Rhodes, J.R.; McDonald-Madden, E.; Nally, S.; Goucher, G.; Thamo, T. Policy-oriented environmental research: What is it worth? Environ. Sci. Policy 2018, 86, 64–71. [Google Scholar] [CrossRef]
  12. Agheb, S.; Tan, X.; Sun, B.; Tsang, D.H. Contract Design for Aggregating, Trading, and Distributing Reserves in Demand-Side Frequency Regulation. IEEE Trans. Ind. Inf. 2017, 14, 2539–2549. [Google Scholar] [CrossRef]
  13. Tavakoli, A.; Negnevitsky, M.; Nguyen, D.T.; Muttaqi, K.M. Energy exchange between electric vehicle load and wind generating utilities. IEEE Trans. Power Syst. 2015, 31, 1248–1258. [Google Scholar] [CrossRef]
  14. Yingchao, D.; Cong, W.; Hongli, Z.; Xiaojun, Z. A novel multi-objective optimization framework for optimal integrated energy system planning with demand response under multiple uncertainties. Inf. Sci. 2024, 663, 120252. [Google Scholar]
  15. Vrettos, E.; Oldewurtel, F.; Andersson, G. Robust energy-constrained frequency reserves from aggregations of commercial buildings. IEEE Trans. Power Syst. 2016, 31, 4272–4285. [Google Scholar] [CrossRef]
  16. Zhan, S.; Hou, P.; Enevoldsen, P.; Yang, G.; Zhu, J.; Eichman, J.; Jacobson, M.Z. Co-optimized trading of hybrid wind power plant with retired EV batteries in energy and reserve markets under uncertainties. Int. J. Electr. Power Energy Syst. 2020, 117, 105631. [Google Scholar] [CrossRef]
  17. Chen, X.; Wang, C.; Wu, Q.; Dong, X.; Yang, M.; He, S.; Liang, J. Optimal operation of integrated energy system considering dynamic heat-gas characteristics and uncertain wind power. Energy 2020, 198, 117270. [Google Scholar] [CrossRef]
  18. Zhang, R.; Jiang, T.; Li, F.; Li, G.; Chen, H.; Li, X. Coordinated Bidding Strategy of Wind Farms and Power-to-Gas Facilities using a Cooperative Game Approach. IEEE Trans. Sustain. Energy 2020, 11, 2545–2555. [Google Scholar] [CrossRef]
  19. Wu, Z.; Zhou, M.; Wang, J.; Du, E.; Zhang, N.; Li, G. Profit-sharing mechanism for aggregation of wind farms and concentrating solar power. IEEE Trans. Sustain. Energy 2020, 11, 2606–2616. [Google Scholar] [CrossRef]
  20. GAMS/SCENRED Documentation. 2024. Available online: http://www.gams.com/docs/document.htm (accessed on 14 November 2024).
  21. PJM—Markets and Operations, Data Miner. 2024. Available online: https://dataminer2.pjm.com (accessed on 14 November 2024).
  22. PJM Market Demand Response Programs. 2024. Available online: https://www.pjm.com/markets-and-operations/demand-response.aspx (accessed on 14 November 2024).
Figure 1. Wind and DR resource cooperation scheme.
Applsci 14 10699 g001
Figure 2. The flowchart for the proposed bidding strategies.
Applsci 14 10699 g002
Figure 3. Wind power data for a sample day.
Applsci 14 10699 g003
Figure 4. Expected hourly prices in energy and regulation markets.
Applsci 14 10699 g004
Figure 5. Total expected profit in each case.
Applsci 14 10699 g005
Figure 6. The expected profits from each market.
Applsci 14 10699 g006
Figure 7. Comparison of individual and integrated bidding strategies for WPP and DRA, (a) results of Case S2, (b) results of Case S4, (c) results of Case S6.
Applsci 14 10699 g007
Figure 8. Daily profit over 1 week.
Applsci 14 10699 g008
Figure 9. Expected profit and CVaR for different β, (a) expected profit versus CVaR for Case 1, (b) expected profit versus CVaR for Case 2, (c) expected profit versus CVaR for Case 3.
Applsci 14 10699 g009
Table 1. Market participation of bidding entities: comparative analysis in multiple cases.
CaseBidding EntityBidding ScenariosMarket(s) Involved
Case 1WPP 1 without DR aggregatorsS1Energy market
S2Energy and frequency regulation markets
Case 2DRA without wind power producers S3Energy market
S4Energy and frequency regulation markets
Case 3Coalition of WPP 1 and DRAS5Energy market
S6Energy and frequency regulation markets
Table 2. Comparison of results of allocated profits based on the game theory methods.
PlayerUncoordinated Profits (USD)Nucleolus-Based MethodShapley-Value Method
Profit (USD)Surplus Profit (USD)Profit (USD)Surplus Profit (USD)
WPP 155,534.557,563.952029.4557,563.952029.45
DRA25,78227,811.452029.4527,811.452029.45
Table 3. Comparison of results of allocated profits based on the game theory method.
PlayerUncoordinated Profits (USD)Nucleolus-Based MethodShapley-Value Method
Profit (USD)Surplus Profit (USD)Profit (USD)Surplus Profit (USD)
WPP 155,534.558,5793044.658,375.02840.5
WPP238,683.041,0782394.741,199.02516.0
DRA25,782.028,2532471.228,336.02554.0
Total119,999.5127,910.07910.5127,910.07910.5
Disclaimer/Publisher’s Note: The statements, opinions and data contained in all publications are solely those of the individual author(s) and contributor(s) and not of MDPI and/or the editor(s). MDPI and/or the editor(s) disclaim responsibility for any injury to people or property resulting from any ideas, methods, instructions or products referred to in the content.