Featured Application
This NMR-based analytical method for pulegone detection could help food safety laboratories rapidly screen mint-flavored products and essential oils for compliance with regulatory limits. The approach is particularly valuable for quality control in the food and flavoring industry, where fast and reliable pulegone quantification is essential to ensure consumer safety, especially given pulegone’s classification as a possible human carcinogen.
Abstract
Pulegone is a monoterpene ketone found in a variety of mint species. It has been classified as possibly carcinogenic to humans (Group 2B) by the International Agency for Research on Cancer (IARC). In previous studies, pulegone in food was analyzed exclusively via GC-MS, while 1H NMR methods were limited to essential oils. The aim of this study was to develop an NMR method for the detection and quantification of pulegone in essential oils and foods. A mixture of methanol-d4/chloroform-d1 in a 1:1 ratio (v/v) was identified as the most effective solvent for separating pulegone signals. The essential oils were subjected to analysis at this solvent-mixture ratio. The extraction of pulegone was required for food analysis, and the steam distillation method proved to be more effective than the ultrasonic-assisted extraction method. The highest pulegone concentrations were identified in pennyroyal oil and muña oil, whereas lower levels were observed in other matrices, including corn mint oil and select food items. A toxicological assessment showed that the amount consumed did not exert any adverse effects on human health.
1. Introduction
Pulegone, (R)-2-isopropylidene-5-methyl-cyclohexanone, is a monoterpene ketone that is a major component of mint flavor. It occurs naturally in the essential oils of various mint species, such as peppermint (Mentha x piperita L.) and pennyroyal (Mentha pulegium L.) [1,2,3]. In addition to mint, pulegone is a component of the essential oils of buchu (Agathosma betulina) and muña (Minthostachys mollis Griseb.) [4,5,6].
At 59.1%–77.9%, the pulegone content in the essential oil of pennyroyal is the highest among the mint species [1,7,8]. In peppermint, a proportion of pulegone in the oil of 1.2%–12.3% can be found [2,9]. In spearmint (Mentha spicata L.), the proportion of pulegone is in the range of 0.30%–29.59% [3]. In corn mint (Mentha arvensis L.) oil, the pulegone content is 0.855–2.27% [10]. Horse mint (Mentha longifolia L.) has a pulegone content of 0.17%–69.49% in the essential oil, lesser calamint (Calamintha nepeta L.) has a pulegone content of 2.4%–64.6%, apple mint (Mentha suaveolens Ehrh.) has a pulegone content of 1.15–2.5%, and water mint has a pulegone content of 0.45% [8,11,12,13]. In Mentha haplocalyx Briq., the proportion of pulegone is 28.7%–80.2% [14].
In Germany, peppermint is one of the most popular types of infusion. In 2018, sales of peppermint tea in Germany totaled 5511 t [15]. Peppermint, corn mint, and spearmint are often used as flavoring in foods such as sweets and chewing gum [16]. In the kitchen, mint leaves are also used fresh or dried. In Great Britain and the USA, mint is used as a sauce and is served with savory dishes. In addition, spearmint is often used to prepare lamb dishes. Pennyroyal is also used in aromatherapy and as a spice [16].
Siano et al. [10] examined various sweets, pastilles, and chewing gums with mint flavor for their pulegone content and found 0.45–29.91 mg/kg in confectionery, 1.23–14.29 mg/kg in pastilles, and 1.63–138.15 mg/kg in chewing gum. A pulegone content of 6.2 mg/kg was quantified for a mint-flavored chocolate brand [17].
A carcinogenicity study was conducted by the National Toxicology Program (NTP) in 2011. They classified the activity of pulegone in male rats as “no evidence of carcinogenic activity”. Increased formation of urinary bladder papillomas was observed in female rats. This evidence was acknowledged by the NTP as “clear evidence of carcinogenic activity”. An increased incidence of liver neoplasia was observed in male and female mice, with the formation of hepatoblasts in males and adenomas in both males and females [18]. The occurrence of this liver tumor was classified as “clear evidence of carcinogenic activity”.
Considering this evidence, the International Agency for Research on Cancer (IARC) has classified pulegone as possibly carcinogenic to humans (Group 2B). Furthermore, the use of pulegone as such as a flavoring agent in food is prohibited in the European Union in accordance with Regulation (EC) No. 1334/2008 Annex III [19]. Nevertheless, the possibility of pulegone occurrence in flavored foods cannot be entirely discounted, given that the use of mint flavoring is permitted. For this reason, Regulation (EC) No. 1334/2008 sets maximum levels for confectionery (250 mg/kg), very small breath-freshening confectionery (2000 mg/kg), chewing gum (350 mg/kg), nonalcoholic beverages (20 mg/kg), and alcoholic beverages (100 mg/kg) with mint or peppermint flavoring.
The Joint FAO/WHO Expert Committee on Food Additives (JEFCFA) estimates the average intake of pulegone to be 2 µg/day/person or 0.04 µg/kg body weight (bw) in Europe [20]. The European Union recommends limiting peppermint oil consumption to a maximum of 1.2 mL per day. Given a maximum content of 32.97 mg of pulegone in 1.2 mL of peppermint oil, the daily intake of pulegone for a 60 kg individual is 0.55 mg/kg bw. The Committee of Experts on Flavouring Substances has established a tolerable daily intake (TDI) of 0.1 mg/kg bw for pulegone [21]. In addition, previous studies reported a no observed effect level (NOEL) of 0.44 mg/kg bw and a no observed adverse effect level (NOEAL) of 0.75 mg/kg bw [20,21].
To date, pulegone in food has been primarily analyzed using gas chromatography coupled with mass spectrometry (GC-MS). A review of the literature reveals that nuclear magnetic resonance (NMR) methods have been employed only for the analysis of essential oils. The measurement time for NMR was shorter than that for GC-MS, and the preparation of samples for NMR was less time-consuming than that for GC-MS [22]. Therefore, NMR is a promising candidate for routine analysis in testing laboratories for the analysis of pulegone in food.
In the present study, the NMR measurement parameters of the pure substance pulegone were initially optimized, specifically including the solvent. In the literature, only chloroform-d1 (CDCl3) has been used as a solvent to date [1,3]. Subsequently, essential oils from trade and foods such as teas, herbs, and confectioneries are analyzed for pulegone. Furthermore, the method is validated in terms of selectivity, accuracy, and linearity, as well as the determination of the limit of detection (LOD) and limit of quantification (LOQ). Subsequently, a toxicological evaluation is performed.
2. Results and Discussion
2.1. Method Development and Optimization
2.1.1. Influence of the Solvent on the Pulegone Signals
Pulegone is insoluble in water and exhibits a n-octanol/water partition coefficient lg(KOW) of 3.08 [23,24]. It can be concluded that lipophilic solvents are suitable for the dissolution of pulegone.
In this study, NMR spectra of pulegone were obtained in a series of solvents, including CDCl3, methanol-d4 (MeOD), MeOD with CDCl3 (1:1; v/v, 1:4; v/v, 4:1; v/v), cyclohexane-d12, and xylene-d10 with CDCl3 (1:50; v/v, 1:20; v/v). A comparison of the spectra of pure pulegone in different solvents reveals that the signals are separated to varying degrees of success and that some signals are shifted.
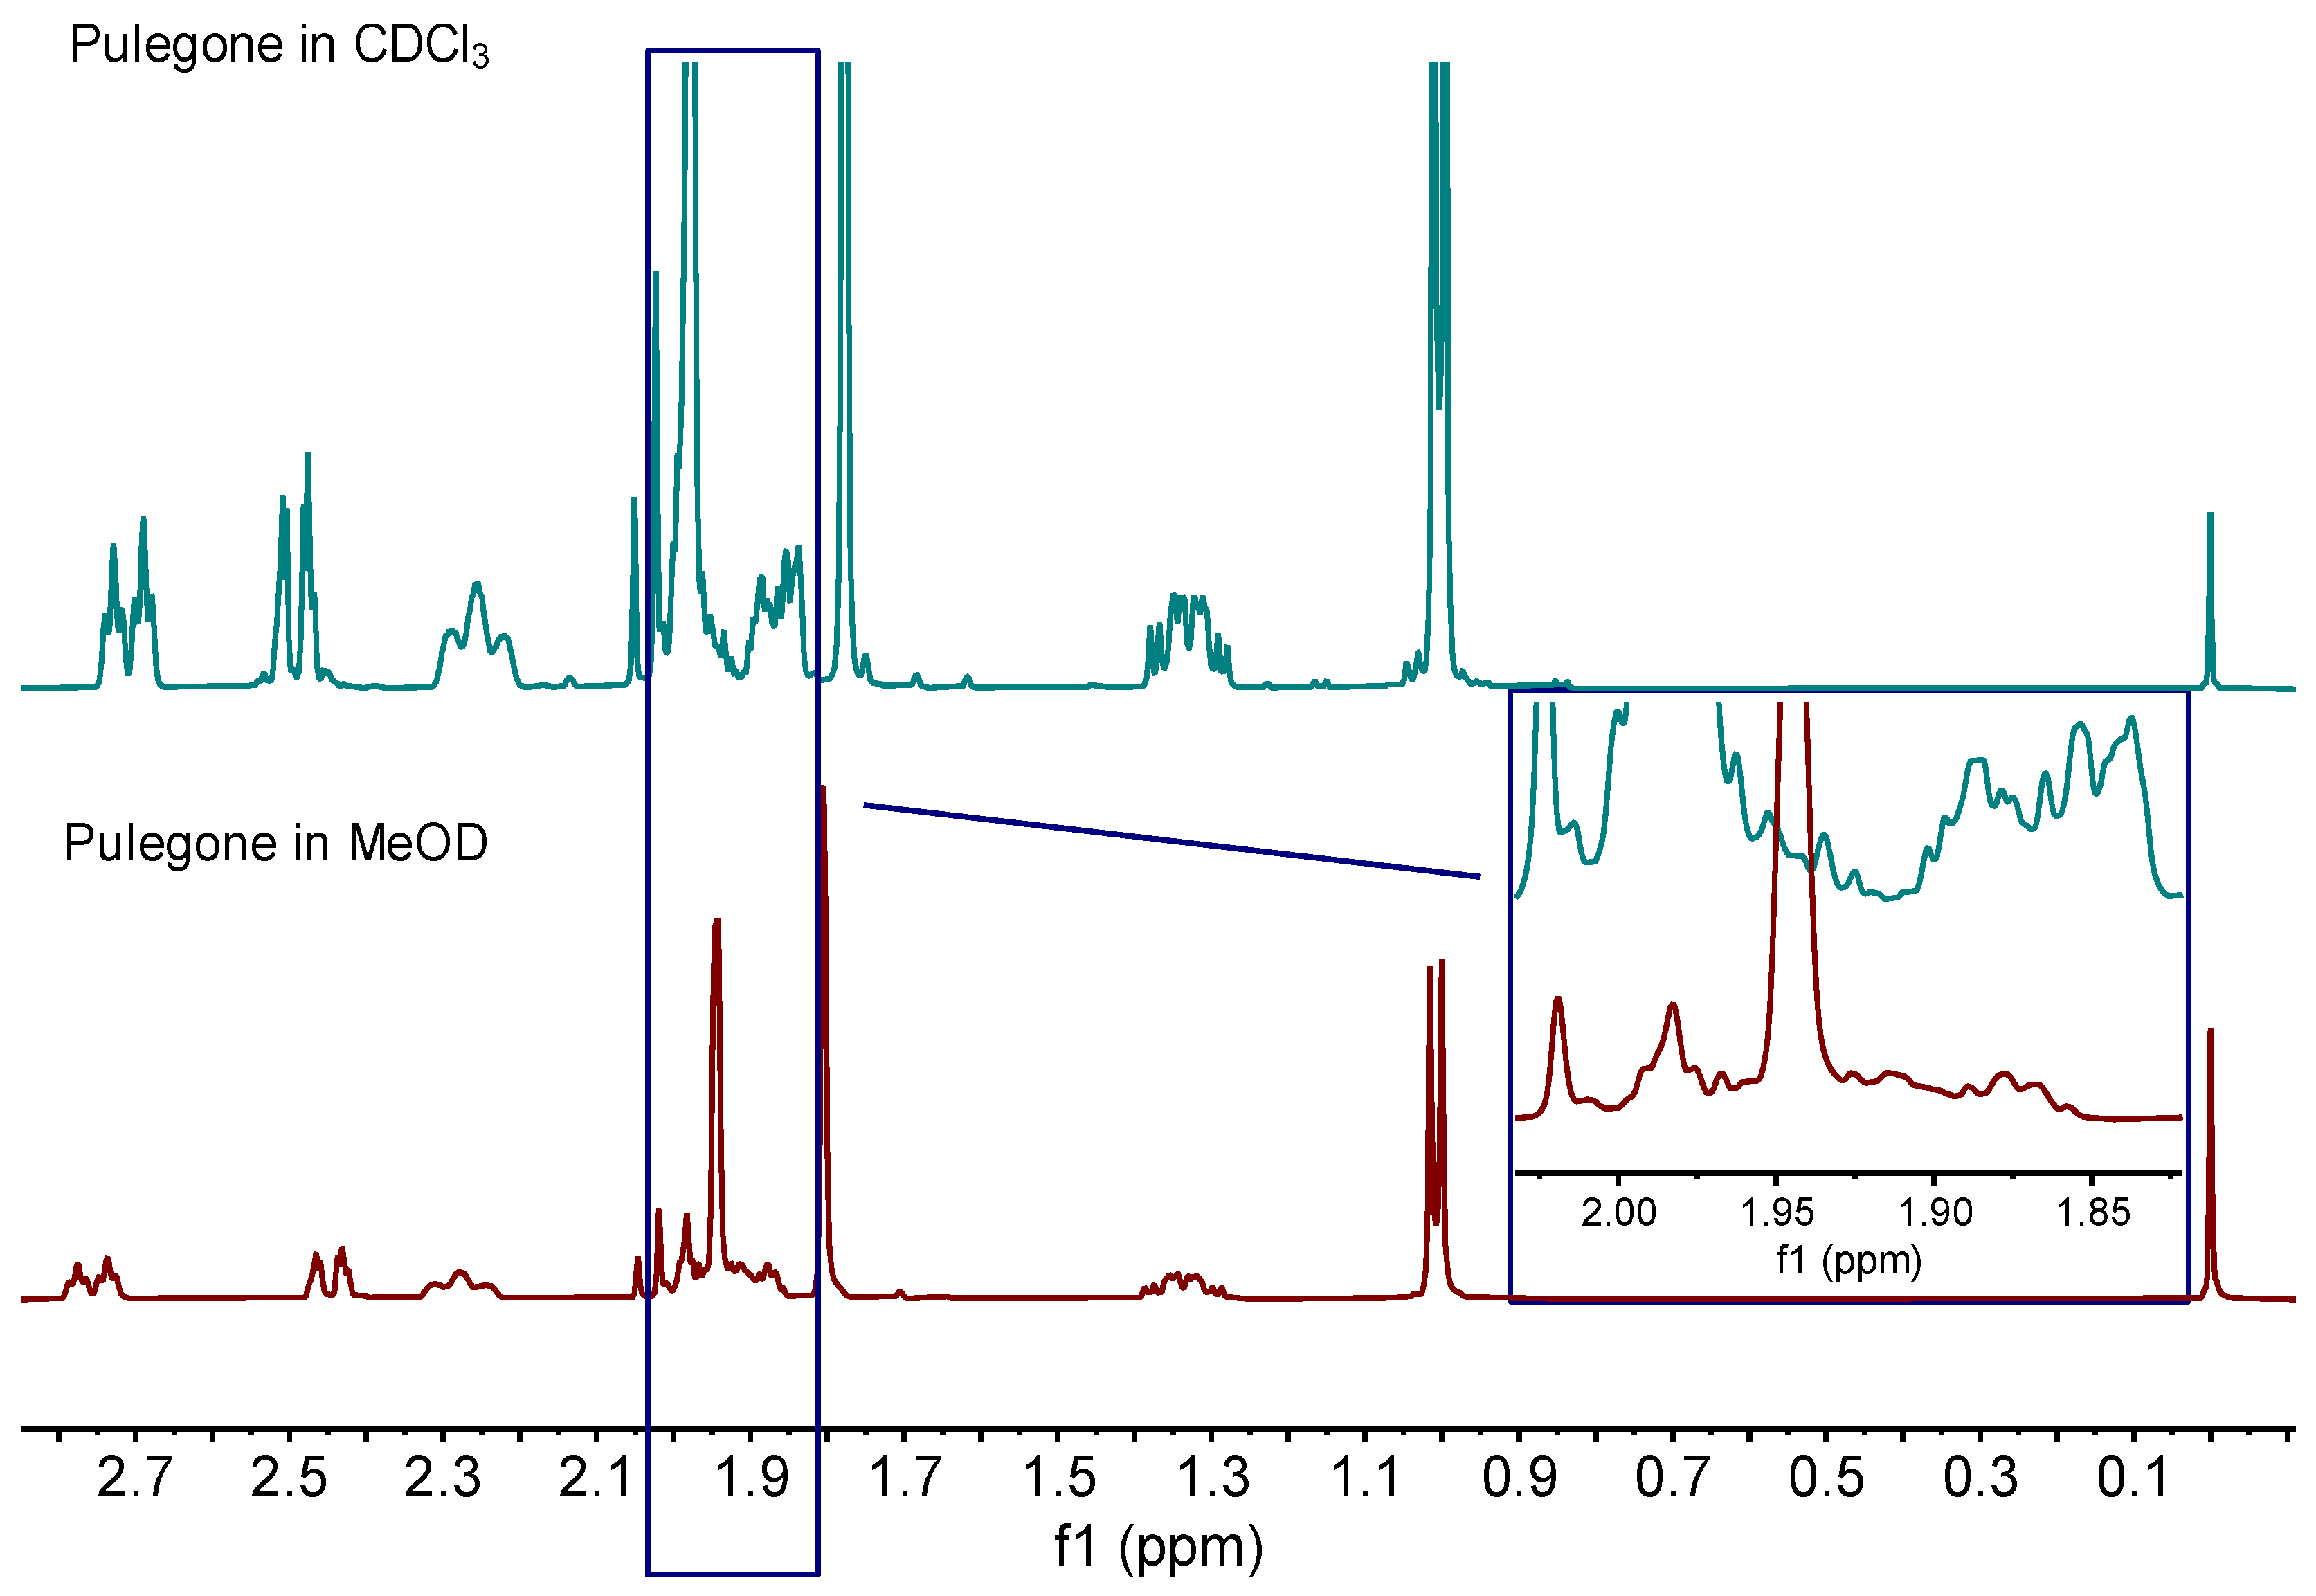
Figure 1 shows a comparison between the 1H spectrum of pulegone in CDCl3 and that of pulegone in MeOD. The use of MeOD resulted in the detection of an additional signal at δH = 1.98 ppm, which was not present in the spectrum obtained using CDCl3. However, the separation between the doublet at δH = 1.94 ppm and the multiplet at δH = 1.89 ppm is less effective when MeOD is used as the solvent, compared to using CDCl3.
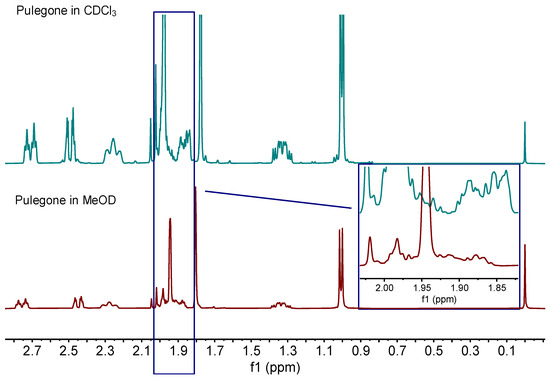
Figure 1.
Comparison of 1H NMR spectra of pulegone in chloroform-d1 (CDCl3) (upper panel, blue line) and pulegone in methanol-d4 (MeOD) (lower panel, red line). The inset shows a detailed enlargement of the range δH = 1.81–2.04 ppm for a better view of the differences between the spectra.
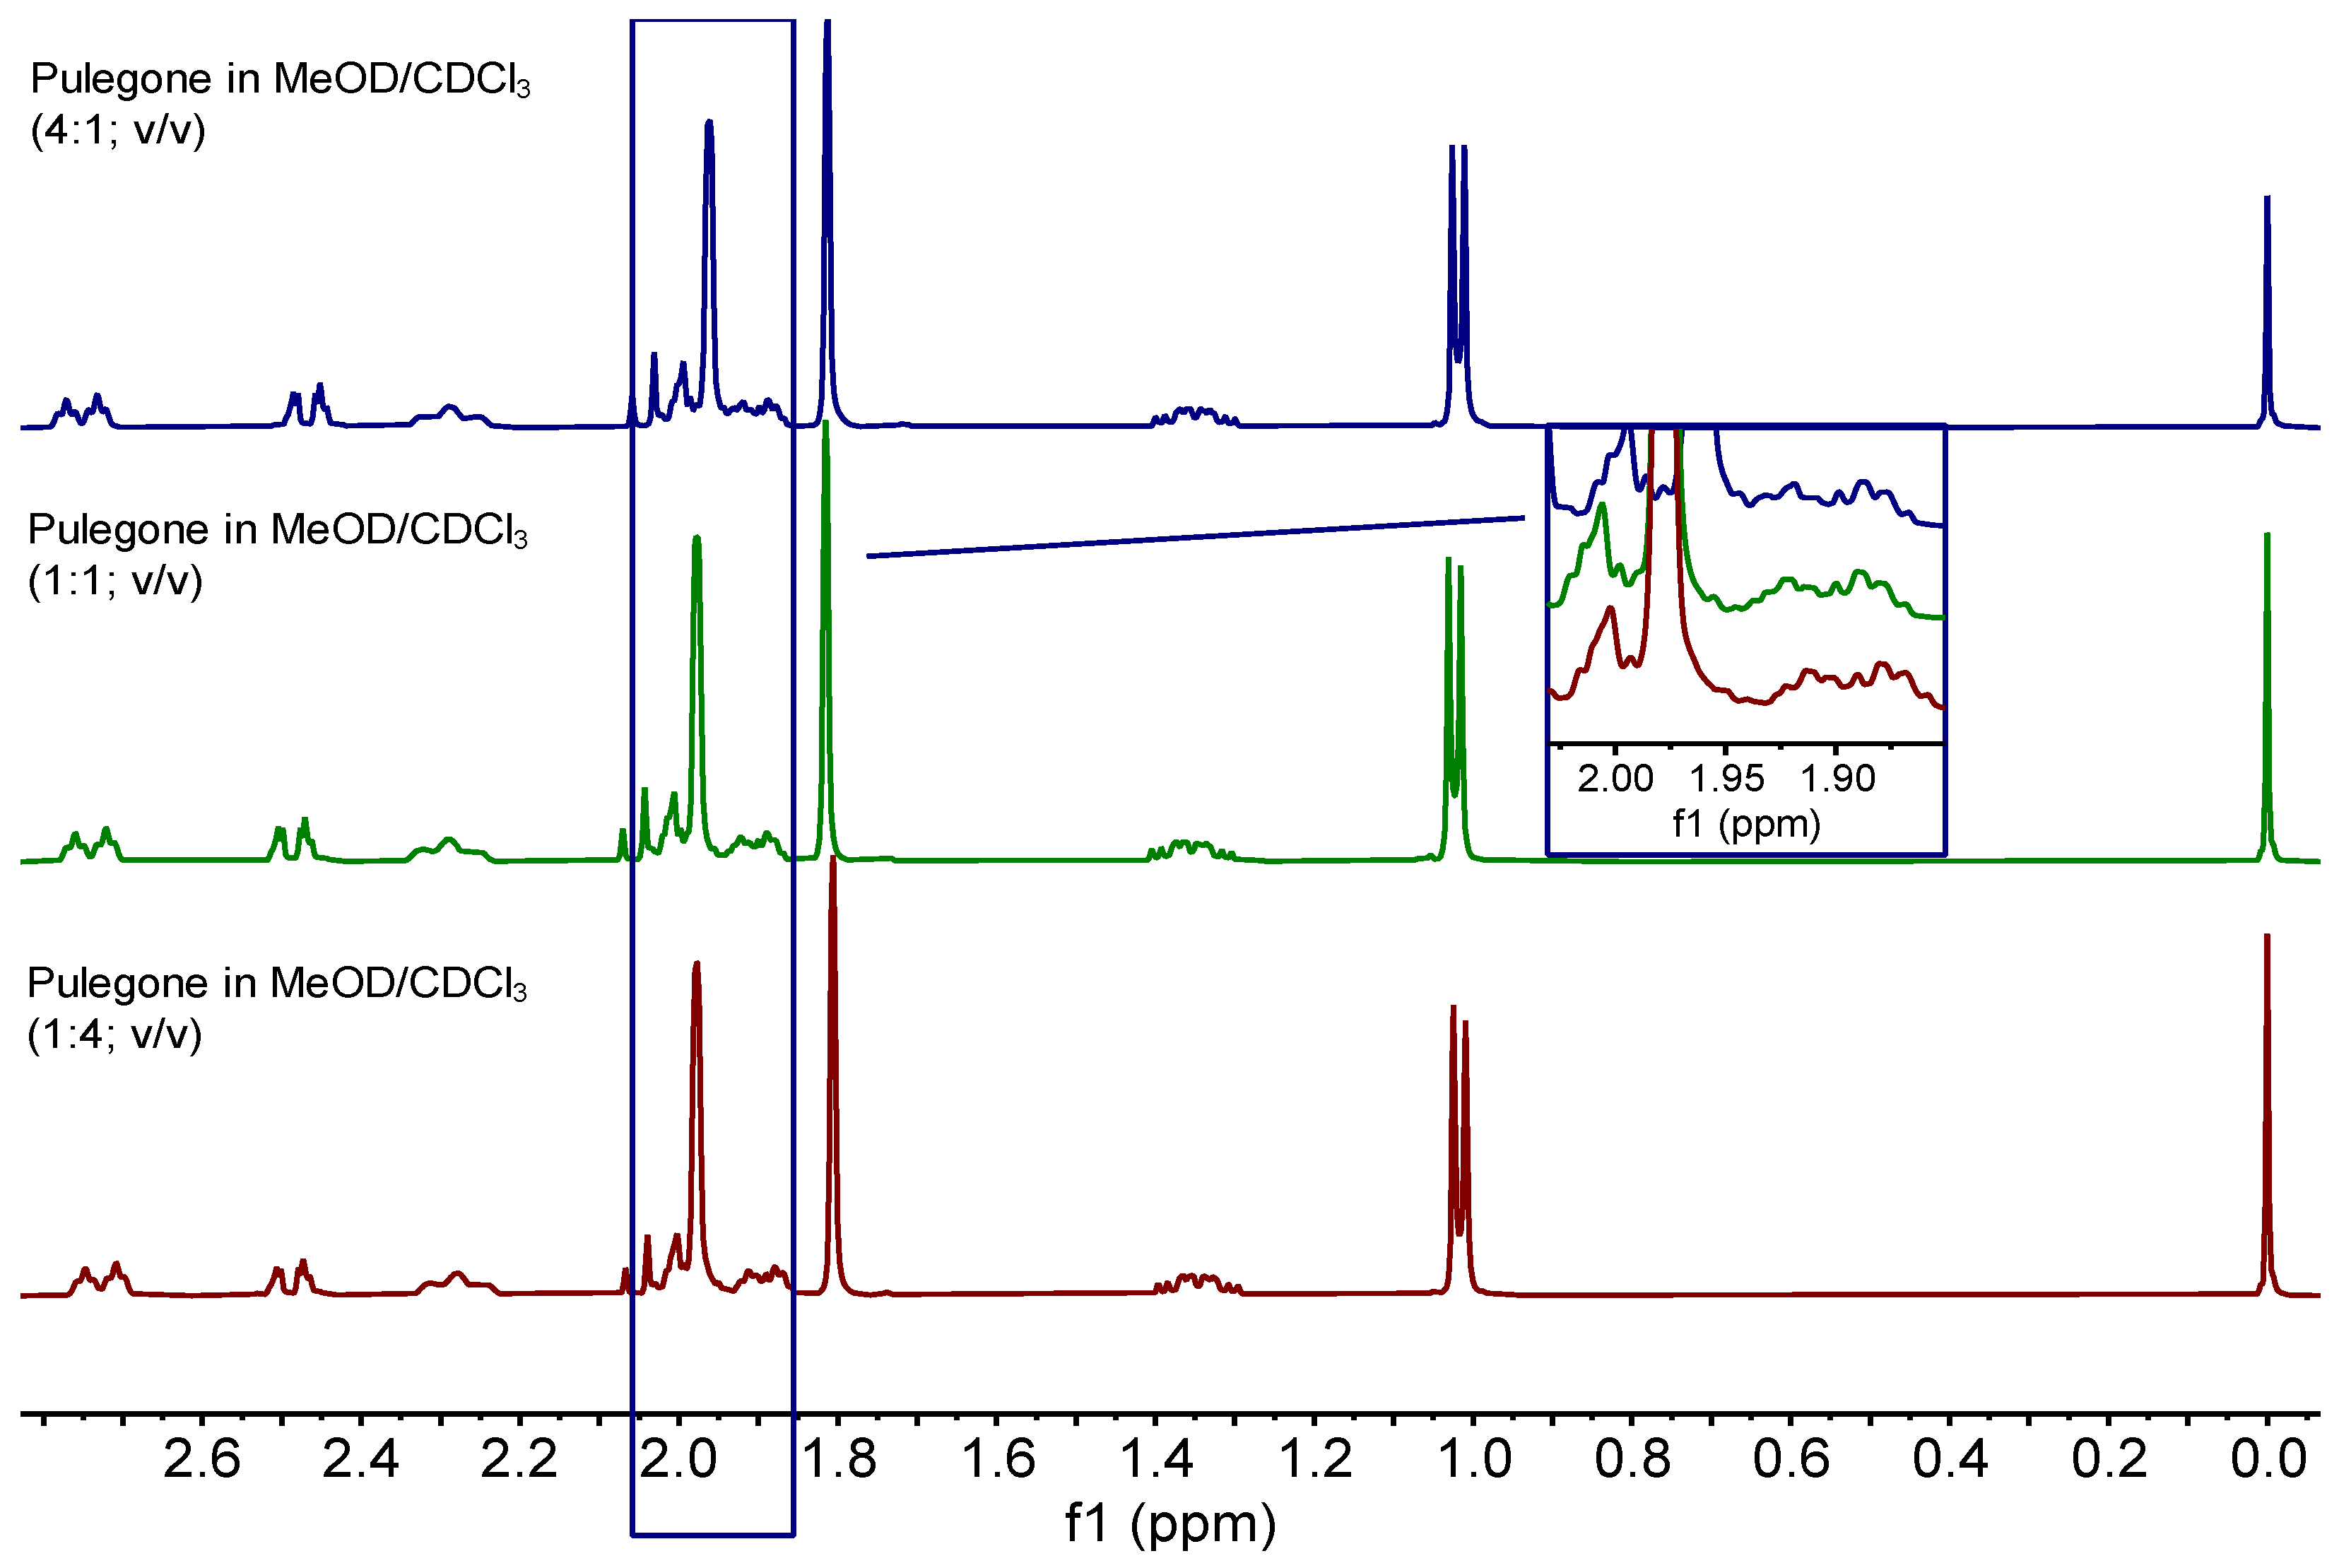
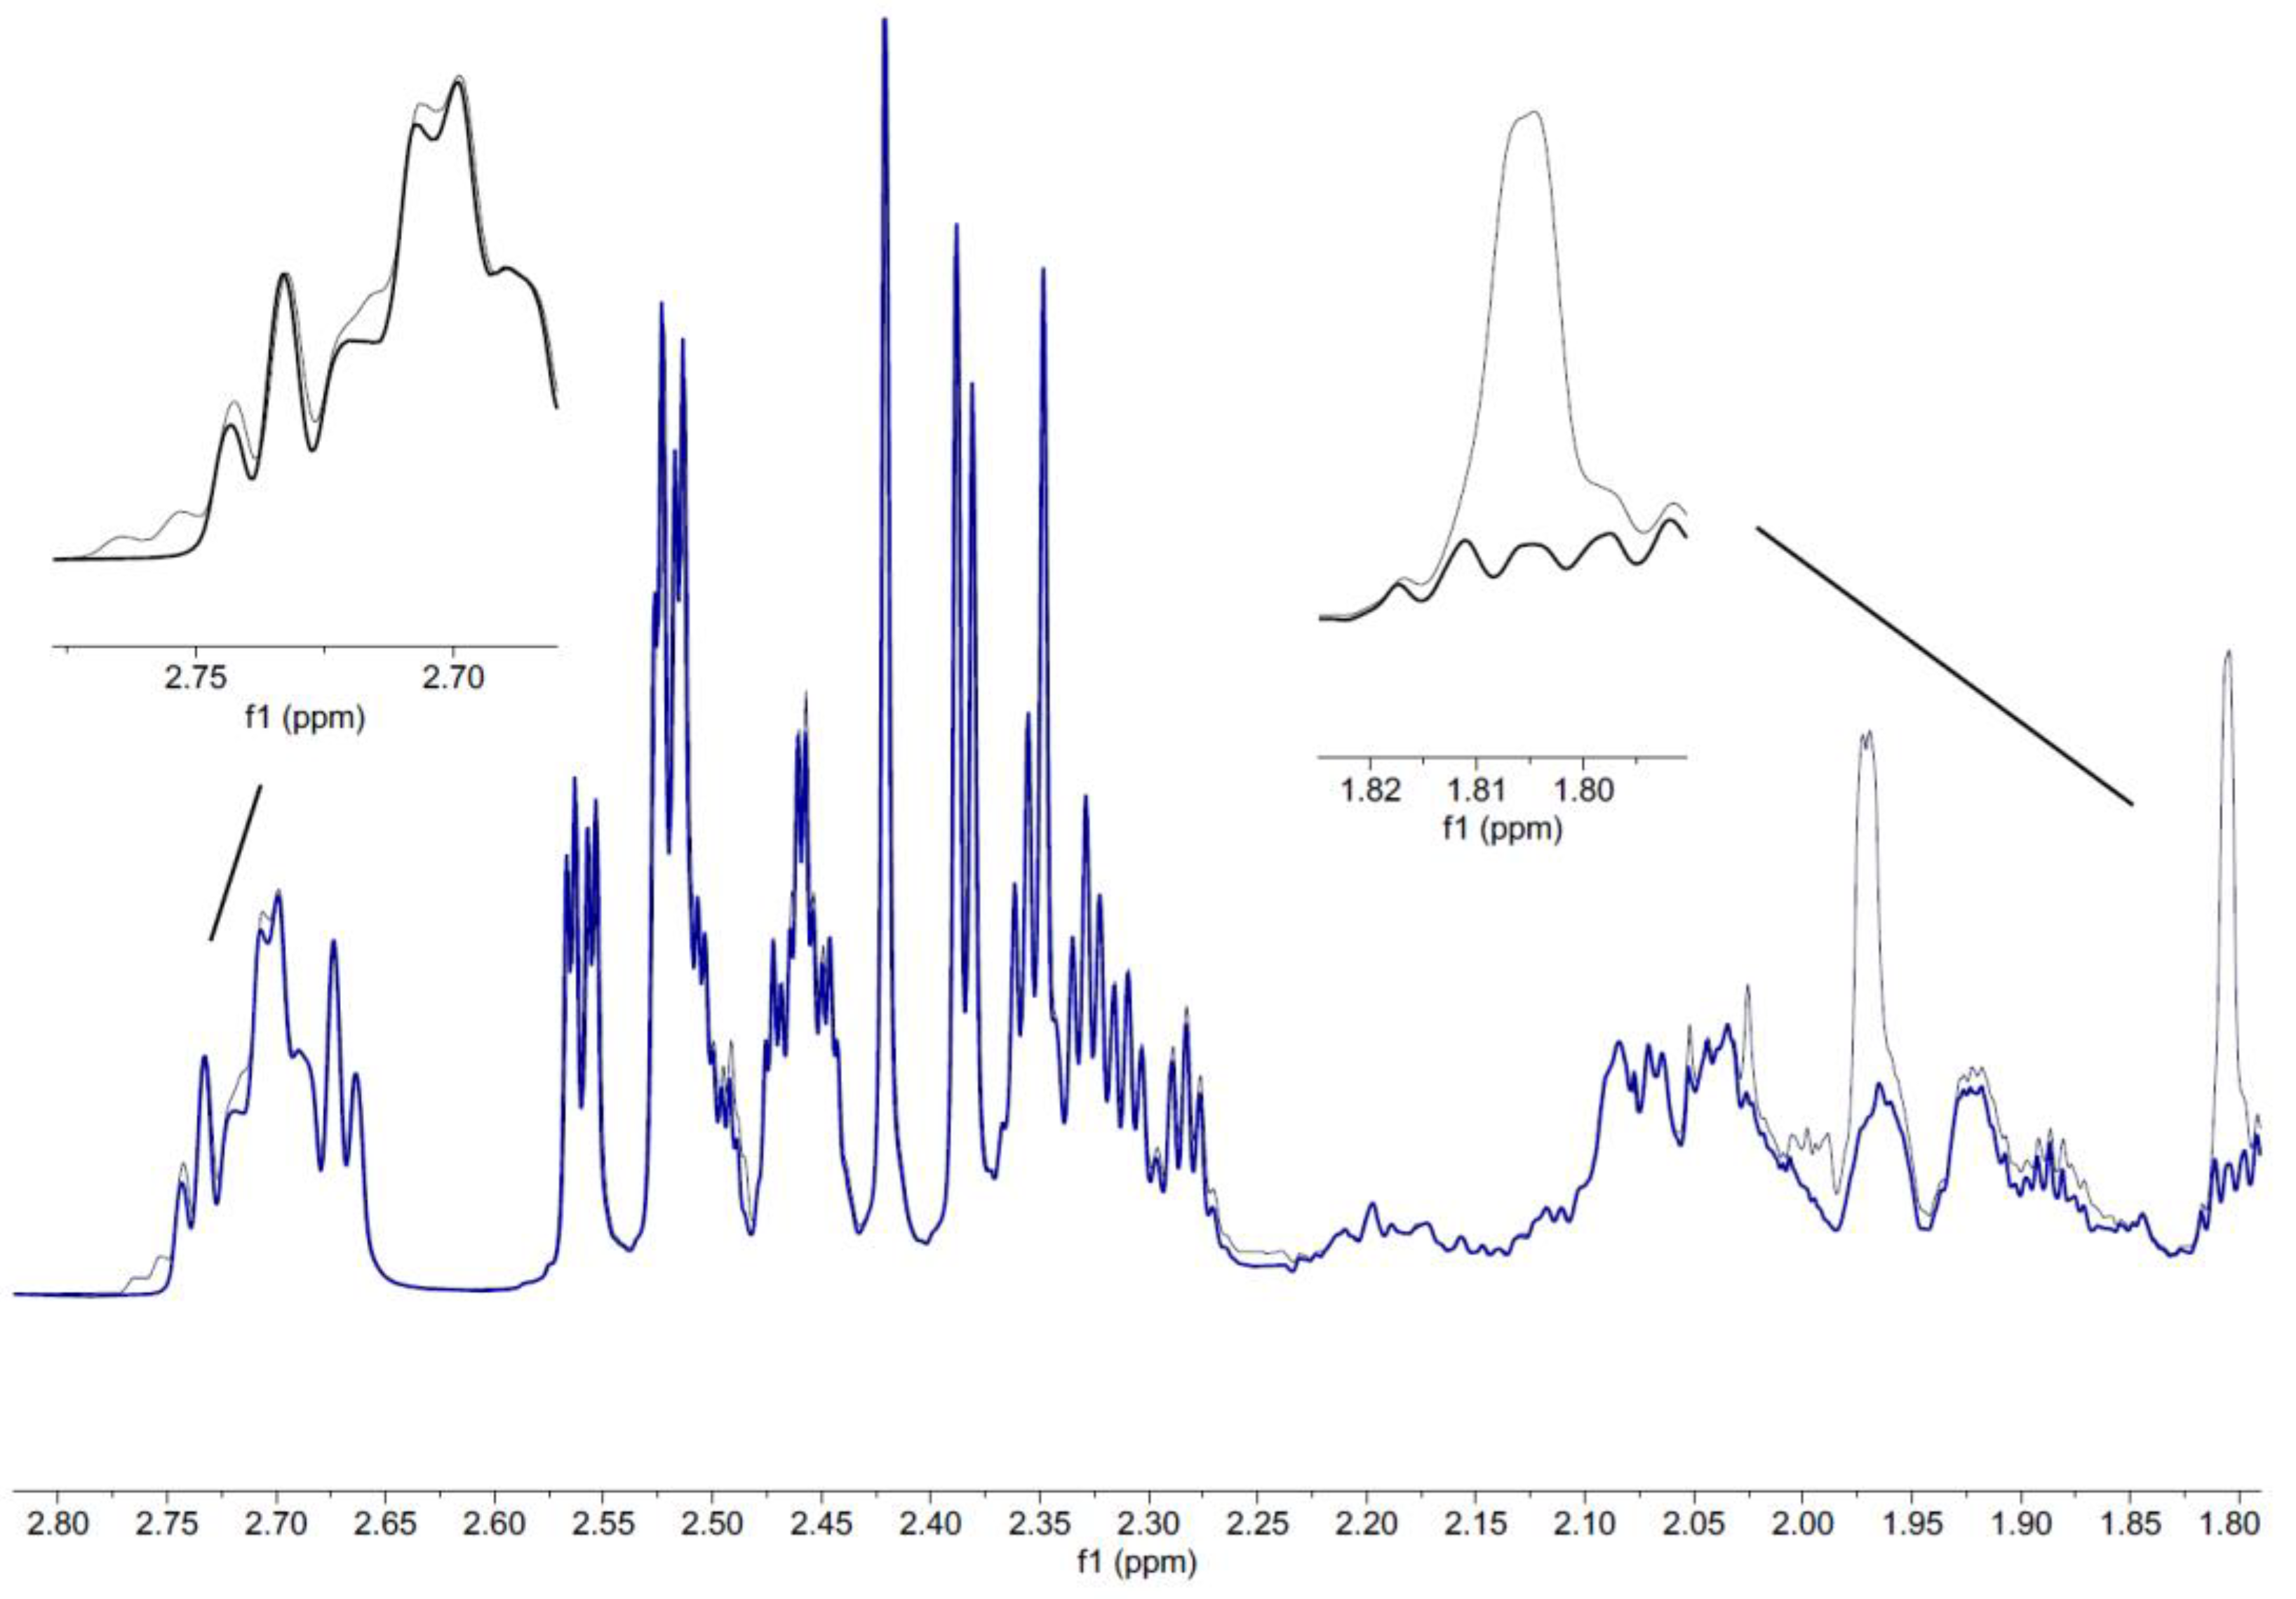
Figure 2 shows the pulegone spectra at MeOD/CDCl3 ratios 1:4 (v/v), 1:1 (v/v), and 4:1 (v/v). The separation of the signals in the range δH = 1.85 to 2.00 ppm differed between the three spectra shown. The multiplet at δH = 1.90 ppm is less distinctly separated from the doublet at δH = 1.96 ppm at a mixing ratio of 4:1 (v/v) than at a mixing ratio of 1:1 (v/v) and 1:4 (v/v). The aforementioned multiplet is most effectively separated from the doublet at a mixing ratio of 1:4 (v/v). In the spectrum with a mixing ratio of 1:4 (v/v), the separation between the multiplet at δH = 2.00 ppm and the doublet at δH = 1.98 ppm was the least distinct compared to the other mixing ratios. The optimal separation between the multiplet at δH = 2.00 ppm and the doublet at δH = 1.98 ppm was observed at a ratio of 4:1. The quality of the separation between the multiplet at δH = 2.00 ppm and the doublet at δH = 1.98 ppm, as well as between the doublet at δH = 1.98 ppm and the multiplet at δH = 1.90 ppm, was intermediate between those of the other mixing ratios at a mixing ratio of 1:1 (v/v). In the spectrum of the MeOD/CDCl3-mixture in a ratio of 1:1 (v/v), the signals in the range δH = 1.85 to 2.00 ppm were more intense than those in the spectrum with only MeOD as the solvent (see Figure 1). This difference in signal intensity likely arises from the different solubility properties of pulegone in the two solvent systems rather than from spectroscopic effects, as the same concentration was used for both measurements. In addition, the signals are better separated. The pulegone signals from future samples can be superimposed by resonances from other matrix constituents, and the CDCl3/MeOD-mixture (1:1, v/v) offers the best dispersion of pulegone resonances. Thus, further samples were prepared using a solvent mixture of MeOD and CDCl3 at a 1:1 (v/v) ratio.

Figure 2.
Comparison of 1H NMR spectrum of pure pulegone in a solvent mixture consisting of methanol-d4 (MeOD) and chloroform-d1 (CDCl3) at mixing ratios of 1:4, 1:1, and 4:1 (v/v) (blue line, green line, red line, from top to bottom). The inset shows an enlargement of the range δH = 1.85–2.05 ppm for a better view of the differences between the spectra.
As illustrated in Figure 2, signal shifts are observed for all other signals. For example, the doublet of the triplet was observed at a MeOD/CDCl3 ratio of 1:4 (v/v) at δH at = 2.73 ppm, at a ratio of 1:1 (v/v) at δH = 2.74 ppm, and at a ratio of 4:1 (v/v) at δH = 2.75 ppm.
Furthermore, cyclohexane-d12 was tested as a solvent. The halogenated alkane chloroform is harmful to the environment, has proven target organ toxicity, and is possibly carcinogenic to humans (IARC Group 2B) [25,26]. Thus, substitution with a less harmful solvent is sensible [27]. For economic reasons, it is feasible to use nondeuterated cyclohexane as a solvent because cyclohexane solely manifests in the spectrum as a singlet at 1.40 ppm, which can be excluded from the spectrum through solvent suppression. However, no enhanced separation was observed for the CDCl3/MeOD mixture. Additionally, the time required to adjust the solvent suppression and adapt the spectrum to this suppression is greater than the benefit, which is why cyclohexane was not used.
Xylene-d10 is used as a collecting agent for steam distillation. Subsequently, the distillate is then diluted in conjunction with the xylene-d10 in CDCl3. As a result, the proportion of xylene-d10 in CDCl3 varies with the volume of the distillate. Most mixing ratios include 1:20 (v/v) and 1:50 (v/v) dilutions. Accordingly, the occurrence of signal shifts from pulegone at varying mixing ratios was investigated.
With different mixing ratios of xylene-d10 and CDCl3, slight signal shifts are evident in the spectrum: dt is located at δH = 2.69 ppm at a mixing ratio of 1:20 (v/v) and at δH = 2.70 ppm at a mixing ratio of 1:50 (v/v). The signal from the proton at position 8 exhibits a chemical shift of δH = 1.76 ppm at a xylene-d10/CDCl3 ratio of 1:20 (v/v) and a chemical shift of δH = 1.77 ppm at a xylene-d10/CDCl3-ratio of 1:50 (v/v).
2.1.2. Assignment of Signals from Pulegone
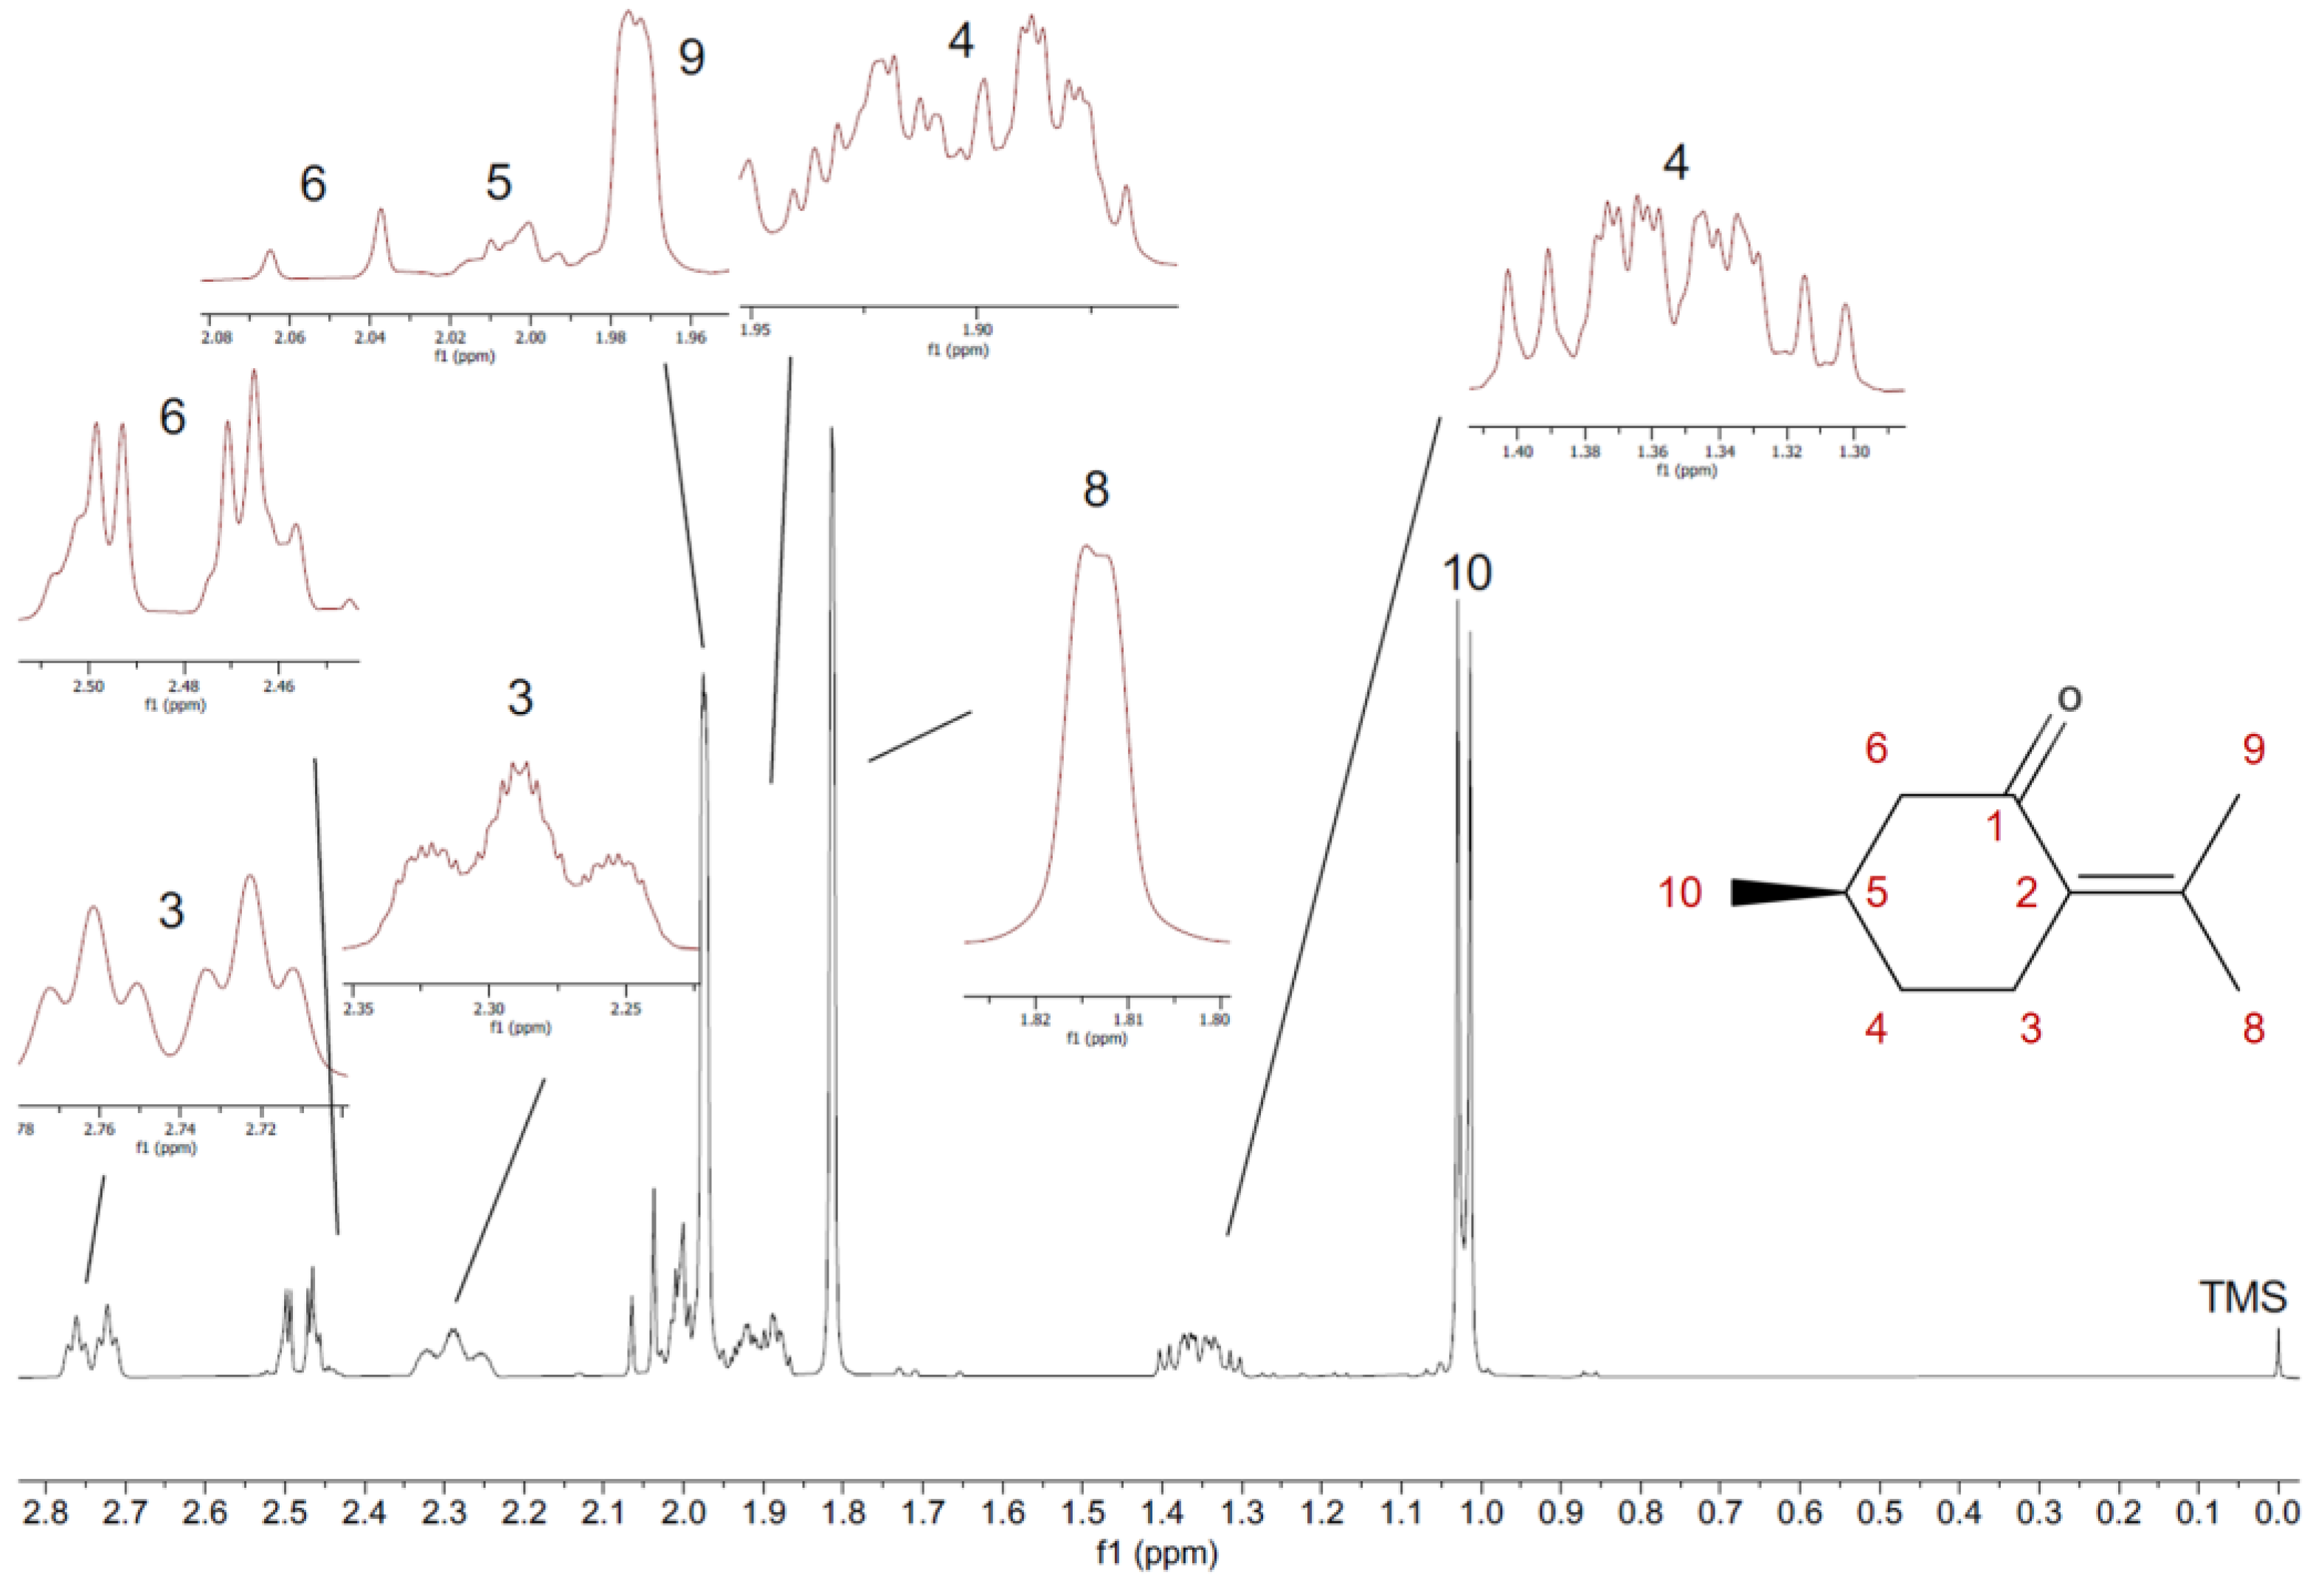
The 1H signals from pulegone in CDCl3/MeOD (1:1; v/v) are presented in Table 1. The assignment of the 1H signals is illustrated in Figure 3, and the 13C signals are illustrated in Figure 4. The HSQC spectrum is shown in Figure 5. The coupling constants were determined using a 1H-J-resolved 2D NMR (JRES) spectrum. The coupling constants of the multiplets at δH = 2.29, 1.90, and 2.00 ppm could not be determined. It is likely that these are higher-order signals.

Table 1.
Assignment of the 1H signals from pulegone in chloroform-d1/methanol-d4 mixture (1:1, v/v) as well as the number of protons of the respective signal, its multiplicity, and coupling constant, m: multiplet, d: doublet, dt: doublet of triplet, ddd: doublet of doublet of doublet.
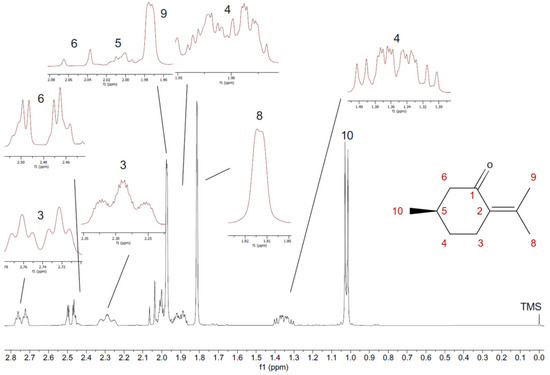
Figure 3.
1H NMR (400 MHz, 300 K, methanol-d4/chloroform-d1 1:1; v/v) spectrum of pure pulegone and the assignment of all signals. The inset shows the chemical structure with numbering.
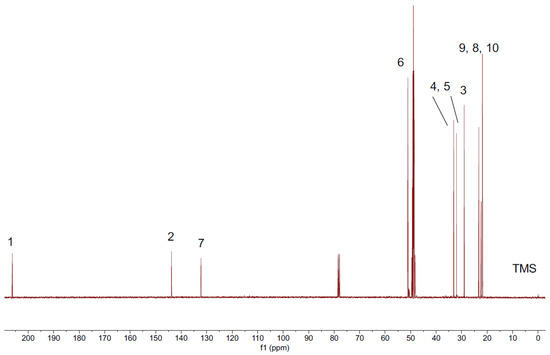
Figure 4.
13C-NMR (100 MHz, 300 K, methanol-d4/chloroform-d1 1:1; v/v) spectrum of pulegone and the assignment of the signals (206.2 ppm (1), 143.8 ppm (2), 29.01 ppm (3), 32.04 ppm (4), 33.12 ppm (5), 51.1 ppm (6), 132.2 ppm (7), 23.26 ppm (8), 22.37 ppm (9), and 21.86 ppm (10)). For carbon numbering, see Figure 3.
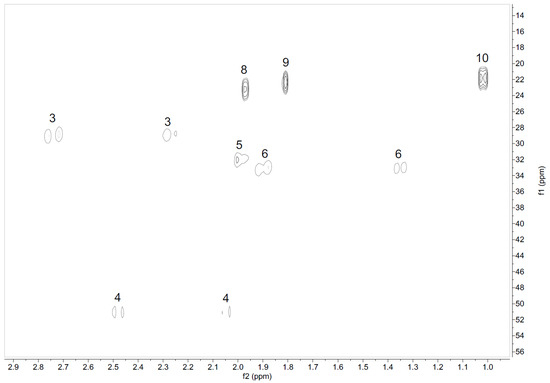
Figure 5.
Section of the HSQC spectrum of pure pulegone recorded in methanol-d4/chloroform-d1 (1:1; v/v).
2.1.3. Extraction of Pulegone from Food
In this study, an attempt was made to extract pulegone from tea, herbs, and confectionery using both ultrasonic-assisted extraction and steam distillation. In ultrasonic-assisted extraction, both CDCl3 and MeOD were used as the extraction agents. The extraction method was used to examine peppermint teas and chewing candies. Despite an increase in the weight of the sample and the volume of the extraction agent, no pulegone was detected.
In contrast, hydrodistillation was employed for the extraction of pulegone from teas, herbs, pastilles, and coated tablets. The hydrodistillation method was developed based on the ISO 6571 method [28]. Deuterated xylene-d10 was used as receiving solvent. As part of this study, the impact of reducing the amount of expensive xylene-d10 used on the yield of pulegone was examined in peppermint and pennyroyal. Furthermore, the potential impact of distillation time reduction on the yield of pulegone was investigated using pennyroyal samples. The test specification specifies a distillation time of 4 h, whereas peppermint requires a shorter distillation time of 3 h.
In both pastilles and coated tablets, the ingredients may include hydrophilic substances such as sugar and hydrophobic substances such as magnesium salts of fatty acids and carnauba wax. To eliminate the possibility of hydrophobic ingredients influencing the yield of pulegone, a candy and a coated tablet solution were filtered and then distilled without insoluble ingredients. It was determined that filtration prior to hydrodistillation reduced the yield for both sample types: the filtered sample of the pastille exhibited a 37% reduction in the pulegone content compared to the unfiltered sample. The filtered dragee sample yielded only about half the amount of essential oil. Without knowledge of the exact volume of the essential oil, pulegone could only be identified qualitatively in the filtered dragee sample. The diminished yield of the two filtered samples can be attributed to the loss of volatile aroma components during the filtration process.
2.1.4. Validation of the NMR Method
The recovery rate of pulegone in peppermint oil is 85.0%, in Chinese mint oil 99.8%, in corn mint oil 98.3%, in buchu oil 86.4%, in pennyroyal oil 86.1%, and in muña oil 95.1%. The coefficient of determination for the standard addition of pulegone to peppermint, Chinese mint, corn mint, buchu, pennyroyal, and muña oil is R2 = 0.998, 0.999, 0.998, 0.997, 0.997, and 0.998, respectively.
For the essential oils obtained via hydrodistillation, the coefficient of determination of the standard addition of pulegone to the respective oil was R2 = 0.994 for peppermint, R2 = 0.999 for pennyroyal, R2 = 0.996 for spearmint, R2 = 0.996 for mint-flavored candies, and R2 = 1 for mint-flavored candies.
The recovery rates of pulegone in peppermint are 91.2%, 96.7%, and 84.3% in peppermint, pennyroyal, and spearmint, respectively. The recovery rate of pulegone in mint-flavored pastilles was 90.1%, whereas that in dragees was 92.1%. Furthermore, a calibration curve based on higher pulegone concentration levels was applied to the spearmint. This resulted in an improved recovery rate of 102%.
The LOD of pulegone in peppermint is 59.9 mg/kg, and the LOQ is 214 mg/kg (see Table 2). The LOD of pulegone in pennyroyal, spearmint, pastille, and candy is 134 mg/kg, 371 mg/kg, 14.5 mg/kg, and 7.15 mg/kg, and the LOQ is 491 mg/kg, 1363 mg/kg, 51.5 mg/kg, and 26.2 mg/kg.
Table 2.
Comparison of the limits of detection and quantification of pulegone in peppermint, pennyroyal, spearmint, pastilles, and dragee. LOD: limit of detection, LOQ: limit of quantification.
2.2. Quantification of Pulegone in Essential Oils
No pulegone was detected in spearmint; therefore, no standard addition of pulegone to spearmint oil was performed.
In this study, a total of 15 peppermint oils, 4 corn mint oils, 1 pennyroyal oil, 2 muña oils, 2 buchu oils, 1 water mint oil, 1 oil produced from a lesser calamint, 1 bergamot mint oil, and 1 balm mint bush oil were examined. The pulegone concentrations in the peppermint oils ranged from 4.05 to 18.8 mg/kg (see Appendix A, Table A1). This results in a pulegone content in the oil of 0.4% to 1.9%. No pulegone was detected in 1 peppermint oil. In the literature, a pulegone content of 1.2% and 12.3% were found in peppermint oil [2,9]. In this study, the pulegone content of the peppermint oil samples was around the lowest reported value.
The different pulegone contents in the respective mint species can be explained by the different cultivation conditions and environmental influences. In the case of peppermint and corn mint, the higher the temperature, the more pulegone could be detected. In addition, the salt content during plant cultivation influences the pulegone content. A high salt concentration is conducive to a high pulegone concentration. In contrast, drought has a negative effect on the concentration of pulegone [29].
The pulegone content of corn mint oil in our sample ranges from 0.31% to 1.47%, while the literature pulegone content of corn mint oil ranges from 0.85% and 2.27% [8,10]. The pulegone content in corn mint samples 1 and 3 was below 0.85%. The lower pulegone content can be explained by various environmental factors during cultivation.
In pennyroyal oil, the pulegone content ranges from 61.3% to 77.9% [1]. With a pulegone content of 63.1% ± 4.6%, the pennyroyal oil investigated in this study was within this range. According to the literature, muña oil contains 30.8% to 83.3% pulegone in the oil [5]. The 2 muña oils investigated in this study had pulegone contents of 28.9% and 55.9%, which are in line with the literature values.
The pulegone content of buchu oil is 3.0% ± 0.2%. The literature indicates that the pulegone content in buchu oil ranges from 2.4% to 8.4% [6]. The pulegone content determined in this study was in accordance with the findings of previous studies.
In the literature, a pulegone content of 0.45% has been reported in the oil of water mint [8]. The water mint content determined in this study was more than twice as high (1.32%). It is plausible that the two water mints were cultivated under different conditions. The oil of the lesser calamint was found to contain 27.1% ± 0.9%. The literature indicates that the pulegone content in the essential oil of lesser calamint ranges from 2.4% to 64.4% [12]. The pulegone content determined in this study was in accordance with the literature value.
The essential oils of bergamot mint, balm mint bush, horse mint, and spearmint were found to be devoid of pulegone. No evidence of pulegone was found in the literature on bergamot mint either [30]. The same is true of balm mint bush. In contrast, pulegone has been detected in horse mint (0.17–69.49%) and spearmint (0.30–29.59%) [3,11,31].
A section of the spectrum of spearmint oil is shown in Figure 6. The spearmint oil was spiked with pure pulegone for verification. The dt at δH = 2.74 ppm is overlaid by a multiplet. The multiplet belongs to (+)-carvone. In addition, the remaining signals cannot be clearly assigned to the pulegone. An additional attempt was made to achieve a more effective separation of the signals from pulegone and carvone by employing a different solvent. The solvents used were CDCl3 and MeOD without mixing. No separation could be achieved. Another attempt to separate the signals from pulegone and carvone was to vary the temperature. Spearmint oil was measured at temperatures of 300 K, 310 K, and 290 K. However, the signals of pulegone and carvone could not be separated. One possible explanation is that the concentration of pulegone was too low compared to that of carvone, which means that the LOD of pulegone was not exceeded. Another possible explanation is the absence of pulegone. Nevertheless, there is no evidence in the literature that suggests that pulegone is not present in spearmint oil.
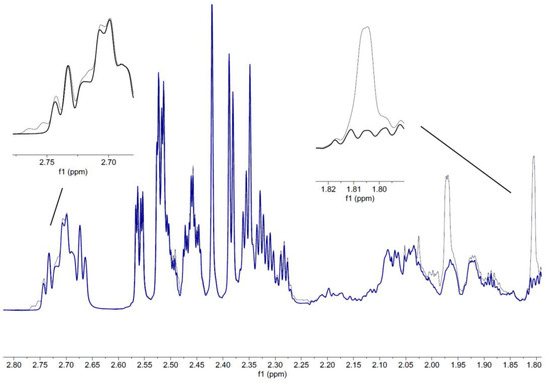
Figure 6.
Section of a 1H NMR spectrum of spearmint essential oil (dark blue line) overlaid with a spectrum spiked with pulegone (thin gray line); both were recorded in MeOD/CDCl3 (1:1; v/v).
Despite spiking with pure pulegone, no signals were clearly assigned to pulegone in horse mint.
2.3. Quantification of Pulegone in Tea, Herbs, and Confectionery Products
The peppermint tea samples analyzed exhibited a pulegone content ranging from 39.9 to 443 mg/kg. A pulegone content of 639.0 ± 2.6 mg/kg was detected in loose peppermint tea. The pulegone concentration of 544 ± 97 mg/kg was detected in spearmint tea. As with peppermint tea, this concentration refers to the concentration of pulegone in spearmint tea and not to its concentration in the oil. In the literature, the pulegone content in the oil, but not in the plant, has been stated for spearmint.
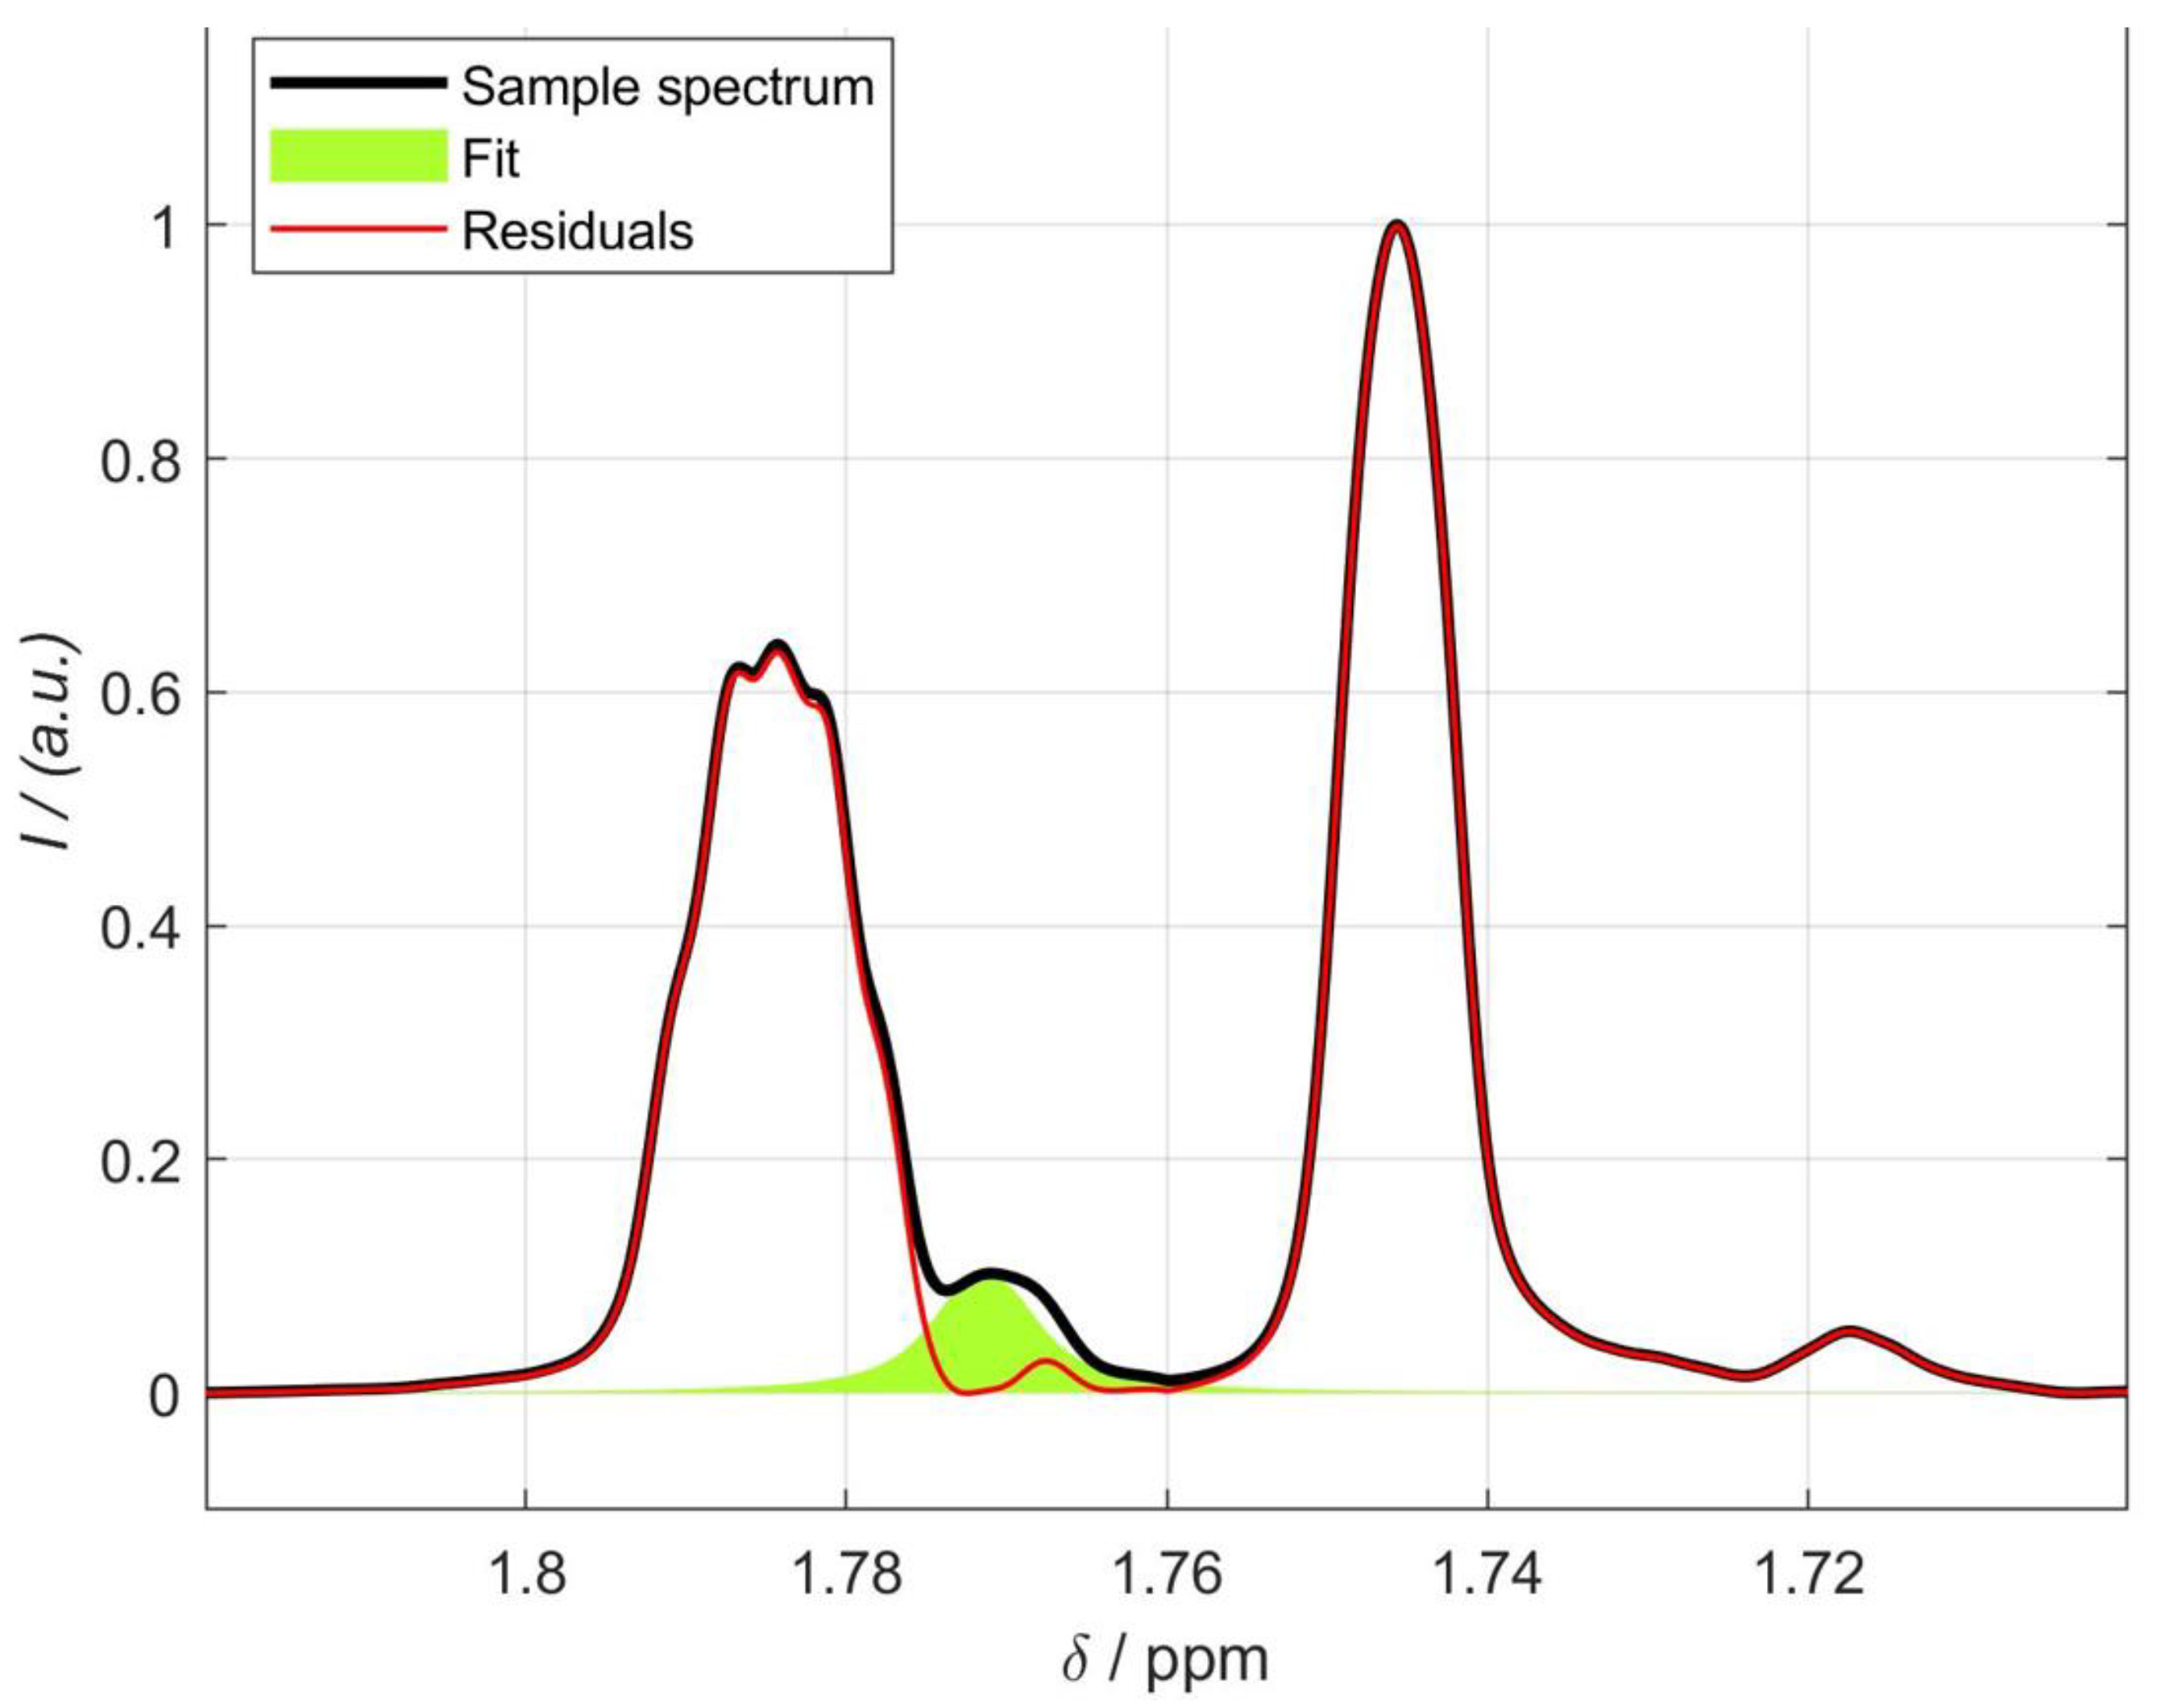
A pulegone content of 275–507 mg/kg was detected in the mint herbs. The packaging of the herbs did not contain a more precise description of the type of mint, only “mint”. For this reason, it is not clear which type of mint is used. Herbal mint 3 was labeled “peppermint”. However, in the sample, the signal from carvone was significantly more intense than that from pulegone (see Figure 7). In spearmint oil, the carvone content can be 41%, whereas the pulegone content is only half as high or lower [3,31]. Therefore, herbal mints 2, 3, and 4 are probably spearmints. Only in herbal mint 1 was carvone not detectable.

Figure 7.
Section of a spectrum of herb mint 3, recorded in CDCl3. The signal marked in green is pulegone, and to the left is the signal of carvone. I: integral, δ: chemical shift.
A pulegone concentration of 1.50 ± 409 mg/kg was detected in pennyroyal sample 1.
A pulegone concentration of 20.5–137 mg/kg was detected in the pastilles. The pulegone content in pastille 6 was below the LOD. Pastilles 2, 4, and 5 are below the LOQ.
A pulegone content of 17.6 ± 6.8 mg/kg was detected in dragee 1. However, this concentration was below the LOQ. The pulegone content in the other coated tablet was below the LOD. A pulegone content of 0.45–29.91 mg/kg in mint-flavored confectionery was reported in the literature [10]. The candy investigated is within the range mentioned in the literature.
2.4. Toxicological Assessment of Pulegone
The toxicological assessment was conducted by comparing the pulegone exposure from recommended serving sizes to established safety thresholds (TDI, NOEL, NOAEL) using a standard 60 kg body weight reference. The toxicological impact of pulegone in food was assessed in accordance with the manufacturer’s recommended consumption guidelines and typical quantities used in recipes sourced from the Internet. The manufacturer recommends dissolving 1 to 2 drops of peppermint oil in 100 to 150 mL of water. The mass of a single drop of peppermint oil was determined as being 25.0 ± 3.1 mg (n = 10). Therefore, with two drops of peppermint oil in 100 mL of water and an average pulegone content of 1.12 ± 0.03% in the oil, a pulegone concentration of 0.56 mg/100 mL is consumed. Thus, a 60 kg individual consumes a pulegone concentration of 0.01 mg/kg bw. The consumed concentration is one-tenth of the TDI (0.1 mg/kg bw) [21].
One manufacturer of corn mint oil recommends the ingestion of a solution comprising three drops of oil in 100 mL of water for the purpose of maintaining fresh breath. The mass of a single drop of corn mint oil is 50.0 ± 3.3 mg (n = 10). Therefore, 150 mg of oil in 100 mL corresponds to a pulegone concentration of 1.3 mg/100 mL. This is based on an average pulegone content of 0.89 ± 0.05% in the oil, which was determined in this study. A 60 kg individual consumes a pulegone concentration of 0.02 mg/kg bw. This pulegone intake was one-fifth lower than the TDI. It can be reasonably assumed that corn mint oil is consumed in this dilution after each meal, with three meals consumed per day. This would result in an intake of 4.01 mg of pulegone per day. Thus, a 60 kg individual ingests a pulegone concentration of 0.07 mg/kg bw, which is 30% below the TDI. It can therefore be assumed that the manufacturer’s recommended intake is not of toxicological concern.
Pennyroyal and spearmint are used as herbs in the kitchen. In online recipes, mint is typically recommended in quantities ranging from one-half to three-quarters of a tablespoon per serving [32,33]. The mass of a tablespoon of spearmint was determined to be 3.30 ± 0.4 g (n = 10), while the mass of a tablespoon of pennyroyal was found to be 2.44 ± 0.2 g (n = 10). Therefore, three-quarters of a tablespoon of spearmint and pennyroyal yield 2.48 g and 1.83 g, respectively.
The average pulegone content in spearmint determined in this study is 391 ± 38 mg/kg. This means that 2.48 g of spearmint contains 1.21 mg of pulegone. A person weighing 60 kg consumes a pulegone concentration of 0.02 mg/kg bw with 2.48 g of spearmint. The consumption of a pulegone dose of 0.02 mg/kg bw corresponds to one-fifth of the TDI.
The pulegone content in pennyroyal is 1504 ± 409 mg/kg. With 1.83 g of pennyroyal, 2.75 mg of pulegone is consumed. This means that a 60 kg individual consumes 0.05 mg of pulegone per kg bw. This corresponds to approximately half of the TDI.
Because the consumption of both pennyroyal and spearmint does not exceed the TDI for pulegone [20,21], it can be assumed that there is no risk to human health. This result also confirms a more recent risk assessment based on benchmark dose-response modeling [34].
3. Materials and Methods
3.1. Samples
Samples were procured from retail shops in Karlsruhe and German and British online retailers from October 2023 to March 2024.
The samples included 32 essential oils (peppermint: 15, corn mint: 4, pennyroyal: 1, spearmint: 3, buchu: 2, muña: 2, water mint: 1, lesser calamint: 1, bergamot mint: 1, balm mint bush: 1, horse mint: 1) and seven teas (peppermint: 7, spearmint: 1). Furthermore, 6 herbs and 10 confectionery products were subjected to analysis, including four candies, two spearmint-flavored candies, two dragees, one candy, and two chewing gums (See Appendix A, Table A1).
3.2. Chemicals
Xylene (isomers) (≥97%, Carl Roth GmbH + Co KG, Karlsruhe, Germany), 1-dodecanol (98%, Sigma-Aldrich, Taufkirchen, Germany), (+)-Carvon (≥98.5%, Sigma-Aldrich, Taufkirchen, Germany), xylene-d10 (99.5%, Deutero GmbH, Kastellaun, Germany), chloroform-d1 (99.8%, Deutero GmbH, Kastellaun, Germany), methyl alcohol-d4 (methanol, 99.8%, Deutero GmbH, Kastellaun, Germany), (+)-pulegone (Analytical Standard, ≥97.5%, Sigma-Aldrich, Taufkirchen, Germany), cyclohexane (99.5%, Thermo Fisher Scientific Inc., Darmstadt, Germany).
3.3. Sample Preparation
An amount of 100 mg of the essential oils was dissolved in an appropriate deuterated solvent (1 mL) and could be measured directly after the addition of 0.1% TMS. For the extraction of pulegone from teas and herbs using ultrasonic-assisted liquid extraction, 200 mg of the sample was first dissolved in 1.5 mL of CDCl3 or MeOD. The samples were then subjected to an ultrasonic bath for 30 min. In the second experiment, a 400 mg sample was dissolved in 2 mL of deuterated solvent and again subjected to an ultrasonic bath for 30 min. In both cases, sample components were filtered out using a syringe attachment before measurement.
Hydrodistillation was conducted in accordance with and modified from ISO 6571 [28]. For peppermint, a 25 g sample was used, while for spearmint and pennyroyal mint, a 20 g sample was used. For apple mint, a 25 g sample was used. To all four mint varieties, 300 mL of distilled water was added. For peppermint, spearmint, and apple mint, 200 µL of xylene-d10 was employed, while for pennyroyal mint, 100 µL of xylene-d10 was used. The distillation period for all samples was 3 h. After hydrodistillation, the produced oils were collected and stored under nitrogen in a refrigerator until measurement.
Before hydrodistillation, the pastilles (25 g) were first dissolved in 25 mL of distilled water. The dissolved sample was then transferred to a round-bottom flask and filled up with 275 mL of distilled water. In this case, 200 µL of xylene-d10 was used, and the distillation time was 4 h.
For the dragees, 40 g of sample material was used, while for the other confectioneries, a 40–50 g sample was used. Subsequent processing and hydrodistillation followed the aforementioned methodology for pastilles (i.e., dissolving in 24 mL of distilled water and filling up with 275 mL distilled water). The produced oil was also stored under nitrogen in a refrigerator. For NMR analysis, 50 µL aliquots were dissolved in 1 mL of CDCl3.
3.4. 1H NMR Spectroscopic Measurements
All samples were analyzed using a 400 MHz spectrometer (NMR Ascend 400, Bruker BioSpin, Ettlingen, Germany). The Bruker Sample Xpress was used as the sample changer. For the 1H qNMR measurements, DeuQuant NMR tubes with a diameter of 5 mm were used (Deutero GmbH, Kastellaun, Germany). Furthermore, the volatile solvents necessitated the use of polytetrafluoroethylene (PTFE) caps. The specific measurement parameters are listed in Appendix A, Table A2.
3.5. Quantification
Quantification was performed using the pulse length-based concentration determination (PULCON) method. Here, the determination of the analyte concentration is based on the correlation between a separately measured reference solution and the intensity of the analyte signal [35]. When using the PULCON method, an external reference solution and the sample are measured using the same instrument [36]. A so-called Quantification Reference Solution (QuantRef) is used as the external reference substance. The QuantRef used here consists of p-xylene and cyclohexane in chloroform.
For quantification of pulegone, either the dt at δH = 2.74 ppm, the doublet at δH = 1.81 ppm, or the mean value of both was selected. Generally, these signals were well separated from other signals for all essential oils containing pulegone. In case of overlap, which happened in less than 10% of the cases, the quantification relied on the signals that did not show overlap. The recovery rate can be determined, the linearity checked, and the real concentration of the analyte in the matrix determined [37]. The LOD and LOQ were also determined from the calibration curve [37]. In this study, standard additions of pulegone to peppermint, Chinese mint, corn mint, buchu, pennyroyal, and muña oil were performed.
3.6. NMR Spectral Processing
In this study, a MATLAB v. 2019b (The MathWorks, Natick, MA, USA) script was used to quantify the signals associated with pulegone according to PULCON. The use of MATLAB enables fast and automated quantification. Due to the knowledge of the chemical shift, the coupling constant(s), and the multiplicity, a fast curve fitting can be performed using MATLAB.
4. Conclusions
Essential oils from trade could be measured directly after dissolving in MeOD/CDCl3 at a ratio of 1:1 (v/v) without any complex sample preparation. In the case of foodstuffs, pulegone had to be extracted beforehand. Hydrodistillation according to ISO 6571 [28] is more effective than ultrasonic-assisted extraction.
The linearity of the concentration determination of pulegone was ensured for all matrices. The accuracy and selectivity of the NMR method was confirmed for the determination of pulegone in Chinese mint, corn mint, and muña oil and for the extracts (distillates) of spearmint and pennyroyal herbs. If carvone is present (e.g., in spearmint samples), its signals overlay of the pulegone signals and impedes quantification. The pulegone contents measured in this study were mostly consistent with the literature values. The manufacturer’s consumption recommendations do not exceed the TDI. Therefore, the consumption of peppermint oil and corn mint oil is assumed to be not toxicologically relevant. The use of pennyroyal and spearmint as seasonings also poses no health risks to humans. Based on the available data, it can be assumed that NMR is a suitable method for determining pulegone in food.
Author Contributions
Conceptualization, D.W.L.; methodology, D.W.L. and T.K.; validation, Y.Y.; formal analysis, Y.Y.; investigation, Y.Y.; resources, T.K.; data curation, Y.Y.; writing—original draft preparation, Y.Y.; writing—review and editing, D.W.L., and T.K.; visualization, Y.Y.; supervision, D.W.L. and T.K.; project administration, D.W.L. All authors have read and agreed to the published version of the manuscript.
Funding
This research received no external funding.
Institutional Review Board Statement
Not applicable.
Informed Consent Statement
Not applicable.
Data Availability Statement
The raw data supporting the conclusions of this article will be made available by the authors on request.
Acknowledgments
The authors sincerely thank the departments of nuclear magnetic resonance and plant-based foods at CVUA Karlsruhe for their invaluable assistance and support.
Conflicts of Interest
The authors declare no conflicts of interest.
Appendix A
Table A1.
Overview of the pulegone content in various essential oils, teas, herbs, and confectioneries determined via 1H NMR spectroscopy. The extraction methods used for tea, herbs, and confectioneries are also stated. Essential oils were directly analyzed. The reported data are based on replicate measurements, including sample preparation.
| Sample | Pulegone Content [mg/kg] (n = 2) | Extraction Method |
|---|---|---|
| Corn mint EO 1 | 3094 ± 290 | - |
| Corn mint EO 2 | 14,672 ± 569 | - |
| Corn mint EO 3 | 4602 ± 65 | - |
| Corn mint EO 4 | 13,196 ± 890 | - |
| Peppermint EO 1 | 9850 ± 633 | - |
| Peppermint EO 2 | 7396 ± 163 | - |
| Peppermint EO 3 | 16,233 ± 443 | - |
| Peppermint EO 4 | 18,733 ± 170 | - |
| Peppermint EO 5 | 8713 ± 77 | - |
| Peppermint EO 6 | 5581 ± 171 | - |
| Peppermint EO 7 | 18,786 ± 416 | - |
| Peppermint EO 8 | 12,582 ± 41 | - |
| Peppermint EO 9 | 4051 ± 393 | - |
| Peppermint EO 10 | 17,398 ± 959 | - |
| Peppermint EO 11 | 12,768 ± 35 | - |
| Peppermint EO 12 | 8216 ± 442 | - |
| Peppermint EO 13 | 11,720 ± 519 | - |
| Peppermint EO 14 | 5149 ± 82 | - |
| Peppermint EO 15 | n.d. | - |
| Chinese Mint EO | 9566 ± 478 | - |
| Pennyroyal EO 1 | 630,557 ± 46,305 | - |
| Muña EO 1 | 559,410 ± 17,506 | - |
| Muña EO 2 | 288,603 ± 76,824 | - |
| Buchu EO 1 | 30,181 ± 2,487 | - |
| Buchu EO 2 | n.d. | - |
| Water mint EO | 13,154 ± 530 | - |
| Lesser calamint EO | 271,276 ± 9,476 | - |
| Bergamot mint EO | n.d. | - |
| Balm Mint Bush EO | n.d. | - |
| Spearmint EO 1 | n.d. | - |
| Spearmint EO 2 | n.d. | - |
| Spearmint EO 3 | n.d. | - |
| Horse mint EO | n.d. | - |
| Peppermint tea 1 | 158 ± 18 | hydrodistillation |
| Peppermint tea 2 | 39.9 ± 5.0 | hydrodistillation |
| Peppermint tea 3 (loose) | 639 ± 3 | hydrodistillation |
| Peppermint tea 4 | 443 ± 384 | hydrodistillation |
| Peppermint tea 5 | 48.6 ± 35.2 | hydrodistillation |
| Peppermint tea 6 | n.d. | ultrasonic assisted extraction |
| Spearmint tea | 544 ± 97 | hydrodistillation |
| Apple mint tea | n.d. | hydrodistillation |
| Herbs Mint 1 | 358.5 ± 0.1 | hydrodistillation |
| Herbs Mint 1 | n.d. | ultrasonic assisted extraction |
| Herbal mint 2 | 275 ± 18 | hydrodistillation |
| Herbal mint 3 | 507 ± 58 | hydrodistillation |
| Herbs Mint 4 | n.d. | hydrodistillation |
| Pennyroyal 1 | 1504 ± 409 | hydrodistillation |
| Pennyroyal 2 | n.d. | hydrodistillation |
| Candy 1 (flavor: mint) | 88.3 ± 22.8 | hydrodistillation |
| Candy 2 (flavor: mint) | 46.3 ± 3.8 | hydrodistillation |
| Candy 3 (flavor: peppermint) | 137 ± 25 | hydrodistillation |
| Candy 4 (flavor: Mint) | 29.6 ± 9.2 | hydrodistillation |
| Candy 5 (flavor: Spearmint) | 20.5 ± 18.4 | hydrodistillation |
| Candy 6 (Spearmint flavor) | n.d. | hydrodistillation |
| Dragee mint flavor | 17.6 ± 6.8 | hydrodistillation |
| Dragee spearmint flavor | n.d. | hydrodistillation |
| Chewing dragee 1 | n.d. | hydrodistillation |
| Chewing dragee 1 | n.d. | ultrasonic assisted extraction |
| Chewing gum 2 | n.d. | ultrasonic assisted extraction |
| Candy 7 | n.d. | hydrodistillation |
EO, essential oil; n.d., not detectable (<limit of detection).
Table A2.
Measurement parameters for Ascend II for methanol-d4 and chloroform-d1 (1:1; v/v); TD: size of FID, SI: size of real spectrum, NS: number of scans, DS: number of dummy scans, D: delay, SW: spectra width, RG: receiver gain, O1P/O1: transmitter frequency offset, AQ: acquisition time.
Table A2.
Measurement parameters for Ascend II for methanol-d4 and chloroform-d1 (1:1; v/v); TD: size of FID, SI: size of real spectrum, NS: number of scans, DS: number of dummy scans, D: delay, SW: spectra width, RG: receiver gain, O1P/O1: transmitter frequency offset, AQ: acquisition time.
| Measurement Parameters | Methanol-d4/Chloroform-d1 (1:1; v/v) |
|---|---|
| Pulse program | zg |
| TD | 65,788 |
| SI | 131,072 |
| NS | 32 |
| DS | 4 |
| D1 [s] | 30 |
| SW [ppm] | 20.5617 |
| O1P [ppm] | 4800 |
| O1 [Hz] | 1919.76 |
| AQ [s] | 3.9999 |
| Temperature [K] | 300 |
References
- Amalich, S.; Zerkani, H.; Tagnaout, I.; Ali, C.; Kamal, F.; Zair, T. Chemical composition of the essential oil and isolation of two main constituents of Mentha pulegium L. Vegetos 2024, 37, 82–93. [Google Scholar] [CrossRef]
- Nazarova, D.V.; Temerdashev, Z.A.; Vinitskaya, E.A.; Kiseleva, N.V.; Nagalevskii, M.V. Comparative Analysis of Chemical Compositions of Mentha L. Plant Extracts by Gas Chromatography–Mass Spectrometry after Hydrodistillation and Subcritical Extraction. J. Anal. Chem. 2023, 78, 1174–1183. [Google Scholar] [CrossRef]
- Telci, I.; Demirtas, I.; Bayram, E.; Arabaci, O.; Kacar, O. Environmental variation on aroma components of pulegone/piperitone rich spearmint (Mentha spicata L.). Ind. Crops Prod. 2010, 32, 588–592. [Google Scholar] [CrossRef]
- Collins, N.F.; Graven, E.H.; van Beek, T.A.; Lelyveld, G.P. Chemotaxonomy of Commercial Buchu Species (Agathosma betulina and A. crenulata). J. Essent. Oil Res. 1996, 8, 229–235. [Google Scholar] [CrossRef]
- van Baren, C.M.; Di Leo Lira, P.; Elechosa, M.A.; Molina, A.M.; Juárez, M.A.; Martínez, A.; Perelman, S.; Bandoni, A.L. New insights into the chemical biodiversity of Minthostachys mollis in Argentina. Biochem. Syst. Ecol. 2014, 57, 374–383. [Google Scholar] [CrossRef]
- Viljoen, A.M.; Moolia, A.; van Vuuren, S.F.; van Zyl, R.L.; Başer, K.H.C.; Demirci, B.; Özek, T.; Trinder-Smith, T.H. The Biological Activity and Essential Oil Composition of 17 Agathosma (Rutaceae) Species. J. Essent. Oil Res. 2006, 18, 2–16. [Google Scholar] [CrossRef]
- Petrakis, E.A.; Kimbaris, A.C.; Pappas, C.S.; Tarantilis, P.A.; Polissiou, M.G. Quantitative determination of pulegone in pennyroyal oil by FT-IR spectroscopy. J. Agric. Food Chem. 2009, 57, 10044–10048. [Google Scholar] [CrossRef]
- Benabdallah, A.; Boumendjel, M.; Aissi, O.; Rahmoune, C.; Boussaid, M.; Messaoud, C. Chemical composition, antioxidant activity and acetylcholinesterase inhibitory of wild Mentha species from northeastern Algeria. S. Afr. J. Bot. 2018, 116, 131–139. [Google Scholar] [CrossRef]
- Nikolić, M.; Jovanović, K.K.; Marković, T.; Marković, D.; Gligorijević, N.; Radulović, S.; Soković, M. Chemical composition, antimicrobial, and cytotoxic properties of five Lamiaceae essential oils. Ind. Crops Prod. 2014, 61, 225–232. [Google Scholar] [CrossRef]
- Siano, F.; Catalfamo, M.; Cautela, D.; Servillo, L.; Castaldo, D. Analysis of pulegone and its enanthiomeric distribution in mint-flavoured food products. Food Addit. Contam. 2005, 22, 197–203. [Google Scholar] [CrossRef]
- Araghi, A.M.; Nemati, H.; Azizi, M.; Moshtaghi, N.; Shoor, M.; Hadian, J. Assessment of phytochemical and agro-morphological variability among different wild accessions of Mentha longifolia L. cultivated in field condition. Ind. Crops Prod. 2019, 140, 111698. [Google Scholar] [CrossRef]
- Marongiu, B.; Piras, A.; Porcedda, S.; Falconieri, D.; Maxia, A.; Gonçalves, M.J.; Cavaleiro, C.; Salgueiro, L. Chemical composition and biological assays of essential oils of Calamintha nepeta (L.) Savi subsp. nepeta (Lamiaceae). Nat. Prod. Res. 2010, 24, 1734–1742. [Google Scholar] [CrossRef]
- Sutour, S.; Bradesi, P.; Casanova, J.; Tomi, F. Composition and chemical variability of Mentha suaveolens ssp. suaveolens and M. suaveolens ssp. insularis from Corsica. Chem. Biodivers. 2010, 7, 1002–1008. [Google Scholar] [CrossRef] [PubMed]
- Zhao, D.; Xu, Y.W.; Yang, G.L.; Husaini, A.M.; Wu, W. Variation of essential oil of Mentha haplocalyx Briq. and Mentha spicata L. from China. Ind. Crops Prod. 2013, 42, 251–260. [Google Scholar] [CrossRef]
- Statista. Absatz von Kräuter- und Früchtetee in Deutschland nach Art in den Jahren 2016 bis 2018 (in Tonnen). Available online: https://de.statista.com/statistik/daten/studie/38232/umfrage/fruechtetee-und-kraeutertee-konsum-in-deutschland/ (accessed on 17 February 2024).
- Taneja, S.C.; Chandra, S. Mint. In Handbook of Herbs and Spices; Peter, K.V., Ed.; Woodhead Publishing: Cambridge, UK, 2012; pp. 366–387. [Google Scholar] [CrossRef]
- Lopez, P.; van Sisseren, M.; de Marco, S.; Jekel, A.; de Nijs, M.; Mol, H.G.J. A straightforward method to determine flavouring substances in food by GC-MS. Food Chem. 2015, 174, 407–416. [Google Scholar] [CrossRef] [PubMed]
- NTP. Toxicological and Carcinogensis Studies of Pulegone (CAS No. 89-82-7) in F344/N Rats and B6C3F1 Mice (Gavage Studies). Natl. Toxicol. Program Tech. Rep. Ser. 2011, 563, 1–201. [Google Scholar]
- European Commission. Regulation (EC) No 1334/2008 of the European Parliament and of the Council of 16 December 2008 on flavourings and certain food ingredients with flavouring properties for use in and on foods and amending Council Regulation (EEC) No 1601/91, Regulations (EC) No 2232/96 and (EC) No 110/2008 and Directive 2000/13/EC. Off. J. EU 2008, L354, 34–50. [Google Scholar]
- Speijers, G.J.A. IPCS 2001 WHO Food Additives Series 46: Pulegone and Related Substances. Available online: http://www.inchem.org/documents/jecfa/jecmono/v46je10.htm (accessed on 2 July 2024).
- European Medicines Agency. Committee on Herbal Medicinal Products. In Public Statement on the Use of Herbal Medicinal Products Containing Pulegone and Menthofuran; European Medicines Agency: Amsterdam, The Netherlands, 2016; pp. 1–24. Available online: https://www.ema.europa.eu/en/documents/scientific-guideline/public-statement-use-herbal-medicinal-products-containing-pulegone-and-menthofuran-revision-1_en.pdf (accessed on 29 March 2024).
- Grosch, S.; Monakhova, Y.B.; Kuballa, T.; Ruge, W.; Kimmich, R.; Lachenmeier, D.W. Comparison of GC/MS and NMR for quantification of methyleugenol in food. Eur. Food Res. Technol. 2013, 236, 267–275. [Google Scholar] [CrossRef]
- O’Neil, M.J. The Merck Index: An Encyclopedia of Chemicals, Drugs and Biologicals, 15th ed.; Merck Sharp & Dohme Corp., RSC Publishing: Cambridge, UK, 2013. [Google Scholar]
- Safety Data Sheet: (+)-Pulegon. Available online: https://www.carlroth.com/medias/SDB-5168-MT-EN.pdf (accessed on 29 March 2024).
- Sicherheitsdatenblatt–Cyclohexan. Available online: https://www.sigmaaldrich.com/DE/de/sds/sial/28920 (accessed on 27 March 2024).
- Sicherheitsdatenblatt–Chloroform-d. Available online: https://www.sigmaaldrich.com/DE/de/sds/aldrich/151823 (accessed on 27 March 2024).
- Anastas, P.; Eghbali, N. Green Chemistry: Principles and Practice. Chem. Soc. Rev. 2010, 39, 301–312. [Google Scholar] [CrossRef]
- ISO 6571:2008/Amd 1:2017; Spices, Condiments and Herbs—Determination of Volatile Oil Content (Hydrodistillation Method). International Organization for Standardization (ISO): Geneva, Switzerland, 2017.
- Tsitlakidou, P.; Tasopoulos, N.; Chatzopoulou, P.; Mourtzinos, I. Current status, technology, regulation and future perspectives of essential oils usage in the food and drink industry. J. Sci. Food Agric. 2023, 103, 6727–6751. [Google Scholar] [CrossRef]
- Verma, S.K.; Goswami, P.; Verma, R.S.; Padalia, R.C.; Chauhan, A.; Singh, V.R.; Darokar, M.P. Chemical composition and antimicrobial activity of bergamot-mint (Mentha citrata Ehrh.) essential oils isolated from the herbage and aqueous distillate using different methods. Ind. Crops Prod. 2016, 91, 152–160. [Google Scholar] [CrossRef]
- Snoussi, M.; Noumi, E.; Trabelsi, N.; Flamini, G.; Papetti, A.; De Feo, V. Mentha spicata Essential Oil: Chemical Composition, Antioxidant and Antibacterial Activities against Planktonic and Biofilm Cultures of Vibrio spp. Strains. Molecules 2015, 20, 14402–14424. [Google Scholar] [CrossRef] [PubMed]
- BBC. Rack of Lamb with Sauce Paloise. Available online: https://www.bbc.co.uk/food/recipes/rack_of_lamb_with_sauce_31777 (accessed on 2 April 2024).
- BBC. Beef Shin Stew with Spiced Sweet Potato Dumplings and Couscous. Available online: https://www.bbc.co.uk/food/recipes/beef_shin_couscous_with_51409 (accessed on 2 April 2024).
- Voigt, V.; Franke, H.; Lachenmeier, D.W. Risk Assessment of Pulegone in Foods Based on Benchmark Dose–Response Modeling. Foods 2024, 13, 2906. [Google Scholar] [CrossRef]
- Wider, G.; Dreier, L. Measuring protein concentrations by NMR spectroscopy. J. Am. Chem. Soc. 2006, 128, 2571–2576. [Google Scholar] [CrossRef] [PubMed]
- Claridge, T.D. High-Resolution NMR Techniques in Organic Chemistry, 3rd ed.; Elsevier Science: Amsterdam, The Netherlands, 2016. [Google Scholar] [CrossRef]
- Kromidas, S. Handbuch Validierung in der Analytik, 2nd ed.; Wiley-VCH-Verlag: Weinheim, Germany, 2011; ISBN 978-3-527-32938-0. [Google Scholar]


Disclaimer/Publisher’s Note: The statements, opinions and data contained in all publications are solely those of the individual author(s) and contributor(s) and not of MDPI and/or the editor(s). MDPI and/or the editor(s) disclaim responsibility for any injury to people or property resulting from any ideas, methods, instructions or products referred to in the content. |
© 2024 by the authors. Licensee MDPI, Basel, Switzerland. This article is an open access article distributed under the terms and conditions of the Creative Commons Attribution (CC BY) license (https://creativecommons.org/licenses/by/4.0/).