Abstract
Background: This study aimed to analyze image biomarkers of the parotid glands in ultrasonography images with reduced shape effects, providing a reference for the radiomic diagnosis of parotid gland lesions. Methods: Ultrasound (US) and sialography images of the parotid glands, acquired from September 2019 to March 2024, were reviewed along with their clinical information. Parotid glands diagnosed as within the normal range were included. Overall, 91 US images depicting the largest portion of the parotid glands were selected for radiomic feature extraction. Regions of interest were drawn twice on 50 images using different shapes to assess the intraclass correlation coefficient (ICC). Feature dimensions were statistically reduced by selecting features with an ICC > 0.8 and applying four statistical algorithms. The selected features were used to distinguish age and sex using the four classification models. Classification performance was evaluated using the area under the receiver operating characteristic curve (AUC), recall, and precision. Results: The combinations of the information gain ratio algorithm or stochastic gradient descent and the naïve Bayes model showed the highest AUC for both age and sex classification (AUC = 1.000). The features contributing to these classifications included the first-order and gray-level co-occurrence matrix (high-order) features, particularly discretized intensity skewness and kurtosis, intensity skewness, and GLCM angular second moment. These features also contributed to achieving one of the highest recall (0.889) and precision (0.926) values. Conclusions: The two features were the most significant factors in discriminating radiomic variations related to age and sex in US images with reduced shape effects. These radiomic findings should be assessed when diagnosing parotid gland pathology versus normal using US images and radiomics in a heterogeneous population.
1. Introduction
Radiomic analysis is used to quantitatively analyze medical images by extracting a variety of informative features, also known as image biomarkers. This approach is the opposite of qualitative image interpretation, typically performed by experts [1,2,3,4]. Since its introduction, radiomic analysis has been applied to diagnose pathologic lesions in various imaging modalities, such as computed tomography [5,6] for sialadenitis staging in submandibular gland and medication-related osteonecrosis of the jaw, magnetic resonance imaging [7,8] for Warthin’s tumor versus pleomorphic adenoma and osteomyelitis of the mandible, as well as ultrasonography (US) [5,9,10,11,12,13,14,15,16] for sialadenitis staging in the submandibular gland and orbit, benign versus malignant breast nodules, triple-negative breast cancer, diabetic nephropathy, metastatic versus non-metastatic cervical lymph nodes, Sjögren’s syndrome, and malignant parotid gland lesions. Studies on radiomic diagnoses involve selecting regions of interest (ROI), statistically determining significant radiomic features, and using regression analysis and/or machine learning for diagnosis [1,2,4,5,6,7,8,11,12,13,14,15,16]. Additionally, the quantitative characteristic of radiomics has led to efforts for harmonizing radiomic features across different US units [17,18].
Compared to other imaging modalities, US offers the advantage of visualizing soft tissue without ionizing radiation or large units. In the oral and maxillofacial region, US is widely used to examine the salivary glands [5,15,16,17,19], muscles [20], cervical lymph nodes [14,21], and small soft tissue areas [22]. When combined with doppler imaging, tumors or inflammation in salivary glands can be readily identified by observing the adjacent blood flow [23,24].
Recently, the application of radiomic approaches to analyze US has been widely researched. The influence of image preprocessing to radiomic features [9,10] was studied, and it was found that intensity standardization with fixed bin size improves feature repeatability. Also, radiomic features were implemented in diagnosing pathologies of various organs [5,10,11,12,13,14,15,16]. In terms of the salivary gland, radiomic diagnoses have been discussed for parenchymal disease, including sialadenitis and Sjögren syndrome [5,15]. However, no studies have scrutinized radiomic features that represent normal radiomic variations due to differences in age and sex. Several studies have corroborated biological variations in salivary gland functions according to age and sex [25,26]. Therefore, this study aimed to analyze radiomic features of the parotid glands with reduced shape effects in US images that contribute to the differentiation of age and sex to establish a normal reference for the radiomic diagnosis of parenchymal disease in the parotid gland.
The following sections detail the acquisition and selection of the US images, the extraction and selection of radiomic features through the calculation of the intraclass correlation coefficient (ICC) between two different shapes of ROIs, the statistical algorithms used, and the performance of machine learning models in classifying age groups and sex. The selected radiomic features that yielded the best classification results are explained and discussed, as well as the characteristics of the classification algorithms and machine learning models. Finally, the contributions, novelty, and limitations of this study are scrutinized.
2. Materials and Methods
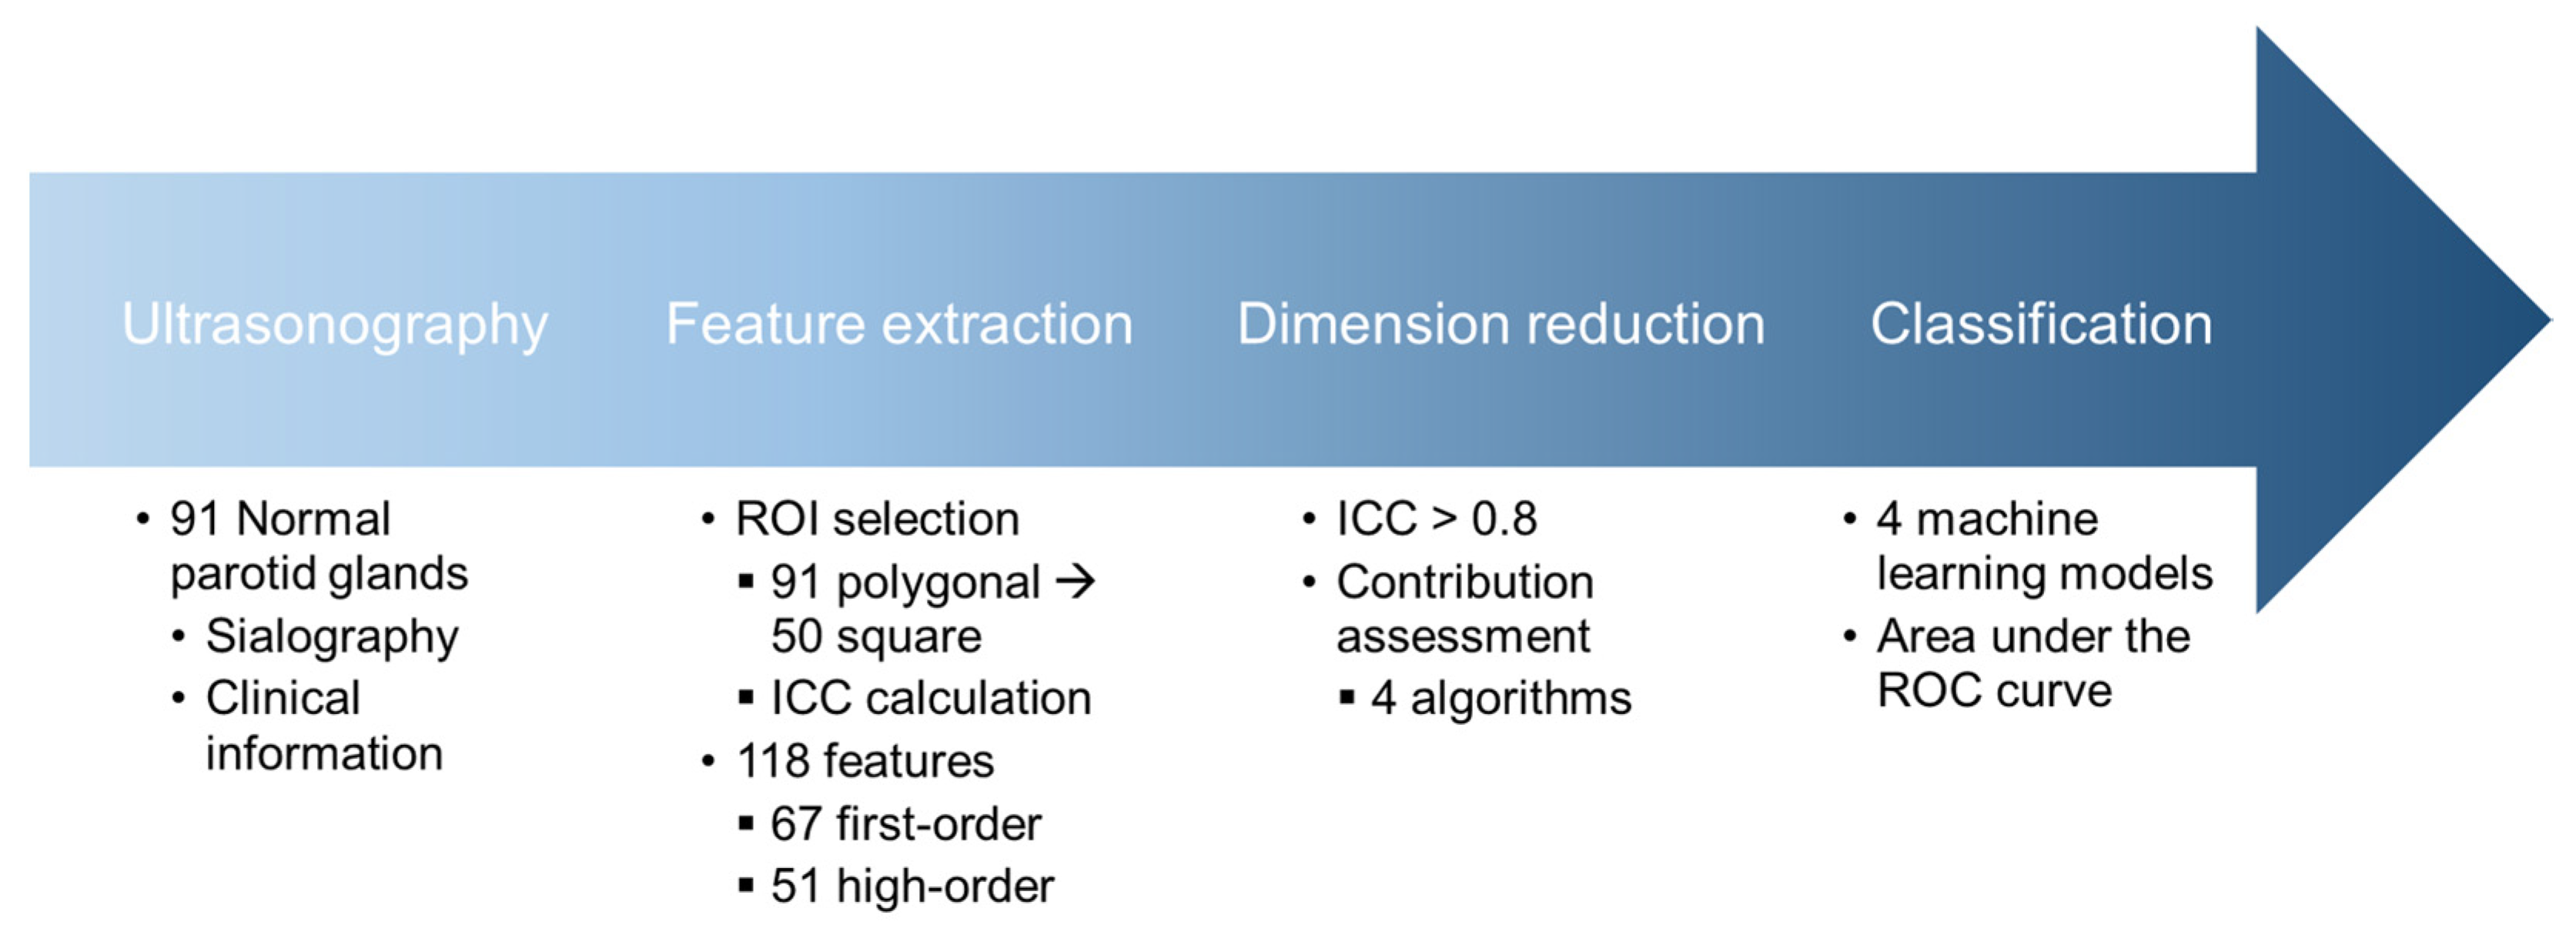
This study was approved by the Institutional Review Board (IRB) of the Kyung Hee University Dental Hospital (IRB No: KH-DT24020) for the access of US images. Informed consent was waived due to the retrospective nature of the ultrasound image collection. The overall procedure of this study is illustrated in Figure 1.
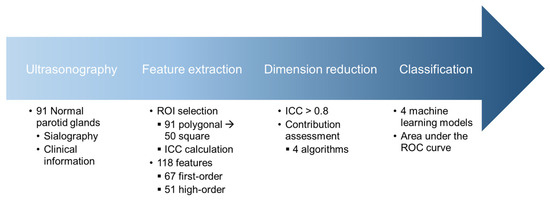
Figure 1.
Schematic diagram illustrating the flow of the study. ROI, region of interest; ICC, intraclass correlation coefficient; ROC, receiver-operating characteristic.
2.1. US Images
All US images of the parotid glands were obtained between September 2019 to March 2024 and reviewed for this study. The US images were obtained using an E-cube 8 (Alpinion, Seoul, Republic of Korea) US unit with a high-density linear transducer (3–12 MHz) from the patients who complained of intraoral dryness. Two oral and maxillofacial radiologists assessed the parotid glands in the US images with reference to sialography images. US images of normal parotid glands were selected based on the following inclusion criteria (Figure 2a): images whose findings were confirmed by sialography and clinical information, images obtained before sialography or ductal irrigation procedure, and images taken in a vertical position to the superficial lobe showing the largest portion of the parotid gland. The exclusion criteria were (Figure 2b) as follows: images containing significant artifacts, images of Sjögren syndrome, benign or malignant tumor or any other pathologic lesions of parotid glands, findings that were not consistent with sialography or clinical information, images obtained after sialography or ductal irrigation procedure, and images not taken in a vertical position to the superficial lobe.
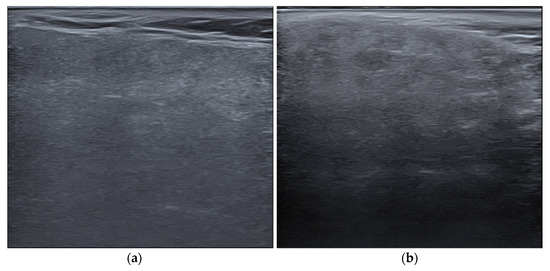
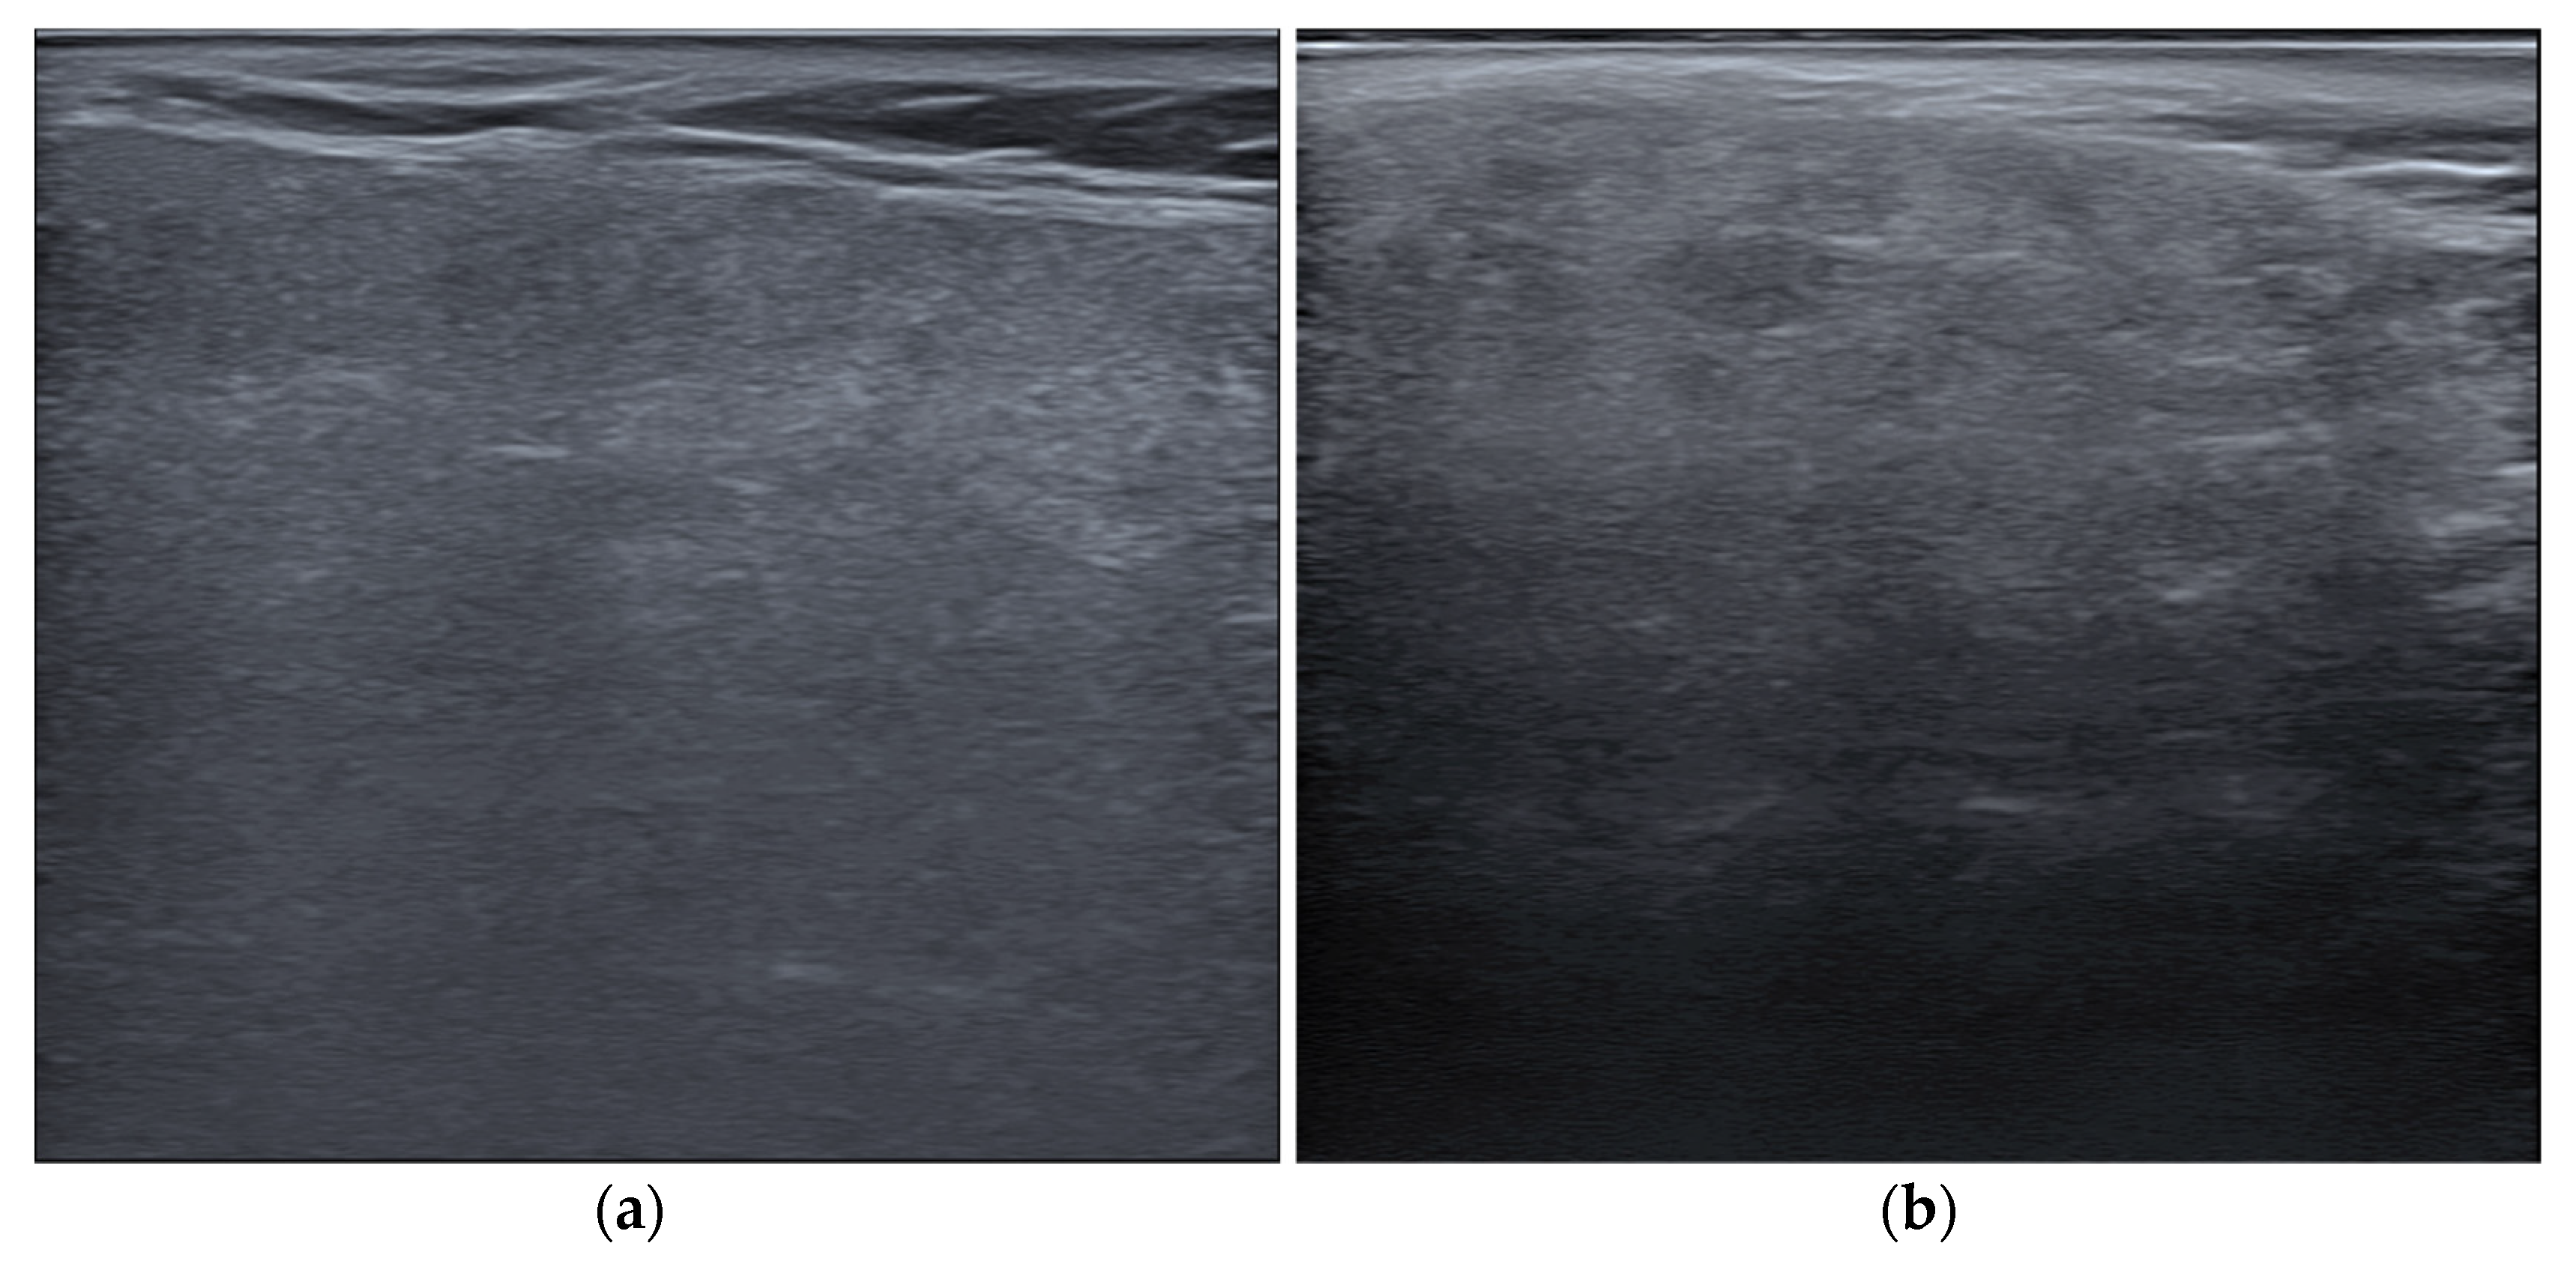
Figure 2.
Examples of ultrasound images of parotid glands: (a) a normal parotid gland with homogeneous echogenicity, included in the study; and (b) an inflammatory parotid gland showing heterogeneous echogenicity with numerous hypoechoic foci, excluded from the study.
A total of 91 US images (of parotid glands) from 63 patients were included (Table 1): 23 images of male patients and 68 of female patients, with 53 images of adults (<65 years) and 38 of older adults (≥65 years). The age classification of adults and older adults is based on the description by the National Institute of Aging in the United States (available from https://www.nia.nih.gov, accessed on 24 October 2024).

Table 1.
Demographic characteristics of patients and their parotid glands included in this study.
2.2. Radiomic Analysis
2.2.1. Feature Extraction
ROIs were drawn on each US image in a polygonal shape to encompass the largest area (Figure 3a). Image normalization was performed according to the software manufacturer’s recommendation, with a gray level of 256 and bin number of 10. A total of 104 radiomic features were extracted, including 53 first-order features of intensity-based and intensity histogram features and 51 high-order features, including gray-level co-occurrence matrices (GLCM), gray-level run length matrices (GLRLM), and gray-level size zone matrices (GLSZM) as follows (features in intensity histogram, GLCM, GLRLM and GLSZM were calculated after image normalization):
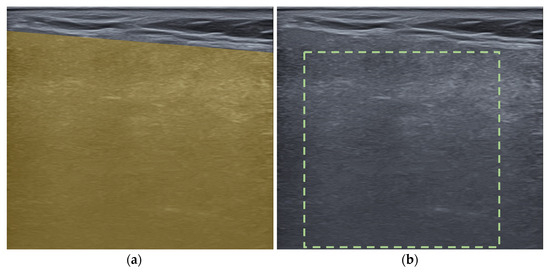
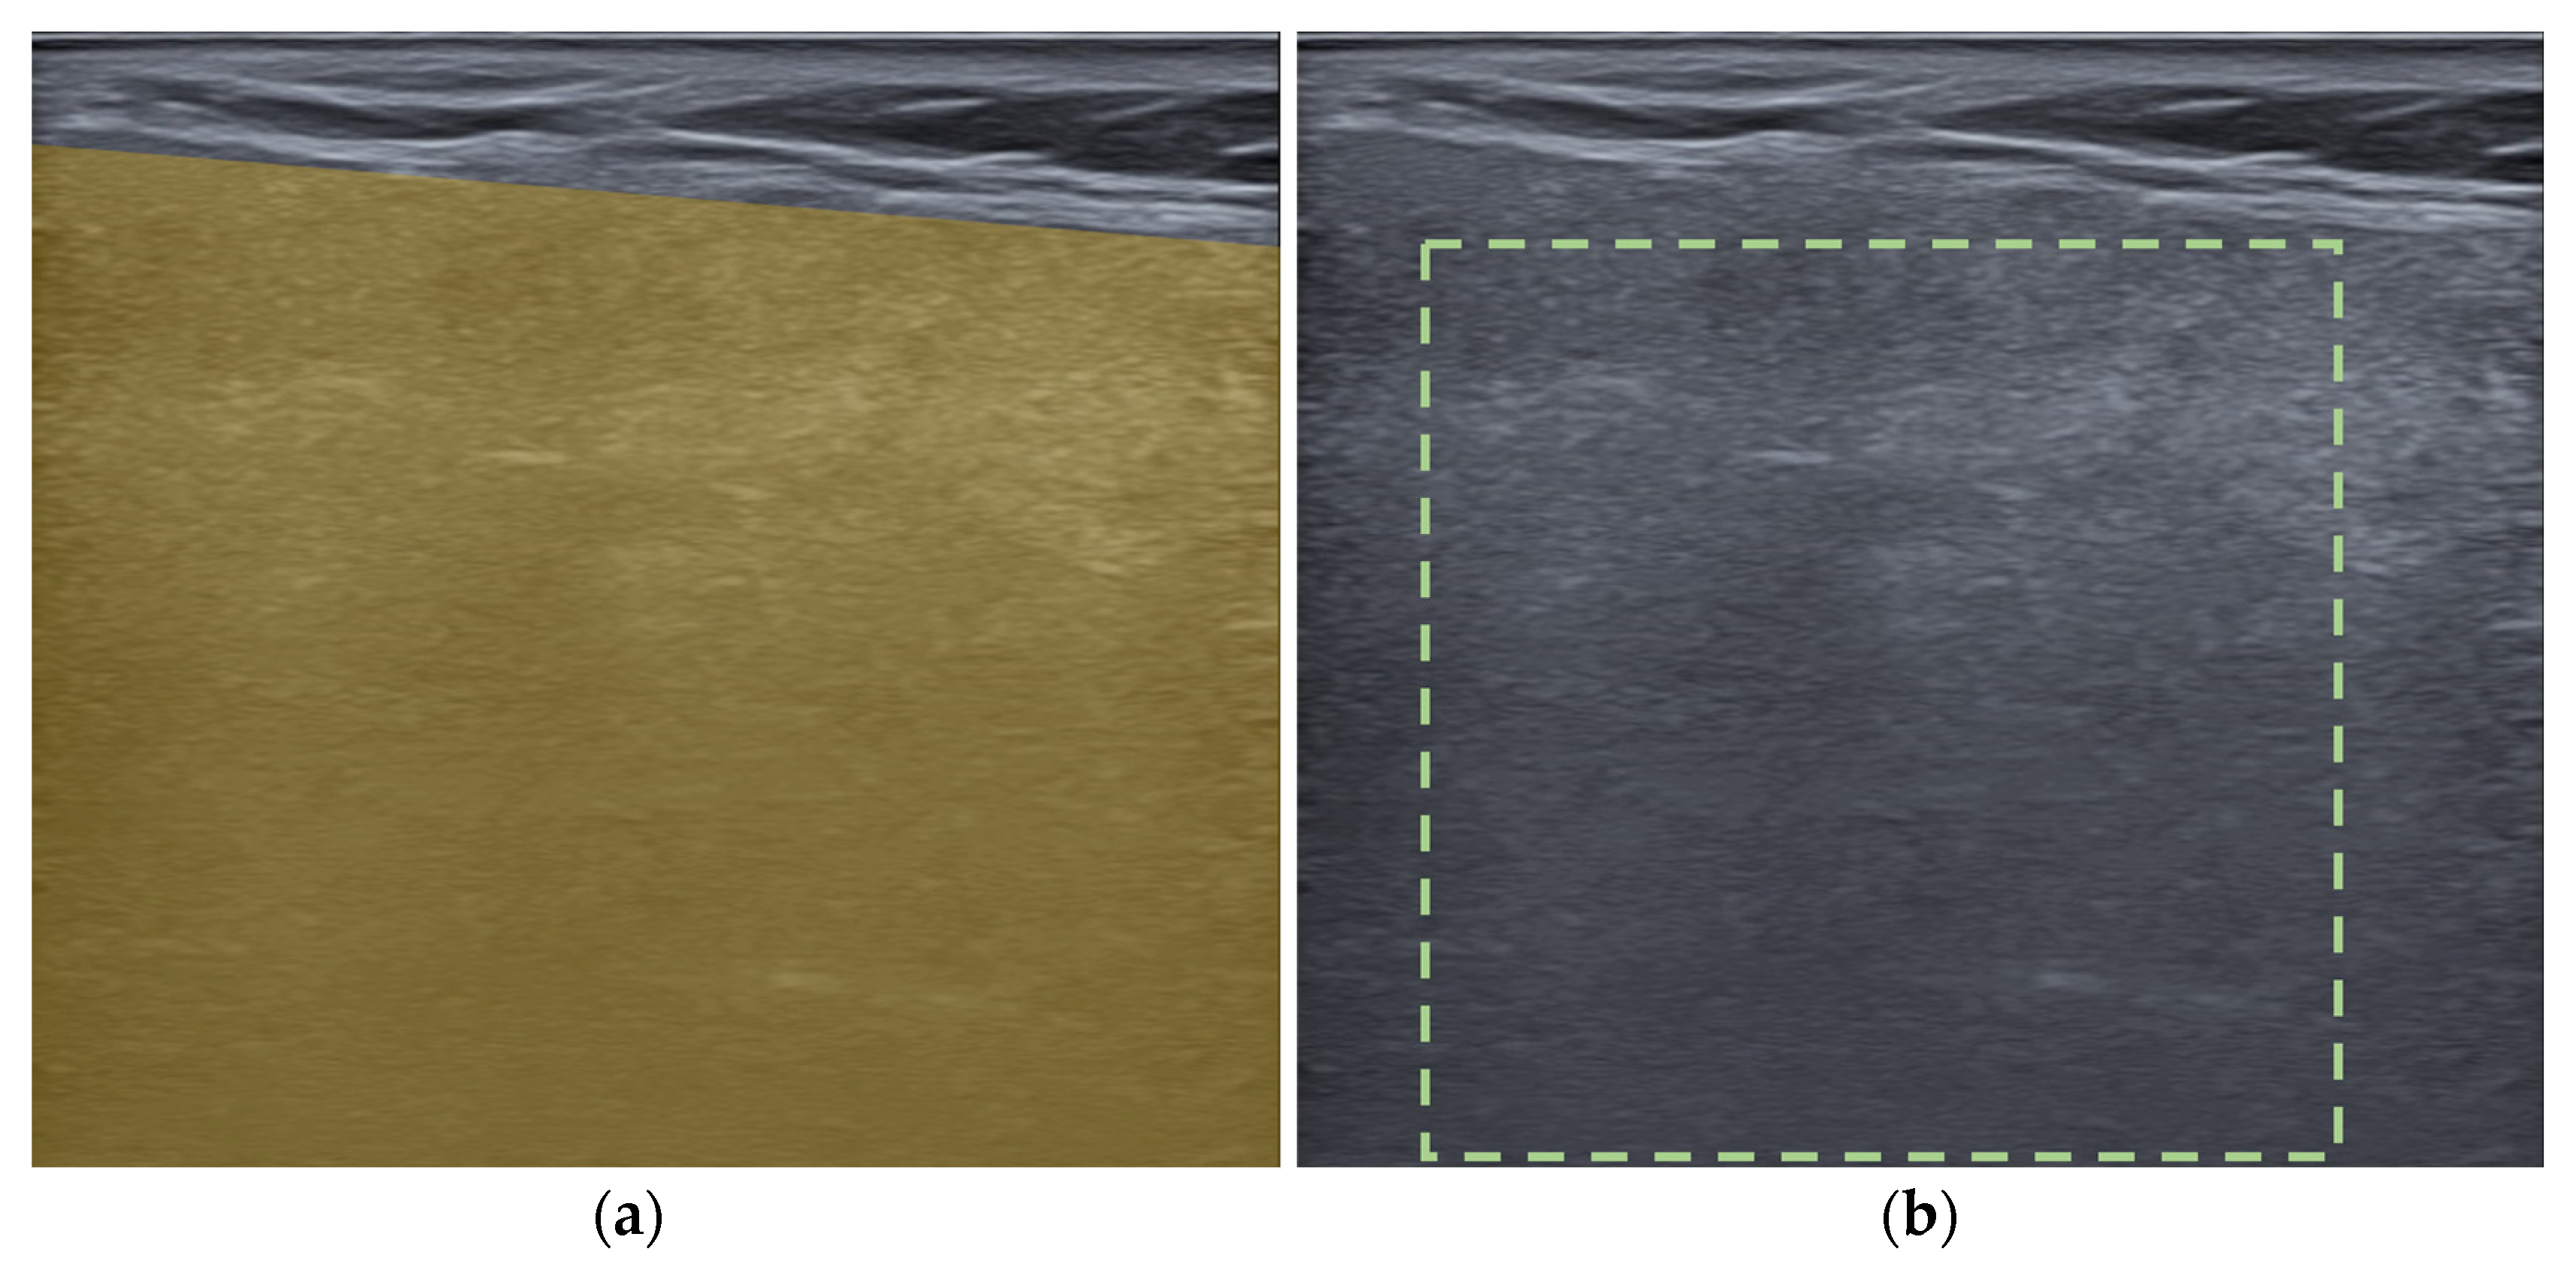
Figure 3.
Examples of regions of interest selection in an ultrasound image of a parotid gland: (a) polygonal, (b) square shape.
- -
- First-order features
- Intensity-based features: mean intensity, intensity variance, intensity skewness, intensity kurtosis, median intensity, minimum intensity, maximum intensity, 10th intensity percentile, 25th intensity percentile, 50th intensity percentile, 75th intensity percentile, 90th intensity percentile, standard deviation, intensity interquartile range, intensity range, intensity based mean absolute deviation, intensity based robust mean absolute deviation, intensity based median absolute deviation, intensity based coefficient of variation, intensity based quartile coefficient of dispersion, area under curve of cumulative intensity volume histogram, intensity based energy, root mean square intensity
- Intensity histogram features: mean discretized intensity, discretized intensity variance, discretized intensity skewness, discretized intensity kurtosis, median discretized intensity, discretized minimum gray level, 10th discretized intensity percentile, 25th discretized intensity percentile, 50th discretized intensity percentile, 75th discretized intensity percentile, 90th discretized intensity percentile, intensity histogram standard deviation, discretized maximum gray level, discretized intensity mode, discretized intensity interquartile range, discretized intensity range, discretized intensity mean absolute deviation, discretized intensity robust mean absolute deviation, discretized intensity median absolute deviation, discretized intensity coefficient of variation, discretized intensity quartile coefficient of dispersion, discretized intensity entropy (based log10), discretized intensity entropy (based log2), area under curve of cumulative intensity volume histogram, discretized intensity uniformity, discretized intensity root mean square, maximum histogram gradient, maximum histogram gradient gray level, minimum histogram gradient, minimum histogram gradient gray level
- -
- High-order features
- GLCM: joint maximum, joint average, joint variance, joint entropy (based log2), joint entropy (based log10), difference average, difference variance, difference entropy, sum average, sum variance, sum entropy, angular second moment, contrast, dissimilarity, inverse difference, normalized inverse difference, inverse difference moment, normalized inverse difference moment, inverse variance, correlation, autocorrelation, cluster tendency, cluster shade, cluster prominence
- GLRLM: short runs emphasis, long runs emphasis, low gray level run emphasis, high gray level run emphasis, short run low gray level emphasis, short run high gray level emphasis, long run low gray level emphasis, long run high gray level emphasis, gray level non-uniformity, run length non-uniformity, run percentage
- GLSZM: small zone emphasis, large zone emphasis, low gray level zone emphasis, high gray level zone emphasis, small zone low gray level emphasis, small zone high gray level emphasis, large zone low gray level emphasis, large zone high gray level emphasis, gray level non-uniformity, normalized gray level non-uniformity, zone size non-uniformity, normalized zone size non-uniformity, zone percentage, gray level variance, zone size variance, zone size entropy
For ICC calculation, ROIs were redrawn on 50 US images in a square shape containing the greatest area of parotid gland parenchyma (Figure 3b). The shape was changed to reduce the variations in results due to different ROI shapes. ROI selection and feature extraction was performed using LIFEx software version 7.5.16 (available from https://www.lifexsoft.org/) [27].
2.2.2. Dimension Reduction and Classification
First, features with an ICC value > 0.80 between two different ROI shapes were selected for reproducibility and redundancy. A total of 38 features, consisting of 19 first-order and 19 high-order features were selected (Table 2).
Table 2.
Radiomic features chosen after evaluating the intraclass correlation coefficient.
Subsequently, four statistical algorithms or machine learning methods were applied to select features according to their contribution towards accurate classification of the sex and age group: least absolute shrinkage and selection operator (LASSO), information gain ratio (IGR), reliefF (R), and stochastic gradient descent (SGD). The selected features were then used to classify the sex, age groups, or sex and age concurrently, using four machine learning models, random forest (RF), gradient boosting (GB), naïve Bayes (NB), and k-nearest neighbor (KNN).
Classification performance was measured using the area under the receiver operating characteristic curve (AUC), recall, and precision. The results were interpreted as follows: 0.5 ≤ AUC < 0.6, fail; 0.6 ≤ AUC < 0.7, poor; 0.7 ≤ AUC < 0.8, fair; 0.8 ≤ AUC < 0.9, good; and AUC ≥ 0.9, excellent [28].
ICC calculation was performed using IBM SPSS Statistics for Windows, Version 29 (IBM Corp., Armonk, NY, USA). Further dimension reduction and classification model development were performed using Orange software (Orange, Ljubljana, Slovenia, available from https://orangedatamining.com/) [29].
3. Results
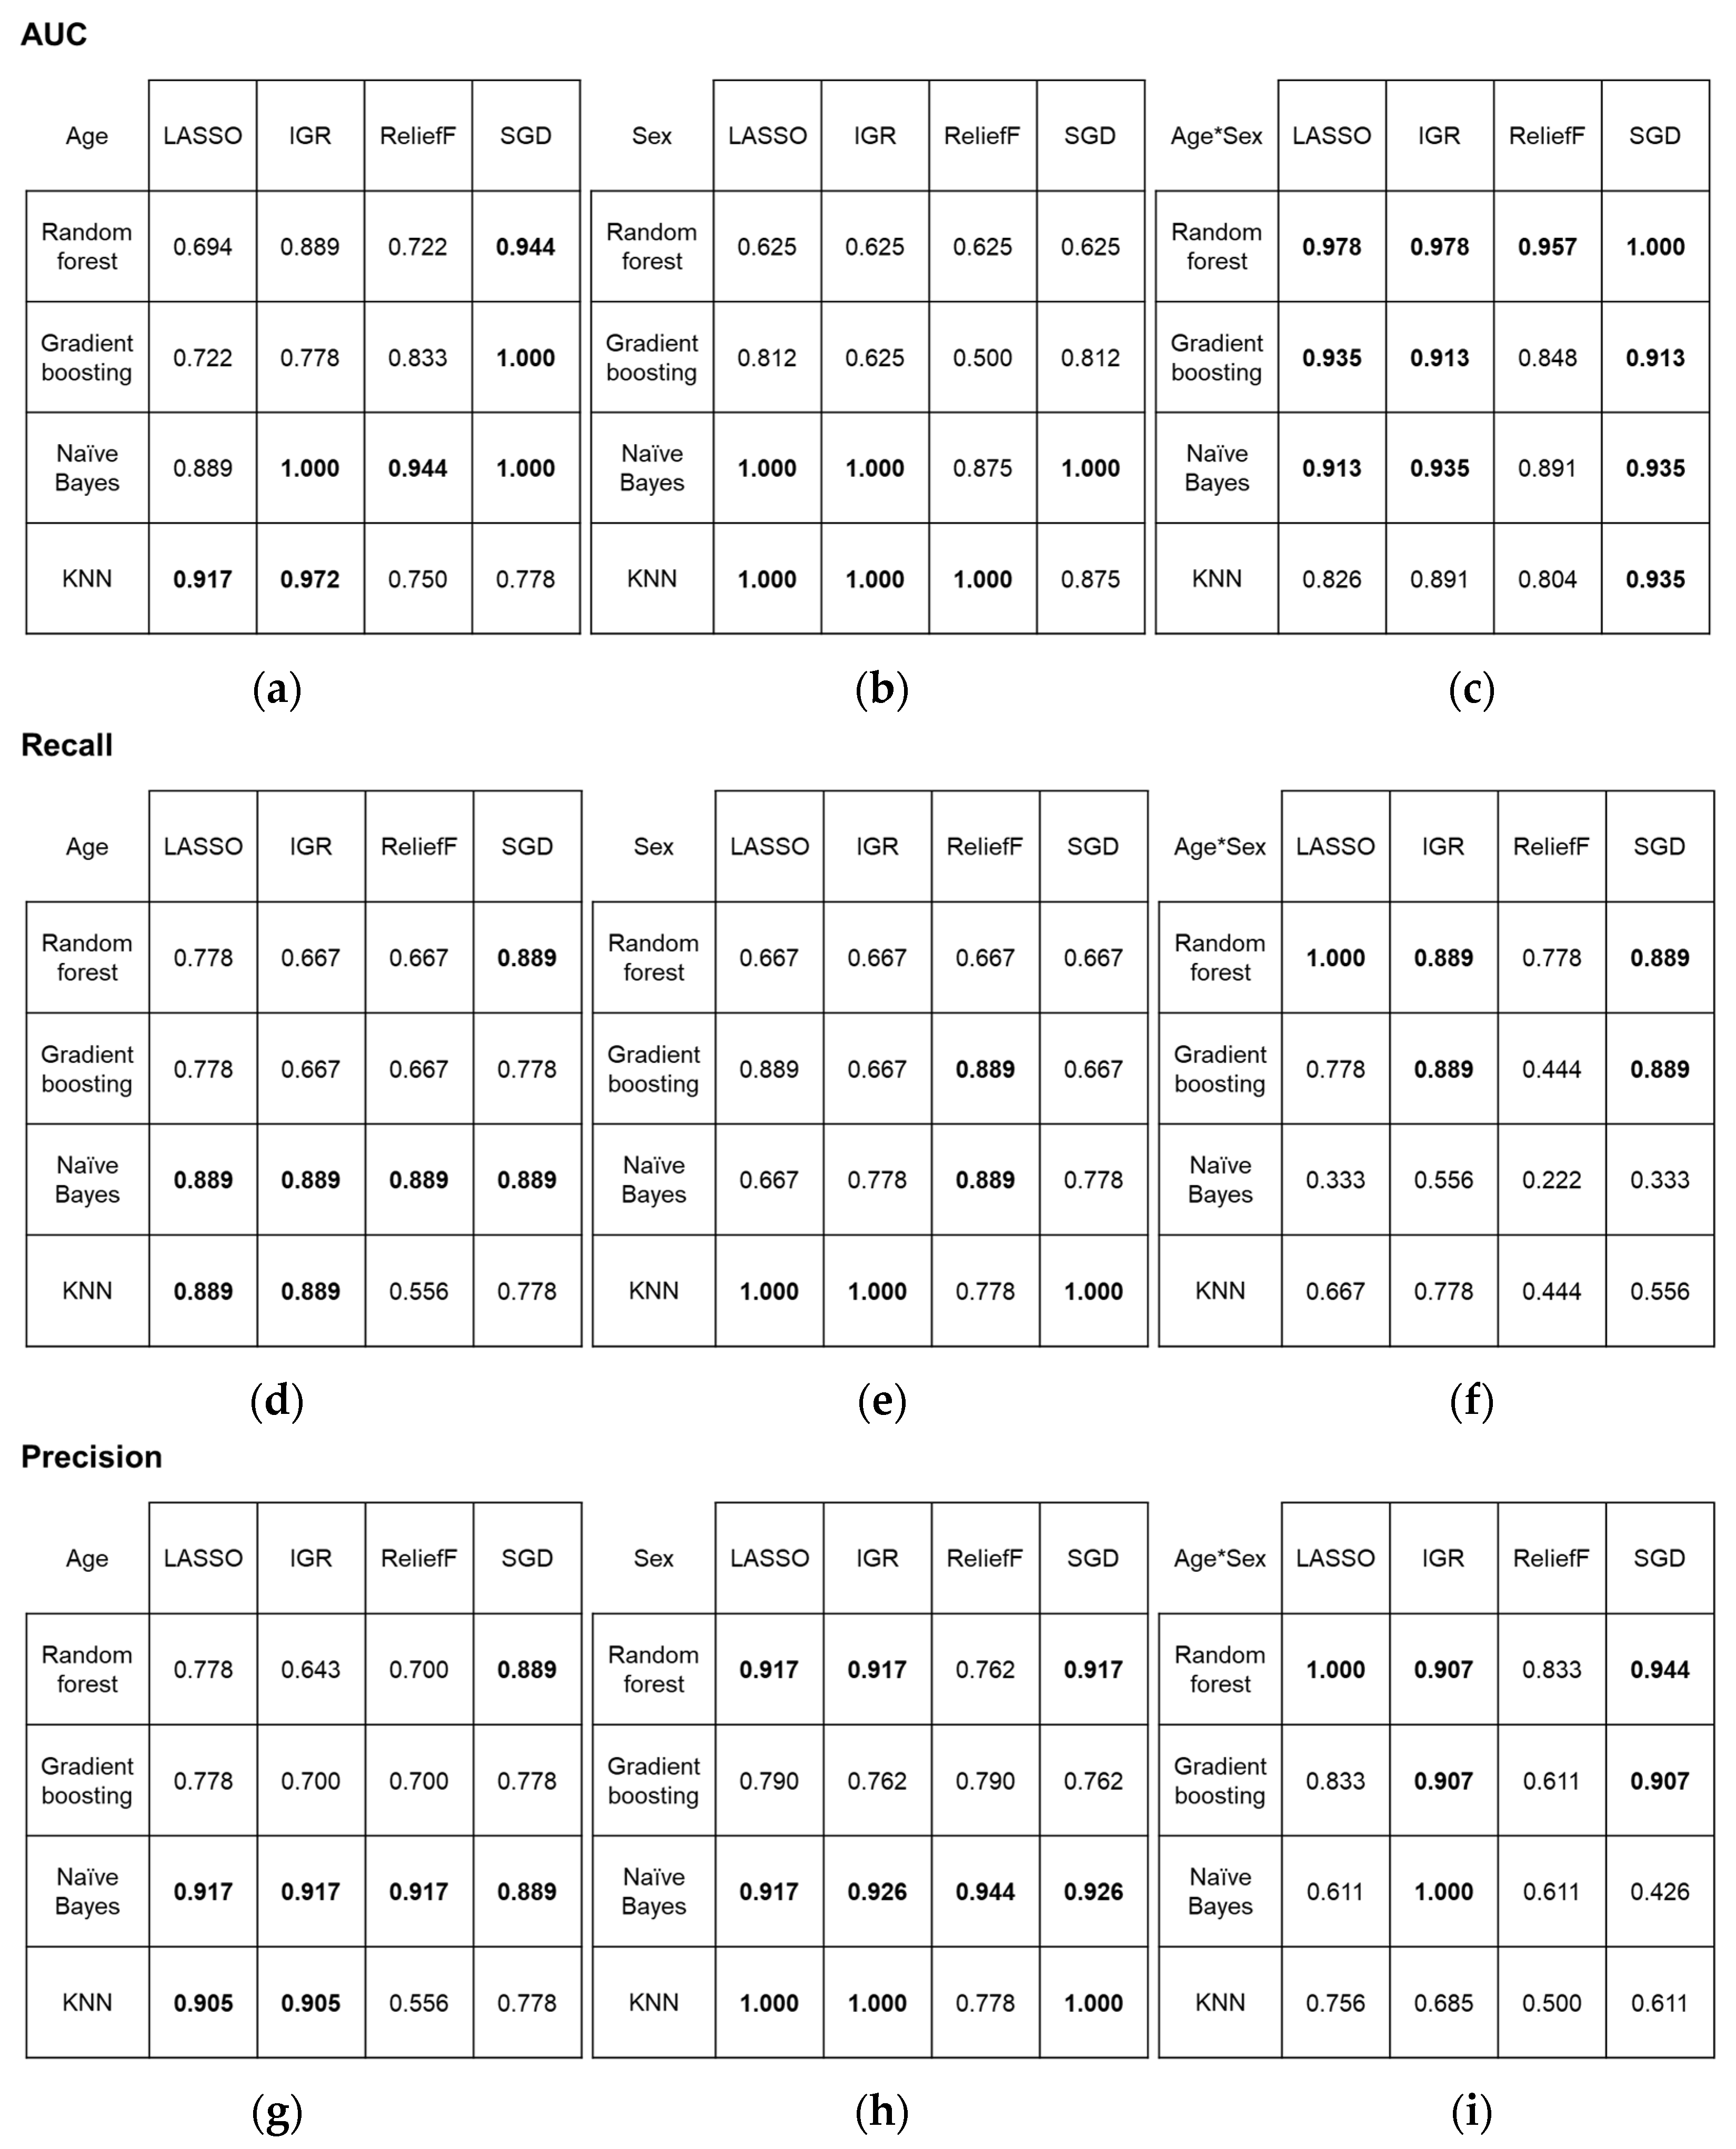
In the classification of age groups, two first-order and three high-order features (two GLRLM and one GLCM feature) contributed to achieving the best and excellent performance in terms of AUC (1.000) when using the combination of IGR and NB, and SGD and GB or NB. For the classification of sex, the combination of IGR and NB also yielded the best performance (AUC = 1.000), along with other combinations, including LASSO and NB or KNN, IGR and KNN, R and KNN, and SGD and NB. The contributing features comprised 3~5 first-order and 3~5 high-order features (2~4 GLCM and 1~2 GLRLM features). However, the best performance in simultaneously classifying age group and sex was observed when using the combination of SGD and RF (AUC = 1.000). The combinations mentioned above also achieved high recall and precision scores. Overall classification performance according to the combinations are depicted in Figure 4, confusion matrices are shown in Figure 5, and the details of the selected features are described in Table 3.
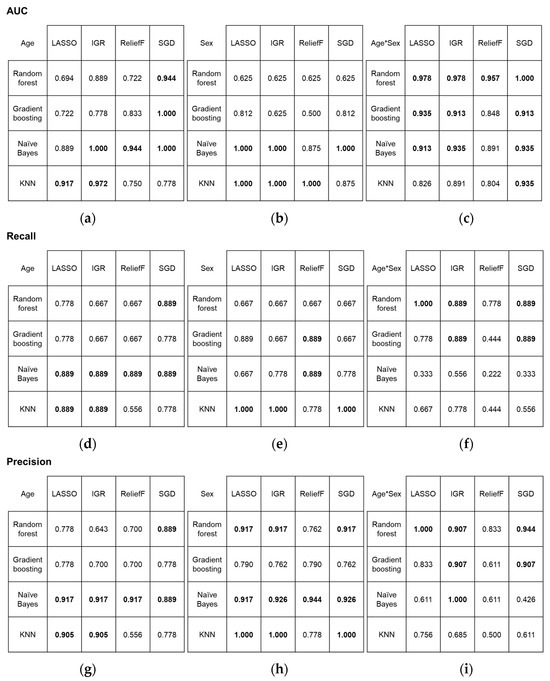
Figure 4.
Performance metrics for four statistical algorithms and four classification models: (a–c) area under the receiver operating characteristic curve results, (d–f) recall, and (g–i) precision. Metrics are presented for (a,d,g) age, (b,e,h) sex, and (c,f,i) combined age and sex classification. The highest scores are highlighted in bold. AUC, area under the receiver operating characteristic curve; LASSO, least absolute shrinkage and selection operator; IGR, information gain ratio; SGD, stochastic gradient descent; KNN, k-nearest neighbors.
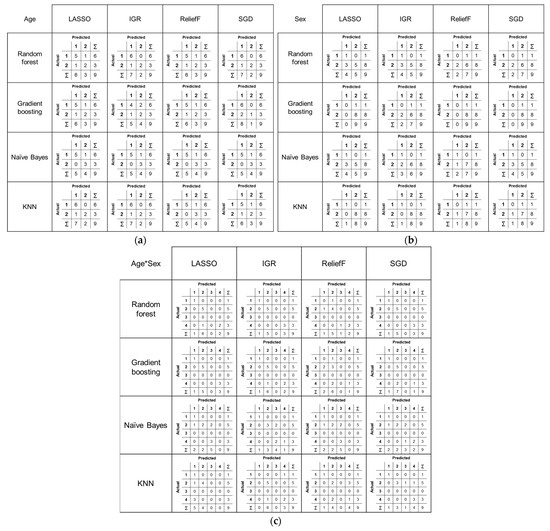
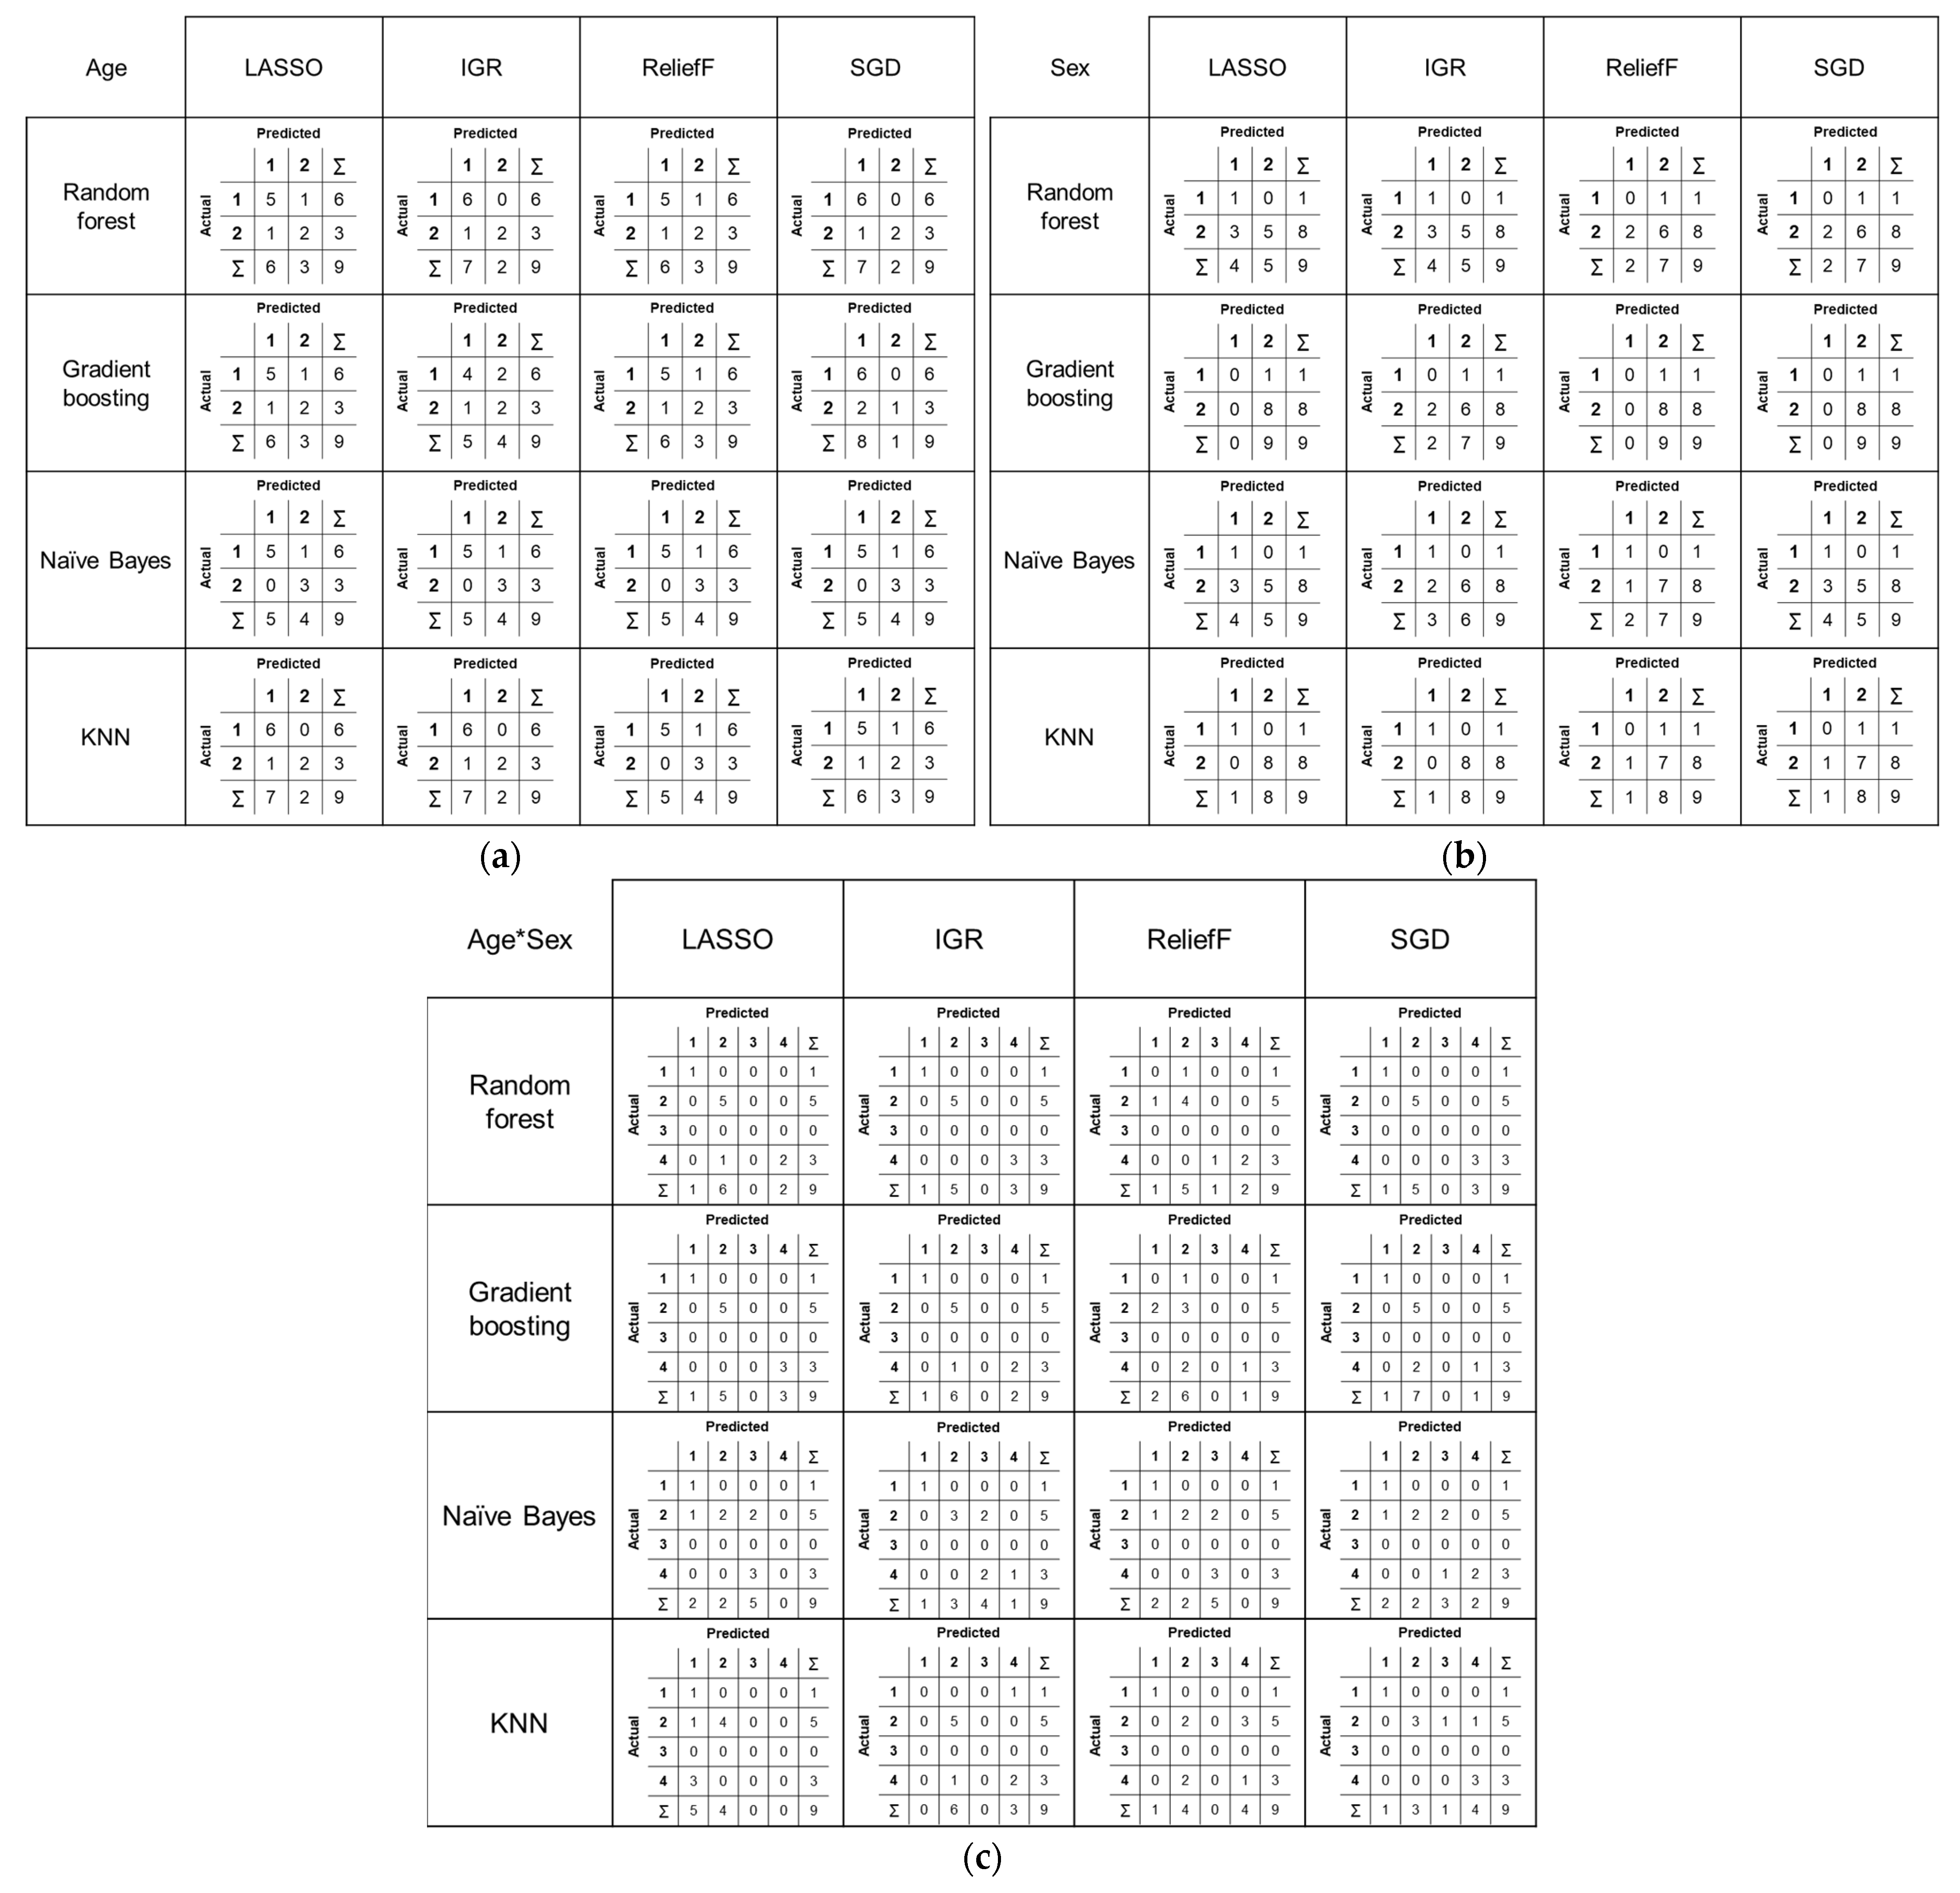
Figure 5.
Confusion matrices showing the classification results for each combination of statistical algorithm and machine learning model: (a) age, (b) sex, and (c) combined age and sex classification.
Table 3.
Selected radiomic features contributing to perfect classification performance (AUC = 1.000). Classification models using the same feature selection algorithm utilized the same features.
Other combinations of statistical algorithm and machine learning methods that produced excellent or good results in classifying age groups are listed below in descending order in terms of AUC: IGR and KNN (AUC = 0.972), R and NB (AUC = 0.944), SGD and RF (AUC = 0.944), LASSO and KNN (AUC = 0.917), LASSO and NB (AUC = 0.889), IGR and RF (AUC = 0.889), and R and GB (AUC = 0.833). The combinations that also produced excellent or good results in sex classification were R and NB (AUC = 0.875), SGD and KNN (AUC = 0.875), LASSO and GB (AUC = 0.812), and SGD and GB (AUC = 0.812). In simultaneous classification of age groups and sex, all combinations generated either excellent or good results. Those excellent results were attained from combinations LASSO and RF (AUC = 0.978), IGR and RF (AUC = 0.978), R and RF (AUC = 0.957), LASSO and GB (AUC = 0.935), IGR and NB (AUC = 0.935), SGD and NB or KNN (AUC = 0.935), LASSO and NB (AUC = 0.913), IGR and GB (AUC = 0.913), and SGD and GB (AUC = 0.913). Good results were acquired from IGR and KNN (AUC = 0.891), R and NB (AUC = 0.891), R and GB (AUC = 0.848), LASSO and KNN (AUC = 0.826), and R and KNN (AUC = 0.804).
Overall, the features that contributed to the most combinations for perfect classification were discretized intensity skewness (combinations of IGR and NB for age; IGR and NB or KNN, LASSO and NB or KNN for sex; and SGD and RF for both) and kurtosis (combinations of IGR and NB, SGD and GB or NB for age; LASSO and NB or KNN, SGD and NB for sex; and SGD and RF for both), and GLCM angular second moment (combinations of IGR and NB for age and all combinations for sex). Discretized intensity skewness was the best-ranked attribute by IGR among other selected attributes for age and sex classification. For the various combinations that achieved perfect classifications of sex, intensity skewness and GLCM angular second moment were the most frequently included features.
4. Discussion
This study aimed to analyze radiomic features of the parotid glands with reduced shape effect in US images that contribute towards the differentiation of age and sex. This differentiation aims to establish a normal reference for the radiomic diagnosis of parenchymal disease of the parotid gland. Through feature selection from different ROI shapes, discretized intensity skewness and kurtosis, intensity skewness, and GLCM angular second moment emerged as the most significant features for overall classification. The best performance in both age group and sex classifications was achieved with a perfect AUC (1.000) by using a combination of IGR or SGD and NB. Similarly, a perfect level of performance for concurrently classifying both age group and sex was achieved using the combination of SGD and RF.
Discretized intensity skewness or kurtosis measures the skewness (measure of asymmetry) or the kurtosis (measure of tailedness) of a histogram after discretizing (normalizing) the image; in the present study, a gray level of 256 was discretized to 10 bins, resulting in a bin size of 25.6. On the other hand, intensity skewness measures the skewness of a histogram before image normalization. Discretized intensity skewness was the most significant attribute selected by IGR in both age group and sex classification, and when combined with the NB model, it produced a perfect result. Additionally, discretized intensity kurtosis and GLCM angular second moment frequently contributed to classifying age group and sex using various algorithms, although they were not the top-ranked attributes. GLCM angular second moment evaluates the uniformity in the gray level distribution in an image. Therefore, the skewness of the discretized histogram can be inferred to vary most substantially among all subgroups, while the kurtosis of the discretized histogram and the gray level distribution remain consistently dissimilar, according to the classification models.
The combinations of IGR and NB, and SGD and GB or NB, performed perfectly in discriminating age groups, whereas sex classification achieved excellent performance with additional combinations such as IGR, LASSO, R, and SGD paired with NB, KNN, or both. This difference can be explained by several factors. First, age groups are a fabricated concept and may not be as biologically disparate from each other as sex. Moreover, the mechanism and strengths of the feature selection algorithms and classification models are divergent: IGR, derived from decision tree learning, involves the length and number of tree branches to select an attribute, in other words, the ratio of information gain, favoring attributes with fewer significant values. SGD stochastically approximates the gradient descent, replacing the actual gradient, which reduces computational burden in high-dimensional optimization tasks. Meanwhile, the NB classifier, a probabilistic classifier, is based on a principle where features’ values are considered independent from one another. In the present study, the radiomic features were inherently independent from one another, and the features that were handpicked by IGR or SGD for age group differentiation were significant. This may have led to IGR or SGD with NB achieving a perfect classification.
The statistical algorithms for feature selection also included LASSO and R. LASSO is a type of regression analysis model that assumes only a few of the coefficients in the linear model are non-zero. This algorithm is used for both variable selection and regularization to enhance prediction accuracy. R is an updated version of the relief algorithm. Originally, relief selects features that are significantly sensitive to feature interactions by filter-method approach. R calculates near-hit and near-miss distances among features using the Manhattan norm and not the Euclidean norm.
Other machine learning models, in addition to NB, included RF, GB, and KNN. The models were chosen for their distinct characteristics, which set them apart from one another: RF is based on numerous decision trees for classification and other objectives, and it reduces the tendency of decision trees to overfit. GB boosts the performance of weaker models by creating an ensemble, using simple decision trees as weak models. This machine learning model frequently performs better than RF. KNN is used for classification or regression, where the output is determined by the most common choice or the average values of the nearest neighbors.
This study is significant that it utilized only reproducible radiomic features from two different ROI shapes, polygon and square. Since US visualizes two-dimensional structure vertical to the surface of the transducer, the orientation of the transducer affects US images [30], which in turn causes ROI selection within images to influence radiomic feature values [1,31]. This study sought to reduce shape effects in radiomic analysis by selecting features with an ICC over 0.8 across two ROI shapes.
The previous literature has shown that parotid gland function differs according to age and sex [25]. From a cellular aspect, gene expressions have also been found to differ in older parotid glands [26]. This study is meaningful because it examines this divergence in parotid gland imaging biomarkers. Given the exploration of the biologic significance of radiomics, it can be speculated that age- and sex-related variation in radiomic features exists within normally functioning organs. Although such biologic differences have been widely studied, no previous research has scrutinized the differences in radiomic features. In US of the normal population, harmonization of radiomic features in submandibular glands was investigated across various units, rather than categorizing through radiomic features as in the current study [17]. In addition to US, the fat fraction of the parotid gland was analyzed in magnetic resonance imaging with the IDEAL-IQ technique, comparing the control to the sialadenitis group [32]. The fat fractions in the sialadenitis group were lower (p < 0.001) than those in the control group across all body mass index categories.
This study has some limitations. Although a relatively large number (91 images) of parotid gland US images were used [5,17], a greater number of images would likely produce more robust results. Furthermore, only two ROI shapes were used for reproducible feature selection. Nonetheless, to the best of my knowledge, the present study is the first study to reduce shape effects in the radiomic analysis of US images. Lastly, images from only one US unit were included; including images from more units would likely yield more solid results. Future studies with more images from various US units and further reduced shape effects are needed for more generalizable conclusions.
5. Conclusions
First-order and GLCM features, particularly discretized intensity skewness and kurtosis, intensity skewness, and GLCM angular second moment, represent significant radiomic variation related to age group and sex in US images. These features contribute the most when the combination of IGR or SGD and NB is incorporated in the analysis. Therefore, these features should be noted when parenchymal diseases of the parotid gland are evaluated against normal by US images and radiomics analysis if the compositions of age and sex is not comparable.
Funding
This research received no external funding.
Institutional Review Board Statement
This study was approved by the Institutional Review Board (IRB) of the Kyung Hee University Dental Hospital (IRB No: KH-DT24020, approved on 29 August 2024).
Informed Consent Statement
Patient consent was waived due to the retrospective nature of the ultrasound image collection.
Data Availability Statement
Data related to this research will be made available by the author on request.
Conflicts of Interest
The author declares no conflicts of interest.
References
- van Timmeren, J.E.; Cester, D.; Tanadini-Lang, S.; Alkadhi, H.; Baessler, B. Radiomics in medical imaging-”how-to” guide and critical reflection. Insights Imaging 2020, 11, 91. [Google Scholar] [CrossRef] [PubMed]
- Tomaszewski, M.R.; Gillies, R.J. The Biological Meaning of Radiomic Features. Radiology 2021, 299, E256. [Google Scholar] [CrossRef] [PubMed]
- Zwanenburg, A.; Vallieres, M.; Abdalah, M.A.; Aerts, H.; Andrearczyk, V.; Apte, A.; Ashrafinia, S.; Bakas, S.; Beukinga, R.J.; Boellaard, R.; et al. The Image Biomarker Standardization Initiative: Standardized Quantitative Radiomics for High-Throughput Image-based Phenotyping. Radiology 2020, 295, 328–338. [Google Scholar] [CrossRef] [PubMed]
- Aerts, H.J.; Velazquez, E.R.; Leijenaar, R.T.; Parmar, C.; Grossmann, P.; Carvalho, S.; Bussink, J.; Monshouwer, R.; Haibe-Kains, B.; Rietveld, D.; et al. Decoding tumour phenotype by noninvasive imaging using a quantitative radiomics approach. Nat. Commun. 2014, 5, 4006. [Google Scholar] [CrossRef]
- Lee, A.; Park, G.C.; Cho, E.S.; Choi, Y.J.; Jeon, K.J.; Han, S.S.; Lee, C. Radiomics-based sialadenitis staging in contrast-enhanced computed tomography and ultrasonography: A preliminary rat model study. Oral Surg. Oral Med. Oral Pathol. Oral Radiol. 2023, 136, 231–239. [Google Scholar] [CrossRef]
- Ito, K.; Muraoka, H.; Hirahara, N.; Sawada, E.; Hirohata, S.; Otsuka, K.; Okada, S.; Kaneda, T. Quantitative assessment of mandibular bone marrow using computed tomography texture analysis for detect stage 0 medication-related osteonecrosis of the jaw. Eur. J. Radiol. 2021, 145, 110030. [Google Scholar] [CrossRef]
- Zheng, Y.M.; Chen, J.; Xu, Q.; Zhao, W.H.; Wang, X.F.; Yuan, M.G.; Liu, Z.J.; Wu, Z.J.; Dong, C. Development and validation of an MRI-based radiomics nomogram for distinguishing Warthin’s tumour from pleomorphic adenomas of the parotid gland. Dentomaxillofac Radiol. 2021, 50, 20210023. [Google Scholar] [CrossRef]
- Muraoka, H.; Kaneda, T.; Ito, K.; Hirahara, N.; Ichiki, S.; Kondo, T. Diagnostic utility of magnetic resonance imaging texture analysis in suppurative osteomyelitis of the mandible. Oral Radiol. 2022, 38, 601–609. [Google Scholar] [CrossRef] [PubMed]
- Li, M.D.; Cheng, M.Q.; Chen, L.D.; Hu, H.T.; Zhang, J.C.; Ruan, S.M.; Huang, H.; Kuang, M.; Lu, M.D.; Li, W.; et al. Reproducibility of radiomics features from ultrasound images: Influence of image acquisition and processing. Eur. Radiol. 2022, 32, 5843–5851. [Google Scholar] [CrossRef]
- Duron, L.; Savatovsky, J.; Fournier, L.; Lecler, A. Can we use radiomics in ultrasound imaging? Impact of preprocessing on feature repeatability. Diagn. Interv. Imaging 2021, 102, 659–667. [Google Scholar] [CrossRef]
- Shi, S.; An, X.; Li, Y. Ultrasound Radiomics-Based Logistic Regression Model to Differentiate Between Benign and Malignant Breast Nodules. J. Ultrasound Med. 2023, 42, 869–879. [Google Scholar] [CrossRef] [PubMed]
- Cai, L.; Sidey-Gibbons, C.; Nees, J.; Riedel, F.; Schaefgen, B.; Togawa, R.; Killinger, K.; Heil, J.; Pfob, A.; Golatta, M. Ultrasound Radiomics Features to Identify Patients With Triple-Negative Breast Cancer: A Retrospective, Single-Center Study. J. Ultrasound Med. 2024, 43, 467–478. [Google Scholar] [CrossRef] [PubMed]
- Su, X.; Lin, S.; Huang, Y. Value of radiomics-based two-dimensional ultrasound for diagnosing early diabetic nephropathy. Sci. Rep. 2023, 13, 20427. [Google Scholar] [CrossRef]
- Kawashima, Y.; Miyakoshi, M.; Kawabata, Y.; Indo, H. Efficacy of texture analysis of ultrasonographic images in the differentiation of metastatic and non-metastatic cervical lymph nodes in patients with squamous cell carcinoma of the tongue. Oral Surg. Oral Med. Oral Pathol. Oral Radiol. 2023, 136, 247–254. [Google Scholar] [CrossRef]
- Vukicevic, A.M.; Milic, V.; Zabotti, A.; Hocevar, A.; De Lucia, O.; Filippou, G.; Frangi, A.F.; Tzioufas, A.; De Vita, S.; Filipovic, N. Radiomics-Based Assessment of Primary Sjogren’s Syndrome From Salivary Gland Ultrasonography Images. IEEE J. Biomed. Health Inform. 2020, 24, 835–843. [Google Scholar] [CrossRef]
- Li, Q.; Jiang, T.; Zhang, C.; Zhang, Y.; Huang, Z.; Zhou, H.; Huang, P. A nomogram based on clinical information, conventional ultrasound and radiomics improves prediction of malignant parotid gland lesions. Cancer Lett. 2022, 527, 107–114. [Google Scholar] [CrossRef]
- Choi, Y.J.; Jeon, K.J.; Lee, A.; Han, S.S.; Lee, C. Harmonization of robust radiomic features in the submandibular gland using multi-ultrasound systems: A preliminary study. Dentomaxillofac Radiol. 2023, 52, 20220284. [Google Scholar] [CrossRef]
- Horng, H.; Singh, A.; Yousefi, B.; Cohen, E.A.; Haghighi, B.; Katz, S.; Noel, P.B.; Shinohara, R.T.; Kontos, D. Generalized ComBat harmonization methods for radiomic features with multi-modal distributions and multiple batch effects. Sci. Rep. 2022, 12, 4493. [Google Scholar] [CrossRef] [PubMed]
- Martire, M.V.; Santiago, M.L.; Cazenave, T.; Gutierrez, M. Latest Advances in Ultrasound Assessment of Salivary Glands in Sjogren Syndrome. J. Clin. Rheumatol. 2018, 24, 218–223. [Google Scholar] [CrossRef]
- Chang, P.H.; Chen, Y.J.; Chang, K.V.; Wu, W.T.; Ozcakar, L. Ultrasound measurements of superficial and deep masticatory muscles in various postures: Reliability and influencers. Sci. Rep. 2020, 10, 14357. [Google Scholar] [CrossRef]
- Ying, M.; Pang, B.S. Three-dimensional ultrasound measurement of cervical lymph node volume. Br. J. Radiol. 2009, 82, 617–625. [Google Scholar] [CrossRef] [PubMed]
- Marotti, J.; Heger, S.; Tinschert, J.; Tortamano, P.; Chuembou, F.; Radermacher, K.; Wolfart, S. Recent advances of ultrasound imaging in dentistry—A review of the literature. Oral Surg. Oral Med. Oral Pathol. Oral Radiol. 2013, 115, 819–832. [Google Scholar] [CrossRef] [PubMed]
- Bradley, M.J.; Durham, L.H.; Lancer, J.M. The role of colour flow Doppler in the investigation of the salivary gland tumour. Clin. Radiol. 2000, 55, 759–762. [Google Scholar] [CrossRef] [PubMed]
- Martinoli, C.; Derchi, L.E.; Solbiati, L.; Rizzatto, G.; Silvestri, E.; Giannoni, M. Color Doppler Sonography of Salivary-Glands. Am. J. Roentgenol. 1994, 163, 933–941. [Google Scholar] [CrossRef]
- Li, N.; Ye, Y.; Wu, Y.; Li, L.; Hu, J.; Luo, D.; Li, Y.; Yang, J.; Gao, Y.; Hai, W.; et al. Alterations in histology of the aging salivary gland and correlation with the glandular inflammatory microenvironment. iScience 2023, 26, 106571. [Google Scholar] [CrossRef]
- Srivastava, A.; Wang, J.; Zhou, H.; Melvin, J.E.; Wong, D.T. Age and gender related differences in human parotid gland gene expression. Arch. Oral Biol. 2008, 53, 1058–1070. [Google Scholar] [CrossRef]
- Nioche, C.; Orlhac, F.; Boughdad, S.; Reuze, S.; Goya-Outi, J.; Robert, C.; Pellot-Barakat, C.; Soussan, M.; Frouin, F.; Buvat, I. LIFEx: A Freeware for Radiomic Feature Calculation in Multimodality Imaging to Accelerate Advances in the Characterization of Tumor Heterogeneity. Cancer Res. 2018, 78, 4786–4789. [Google Scholar] [CrossRef]
- Nahm, F.S. Receiver operating characteristic curve: Overview and practical use for clinicians. Korean J. Anesthesiol. 2022, 75, 25–36. [Google Scholar] [CrossRef]
- Demsar, J.; Curk, T.; Erjavec, A.; Gorup, C.; Hocevar, T.; Milutinovic, M.; Mozina, M.; Polajnar, M.; Toplak, M.; Staric, A.; et al. Orange: Data Mining Toolbox in Python. J. Mach. Learn. Res. 2013, 14, 2349–2353. [Google Scholar]
- Bolsterlee, B.; Gandevia, S.C.; Herbert, R.D. Effect of Transducer Orientation on Errors in Ultrasound Image-Based Measurements of Human Medial Gastrocnemius Muscle Fascicle Length and Pennation. PLoS ONE 2016, 11, e0157273. [Google Scholar] [CrossRef]
- Naseri, H.; Skamene, S.; Tolba, M.; Faye, M.D.; Ramia, P.; Khriguian, J.; Patrick, H.; Hernandez, A.X.A.; David, M.; Kildea, J. Radiomics-based machine learning models to distinguish between metastatic and healthy bone using lesion-center-based geometric regions of interest. Sci. Rep. 2022, 12, 9866. [Google Scholar] [CrossRef] [PubMed]
- Lee, A.; Choi, Y.J.; Jeon, K.J.; Han, S.S.; Lee, C. Development and accuracy validation of a fat fraction imaging biomarker for sialadenitis in the parotid gland. BMC Oral Health 2023, 23, 347. [Google Scholar] [CrossRef] [PubMed]
Disclaimer/Publisher’s Note: The statements, opinions and data contained in all publications are solely those of the individual author(s) and contributor(s) and not of MDPI and/or the editor(s). MDPI and/or the editor(s) disclaim responsibility for any injury to people or property resulting from any ideas, methods, instructions or products referred to in the content. |
© 2024 by the author. Licensee MDPI, Basel, Switzerland. This article is an open access article distributed under the terms and conditions of the Creative Commons Attribution (CC BY) license (https://creativecommons.org/licenses/by/4.0/).