Article

Speech Signal Analysis in Patients with Parkinson’s Disease, Taking into Account Phonation, Articulation, and Prosody of Speech

by
Ewelina Majda-Zdancewicz
1,*,
Anna Potulska-Chromik
2,
Monika Nojszewska
2 and
Anna Kostera-Pruszczyk
2
1
Faculty of Electronics, Military University of Technology, 00-908 Warsaw, Poland
2
Department of Neurology, Medical University of Warsaw, 02-097 Warsaw, Poland
*
Author to whom correspondence should be addressed.
Appl. Sci. 2024, 14(23), 11085; https://doi.org/10.3390/app142311085
Submission received: 5 September 2024 / Revised: 10 November 2024 / Accepted: 22 November 2024 / Published: 28 November 2024
(This article belongs to the Special Issue Machine Learning Based Biomedical Signal Processing)

Abstract

:
This study involved performing tests to detect Parkinson’s disease (PD) based on voice changes, including speech phonation, articulation, and prosody, in patients with PD using different types of speech signal. For this purpose, during the first stage of the investigation, three separately modeled PD diagnosis systems using different types of speech signal characteristics were defined. The classification results were obtained when the SVM method was applied compared to the k-nearest neighbors method applying 1-nn in general. The tests were carried out within the database of patient voice recordings collected in the Department of Neurology at the Medical University of Warsaw. The second stage of the research was the selection of descriptors. The SFFS (sequential floating forward) method was applied together with the k-nn and SVM classifier. These subsets were used to create a new system based on a descriptor loose integration. Within the experiments conducted, general diagnosis results lead to improved classifier performance only in certain cases. This prompted the authors to conduct the last experimental research stage—selection at the feature fusion stage. Feature evaluation ranking methods (Relief, Fisher Score, F-tests, Chi-square) were applied for this purpose. With 10-fold validation, the k-nn method achieved an recognition rate of 92.2% with 91.1% sensitivity and 93.3% specificity.

1. Introduction

Neurodegenerative diseases are characterized by a progressive course, which over time leads to significant limitations in the daily life of patients. Parkinson’s disease (PD) is one of the most common neurodegenerative diseases. Its etiopathogenesis has not yet been fully studied [1]. Primary motor symptoms of PD include bradykinesia, rigidity, resting tremor, and gait disturbances. PD not only includes motor symptoms but also an extensive spectrum of extramotor ones, which is receiving a lot of attention today. These include olfactory impairment, orthostatic hypotension, constipation, sleep disturbances, and speech impairment [2]. Behavioral problems, depression, and anxiety often occur, and dementia is quite common in the advanced stages of the disease [3]. Classic motor symptoms are preceded by non-motor symptoms, which are very often downplayed or attributed to another disease. In this context, the detection of these symptoms carries important information and plays a key role in the early detection and monitoring of the disease. These symptoms can precede the appearance of a classic motor syndrome even for several years (for example, 10 years), which proves a slowly developing neurodegenerative process [4].
The dominant modern medical standard for the diagnosis and assessment of the severity of Parkinson’s disease symptoms is the UPDRS (Unified Parkinson’s Disease Rating Scale) introduced in the 1980s [5]. The speech item is referred to as the MDS-UPDRS Speech (MDS-UPDRS-S) scale. The MDS-UPDRS-S scale evaluates volume, modulation (prosody), and clarity, including slurring, palilalia (repetition of syllables), and tachyphemia (rapid speech, running syllables together) [6,7]. It involves four parts related to non-motor experiences of daily living, motor experiences of daily living, motor examination, and motor complications, respectively. There is no cure for PD, but pharmacological and non-pharmacological treatments are available, providing symptomatic relief and improving quality of life. In this regard, levodopa is the most effective drug available to treat motor symptoms of PD, but in certain cases it can be associated with other dopaminergic and non-dopaminergic drugs [8].
Usually, a diagnosis of PD is based on a clinical assessment of motor status. Such tests require a good knowledge of the symptoms of the disease and a broad clinical experience of the examiner. In clinical practice, the diagnosis of the disease is still very often significantly delayed, especially if a family doctor does not quickly send a patient to a neurologist. According to modern and currently widely accepted views, treatment should be started from the first symptoms of the disease (and not from the moment they become bothersome). A quick diagnosis based on non-motor symptoms allows for faster treatment for the patient, which extends the life of the patient with the disease and delays the period of complications.
This is the reason why researchers focus their attention on searching for new methods aimed at the early detection and precise diagnosis of such disorders. The acquisition of voice signals and their objective evaluation can constitute a valuable tool in the operation of such systems, due to the fact that speech disorders are some of the first non-characteristic symptoms of Parkinson’s disease. Furthermore, the use of a voice signal in creating such a system does not require special equipment and is not invasive. It will enable faster detection of the pathological state and the application of a dedicated treatment therapy.
Much of the current understanding of parkinsonian speech disorders comes from three separate speech assessments: phonation, articulation, and prosodic. For a detailed description of these issues, see Section 2.2 of this article. Sometimes, it is difficult to say whether the voice disorders that occur are caused by a disease or perhaps by natural aging of the body. Old age contributes to physiological hearing impairment, as a result of which the tone of the voice changes; then, it becomes weakened and begins to tremble and its scale narrows.
The objective of the experiments carried out by the authors of this paper was to develop a target diagnostic system employing various types of speech, to use and assess every aspect of the generation of speech signals. Therefore, this article reviews methods for extracting various features employing different types of speech signal. Feature generation takes into account the speech signal generation process, focusing on the aspects of phonation, articulation, and prosody. The feature vectors defined under this concept were applied in the classic approach based on evaluating the performance of the classifier, followed by a comparison of the results obtained by integrating individual feature vectors using tight integration descriptors. The final result of the research was a comparison of the effectiveness of individual speech signal generation subsystems defined by using various types of recording and integrating these subsystems into one tight system using the process of selecting individual features. The key motivation to conduct research on the use of different acoustic signals is the difficulty in speaking to patients with PD during research. Sometimes, this is caused by stress, cold, or other illnesses, but sometimes by deterioration of the speech organs. Some patients have problems with prolonged vowel phonation; others have problems with expressing emotions in text. It depends on the stage of patients with PD, but also on their personality and health condition, including other diseases.
The main novelty presented in the experiments is the use of different types of acoustic material at the same time, assuming that speech signals are recorded under conditions of low intensity of disease symptoms. These conditions were achieved through the use of oral L-Dopa by the patients. The patients are the ON phase, so at first glance they do not have any visible symptoms of Parkinson’s disease. The choice of speech technology has been dictated by simplicity, giving the potential opportunity to assess the disease during remote consultations. In a normal stage, the evaluation of speech disorders in PD should be made on the basis of an interview, speech therapy, examination of the efficiency of the articulatory organs, evaluation of speech quality, phoniatric examination, and acoustic analysis [9]. What is more, there is no available information on prosody perception in individuals with PD in the Polish language.
The outline of this paper is as follows: The related research, including clinical symptoms and speech changes, is described in Section 2. The contribution of this paper is described in Section 3. The data pool is described in Section 4. The architecture of proposed system including the phonation process, articulation process, and prosody process assessment is described in Section 5. The experiment is described in Section 6. The results are presented in Section 7. The paper finishes with a discussion (Section 8) and Conclusions (Section 9).

2. Related Works

2.1. Evaluation of Clinical Symptoms

Most methods of diagnosing Parkinson’s disease are based on clinical symptoms, taking into account the patient’s motor functions. The development of technologies and devices that allow one to record a given signal and the use of digital signal processing methods that allow one to classify such a signal have resulted in a very large increase in interest in this subject. Tremor disturbances are one of the key features in PD. The most popular systems are methods aimed at detecting tremors in a patient’s limbs. MEMS sensors are used for this purpose [10], such as inertial sensors placed on the back of each hand [11], electromyograms (EMGs) [12], and electroencephalograms (EEGs) [12,13], as well as accelerometers included in smartphones and smartwatches [14].
The second most popular method for detecting tremors is handwriting analysis. The most common symptoms in handwriting in patients with PD include micrographia and dysgraphia, slower movements, and jerk [15]. Most studies are based on handwriting data from the on-line technique, which are enrolled from tablets and special pens [16]. It contains information related to the dynamic feature of the handwriting process (i.e., azimuth and altitude angles) [17,18]. New research also using the deep learning method [19].
Another method developed to support PD diagnostics is facial image analysis to recognize, for example, hypomimia in patients with Parkinson’s disease based on image recordings in the visible and infrared field [20] and facial expressions [21]. Another method also uses infrared thermography to detect a significantly altered thermal skin response in PD patients compared to healthy control subjects, especially on the fingers [22]. The detection of gait using different sensors gives possibilities to build different kinds of system to detect PD. The evaluation methods include embedded wearable devices integrating a triaxial accelerometer, a triaxial gyroscope, and a triaxial magnetometer, implementing a sensor with embedded data fusion and aggregation algorithms [23]; CNN models using video datasets [24]; a 2D key point estimator that estimates the joint coordinates of people after image capture using a monocular camera [25]; and the combination of wearable sensors and machine learning (ML) to detect FOG (freezing of gait) in real time [26]. Recent work has applied data-driven machine learning techniques to analyze videos of PD patients performing motor tasks, such as finger tapping [27,28]. This task is an essential element of the UPDRS scale, motor examination (Part III), encompassing 18 motor tasks performed by the patient.

2.2. Evaluation of Speech Changes

Speech sounds are formed through the cooperation of three organ systems: respiratory, phonatory, and articulatory. The respiratory organs generate a flux of air of sufficient pressure required by phonation, which creates sounds. The phonatory organs are made up of the voice-generating part of the vocal organ (generates sounds of appropriate frequency). It is composed of the larynx with vocal folds and innervated nerves in the larynx. The articulatory organs comprise the pharyngeal cavity, the resonant space complex formed by the paranasal sinuses, nose, oral cavity, and mouth [29]. A dysphonic voice is formed when any element of the phonatory system is disturbed. The way of breathing, phonation–respiratory coordination, phonation time, activation of resonators, volume and pitch of the voice, range and average position of the voice, and its timbre and sonority may be incorrect. In the case of people with Parkinson’s disease, the muscles of the larynx, throat, soft palate, tongue, and mouth are weakened. The patient’s speech is characterized by respiratory–articulatory–phonatory disorders resulting from damage to the subcortical nuclei (extrapyramidal system), primarily the striated body and the globus pallidus [30,31].
Characteristic voice changes experienced by ca. 70 to 90% of patients already at early stages of the disease are usually of variable nature [32]. Parts of the vocal cords affected by PD include phonation, prosody, and articulation. Numerous tests and experiments have been conducted over the years that allow a synthetic analysis of voice change in a person with PD [9]. For the first time, the pathomechanism of speech disorders in PD was described by Darley et al. [33]. They identified characteristic features of speech in PD, such as decreased speech volume, monotony, disturbances in the pitch and volume of speech, reductions in stress and breathing, hoarseness, inaccurate articulation, and acceleration of the pace of speech. The first articulation and breathing studies were performed in 1970. As a result, the presence of hoarseness, voice roughness, and breathing disorders was observed in 89 patients. Moreover, 25% of the 200 patients experienced problems with producing the sounds “p”, “b”, “s”, “f”, “š”, and “ž” [34]. In the case of patients with PD, speech disorders include dysarthria, aprosody and dysprosody (monotonous speech, no modulation, rhythm, and stress disturbance) [35], paraphasia (using words, syllables or sounds of similar sounding instead of proper ones) [36], breathy and harsh sonority, differences in contrastive stress, shorter phrases, increased length of pauses and hesitations (so-called reflection moans), and a variable speed of speech, including bradylalia (slowing down speech) [37]. Stiffness in the mandible and lip area is also observed. Furthermore, palilalia, which is an involuntary repetition of the same word, may also appear [38,39]. In this context, the literature shows a very large number of studies and approaches aimed at assessing the impact of PD on the voice of patients. Particular intensity in this aspect has been noticed since 2010. In general, these studies can be divided into three main groups depending on the aspect of speech being analyzed, i.e., phonational, articulatory, and prosodic [39]. Since then, a plethora of studies have presented evidence that the neurodegenerative processes associated with PD cause dysphonia and dysarthria, particularly hypokinetic dysarthria [40,41,42,43], in different stages of the disease [44]. Dysphonia can be defined as the speaker’s incapacity to produce a normal phonation due to the phonatory system’s impaired functioning, while dysarthria is more related to problems with articulation when pronouncing words.

2.2.1. Phonation

Studies about the influence of PD in the phonatory system mainly analyze the impairments in phonatory-related structures and muscles like the diaphragm, the muscles connected to the larynx, the vocal folds, or the supraglottal resonant cavities [45]. In the case of phonation change analysis, recording of the “a” vowel with prolonged phonation is most often used as research material, due to how easy it is for a patient to utter and the relatively simple-to-observe phonation stability. Due to the fact that such signals consist of many vocal fold operating cycles, parameters are adopted to relate to each of them. Most often, in the case of this type of examination, disorders related to impairments in phonatory-related structures and muscles are studied. This includes the works of the diaphragm, the muscles connected to the larynx, the vocal folds, or the supraglottal resonant cavities. The results of these studies generally show that patients with PD show a general decrease in phonatory abilities, which is manifested primarily by airflow insufficiency, irregular pitch fluctuations, microperturbations in frequency, microperturbations in amplitude, tremor of jaw, and aperiodicity [9,46].
Basic studies in this field indicate abnormal laryngeal function in 89% of patients [47]. This is mainly manifested by shortened phonation, because the expiratory phase is very short. This contributes to the occurrence of difficulties in speaking longer phrases, as a result of which there are frequent pauses in speaking to take air into the lungs. On the other hand, examination of the larynx showed that there was tremor in the range of 2 to 7 Hz. Zhang et al. [48] observed that patients had an irregular frequency of vibrations of the vocal folds. Additionally, men have a higher base frequency (F0), while women have a lower F0 variation. Further studies by Zwirner and Barnes [49] on F0 in PD patients showed instability of F0 and the F1 formant during vowel pronunciation [9]. According to Harel et al. [50], changes in F0 can be observed as early as 5 years before the diagnosis is established.
The most studied parameters of acoustic analysis in the current literature are fundamental frequency F0 and parameters describing its variability in time (jitter). Jitter can be determined based on its several measures, including parameters like Jitta, PPQ5, and RAP. Jitter is mainly affected by the lack of control over the vibration of the cords. The next group of parameters describes the signal energy in general. Shimmer, which is the variation in amplitude of the sound wave, is determined by shimmer parameters such as ShdB, APQ3, and APQ5 [51,52,53]. These various classification schemes usually provide accuracy over 75% [39,54,55]. In a different approach, the authors of [56] used perceptual linear prediction (PLP) feature vectors to characterize sustained vowels of 34 subjects (17 patients). In contrast, other related studies used several corpora and a broad set of state-of-the-art acoustic features such as jitter, shimmer, noise, complexity, PLP, linear predictive coding (LPC) or MFCC [57], and reached accuracy below 75% [39].

2.2.2. Articulation

The phenomenon of articulatory undershooting has been described for several aspects of parkinsonian speech leading to imprecise stop consonant articulation [58,59,60]. Articulation deficits in PD patients are primarily due to the reduced amplitude and velocity in the lips, tongue, and jaw movements. In the field of research on changes in articulation in people with PD, the most common analysis is performed using a pronounced vowel with prolonged phonation or repeated syllables. A small proportion of studies use spontaneous speech. Most studies focus on the analysis of speech signal formants [39] due to the fact that, based on the position of the tongue, a reduction in the articulation extension of this articulator can subsequently affect the frequency range of the formants [61,62]. The transitions between phonemes and between voiced and unvoiced segments have also been employed in the automatic detection of PD using spectrograms and convolutional neural networks (CNNs) [63], PLP and Gaussian Mixture Model–Universal Background Model (GMM-UBM) [64], i-vectors and Probabilistic Linear Discriminant Analysis (PLDA) [64], or MFCC and Band Bark Energies (BBEs) with SVM classifiers [65], yielding, in most of the cases, accuracies over 85% [39]. The analysis performed in [39] indicates that individual segments associated with specific articulation movements, such as those of plosives, provide more relevant information for the detection of PD in comparison to detection schemes that do not select or set the attention to any specific segment. Similar studies employing voiced and unvoiced segments separately to detect PD obtain better classification results using the unvoiced segments [66].

2.2.3. Prosody

In addition to articulation disorders, people with PD also have disorders of prosody of emotions, problems with understanding metaphors, naming, and defining [67,68]. However, the available parametric data are scarce. This is most often due to the lack of sufficient audio material necessary to carry out this type of analysis, as well as inconclusive results, as described in [69]. The prosodic base features are calculated mainly based on the whole expression. These kinds of changes mainly focus on paralinguistic features such as pitch variation, syllable rate analysis, or the manifestation of emotions in the speech signal. Prosodic information enables listeners to distinguish between different sentence modalities and to make different inferences about the meaning based on the speaker’s tone. Just altering the prosody can transform a declarative sentence into an interrogative statement. Prosodic perception deficits have also been reported in individuals with Parkinson’s disease (PD) [70,71]. Some of these studies have examined linguistic prosody [72,73] while others have focused on emotional prosody [70,74].
Every language possesses unique prosodic features that manifest themselves through tone structures, speech melody, and various accents. We observe that the use of only prosody-related features in automatic detectors is uncommon in contrast to other aspects such as the phonatory and articulatory features. Furthermore, despite the clear evidence for the influence of PD on prosody, most of the proposed objective biomarkers or measures are not used in clinical practice to detect PD, as a high percentage of the studies in the literature only show trends and do not establish normative data for PD detection. Moreover, to the best of our knowledge, prosody perception in people with PD has been studied in only five languages [70,73,74,75,76]. There is no available information on prosody perception in individuals with PD who speak Polish.

3. Problem Statement

Our general motivation to conduct the experiments using various types of recordings is an attempt at reliably assessing all aspects of speech signal generation and changes ongoing within the articulation, phonation, and prosody processes in people with Parkinson’s disease. Four systems based on features related to phonation, articulation, prosody, and their fusion are analyzed. Extracting features that characterize phonation, articulation, and prosody is justified by previous studies showing that impairment of speech in PD is reflected by all these features, which helps in the automatic classification of PD [45,77]. Based on the literature review, disorders associated with PD depend on their stage and can manifest themselves at various levels of speech signal generation. Some patients have weaker muscles of the larynx, which influence phonation. Other ones have a great problem with the pharyngeal cavity, which influences the articulation process. Last but not least, some patients could have a problem with the emotion that influences prosody of speech. It depends on the research group. Consequently, tools based on only one aspect will favor false-negative rates with respect to approaches considering several aspects. Therefore, the complementarity between the articulatory, phonatory, and prosody information should be the basis for the objective detection of PD.
In the related papers presented above, the authors do not report the level of severity of disease symptoms among PD patients. The real problem of this kind of research is trying to make the correct diagnosis at an early stage of the disease when the severity of classic symptoms is low. The conducted research presents an approach which includes this issue. The group of patients who had PD were in the so-called ON phase. This kind of phase minimizes the level of severity of disease symptoms among PD patients due to drugs taken. According to the searches, when patients are under the influence of levodopa drugs, symptoms and voice disorders disappear or decrease noticeably and reappear after stopping the action of the drug [78]. Levodopa promotes articulation, sound, rhythm, vocal amplitude, and speech intelligibility in patients with PD [67]. During the experiments conducted, a patient taking this medication, in the vast majority of cases, caused the symptoms of the disease to be dormant. At first glance, the patient appeared to be a healthy person. During the tests conducted by the authors in the hospital, such a situation could be observed very often.
Our suggested approach will allow one to determine the most significant feature subset, taking into account different aspects of speech generation. The use of several types of recordings resulted from our previous experience in the scope of patient recording. It was not directly associated with PD but took into account comorbid conditions. Recording conditions and a medical examination often induce stress in patients. In the course of the recordings, the patients had a cold, which hindered uttering, e.g., a vowel with prolonged phonation. They were often unable to maintain a stable phonation, precisely due to the ac-companying cold. At the same time, recording other texts was not difficult for them. The use of various recording types within this system may constitute grounds for developing a universal system, independent of available recordings, on the one hand. On the contrary, it will be possible to employ a system that integrates features of different recordings to define a multimodal PD identification system if we have all the recordings.

4. Data Pool

The studies reviewed in this article constitute part of a project, its main task being the recording of multimodal data to create a system for the early detection of PD. The collected signals are of noninvasive character. The test bench designed at the Faculty of Electronics at the Military University of Technology consists of an infrared camera, a visible range camera, a microphone with a preamplifier, a graphic tablet, and a portable PC, which acts as the controller and data integrator [79]. The developed system is to support the final doctor’s diagnosis.
The experiments focus solely on the recording of speech signals and were conducted in the Department and Clinic of Neurology of Warsaw Medical University in Warsaw after obtaining the consent of the Bioethics Committee. Registered recordings included the following:
  • Two texts of different emotional tone (approximately 176 words);
  • Recording the vowel “a” with prolonged phonation, uttered by a patient in one breath (two times);
  • Repeating the “pa” syllable in one breath as constantly and for long as possible, for 5 s.
The reading of the text was not simulated. This means that patients were not asked to simulate (act) emotions. The subjects were informed that they had to read the text in a normal, natural way. These sentences were not manually labeled to determine which was sad or happy. A total of 7 acoustic signals per patient, with an average length of ca. 75 s, were recorded.
The test bench consisted of the Shure MX58 dynamic microphone connected to a personal computer with dedicated software via a USB adapter containing a preamplifier and an ADC converter. The frequency response of the set was configured especially for the voice sounds and enabled recordings over the frequency range from 50 Hz to 15 kHz. The microphone sensitivity of −54.5 dBV/Pa was as low as in other dynamic microphones, but it was sufficient enough for recording the voice at small distances from a patient’s mouth. All of the aforementioned devices were operated from a computer using Matlab 2022 software. The software panel contains four tabs corresponding to each individual set modality. The tab “Microphone” enables recording sound in monoaural mode, with a sampling frequency of 44.1 kHz and a 16-bit resolution, saved as a WAV file. This modality enables archiving patient voice samples during spontaneous and forced speech [79]. The tests were conducted in a soundproof room with an average noise level of ca. 30 dB.
The classification was based on the UPDRS (Unified Parkinson’s Disease Rating Scale) score. The database covered recordings for 24 people with diagnosed PD (aged 55.5) and 24 people without diagnosed PD (aged 40 on average). All PD patients were included in the research group based on their positive response to dopaminergic treatment. Importantly, patients were pharmacologically prepared for testing in such a way that their condition corresponded to the lower range of the UPDRS used in diagnosis. A full specification of the recorded signals can be found in Table 1.

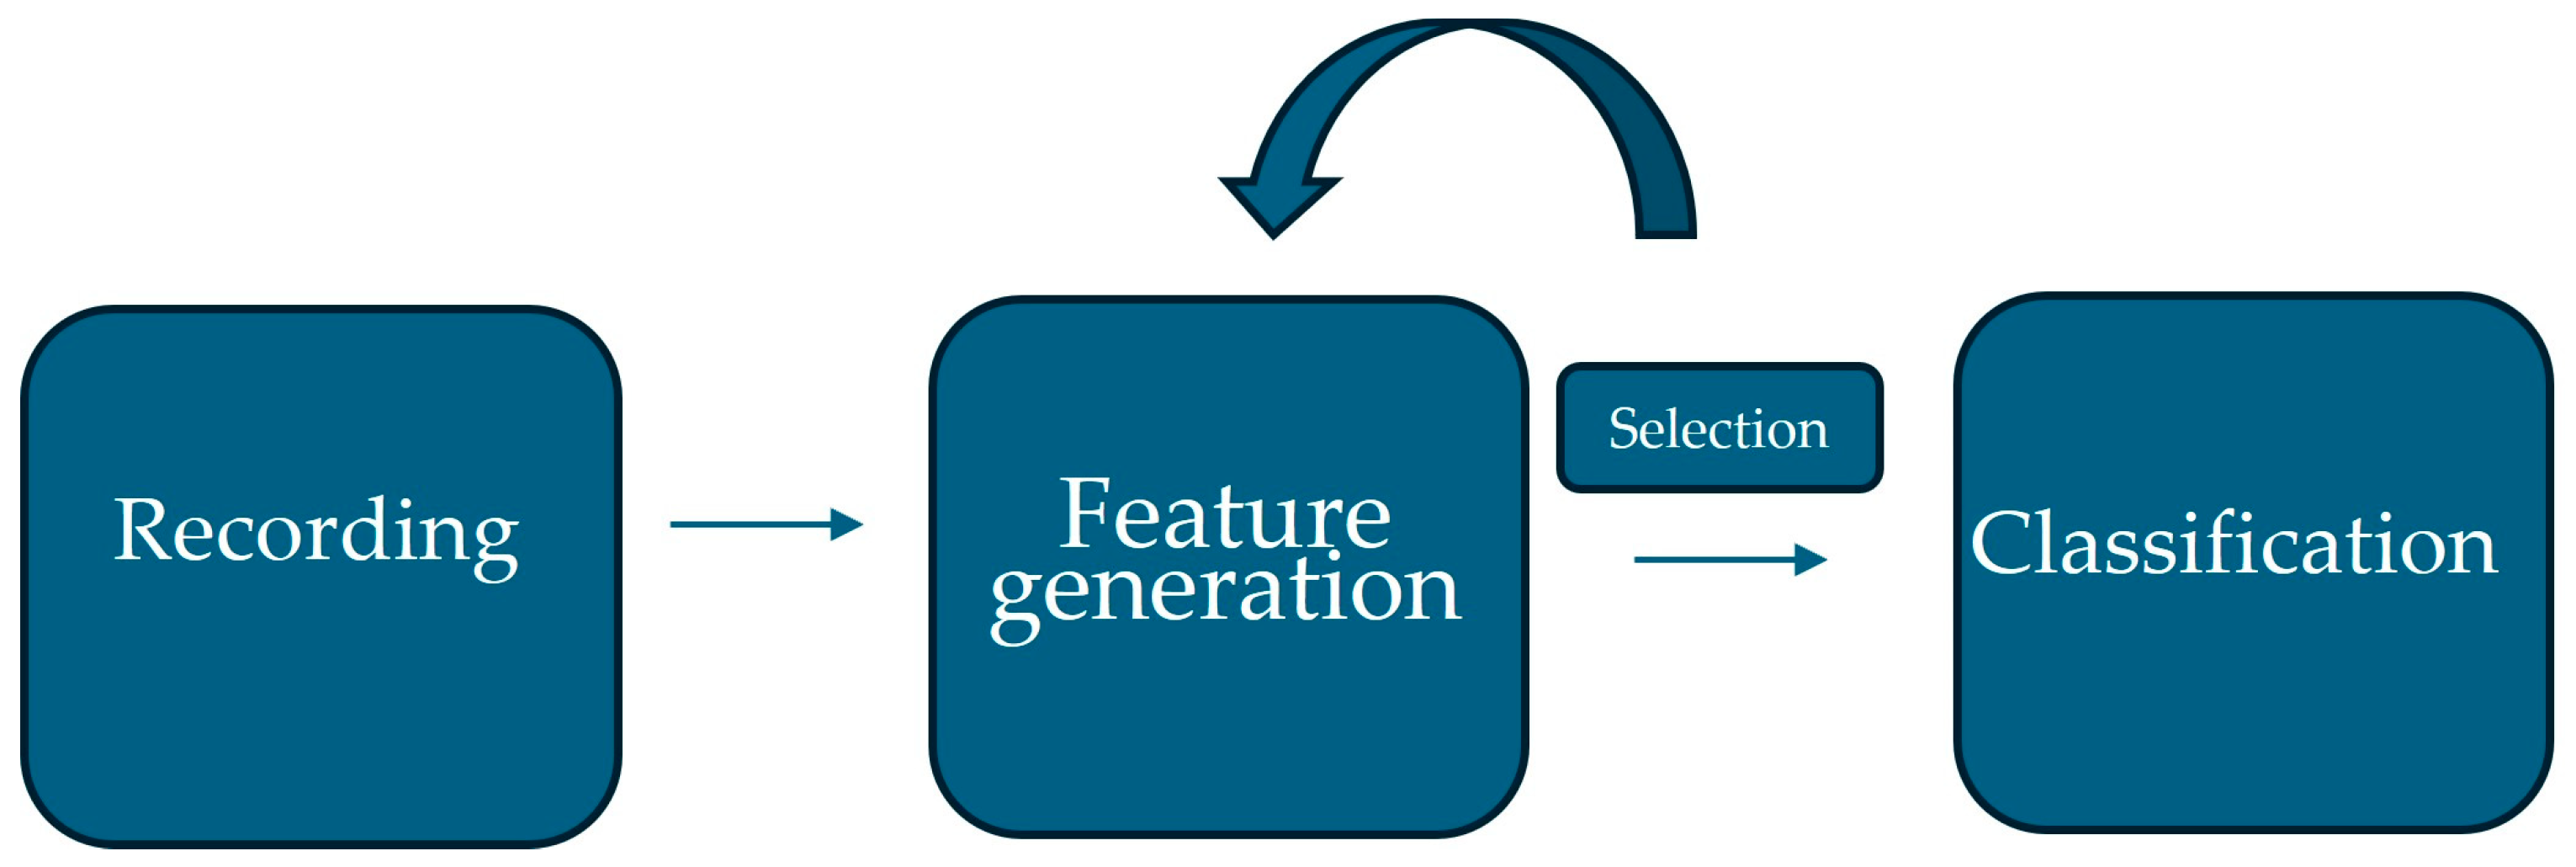
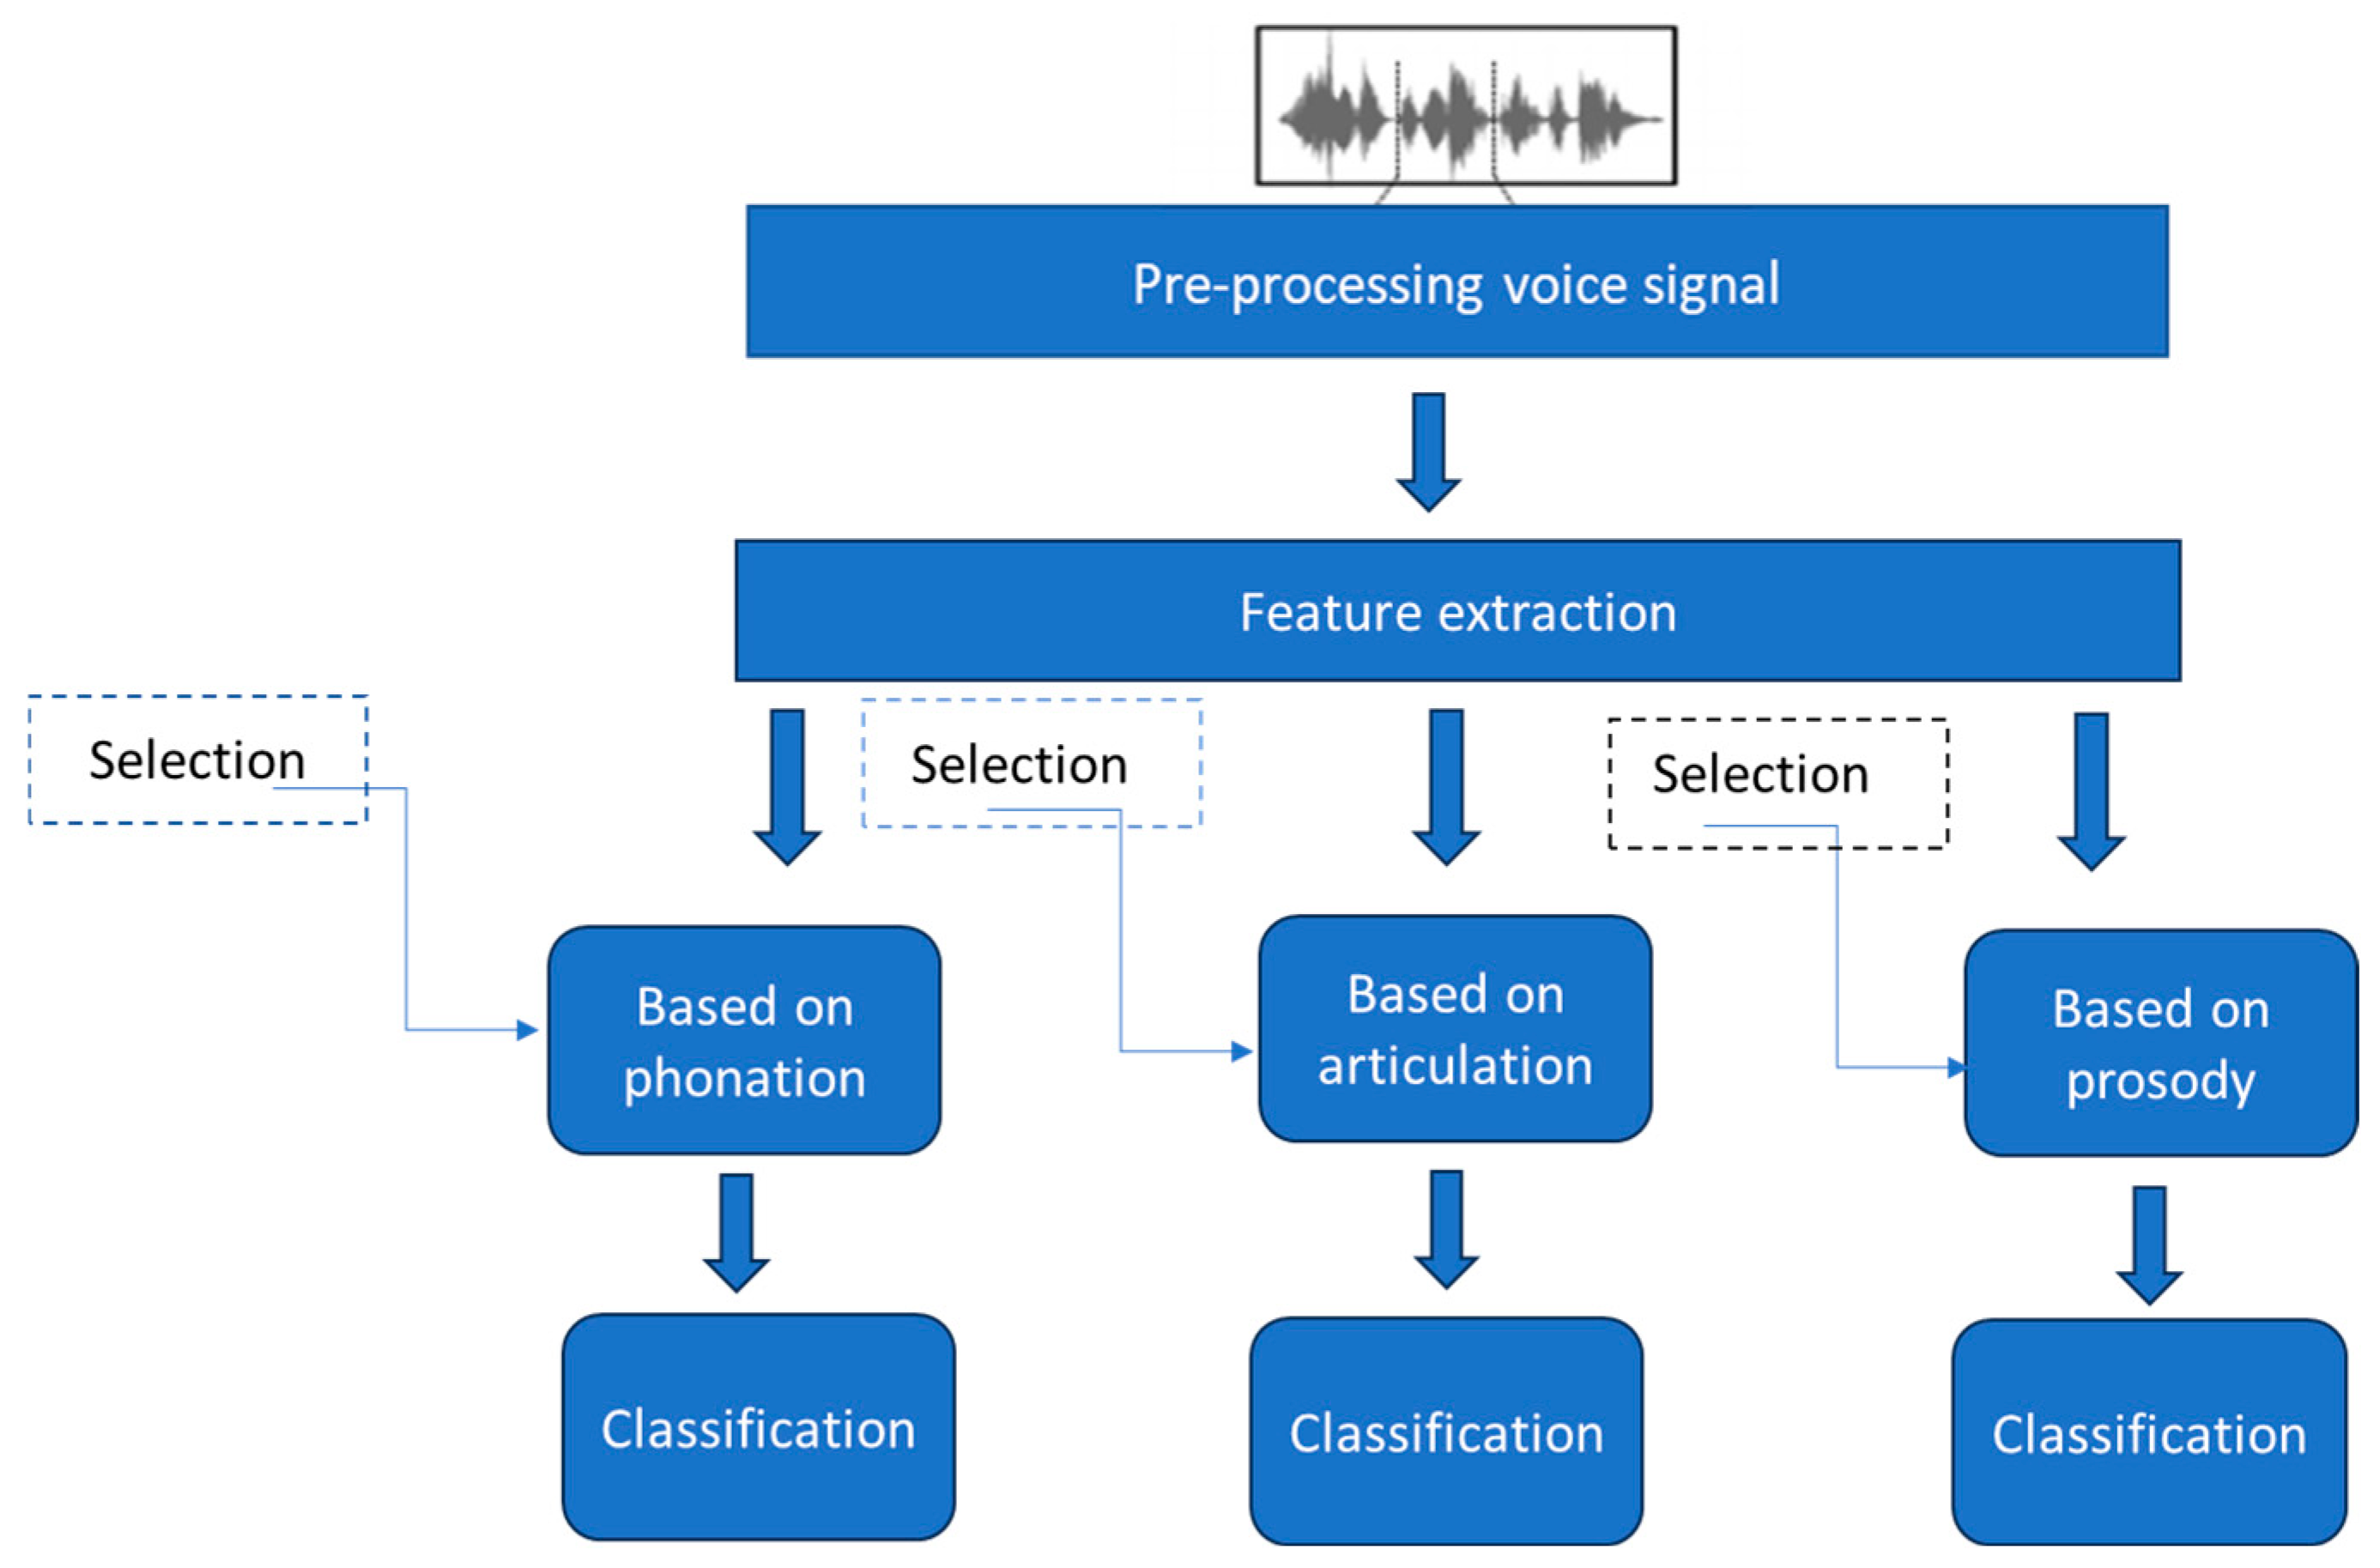
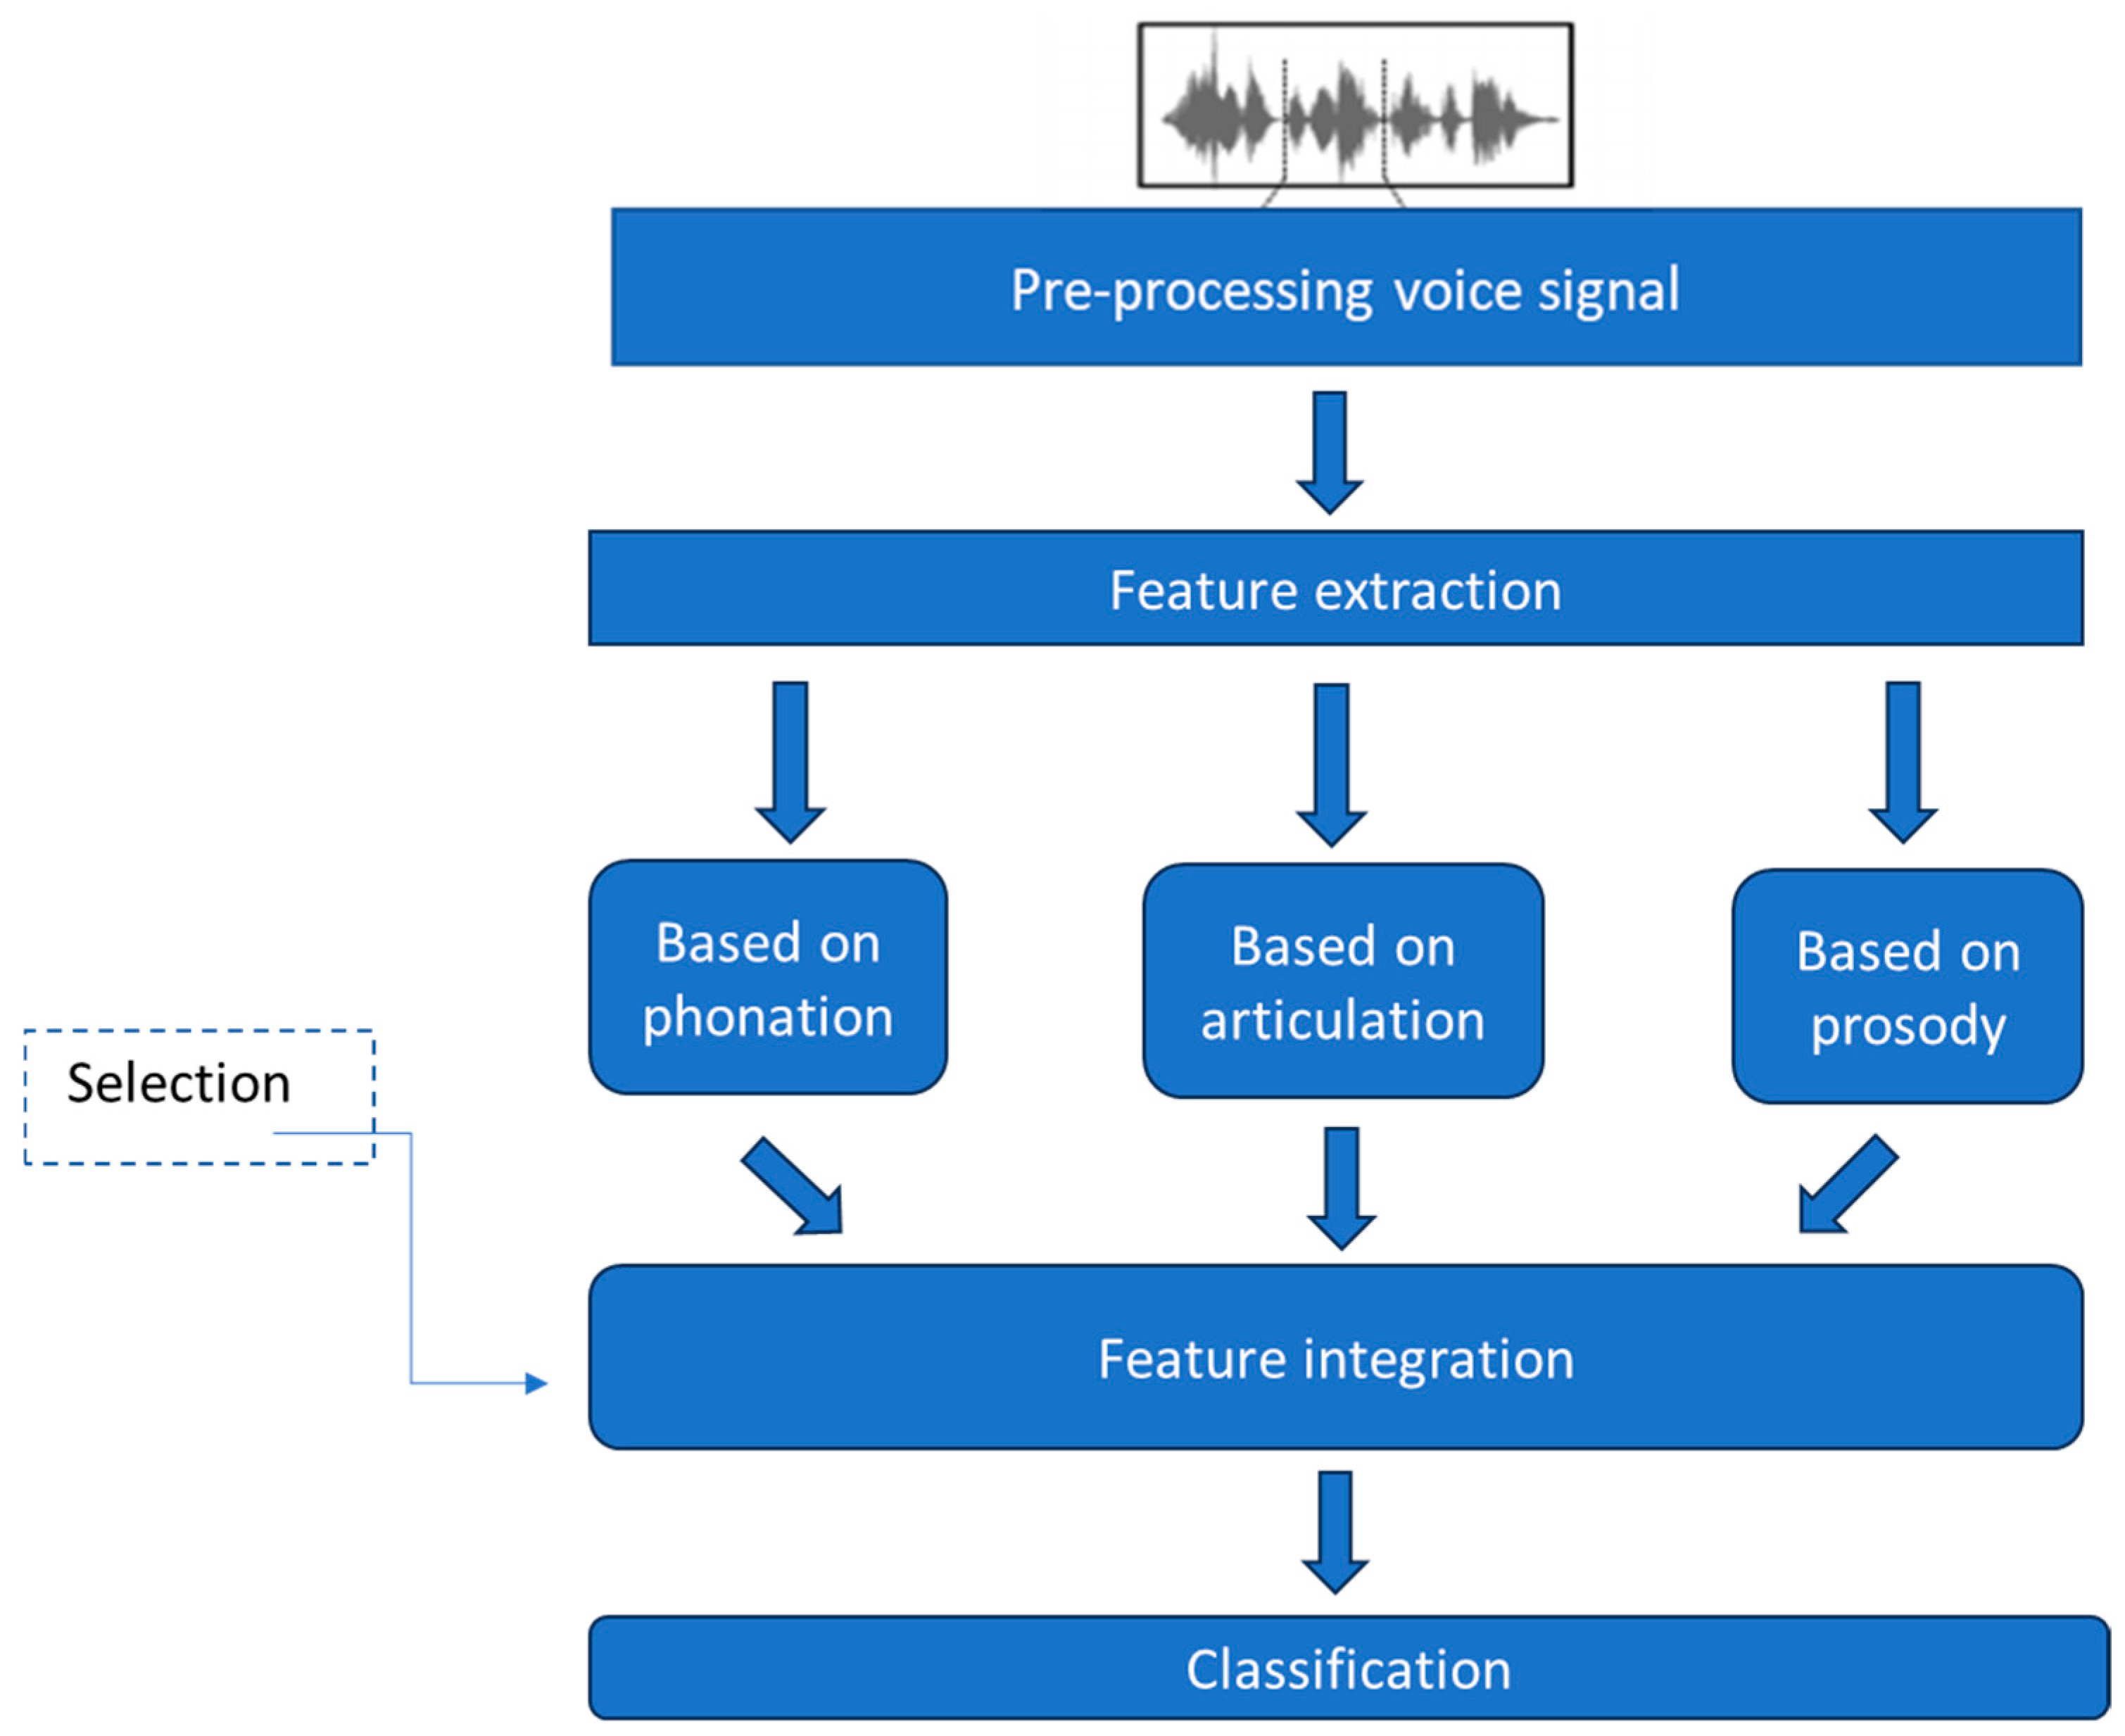
5. Architecture of the Proposed System

A typical identification system structure includes three stages. The first one is signal recording, including a pre-processing stage, followed by parameter extraction and classification. A diagram of the method proposed by the authors is shown in Figure 1. The extraction stage, which also includes the selection of features, is the most important work stage in terms of designing each identification system. The process is aimed at choosing such parameters of a recorded signal, so as to achieve characteristic features for each class of acquired sounds. The descriptors obtained will be used to define the target feature vector describing a given signal. The objective of processing sound signals with the use of an appropriate algorithm is to achieve distinguishing features of a given model. It is worth noting that the selection and fusion of the features must be repeated to obtain the optimal solution. If the robust feature vector is determined, we can use an easy classification method. This is the main aim of the authors’ research. The stage of parameterization of the signal is the most important because incorrect results at this stage cannot be corrected in further stages, even if complex machine learning methods were used.
To highlight the diverse nature of human speech, the experimental studies proposed by the authors involved, first of all, creating three separate detection PD systems, for which separate descriptor methods were applied, using a speech signal generation model. The next level of research is an attempt to integrate individual feature vectors from the subsystem, through tight data integration.

5.1. Pre-Processing

The developed algorithm concept requires one to first apply sequences of actions making up signal pre-processing. The standardization procedure assumed standardizing signals relative to their maximum values. The pre-processing process often also involves so-called sound file segmentation, which results in a speed signal division into short fragments called frames. The frame length of the speech signal was set at 40 ms. The overlap was 10 ms. A speech signal acoustic analysis, which aims at capturing changes in the excitation signal (i.e., sound generated directly by vocal folds), requires selecting a speech signal in terms of its sonority due to a commonly known speech signal generator model associated with the speech signal production/generation process. The detection of voiced sounds was achieved with the use of the autocorrelation function.
Voiced fragments are characterized by the occurrence of regular peaks (with a period of basic tone). The voiceless parts are similar to an aperiodic signal. In the system, the classification of the speech signal into voiced or unvoiced parts is performed using the autocorrelation function. To verify whether a sound is voiced, the second global maximum is determined and checks one level (the first maximum is zero). If the level is higher than a reference value pv, then this part is considered to be voiced; otherwise, it is deemed voiceless.
Another problem for the pre-processing stage is the detection of speaker activity. During registration, parts of the signal in which the speaker is not active occurred. The use of another parameter responsible for the rejection of frames without speech is aimed at eliminating the silence of the recording and the rejection of frames that are potential noise, which can cause erroneous feature extraction for the dedicated speech description. The authors decided to base their decision on the power of the variable component (the variance of the signal by threshold). If the level of power is higher than a reference value (pp), then this part is considered to be speech; otherwise, the frame is deemed silent.

5.2. Feature Extraction

The second stage of engineering a conceptual speech signal processing system for the purposes of early diagnosis of neurodegenerative diseases, after pre-processing, is speech signal parameterization, which is an attempt at extracting certain distinguishing descriptors of various representations that may reflect voice changes. As part of this analysis section, we have suggested employing the speech signal generation process.
From a technical point of view, a speech signal is formed as a result of the laryngeal tone plexus (phonation) and a vocal tract response (articulation) powered by the lungs [29].
s ( t ) = g ( t ) h ( t )
s(t)—resultant speech signal;
g(t)—stimulation;
h(t)—voice track.
Phonation is a process of human voice formation resulting from vocal fold vibrations due to exhaled air, and articulation is a process of shaping human speech sounds, which takes place in the speech apparatus part that includes the vocal tract, i.e., tongue, jaw, and cheek movements. The articulation determines the frequency response. The third mechanism of speech production is prosody, which defines the sound properties of speech, including the phonetic, syllabic and word sequences of utterances [80]. Parkinsonian dysarthria is a multidimensional impairment affecting all different aspects of speech, such as speech respiration, phonation, articulation, and prosody. PD can cause changes in the articulation and phonation of PD patients, wherein increases or decreases occur in some acoustic features [45].
The primary and basic form in which the speech signal is present is its temporal form. This form contains all the elements necessary for analysis and recognition, but the information is convoluted and is not clearly visible. If we want to focus on the specified mechanism of speech production, we have to remove the undesired ingredient by using the signal analysis method for the reconvolution signal (i.e., spectral analysis, cepstral analysis).
The experimental part of this study was carried out using an additional Matlab library, which allows for the analysis of acoustic signals in the time and frequency domains.
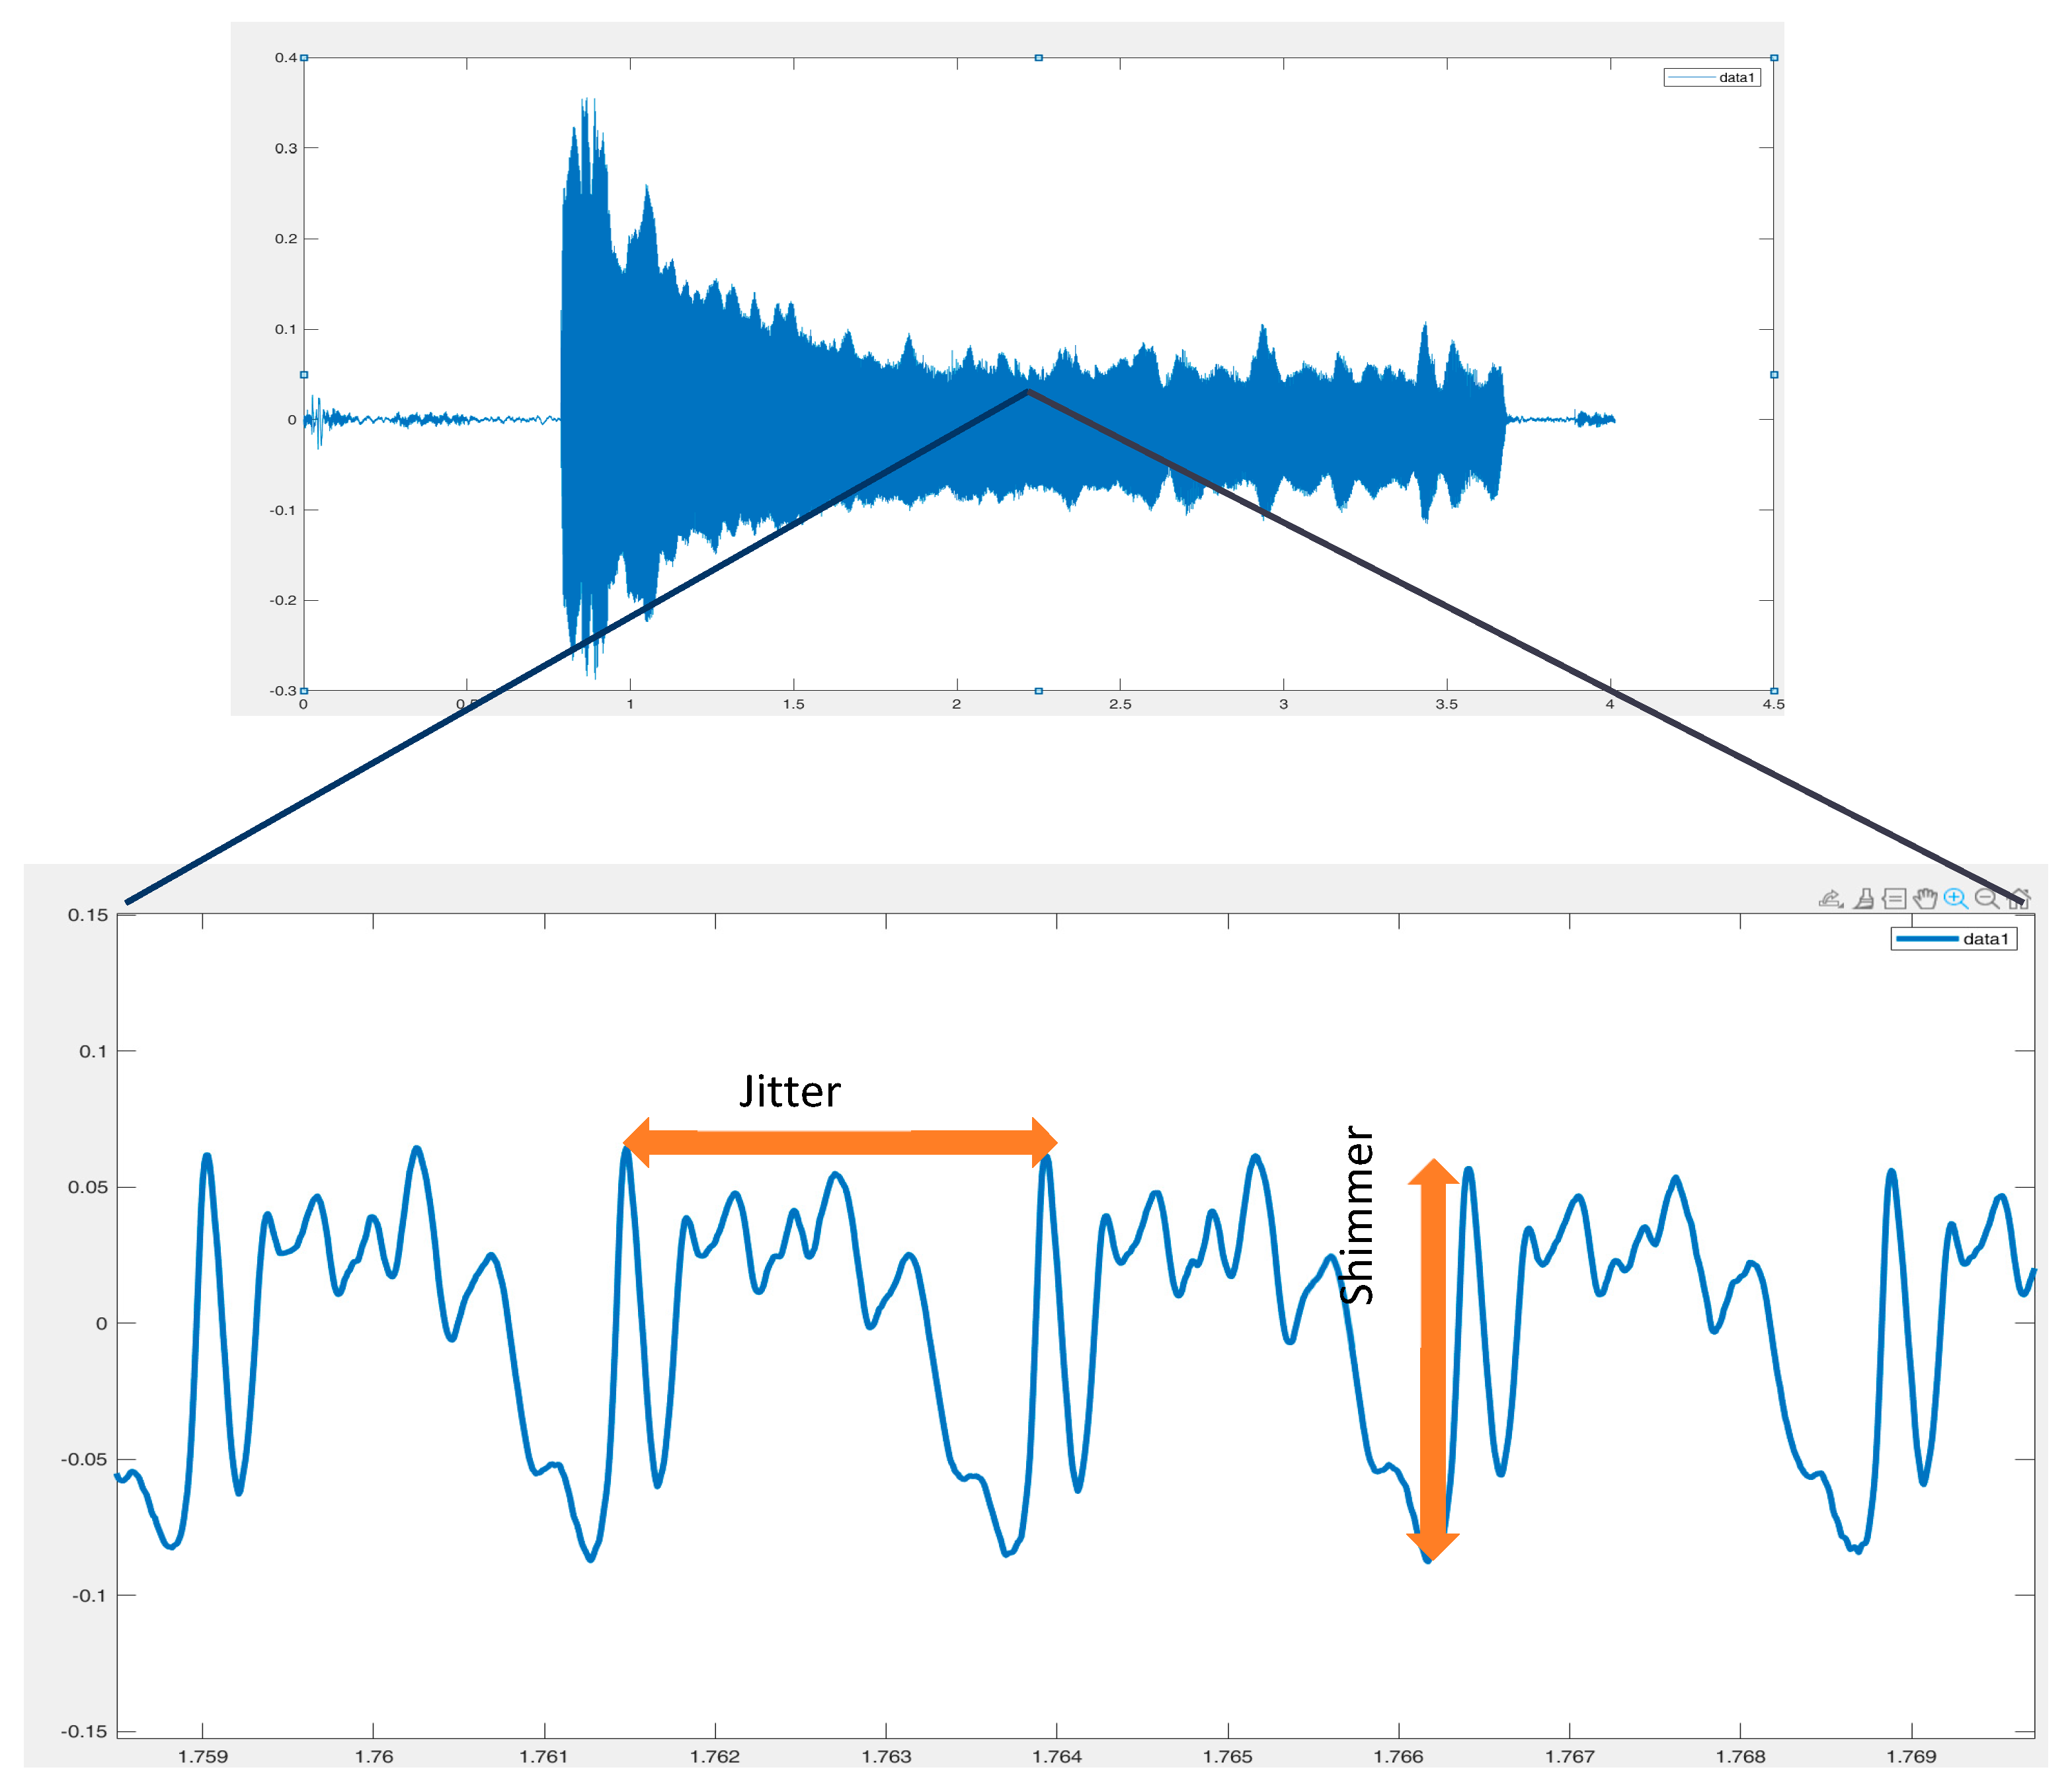
  • A. Evaluation of the phonation process
The phonation process is mainly defined by periodicity, noise content, and the phonation process’s non-linearity. Periodicity in speech covers the ability to generate a continuous flow of air during the production of vowels with prolonged phonation. To capture vocal fold vibration’s temporal and amplitudinal variations, phonation features are derived from voiced segments. The stability and constancy of such a flow through the vocal cords may be characterized in terms of parameters such as amplitude and/or frequency variability. The time interval between successive vocal fold closures determines the smallest repeatable sequence in a speech signal. This interval is called the fundamental period. The inverse of this period determines the fundamental frequency (F0) and is one of the most important parameters that characterize a voiced speech source. If we want to analyze non-linearity, we have to focus on ways of engaging sound sources in the form of the larynx and vocal tract airways (the filter). This occurs in two fundamentally different ways. The first is linear source–filter coupling, where source frequencies are produced independently of the acoustic pressures in the airways. The glottal airflow in the larynx is produced aerodynamically, with a quasisteady transglottal pressure and a flow pulse that mirrors the time-varying glottal area. The second is non-linear coupling, where the acoustic airway pressures contribute to the production of frequencies at the source. In the non-linear case, the transglottal pressure includes a strong acoustic component, much like in woodwind instruments where the airflow through the reed is driven by acoustic pressures of the instrument bore, or in brass instrument playing, where the lip flow is driven by the acoustic pressures in the brass tube. Non-linear source–filter coupling clearly indicates sound source instabilities, which are one of the symptoms of PD. The goal of this study is to detect manifestations of a source–filter non-linearity interaction appearing in the form of chaotic vocal fold vibrations. This is what the non-linearity phonation process means.
Figure 2 shows the voice waveforms of the sustained phonation of the vowel ‘a’ and the contour of the fundamental frequency. To achieve greater stability of this descriptor, we decided to calculate the fundamental frequency using two methods: the autocorrelation method and the cepstral method. From Figure 2, phonation analysis shows that the contour of healthy people is more stable than the contour obtained from PD patients. People with PD have lower vocal fold strength. This demonstrates the irregular work of the vocal folds and, more precisely, the irregular frequency of their opening and closing. As a result, impaired laryngeal operation is the case for people with Parkinson’s disease. This is particularly visible in the second half of the analyzed time period. People with PD have difficulty maintaining the utterance of a sound with the same pitch. This is caused by occasional loss of phonation in people with PD (whisper).
The following descriptors were used to evaluate the variability of the phonation process:
  • Jitter group parameters (Jitter [%], Jitta [μs], RAP [%], PPQ5 [%]);
  • Shimmer group parameters (shimmer [%], APQ3 [%], APQ5 [%], APQ11 [%];
  • PVI (pathology vibrato index).
Jitter, shimmer, and F0 parameters are directly associated with vocal fold vibration. These are the parameters most frequently used in voice apparatus analysis [81]. All healthy voices exhibit natural fundamental tone frequency variability characterized by a smooth vibrato and micro-vibrations, which are detected, e.g., using traditional jitter measures. These parameters can be analyzed under a steady voice producing a vowel continuously.
Jitter parameters are defined as a change in the basal frequency of the laryngeal tone. Jitter represents the average absolute difference between two consecutive periods of speech signal and is commonly referred to as Jitta. Local jitter is used to represent the average absolute difference between two consecutive periods divided by the mean period. Another parameter in this group is RAP, which represents the mean absolute difference of a given period and the average of a period with its two neighbors divided by the mean period. PPQn (pitch period perturbation quotient) parameters were also defined, defining the relative assessment of short- or long-term changes in the fundamental frequency within the analyzed voice sample, with a user-defined smoothing coefficient. The jitter is affected mainly by the lack of control over the vibration of the cords. The voices of patients with pathologies often have a higher percentage of jitter [81].
Shimmer parameters are defined as changes in the amplitude of a sound wave (speech signal) in successive cycles of vocal folds. A parameter called shimmer represents the mean absolute difference between the amplitudes of two consecutive periods divided by the mean amplitude. The parameters from the APQn group represent the quotient of amplitude disturbances over n periods, i.e., the mean absolute difference between the amplitude of the period and the mean amplitude of its (n − 1) neighbors divided by the mean amplitude. The higher the values, the greater the instability of the voice amplitude in the analyzed signals [82]. A representation of jitter and shimmer perturbation measures in speech signals is shown in Figure 3.
Another parameter is the PVI (pathology vibrato index). Vibrato means a rapid and regular fluctuation of the fundamental frequency of the laryngeal tone F0, which occurs during prolonged vowel phonation. The estimation of the extent of pathological changes in vibrato is based on the observation that for healthy voices vibrato lies at low frequency, while for PD patients it is characterized by presence of high-frequency components [83].
Voice analysis employs similar parameters, such as the harmonics-to-noise ratio (HNR) and the noise-to-harmonics ratio (NHR). Their main objective is to detect uncontrolled movements of the vocal folds and their incomplete closure. This parameter is associated with the perception of roughness and hoarseness of the voice [45].
The physiological motivation for this group is that incomplete vocal fold closure leads to the creation of aerodynamic vortices which result in increased acoustic noise. The evaluation between the two components reflects the efficiency of speech, i.e., the greater the flow of air expelled from the lungs into the energy of the vibration of the vocal cords. In these cases, the HNR will be greater. A voice sound is thus characterized by a high HNR, which is associated with a sonorant and harmonic voice. A low HNR denotes an asthenic voice and dysphonia [45].
Some researchers try to determine the threshold of these parameters in order to unambiguously classify pathological voices. Unfortunately, many factors mean that there is no clear boundary that allows for the identification of a pathological voice. A person’s gender, the way a person used their tongue on a given day, the sound pressure level, the highly variable acoustic environment, and a number of other aspects make it difficult to develop standards that we can use [40,83]. For example, according to Vizza et al. [41] and Holmes et al. [42], NHR is higher for PD patients compared to healthy controls.
One of the common voice symptoms in patients with PD is impaired control of the pitch of the voice during prolonged phonation. It is difficult to distinguish natural healthy tone shifts and dysphonic shifts caused by PD using classic parameters. One of the reasons regards the extent to which natural variation is related to the average voice pitch of the subject. Speakers with naturally high-pitched voices will have much larger vibrato and microtremor than those with low-pitched voices, when these variations are measured on an absolute frequency (in hertz) scale. For this reason, the authors of [84] introduced a new measure of dysphonia (pitch period entropy) (PPE), a robust measure sensitive to observed changes in speech specific to PD [85]. The entropy of this probability distribution [43] then characterizes the extent of (non-Gaussian) fluctuations in the sequence of relative semitone pitch period variations. An increase in this entropy measure better reflects the variations over and above natural variations in pitch observed in healthy speech production [84]. It is robust to many uncontrollable confounding effects including noisy acoustic environments and normal, healthy variations in voice frequency. Another method to estimate F0 contour-based parameters is PFR (phonatory_frequency_range) [86]. It is defined as the semitone difference between the lowest (f0 low) and highest (f0 high) fundamental frequencies [87]. The final parameter, PPF (pitch_petrurbation_factor), only describes the voiced part of speech [88]. The numerator and denominator represents the pitch values greater that the given threshold and the total number of extracted pitch values, respectively.
P P F = N p t r e s h o l d N × 100
Non-standard methods in combination with traditional methods can be optimal and robust in their ability to separate healthy subjects from PD subjects.
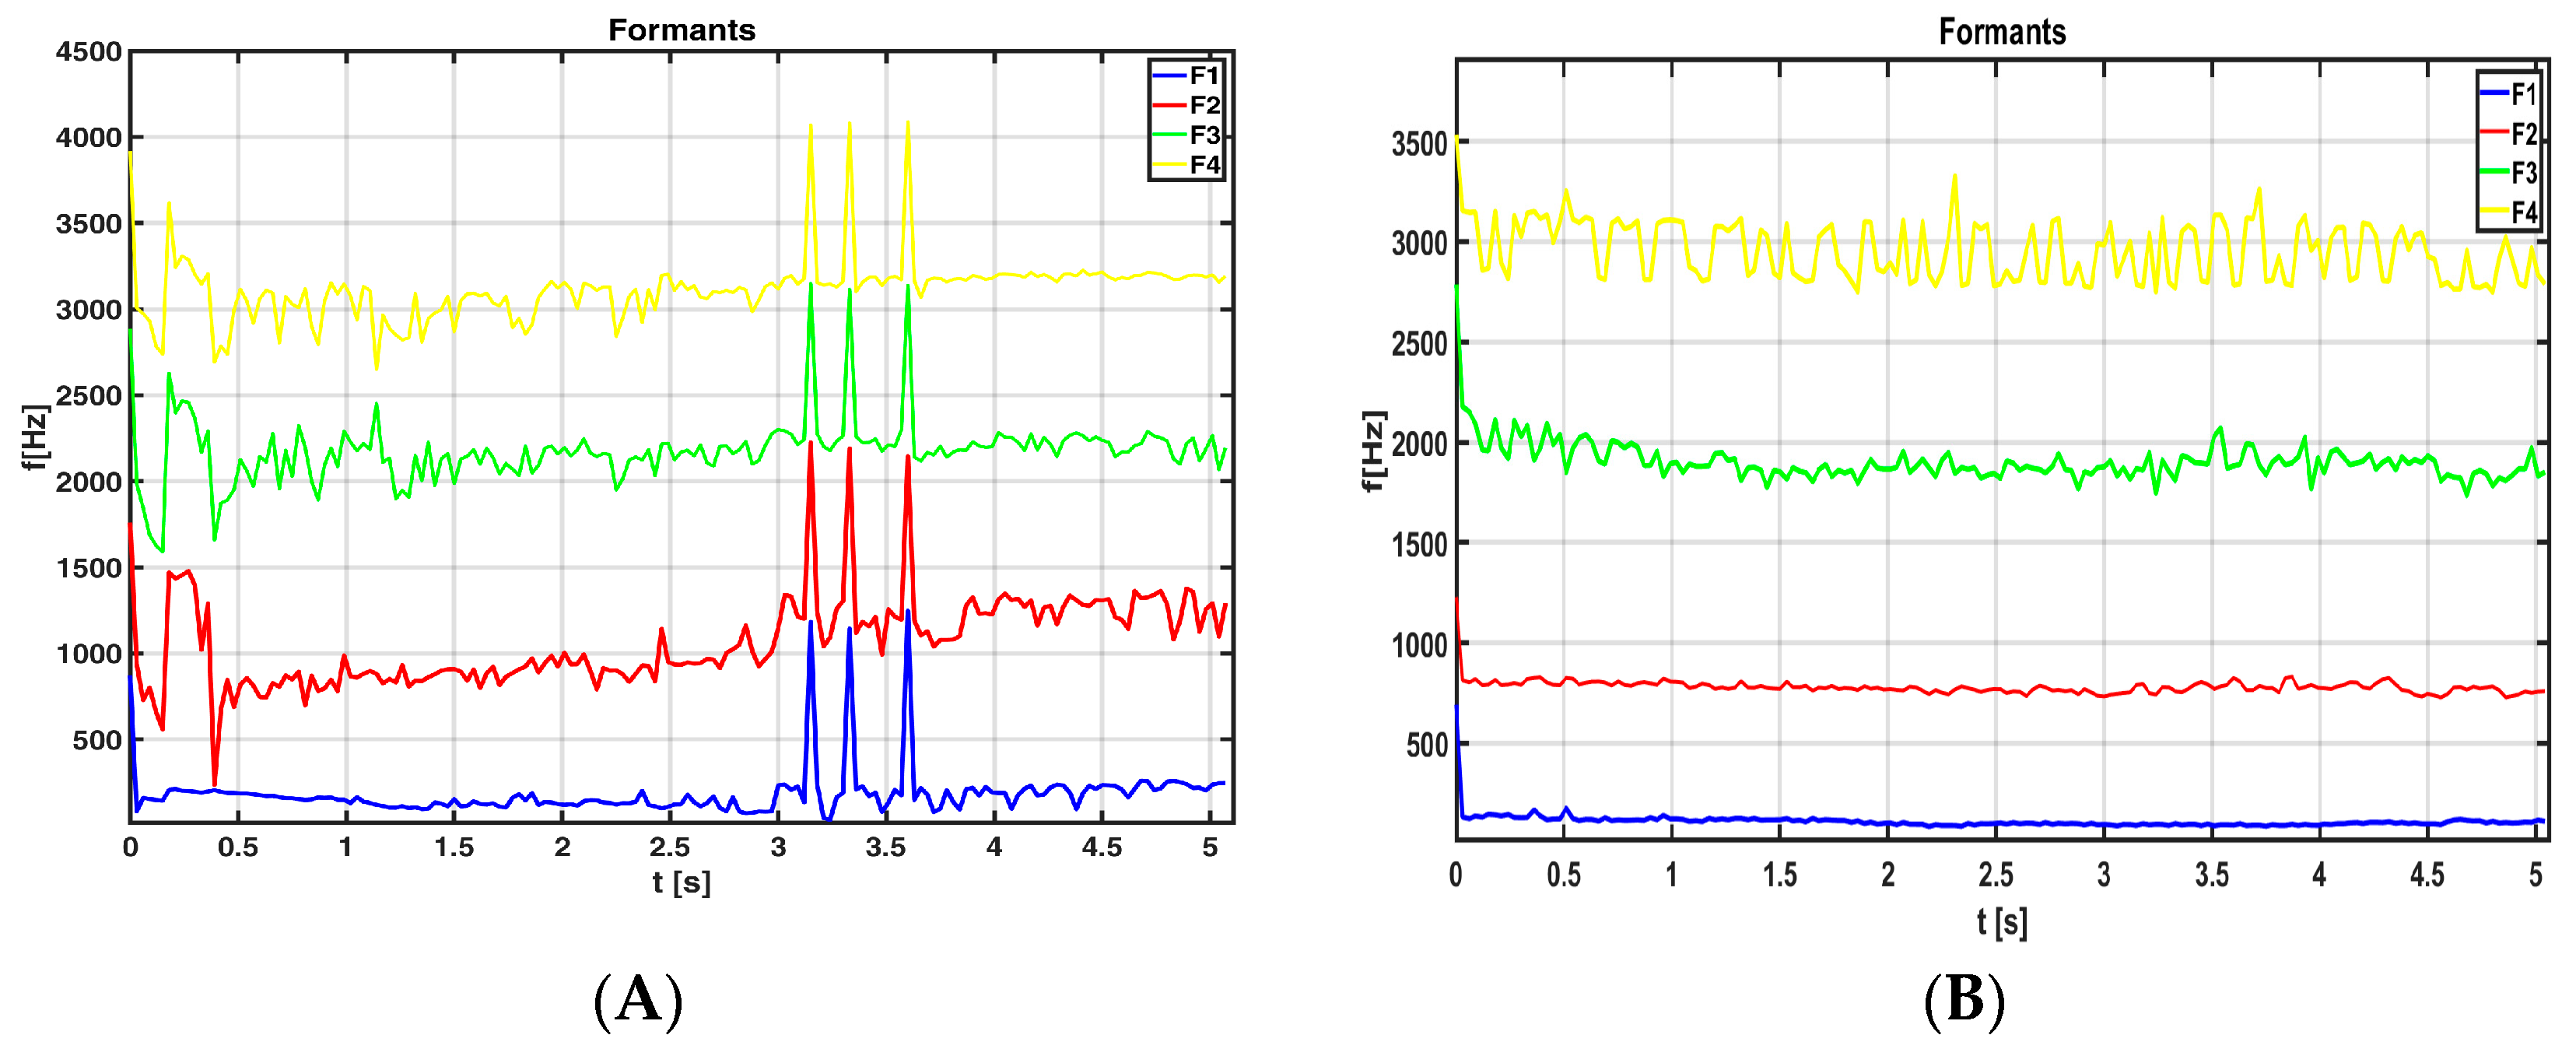
  • B. Assessment of the articulation process
Articulation analysis can be performed with sustained vowels or with continuous speech signals. The articulation process is assessed primarily through the following:
  • Evaluating resonant cavities within specific frequency bands (formant analysis);
  • Speech signal frequency analysis.
Formants reflect the physical characteristics of the sound channel (resonant cavity). Different studies have revealed significant differences in the formant frequencies of different vocalized syllables between PD patients and controls [58,89]. Vowels are formed primarily by movements of the tongue, lips, and jaw, creating oropharyngeal resonating cavities, which amplify certain frequency bands of the voice spectrum. These harmonics are called “formants” [60]. The position of the articulators therefore defines the three-dimensional characteristics of the vocal tractus and influences the formant frequencies [59]. Since formants reflect, to some extent, the position of the tongue, a reduction in the articulation extension of this articulator can subsequently affect the frequency range of the formants. The formant location within the frequency axis is closely related to vocal tract resonant frequency values and depends on its shape. The mid-frequency of each formant is different and closely associated with the vocal tract shape. It depends both on the uttered vowel and the individual traits of the speaker. The frequency of the F1 formant is affected by the position of the tongue in the oral cavity. The formant value F2 is determined by the forward–backward movement of the tongue. The F3 and higher formants depend mainly on the length of the vocal tract, while their resonant frequencies change slightly when uttering various vowels [80,90]. Figure 4 shows the contour of the formants corresponding to patients with PD and healthy subjects. It should be emphasized that diagnostic information can only be sought when analyzing the stability of changes in selected formants and not their sole values, for which, according to claims in the literature, there is a relatively wide frequency range. Please note that the position of the formants on the frequency axis is closely related to vocal tract resonant frequency values and depends on its shape. The mid-frequency of each formant is also closely associated with the vocal tract shape. The waveforms of the formant variability in F1 and F2 demonstrate a significant difference between healthy and PD patients. The waveform for a physiological voice is almost stabilized and has a roughly similar nature to a linear waveform, while when values for a pathological voice do not assume constancy, it is characterized by high variability. Considerable changes for the range of both voices can be observed for the F3 and F4 formants. Less distinctive “formant” generation is cause by the reduced range of articulator movements in PD, leading to impaired vowel articulation. The change in the position of the tongue and the characteristics of the cavity will affect the frequencies of formants [89].
Frequency analysis employs spectral parameters to describe the spectral centroid, spectral crest, spectral decrease, spectral entropy, spectral flatness, spectral flux, spectral kurtosis, spectral rolloff point, spectral skewness, spectral slope, spectral spread. These kinds of descriptors give clear information about the spectrum shape. The spectral centroid is a measure that indicates the central frequency or “balance point” of a spectrum. The spectral centroid is identified with perceptual properties such as the brightness and sharpness of sound. The spectral crest is a descriptor that defines the so-called spectral ridge signal. In other words, the descriptor measures the relationship between the highest point in a spectrum and the average value of the spectrum [91]. A crest factor of 1 means that there are no peaks. Higher values of this parameter indicate peaks. For example, sound waves tend to have high crest factor values. Spectral flatness is the ratio of the geometric mean to the arithmetic mean of the spectrum. The task of this descriptor is to capture the presence of a large number of peaks in the spectrum. It will assume larger values for sounds showing harmonics or consisting of many distinct individual tones. Spectral kurtosis is a descriptor that defines the measure of the flatness of the spectrum distribution around its mean value [92]. Statistically, it is a fourth-order moment. Spectral entropy gauges the peakiness of the spectrum. The spectral rolloff point is a descriptor that determines the frequency below which 95% of the signal energy is contained. Spectral skewness gives a measure of the spectrum distribution asymmetry around its mean value. The spatial slope has been used in speech analysis, especially in modeling speaker stress [93]. The slope is directly related to the resonant characteristics of the vocal folds. Spectral spread calculates the standard deviation around the spectral centroid and represents the “instantaneous bandwidth” of a spectrum. Spectral crest measures the relationship between the highest point in a spectrum and the average value of the spectrum. Spectral decrease measures the extent of the spectrum decrease, focusing on the slopes of the lower frequencies. Spectral rollof point measures the bandwidth of the audio signal by determining the frequency bin under which a given percentage of the total energy exists. Spectral flatness calculates the ratio between the geometric mean and the arithmetic mean of a spectrum. Spectral flux measures the variability of a spectrum over time. Spectral kurtosis quantifies the flatness or non-Gaussianity of a spectrum around its center frequency [94].
The last articulation assessment stage involves parameters that measure the range of sonority of the speech signal. A healthy person with a physiological voice, who utters a prolonged vowel, should not have problems with maintaining phonation for a longer period. However, some people with a disease-weakened voice may find it difficult to perform such a task. PD patients produce abnormal unvoiced sounds and have difficulty beginning and/or to stopping vocal fold vibration [39]. The voice signal is described using parameters that determine the so-called voice signal sonorousness in order to investigate if, and to what degree, the examined person experiences this issue.
These include the following:
  • Fraction of locally unvoiced pitch frames, which defines which part of the analyzed speech signal is unvoiced;
  • Sonorousness coefficient, which is the quotient of voiced to unvoiced frames in the analyzed speech signal.
The fraction of locally unvoiced pitch frames is detected by the pp level described in Section 5.1. The sonorousness coefficient, which is the quotient of voiced to unvoiced frames, is defined as follows:
sonorousness   coefficient = n u m b e r   o f   v o i c e d   s p e e c h   s i g n a l   f r a m e s n u m b e r   o f   a l l   s p e e c h   s i g n a l   f r a m e s
To detect voiced frames of speech, the autocorrelation function with the pv level indicated in Section 5.1 has been used. Our preliminary research study determined that the difference in this descriptor is caused primarily by weaker operation of the vocal folds, as well as by the stiffness of the oral cavity, pharynx and larynx muscles, in those patients [95]. Furthermore, it can be caused by the issue of generating voiced consonants like “b” and inaccurate articulation in patients with PD [3].
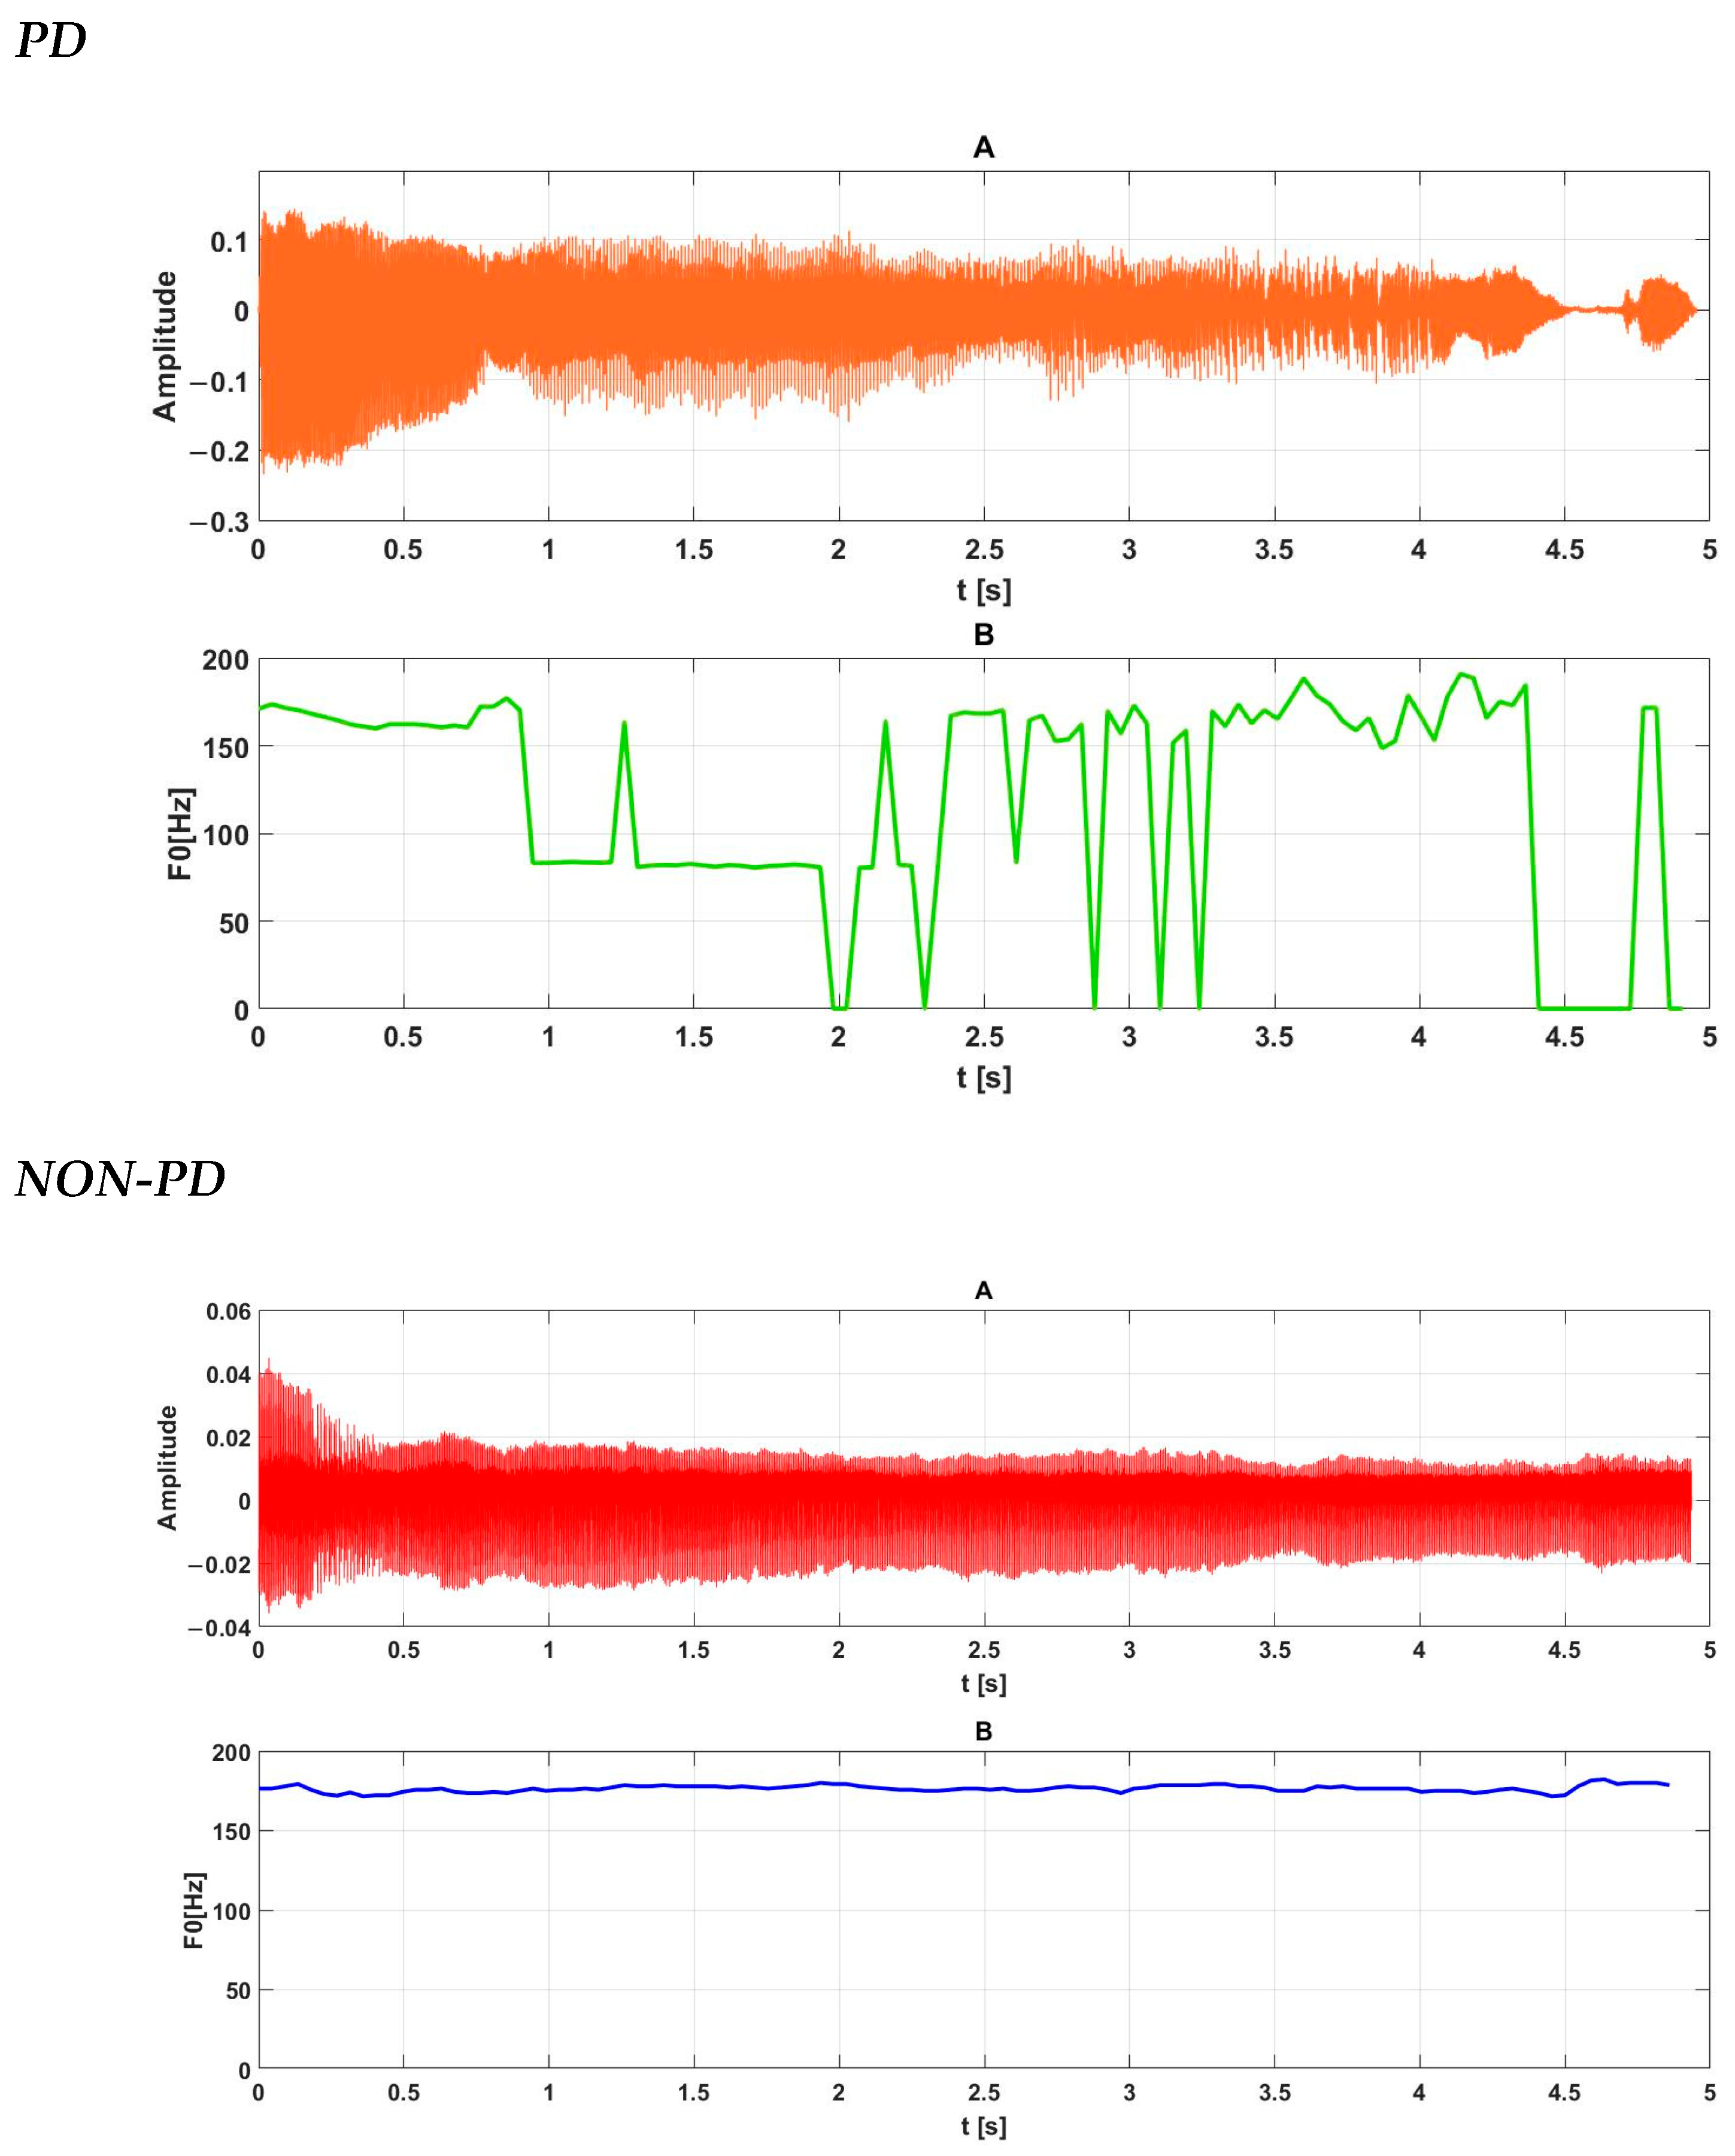
  • C. Prosody process assessment
Due to its numerous functions, speech prosody is a very important component of the linguistic communication process. For example, prosody organizes statements while having a similar role to punctuation in written texts; simultaneously, employing prosody enables emphasizing a word or a part of a message that the speaker considers important. Furthermore, prosody conveys information on the speaker’s attitude and emotional state. The aspect of prosody is often omitted in speech or speaker recognition systems; however, it can constitute a very important factor improving the effectiveness of such a system when used in a speech-based system to identify Parkinson’s disease.
Evaluating the prosody process in patients with Parkinson’s disease requires analysis of the so-called free text uttered by the subject. This is particularly important when assessing emotional prosody in people with diagnosed PD. Prosody is commonly evaluated with measures derived from the fundamental frequency, the energy contour, and duration. Changes in this aspect of speech are manifested by difficulties in expressing emotion and repeating sounds or syllables [9]. Speech signal prosody is implemented by such prosodic features as the following, among others:
  • Fundamental tone (laryngeal, F0), or more specifically, an analysis of the changes in this parameter for a specific recording;
  • Individual recording durations, including the duration of a sad statement or the duration of a joyful statement;
  • The number of “pa” syllables uttered during a 5 s speech fragment;
  • The duration of the intervals between “pa” syllables.
First of all, it should be noted that prosody information is difficult to model, and solutions are still being sought to overcome the problem of prosody in the context of automatic recognition systems. In PD disorders, speech is generally laborious, with a need for frequent breath intake and poor breath support. This results in frequent pauses and disfluency. Silence, including its presence and duration, has a role to play, in that it is directly implicated in some prosodic effects (boundary, hesitation) and needs to be controlled for in the calculation of speech tempo and rhythm. The prosody in this research is understood as lengthening or shortening the duration of a sound. This is the reason why the rapid repetition of /pa/ and the interval between such sounds has been used in this investigation.

5.3. Feature Selection

Four extracted features—phonation, articulation, prosody, and their fusion—were compared. Table 2 summarizes all the calculated characteristics in proposed system along with the typical voice disorders in Parkinson’s disease.
The descriptors defined at the stage of generation of the features of each of the subsystems constitute the maximum set of features that describe a given problem. Nonetheless, given the very large number of measures of dysphonia, as a main symptom of PD, it is computationally infeasible to test all possible combinations. Having a large number of characteristics is a very serious problem. It increases the computational complexity of the algorithm and its memory requirements, extends the learning process, and increases the complexity of the classifier itself. However, most importantly, it also often causes a decrease in the number of correctly classified objects. The selection of features consists of selecting the best signal parameters in terms of distinguishability. Unfortunately, nothing short of a full, exhaustive (but intractable) search is guaranteed to produce the optimal feature set. As a compromise, in this study, we first apply a pre-selection filter in a separate system and then we employ the SFFS method (sequential floating forward), Relief, Fisher Score, F-tests, and Chi-square in integration feature sets [96,97].

5.4. Classification

The proposed solution is based on two different classification units, the support vector machines and the k-nn method. The k method of nearest neighbors (k-nn), despite its simplicity, provides surprisingly good results in some applications. Its undoubted advantage is the naturally solved issue of discriminating against many classes. It only uses the distances between objects, understood as their similarity in terms of specific features. The number k is a hyperparameter, and like other hyperparameters in machine learning, there is no rule or formula for determining its value. It is best to determine it experimentally, by evaluating the prediction performance for different values of k.
SVM is one of the most widely used ML algorithms and is based on statistical learning theory. The key strength of an SVM classifier lies in its ability to identify an optimized decision boundary representing the largest separation (maximum margin) between classes. The creation of the optimal hyperplane is influenced by only a small subset of training samples, known as support vectors (SVs), which are the pivotal data structure in an SVM. This means that the training samples that are not relevant to the SVs can be removed without affecting the construction of the SVM’s decision function, that is, the optimal hyperplane. The choice of an appropriate kernel function can significantly impact the performance of SVMs. We decided to use a support vector machine because this method is known to prevent overfitting.

5.5. Integration of Subsystems

The idea proposed by the authors of the construction of three subsystems and their combination allows for a strict design of a multimodality system based on the diverse nature of the speech signal. The idea of strict integration is to combine representations that are obtained from multiple sensors, and consequently, the decision is made on the basis of the total vector of features. In this aspect, we assume that the presence of different sensors means different speech tasks for one person. This type of integration assumes the fusion of input data at the beginning of the system’s operation. Thus, matrices of phonation, articulation, and prosody descriptors were combined into one matrix containing all generated descriptors. The outcome of the conducted experiments is an attempt at identifying a speech signal pattern, assuming the diversity of its existence source. This will be used to develop the final design of a multimodal system characterized by the highest possible PD detection efficiency [98].

6. Experiment

The experimental methodology was based on analyzing the speech signal by employing its defined generation levels. The quantification of each of the processes requires their parametric description. The experiments conducted as part of the research concentrate on 3 issues. First of all, we conducted tests with a distinction of three separate speech aspects and evaluated classifier quality based on a selected speech signal generation process. The block diagram of the conducted acoustic analysis is shown in Figure 5. Due to the fact that information is extracted based on various aspects of speech signals, additional utilization of different recordings for this purpose provides vast opportunities for studying optimization of the resultant feature vector.
The second stage of the research was the application of selection descriptors. The selection of features involves reducing the original feature vector by selecting a subset of features from the original feature set. It should be stressed that this case requires establishing a criterion to serve as the selection base. This stage involved defining selections at the feature generation level for three separate subsystems. The SFFS method (sequential floating forward) was applied together with the k-nn and SVM classifier [96]. The first step within the applied method is to select one of the features. This is achieved by verifying the classification error for each of them separately. The feature that is characterized by a classification error is added to a previously created set of features. Further features are added to the previously created set in subsequent stages [97]. The feature vectors were normalized by centering and dividing the value of their elements by standard deviations of the training data. In order to verify which of the distinguished classifiers is characterized by better properties, different hyperparameters have been determined for them. The number of neighbors in the k-nn method was limited only to k = 1 because preliminary research showed that increasing the number of neighbors caused an increase in testing error. The research was carried out using 4 different types of distance (Euclidean, Minkowski, Chebyshev, Spearman). The classification process using the SVM (support vector machine) algorithm was carried out with 4 different kernel functions (Linear, Cubic, Gaussian, Quadratic). The fitcsvm function available in the Matlab environment with a different type of kernel was used. The other parameters were set as default.
A third aspect of this research is an attempt to integrate individual feature vectors through tight data integration [98]. This case involves a large number of features, which is a very serious problem. It increases the computational complexity of the algorithm and its memory requirements, expands the learning process, and leads to higher complexity of the classifier itself. However, most importantly, it often also causes a decrease in the number of correctly classified objects [96,98]. It is associated with the so-called “curse of dimensionality”. Therefore, this requires the feature selection process, which involves reducing the original feature vector by selecting a feature subset from the original feature set. It should be stressed that this case requires establishing a criterion to serve as a selection basis. We employ ranking methods for the following features: Relief, Fisher Score, F-tests, and Chi-square [97].
The diagram of experimental tests following this methodology is shown in Figure 6.
Due to the low amount of data, a cross-validation technique was used to avoid the risk of assessments being too optimistic and unreliable. This method involves random division of the entire dataset into N folds of equal size. Next, a single fold is used to validate the model, while the remaining subsets are used in training. The process is repeated K times so that all data are used in testing and training. In this research, the 10-fold cross-validation was preserved, the data pool acquired from 40 people was used in training, and data from 4 people was used in the validation. At the same time, the requirement for the data of people from the validation group excluded from the learning group was satisfied.
The classification results were expressed according to the nomenclature preferred by physicians, such as sensitivity (Se) and specificity (Sp):
S e = T P T P + F N · 100 %
S p = T N T N + F P · 100 %
The metrics in the above equations are taken from the concept of a confusion matrix. This is a simple cross-tabulation of the actual and recognized classes and allows us to easily calculate the classifier parameters. Its diagonal cells denote the number of people (TP) correctly classified as sick and the number of people (TN) correctly classified as healthy, while the off-diagonal cells contain the number of people classified incorrectly. FP stands for healthy cases classified as sick and FN stands for sick ones classified as healthy. ACC is understood as the number of all correct diagnoses related to the number of all people, i.e., people from the control group and the research group.
A C C = T P + T N T P + T N + F P + F N · 100 %

7. Results of Experiments

The results of the numerical experiments will be presented according to effectiveness based on the following subsets:
  • Subset 1—three separate systems based on full dimensional vectors of various models of speech;
  • Subset 2—three separate systems based on vectors of selected feature of various models of speech;
  • Subset 3—raw feature integration data using the features of subset 2;
  • Subset 4—feature integration after the selection of subset 3.

7.1. Effectiveness of Individual Model

The classification effectiveness for individual tests is shown collectively in Table 3. The testing data are normalized by subtracting the mean of the training set and dividing by the standard deviation of the training set for each feature. The results at this stage of the research show the best recognition obtained using different the types of kernel in the SVM method and different distances in the k-nn method (described in Section 6). Almost all classification systems produced results which are significant, but the phonation and articulation system seems to be the best choice. The best recognition result (accuracy 87.8%) is achieved when we use a system based on the speech articulation model with 1 nn classification. However, the highest sensitivity result is achieved by the speech phonation model. Using the SVM classifier, the system achieved 100% recognition. In order to obtain the parameters that are of the most significance, task feature selection is used.

7.2. Feature Pre-Selection

As part of feature selection using the SFFS method, the authors generated a different number of significant features from the perspective of the analyzed experiment for each of the subsystems. As a consequence, the size of individual feature vector matrices for speech signal models was reduced. The feature vector of the phonation system contains 5 vectors out of 20 features after selection. The feature vector of the articulation system contains 9 out of 15 features after vector selection. And the prosody system contains two vectors after selection. The classification effectiveness for subset 2 is shown collectively in Table 4. A general improvement of classifier quality can be observed when selecting features under each of the speech signal modeling techniques defined as stand-alone systems. The dominant processes with the highest classifier effectiveness are still phonation and articulation. The operating efficiency of a system based on the prosody process was also increased when using the SVM network.

7.3. Raw Feature Integration

The results of data integration were presented, first of all, in the case of applying loose feature integration after pre-selecting features as part of pre-defined separate systems for PD identification. An 11-component feature vector was obtained at the feature pre-selection stage, taking into account the features generated based on three speech signal generation aspects (phonation, articulation and prosody) obtained at the feature pre-selection stage. Classifier effectiveness is shown using the error matrix in Figure 7. A confusion matrix represents the prediction summary in matrix form. It shows how many predictions are correct and incorrect per class. It helps in understanding the classes that are being confused by the model as belonging to another class. The column on the far right represent the percentages of all patients recognized as belonging to each class that are correctly (blue) and incorrectly (orange) classified. Naturally, the values in blue are sensitivity and specificity, respectively [98].
The obtained results enable a conclusion that a feature vector structure involving a simple combination of features generated based on different speech signal modeling systems does not cause a significant increase in system accuracy. It is most probably associated with the fact that the selection process in feature subsets is related to a specifically preset feature vector, optimizing it in relation to the applied classifier. Therefore, the structure of the feature vector at the property fusion level should be defined based on a separate process of selecting features dedicated to the new set of descriptors. The usefulness of features selected based on a separate speech signal generation aspect is high, but only in relation to this specific task. Combining them will lead to a change in usefulness within a fusion-based system. The essence of these approaches is different.

7.4. Feature Integration After the Selection of Descriptors

Table 5 and Figure 8 show the significance ranking for individual models, taking into account different feature usefulness evaluation methods. The study aimed to highlight the differences in the rankings obtained using each procedure. Additionally, the colors in the table mark five features with the best significance indicators for each of the methods.
In this case, the subset of the most significant features for the Relief procedure contains the following attributes: 1, 2, 3, 6, and 8. Such a subset for the Chi-square contains features 1, 3, 6, 8, and 9, with features 3, 6, 8, 9, and 11 in the case of the Fischer score method. In turn, the subset for the F-test method involves descriptors 1, 3, 6, 8, and 9. The high similarity of the Chi-square and F-test methods means that the features distinguished through these techniques are almost equally arranged by significance. In the case of each of the rankings, it is possible to distinguish hypothetical subsets, where feature significance values are close to each other within a subset, while being greatly different from feature significances in subsequent subsets.
When analyzing the results obtained, it can be seen that each of the methods provides a different significant feature ranking. However, it is evident that the results obtained exhibit certain similarities. Descriptors d3, d6, and d8 appear as significant features, narrowing down to the five most significant features for each method. Moreover, the descriptors d1 and d9 appear three times in the feature ranking. They assume the occurrence of significant features for a minimum of three out of four methods. This enabled the practical construction of a pre-selected subset in one variant due to the repeated feature acronyms for different methods. Five features defining the final feature vector were selected. The performance of different recognition methods, taking into account different types of kernel function and different types of distance in the 1-nn method, has been shown in Table 6.
In the SVM method, a Gaussian kernel seems to be optimal because another kernels cause an increase in testing errors. In the k-nn method, the Chebyshev distance gives the best result. The error matrix of the best result for every kind of method is shown in Figure 9.

8. Discussion

In this work, different vocal feature subsets were merged to select an optimal subset of features, with attributes from three different subsets.
The most reported performance metric is accuracy, followed by ROC and AUC. Unfortunately, sensitivity and specificity have been mentioned only in a few studies.
Most of the phonatory approaches provide accuracy ranging between 75 and 90% [39]. In the case of articulatory approaches, accuracy ranges between 80 and 95% [55,99,100,101]. Furthermore, some articles that include the results of phonatory and articulatory approaches applied to the same corpus [64,102] suggest that the articulatory aspects have better discriminative properties than the phonatory aspects.
The results obtained within this experiment show that the features generated based separately on the phonation and articulation process are characterized by the highest diagnostic accuracy, reaching 88–90%. With speech modeling using only phonation information, a system for PD recognition was achieved with the best sensitivity rate—100%. The results obtained are comparable to the results of others in studies with similar methodology, but the authors used a much smaller number of features. What is more, this is very important since the authors have demonstrated value in the use of k-NN and SVM at a time when many researchers seek more complicated machine learning methods, often unnecessarily [103,104].
The prosody aspect is still limited in performing objective analysis based on the Polish corpora. It is very important to compare within the same language in this kind of research. Our PD recognition rate using a prosody system is medium (65–70% is achieved). The best result is 75% sensitivity using SVM methods in our research. In [105], the accuracy is 62.86%, the sensitivity is 63.00, and the specificity is 62.71. Another work reported 58% accuracy, sensitivity of 70.5, and 28% specificity [106].
These subsets of features were used to create a new system based on descriptor loose integration, which is a classic combination of descriptors generated at the phonation, articulation, and prosody analysis stage. It involved obtaining an 11-component feature vector. The initial results of PD recognition lead us to make a selection at the feature fusion stage. Collective feature fusion results including the AUC factor are shown in Table 7. Implementing a different feature selection process resulted in increasing the effectiveness of system performance. The additional feature selection process allowed for the evaluation of features operating in an assembly. This is because there may be such a data distribution for which each of the two features separately may be deemed noisy, but taking into account their interaction provides a chance for a correct classification. Therefore, it is evident that not all good features of a certain subset must be useful in isolation from the remaining ones. And conversely, the best variables, if considered individually, do not necessarily form an optimal subset.
Due to the specificity of the research assumption (fusion of features using different types of speech), as well as assuming that the acquired samples came from patients in the ON phase, the results obtained can be compared with the results presented in [103,105,106,107] with a similar methodology and performance metric.
In [107], data are collected via a physician’s examination process that is very similar to our experiment. It included multimodal data acquisition (speech and writing) and the registration included different types of voice samples [107]. Here, the SVM and k-nn algorithms were applied for this process, the use of which also gave other authors the best results. The SVM classifier produced higher accuracies than the k-NN classifier. The experimental results point out that collecting as many voice samples as possible from patients and extracting the features of each voice sample with different metrics increase the success of the diagnostic system. In [105], the authors use the traditional pipeline approach; SVM classifiers were developed using different combinations of the baseline and glottal features. Among the three baseline feature sets, the articulation features show the best detection result. The results of this research conform with approach proposed in this article. Detection results are observed after combining the feature sets. In [106], three different feature sets are computed based on phonation, articulation, and prosody analysis using an SVM and CNN. The speech of the patients is captured during a phone call using smartphones during spontaneous conversations. Several feature sets are computed to assess the phonation, articulation, and prosody impairments. For the case of the SVM, the accuracies range from 58% to 75% in the original phone calls. The results improve in up to 21% (absolute) when the recordings are processed with the SE algorithm. In [103], the results in terms of accuracy are pretty high. The methodology for determining features is different. The authors do not report whole factors of identification. Noisy environment means that speech samples were recorded in a clinic, in the examination room. They treated it an inherently noisy environment, with no prior measures used for soundproofing and noise reduction. Speech denoising was achieved in the context of parkinsonian speech identification using an optimal Wiener filter. In our research, a clinic room is considered to be a normal condition for recording. We do not use additional filtering. The original signal gives 87% as the best record of accuracy.
Table 8 shows a comparison of the accuracy, sensitivity and specificity values obtained in this paper and by other authors. The accuracy of the diagnosis reported here was obtained at a higher level with a much smaller number of features.

9. Conclusions

This article involved conducting tests aimed at detecting PD based on voice changes, focusing on its selected aspects including speech phonation, articulation, and prosody and the fusion of these subsets in patients with PD. From a clinical perspective, phonation-related issues are associated with incorrect vocal fold movements or their incomplete closure. Changes in articulation are caused by reduced amplitude and speed of lip, jaw, and tongue movements. This leads to reduced stress, inaccurate consonant articulation, and even gibberish. Prosody is a sonic speech property that takes into account intonation, volume, stress, and phonation duration. For this purpose, during the first stage of this research, we defined three separately modeled PD diagnosis systems employing different types of speech signal feature. The next step was the fusion of the proposed system with different types of feature selection. The classification results were obtained when the SVM method was applied compared to the k-nearest neighbor method, applying 1-nn in general.
The results obtained suggest that each of the applied techniques has the potential to be used in relation to the resulting feature vector, which describes the voices of patients with PD. Furthermore, feature fusion leads to an improvement in system performance indicators. On the one hand, it allows for a comprehensive analysis of speech signals, taking into account various aspects of generation. This, in turn, gives rise to hopes that the suggested solution will be universal. Defining a system that utilizes all aspects of speech signal generation may guarantee its uniqueness. The end result of this research is defining an ultimate feature vector based on three various speech signal modeling methods using a loose integration descriptor. With a 10-fold validation, the 1-nn method achieved a recognition rate of 92.2 with 91.1% sensitivity and 93.3 specificity. Regarding the analysis of the study results, it should be emphasized that the patients did not suspend current treatment for the duration of the experiment, which consequently meant that the recording was conducted after taking the drug (in the so-called ‘on’ phase), which largely leads to reduced disease symptoms, also related to the speech apparatus.
The main problem in comparing this kind of research is corpora public availability being very limited. The second problem is the language and the audio material. Different studies use different types of speech (supervised and unsupervised). Automatic detection of PD depends on the specific phonemic content contained in the utterance. It should be compared with the same language. Only a few works conduct cross-corpora trials [55,108,109] due to the lack of publicly available corpora in the same language. It becomes even more important when we use a wide range of speech signals to describe all aspects of speech (phonation, articulation, and prosody). The next problem is related to highly unbalanced corpora. In some databases, there is a big average age difference between patients and controls or unmatched gender. Another problem in comparing the results of the analyzed studies is related to speech tasks. Some studies use supervised speech tasks, and others use unsupervised speech tasks. Automatic detection or assessment of PD depends on the specific phonemic content contained in the utterances, as well as procuring a more detailed comparison between studies.
This work is a continuation of our previous analysis of experimental data, which we obtained as part of a project on multimodal data acquisition for the objective assessment of Parkinson’s disease during tests performed according to the UPDRS recommendation. Subsequent research stages may focus on the search for new speech signal classification methods, on the one hand, and studies reviewed as part of this research paper, being part of a larger project, on the other. The project fundamentally employs a number of varying kinds of signals. Further experimental phases will focus on analyzing the possibility of integrating algorithmic components of the diagnosis of PD to develop a solution that is a multimodal system for diagnosing Parkinson’s disease. Such a fusion can only be understood as a feature-level or decision-level fusion.

Author Contributions

Conceptualization, A.P.-C. and E.M.-Z.; methodology, E.M.-Z. and A.P.-C.; software, E.M.-Z.; validation, A.K.-P.; formal analysis, E.M.-Z.; investigation, E.M.-Z.; resources, A.P.-C. and M.N.; data curation, E.M.-Z.; writing—original draft preparation, E.M.-Z.; writing—review and editing, E.M.-Z., A.P.-C., M.N. and A.K.-P.; visualization, E.M.-Z.; supervision, A.K.-P. and E.M.-Z.; project administration, E.M.-Z.; funding acquisition, E.M.-Z. and A.K.-P. All authors have read and agreed to the published version of the manuscript.

Funding

This research was funded by the Polish Ministry of National Defense for the implementation of basic research within the research grant No. GBMON/13-996/2018/WAT “Basic research in the field of sensor technology using innovative data processing methods”.

Institutional Review Board Statement

This study was conducted according to the guidelines of the Declaration of Helsinki and approved by the Ethics Committee of the Medical University of Warsaw (protocol code KB/106/2019 approved on 10 June 2019).

Informed Consent Statement

Informed consent was obtained from all subjects involved in the study.

Data Availability Statement

The datasets presented in this article are not readily available due to restrictions imposed by the Ethics Committee of the Medical University of Warsaw (protocol code KB/106/2019 approved on 10 June 2019).

Conflicts of Interest

The authors declare no conflicts of interest. The funders had no role in the design of the study; in the collection, analyses, or interpretation of data; in the writing of the manuscript; or in the decision to publish the results.

References

  1. Lang, A.E.; Lozano, A.M. Parkinson’s disease. N. Engl. J. Med. 1998, 339, 1044–1053. [Google Scholar] [CrossRef]
  2. Stewart, A.F.; William, J.W. Parkinson’s Disease: Diagnosis & Clinical Management, 2nd ed.; Springer: Berlin/Heidelberg, Germany, 2008. [Google Scholar]
  3. Grover, S.; Somaiya, M.; Kumar, S.; Avasthi, A. Psychiatric aspects of Parkinson’s disease. J. Neurosci. Rural. Pract. 2015, 6, 65–76. [Google Scholar] [CrossRef]
  4. Singh, N.; Pillay, V.; Choonara, Y.E. Advances in the treatment of parkinsons disease. Prog. Neurobiol. 2007, 81, 29–44. [Google Scholar] [CrossRef]
  5. Fahn, S.; Elton, R.L.; Members of the UPDRS Develoment Committee. Unified Parkinson’s Disease rating scale. In Recent Developments in Parkinson’s Disease; Goetz, C.G., Tilley, B.C., Shaftman, S.R., Eds.; Macmillan Health Care Information: Florham Park, NJ, USA, 1987; Volume 2, pp. 153–164. [Google Scholar]
  6. Goetz, C.G.; Tilley, B.C.; Shaftman, S.R.; Stebbins, G.T.; Fahn, S.; Martinez-Martin, P.; Poewe, W.; Sampaio, C.; Stern, M.B.; Dodel, R.; et al. Movement Disorder Society-sponsored revision of the Unified Parkinson’s Disease Rating Scale (MDS-UPD-RS): Scale presentation and clinimetric testing results. Mov. Disord. 2008, 23, 2129–2170. [Google Scholar] [CrossRef] [PubMed]
  7. Siuda, J.; Boczarska-Jedynak, M.; Budrewicz, S.; Dulski, J.; Figura, M.; Fiszer, U. Validation of the Polish version of the Movement Disorder Society-Unified Parkinson’s Disease Rating Scale (MDS-UPDRS). Pol. J. Neurol. Neurosurg. 2020, 54, 416–425. [Google Scholar] [CrossRef]
  8. Poewe, W.; Antonini, A.; Zijlmans, J.C.; Burkhard, P.R.; Vingerhoets, F. Levodopa in the treatment of Parkinson’s disease: An old drug still going strong. Clin. Interv. Aging. 2010, 5, 229–238. [Google Scholar] [CrossRef] [PubMed] [PubMed Central]
  9. Pawlukowska, W.; Honczarenko, K.; Gołąb-Janowska, M. Charakter zaburzeń mowy w chorobie Parkinsona. Neurol. Neurochir. Pol. 2013, 47, 263–270. [Google Scholar] [CrossRef] [PubMed]
  10. Meka, S.S.L.; Kandadai, R.M.; Borgohain, R. Quantitative Evaluation of Parkinsonian Tremor and the Impact on it by DBS and Drugs. In Proceedings of the 2022 IEEE International Students’ Conference on Electrical, Electronics and Computer Science (SCEECS), Bhopal, India, 19–20 February 2022; pp. 1–4. [Google Scholar]
  11. Fujikawa, J.; Morigaki, R.; Yamamoto, N.; Nakanishi, H.; Oda, T.; Izumi, Y.; Takagi, Y. Diagnosis and Treatment of Tremor in Parkinson’s Disease Using Mechanical Devices. Life 2023, 13, 78. [Google Scholar] [CrossRef] [PubMed]
  12. Mailankody, P.; Thennarasu, K.; Nagaraju, B.C.; Yadav, R.; Pal, P.K. Re-emergent tremor in Parkinson’s disease: A clinical and electromyographic study. J. Neurol. Sci. 2016, 366, 33–36. [Google Scholar] [CrossRef]
  13. Hellwig, B.; Häussler, S.; Lauk, M.; Guschlbauer, B.; Köster, B.; Kristeva-Feige, R.; Timmer, J.; Lücking, C.H. Tremor-correlated cortical activity detected by electroencephalography. Clin. Neurophysiol. 2000, 11, 806–809. [Google Scholar] [CrossRef] [PubMed]
  14. Barrantes, S.; Sánchez Egea, A.J.; González Rojas, H.A.; Martí, M.J.; Compta, Y.; Valldeoriola, F.; Simo Mezquita, E.; Tolosa, E.; Valls-Solè, J. Differential diagnosis between Parkinson’s disease and essential tremor using the smartphone’s accelerometer. PLoS ONE 2017, 12, e0183843. [Google Scholar] [CrossRef]
  15. De Stefano, C.; Fontanella, F.; Impedovo, D.; Pirlo, G.; di Freca, A.S. Handwriting analysis to support neurodegenerative diseases diagnosis: A review. Pattern Recogn. Lett. 2019, 121, 37–45. [Google Scholar] [CrossRef]
  16. Junior, E.P.; Delmiro, I.L.D.; Magaia, N.; Maia, F.M.; Hassan, M.M.; Albuquerque, V.H.C.; Fortino, G. Intelligent sensory pen for aiding in the diagnosis of parkinson’s disease from dynamic handwriting analysis. Sensors 2020, 20, 5840. [Google Scholar] [CrossRef]
  17. Drotár, P.; Mekyska, J.; Rektorová, I.; Masarová, L.; Smékal, M. Faundez-Zanuy, Evaluation of handwriting kinematics and pressure for differential diagnosis of parkinson’s disease. Artif. Intell. Med. 2016, 67, 39–46. [Google Scholar] [CrossRef] [PubMed]
  18. Rios-Urrego, C.D.; Vásquez-Correa, J.C.; Vargas-Bonilla, J.F.; Nöth, E.; Lopera, F.; Orozco-Arroyave, J.R. Analysis and evaluation of handwriting in patients with Parkinson’s disease using kinematic, geometrical, and non-linear features. Comput. Methods Programs Biomed. 2019, 173, 43–52. [Google Scholar] [CrossRef] [PubMed]
  19. Pereira, C.R.; Pereira, D.R.; Rosa, G.H.; Albuquerque, V.H.; Weber, S.A.; Hook, C.; Papa, J. Handwritten dynamics assessment through convolutional neural networks: An application to parkinson’s disease identification. Artif. Intell. Med. 2018, 87, 67–77. [Google Scholar] [CrossRef]
  20. Jakubowski, J.; Potulska-Chromik, A.; Białek, K.; Nojszewska, M.; Kostera-Pruszczyk, A. A Study on the Possible Diagnosis of Parkinson’s Disease on the Basis of Facial Image Analysis. Electronics 2021, 10, 2832. [Google Scholar] [CrossRef]
  21. Su, G.; Lin, B.; Yin, J.; Luo, W.; Xu, R.; Xu, J.; Dong, K. Detection of hypomimia in patients with Parkinson’s disease via smile videos. Ann. Transl. Med. 2021, 9, 1307. [Google Scholar] [CrossRef] [PubMed]
  22. Purup, M.M.; Knudsen, K.; Karlsson, P.; Terkelsen, A.J.; Borghammer, P. Skin Temperature in Parkinson’s Disease Measured by Infrared Thermography. Parkinson’s Dis. 2020, 2020, 2349469. [Google Scholar] [CrossRef] [PubMed]
  23. Pierleoni, P. A Smart Inertial System for 24h Monitoring and Classification of Tremor and Freezing of Gait in Parkinson’s Disease. IEEE Sens. J. 2019, 19, 11612–11623. [Google Scholar] [CrossRef]
  24. Khan, M.A.; Kadry, S.; Parwekar, P.; Damaševičius, R.; Mehmood, A.; Khan, J.A.; Naqvi, S.R. Human gait analysis for osteoarthritis prediction: A framework of deep learning and kernel extreme learning machine. Complex. Intell. Syst. 2021, 9, 2665–2683. [Google Scholar] [CrossRef]
  25. Liu, P.; Yu, N.; Yang, Y.; Yu, Y.; Sun, X.; Yu, H.; Han, J.; Wu, J. Quantitative assessment of gait characteristics in patients with Parkinson’s disease using 2D video. Park. Relat. Disord. 2022, 101, 49–56. [Google Scholar] [CrossRef] [PubMed]
  26. Borzì, L.; Sigcha, L.; Rodríguez-Martín, D.; Olmo, G. Real-time detection of freezing of gait in Parkinson’s disease using multi-head convolutional neural networks and a single inertial sensor. Artif. Intell. Med. 2023, 135, 102459. [Google Scholar] [CrossRef] [PubMed]
  27. Yu, T.; Park, K.W.; McKeown, M.J.; Wang, Z.J. Clinically Informed Automated Assessment of Finger Tapping Videos in Parkinson’s Disease. Sensors 2023, 23, 9149. [Google Scholar] [CrossRef] [PubMed]
  28. Sano, Y.; Kandori, A.; Shima, K.; Tamura, Y.; Takagi, H.; Tsuji, T.; Noda, M.; Higashikawa, F.; Yokoe, M.; Sakoda, S. Reliability of Finger Tapping Test Used in Diagnosis of Movement Disorders. In Proceedings of the 2011 5th International Conference on Bioinformatics and Biomedical Engineering, Wuhan, China, 10–12 May 2011; pp. 1–4. [Google Scholar]
  29. Fernandez, L.D.; Mateo, C.G. Speech production. In Encyclopedia of Biometrics; Li, S.Z., Jain, A., Eds.; Springer: Boston, MA, USA, 2009. [Google Scholar]
  30. Factor, S.; Weiner, W.J. Parkinson’s Disease Diagnosis and Clinical Management; Medical Publishing: New York, NY, USA, 2002. [Google Scholar]
  31. Adams, S.G.; Dykstra, A. Hypokinetic dysarthria. In Clinical Management of Sensorimotor Speech Disorders; Mc-Neil, M.R., Ed.; Thieme: New York, NY, USA, 2008. [Google Scholar]
  32. Darley, F.L.; Aronson, A.E.; Brown, J.R. Clusters of deviants speech dimensions in the dysarthrias. J. Speech Hear. Res. 1969, 12, 462–469. [Google Scholar] [CrossRef] [PubMed]
  33. Logemann, J.; Fisher, H.; Boshes, B. The steps in the degeneration of speech and voice control in Parkinson’s disease. In Parkinson’s Disease: Refidity, Akinesia, Behavior; Siegfried, J., Ed.; Hans Huber: Vienna, Austria, 1973. [Google Scholar]
  34. Blanchet, P.G.; Snyder, G.J. Speech rate deficits in individuals with parkinson’s disease: A review of the literature. J. Med. Speech Lang. Pathol. 2009, 17, 1–7. [Google Scholar]
  35. Jauer-Niworowska, O. Zaburzenia mowy u osób z chorobą Parkinsona—Nie tylko dyzartria. In Złożoność Uwarunkowań Trudności w Komunikacji Werbalnej; Wydział Polonistyki Uniwersytetu Warszawskiego: Warszawa, Poland, 2016. (In Polish) [Google Scholar]
  36. Ma, A.; Lau, K.K.; Thyagarajan, D. Voice changes in Parkinson’s disease: What are they telling us? J. Clin. Neurosci. 2020, 72, 1–7. [Google Scholar] [CrossRef]
  37. Skodda, S.; Schlegel, U. Speech rate and rhythm in parkinson’s disease. Mov. Disord. 2008, 23, 985–992. [Google Scholar] [CrossRef] [PubMed]
  38. Van Borsel, J.; Bontinck, C.; Coryn, M.; Paemeleire, F.; Vandemaele, P. Acoustic features of palilalia: A case study. Brain Lang. 2007, 101, 90–96. [Google Scholar] [CrossRef] [PubMed]
  39. Moro-Velazquez, L.U.; Gomez-Garcia, J.A.; Arias-Londoño, J.D.; Dehak, N.; Godino-Llorente, J.I. Advances in Parkinson’s disease detection and assessment using voice and speech: A review of the articulatory and phonatory aspects. Biomed. Signal Process. Control 2021, 66, 102418. [Google Scholar] [CrossRef]
  40. Guimarães, I. A Ciência e a Arte da Voz Humana; Escola Superior de Saúde de Alcoitão: Alcabideche, Portugal, 2007. [Google Scholar]
  41. Vizza, P.; Tradigo, G.; Mirarchi, D.; Bossio, R.B.; Lombardo, N.; Arabia, G.; Quattrone, A.; Veltri, P. Methodologies of speech analysis for neuro-degenerative diseases evaluation. Int. J. Med. Inform. 2019, 122, 45–54. [Google Scholar] [CrossRef]
  42. Holmes, R.J.; Oates, J.M.; Phyland, D.J.; Hughes, A.J. Voice characteristics in the progression of Parkinson’s disease. Int. J. Lang. Commun. Disord. 2000, 35, 407–418. [Google Scholar] [CrossRef] [PubMed]
  43. Thomas, M.; Thomas, J.A. Elements of Information Theory, 2nd ed.; Wiley-Interscience: Hoboken, NJ, USA, 2006. [Google Scholar]
  44. Atalar, M.S.; Oguz, O.; Genc, G. Hypokinetic Dysarthria in Parkinson’s Disease: A Narrative Review. Sisli Etfal Hastanesi tip bulteni 2023, 57, 163–170. [Google Scholar] [CrossRef] [PubMed]
  45. Xiu, N.; Li, W.; Liu, L.; Liu, Z.; Cai, Z.; Li, L.; Vaxelaire, B.; Sock, R.; Ling, Z.; Chen, J.; et al. A Study on Voice Measures in Patients with Parkinson’s Disease. J. Voice, 2024; in press. [Google Scholar] [CrossRef]
  46. Cuong Ngo, Q.; Motin Mohammod, A.; Nemuel, D.P.; Drotár, P.; Kempster, P.; Kumar, D. Computerized analysis of speech and voice for Parkinson’s disease: A systematic review. Comput. Methods Programs Biomed. 2022, 226, 107133. [Google Scholar]
  47. Logemann, J.A.; Fisher, H.B.; Boshes, B.; Blonsky, E.R. Frequency and cooccurrence of vocal tract dysfunctions in the speech of a large sample of parkinson patients. J. Speech Hear. Disord 1978, 43, 47–57. [Google Scholar] [CrossRef]
  48. Zhang, Y.; Jiang, J.; Rahn, D.A. Studying vocal fold vibrations in Parkinson’s disease with a nonlinear model. Chaos 2005, 15, 033903. [Google Scholar] [CrossRef] [PubMed]
  49. Zwirner, P.; Barnes, G.J. Vocal tract steadiness: A measure of phonatory and upper airway motor control during phonation in dysarthria. J. Speech Lang. Hear. Res. 1992, 35, 761–768. [Google Scholar] [CrossRef]
  50. Harel, B.; Cannizzaro, M.; Snyder, P.J. Variability in fundamental frequency during speech in prodromal and incipient Parkinson’s disease: A longitudinal case study. Brain Cogn. 2004, 56, 24–29. [Google Scholar] [CrossRef]
  51. Chiaramonte, R.; Bonfiglio, M. Acoustic analysis of voice in Parkinson’s disease: A systematic review of voice disability and meta-analysis of studies. Rev. Neurol. 2020, 70, 393–405. [Google Scholar]
  52. Mekyska, J.; Janousova, E.; Gomez-Vilda, P.; Smekal, Z.; Rektorova, I.; Eliasova, I.; Lopez-de-Ipina, K. Robust and complex approach of pathological speech signal analysis. Neurocomputing 2015, 167, 94–111. [Google Scholar] [CrossRef]
  53. Erdogdu Sakar, B.; Serbes, G.; Sakar, C. Analyzing the effectiveness of vocal features in early telediagnosis of Parkinson’s disease. PLoS ONE 2017, 12, 8. [Google Scholar] [CrossRef] [PubMed]
  54. Khojasteh, P.; Viswanathan, R.; Aliahmad, B.; Ragnav, S.; Zham, P.; Kumar, D. Parkinson’s disease diagnosis based on multivariate deep features of speech signal. In Proceedings of the 2018 IEEE Life Sciences Conference (LSC), Montreal, QC, Canada, 28–30 October 2018; pp. 187–190. [Google Scholar]
  55. Moro-Velazquez, L.; Gomez-Garcia, J.A.; Godino-Llorente, J.I.; Grandas-Perez, F.; Shattuck-Hufnagel, S.; Yagüe-Jimenez, V.; Dehak, N. Phonetic relevance and phonemic grouping of speech in the automatic detection of parkinson’s disease. Sci. Rep. 2019, 9, 19066. [Google Scholar] [CrossRef] [PubMed]
  56. Benba, A.; Jilbab, A.; Hammouch, A. Voice analysis for detecting persons with parkinson’s disease using PLP and VQ. J. Theor. Appl. Inf. Technol. 2014, 70, 443. [Google Scholar]
  57. Schoentgen, J.; Kacha, A. Grenez, Joint analysis of vocal jitter, flutter and tremor in vowels sustained by normophonic and parkinson speakers. In Proceedings of the Models and Analysis of Vocal Emissions for Biomedical Applications 11th International Workshop 2019, Firense, Italy, 17–19 December 2019. [Google Scholar]
  58. Skodda, S.; Visser, W.; Schlegel, U. Vowel Articulation in Parkinson’s Disease. J. Voice 2011, 25, 467–472. [Google Scholar] [CrossRef] [PubMed]
  59. Ackermann, H.; Hertrich, I.; Hehr, T. Oral diadochokinesis in neurological dysarthrias. Folia Phoniatr. Logop. 1995, 47, 15–23. [Google Scholar] [CrossRef]
  60. Canter, G.J. Speech characteristics of patients with Parkinson’s disease: III. Articulation, diadochokinesis, and overall speech adequacy. J. Speech Hear. Disord. 1965, 30, 217–224. [Google Scholar] [CrossRef]
  61. Skodda, S.; Grönheit, W.; Schlegel, U. Impairment of vowel articulation as a possible marker of disease progression in parkinson’s disease. PLoS ONE 2012, 7, e32132. [Google Scholar] [CrossRef]
  62. Whitfield, J.; Goberman, A. Articulatory acoustic vowel space: Application to clear speech in individuals with parkinson’s disease. J. Commun. Disord. 2014, 51, 19–28. [Google Scholar] [CrossRef] [PubMed]
  63. Vásquez-Correa, J.; Arias-Vergara, T.; Orozco-Arroyave, J.; Nöth, E. A multitask learning approach to assess the dysarthria severity in patients with parkinson’s disease. In Proceedings of the Annual Conference of the International Speech Communication Association, INTERSPEECH 2018, Hyderabad, India, 2–6 September 2018; pp. 456–460. [Google Scholar]
  64. Moro-Velazquez, L.; Gomez-Garcia, J.A.; Godino-Llorente, J.I.; Villalba, J.; Orozco-Arroyave, J.R.; Dehak, N. Analysis of speaker recognition methodologies and the influence of kinetic changes to automatically detect parkinson’s disease. Appl. Soft Comput. 2018, 62, 649–666. [Google Scholar] [CrossRef]
  65. Orozco-Arroyave, R.F.; Hönig, J.D.; Arias-Londoño, J.F.; Vargas-Bonilla, K.; Daqrouq, S.; Skodda, J.; Rusz, E. Nöth, Automatic detection of parkinson’s disease in running speech spoken in three different languages. J. Acoust. Soc. Am. 2016, 139, 48. [Google Scholar] [CrossRef] [PubMed]
  66. Vásquez-Correa, J.C.; Arias-Vergara, T.; Orozco-Arroyave, J.R.; Vargas-Bonilla, J.F.; Arias-Londoño, J.D.E. Nöth Automatic detection of parkinson’s disease from continuous speech recorded in non-controlled noise conditions. In Proceedings of the Sixteenth Annual Conference of the International Speech Communication Association 2015, Dresden, Germany, 6–10 September 2015. [Google Scholar]
  67. Breitenstein, C.; Van Lancker, D.; Daum, I.; Waters, C.H. Impaired perception of vocal emotions in Parkinson’s disease: Influence of speech time processing and executive functioning. Brain Cogn 2001, 45, 277–314. [Google Scholar] [CrossRef] [PubMed]
  68. Martens, H.; Van Nuffelen, G.; Cras, P.; Pickut, B.; De Letter, M.; De Bodt, M. Assessment of prosodic communicative efficiency in Parkinson’s disease as judged by professional listeners. Park. Dis. 2011, 2011, 129310. [Google Scholar] [CrossRef]
  69. Shahouzaei, N.; Ghayoumi-Anaraki, Z.; Maleki Shahmahmood, T.; Ladani, N.T.; Shoeibi, A. Changes in speech prosody perception during Parkinson’s disease: A comprehensive analysis. J. Commun. Disord. 2024, 110, 106430. [Google Scholar] [CrossRef]
  70. Albuquerque, L.; Martins, M.; Coelho, L.; Guedes, J.J.; Ferreira, M.; Rosa, I.P. Martins, Advanced Parkinson disease patients have impairment in prosody processing. J. Clin. Exp. Neuropsychol. 2016, 38, 208–216. [Google Scholar] [CrossRef]
  71. Basirat, A.; Schwartz, J.-L.; Moreau, C. Word segmentation based on prosody in Parkinson’s Disease. Clin. Linguist. Phon. 2021, 35, 534–541. [Google Scholar] [CrossRef] [PubMed]
  72. Steinhauer, K.; Abada, S.H.; Pauker EItzhak, I.; Baum, S.R. Prosody–syntax interactions in aging: Event-related potentials reveal dissociations between on-line and off-line measures. Neurosci. Lett. 2010, 472, 133–138. [Google Scholar] [CrossRef] [PubMed]
  73. Dara, C.; Monetta, L.; Pell, M.D. Vocal emotion processing in Parkinson’s disease: Reduced sensitivity to negative emotions. Brain Res. 2008, 1188, 100–111. [Google Scholar] [CrossRef] [PubMed]
  74. Ariatti, A.F.; Benuzzi, P. Nichelli, Recognition of emotions from visual and prosodic cues in Parkinson’s disease. Neurol. Sci. 2008, 29, 219–227. [Google Scholar] [CrossRef] [PubMed]
  75. Martens, H.; Van Nuffelen, G.; Wouters, K.; De Bodt, M. Reception of communicative functions of prosody in hypokinetic dysarthria due to Parkinson’s disease. J. Park. Dis. 2016, 6, 219–229. [Google Scholar] [CrossRef] [PubMed]
  76. Blesić, M.; Georgiev, D.; Manouilidou, C. Perception of linguistic and emotional prosody. In Parkinson’s Disease-Evidence from Slovene; Blesić, M., Ed.; 2020; Available online: https://www.academia.edu/download/61772364/IJS_Blesic_et_al_201920200113-53227-tv5i3w.pdf (accessed on 21 November 2024).
  77. Kodali, M.; Kadiri, S.R.; Alku, P. Automatic classification of the severity level of Parkinson’s disease: A comparison of speaking tasks, features, and classifiers. Comput. Speech Lang. 2024, 83, 101548. [Google Scholar] [CrossRef]
  78. Ho, A.K.; Bradshaw, J.L.; Iansek, R. For better or worse: The effect of levodopa on speech in Parkinson’s disease. Mov. Disord. 2008, 23, 574–580. [Google Scholar] [CrossRef]
  79. Chmielińska, J.; Białek, K.; Potulska-Chromik, A.; Jakubowski, J.; Majda-Zdancewicz, E.; Nojszewska, M.; Kostera-Pruszczyk, A.; Dobrowolski, A. Multimodal data acquisition set for objective assessment of Parkinson’s disease; SPIE 11442. In Proceedings of the Radioelectronic Systems Conference, Jachranka, Poland, 20–21 November 2019. [Google Scholar]
  80. Zhang, Z. Mechanics of human voice production and control. J. Acoust. Soc. Am. 2016, 140, 4. [Google Scholar] [CrossRef] [PubMed]
  81. Teixeira, J.P.; Oliveira, C.; Lopes, C. Vocal Acoustic Analysis—Jitter, Shimmer and HNR Parameters. Procedia Technol. 2013, 9, 1112–1122. [Google Scholar] [CrossRef]
  82. Brockmann, M.; Drinnan, M.J.; Storck, P.N. Carding, “Reliable Jitter and Shimmer Measurements in Voice Clinics: The Relevance of Vowel, Gender, Vocal Intensity, and Fundamental Frequency Effects in a Typical Clinical Task. J. Voice 2011, 25, 44–53. [Google Scholar] [CrossRef] [PubMed]
  83. Brockmann-Bauser, M. Improving Jitter and Shimmer Measurements in Normal Voices. Ph.D. Thesis, Newcastle University, Newcastle, UK, 2011. [Google Scholar]
  84. Little, M.A.; McSharry, P.E.; Hunter, E.J.; Spielman, J.; Ramig, L.O. Suitability of dysphonia measurements for telemonitoring of Parkinson’s disease. IEEE Trans. Biomed. Eng. 2015, 56, 1015. [Google Scholar]
  85. Tsanas, A.; Little, M.A.; Lorraine, O. Ramig, Remote Assessment of Parkinson’s Disease Symptom Severity Using the Simulated Cellular Mobile Telephone Network. IEEE Access Pract. Innov. Open Solut. 2021, 9, 11024–11036. [Google Scholar]
  86. Moran, R.J.; Reilly, R.B.; de Chazal, P.; Lacy, P.D. Telephony-based voice pathology assessment using automated speech analysis. IEEE Trans. Biomed. Eng. 2006, 53, 468–477. [Google Scholar] [CrossRef]
  87. Vashkevich, M.Y. Rushkevich, Classification of ALS patients based on acoustic analysis of sustained vowel phonations. Biomed. Signal Process. Control. 2021, 65, 102350. [Google Scholar] [CrossRef]
  88. Madhu Keerthana, Y.; Sreenivasa Rao, K.; Mitra, P. Dysarthric speech detection from telephone quality speech using epoch-based pitch perturbation features. Int. J. Speech Technol. 2022, 25, 967–973. [Google Scholar] [CrossRef]
  89. Wang, M.; Wen, Y.; Mo, S.; Yang, L.; Chen, X.; Luo, M.; Yu, H.; Xu, F.; Zou, X. Distinctive acoustic changes in speech in Parkinson’s disease. Comput. Speech Lang. 2022, 75, 101384. [Google Scholar] [CrossRef]
  90. Maryn, Y.; Roy, N.; De Bodt, M.; Van Cauwenberge, P.; Corthals, P. Acoustic measurement of overall voice quality: A meta-analysis. J. Acoust. Soc. Am. 2009, 126, 2619–2634. [Google Scholar] [CrossRef]
  91. Kumar, D.; Satija, U.; Kumar, P. Automated classification of pathological speech signals. In Proceedings of the IEEE 19th India Council International Conference (INDI-CON), Kochi, India, 24–26 November 2022; pp. 1–5. [Google Scholar]
  92. Peeters, G. A Large Set of Audio Features for Sound Description (Similarity and Classification) in the CUIDADO Project; CUIDADO: Paris, French, 2014. [Google Scholar]
  93. Misra, H.; Ikbal, S.; Bourlard, H.; Hermansky, H. Spectral Entropy Based Feature for Robust ASR. In Proceedings of the IEEE International Conference on Acoustics, Speech, and Signal Processing (ICASSP), Montreal, QC, Canada, 17–21 May 2004. [Google Scholar]
  94. Alías, F.; Socoró, J.C.; Sevillano, X. A Review of Physical and Perceptual Feature Extraction Techniques for Speech, Music and Environmental Sounds. Appl. Sci. 2016, 6, 143. [Google Scholar] [CrossRef]
  95. Majda-Zdancewicz, E.; Dobrowolski, A.; Potulska-Chromik, A.; Jakubowski, J.; Chmielińska, J.; Białek, K.; Nojszewska, M.; Kostera-Pruszczyk, A. The use of voice processing techniques in the assessment of patients with Parkinson’s disease. In Proceedings of the SPIE 11442, Radioelectronic Systems Conference, Jachranka, Poland, 20–21 November 2019. [Google Scholar]
  96. Osowski, S. Metody i Narzędzia Eksploracji Danych; BTC Publishing House: Legionowo, Poland, 2017. (In Polish) [Google Scholar]
  97. Guyon, I.; Elisseeff, A. An Introduction to Variable and Feature Selection. J. Mach. Learn. Res. 2003, 3, 1157–1182. [Google Scholar]
  98. Brzostowski, K. Zastosowanie Przetwarzania Sygnałów w Fuzji Danych Strumieniowych; Oficyna Wydawnicza Politechniki Wroclawskiej: Wrocław, Poland, 2018. (In Polish) [Google Scholar]
  99. Azadi, H.; Akbarzadeh, T.M.; Shoeibi, A.; Kobravi, H.R. Evaluating the effect of Parkinson’s disease on jitter and shimmer speech features. Adv. Biomed. Res. 2021, 10, 54. [Google Scholar] [CrossRef] [PubMed]
  100. Tsanas, M.A.; Little, P.E.; McSharry, J.; Spielman, L.O. Ramig, Novel speech sig-nal processing algorithms fo A. r high-accuracy classification of Parkinson’s dis-ease. IEEE Trans. Biomed. Eng. 2012, 59, 1264–1271. [Google Scholar] [CrossRef] [PubMed]
  101. Montaña, D.; Campos-Roca, Y.; Pérez, C.J. A Diadochokinesis-based expert sys-tem considering articulatory features of plosive consonants for early de-tection of Parkinson’s disease. Comput. Methods Program Biomed. 2018, 154, 89–97. [Google Scholar] [CrossRef] [PubMed]
  102. Moro-Velázquez, L.; Gómez-García, J.A.; Dehak, N.; Godino-Llorente, J.I. Analysis of phonatory features for the automatic detection of parkinson’s disease in two different corpora. In Proceedings of the Models and Analysis of Vocal Emissions for Biomedical Applications (MAVEBA) (2019), Florence, Italy, 17–19 December 2019; p. 33. [Google Scholar]
  103. Faragó, P.; Ștefănigă, S.-A.; Cordoș, C.-G.; Mihăilă, L.-I.; Hintea, S.; Peștean, A.-S.; Beyer, M.; Perju-Dumbravă, L.; Ileșan, R.R. CNN-Based Identification of Parkinson’s Disease from Continuous Speech in Noisy Environments. Bioengineering 2023, 10, 531. [Google Scholar] [CrossRef] [PubMed]
  104. Er, M.B.; Isik, E.; Isik, I. Parkinson’s detection based on combined CNN and LSTM using enhanced speech signals with Variational mode decomposition. Biomed. Signal Process. Control. 2021, 70, 103006. [Google Scholar] [CrossRef]
  105. Narendra, N.P.; Schuller, B.; Alku, P. The Detection of Parkinson’s Disease From Speech Using Voice Source Information. IEEE/ACM Trans. Audio Speech Lang. Process. 2021, 29, 1925–1936. [Google Scholar] [CrossRef]
  106. Arias-Vergara, T.; Vásquez-Correa, J.C.; Orozco-Arroyave, J.R.; Klumpp, P.; Nöth, E. Unobtrusive monitoring of speech impairments of Parkinson’s disease patients through mobile devices. In Proceedings of the 2018 IEEE International Conference on Acoustics, Speech and Signal Processing (ICASSP), Calgary, AB, Canada, 15–20 April 2018. [Google Scholar]
  107. Sakar, B.E.; Isenkul, M.E.; Sakar, C.O.; Sertbas, A.; Gurgen, F.; Sakir, D.; Apaydin, H.; Kursun, O. Collection and analysis of a Parkinson speech dataset with multiple types of sound recordings. IEEE J. Biomed. Health Inform. 2013, 19, 828–834. [Google Scholar] [CrossRef]
  108. Moro-Velazquez, L.; Gomez-Garcia, J.; Godino-Llorente, J.I.; Rusz, J.; Skodda, S.; Grandas, F.; Velazquez, J.-M.; Orozco-Arroyave, J.R.; Noth, E.; Dehak, N. Study of the automatic detection of Parkison’s disease based on speaker recognition technologies and allophonic distillation. In Proceedings of the 40th Annual International Conference of the IEEE Engineering in Medicine and Biology Society (EMBC), Honolulu, HI, USA, 18–21 July 2018; pp. 1404–1407. [Google Scholar]
  109. Vásquez-Correa, J.C.; Orozco-Arroyave, J.R.; Nöth, E. Convolutional neural network to model articulation impairments in patients with Parkinson’s disease. In Proceedings of the Interspeech, Stockholm, Swede, 20–24 August 2017; pp. 314–318. [Google Scholar] [CrossRef]
Figure 1. Architecture of the proposed system.
Applsci 14 11085 g001
Figure 2. Voice waveforms of the sustained phonation of the vowel /a/ (A) and contour of the fundamental frequency (B) corresponding to patients with PD (top) and patients with non-PD (down).
Applsci 14 11085 g002
Figure 3. Representation of jitter and shimmer perturbation measures in speech signal.
Applsci 14 11085 g003
Figure 4. The contour of the formants corresponding to PD patients (A) and non-PD patients (B).
Applsci 14 11085 g004
Figure 5. Experimental test diagram with the distinction of three separate speech aspects.
Applsci 14 11085 g005
Figure 6. Diagram of experimental tests employing tight data integration.
Applsci 14 11085 g006
Figure 7. Confusion matrices after raw integrated data fusion: (A) SVM; (B) 1-nn.
Applsci 14 11085 g007
Figure 8. Significance ranking for individual models, taking into account different feature usefulness evaluation methods.
Applsci 14 11085 g008
Figure 9. Confusion matrices accessing integrated data fusion with selection; left: 1-NN (Chebyshev Distace); right: SVM (Gaussian kernel).
Applsci 14 11085 g009
Table 1. Basic information about patients with PD and control group (NON-PD).
CharacteristicPD PatientsNON-PD Patients
Male819
Female165
Age (average)55.540.0
The disease duration (average)5.3N/A
The symptom severity—based on part III UPDRS20.25N/A
Table 2. List of all the calculated characteristics in the proposed system along with the typical voice disorders in Parkinson’s disease.
FeaturesSymptoms of PDMeasured FeatureAdditional Information
PhonationDysphonia
Unstable vibrations of vocal folds
Jitter [%]
Jitta [μs]
RAP [%],
PPQ5 [%]
Irregular contraction of laryngeal muscles during sound production
Roughness
Hoarseness
Dysphonia
Shimmer [%]
APQ3 [%]
APQ5 [%]
APQ11 [%]
Reduced laryngeal control and degenerative changes in laryngeal tissue
Exaggerated vocal tremorPVIRapid and regular fluctuation of the fundamental frequency
DysphoniaPPENew measure of dysphonia, which is robust to many uncontrollable confounding effects
DysphoniaPPFUnstable vibrations of vocal folds
DysphoniaPFRThe degree of variability in fundamental frequency contour that characterizes the functioning of the phonatory subsystem
DysphoniaNHRIncomplete vocal fold closure
Hoarseness
Vocal weakness
HNR,Assessment of the ratio between periodic components and non-periodic components
ArticulationHypokinetic
Dysarthria
Spectral parameters
(11 features)
Articulator movements
Hypokinetic
dysarthria
F1, F2, F3, F4
formants
Articulator movements
Physical characteristics of the sound channel (resonant cavity)
DysfluencySonorousness coefficient
Fraction of locally unvoiced pitch frames
Information about the amount of aperiodicity in the phonation
ProsodyMonotonicity, Monoloudness
Hypoprosodia
Bradylalia
Fundamental tone,
Duration of a sad statement,
Duration of a joyful statement,
Number of “pa” syllables uttered during a 5 s speech fragment,
Duration of the intervals between “pa” syllables
Table 3. Effectiveness of classifiers for the individual modalities for full dimensional vectors of the speech model.
Classifier
Modalities1-nnSVM
ACC [%]Se [%]Sp [%]ACC [%]Se [%]Sp [%]
Phonation87.595.879.283.110066.7
Articulation87.888.986.782.284.480.0
Prosody60.454.266.770.875.066.7
Table 4. Effectiveness of classifiers for the individual modalities for feature pre-selection of the individual speech model.
Classifier
Modalities1-nnSVM
ACC [%]Se [%]Sp [%]ACC [%]Se [%]Sp [%]
Phonation91.791.791.785.410070.8
Articulation89.889.488.188.988.988.9
Prosody64.666.762.572.975.070.8
Table 5. Ranking of significance for individual models, taking into account different evaluation methods of usefulness of features. Effectiveness of classifiers for the individual modalities for full-dimensional vectors of the speech model.
MethodNumber of Descriptors
1234567891011
Relief0.0590.0640.054−0.00020.0170.0490.0030.0490.0460.0240.010
Chi-square11.870.0452.950.51820.7043.8160.7043.8164.9391.1420.518
Fischer score0.130.0670.210.07160.0980.2410.1350.2410.2840.1540.173
F-test26.870.0313.280.43890.6194.5000.6194.5006.2861.0710.438
Table 6. Effectiveness of classifiers for modality integration with selection of features.
Classifier
ACC [%]Se [%]Sp [%]
Fusion model based on pre-selection (11 features)
SVM (Linear kernel)72.958.387.5
SVM (Quadratic kernel)79.162.595.8
SVM (Cubic kernel)75.058.391.7
SVM (Gaussian kernel)77.158.395.8
1-nn (Euclidean Distance)83.370.895.8
1-nn (Chebyshev Distance)75.062.587.5
1-nn (Minkowski Distance)70.875.066.7
1-nn (Spearman Distance)77.154.2100.0
Fusion model based on final selection (5 features)
SVM (Linear kernel)70.850.091.7
SVM (Quadratic kernel)77.166.787.5
SVM (Cubic kernel)79.270.887.5
SVM (Gaussian kernel)89.695.883.3
1-nn (Euclidean Distance)83.379.287.5
1-nn (Chebyshev Distance)92.291.193.3
1-nn (Minkowski Distance)68.841.795.8
1-nn (Spearman Distance)85.483.387.5
Table 7. Effectiveness of classifiers for modality integration with selection of features.
Classifier1-nnSVM
ACC [%]Se [%]Sp [%]ACC [%]Se [%]Sp [%]
Fusion model
based on pre-selection
83.370.895.879.162.595.8
AUC0.850.82
Fusion model
based on final selection
92.291.193.389.695.883.3
AUC0.890.92
Table 8. Comparison of results obtained in other works on similar topics.
ReferenceACC [%]Se [%]Sp [%]Additional Information
[107]85.080.090.0SVM methods
82.585080.0K-NN classifier
[105]65.5763.2967.86Baseline features
(phonation + articulation + prosody)
67.9369.7166.14Baseline features + Glottal (QCP)
[106]66.088.014.0SVM method. Telephonic speech
The best results were obtained when the prosody features were considered.
61.082.00CNN
[103]93/96/92--Continuous speech, speech denoising
83/87/86--Original signal
this paper92.2%91.1%93.3%1-nn method
Disclaimer/Publisher’s Note: The statements, opinions and data contained in all publications are solely those of the individual author(s) and contributor(s) and not of MDPI and/or the editor(s). MDPI and/or the editor(s) disclaim responsibility for any injury to people or property resulting from any ideas, methods, instructions or products referred to in the content.

