Article

Optimization of Embedded Retaining Walls Under the Effects of Groundwater Seepage Using a Reliability-Based and Partial Factor Design Approach

Faculty of Civil Engineering, Transportation Engineering and Architecture, University of Maribor, Smetanova Ulica 17, 2000 Maribor, Slovenia
*
Author to whom correspondence should be addressed.
Appl. Sci. 2024, 14(23), 11135; https://doi.org/10.3390/app142311135
Submission received: 24 October 2024 / Revised: 18 November 2024 / Accepted: 26 November 2024 / Published: 29 November 2024
(This article belongs to the Special Issue Slope Stability and Earth Retaining Structures—2nd Edition)

Abstract

:
In this paper, a comparative analysis of the effects of groundwater, seepage and hydraulic heave on the optimal design of embedded retaining walls is carried out. The optimization model for an optimal retaining wall (ORW) minimizes the total length of the retaining wall considering design constraints. The model is extended to include the probability of failure as an additional constraint. This overcomes the limitations of the partial safety factor approach, which does not fully account for uncertainties in the soil. In contrast, the reliability-based design (RBD) approach integrates these uncertainties and enables an assessment of the impact of seepage and hydraulic heave on the reliability of the structure. A real-coded genetic algorithm was used to determine optimal designs for both optimization methods. The results of the case study show that the addition of seepage (groundwater flow) to the hydrostatic conditions has a modest effect on the embedment depth. The design based on partial safety factors, which takes seepage into account, leads to a slight increase in the embedment depth of 0.94% compared to a retaining wall design that only takes the hydrostatic conditions of the groundwater into account. When designing on the basis of probability failure, the percentage increase in embedment depth due to seepage is between 2.19% and 6.41%, depending on the target probability of failure. Furthermore, the hydraulic heave failure mechanism did not increase the required embedment depth of the retaining wall, which means that the failure mechanism of rotation near the base was decisive for the design.

1. Introduction

Embedded retaining walls are structural elements used to support soil or rock and prevent movement during excavation or slope stabilization projects. Embedded walls are usually constructed as prefabricated walls or as in situ walls. When groundwater and seepage are present, the design of these walls becomes even more complex due to the added hydrostatic pressure and potential instability from water flow. Groundwater can exert significant pressure on the wall and increase bending moments and shear forces, which must be considered in the design. In addition, seepage of water through the soil can lead to erosion, heave or piping, jeopardizing the integrity of the wall and soil.
The design process includes determining the embedment depth of the wall, selecting appropriate materials and providing suitable drainage measures to manage water pressure and prevent saturation of the soil. Stability analyses, such as limit equilibrium and finite element methods, are used to evaluate the performance of the wall under different groundwater conditions. Overall, effective groundwater and seepage management is critical to the long-term stability and safety of embedded retaining walls [1,2]. Several methods have been developed to calculate the seepage fields in deep excavations, whereby the conductivity in the layers plays an important role in determining the water head and the distribution of the streamlines [3].
The design of retaining walls has been studied and documented in detail by numerous researchers and engineers. These designs generally comply with the guidelines and requirements of European, American and British standards, which provide a comprehensive framework for ensuring structural safety and stability. The Eurocode 7 [4] provides detailed methods for analyzing the effects of various factors that can influence the performance of retaining walls, such as soil properties, external loads and the presence of groundwater [5,6,7,8].
Due to the need to develop structures that are both economical and have sufficient safety and performance standards, optimization methods have become an integral part of the design process for embedded retaining walls. The optimization process involves the systematic investigation of a wide range of possible solutions to find the one that provides the best balance between performance, durability and cost efficiency. Various advanced optimization algorithms, such as genetic algorithms, particle swarm optimization and other meta-heuristic approaches, have already been successfully applied in this context [9,10,11,12,13].
Although significant progress has been made in the optimization of embedded retaining walls, there are still challenges in accurately modeling the effects of groundwater and seepage [3]. Accurately capturing these influences is crucial for predicting the behavior of retaining structures under different conditions. Advanced numerical techniques such as finite element analysis are often used to simulate the complicated interactions between wall, soil and water. However, for these simulations to provide reliable results, the models must be carefully calibrated with real data from observations and on-site measurements. This calibration process is crucial for improving the accuracy and reliability of the models in reproducing actual field conditions. Several authors have therefore developed numerical models with in situ data to enable reliable design for different conditions [14,15,16,17,18].
Reliability-based design (RBD) could provide a more robust approach to the consideration of uncertainties associated with seepage and groundwater in the design of embedded retaining walls. Unlike conventional design methods, which often rely on deterministic values and partial safety factors to account for uncertainties, RBD explicitly considers the probabilistic nature of key random variables, such as cohesion, friction angle and the unit weight of soil. In this approach, the probability of failure is assessed considering the inherent uncertainties in soil properties, hydrostatic groundwater conditions and seepage behavior, resulting in a more comprehensive assessment of the safety and performance of the wall. In the design of embedded retaining walls, RBD enables engineers to systematically quantify the effects of uncertainties in groundwater levels, flow patterns and soil–water interactions [19,20]. It uses statistical methods to model these variables as random parameters, reflecting their natural variability and lack of predictability in practice. By integrating these uncertainties into the design process, RBD provides a clearer understanding of the range of possible outcomes and identifies the likelihood of different failure modes, such as instability due to fluctuating groundwater pressure or unexpected seepage flows [21,22,23,24]. The rotational and structural stability of cantilever retaining walls was evaluated by Daryani and Mohamad [19] using a reliability analysis that also considers the effects of the variability of key design parameters on the reliability of the wall.
The optimization of embedded retaining walls in the presence of groundwater and seepage requires a comprehensive approach that combines advanced optimization methods. By considering the uncertainties and complexities associated with the effects of groundwater, engineers can produce designs that are both reliable and capable of maintaining long-term stability. To achieve this, the optimization model for retaining walls (ORW) was developed. The optimization model includes several failure mechanisms such as rotational failure and piping. The case study suggests that reliability-based design can provide a better understanding of optimal design in terms of safety and has been shown to be more sensitive to capture the effects of seepage based on the case study. Therefore, RBD can offer greater certainty regarding the retaining wall’s capacity to withstand uncertain conditions, including hydrostatic pressures and seepage (groundwater-flow), ultimately leading to more optimized structures. This paper also emphasizes the advantages of using a probabilistic framework as a design method over a deterministic approach based on partial safety factors. The proposed approach allows a direct comparison between the two design methodologies as it includes an optimization-based evaluation.

2. Optimization Model for the Embedded Retaining Wall

To optimize the design of an embedded retaining wall using an Excel-based evolutionary algorithm, the design problem was formulated and presented in an Excel spreadsheet for data structuring and analysis. Excel Solver (Version 2301) was then used as a platform for developing the mathematical model and managing the data input and output. The resulting optimization model (ORW) consists of input data (constants), variables and an objective function designed to minimize the total embedment depth of the wall while adhering to geotechnical and design constraints. Each row in the spreadsheet represents a unique combination of random input data and calculates the failure probability (0 for no failure, 1 for failure) based on the current embedment depth. The actual failure probability, defined as the sum of all row failures, is used as a constraint. Solver iteratively adjusts the embedment depth to find the shortest possible value that ensures the actual failure probability remains below the target failure probability, resulting in a safe and efficient design.
The ORW model integrates these components with constraints that ensure the objective function conforms to geotechnical design standards. The input data are based on specific project requirements and site conditions that are critical for optimal design. The model also includes several geometric variables, as shown in Figure 1.

2.1. Objective Function and Geotechnical Constraints of the Optimization Model

The objective function aims to minimize the total length of the embedded retaining wall required to support the specified load. It includes three key parameters: L, the total length of the wall; Hnom, the excavation depth; and dnom, the embedment depth, as defined in Equation (1).
min L = H n o m + d n o m
Geotechnical analysis forms the basis for the optimization model. It considers all design constraints that ensure stability while minimizing the length of the wall. This analysis follows the guidelines of Eurocode 7 and considers both the bearing soil and all additional surcharge loads. The design must fulfill three main conditions:
  • Balance the horizontal forces from active and passive earth pressure.
  • Ensure that the moments generated by the active and passive earth pressure are balanced.
  • Prevent failure due to hydraulic heave.
The proposed optimization model (see, Figure 1) includes the following input data (constants): The shear angle of the soil on the active and passive side φ′k [°], uniformly distributed surcharge load qQk [kN], slope angle β [°], whether groundwater is found behind the retaining wall at the surface level and in the excavated hole also at the surface level (see Figure 1) with the unit weight γw [kN/m3], cohesion of soil on the active and passive side c′k [kPa], reduction coefficient on the active side ka [-] and reduction coefficient on the passive side kp [-], unit weight of soil γk [kN/m3] and the height of the excavation Hnom. To optimize the design based on Eurocode 7, for design approach 2, the following partial safety factors were used: the partial safety factor for permanent actions SFG [-], the partial safety factor for favorable permanent actions SFG,fav [-], the partial safety factor for variable actions SFQ [-], the partial safety factor for the shear angle SFφ [-], the partial safety factor for cohesion SFc [-] and the partial safety factor for earth resistance SFRe [-].
Furthermore, according to Eurocode standards, the design values for the groundwater pressure can be determined either by applying partial safety factors to the characteristic water pressures or by including a safety margin on the characteristic water level height. In this study, the latter approach was used, which assumes that the groundwater level reaches the ground surface and is at its highest possible point [25]. The optimum design is found based on the above-mentioned input data.
In addition, the geotechnical conditions that must be met are defined using the equations summarized in Table 1. The optimization model ORW is therefore constrained by Equation (2), which limits the horizontal forces on the active side HEd with the resistance forces on the passive side HRd. The total horizontal force HEd (Equation (2a)) on the active side of the embedded retaining wall is the sum of the active earth pressure and surcharge load HEd,z,i and the horizontal force due to the presence of groundwater HEd,w,i. The horizontal forces due to soil and surcharge load are calculated using Equations (2b)–(2e). The horizontal forces due to the presence of groundwater are considered using Equations (2f)–(2i). The horizontal effective stresses σ′a,d,i required for the calculation of the horizontal forces and are calculated using Equations (2j)–(2m) and represent the design values as they are multiplied with partial safety factors. In addition, the effective vertical stresses σ′v,k,i caused by the weight of the soil are determined using Equations (2n)–(2r). Since in some cases the water flow is also taken into account, the change in water pressure Δua,i is determined by Equations (2s)–(2v). The individual water pressures at a certain depth ua,i are further calculated using Equations (2z)–(2ac). The resistant horizontal force HRd, which represents the passive side of the embedded retaining structure, is described by Equation (2ad) and is the sum of the resistances due to the soil HRd,z,i and the resistance due to the existing groundwater HRd,w,i. The resisting horizontal force is therefore calculated using Equations (2ae) and (2af). It is important to note that these resistances are reduced by the partial safety factor SFRe. Equations (2ag) and (2ah) are used to calculate for the resistance provided by groundwater, if present. The design horizontal stresses on the passive side σ′p,d,i are determined using Equations (2ai) and (2aj) and the required vertical stresses σ′v,k,i using Equations (2ak) and (2al). In addition, seepage is considered on the passive side, which requires the calculation of the changes in water pressures Δup,i and initial water pressures up,i on the passive side described by Equations (2am) and (2an), further using Equations (2ao) and (2ap). As the model considers several possible scenarios (no groundwater, presence of groundwater (hydrostatic conditions), seepage), the equations in Table 1 are therefore adjusted accordingly. To consider the effects of seepage (groundwater flow), we have used the recommendations from DIN 4085:2011-05 [26].
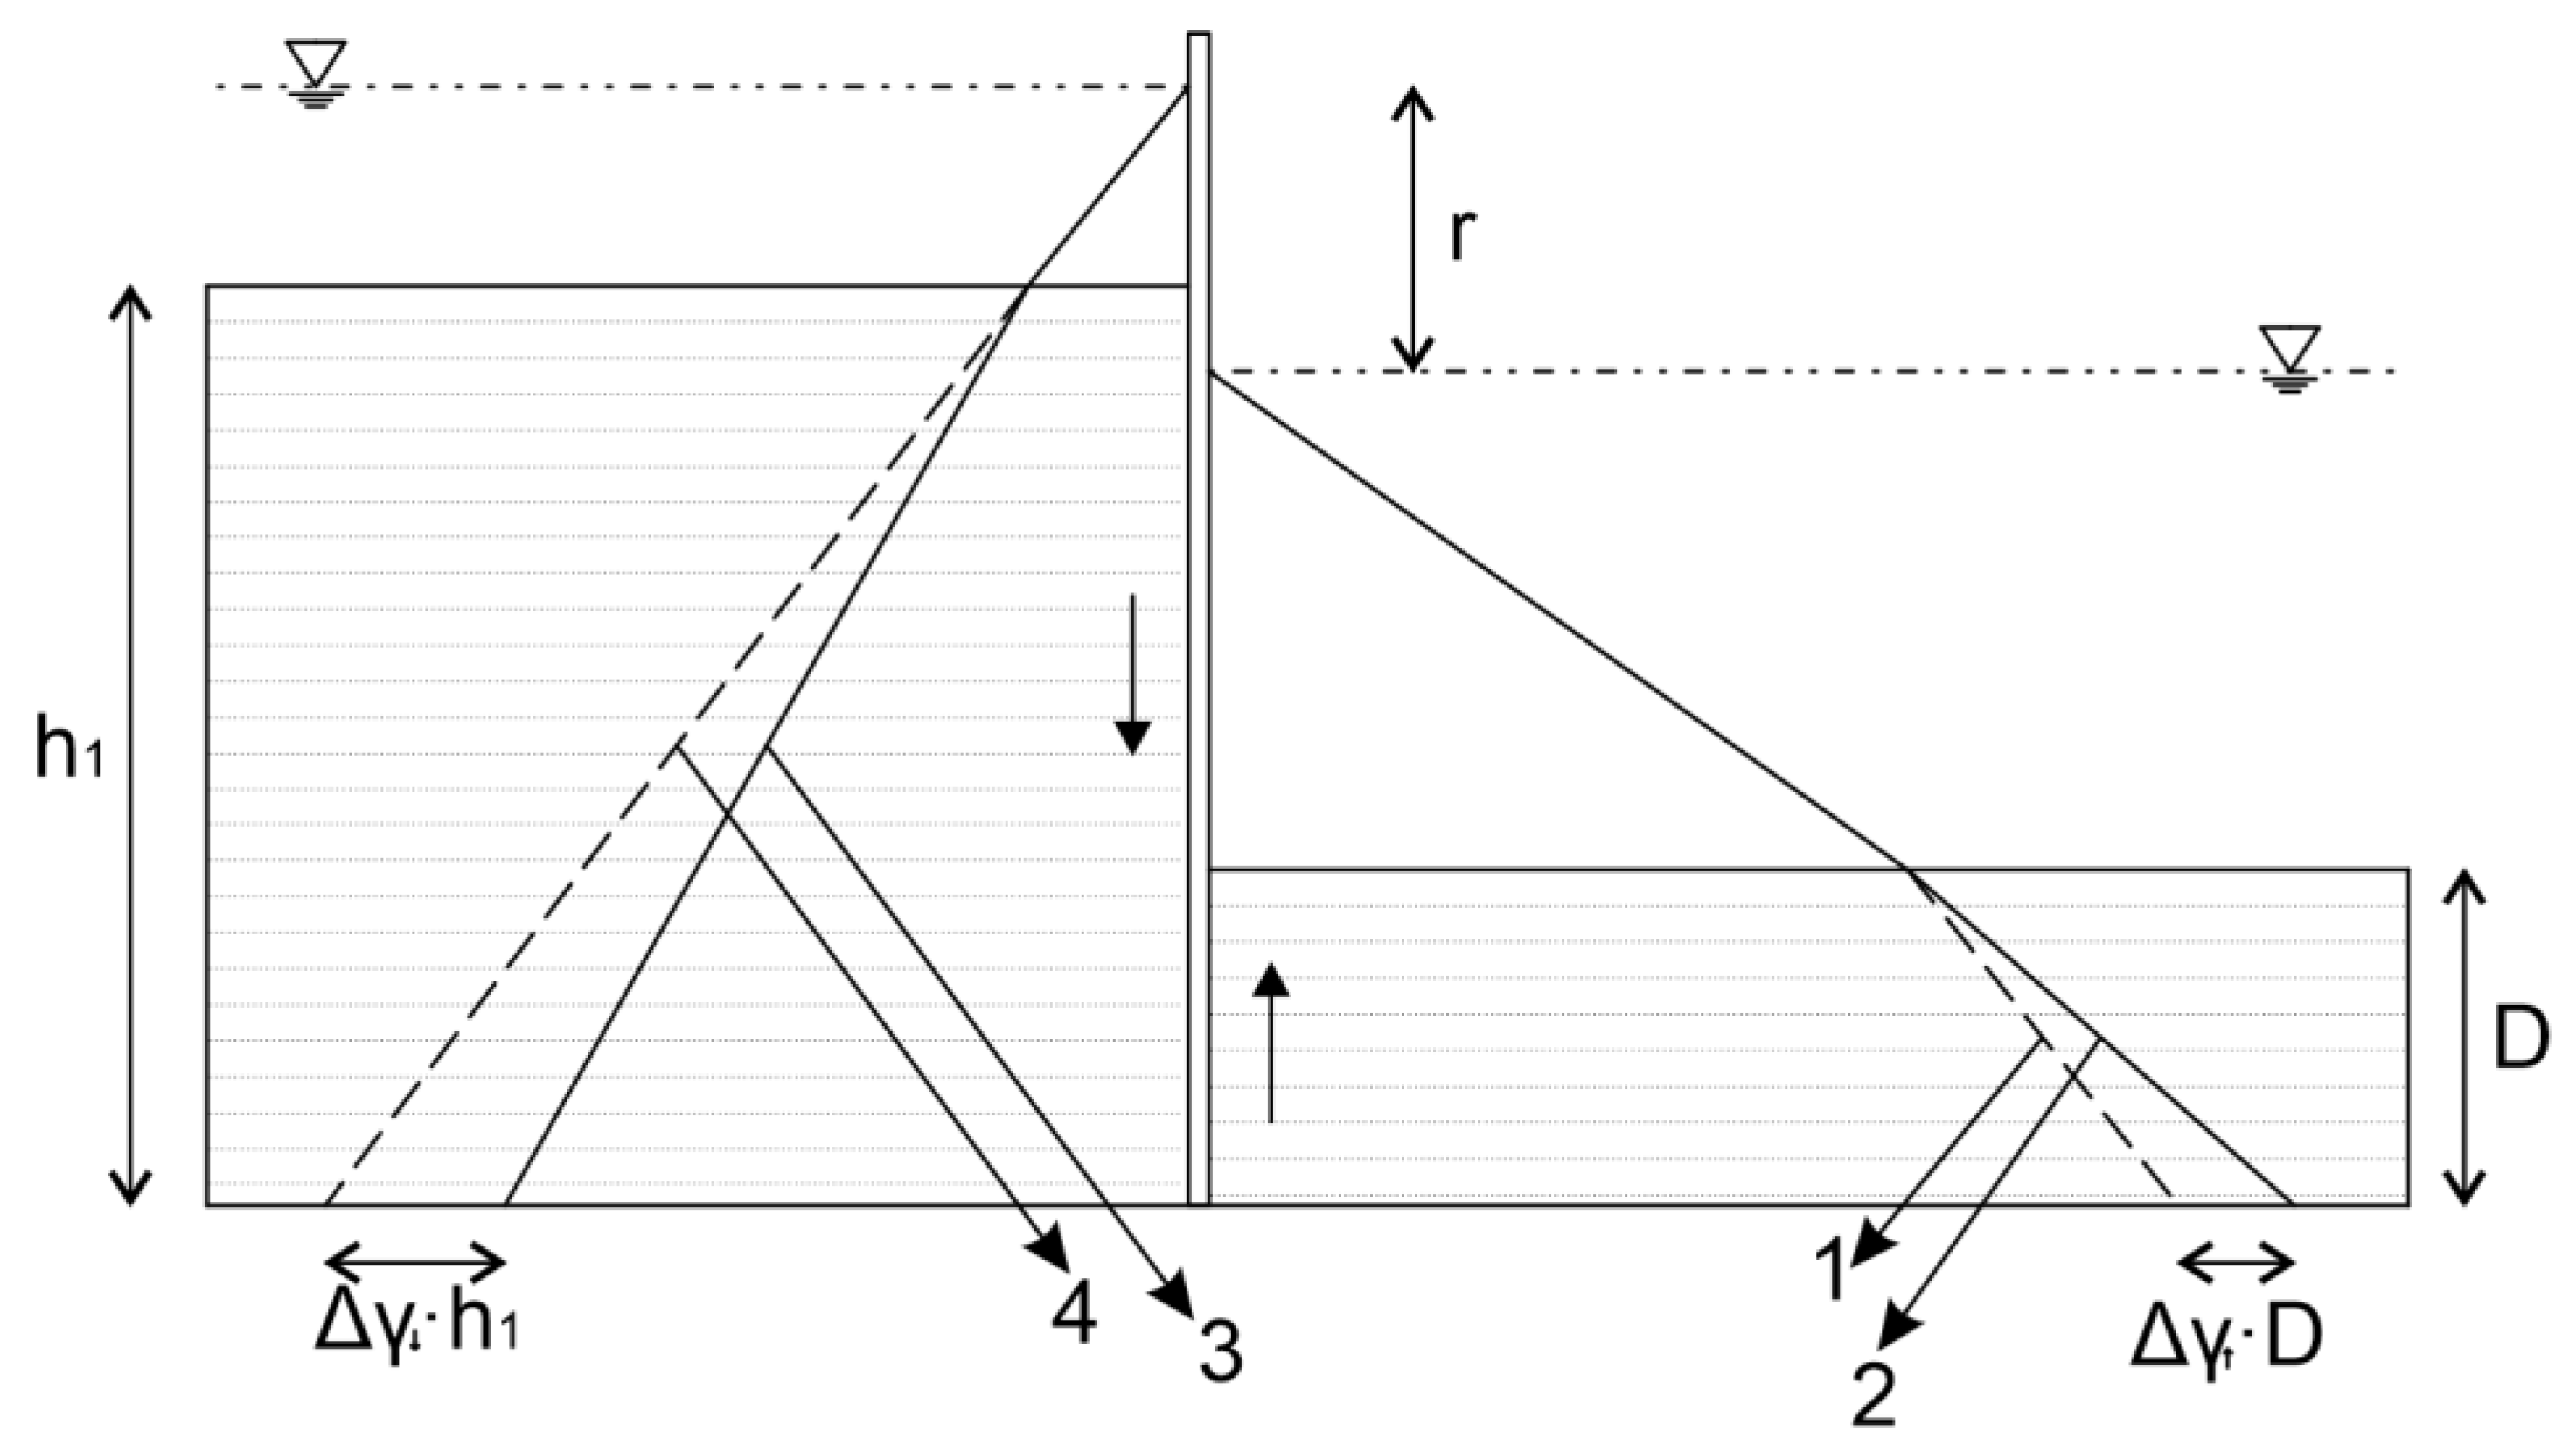
If no groundwater is present, the unit of weight is defined as given in Equations (2ar) and (2as). If groundwater is present, Equations (2at) and (2au) are used to determine the unit weight of soil. If water flow is also considered, Equations (2av) and (2az) must be used. If seepage is considered, the hydraulic gradient on the active side, ia (Equation (2ba)), and on the passive side, ip (Equation (2bb)), must be calculated. The hydraulic gradients are calculated according to the standard DIN 4085:2011-05 [26]. In order to take into account the influence of seepage, the weight of the soil on the active side γk,a is increased with the calculation method, which reduces the water pressures. On the passive side, the unit weight γk,p is reduced in the calculation, which increases the water pressures. These calculation methods, which involve increasing or decreasing the unit weight of the soil, have a direct effect on the effective stresses in the soil. While this approach does not fully capture the true mechanical behavior, it provides a valid simplification for computational purposes, eliminating the need for determining flow nets and calculating actual pore water pressures. This concept is illustrated in Figure 2. Line 1 represents the original water pressures, while line 2 shows the water pressures after an increase on the passive side. On the active side, the situation is similar: line 4 shows the original water pressure distribution, and line 3 the water pressures after reduction by groundwater flow.
The active and passive earth pressures are calculated in accordance with Eurocode 7-1 [4]. The coefficients for the active and passive earth pressure, which result from the self-weight of the soil Kaγh, Kpγh, the cohesion Kach, Kpch and the uniform surcharge load Kaqh, are determined using Equations (2bc)–(2bh). The design values for the shear angle of the soil φ′d, the friction angle between the structure and the soil δ′d and the cohesion cd are obtained from Equations (2bi)–(2bk).
Equation (3) outlines the condition for the verification of the moments due to active pressures MEd and passive pressures MRd. The moment on the active side includes contributions from the weight of the soil and the applied load in the backfill MEd,z,i as well as the moments due to groundwater MEd,w,i, which are calculated using Equations (3a)–(3i). The resisting moments on the passive side acting within the embedded retaining structure are calculated using Equation (3j) and include the moments due to the self-weight of the soil MRd,z,i and due to groundwater MRd,w,i, as given in Equations (3k)–(3n). Equation (4) must be fulfilled to prevent hydraulic failure due to hydraulic heave, where G d , s t b is the design submerged weight of a soil column that is being destabilized by the design seepage force S d , d s t . Further G d , s t b is calculated according to Equation (4a) and S d , d s t is calculated with Equation (4b). The total head pressure hs is defined with Equation (4c). Further, Equation (4d) defines the average pressure head h1 where it is assumed that the ratio of equipotential lines and flow lines in a flow net is constant at 0.5 [25]. The height h2 is described by Equation (4e) and is equal to the embedment depth dd.
Lastly, it should be noted that normal levels of site control were employed, and therefore Δ H for over digging was considered with Equation (4g). All relevant equations for the optimization are listed in Table 1.

2.2. Expanded Optimization Model with a Target Probability of Failure

The deterministic model outlined in Table 1 is expanded by a conditional equation for calculating the probability of failure, so that the embedded retaining structure can be optimized based on a defined probability of failure. The optimization model thus searches for a solution that satisfies the failure probability specified as an input parameter. It is important to note that in this expanded model, some input parameters, which will be explained in more detail in the next chapter, are treated as random variables. In addition, the geotechnical conditions from Table 1, specified by Equations (2)–(4), are integrated into the conditional equation for the probability of failure (Equation (5)). The equation is expressed as follows:
A F P = 1 i A ( i ) i T F P
I f   H E d i H R d i 1   o r   M E d i M R d i 1   o r   G d , s t b i S d , d s t i 1 ; t h e n   A i = 1 ; e l s e   A i = 0
where i denotes the number of samples, TFP represents the target failure probability and AFP represents the actual failure probability. Figure 3 illustrates the two optimization methods, optimization based on Eurocode guidelines (methodology 1) and design optimization based on target reliability (methodology 2), and highlights the main differences between them.
The main difference between methodology 1 and methodology 2 as shown in Figure 3 is that a new condition is added (C4) that connects condition 1, 2 and 3 with a target probability of failure. Also, the input data in methodology 1 are characteristic values while in methodology 2 the input data for random variables are random values generated with Monte Carlo Markov Chain simulation. The simulation is carried out using the plugin “BEST” for Microsoft Excel (Version 2301) [27].

3. Application of the ORW Optimization Model—Case Study

A case study illustrating the practical application of the optimization model for the design of embedded retaining walls. The case study illustrates the process of determining the optimal design by applying the deterministic optimization model and its extended version that incorporates the target failure probability condition. This case study highlights the effectiveness and differences between the two models in achieving an optimized retaining wall design and provides valuable insight into their use in real-world scenarios.

3.1. Input Data for the Case Study

The physical and mechanical properties of soils can vary considerably due to natural processes. To account for these variations, statistical analyses and Markov Chain Monte Carlo (MCMC) simulations were performed according to the theory of Phoon and Kulhawy [28,29]. This approach enables the development of a representative soil model based on data from site samples, which are then integrated into the optimization model.
To accurately define the random variables, 15 soil samples were taken from five different boreholes on the site, with samples taken at different depths. Laboratory tests, including a triaxial shear strength test, were performed to determine the effective shear angle (φ′k) and cohesion (c′k). In addition, the unit weight of soil (γk) was measured indirectly while performing the mentioned laboratory test. A total of 15 measurements were performed for each soil property, which are listed in Table 2. This comprehensive sampling and testing procedure ensures that the soil model accurately reflects the variability of site conditions.
The large number of soil samples and the high-quality laboratory tests that have been performed provide reliable preliminary information on the soil properties of the site. These data are used to create a preliminary distribution for the soil properties. Given the adequacy of the laboratory data, a normal distribution, characterized by its mean and standard deviation, was chosen for the prior construction. The summarized prior information about the soil is presented in Table 3. The coefficients of variation (COV) values were obtained according to the theory provided by several authors [30,31,32,33].
To optimize the design with respect to a certain probability of failure, the data were processed using an Excel plugin that uses the Bayesian sampling algorithm known as “BEST” (Bayesian Equivalent Sample Toolkit) [27]. This method utilizes Bayesian theory, which provides a framework for updating the probability distribution of a parameter as more evidence or data becomes available. The optimization also used Monte Carlo simulations in combination with Markov Chain Monte Carlo (MCMC) methods to generate samples. Monte Carlo simulations are used to perform numerical experiments to estimate the behavior of complex systems through random sampling, while MCMC methods facilitate the sampling of random variables from probability distributions using a Markov chain approach.
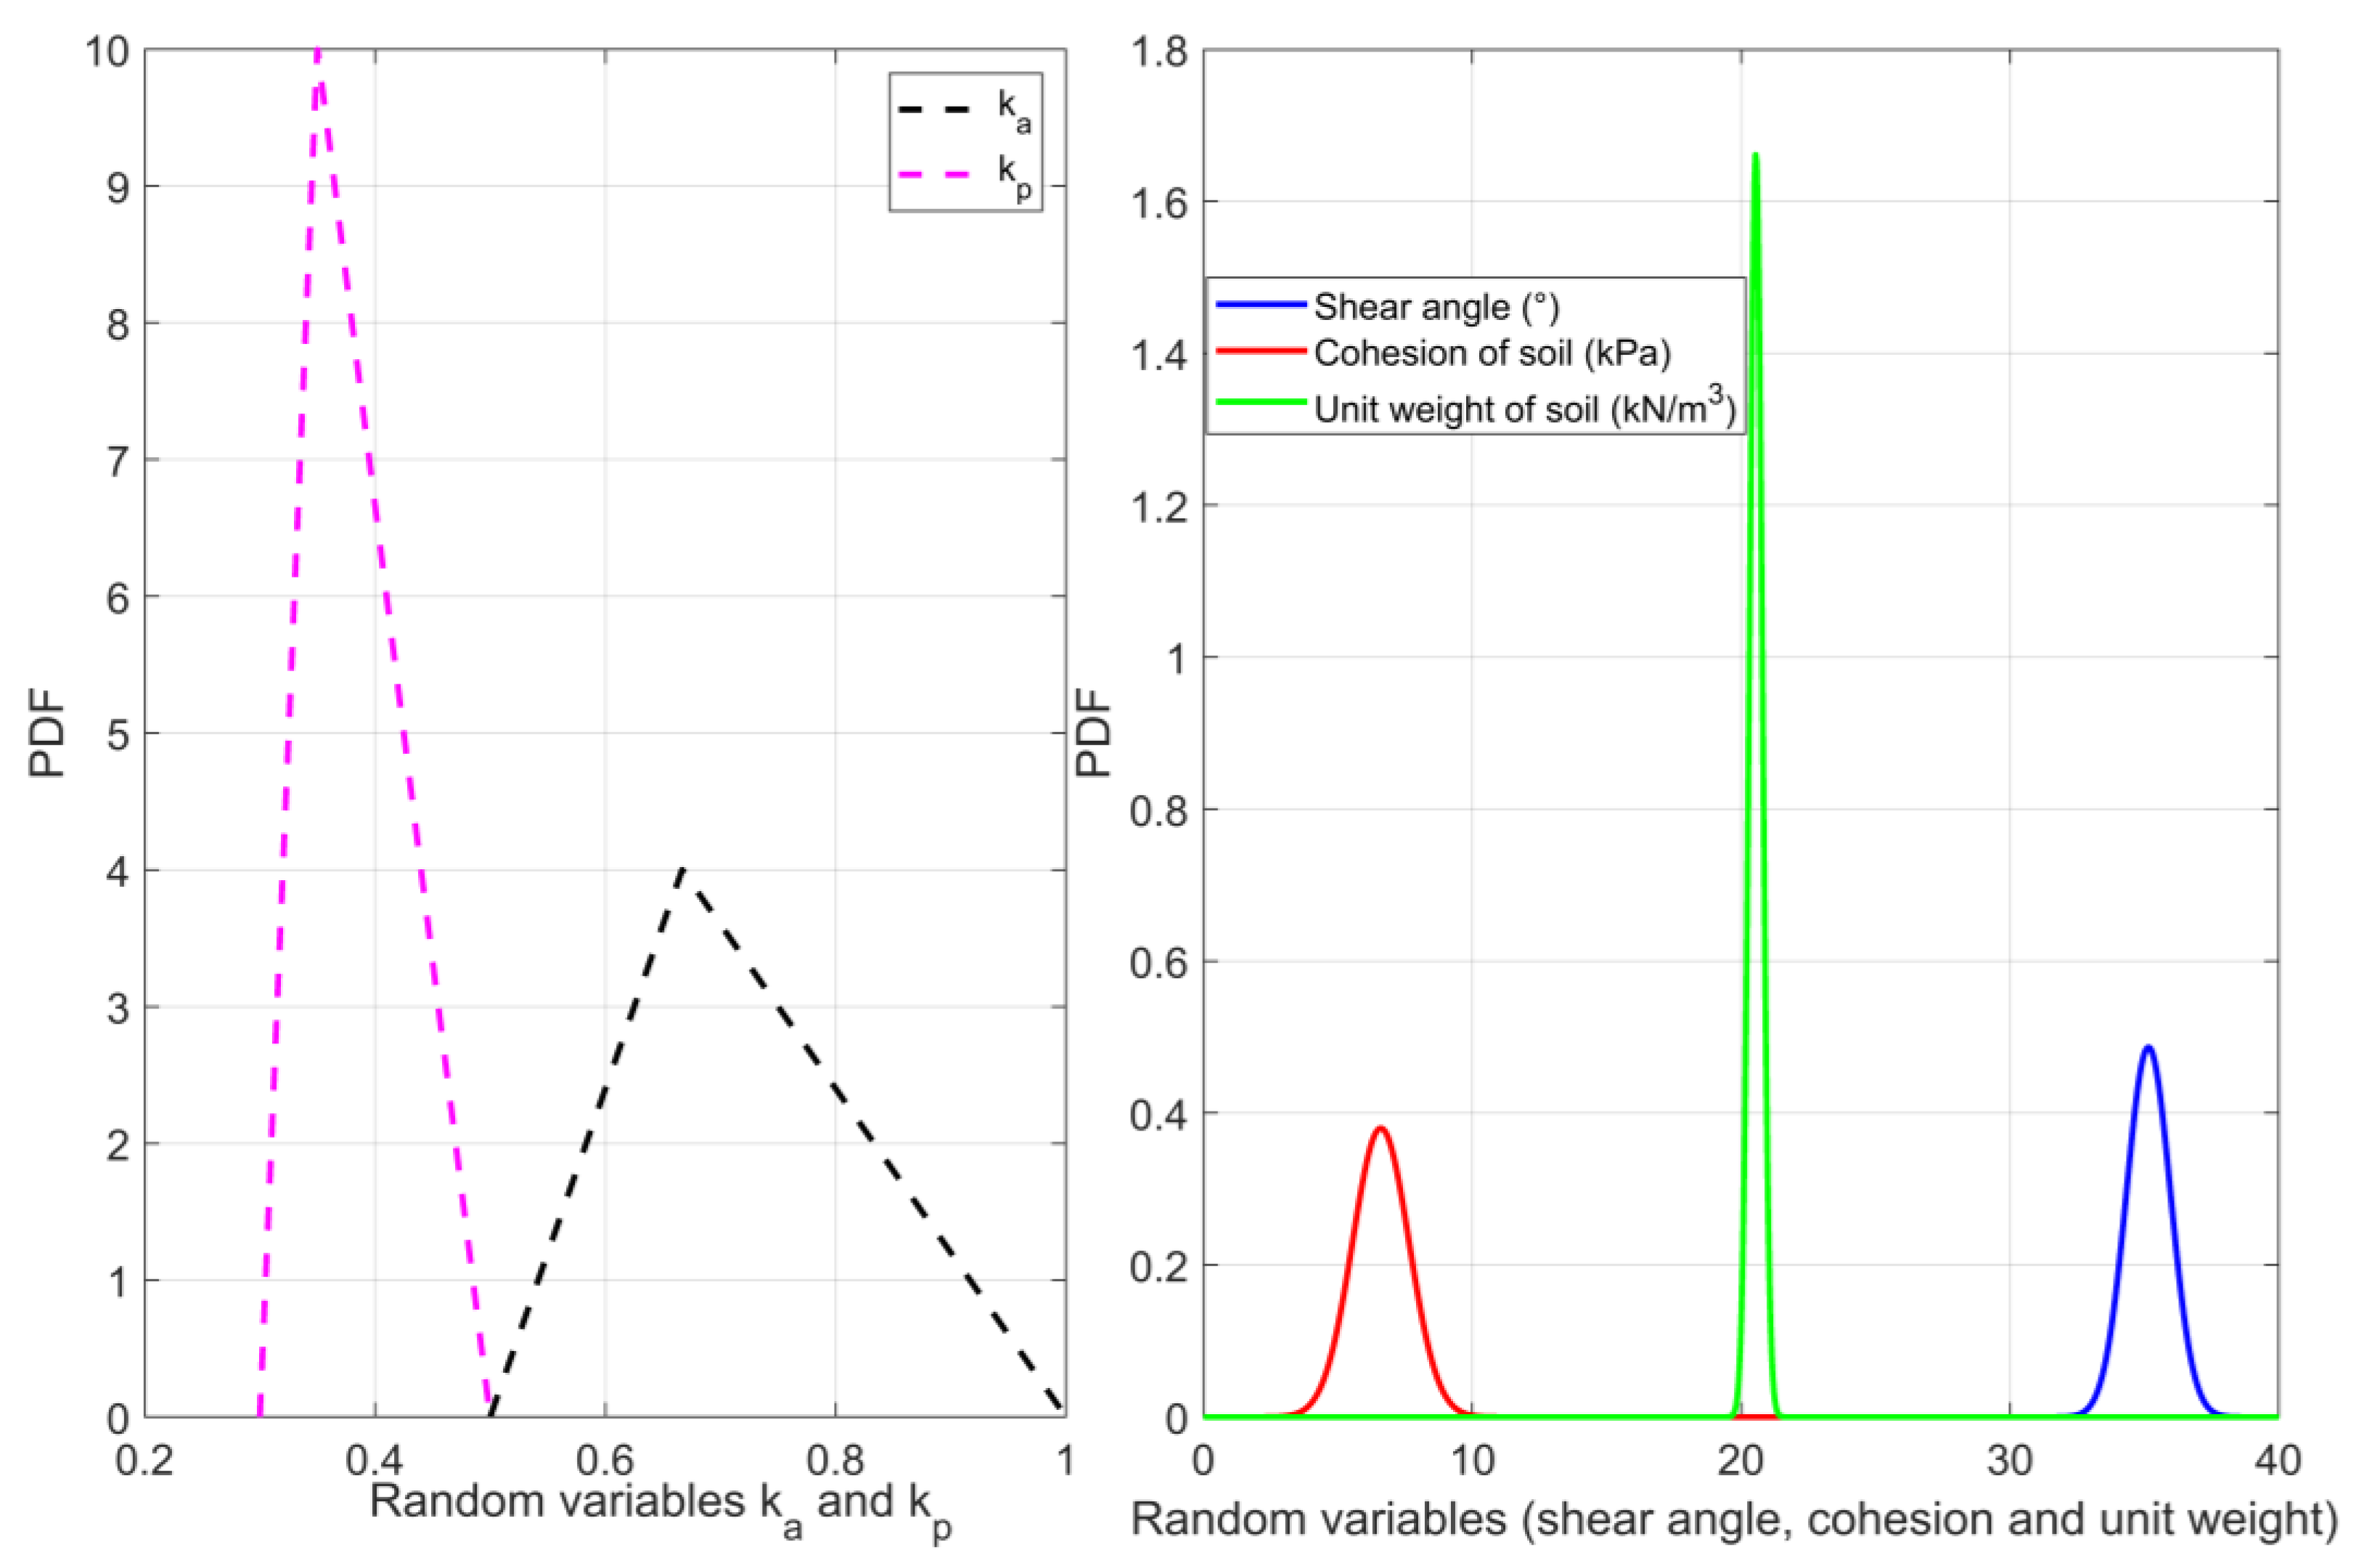
This combined approach generated a total of 100,000 samples, each containing random values for the variables defining the soil model. The input data for the reduction coefficients ka and kp, which relate to the interaction between the embedded retaining structure and the soil on the active and passive sides, respectively, are mainly based on empirical estimates. Therefore, a triangular distribution was chosen to derive the cumulative function for these coefficients, as shown in Table 4. This distribution was chosen to reflect the practical uncertainties associated with these variables.
From a technical point of view, it is recognized that these variables have defined upper and lower limits. Therefore, they are modeled as unequally distributed random variables with certain bounds, as described in Equations (7) and (8). For variables with known bounds, a triangular distribution was used to accurately represent their probabilistic properties [34].
k a =   C D F 1 U i = 0.5 + U i 12   U i   1 3   1 1 U i 6   U i > 1 3
k p =   C D F 1 U i = 0.3 + 2 U i 100   U i   1 2   0.5 4 4 U i 100   U i > 1 2
where Ui denotes randomly distributed values for ka within the interval [0.5–1.0] and kp within the interval [0.3–0.5], which were generated using the rand() function in Excel. This process resulted in a total of 100,000 samples of these random variables. The statistical parameters derived from these samples are summarized in Table 4 and are used in the expanded deterministic model that contains the condition for the target failure probability. The probability density function (PDF) of each random variable is shown in Figure 4.

3.2. Optimization of the Embedded Retaining Wall with Partial Safety Factors (Methodology 1)

For the optimization of the deterministic model, the Eurocode standard [35] prescribes a statistical method for determining the characteristic values. This method is used due to the adequacy of laboratory tests and the high quality of available soil data. According to the Eurocode, the characteristic values are calculated using Equation (9), where Xk is the characteristic value, Xm is the mean value of the soil property, σN is the standard deviation of the property and κN is a coefficient related to the sample population. This approach ensures that the optimization model reflects the true variability and reliability of the soil properties.
X k = X m · 1 κ N σ N
κ N = 1.645 · 1 N + 1
In accordance with the given equations, the characteristic values for the presented deterministic optimization model (ORW) are calculated.
φ k = φ m e a n 1.645 · 1 N + 1 · σ φ , k = 35.15 ° 1.645 · 0.82 ° = 33.80 °
γ k = γ m e a n 1.645 · 1 N + 1 · σ γ , k = 20.55 k N m 3 1.645 · 0.24 k N m 3 = 20.16   k N / m 3
c k = c m e a n 1.645 · 1 N + 1 · σ c , k = 6.6   k P a 1.645 · 1.05   k P a = 4.87   k P a
The obtained values from Equations (11)–(13) serve as characteristic values and the input data for the deterministic optimization model to obtain the optimal design based on the partial safety factor approach. Further input data can be found in Table 5.
After optimizing the deterministic model according to the Eurocode standard [4], and using design approach 2 using partial safety factors, we successfully determined the optimal embedment depths for the embedded retaining wall based on the provided input data. This optimization process was performed under four different scenarios to account for different conditions: one scenario without groundwater, another with groundwater present (hydrostatic conditions), a third scenario where seepage effects (groundwater-flow) were considered, and a fourth scenario where hydraulic heave had to be prevented.
The aim of the analysis was to assess how each condition affects the required embedment depths for stability and performance. By comparing these scenarios, we can evaluate the impact of groundwater and seepage on the design and ensure that the wall meets the required stability criteria under different environmental conditions. The results of the optimization for each scenario, including the optimal embedment depths, are detailed and summarized in Table 6 below.
The results show a significant influence of groundwater on the embedment depth of the retaining wall. In the presence of groundwater, an increase of 240% was observed. In contrast, the embedment depth increases only slightly by 0.94% if seepage is considered in addition to groundwater. These results illustrate the considerable influence of groundwater on construction planning, while the influence of seepage and hydraulic failure is relatively small in this case study. Hydraulic failure through the piping was also considered, but this condition did not increase the penetration of the retaining wall, which means that the mechanism of rotational failure was crucial in the design. Piping failure in embedded retaining walls occurs when seepage forces exceed the soil’s resistance, leading to soil erosion and instability. In addition, the optimization of the extended deterministic model was performed including the probability of failure, which allows a comprehensive evaluation of the design under different conditions in the following subsection.

3.3. Optimization of the Embedded Retaining Wall with Target Failure Probability (Methodology 2)

The original deterministic optimization model, which was formulated according to the Eurocode 7 standard, was expanded into an uncertainty model that includes a certain target probability of failure. In this extended model, the partial safety factors are set to 1.0, effectively eliminating additional safety margins. This approach allows for the inclusion of variability in the input data, represented by random values for the parameters listed in Table 4. The uncertainty model is based on the principle that failure occurs if one of the criteria specified in Equation (14) is not met. This equation defines the failure conditions based on the design parameters:
F = M 1 0 M 2 0 M 3 1 = H E d H R d 0 M E d M R d 0 S d , d s t G d , s t b 0
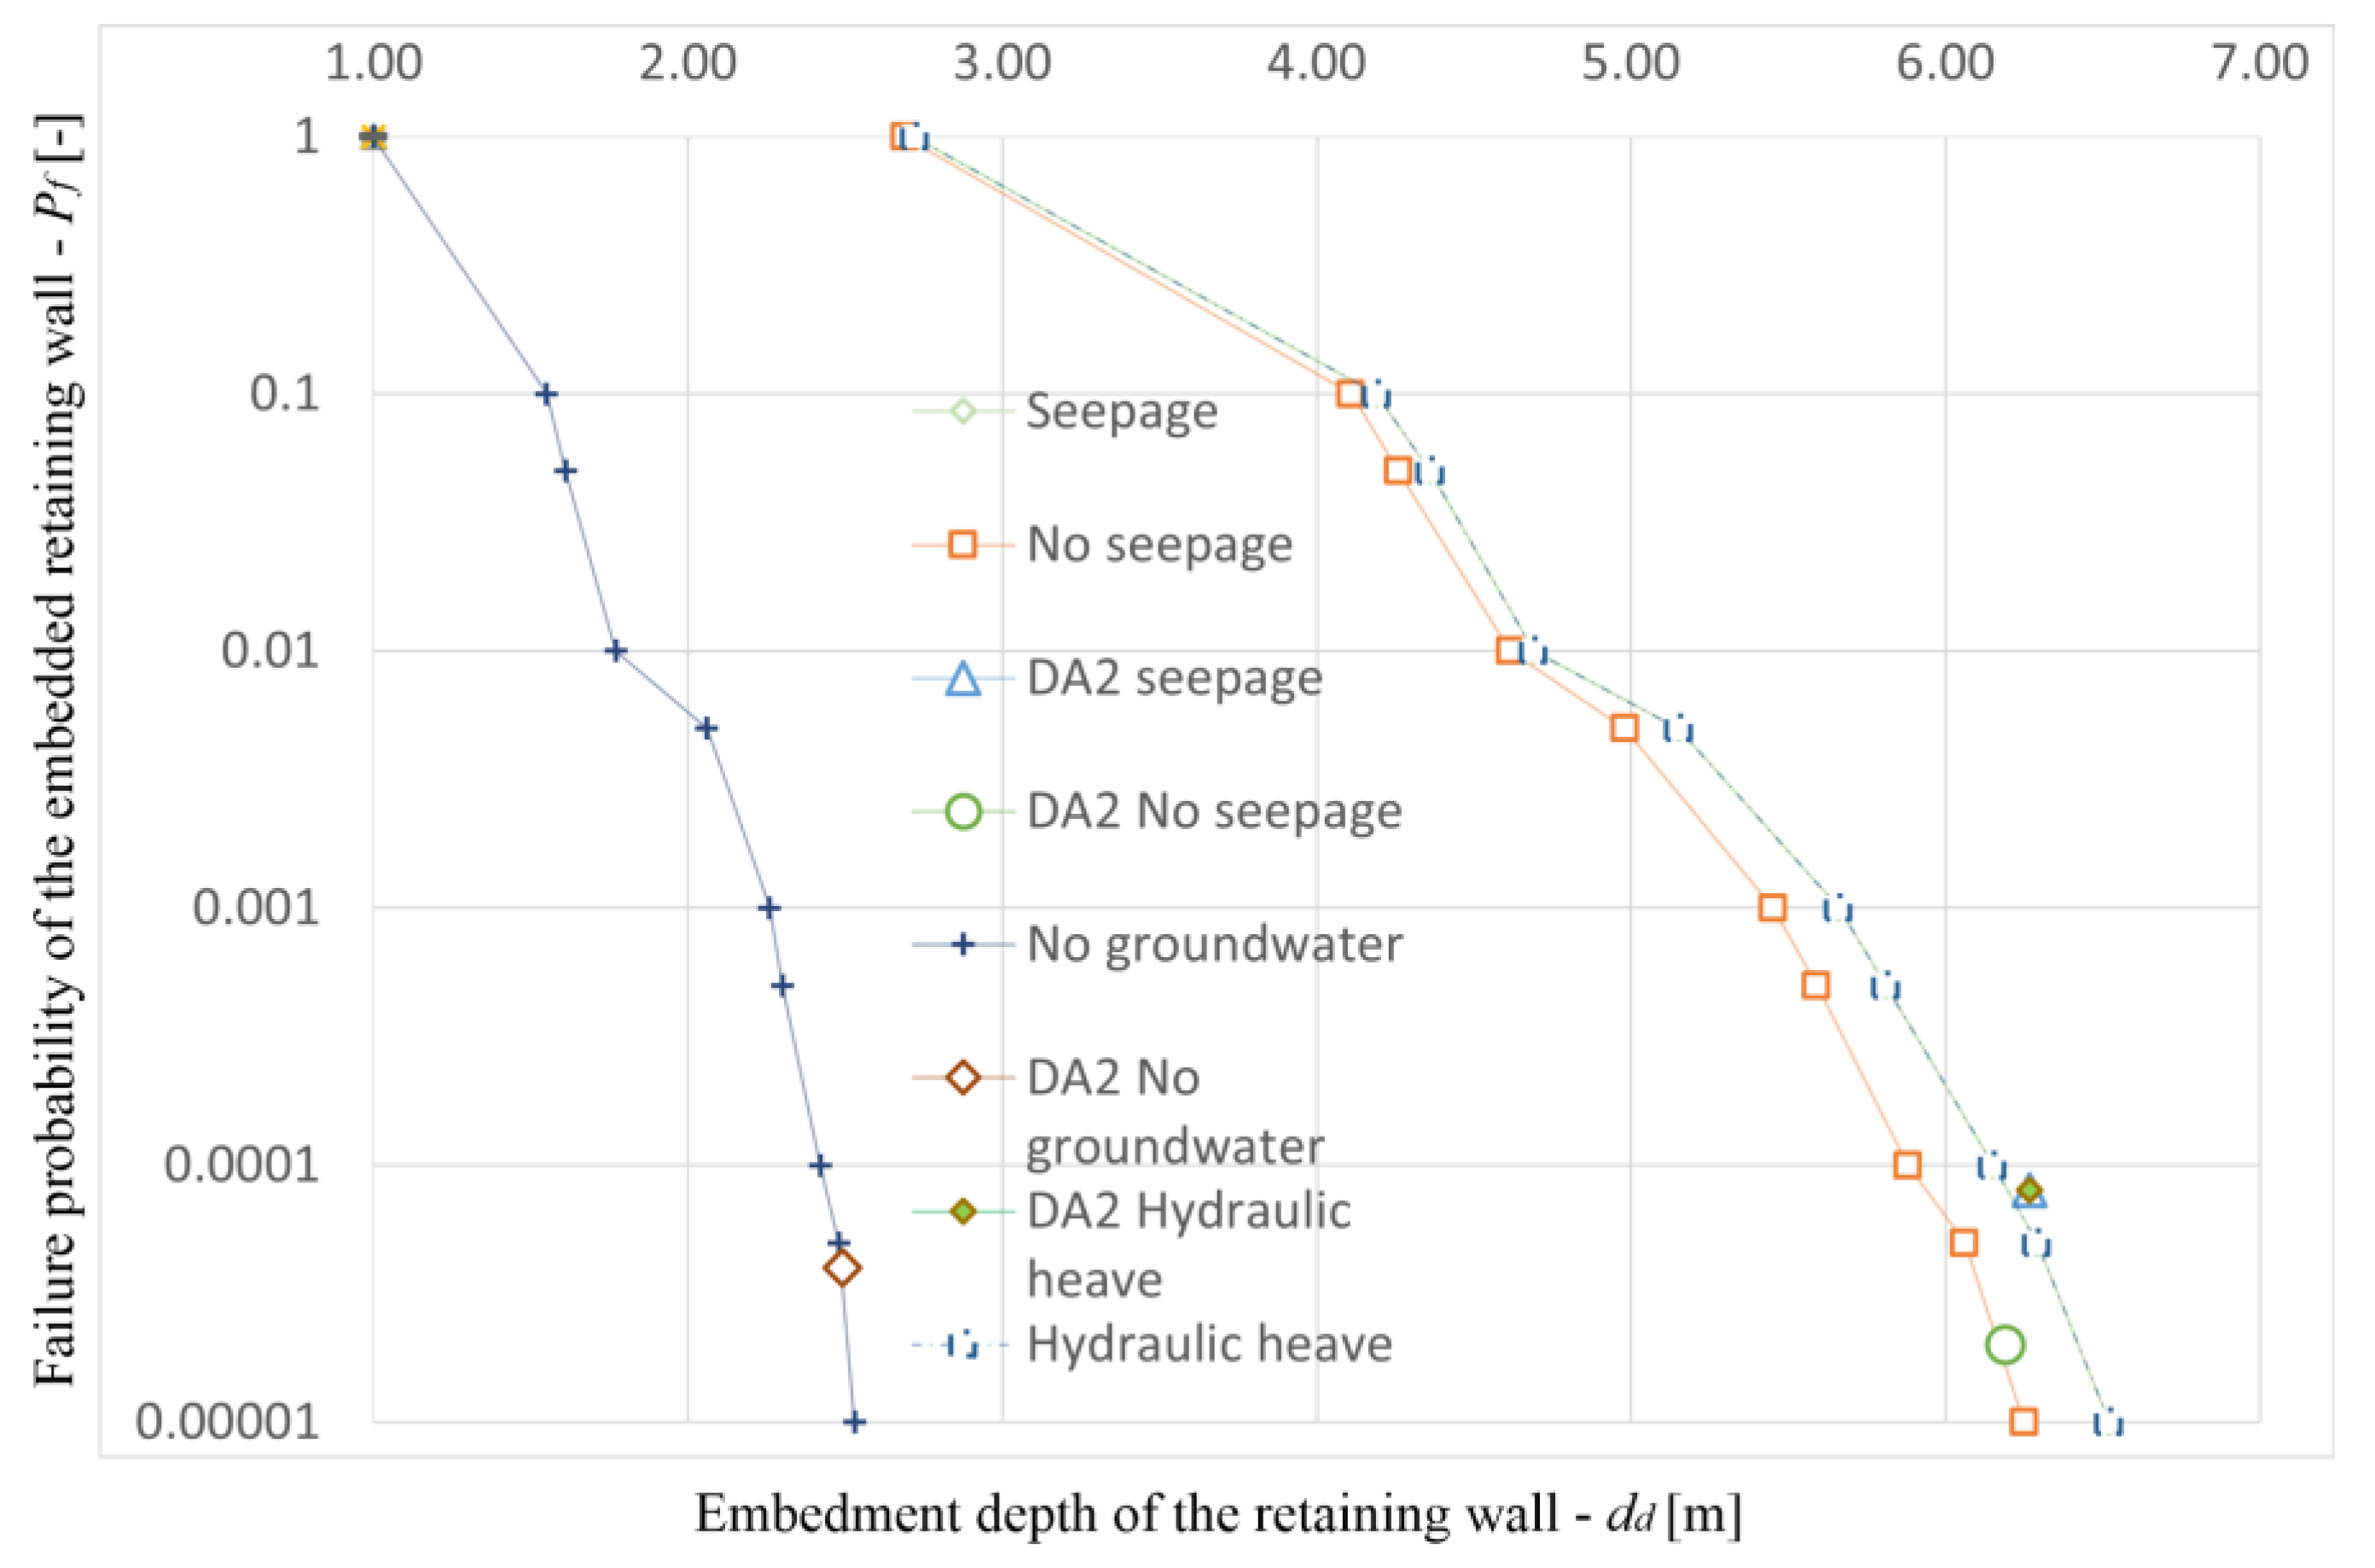
To investigate different failure probabilities, ranging from 1⋅10−5 to 1.0, the optimization was performed step by step. The algorithm systematically evaluated different design dimensions based on these probabilities and used Equation (6) to determine if the conditions were met. It assigned a score of 1 for failures and 0 for successful outcomes. With a target failure probability of 1 × 10⁻⁴, the algorithm identified dimensions that resulted in failure in only 10 out of 100,000 samples. This process was repeated for other failure probabilities and similar results were observed. The presence of groundwater significantly increases the embedment depth at each TFP, with the percentage increase ranging from approximately 113.8% at the highest TFP to over 146% at the lowest TFP. This indicates that the groundwater significantly increases the embedment depth, but its relative effect decreases with increasing TFP. The addition of seepage to groundwater has a modest effect on the embedment depth. The percentage increase in embedment depth due to seepage ranges from around 2.19% to 6.41%, depending on the TFP. This shows that the effect of seepage is small compared to the more significant increase observed when groundwater is first introduced, but it still slightly increases the embedment depth, especially at lower TPFs. These results are summarized in Table 7, which illustrates how the embedment depth of the retaining wall changes with changes in the target probability of failure.
The characteristic values for the deterministic model were derived using a statistical method based on mean values, as prescribed in the Eurocode. In this approach, characteristic values are calculated by applying a statistical analysis to mean soil properties, which provides a basis for determining design parameters under assumed average conditions. By integrating these characteristic values into the uncertainty model, we were able to accurately assess the failure probabilities associated with the optimal designs determined based on the partial safety factor approach.
The partial safety factor approach applies safety factors to account for variability and uncertainties. In contrast, the RBD approach directly considers the probabilistic nature of the design parameters and the associated uncertainties. RBD methods use probability distributions and statistical analysis to more explicitly quantify and manage risk and provide a more nuanced assessment of failure probabilities. Because a gaussian (normal) distribution of random variables was used, a direct comparison between the two methodologies can be made. The results are shown in Table 8 below.
The results of the study show that although the embedment depths determined using the partial safety factor approach based on the Eurocode are within acceptable limits for the probability of failure [36], alternative designs for retaining structures could offer significantly greater safety margins. The most notable observation arises when the seepage flow is considered in the optimal design according to the Eurocode standard, as shown in Figure 5. This comparison shows that the partial safety factors may not fully account for the influence of seepage and hydraulic heave on the stability of the structure. It should also be noted that the results of the RBD method for the given input parameters show that failure due to hydraulic heave never occurs as an independent failure mechanism, but only in combination with the overturning moment (see, Table 9). Therefore, the results are identical when only the seepage is considered and when the seepage is considered in combination with the hydraulic heave.
A direct comparison with the reliability-based design approach, which targets a specific probability of failure, underlines the limitations of the Eurocode method. Although the Eurocode-based design remains within the acceptable failure range, the analysis shows that increasing the embedment depth by only 0.94% does not sufficiently reduce the risk, as the probability of failure under seepage and hydraulic heave increases by a factor of 4. This underlines the usefulness of the RBD method, which allows for a more accurate risk assessment by explicitly considering uncertainties and probabilistic variables, which could lead to safer and more reliable structural designs.

4. Conclusions

By optimizing both the deterministic model based on Eurocode 7 and an uncertainty model that includes a probabilistic failure analysis, we have determined the optimal designs for an embedded retaining wall under different conditions. The most important results of the case study presented show that the presence of groundwater has a considerable influence on the required embedment depth (dd) of the retaining wall (approx. 2.4 times deeper). The design based on partial safety factors, which considers seepage and a combination of seepage and hydraulic heave, leads to a modest increase in the embedment depth of 0.94% compared to a retaining wall design that only takes groundwater into account. The analysis of the probability of failure of designs based on partial safety factors compared to designs based on a full reliability analysis shows that the embedment depth is more dependent on seepage in an analysis based on the reliability analysis than in an analysis with the partial safety factor. The percentage increase in embedment depth due to seepage is between 2.19% and 6.41% for the design based on the probability of failure, depending on the targeted probability of failure. The RBD method also provides valuable information on the required embedment depths as a function of the probability of failure, whereas the Eurocode design method specifies a single embedment depth with a corresponding probability of failure. In this case study, the analysis of the failure mechanisms shows that piping failure never occurs as an independent failure mechanism, but is linked to the overturning moment mechanism. Piping failure in embedded retaining walls happens when seepage forces surpass the soil’s resistance, causing soil erosion and instability. Key factors contributing to piping failure include excessive hydraulic gradients, highly permeable soils, insufficient embedment depth, significant hydraulic head differences and weak soil resistance [25].
It should be noted that the RBD method is more sensitive to fluctuating field conditions such as seepage and hydraulic heave. This could allow for a more accurate risk assessment as these uncertainties are explicitly considered. This makes the RBD method a more robust approach to ensure optimal structure in real-world scenarios where environmental conditions are unpredictable and involve a degree of uncertainty. Engineers should consider using the RBD method when there is significant uncertainty in the input data. This method can serve as an additional analysis for conventional approaches based on partial safety factors. In addition, the RBD method allows for potential structural optimization when applied with an appropriate methodology, as shown in this article. Further research is required as this work did not consider structural failure modes, which limits the applicability of the designs obtained. However, different types of retaining walls such as sheet pile walls, reinforced concrete pile walls or Berliner walls have different structural failure modes, which should be integrated into the optimization model. Most walls are not entirely rigid, meaning they experience both rigid body movement and flexing. Steel sheet piling is especially flexible, but even bored piles can bend significantly when used to support deep excavations. These factors affect not only structural failure mechanisms but also the magnitude of the earth pressure exerted on the walls. It is currently assumed that the most important variables such as soil weight, shear angle and cohesion are not correlated with each other, although further investigations are required to determine their correlations.

Author Contributions

Conceptualization, P.J.; methodology, P.J. and R.V.; formal analysis, P.J. and R.V.; writing—original draft preparation, P.J., B.Ž. and R.V. All authors have read and agreed to the published version of the manuscript.

Funding

This research was funded by Slovenian Research Agency (ARIS), grant number P2-0268.

Institutional Review Board Statement

Not applicable.

Informed Consent Statement

Not applicable.

Data Availability Statement

The raw data supporting the conclusions of this article will be made available by the authors on request.

Conflicts of Interest

The authors declare no conflicts of interest.

Nomenclature

AcronymMeaning
AFPActual failure probability
BESTBayesian Equivalent Sample Toolkit
CDFCumulative Distribution Function
COVCoefficient Of Variation
DA2Design approach 2
DINDeutsche Institut für Normung
ECEurocode
MCMCMonte Carlo Markov Chain
ORWOptimal retaining wall
PDFProbability density function
RBDReliability-based design
TFPTarget failure probability
SymbolMeaning
c′kCohesion of soil
d0.dPivot (rotation) point depth
d0.nomNominal pivot (rotation) point depth
ddEmbedment depth
dnomNominal embedment depth
G′d,stbSubmerged weight of the soil column
h1Average pressure head
HEdSum of horizontal forces
HEd,w,iHorizontal forces due to groundwater presence
HEd,z,iHorizontal forces due to earth pressure and surcharge load
HnomNominal excavation depth
HRdSum of resistant horizontal forces
HRd,w,iHorizontal resistances due to groundwater presence
HRd,z,iHorizontal resistances due to earth pressure
hsTotal head pressure
iaHydraulic gradient (active side)
ipHydraulic gradient (passive side)
kReduction coefficient
KachCoefficient for active earth pressure due to cohesion of soil (active side)
KaqhCoefficient for active earth pressure due to surcharge load (active side)
KaγhCoefficient for active earth pressure due to soil unit weight (active side)
KpchCoefficient for active earth pressure due to cohesion of soil (passive side)
KpγhCoefficient for active earth pressure due to soil unit weight (passive side)
LTotal length of the wall
MEdDesign moment
MEd,w,iMoment due to forces caused by groundwater
MEd,z,iMoment due to forces caused by unit weight of soil and surcharge load
MRdResistant moment
MRd,w,iResisting moments due to groundwater
MRd,z,iResisting moments due to unit weight of soil
qQkUniformly distributed surcharge load
Sd,dstDestabilizing seepage force
SFcPartial safety factor for cohesion
SFGPartial safety factor for permanent actions
SFG,favPartial safety factor for favorable permanent actions
SFQPartial safety factor for variable actions
SFRePartial safety factor for earth resistance
SFφPartial safety factor for the shear angle
ua,iIndividual water pressure (active side)
UiRandomly distributed values
up,iIndividual water pressure (passive side)
XkCharacteristic value of a parameter
XmMean value of a parameter
ziDepth
Greek SymbolMeaning
βSlope angle
γkUnit weight of soil
γ′k,aEffective unit weight of soil (active side)
γk,aUnit weight of soil when considering seepage (active side)
γ′k,pEffective unit weight of soil (passive side)
γk,pUnit weight of soil when considering seepage (passive side)
γwUnit weight of water
ΔHChange in depth due to site control
Δua,iChange in water pressure (active side)
Δup,iChange in water pressure (passive side)
κNCoefficient for the sample population size
σ′a,d,iEffective horizontal stresses (active side)
σNStandard deviation
σ′p,d,iEffective horizontal stresses (passive side)
σ′v,k,iEffective vertical stresses (active side)
σ′v,k,iEffective vertical stresses (passive side)
φ′kShear angle

References

  1. Richards, D.J.; Wiggan, C.A.; Powrie, W. Seepage and Pore Pressures around Contiguous Pile Retaining Walls. Geotechnique 2016, 66, 523–532. [Google Scholar] [CrossRef]
  2. Bolshakov, Y.; Katsov, K.; Morozov, A.A. Seepage Properties of Materials of Antifiltration Earth Diaphragms. Int. J. Rock Mech. Min. Sci. Geomech. Abstr. 1984, 21, 73. [Google Scholar] [CrossRef]
  3. Yu, J.; Yang, X.-X.; Deng, P.-B.; Chen, W.-B. Analytical Solution for a Steady Seepage Field of a Foundation Pit in Layered Soil. Int. J. Geomech. 2022, 22, 1–10. [Google Scholar] [CrossRef]
  4. EN 1997-1; Eurocode 7: Geotechnical Design Part 1, Part 1. BSI: London, UK, 2004; ISBN 9780580671067/0580671062/0580452123/9780580452123.
  5. Kelly, L.; Tully, K.; Gaba, A.; Hardy, S.; Selemetas, D.; Doughty, L.; Powrie, W. Briefing: Ciria Guide C760: Guidance on Embedded Retaining Wall Design. Geotech. Res. 2019, 6, 234–242. [Google Scholar] [CrossRef]
  6. Tedd, P.; Charles, J.A. Strength of London Clay in Relation to the Design of Embedded Retaining Walls. Technical Note. Int. J. Rock Mech. Min. Sci. Geomech. Abstr. 1985, 22, 188. [Google Scholar] [CrossRef]
  7. Conte, E.; Troncone, A.; Vena, M. A Method for the Design of Embedded Cantilever Retaining Walls under Static and Seismic Loading. Geotechnique 2017, 67, 1081–1089. [Google Scholar] [CrossRef]
  8. Lees, A.S. Use of Geotechnical Numerical Methods with Eurocode 7. Proc. Inst. Civ. Eng. Comput. Mech. 2018, 170, 146–153. [Google Scholar] [CrossRef]
  9. Zastrow, P.; Molina-Moreno, F.; García-Segura, T.; Martí, J.V.; Yepes, V. Life Cycle Assessment of Cost-Optimized Buttress Earth-Retaining Walls: A Parametric Study. J. Clean. Prod. 2017, 140, 1037–1048. [Google Scholar] [CrossRef]
  10. Hosseinzadeh, S.; Joosse, J.F. Design Optimisation of Retaining Walls in Narrow Trenches Using Both Analytical and Numerical Methods. Comput. Geotech. 2015, 69, 338–351. [Google Scholar] [CrossRef]
  11. Gandomi, A.H.; Kashani, A.R.; Roke, D.A.; Mousavi, M. Optimization of Retaining Wall Design Using Recent Swarm Intelligence Techniques. Eng. Struct. 2015, 103, 72–84. [Google Scholar] [CrossRef]
  12. Mousa, A.; Isaac, R.; Eid, M.; Mohamed, A. Optimal design of restrained sheet pile walls. J. Adv. Eng. Trends 2020, 39, 109–120. [Google Scholar] [CrossRef]
  13. Shao, J.; Fan, Z.; Huang, Y.; Zhan, Y.; Cai, Q. Multi-Objective Optimization of Double-Walled Steel Cofferdams Based on Response Surface Methodology and Particle Swarm Optimization Algorithm. Structures 2023, 49, 256–266. [Google Scholar] [CrossRef]
  14. Vaziri, H.H. A Simple Numerical Model for Analysis of Propped Embedded Retaining Walls. Int. J. Solids Struct. 1996, 33, 2357–2376. [Google Scholar] [CrossRef]
  15. Conti, R.; Viggiani, G.M.B. A New Limit Equilibrium Method for the Pseudostatic Design of Embedded Cantilevered Retaining Walls. Soil. Dyn. Earthq. Eng. 2013, 50, 143–150. [Google Scholar] [CrossRef]
  16. Gajan, S. Normalized relationships for depth of embedment of sheet pile walls and soldier pile walls in cohesionless soils. Soils Found. 2011, 51, 559–564. [Google Scholar] [CrossRef]
  17. Krabbenhoft, K. Plastic Design of Embedded Retaining Walls. Proc. Inst. Civ. Eng. Geotech. Eng. 2018, 172, 131–144. [Google Scholar] [CrossRef]
  18. Krabbenhoft, K.; Damkilde, L.; Krabbenhoft, S. Ultimate Limit State Design of Sheet Pile Walls by Finite Elements 551 and Nonlinear Programming. Compos. Struct. 2005, 83, 383–393. [Google Scholar] [CrossRef]
  19. Daryani, K.E.; Mohamad, H. System Reliability-Based Analysis of Cantilever Retaining Walls Embedded in Granular Soils. Georisk Assess. Manag. Risk Eng. Syst. Geohazards 2014, 8, 192–201. [Google Scholar] [CrossRef]
  20. Li, D.-Q.; Shao, K.-B.; Cao, Z.-J.; Tang, X.-S.; Phoon, K.-K. A Generalized Surrogate Response Aided-Subset Simulation Approach for Efficient Geotechnical Reliability-Based Design. Comput. Geotech. 2016, 74, 88–101. [Google Scholar] [CrossRef]
  21. Fenton, G.A.; Griffiths, D.V.; Naghibi, F. Future Directions in Reliability-Based Geotechnical Design; Geo-Risk 2017; American Society of Civil Engineers: Reston, VR, USA, 2017; pp. 69–95. [Google Scholar] [CrossRef]
  22. Day, P.; De Koker, N. Assessment of Reliability-Based Design for a Spectrum of Geotechnical Design Problems. Proc. Inst. Civ. Eng. Geotech. Eng. 2017, 171, 147–159. [Google Scholar] [CrossRef]
  23. Low, B.K. Reliability-Based Design Applied to Retaining Walls. In Risk and Variability in Geotechnical Engineering; Thomas Telford Publishing: London, UK, 2007; pp. 151–163. ISBN 9780727734860. [Google Scholar]
  24. Varga, R.; Jelušič, P. Failure Probability of an Optimally Designed Gravity Retaining Wall. ASCE-ASME J. Risk Uncertain. Eng. Syst. Part A Civ. Eng. 2022, 8, 04022007. [Google Scholar] [CrossRef]
  25. Bond, A.; Harris, A. Decoding Eurocode 7; CRC Press: London, UK; New York, NY, USA, 2006; ISBN 9780429082535. [Google Scholar]
  26. DIN 4085:2011-05; Deutsches institut für Normung. German Institute for Standardisation: Berlin, Germany, 2011.
  27. Wang, Y.; Akeju, O.V.; Cao, Z. Bayesian Equivalent Sample Toolkit (BEST): An Excel VBA Program for Probabilistic Characterisation of Geotechnical Properties from Limited Observation Data. Georisk Assess. Manag. Risk Eng. Syst. Geohazards 2016, 10, 251–268. [Google Scholar] [CrossRef]
  28. Phoon, K.K.; Kulhawy, F.H. Evaluation of geotechnical property variability. Can. Geotech. J. 1999, 36, 625–639. [Google Scholar] [CrossRef]
  29. Phoon, K.K.; Kulhawy, F.H. Characterization of geotechnical variability. Can. Geotech. J. 1999, 36, 612–624. [Google Scholar] [CrossRef]
  30. Phoon, K.K. (Ed.) Reliability-Based Design in Geotechnical Engineering: Computations and Applications; CRC Press: London, UK, 2008; p. 544. [Google Scholar] [CrossRef]
  31. Doganaksoy, N.; Ushakov, I.A.; Harrison, R.A. Handbook of Reliability Engineering. J. Am. Stat. Assoc. 1995, 90, 804. [Google Scholar] [CrossRef]
  32. Rackwitz, R. Reviewing Probabilistic Soils Modelling. Comput. Geotech. 2000, 26, 199–223. [Google Scholar] [CrossRef]
  33. Rackwitz, R.; Flessler, B. Structural Reliability under Combined Random Load Sequences. Comput. Struct. 1978, 9, 489–494. [Google Scholar] [CrossRef]
  34. Phoon, K.-K.; Retief, J.V. Reliability of Geotechnical Structures in ISO2394; CRC Press: London, UK, 2016; ISBN 9781351783408. [Google Scholar]
  35. EURONORM EN 1990; Eurocode—Basis of Structural Design. European Commission: Brussels, Belgium, 2002.
  36. NAVFAC. Foundations and Earth Structures. Naval Facilities Engineering Command; DM.7.02; Department of Navy. Bureau of Yards and Docks: Alexandria, VR, USA, 1986; p. 278.
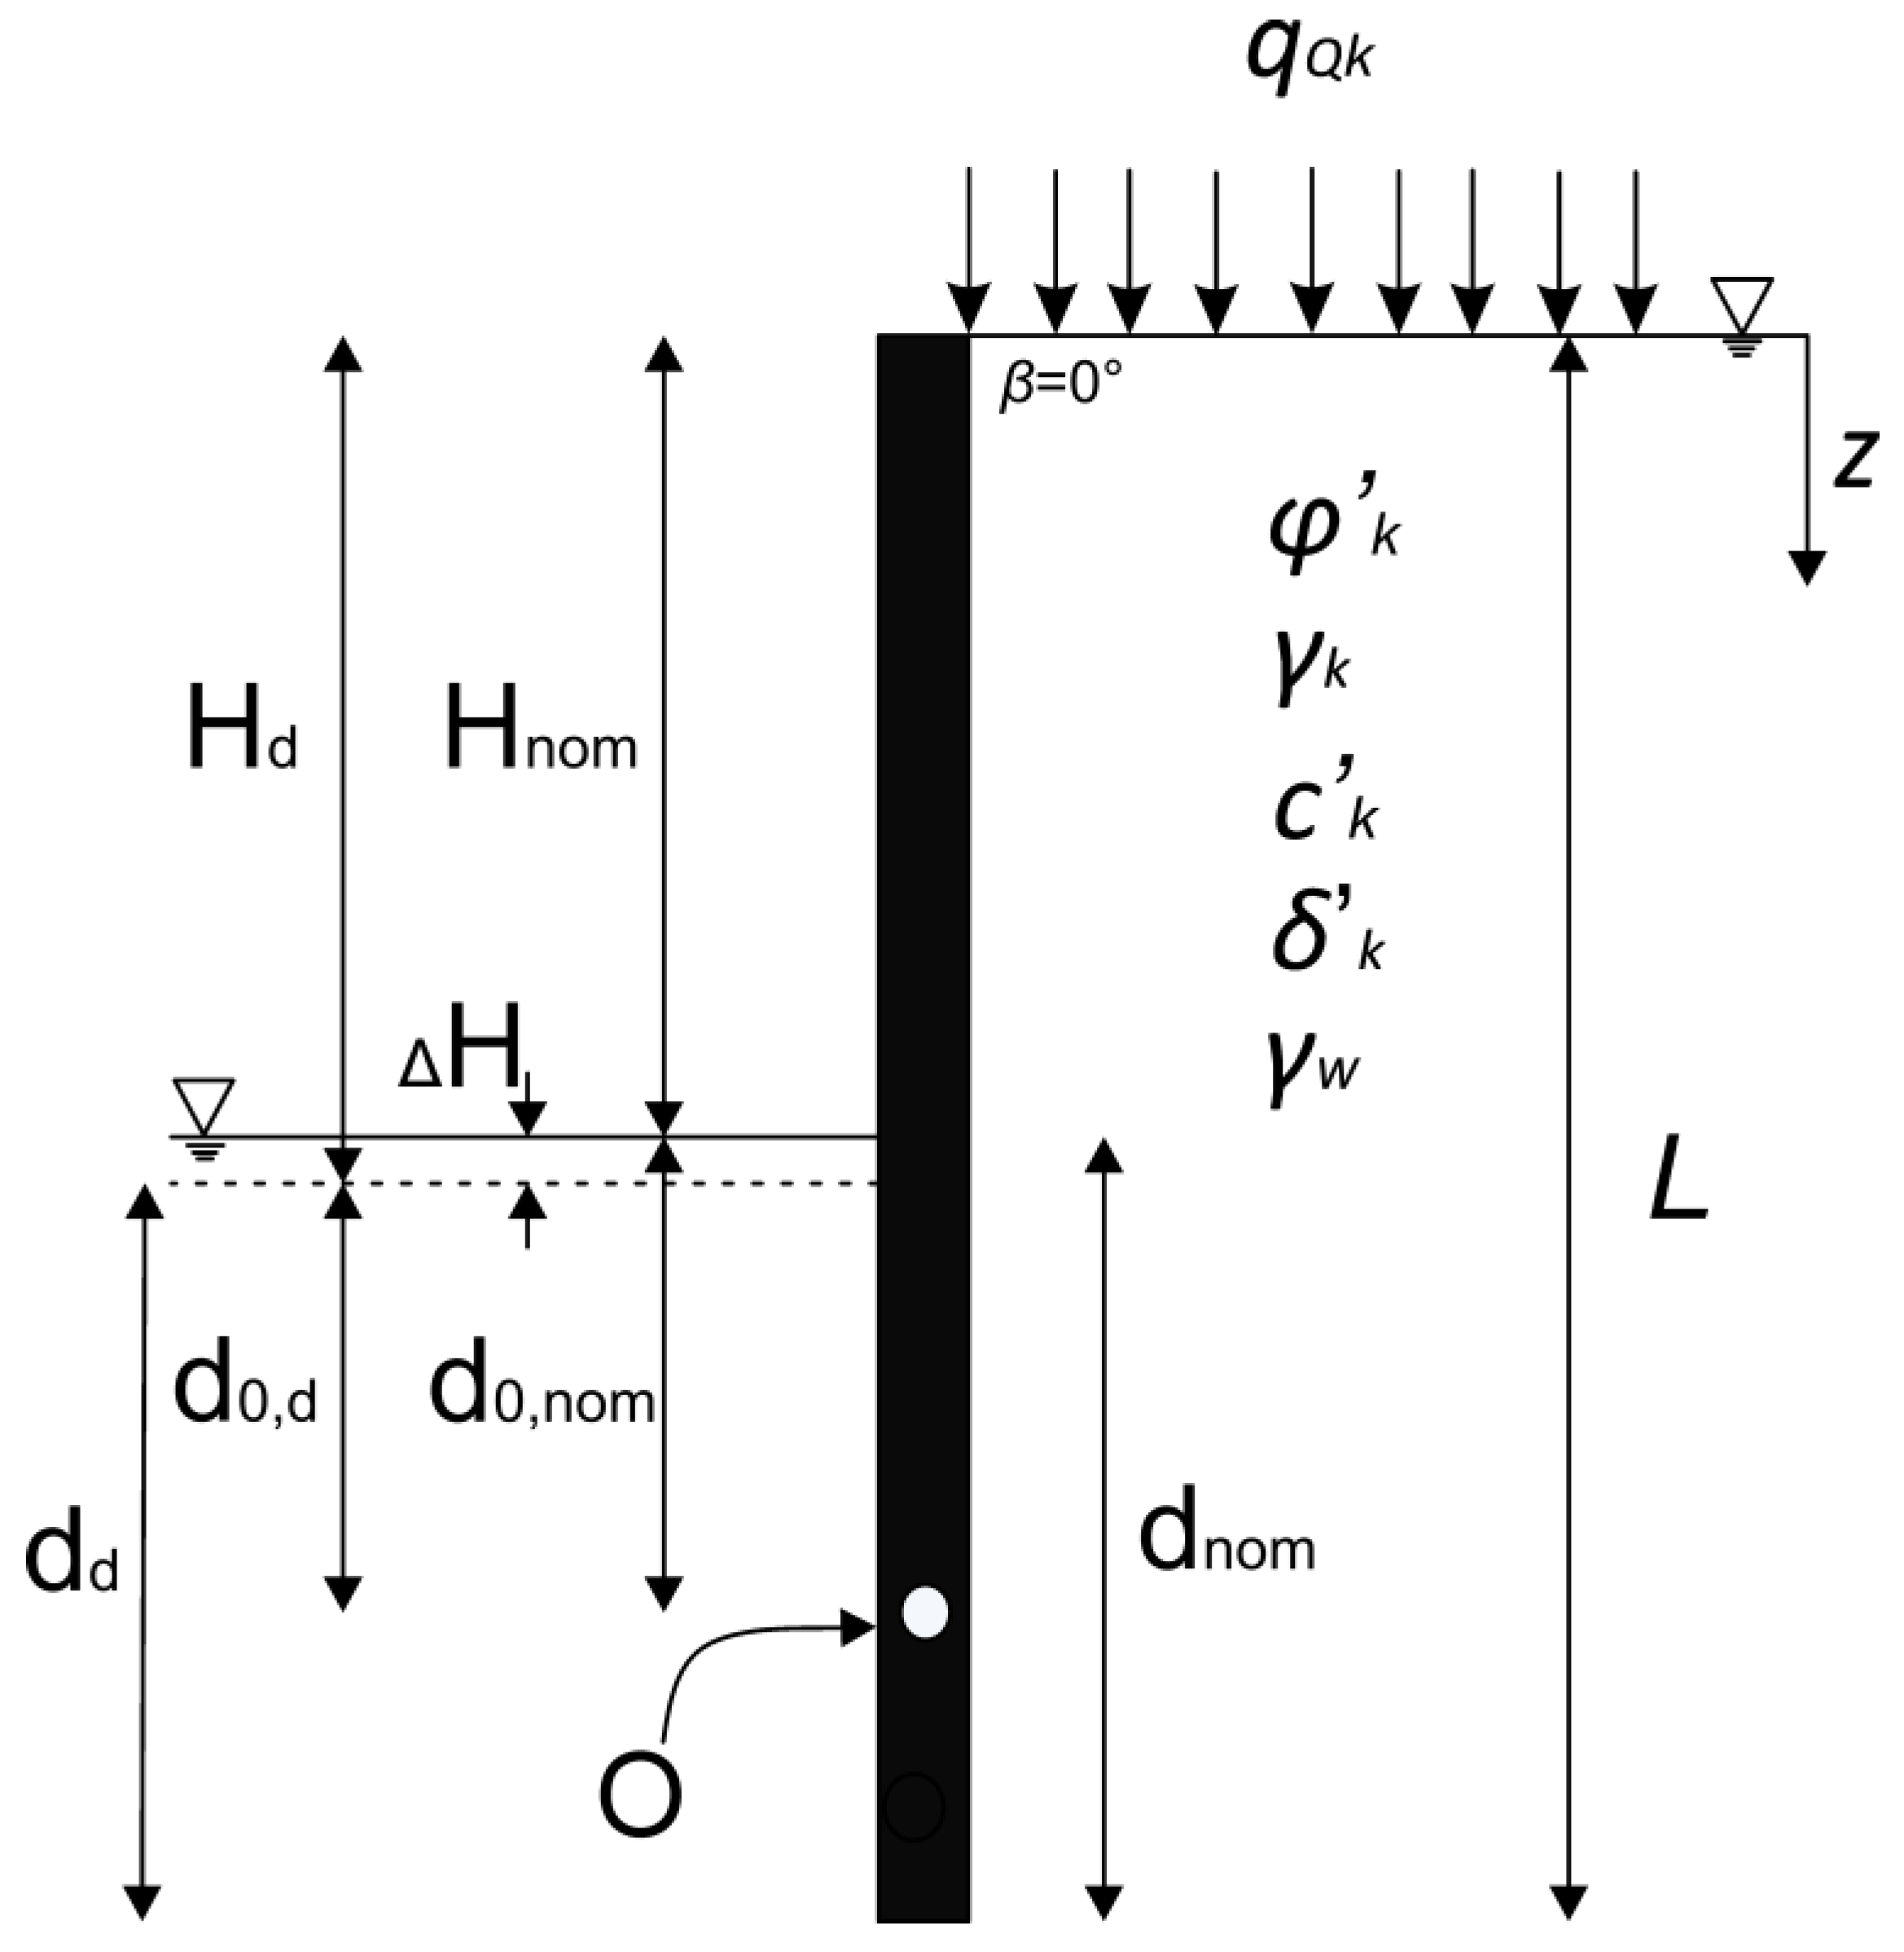
Figure 1. Input parameters for the embedded retaining wall optimization model.
Applsci 14 11135 g001
Figure 2. Effects of seepage on water pressure according to DIN 4085:2011-05 [27].
Applsci 14 11135 g002
Figure 3. Comparison between (a) methodology 1 and (b) methodology 2.
Applsci 14 11135 g003
Figure 4. Probability density function of random variables.
Applsci 14 11135 g004
Figure 5. Relationship between embedment depth and probability of failure.
Applsci 14 11135 g005
Table 1. Geotechnical constraints for the deterministic and the expanded optimization model ORW.
Condition 1: H E d H R d (2)
H E d = Σ H E d , z , i + Σ H E d , w , i (2a) σ p , d , 5 = S F G , f a v · K p γ h · σ v , k , 5 + c d · K p c h (2ai)
H E d , z , 1 = σ a , d , 1 · H n o m (2b) σ p , d , 6 = S F G , f a v · K p γ h · σ v , k , 6 + c d · K p c h (2aj)
H E d , z , 2 = ( σ a , d , 2 σ a , d , 1 ) · H n o m 2 (2c) σ v , k , 5 = z 5 · γ k , p (2ak)
H E d , z , 3 = σ a , d , 3 · d 0 , n o m (2d) σ v , k , 6 = σ v , k , 5 + d 0 , d · γ k , p (2al)
H E d , z , 4 = ( σ a , d , 4 σ a , d , 3 ) · H n o m 2 (2e) Δ u p , 5 = u p , 5 + i p · z 5 · γ w (2am)
H E d , w , 1 = Δ u a , 1 · H n o m (2f) Δ u p , 6 = u p , 6 + i p · d 0 , d · γ w (2an)
H E d , w , 2 = Δ u a , 2 · H n o m 2 (2g) u p , 5 = z 5 · γ w (2ao)
H E d , w , 3 = Δ u a , 3 · d 0 , n o m (2h) u p , 6 = d 0 , d · γ w (2ap)
H E d , w , 4 = ( Δ u a , 4 Δ u a , 3 ) · H n o m 2 (2i)Three different cases are analyzed and the change in unit weight for γ k , a and γ k , p is as follows:
σ a , d , 1 = S F G · K a γ h · σ v , k , 1 c d · K a c h + S F Q · K a q h · q Q k (2j)Case 1: no presence of groundwater:
σ a , d , 2 = S F G · K a γ h · σ v , k , 2 c d · K a c h + S F Q · K a q h · q Q k (2k) γ k , a = γ k (2ar)
σ a , d , 3 = S F G · K a γ h · σ v , k , 3 c d · K a c h + S F Q · ( K a q h · q Q k ) (2l) γ k , p = γ k (2as)
σ a , d , 4 = S F G · K a γ h · σ v , k , 4 c d · K a c h + S F Q · ( K a q h · q Q k ) (2m)Case 2: groundwater is present (hydrostatic conditions):
σ v , k , 1 = z 0 · γ k , a (2n) γ k , a = γ k = γ k γ w (2at)
σ v , k , 2 = σ v , k , 1 + H n o m · γ k , a (2o) γ k , p = γ k = γ k γ w (2au)
σ v , k , 3 = σ v , k , 1 + H n o m · γ k , a (2p)Case 3: groundwater and seepage are present:
σ v , k , 4 = σ v , k , 3 + d 0 , n o m · γ k , a (2r) γ k , a = γ k , a = γ k γ w + γ w · i a (2av)
Δ u a , 1 = u a , 1 i a · z 0 · γ w (2s) γ k , p = γ k , p = γ k γ w γ w · i p (2az)
Δ u a , 2 = u a , 2 i a · H n o m · γ w (2t) i a = 0.7 · H d L · L · d 0 , d (2ba)
Δ u a , 3 = u a , 3 i a · H n o m · γ w (2u) i p = 0.7 · H d d 0 , d · d 0 , d · L (2bb)
Δ u a , 4 = u a , 4 i a · ( H n o m + d 0 , n o m ) · γ w (2v) K a γ h K p γ h } = K n · cos β · cos β θ (2bc)
u a , 1 = z 0 · γ w (2z) K a c h K p c h } = ( K n 1 ) · cot φ d (2bd)
u a , 2 = H n o m · γ w (2aa) K a q h K p q h } = K n · cos 2 β (2be)
u a , 3 = H n o m · γ w (2ab) K n = 1 ± sin φ d · sin 2 m w ± φ d 1 sin φ d · sin 2 m t ± φ d · e 2 · m t + β m w θ · tan φ d (2bf)
u a , 4 = ( H n o m + d 0 , n o m ) · γ w (2ac) 2 m t = cos 1 sin β sin φ d φ d β (2bg)
H R d = Σ H R d , z , i + Σ H R d , w , i (2ad) 2 m w = cos 1 sin δ d sin φ d φ d δ d (2bh)
H R d , z , 5 = ( σ p , d , 5 · d 0 , d ) / S F R e (2ae) φ d = tan 1 tan φ k S F φ (2bi)
H R d , z , 6 = ( ( σ p , d , 5 σ p , d , 6 ) · d 0 , d 2 ) / S F R e (2af) δ d = φ d · k a (2bj)
H R d , w , 5 = Δ u p , 5 · d 0 , d (2ag) c d = c k S F c (2bk)
H R d , w , 6 = Δ u p , 6 · d 0 , d 2 (2ah)
Condition 2: M E d = M R d (3)
M E d = Σ M E d , z , i + Σ M E d , w , i (3a) M E d , w , 3 = H E d , w 3 · d 0 , n o m 2 (3h)
M E d , z , 1 = H E d , z , 1 · ( H n o m 2 + d 0 , n o m ) (3b) M E d , w , 4 = H E d , w 4 · d 0 , n o m 3 (3i)
M E d , z , 2 = H E d , z , 2 · ( H n o m 3 + d 0 , n o m ) (3c) M R d = Σ M R d , z + Σ M R d , w (3j)
M E d , z , 3 = H E d , z , 3 · d 0 , n o m 2 (3d) M R d , z , 5 = H R d , z 5 · d 0 , d 2 (3k)
M E d , z , 4 = H E d , z , 4 · d 0 , n o m 3 (3e) M R d , z , 6 = H R d , z 6 · d 0 , d 3 (3l)
M E d , w , 1 = H E d , w , 1 · ( H n o m 2 + d 0 , n o m ) (3f) M R d , w , 5 = H R d , w 5 · d 0 , d 2 (3m)
M E d , w , 2 = H E d , w , 2 · ( H n o m 3 + d 0 , n o m ) (3g) M R d , w , 6 = H R d , w 6 · d 0 , d 3 (3n)
Condition 3: G d , s t b S d , d s t (4)
G d , s t b = d d 2 · d d · γ k , p (4a) h 1 = ( H d + d d ) H d · 0.5 (4d)
S d , d s t = d d 2 · h s · γ w (4b) h 2 = d d (4e)
h s = h 1 h 2 (4c)
Correlation of the heights and depths:
d 0 , n o m = d 0 , d + Δ H (4f) d d = d n o m Δ H (4i)
Δ H = m i n ( 0.1 · H n o m ; 0.5 ) (4g) L = H n o m + d n o m (4j)
d 0 , d = d d / 1.2 (4h)
Table 2. Results of the laboratory test that were carried out on the soil samples.
Random VariableValue Estimated with Laboratory Tests and Field Tests
φ′k (°)34.3534.4634.6734.7535.2135.7135.8135.9736.0636.11
36.3336.3936.8137.2637.76
c′k (kPa)5.715.795.855.905.925.965.975.986.076.13
6.226.366.376.446.48
γk (kN/m3)19.6119.7919.9119.9219.9820.5420.6820.8420.9921.02
21.3421.4921.5521.7821.82
Table 3. Informative prior information of the random variables.
Random VariablesMin. ValueMax. ValueCOV [%]Min. Standard DeviationMax. Standard Deviation
φ′k (°)34.3537.765–101.723.78
c′k (kPa)5.716.4820–301.141.95
γk (kN/m3)19.6121.824–60.781.31
Table 4. Values of random variables after MCMC sampling.
Random VariableStatistical ParameterValueDistribution
φ′k (°)Mean value35.15Normal
Standard deviation0.82
c′k (kPa)Mean value6.6Normal
Standard deviation1.05
γk (kN/m3)Mean value20.55Normal
Standard deviation0.24
kaMinimal value0.5Triangle
Most probable value2/3
Maximal value1
Mean value0.71
Standard deviation0.1
kpMinimal value0.3Triangle
Most probable value0.35
Maximal value0.5
Mean value0.39
Standard deviation0.11
Table 5. Input data for the optimization model ORW.
SymbolDescription Value
qQ,kUniformly distributed surcharge load14.5 kN/m
βSlope angle
hGroundwater height0 m
kaReduction coefficient on the active side2/3
kpReduction coefficient on the passive side0.35
φ′kShear angle of soil33.80°
c′kCohesion of soil4.87 kPa
γkUnit weight of soil20.16 kN/m3
γwUnit weight of water9.81 kN/m3
HnomHeight of excavation3.2 m
Partial safety factors for DA2DA2
SFGPartial safety factor for permanent actions1.35
SFG,favPartial safety factor for favorable permanent actions1.0
SFQPartial safety factor for variable actions1.5
SFφPartial safety factor for the shear angle1.0
SFcPartial safety factor for the cohesion1.0
SFRePartial safety factor for earth resistance1.4
Table 6. Optimal designs for various conditions obtained using the partial safety factor approach.
No GroundwaterGroundwater Present
(Hydrostatic Conditions)
Groundwater and Seepage
(Groundwater-Flow)
Groundwater, Seepage and Hydraulic Heave
dd [m]2.6916.4596.5206.520
Table 7. Optimal designs obtained using methodology 2 for each target failure probability (TFP).
TFPEmbedment Depth dd [m]
No GroundwaterGroundwater Present
(Hydrostatic Conditions)
Groundwater and Seepage
(Groundwater-Flow)
Groundwater, Seepage and Hydraulic Heave
02.726.717.147.14
0.000012.716.596.906.90
0.000052.686.346.576.57
0.00012.626.066.326.32
0.00052.495.896.096.09
0.0012.455.785.985.98
0.0052.335.515.675.67
0.012.275.365.515.51
0.052.15.025.135.13
0.12.024.794.934.93
11.232.622.822.82
Table 8. Failure probability of optimal designs obtained using the partial safety factor approach.
No GroundwaterGroundwater Present
(Hydrostatic Conditions)
Groundwater and Seepage
(Groundwater-Flow)
Groundwater, Seepage and Hydraulic Heave
Embedment depth dd [m]2.6916.4596.5206.520
Actual failure probability (AFP)0.000020.000020.000080.00008
Table 9. Failure mechanisms for each combination of effects on the embedded retaining wall (N = 100,000).
Failure MechanismNo GroundwaterGroundwater Present
(Hydrostatic Conditions)
Groundwater and Seepage
(Groundwater-Flow)
Groundwater, Seepage and Hydraulic Heave
H E d H R d 0 0 *000
M E d M R d 0 2288
S d , d s t G d , s t b 0 0008
* Number of failure events.
Disclaimer/Publisher’s Note: The statements, opinions and data contained in all publications are solely those of the individual author(s) and contributor(s) and not of MDPI and/or the editor(s). MDPI and/or the editor(s) disclaim responsibility for any injury to people or property resulting from any ideas, methods, instructions or products referred to in the content.