Article

Shelf Life and Organoleptic Attributes of Multifruit Smoothies Treated by Combined Mild Preservation Technologies

1
Department of Food Microbiology Hygiene and Safety, Institute of Food Science and Technology, Hungarian University of Agriculture and Life Sciences, 1118 Budapest, Hungary
2
Department of Livestock Products and Food Preservation Technology, Institute of Food Science and Technology, Hungarian University of Agriculture and Life Sciences, 1118 Budapest, Hungary
3
Department of Food Measurement and Process Control, Institute of Food Science and Technology, Hungarian University of Agriculture and Life Sciences, 1118 Budapest, Hungary
4
Correltech Laboratory, Adexgo Kft., Nagytétényi Str. 100., 1222 Budapest, Hungary
*
Author to whom correspondence should be addressed.
Appl. Sci. 2024, 14(23), 11223; https://doi.org/10.3390/app142311223
Submission received: 14 September 2024 / Revised: 18 October 2024 / Accepted: 27 November 2024 / Published: 2 December 2024
(This article belongs to the Special Issue Advanced Technologies for Food Packaging and Preservation)

Abstract

:
The application of high hydrostatic pressure and mild heat treatment represents preservation processes for extending the shelf life of food products without compromising their quality. The combination of these physical methods at lower applied levels represents a promising approach to preserving the quality of treated products. This study aims to investigate the impact of combined treatments on the quality and storage stability of strawberry, banana, almond milk and avocado smoothies. The total colony count, electronic nose and tongue signals, colour, viscosity and sensory properties were examined over a 14-day storage period at 6 °C. The combined treatments were found to be effective in reducing the total colony count. During the sensory analysis, the impact of storage was the most prominent factor. Both the treatments and storage conditions significantly affected the colour characteristics of the samples. The smoothie samples exhibited pseudoplastic flow behaviour. Both applied treatments resulted in enhanced texture stability of the samples during the storage period. The electronic tongue and nose could differentiate between groups of fresh and stored samples, as well as between control and treated samples.

1. Introduction

It is well documented that the consumption of fresh fruits and products derived from them is highly beneficial from a nutritional and biological perspective. Adequate daily intake can play a pivotal role in the prevention of significant illnesses, including cardiovascular disease, cancer, diabetes, and obesity [1,2,3]. The lack of convenience is identified by consumers as a significant barrier to fruit consumption [4]. Fruit shakes and smoothies are a popular and convenient way of consuming fruit. The term “smoothie” is used to describe a blended beverage that typically contains fruit, juice, ice, yoghurt, and milk or a milk substitute. The consumption of such beverages has the potential to markedly enhance the daily intake of antioxidants. Antioxidants are bioactive molecules that are found in a variety of fruits and can inhibit the oxidation of other compounds. Antioxidants play a significant role in the biological defence against degenerative diseases [5]. The function of antioxidants is to protect the fruit from oxidative damage, which is a crucial factor in determining the quality of the fruit. Smoothies are a healthy, tasty food product that can be consumed immediately and conveniently, thereby satisfying consumer demand. Consequently, their rapid growth in popularity has made them one of the fastest-growing food industries in the world [6].
The fruit processing industry typically employs thermal processing techniques to extend the shelf life and enhance the safety of the products in question [7,8]. However, the temperatures used during processing (heat treatments between 60 °C and 100 °C to destroy target microorganisms or enzymes) typically have a detrimental impact on heat-labile components (e.g., vitamins, antioxidants, polyphenols), resulting in a reduction in nutrient content and deterioration of physico-chemical, rheological and sensory properties [9,10,11]. Concurrently, there is a growing consumer demand for minimally processed, high-quality, safe foods that are more similar to fresh products. Survey findings suggest that individuals in the European Union perceive minimally processed products to possess superior taste and appearance [12].
In response to the necessity of maintaining sensory, nutritional and health-preserving properties and to satisfy consumer needs, research is being conducted into non-thermal methods of food preservation, which serve as a promising alternative to thermal processes [13,14]. Among the non-thermal processing methods, high hydrostatic pressure (HHP) processing offers the possibility of mild fruit preservation while affecting their sensitive components less than heat treatment [15]. The HPP treatment has been successfully applied to a variety of fruit-based products, including jams [16], purées [17] and fruit juices [18].
The direct effect of HPP on the sensory properties of fruit preparations is minimal. HPP-treated products preserve the original colour, freshness, aroma, and taste of the fruit. Additionally, the colour change is minimal, and HPP extends the stability and shelf life of the products [14,19,20,21]. Despite the fact that HHP processing has been used commercially for several years in a few countries besides Japan, it has not yet become a widespread practice within the food industry. European consumers demonstrate a positive response to HHP technology, perceiving it as a viable alternative to traditional pasteurisation methods for fruit juice [22].
The application of high hydrostatic pressure (HHP) typically involves the use of a pressure range of 100 to 600 MPa, which is sufficient to inactivate microbial vegetative cells and enzymes in foodstuffs at ambient temperature [23,24]. Consequently, it may also result in a reduction of the energy consumption typically associated with heating and cooling processes [25]. As the cost of the HHP treatment rises in direct proportion to the pressure employed, it is advisable to utilise a value below 300 MPa and, if feasible, to implement a treatment time of under five minutes [26]. It is only possible to minimise the treatment parameters without compromising the efficiency of pathogen and spoilage microbiota inactivation. This can be achieved, for instance, by combining pressure and a mild temperature [27]. The parameters of pressure treatment depend on a number of factors. With the exception of spores, the majority of microbes can be inactivated at pressures below 300 MPa. In the case of fruits and vegetables, deterioration is generally caused by moulds and yeasts. Treatment at 300 MPa for five minutes achieved a 5-log reduction of vegetative cells of Z. bailii in apple, orange, pineapple, cranberry and grape juice. In contrast, the same treatment for ascospores only achieved a 0.5–1-log reduction [28].
As the taste of fruit-based products is the primary factor influencing consumer acceptance and preference [29,30], it is crucial to assess the sensory quality of HPP-treated fruit products. It is generally accepted that the evaluation of sensory qualities represents an important indicator in the instinctive assessment of food quality and shelf life. In the food industry, chemical analysis and microbiological testing are usually required to objectively assess the quality of food. Nevertheless, high-performance analytical instruments are not always appropriate for this objective due to the high costs and time demands of sample preparation. It is, therefore, necessary to develop alternative methods that facilitate rapid and cost-effective analysis of samples. The application of the electronic nose and tongue represents such an alternative. In response to the needs of food producers and consumers, the electronic tongue and the electronic nose are used in many areas to guarantee the quality and safety of food throughout food production [31].
An electric nose (E-nose) is an instrument that can discriminate and classify foods by evaluating the volatile profile and aroma pattern of the samples [32,33]. This device comprises electronic chemical sensors that are capable of mimicking the human sense of smell [34]. The E-nose is a rapid, sensitive, and non-destructive analytical tool for evaluating the aroma and flavour of foodstuffs [35]. An electronic tongue is an electrochemical, non-specific, multi-sensor device with global selectivity that imitates the taste ability of the human tongue. The electronic tongue has several advantages over trained human panellists, namely the absence of perceptual fatigue, the possibility of analysing toxic substances and objective analysis while minimising the risk of human subjectivity [36].
The analysis of multicomponent matrices can be conducted using non-specific or low-selectivity sensors, which generate signals that are beneficial for analytical purposes. This approach employs the use of electronic tongue and nose. Electronic tongue is a multi-sensor system comprising three principal parts: the sensor array, the signal acquisition system, and the pattern recognition system. It employs sophisticated mathematical methodologies for signal processing based on pattern recognition (PARC) and/or multivariate analysis. The electronic tongue may be potentiometric, voltametric, or impedance spectroscopic, depending on the operating principles of the sensors in question [37,38].
The electronic nose is comprised of three principal components: the sampling unit, which contains the sensors; the signal processing unit; and the pattern recognition algorithm for identifying simple or complex odours. The sensor is typically constructed from a variety of materials, including metal oxides and conductive polymers, whose electrical resistance and sensitivity are altered when exposed to volatile compounds [39]. In the field of electronic noses, there is a growing prevalence of versions that operate according to the GC principle among the latest generations of these devices.
To date, only a limited number of studies have evaluated the impact of HHP and mild heat treatment on smoothies. It is unclear whether the findings from studies examining individual fruit purées can be extrapolated to mixtures. Therefore, the objective of this study was to examine the traditional and instrumental sensory properties of a strawberry-based smoothie product and some content characteristics during a 2-week storage period.

2. Materials and Methods

2.1. Materials

The subject of our experiments was a self-made smoothie. The proportions of the ingredients were determined based on preliminary sensory evaluations. The composition that was most preferred by the evaluator was as follows: strawberry (37%), almond milk (26%), banana (24%) and avocado (13%). The ingredients were blended (Robot Coupe Mini MP 160 V.V., Robot-Coupe Ltd., Montceau-les-Mines, France) until a homogeneous mixture was obtained. This mixture was then filled into pressure-resistant bags in 25 g portions hermetically sealed.

2.2. Preparation of Samples

HHP treatments were carried out with Resato FPU-100-2000 type equipment, (Resato International B.V, Assen, The Netherlands) wherein the pressure transfer medium is Resato PG fluid. The adiabatic temperature increase during treatments is 3 °C per 100 MPa.
As a preliminary experiment, the total colony count of the samples was determined. The samples were subjected to heat and/or pressure treatment at 60 °C for 5 min or at 250 MPa for 5 min. Additionally, a number of samples underwent a combination of HHP and heat treatment, which was applied in varying sequences. Accordingly, a subset of samples was subjected to heat treatment prior to pressure treatment, while another subset underwent the opposite sequence. Following the completion of the treatments, the samples were promptly cooled with ice water and subsequently stored for a period of 14 days at either 6 or 15 °C. All batches were prepared under the same refrigerated conditions (<10 °C) with the same pH value (pH 4.5).
The following samples were selected for further testing (colourimetry, rheological examination, electronic tongue and electronic nose) based on the results of the preliminary experiment: control, mild heat treatment at 60 °C, 5 min combined with 250 MPa, 5 min and the same treatment in the reverse order, i.e., pressure treatment at 250 MPa, 5 min combined with 60 °C, 5 min and stored only at 6 °C for 14 days.

2.3. Total Colony Count Evaluation

The total colony count was determined both immediately following the treatment and after 14 days of storage at 6 and 15 °C. The analysis was conducted in triplicate.
A total colony count was determined using the pour plate method with plate count agar (PCA agar, Merck 105463, Merck KGaA, Darmstadt, Germany), which was supplemented with a triphenyl-tetrazolium-chloride (TTC) solution to facilitate the counting process. Finally, plates were evaluated after a two-day incubation period at 30 °C under aerobic conditions.

2.4. Sensory Evaluation

The panellists evaluated samples both fresh and after a period of 14 days of storage. In order to ensure a fair comparison between the fresh and stored samples, the smoothie samples were prepared in two separate batches. The first batch consisted of samples stored at 6 °C for a period of 14 days, while the second batch consisted of fresh samples prepared on the day of judging.
The sensory evaluation was conducted by the Institute of Food Science and Technology of the Hungarian University of Agriculture and Life Sciences with the assistance of an untrained panel of 20 judges, who were tasked with ranking the six samples as follows:
  • From least brown to most brown;
  • From least to most fruity;
  • From least to most dense;
  • From least fruity flavour to most fruity character;
  • From least to most popular.
In order to determine whether there are significant differences between the samples, the largest difference between the rank sums should be compared with the critical values of the differences between the rank sums. In the event that a significant difference is identified, multiple comparisons should be performed in order to determine whether there are significant differences between all pairwise comparisons. If the difference in the rank sums of one sample in comparison to another sample equals or exceeds a specified critical value, the samples are considered to be significantly different [40].

2.5. Colourimetry

The colour characteristics were quantified using a Konica Minolta CR-400 (Konica Minolta, INC., Tokyo, Japan) tristimulus colorimeter in 5 replicates.
The instrument determines the lightness (L*), red–green (a*) and yellow–blue (b*) colour coordinates. From these coordinates, the colour difference ΔE* can be calculated in order to express the degree of change perceived by the human eye:
Δ E a b = Δ L 2 + Δ a 2 + Δ b 2
The human eye may not always be able to distinguish between two different colour points. Therefore, the difference in chromaticity, ΔE*, is used to quantify this difference (Table 1).
In addition to the chromatic difference, a colour point can also be characterised by its chroma value (C*) and hue angle (h°). The chroma and hue angle are calculated from the red–green (a*) and yellow–blue (b*) factors using the following equations:
C a b = a 2 + b 2
h a b = a r c t g b a
Chroma is a vector quantity that indicates the distance of a given colour point from the L* axis. An increase in distance or chroma value indicates a greater degree of saturation in the colour point.

2.6. Examination of the Rheological Properties of Smoothie Samples

The rheological properties were evaluated in triplicate on days 0 and 14 at 20 °C according to the method of Hidas et al. [42]. The measurements were made with a concentric cylinder system (cup diameter 28.920 mm, bob diameter 26.651 mm, bob length 40.003 mm, active length 120.2 mm, positioning length 72.5 mm) on a rotating MCR 92 rheometer (Anton Paar, Ltd., Les Ulis, France). The apparatus was operated using the RheoCompass software (version 1.21.852, Anton Paar, Ltd.). Shear stress and apparent viscosity were measured at 3 s intervals using a range of logarithmically increasing and decreasing shear between 10 and 1000 s−1. The evaluation was carried out by contrasting the flow curves (shear rate–shear stress) and viscosity curves (shear rate–apparent viscosity) in the decelerating phase. To further characterise the rheological behaviour of the samples, the Excel Solver using the least squares method was used to apply the Herschel–Bulkley model (Equation (4)), which was previously determined to be the best fitting model [43], to the flow curves. The coefficient of determination (R2 > 0.95) was used to assess the goodness of fitting.
τ = τ 0 + K γ ˙ n
where τ is shear stress (Pa); τ0 is yield stress (Pa); γ ˙ is shear rate (s−1); K is the consistency coefficient (Pa·sn), and n is the flow behaviour index (dimensionless).

2.7. Electronic Tongue Alaysis

The electronic tongue measurements were performed using the Alpha Astree type electronic tongue (Alpha M.O.S., Toulouse, France) with Ag/AgCl reference electrode and chemically modified field-effect transistor sensors (AHS, PKS, CTS, NMS, CPS, ANS, SCS) developed for liquid analysis. To prepare the samples, 10 g of the sample were placed in a 100-millilitre flask and filled to the mark with distilled water. The samples were then filtered first through a metal filter and then through filter paper. Before the actual analysis of the smoothie samples, the instrument was conditioned in two steps as recommended by the manufacturer. In the first step, 0.01 M HCl solution was used to condition the sensors, while in the second step of the conditioning, an equal mixture of the smoothie samples under study was used to reduce sensor drift. The signal acquisition was performed for 120 s for each of the randomly tested samples. Each sample was measured nine times with the electronic tongue resulting in a total of 54 readings for the tested smoothie samples.

2.8. Electronic Nose Analysis

One-gram aliquots of each sample were placed into 20 mL headspace vials in eight replicates and sealed with magnetic caps having UltraCleanTM polytetrafluoroethylene/silicone septa. The electronic nose measurements were performed using the Heracles Neo 300 electronic nose (Alpha M.O.S., Toulouse, France), according to Yakubu et al. [44]. The retention times of the chromatograms recorded at the flame ionisation detectors at the two gas chromatography columns (MXT-5; MXT-1701, Restek, Bellefonte, PA, USA) of the electronic nose were converted to retention indices (RIs) [45]. The AlphaSoft (ver 16) software (Alpha M.O.S., Toulouse, France) was used for operating the electronic nose and recording the data.
The settings of the measurement were the following: incubation at 40 °C for 5 min with 500 rpm agitation to generate headspace, 5 mL of headspace injected into the Heracles analyzer, flushing time between injections: 90 s; carrier gas: hydrogen, the flow of carrier gas: 30 mL/min, trapping temperature: 30 °C, initial oven temperature: 50 °C, the endpoint of oven temperature: 250 °C, heating rate: 2 °C/s, acquisition duration: 110 s, acquisition period: 0.01 s, injection speed: 125 μL/s, cleaning phase: 8 min. This setting has been successfully used in previous measurements to distinguish sample groups with high accuracy [46].

2.9. Data Analysis and Chemometrics

The results of total colony count, colour and rheological measurement were analysed by ANOVA models followed by Tukey’s pairwise comparisons (total colony count and colour) or Games–Howell test (rheology) (p < 0.05) with Past software (version 3.16, 2001). In the case of colour and rheological properties, the samples were compared using two approaches: one comparing fresh and stored samples that had undergone the same treatment, and the other comparing three fresh and three stored samples (control; 60 °C-250 MPa; 250 MPa-60 °C).
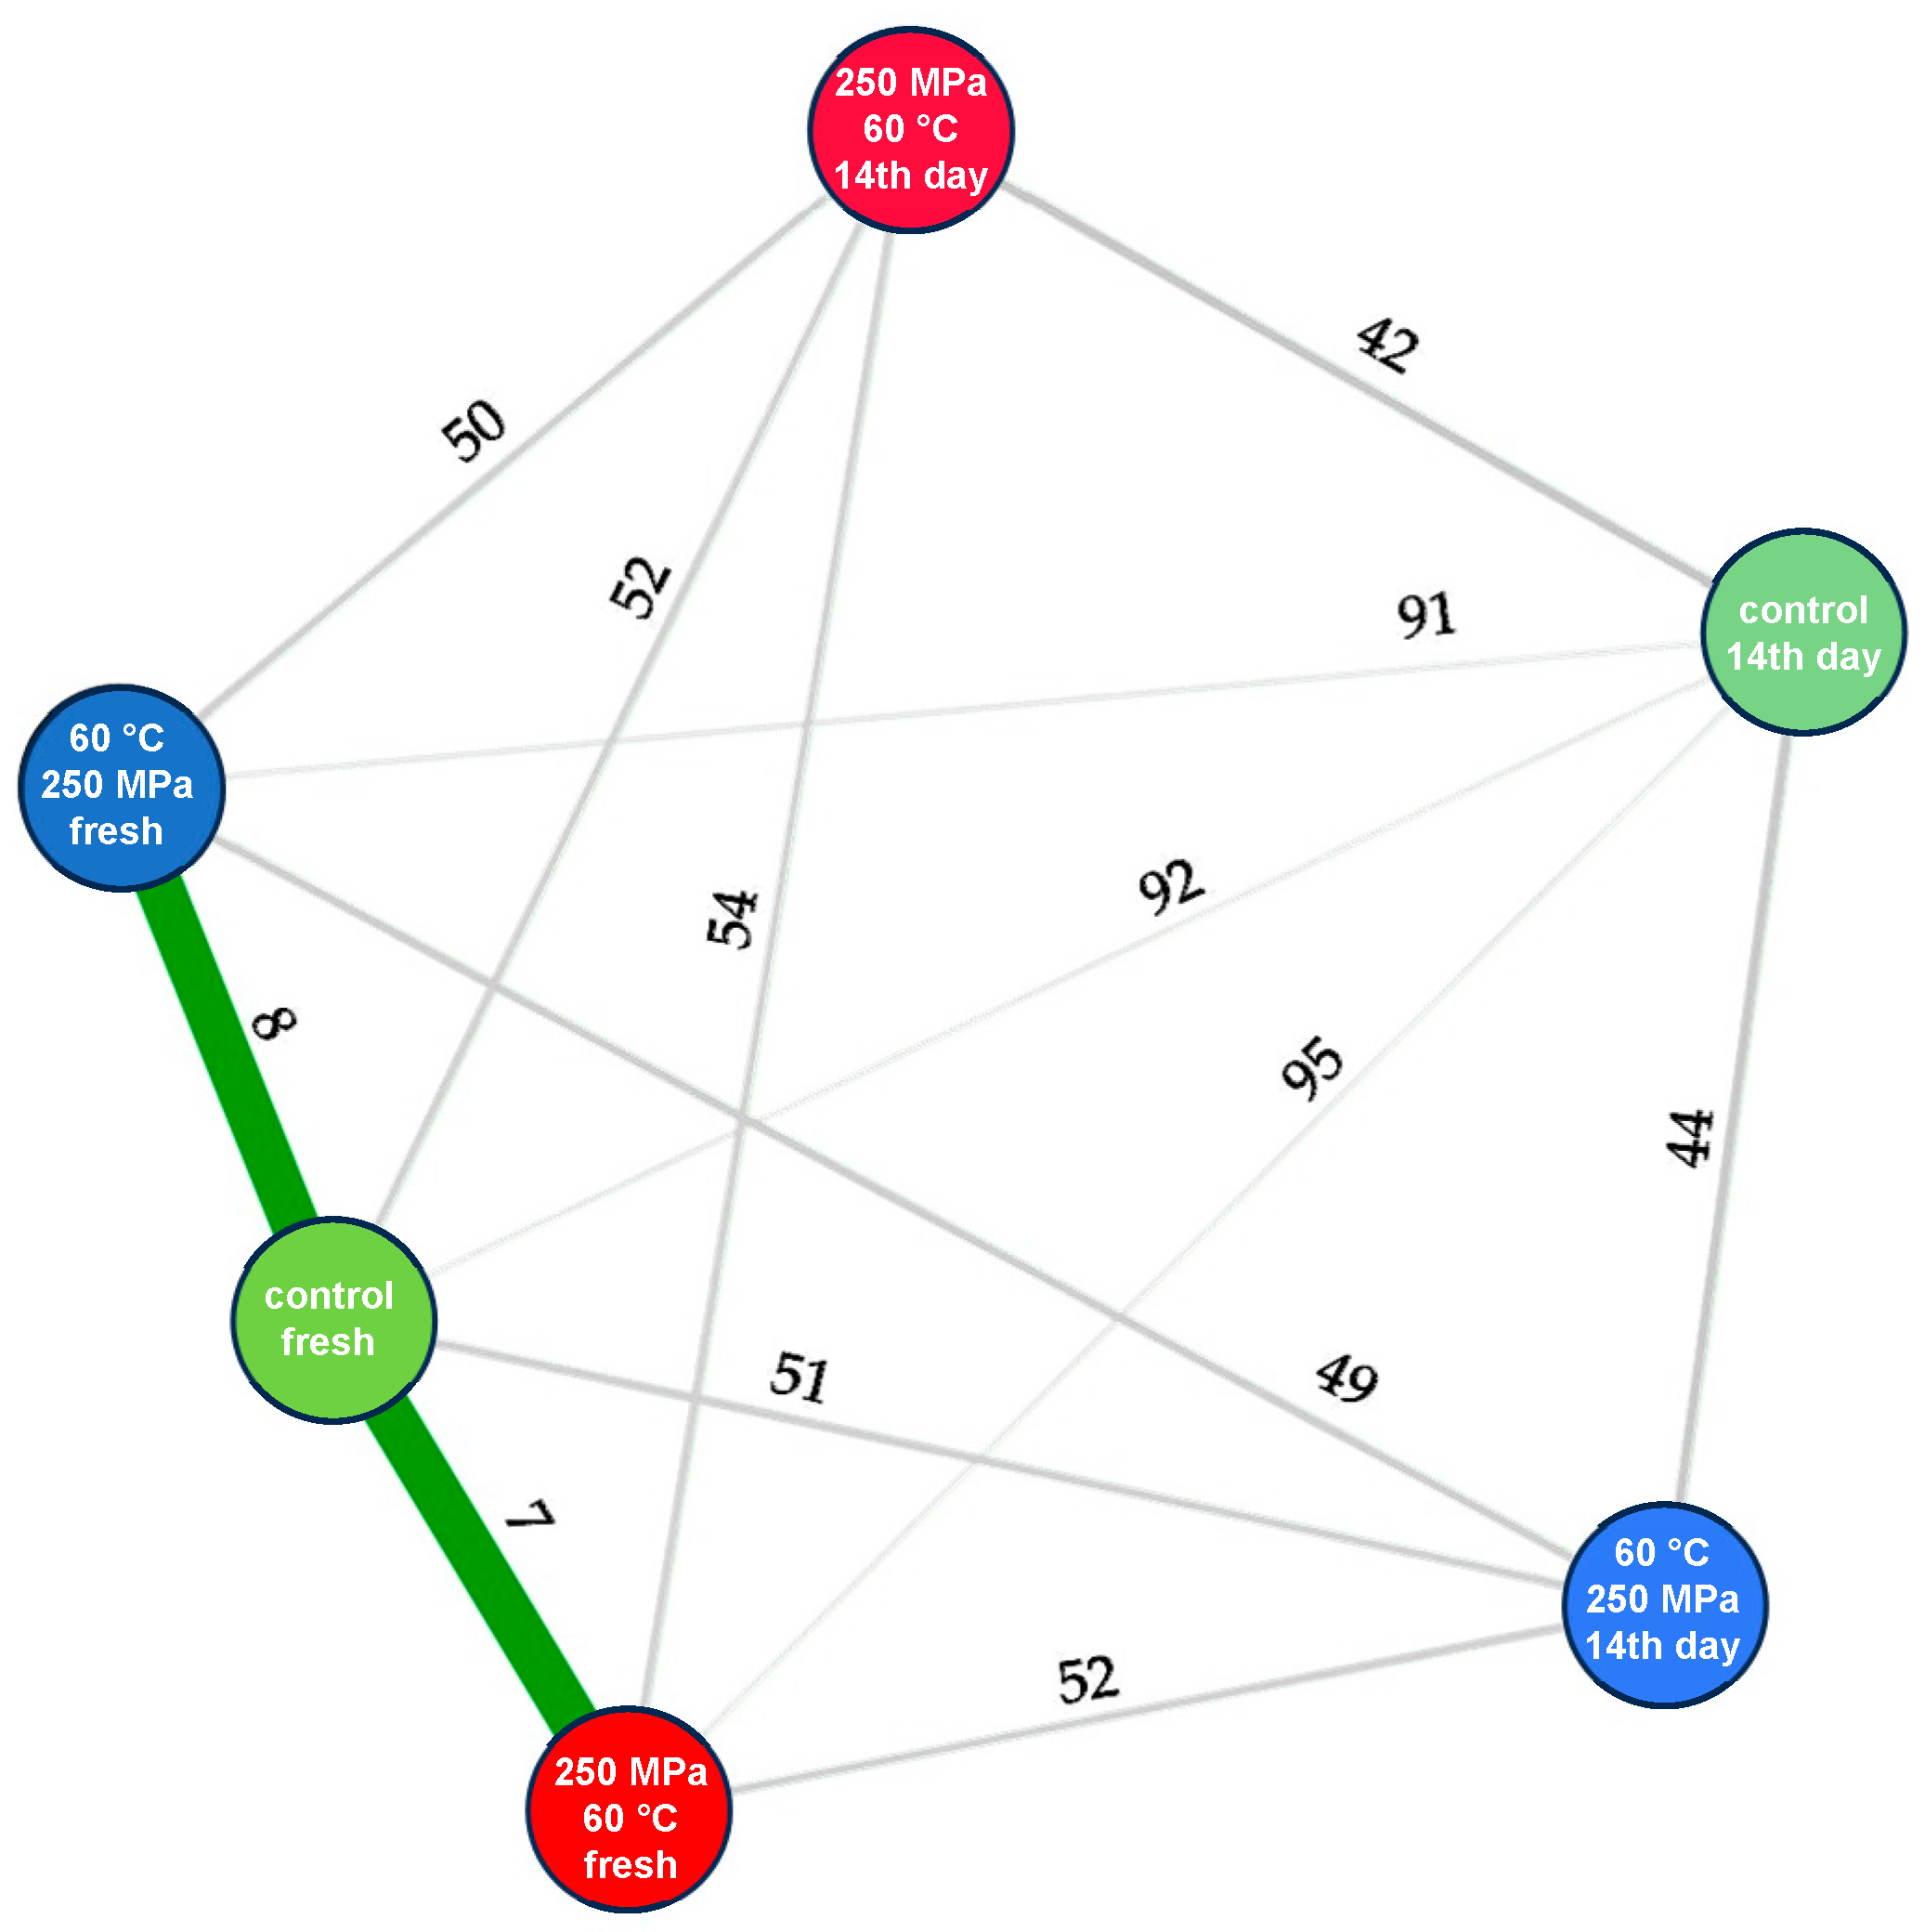
In the case of the electronic tongue, the stabilised and optimal sensitivity signals of the different sensors, i.e., the last 10 s of the acquired signals, were averaged and used for further statistical analysis. These raw sensor signals were first visualised and inspected to discover potential sensor failure, drift and outlying observations. The differences in the chemical fingerprints of the tested samples detected by the electronic tongue sensors were compared with the Euclidean distances that are often used in the literature for general comparison of the samples [47,48]. The calculated Euclidean distances were presented in a neuron-like graph for better visualisation. In this graph, the representations of the more similar samples (presenting shorter Euclidean distance) are closer to each other and connected by a thick line, while those more different by their chemical fingerprints are further from each other and connected by a thin line. Drift correction of the sensor signals was applied using the “Additive correction relative to all samples” method described by Kovacs et al. [49] to avoid potential baseline differences and drift in sensor signals. The chemometric evaluation of the sensor signals was performed by principal component analysis (PCA). The PCA scores were presented using different colouring schemes to better understand the multidimensional patterns developed by the different parameters of the samples (e.g., storage, heat and pressure treatment). The calculations and visualisations were executed in R-project ver. 4.2.3 [50].
The multivariate data of the electronic nose measurements describing the odour profiles of the samples were analysed using the AlphaSoft (ver. 16) software. The chromatograms were transformed into a signal series of virtual sensors based on the identified chromatogram peaks and areas under the curves [51]. Data preprocessing and multivariate data evaluation were performed as described by Yakubu et al. [44]. The most distinctive virtual sensors were selected during the data evaluation. The specific volatile compounds were assigned to the respective retention index associated with a virtual sensor using the AroChemBase v7 of the AlphaSoft software.

3. Results and Discussion

3.1. Microbiological Aspects

Figure 1 illustrates the trend in the total colony count of the smoothie samples during storage. Total colony counts decreased by at least one order of magnitude with either treatment applied. In contrast, the total colony count values of the control (untreated) sample demonstrated an increasing trend during storage. After two weeks of storage, it was already deteriorating at 6 °C.
Of the samples stored for two weeks, those subjected to the combined treatment had the best total bacterial counts. Storage at 6 °C caused little change in total colony counts, while samples stored at 15 °C had total colony counts more than two orders of magnitude higher than those tested on day 0 but still below 104 CFU/mL. The total colony counts of samples treated with the combined treatments and stored at 6 °C for 14 days were slightly lower than those of fresh samples. This reduction can be attributed to the enhanced preservative effect of the combination of mild heat and HHP treatment together with low storage temperatures (hurdle technology, [52]). According to the hurdle technology, microorganisms have to overcome more preservation factors as hurdles in order to multiply. Storage at 15 °C in combination with the treatments used did not provide an adequate preservative effect.
In samples that had been subjected to a single treatment, a significant increase in total colony count was observed after two weeks of storage at 6 °C. However, after two weeks of storage at 15 °C, the sample treated at 250 MPa exhibited signs of deterioration. The sample that was treated at 60 °C showed signs of spoilage after two weeks of storage at 15 °C.
Our results are consistent with those of Subasi et al. [53], who treated pomegranate juice at 200 MPa for 5 min. The reduction in microbial counts compared to the untreated control in their study was 1.2–1.7-log CFU/mL, whereas our results showed a reduction of 1.1-log CFU/mL.
A comparison of fresh samples treated differently revealed significant differences between the control sample and the others. A similar result was observed when comparing samples stored at 6 °C, with the control sample differing from the others. In this case, both the single and combined treated samples were distinguishable.
When comparing the results of the samples stored at 15 °C, no significant difference was found between the control and the 250 MPa treated samples or between the two combined treated samples. However, the control and 250 MPa treated samples and the combined treated samples exhibited a significant difference from each other, as well as from the sample treated at 60 °C. The non-thermal treatment was found to be ineffective in maintaining low microbial counts when storage temperatures were higher (15 °C) compared to the expected low value (6 °C). The additional thermal treatment was therefore required to ensure the desired microbial count during storage at 15 °C.
The total colony count of the samples was not affected by the order of treatments. The microbiological results indicated that storage at 15 °C did not produce an acceptable level of microbiological quality. Similarly, treatments at 60 °C for 5 min and at 250 MPa for 5 min alone resulted in a significant increase in total colony counts. Consequently, the following six samples were selected for further testing (for sensory evaluation, colourimetry, measurement of viscosity, electronic nose, and tongue):
  • Control, fresh;
  • Control, stored for 14 days at 6 °C;
  • 60 °C-250 MPa, fresh;
  • 60 °C-250 MPa, stored for 14 days at 6 °C;
  • 250 MPa-60 °C, fresh;
  • 250 MPa-60 °C, stored for 14 days at 6 °C.

3.2. Evaluation of Sensory Properties

Table 2 shows the results of the sensory evaluation. The judges determined that the control sample stored for two weeks exhibited the greatest density, and the samples treated at 60 °C-250 MPa and 250 MPa-60 °C were the most diluted. The control sample stored for two weeks was significantly different from the other samples, with the exception of the sample treated at 250 MPa-60 °C and stored for two weeks. The lowest ranking numbers were assigned to the treated versions of the fresh samples, indicating that the sensory evaluators perceived these samples to be the least dense. The fresh control samples were observed to exhibit slightly greater density than the treated samples, indicating that the treatments had resulted in a reduction in sample density. In all cases, the stored samples were assigned a higher ranking number, indicating that the evaluators perceived them to possess more unfavourable properties. The untreated sample received the highest ranking number, and the difference in scores was also significant. It can be concluded that the treatments could stabilise the texture of smoothie products. The 250 MPa-60 °C treatment appears to be more effective in preserving the texture until the end of the two-week storage period.
The judges found that the sample treated at 250 MPa-60 °C had the most pronounced fruity odour and the sample treated at 60 °C-250 MPa and stored for two weeks had the least fruity odour. The sample treated at 60 °C-250 MPa and stored for two weeks was significantly different from the control sample stored for two weeks and the sample treated at 250 MPa-60 °C. The least fruity character was observed in the two stored samples that had undergone a combined treatment. The control sample retained its favourable aroma characteristics despite storage, scoring essentially the same as the fresh samples. In the case of the fresh samples, the heat treatment applied after the pressure treatment appeared to have resulted in a more intense fruity character in the treated sample.
The fresh control sample was perceived as the most fruity by the evaluators, while the sample treated at 60 °C-250 MPa and stored for two weeks was perceived as the least fruity taste. There was a significant difference in taste between the fresh and stored samples for both treated and untreated samples. The evolution of the ranking numbers clearly demonstrates that the storage conditions exert a predominant influence on the perception of taste, as opposed to the presence or the type of preservation process employed. The judges perceived the fruit flavour of the stored samples to be less pronounced than that of the fresh samples, irrespective of the type of combined treatment used.
The sample subjected to 250 MPa-60 °C was perceived as the least brownish, while the pair of samples stored for two weeks with the same treatment was perceived as the most brownish. A significant difference was observed between the 250 MPa-60 °C treated sample and the control; the control was stored for two weeks, the 60 °C-250 MPa treated sample was stored for two weeks, and the 250 MPa-60 °C treated sample was stored for two weeks. The sample that exhibited the least browning was the sample that had undergone heat treatment subsequent to fresh pressure treatment. Although the fresh control sample was browner, it is not possible to conclude that the treatment resulted in lightening. Rather, it may be assumed that the combined treatments slowed down the browning process. By the time the test samples were presented to the judges, the fresh control sample had browned slightly. This difference between the samples that had completely disappeared by the end of 14 days of storage and were uniformly browned by the judges is noteworthy.
In terms of preference, the control was ranked first, while its two-week stored counterpart was ranked last. Once more, there was a significant difference between the fresh and stored samples. As might be expected, the judges gave preference to samples that were freshly prepared, according to their ranking numbers. The combined treatments were found to have an equally adverse effect on the fresh smoothie products. The rate of deterioration observed in the fresh samples was much more modest than that observed at the end of the storage period. Of the stored samples, the control sample was the least preferred.
In a study conducted by Keenan et al. [54], the sensory properties of apple, strawberry, banana and orange smoothies treated with HHP and gentle heat were investigated. They found that the freshness characteristics of the products, including fresh colour, fresh smell, fresh taste, and pink colour, gradually decreased during storage. This deterioration in flavour can be attributed to the degradation or oxidation of ester and aldehyde compounds, which is thought to be caused by residual enzyme activity.

3.3. Evaluation of Colourimetric Properties

The freshly prepared smoothie sample had a pinkish colour. Overall, the samples exhibited minimal change in colour due to treatment and storage (Table 3). As a result of the treatments, on day 0, there was a slight increase in L*, while a* slightly decreased and b* slightly increased. However, samples stored for 14 days showed a slight decrease in lightness factor and a slight increase in a* value when control samples were compared to the treated ones. Terefe et al. [55] also observed a similar trend in L* for strawberries during 4–6 weeks of storage.
The treated samples demonstrated a reduction in their a* values in comparison to the control. The treated samples exhibited a decrease of 10.18% and 14.80% in a* values, respectively, compared to the control. The loss of red colour in the samples is attributed to residual enzyme activity, which causes enzymatic browning of phenolic compounds. Škegro et al. [56] found a similar trend for the a* parameter in a fruit smoothie treated at 350 and 450 MPa.
The order of the treatments did not have a significant effect on the colour of the samples. The same conclusion was drawn in our previous study of strawberry puree samples that applied higher treatment levels of HHP and mild heat treatment [57].
A comparison between the fresh samples and those stored for 14 days revealed significant differences in almost all cases, with the exception of the light factor L*. The only exceptions were the b* and C* values of the fresh control and stored controls and the chromium values of the fresh and stored 250 MPa-60 °C treated samples.
A comparison of the fresh samples revealed no significant differences in L* and chromium values. However, for the remaining parameters, the control sample differed significantly from the treated sample.
When comparing the samples stored for 14 days, no significant differences were observed between the samples with respect to the L* and b* factors. However, in all other cases, the control sample demonstrated significant differences from the treated samples. Additionally, the two samples treated in different orders also showed differences, particularly with regard to the a* and hue angle.
A comparison of the colour of the samples can be made on the basis of the measured colour factors and the colour difference (ΔE*). Table 4 presents the calculated ΔE* values, which were calculated in relation to both the control sample and each other.
The ΔE* values indicate that the treatments did not cause a significant change in the colour of the samples, with the largest difference being only in the noticeable category. The change was noticeable for the two control samples, between the control and treated samples, and also due to storage. There was no noticeable difference between the samples treated in different sequences on day 0, which supports our previous finding that the treatment sequence does not affect colour change.

3.4. Evaluation of Viscosity of Smoothie Samples

The rheograms and viscosity curves of the control and treated smoothie samples on days 0 and 14 are shown in Figure 2, while Table 5 demonstrates the parameters, the goodness of fitting of the Herschel–Bulkley model, and a comparison of selected apparent viscosity values. It can be observed that there is a non-linear relation between shear rate and shear stress, and shear rate and apparent viscosity in the range of 10 and 1000 s–1, which proves the non-Newtonian rheological behaviour of the samples. The convex profile of the flow curves and the flow behaviour index values (0 < n < 1) indicate that the smoothie samples exhibited shear-thinning (pseudoplastic) flow behaviour. With increasing shear rate, pseudoplastic behaviour shows increasing shear stress values and decreasing apparent viscosity values as the molecular interactions are weakened [58]. The pseudoplastic flow behaviour of fruit smoothie samples has been observed by numerous researchers [59,60,61].
It is also important to note that all the tested samples had a yield stress, indicating that a minimum shear stress is necessary to enable the samples to flow [58]. Moreover, the observed fluctuation in the apparent viscosity within the small shear rate range (10–73.6 s–1) in the case of all stored samples suggests inhomogeneity in the texture.
The yield stress value was the sole parameter of the Herschel–Bulkley model that was able to differentiate the samples in our study to a statistically significant extent. Significant differences were observed in this parameter between the fresh and stored samples in all cases. After storage, a smaller shear stress is required to induce flow. Considering the fresh samples, it can be concluded that the effect of the applied gentle preservation procedures is not significant on the yield stress of the prepared smoothie sample. However, a significant difference can be seen between the control sample and the first heat-treated and then pressure-treated sample after storage.
A similar trend can be seen in the apparent viscosity values at lower (100 s−1) and higher (1000 s−1) shear stress. The only difference is that after storage, both treated samples were significantly different from the control sample. It can be concluded that for fresh samples, the impact of treatment on apparent viscosity is undetectable at the shear rates examined, but storage clearly reduced the viscosity of all samples. After storage, the 60 °C-250 MPa sample was most similar to the fresh samples, and the control sample showed the greatest reduction in viscosity. This finding contrasts with the results of the sensory evaluation, wherein the judges perceived the control sample to be the densest. It is likely that the inhomogeneous particles in the sample led to this perception of density.
The direction of changes in the consistency coefficient followed the trends observed for viscosity, but the differences were not significant in either case. It was also reported by [43] that the consistency coefficient does not reflect the variation in the apparent viscosity.

3.5. Electronic Tongue Measurements

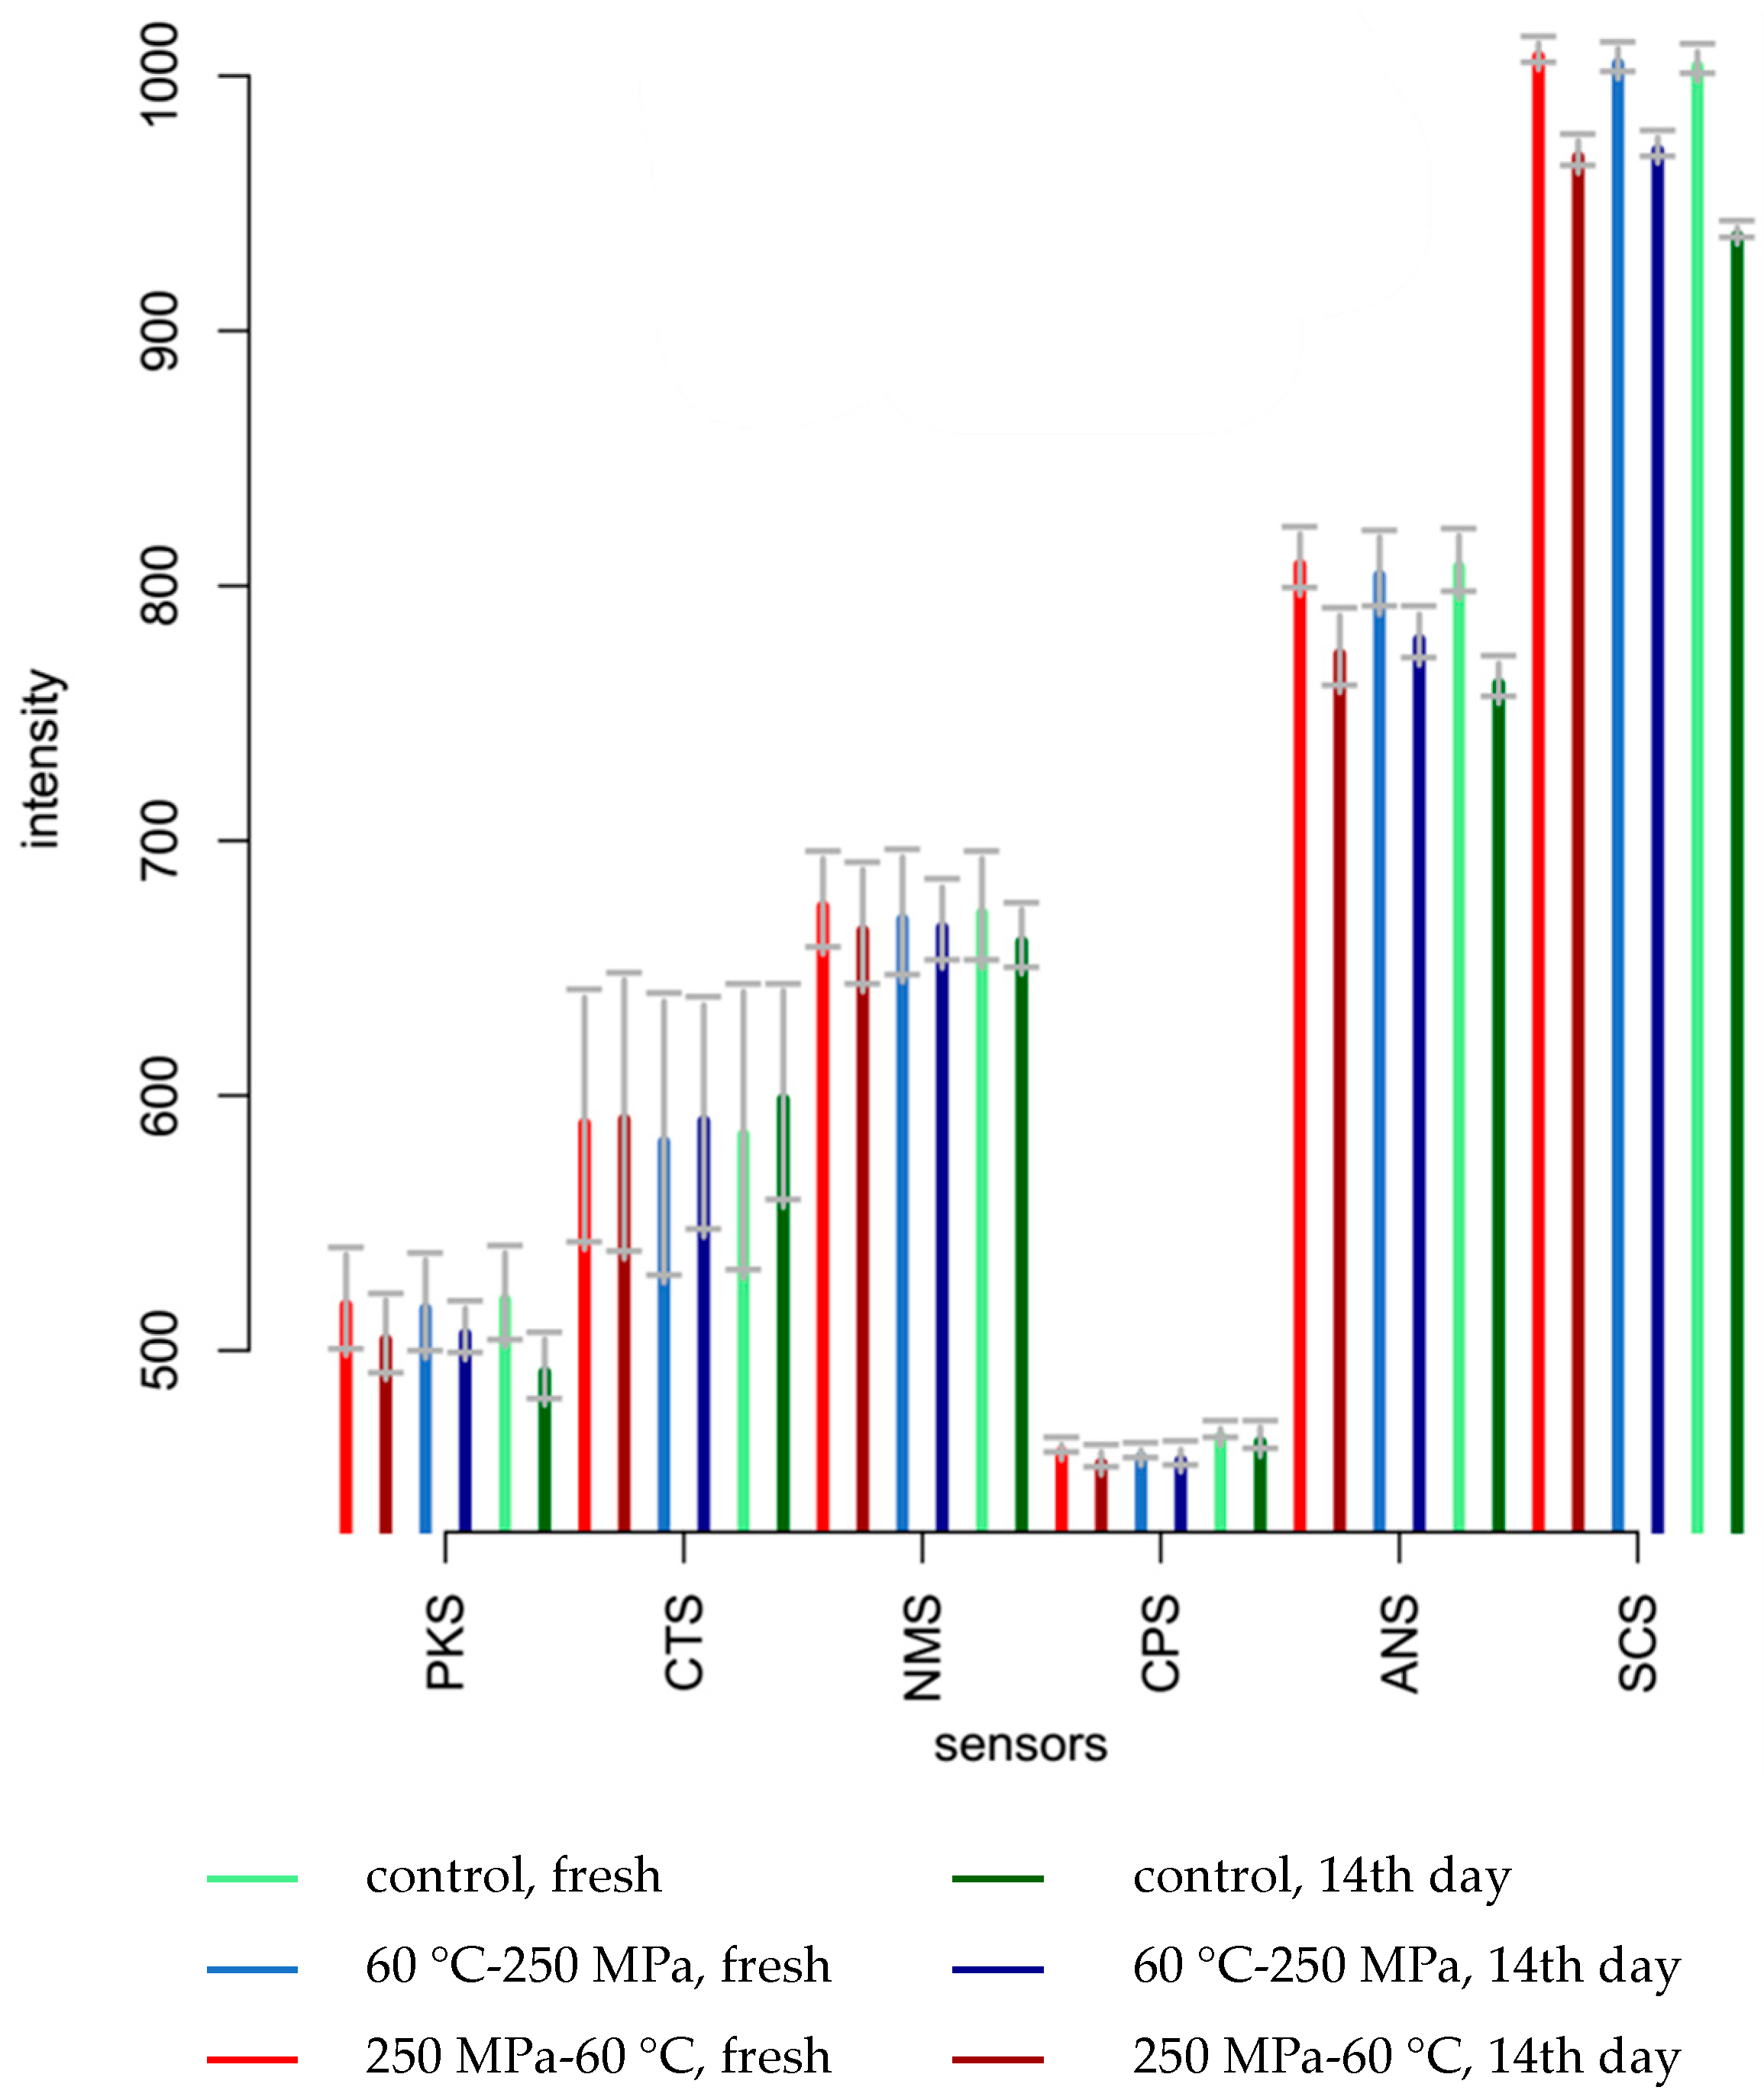
Based on the evaluation of the raw sensor signals, the initial three replicate measurements of the samples were excluded from further analysis, as the sensors of the electronic tongue were found to be unstable. The average of the raw sensor signals of the six selected sensors is presented in Figure 3. It was observed that the majority of sensors exhibited notable differences between at least some of the tested samples.
Figure 4 illustrates the Euclidean distances calculated between the raw signals of the electronic tongue sensors of the tested smoothie samples. The greatest distances were observed between the groups of fresh and stored samples, indicating the formation of two principal groups based on the chemical profiles of the tested smoothie samples. As illustrated in Figure 4, the groups of treated fresh samples exhibited shorter distances to the control fresh sample group than after 14 days of storage.
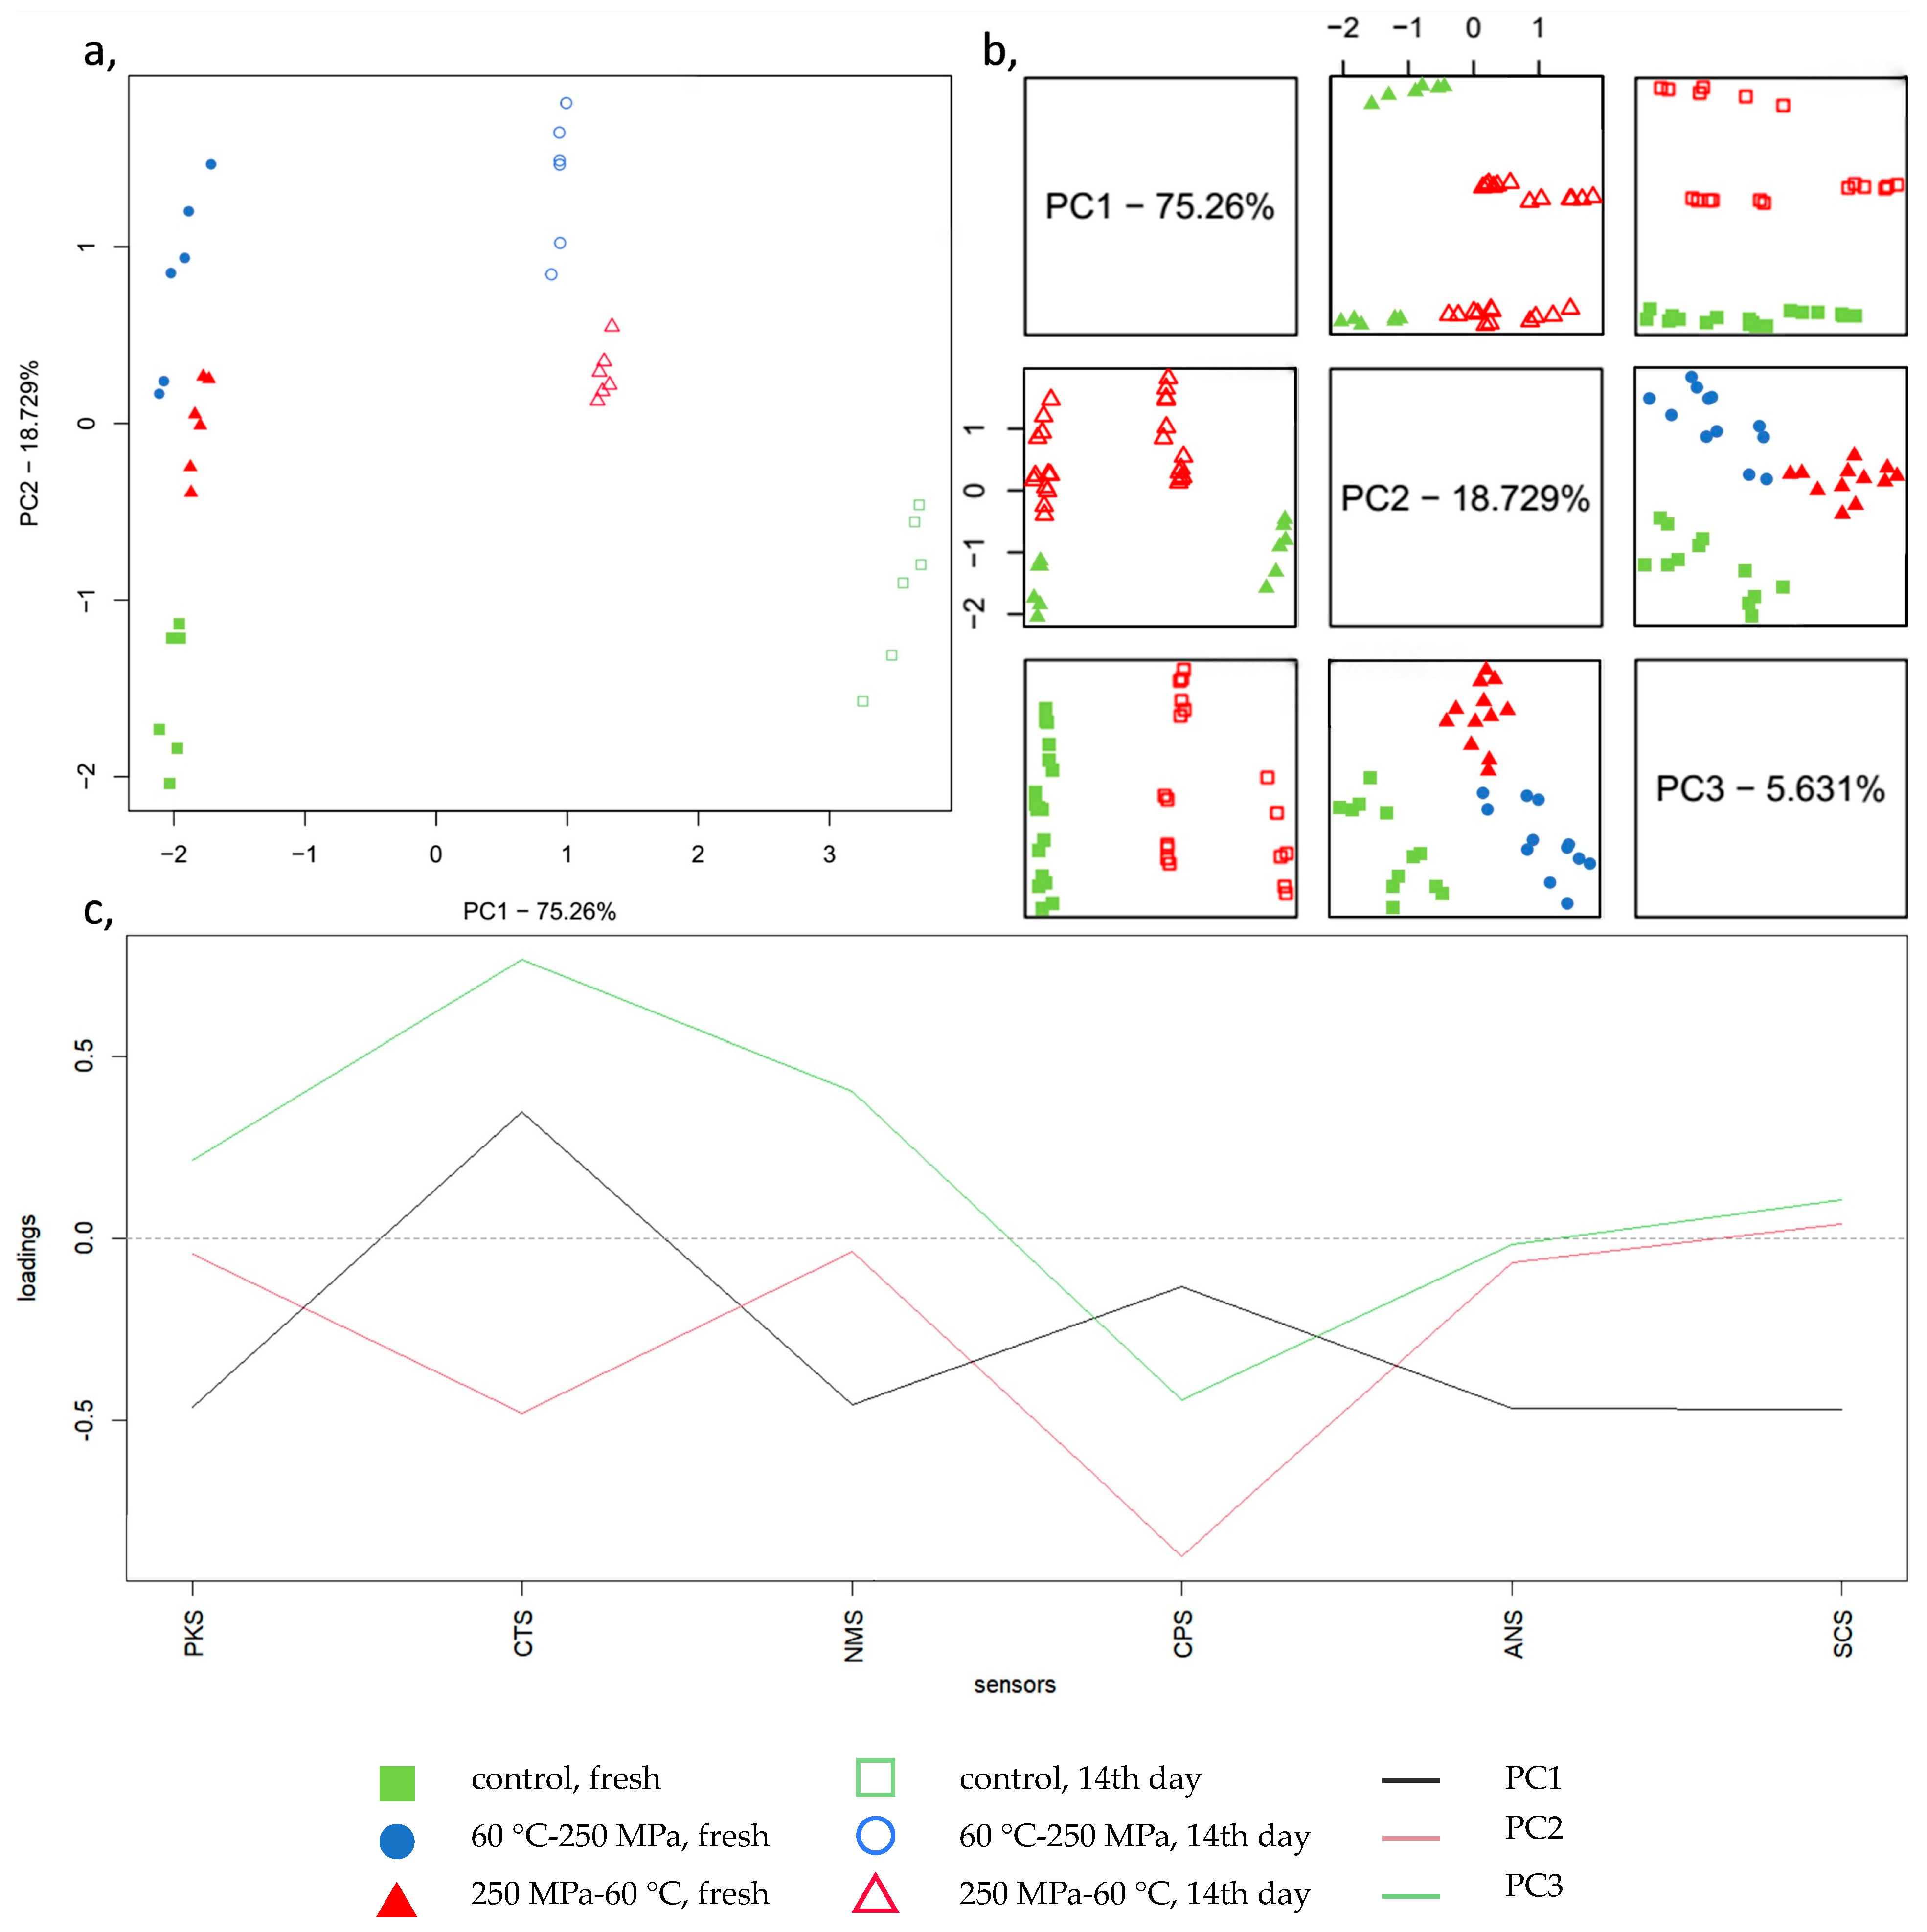
The results of the principal component analysis calculated based on the drift-corrected results of the six selected sensors are presented in Figure 5. The first two principal components (Figure 5a) represent about 94% of the total variance and result in a clear separation of the six types of samples. The most prominent separation was observed based on PC1 between the groups of fresh and stored samples.
Figure 5b illustrates the different patterns observed on the initial three PCs highlighted with the different colouring schemes. PC2 demonstrates a clear separation between the control and treated sample groups (Figure 5b, PC1–PC2). Additionally, a separation has been observed between the different treatment types (Figure 5b, PC2–PC3). Figure 5c depicts the contributions of the six selected electronic tongues on the first three PCs, which demonstrates the separation of the aforementioned patterns.

3.6. Electronic Nose Measurements

The chromatograms of representative samples of each group are shown in Figure 6. Throughout this manuscript, “1-A” as an identifier after the RI refers to column MXT-5, and “2-A” for column MXT-1701. Acetaldehyde (433-1-A, 485-2-A), ethanol (459-1-A, 554-2-A), propanal (485-1-A, 59-2-A), hexanal (801-1-A, 893-2-A), and 1-hexanol (859-1-A, 977-2-A), all indicative of a fruity odour, were the most dominant volatiles based on the RIs of the chromatogram peaks. Fatty acids, usually linoleic acid and linolenic acid, are converted by oxidative degradation with lipoxygenase or hydroperoxide lyase to volatile aldehydes such as hexanal [61]. The aldehydes are then converted to alcohol by the action of alcohol dehydrogenases [62].
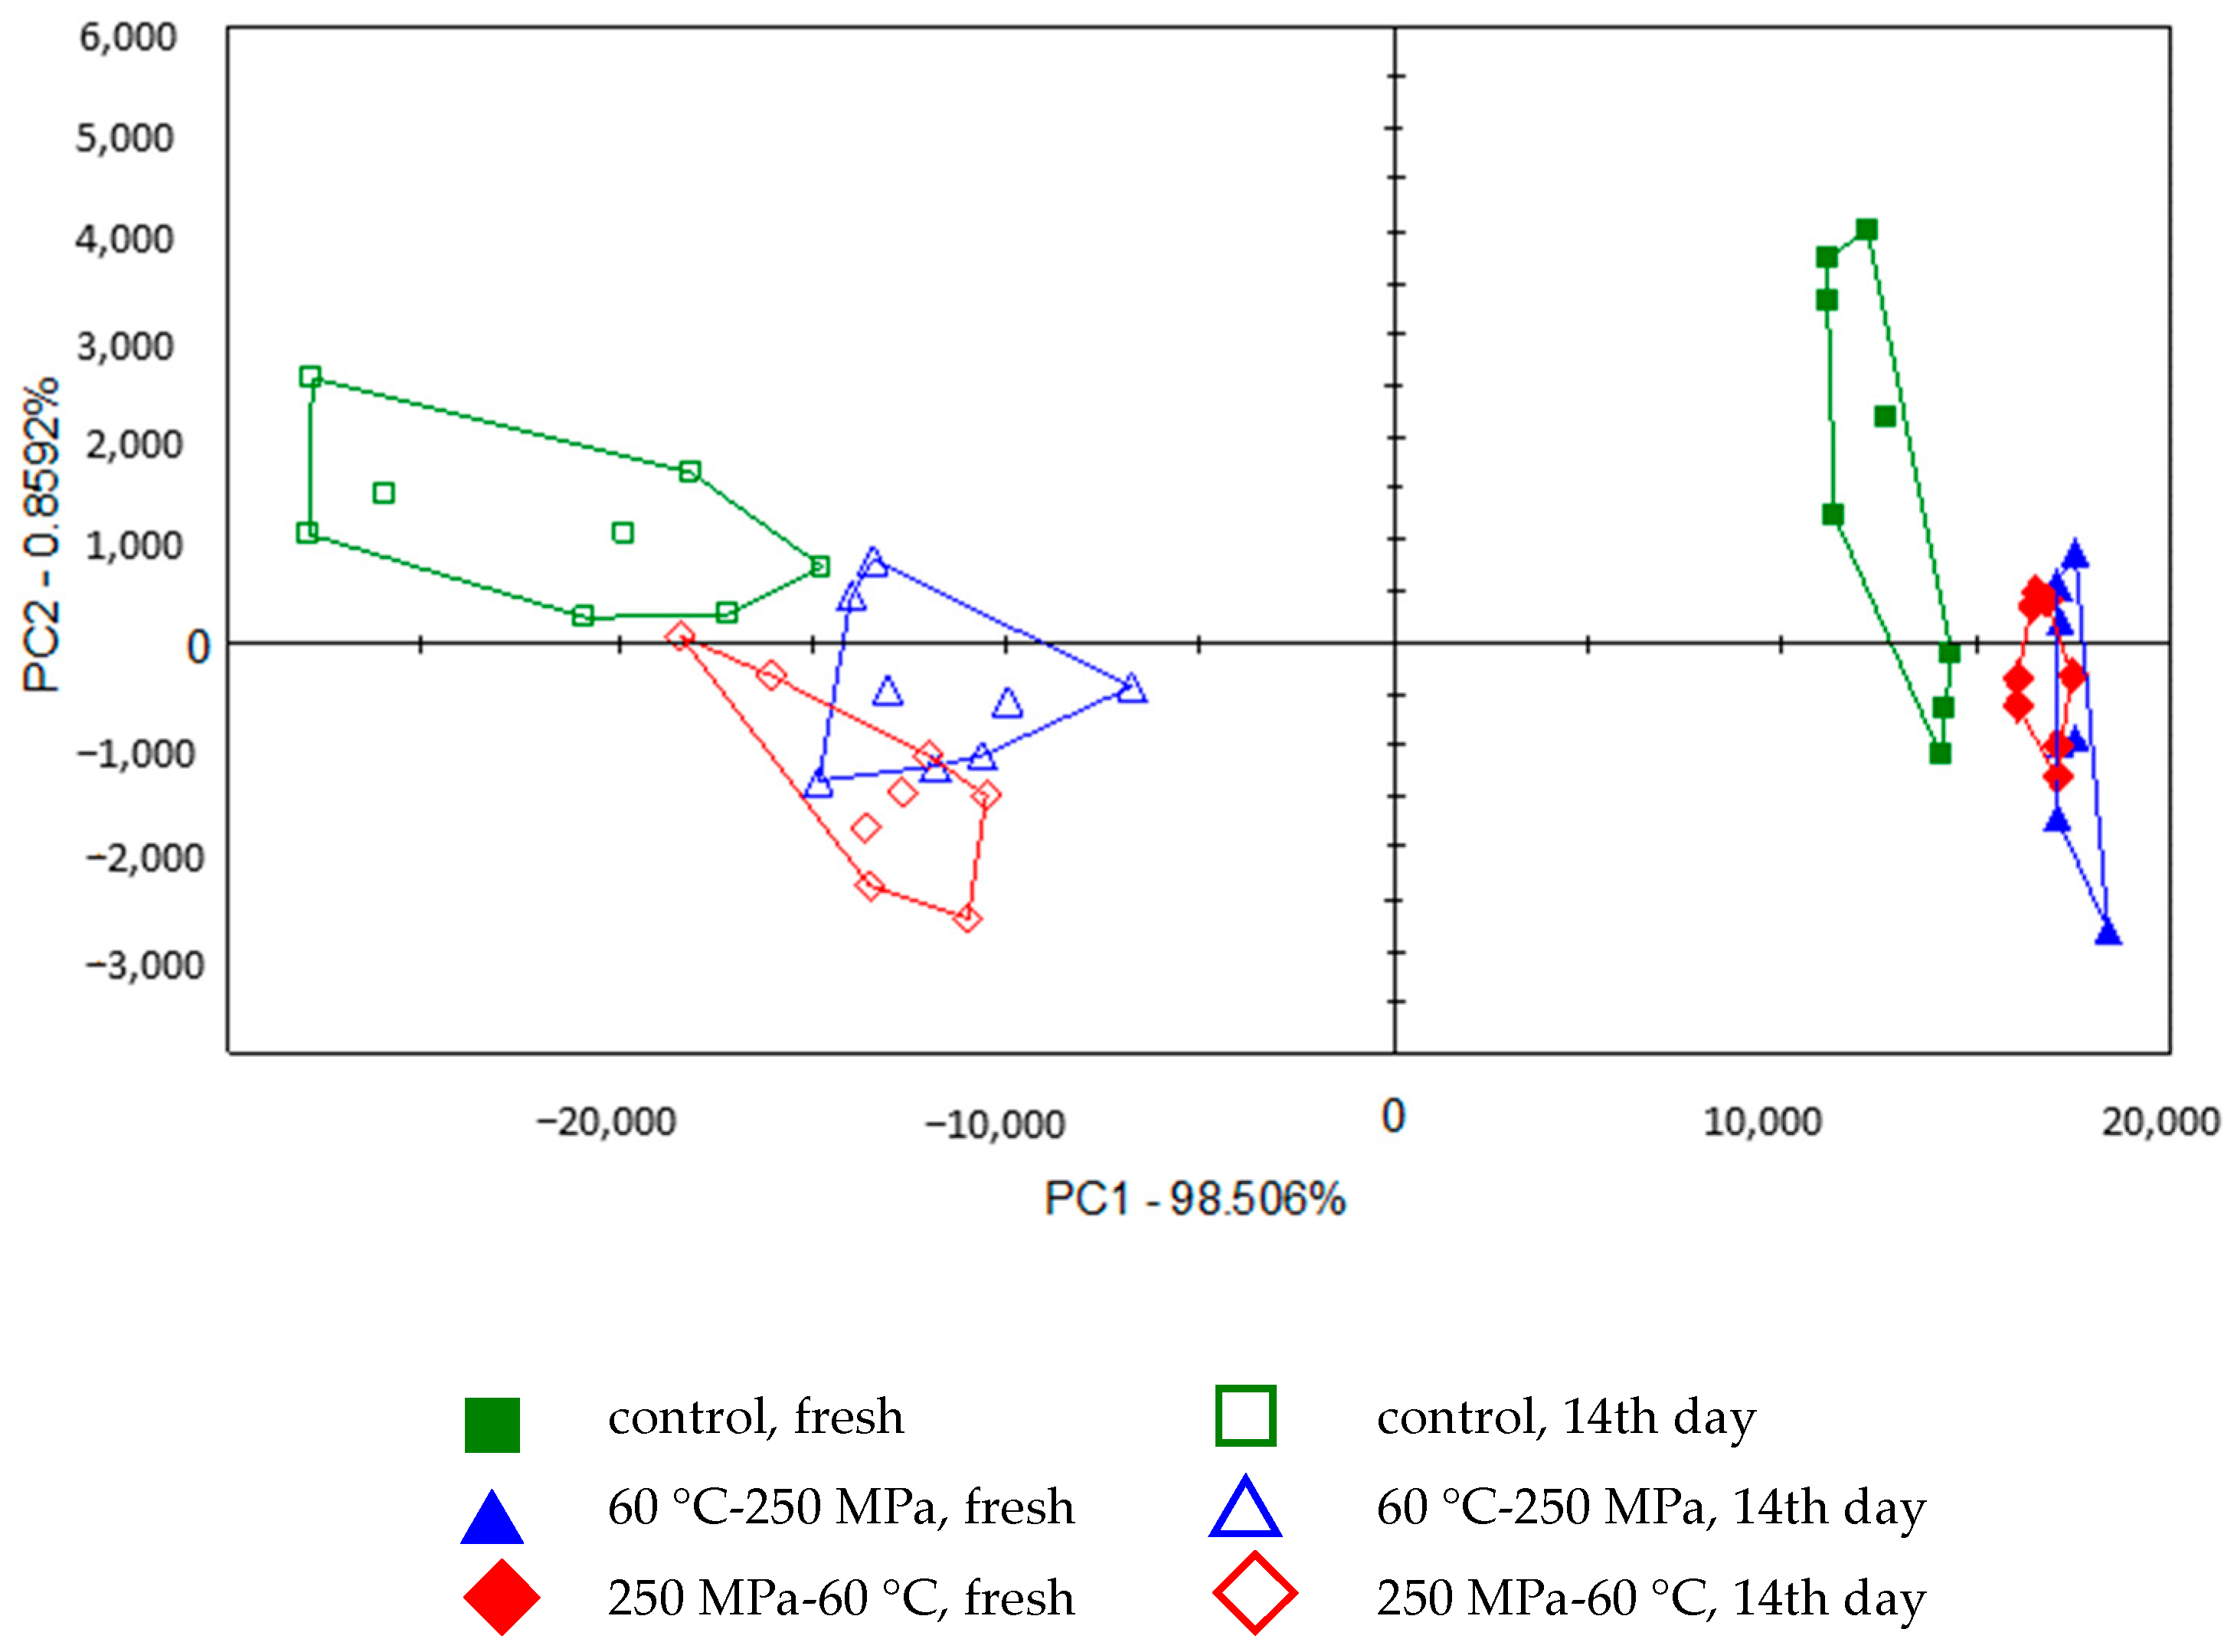
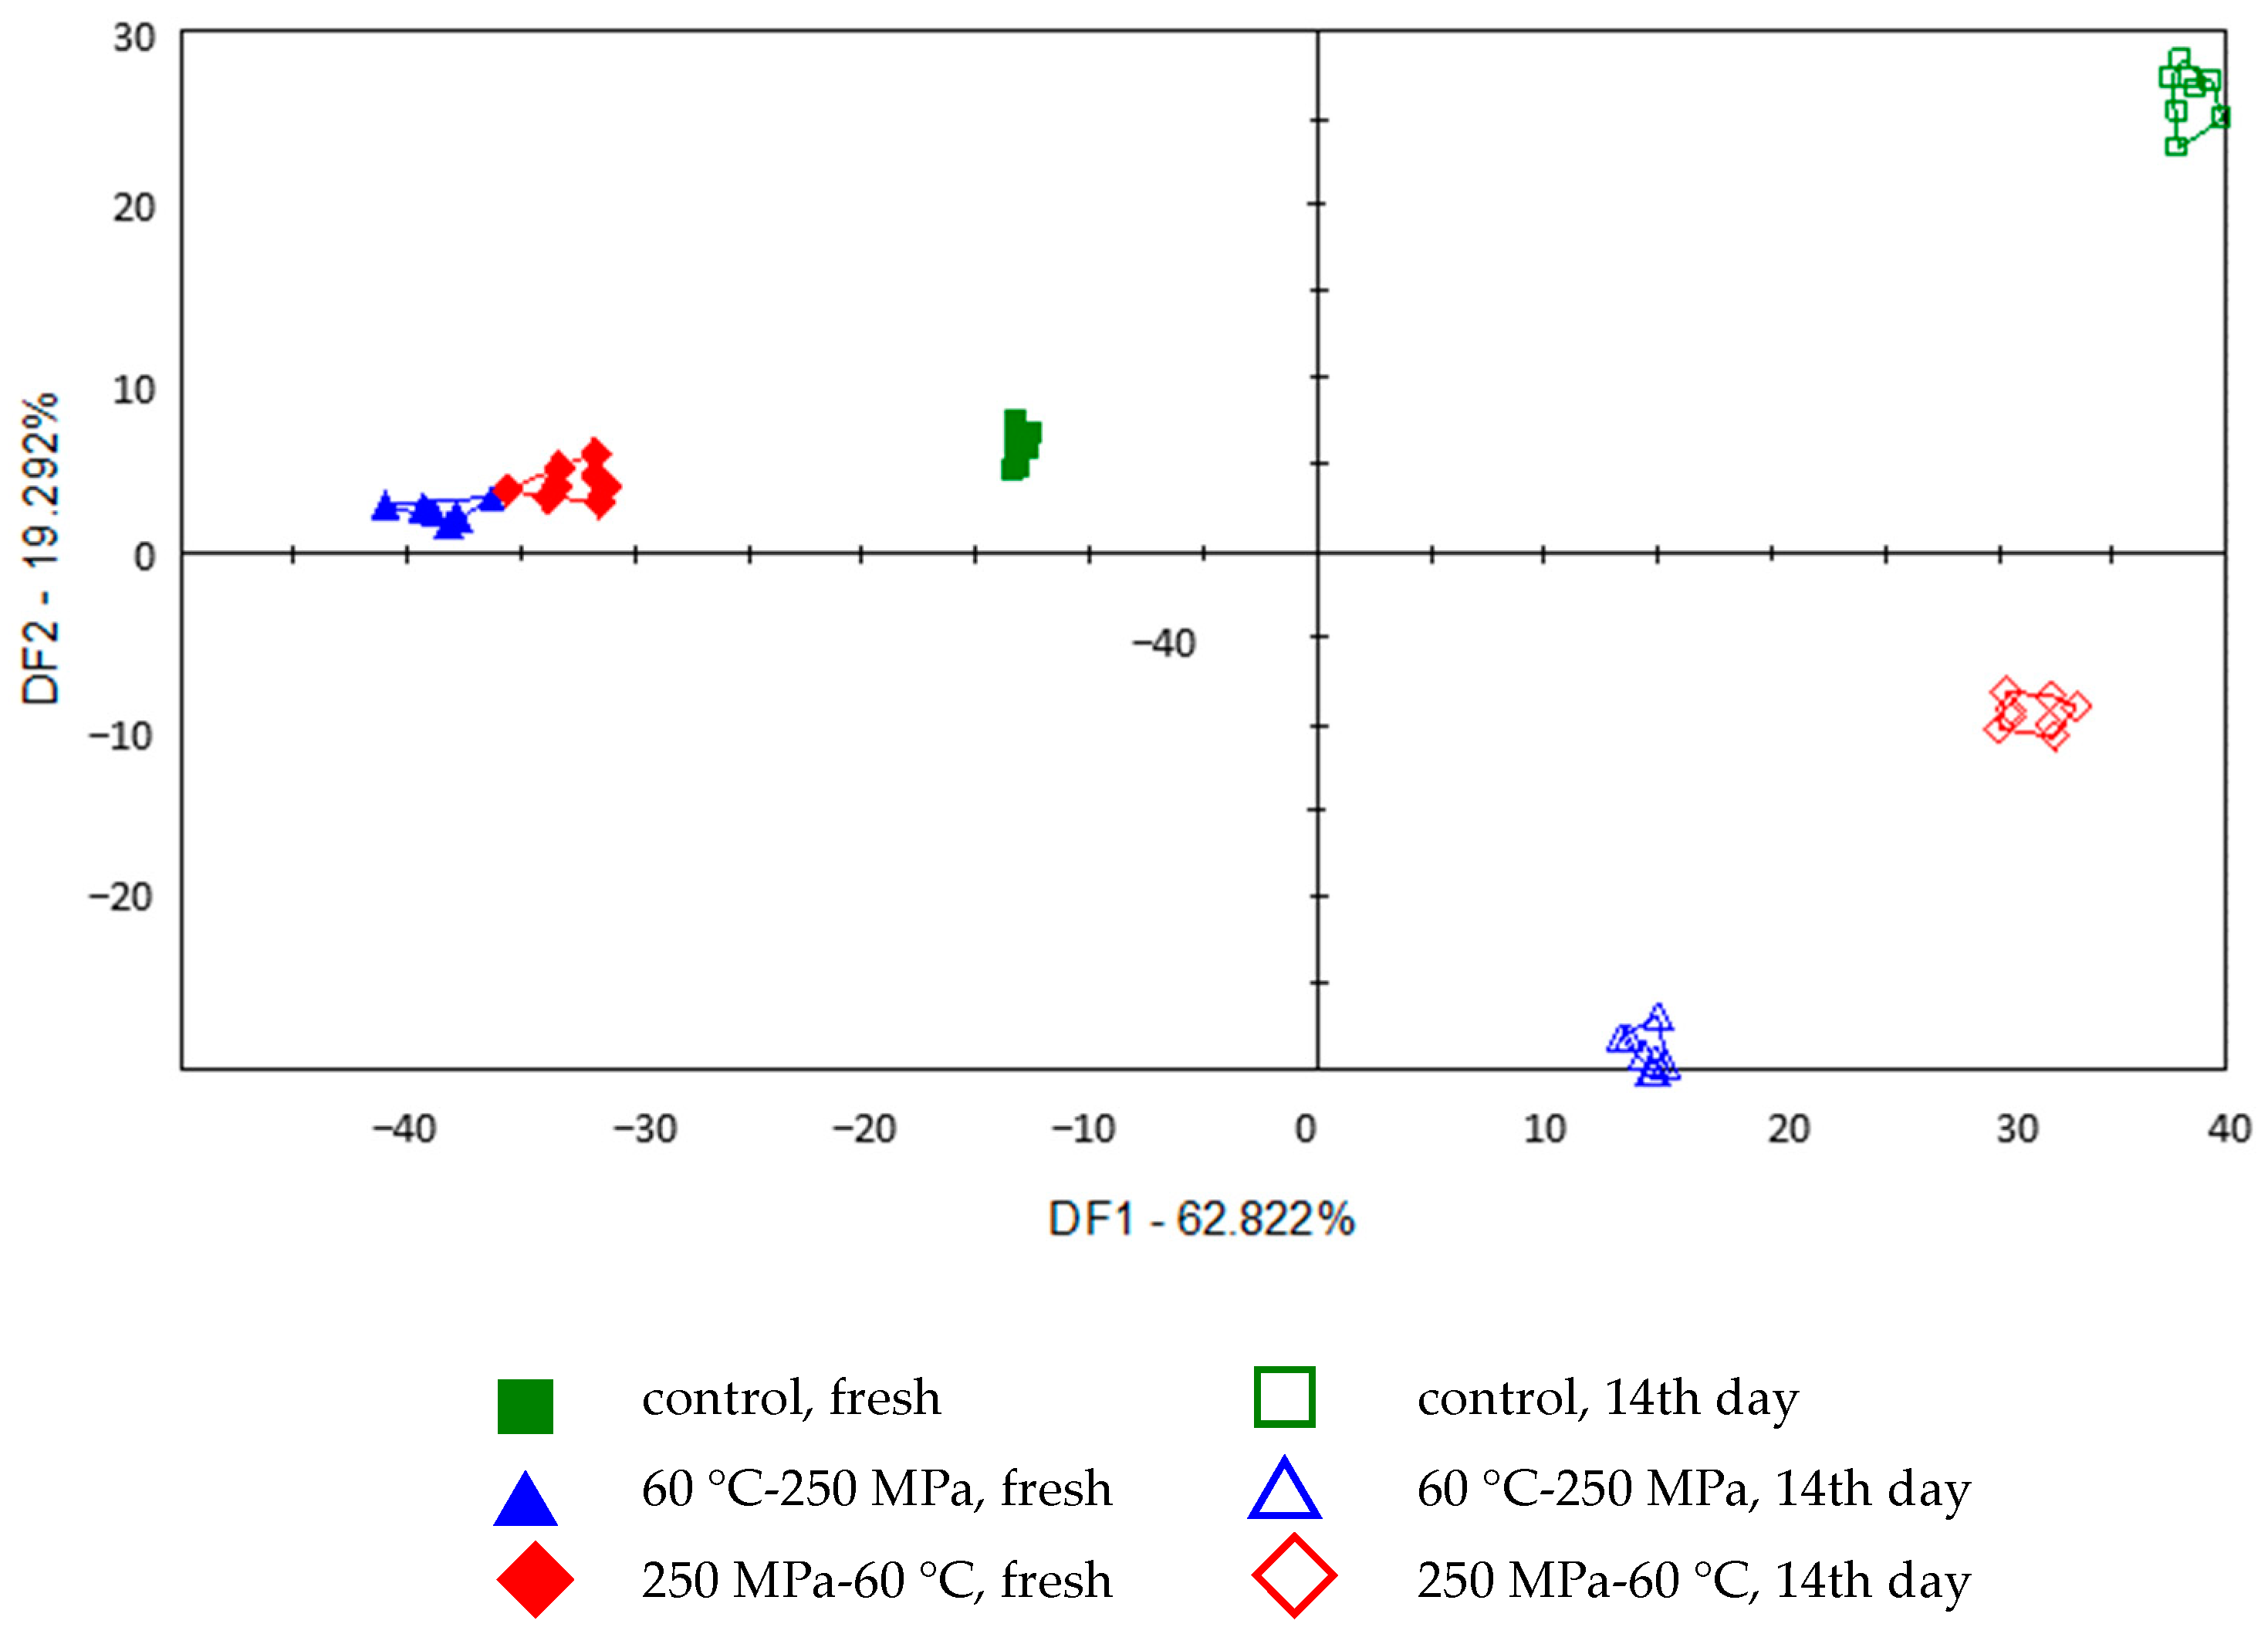
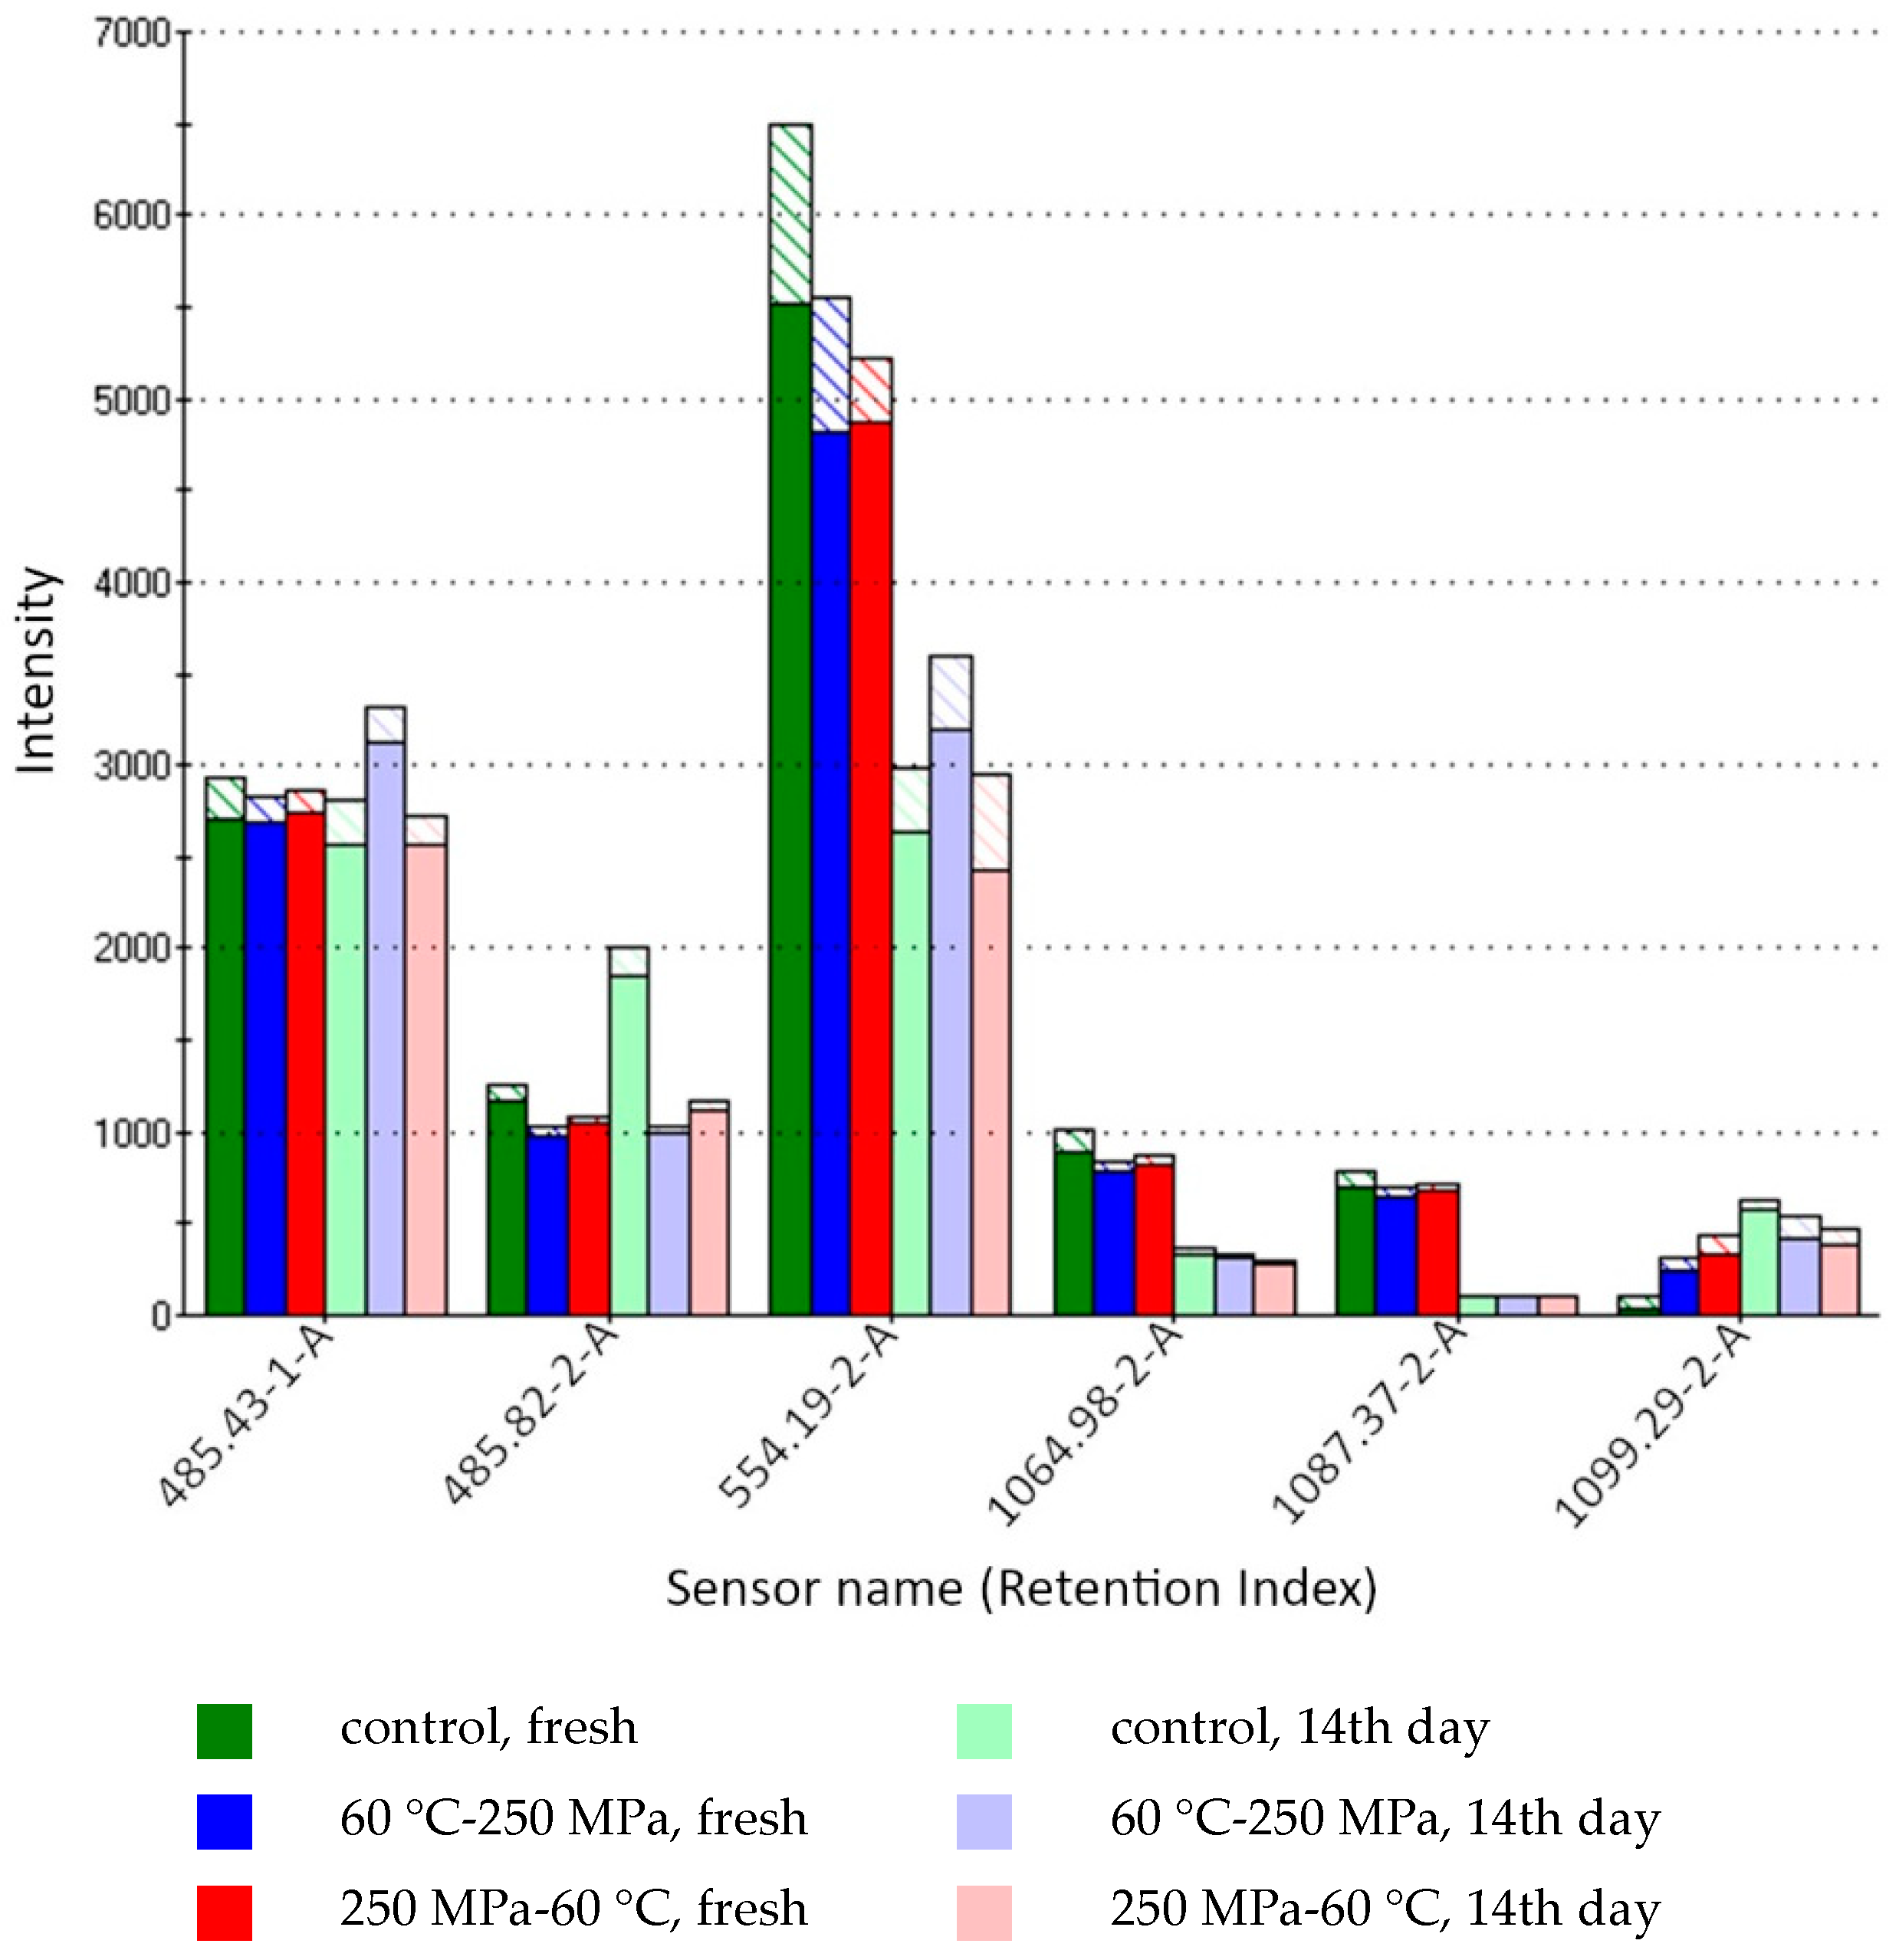
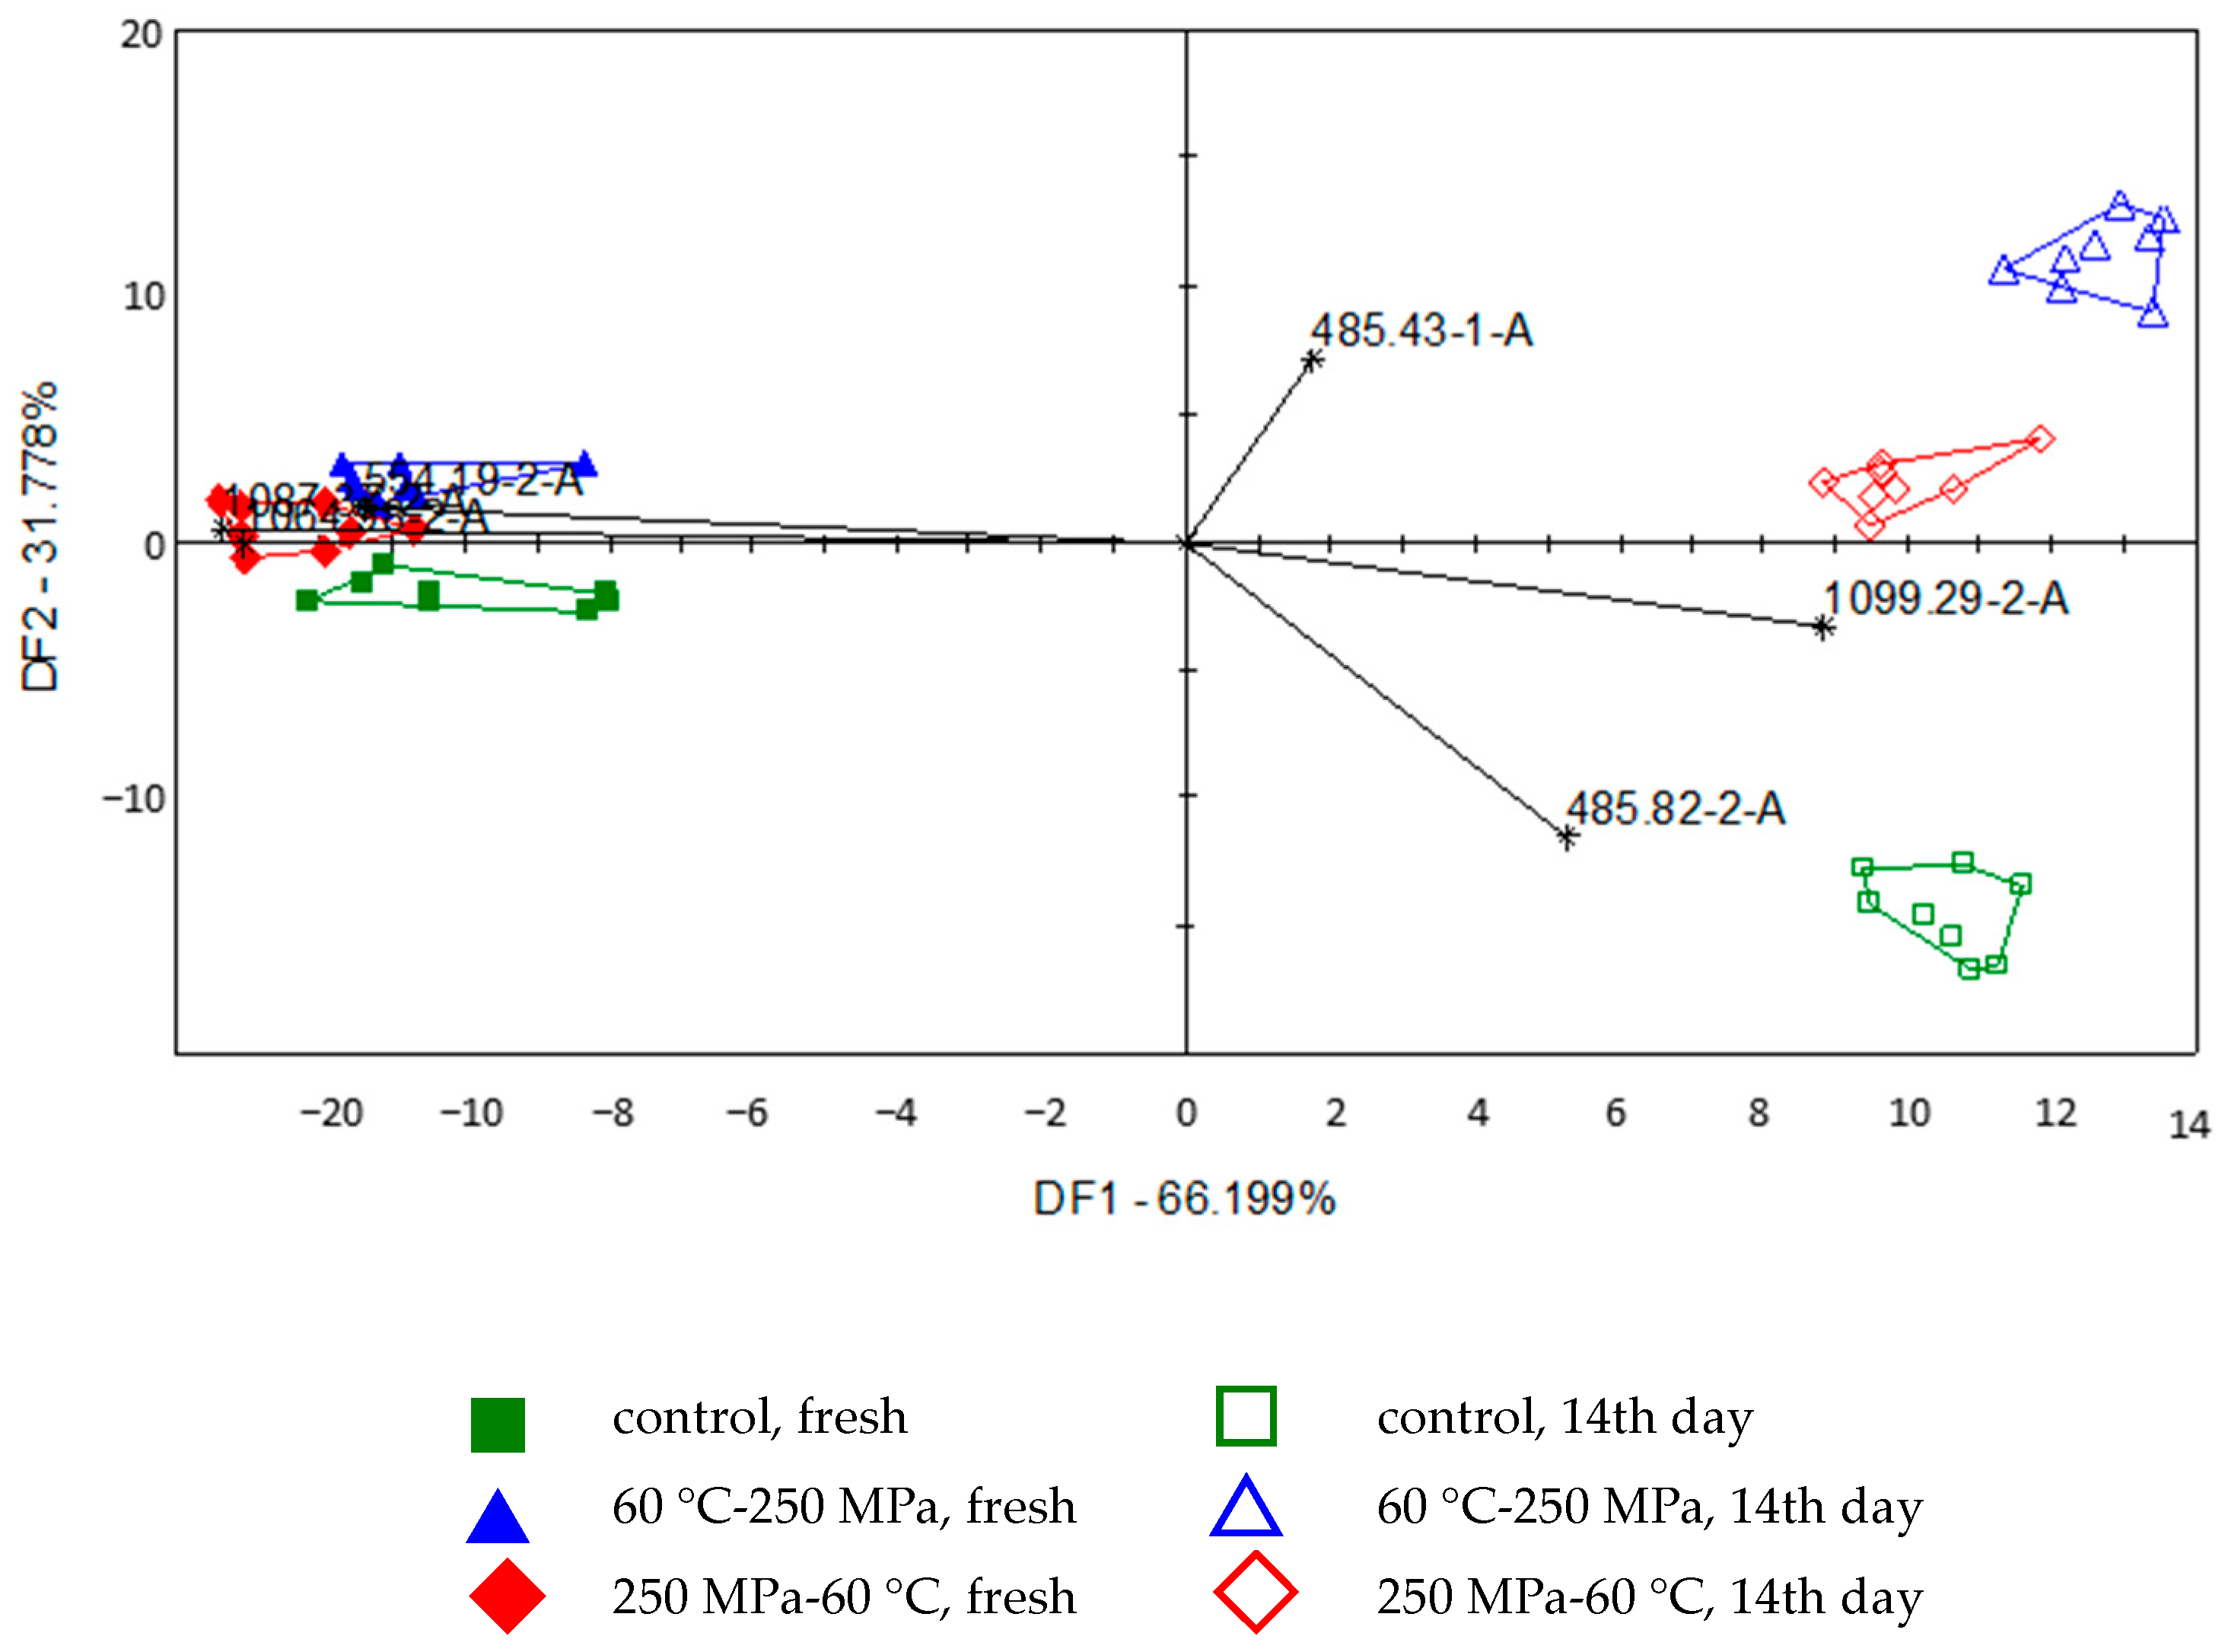
Principal component analysis of the multivariate data from the electronic nose measurement showed a dominant odour difference between the fresh and stored samples (Figure 7). The stored samples had a greater odour variance. The control group differed from the treated samples in both the fresh and stored samples. The overlap of the two treated groups shows the similarity in odour, but it can be noted that the 60 °C-250 MPa groups were the most different from the control groups, either fresh or stored. The discriminant factor analysis (Figure 8) showed the same pattern, but due to the supervised approach, the group separations were larger. The automatic sensor selection function of the Alpha Soft program was used, and the bar graph of the selected virtual sensors is shown in Figure 9. The bi-plot of Figure 10 shows the orientation of the group when the discriminant factor analysis was run with the selected sensors, and the loading vectors of the sensor variables are projected onto the plot. The results indicate loss of some of the volatiles during storage; the largest decrease during storage was observed for RI 1087.37-2-A associated with benzaldehyde, while ethanol (554.19-2-A) and ethylhexanoate (1064.98-2-A) also showed a general decrease. Octanal (1099.29-2-A) showed an increase in all stored samples. Propanal (485.43-1-A) and acetaldehyde (485.82-2-A) increased during the storage in the 60 °C-250 MPa and control groups, respectively.
The advantage of using virtual sensors derived from chromatograms, as applied in this study, lies in the possibility of identifying the volatiles associated with specific sensors, i.e., the retention indices of the chromatogram peaks. This allows the user to identify the odourants of the sample from international databases or their own recorded data, which is rarely possible in the case of other sensor-based electronic nose approaches.

4. Conclusions

The application of heat treatment alone resulted in a product that exhibited reduced sensitivity to storage temperature in comparison to the pressure treatment. However, the combination of the two treatments led to a notable enhancement in product stability. The microbiological analysis demonstrated that the sequence of treatments is not an influencing factor, which was also confirmed by the results of the other instrumental analysis. Regarding sensory characteristics, storage had the greatest impact, while treatments also resulted in variations in sensory parameters when compared to untreated samples. Instrumental analysis has confirmed the sensory results, thus providing an objective means of determining sensory characteristics during storage.

Author Contributions

Conceptualisation, I.D., F.Z. and G.K.; formal analysis, F.Z., I.D., Z.K., K.I.H. and G.B.; investigation, F.Z., I.D., K.I.H., Z.K. and G.B.; writing—original draft preparation, F.Z., I.D., G.K., Z.K., K.I.H. and G.B.; writing—review and editing, F.Z., I.D., G.K. and A.T.-B.; visualisation, F.Z., K.I.H., Z.K. and G.B.; project administration, I.D. All authors have read and agreed to the published version of the manuscript.

Funding

This research received no external funding.

Institutional Review Board Statement

Not applicable.

Informed Consent Statement

Not applicable.

Data Availability Statement

The original contributions presented in the study are included in the article, further inquiries can be directed to the corresponding author.

Acknowledgments

The authors acknowledge the Doctoral School of Food Sciences, Hungarian University of Agriculture and Life Sciences and Veronika Szappanos for her assistance in measurements.

Conflicts of Interest

The authors declare no conflicts of interest.

References

  1. Boeing, H.; Bechthold, A.; Bub, A.; Ellinger, S.; Haller, D.; Kroke, A.; Leschik-Bonnet, E.; Muller, M.J.; Oberritter, H.; Schulze, M.; et al. Critical review: Vegetables and fruit in the prevention of chronic diseases. Eur. J. Nutr. 2012, 51, 637–663. [Google Scholar] [CrossRef]
  2. Mullen, W.; Marks, S.C.; Crozier, A. Evaluation of phenolic compounds in commercial fruit juices and fruit drinks. J. Agric. Food Chem. 2007, 55, 3148–3157. [Google Scholar] [CrossRef]
  3. Valenzuela, A.; Sanhueza, J.; Nieto, S. Cholesterol oxidation: Health hazard and the role of antioxidants in prevention. Biol. Res. 2003, 36, 291–302. [Google Scholar] [CrossRef] [PubMed]
  4. Briz, T.; Sijtsema, S.J.; Jasiulewicz, A.; Kyriakidi, A.; Guàrdia, M.D.; Van Der Berg, I.; Van Der Lans, I.A. Barriers to fruit consumption: Driving forces behind consumer behaviour. Scr. Hortic. 2009, 8, 7–18. [Google Scholar]
  5. Serafini, M. The role of antioxidants in disease prevention. Medicine 2006, 34, 533–535. [Google Scholar] [CrossRef]
  6. Morales-de la Peña, M.; Welti-chanes, J.; Martín-belloso, O. Application of novel processing methods for greater retention of functional compounds in fruitbased beverages. Beverages 2016, 2, 14. [Google Scholar] [CrossRef]
  7. Abadias, M.; Usall, J.; Anguera, M.; Solsona, C.; Viñas, I. Microbiology Quality of Fresh, Minimally-Processed Fruit and Vegetables, and Sprouts from Retail Establishments. Int. J. Food Microbiol. 2008, 123, 121–129. [Google Scholar] [CrossRef] [PubMed]
  8. Jay, J.M.; Loessner, M.J.; Golden DAIn: Jay, J.M.; Loessner, M.J.; Golden, D.A. Modern Food Microbiology, 7th ed.; Springer Science + Business Media Inc.: New York, NY, USA, 2005; pp. 423–424. [Google Scholar]
  9. Lešková, E.; Kubíková, J.; Kováčiková, E.; Košická, M.; Porubská, J.; Holčíková, K. Vitamin losses: Retention during heat treatment and continual changes expressed by mathematical models. J. Food Compos. Anal. 2006, 19, 252–276. [Google Scholar] [CrossRef]
  10. Rickman, J.C.; Bruhn, C.M.; Barrett, D.M. Review: Nutritional comparison of fresh, frozen, and canned fruits and vegetables. Part I. Vitamins C and B and phenolic compounds. J. Sci. Food Agric. 2007, 87, 930–944. [Google Scholar] [CrossRef]
  11. Gómez, P.L.; Welti-Chanes, J.; Alzamora, S.M. Hurdle technology in fruit processing. Annu. Rev. Food Sci. Technol. 2011, 2, 447–465. [Google Scholar] [CrossRef] [PubMed]
  12. Oey, I.; Van der Plancken, I.; Van Loey, A.; Hendrickx, M. Does high pressure processing influence nutritional aspects of plant based food systems? Trends Food Sci. Technol. 2008, 19, 300–308. [Google Scholar] [CrossRef]
  13. Raso, J.; Barbosa-Cánovas, G.V. Nonthermal preservation of foods using combined processing techniques. Crit. Rev. Food Sci. Nutr. 2003, 43, 265–285. [Google Scholar] [CrossRef]
  14. Barba, F.J.; Esteve, M.J.; Frígola, A. High pressure treatment effect on physicochemical and nutritional properties of fluid foods during storage: A review. Compr. Rev. Food Sci. Food Saf. 2012, 11, 307–322. [Google Scholar] [CrossRef]
  15. Dalmadi, I.; Polyak-Fehér, K.; Farkas, J. Effects of pressure-and thermal-pasteurization on volatiles of some berry fruits. High Press. Res. 2007, 27, 169–171. [Google Scholar] [CrossRef]
  16. Gimenez, J.; Kajda, P.; Margomenou, L.; Piggott, J.R.; Zabetakis, I. A study on the colour and sensory attributes of high-hydrostatic-pressure jams as compared with traditional jams. J. Sci. Food Agric. 2001, 81, 1228–1234. [Google Scholar] [CrossRef]
  17. Echenique-Martínez, A.A.; Ramos-Parra, P.A.; Rodríguez-Sánchez, D.G.; Troncoso-Rojas, R.; Islas-Rubio, A.R.; Montoya-Ballesteros, L.D.C.; Hernández-Brenes, C. Botrytis cinerea induced phytonutrient degradation of strawberry puree: Effects of combined preservation approaches with high hydrostatic pressure and synthetic or natural antifungal additives. CyTA-J. Food 2023, 21, 451–463. [Google Scholar] [CrossRef]
  18. Xu, Z.; Lin, T.; Wang, Y.; Liao, X. Quality assurance in pepper and orange juice blend treated by high pressure processing and high temperature short time. Innov. Food Sci. Emerg. Technol. 2015, 31, 28–36. [Google Scholar] [CrossRef]
  19. Hartyáni, P.; Dalmadi, I.; Knorr, D. Electronic nose investigation of Alicyclobacillus acidoterrestris inoculated apple and orange juice treated by high hydrostatic pressure. Food Control 2013, 32, 262–269. [Google Scholar] [CrossRef]
  20. Laboissière, L.H.E.S.; Deliza, R.; Barros-Marcellini, A.M.; Rosenthal, A.; Camargo, L.M.A.Q.; Junqueira, R.G. Effects of high hydrostatic pressure (HHP) on sensory characteristics of yellow passion fruit juice. Innov. Food Sci. Emerg. Technol. 2007, 8, 469–477. [Google Scholar] [CrossRef]
  21. Liu, S.; Xu, Q.; Li, X.; Wang, Y.; Zhu, J.; Ning, C.; Meng, X. Effects of high hydrostatic pressure on physicochemical properties, enzymes activity, and antioxidant capacities of anthocyanins extracts of wild Lonicera caerulea berry. Innov. Food Sci. Emerg. Technol. 2016, 36, 48–58. [Google Scholar] [CrossRef]
  22. Olsen, N.V.; Menichelli, E.; Grunert, K.G.; Sonne, A.M.; Szabó, E.; Bánáti, D.; Næs, T. Choice probability for apple juice based on novel processing techniques: Investigating the choice relevance of mean-end-chains. Food Qual. Prefer. 2011, 22, 48–59. [Google Scholar] [CrossRef]
  23. Huang, H.W.; Lung, H.M.; Yang, B.B.; Wang, C.Y. Responses of microorganisms to high hydrostatic pressure processing. Food Control 2014, 40, 250–259. [Google Scholar] [CrossRef]
  24. Aganovic, K.; Hertel, C.; Vogel, R.F.; Johne, R.; Schlüter, O.; Schwarzenbolz, U.; Jäger, H.; Holzhauser, T.; Bergmair, J.; Roth, A.; et al. Aspects of high hydrostatic pressure food processing: Perspectives on technology and food safety. Compr. Rev. Food Sci. Food Saf. 2021, 20, 3225–3266. [Google Scholar] [CrossRef]
  25. Rastogi, N.K.; Raghavarao, K.S.M.S.; Balasubramaniam, V.M.; Niranjan, K.; Knorr, D. Opportunities and challenges in high pressure processing of foods. Crit. Rev. Food Sci. Nutr. 2007, 47, 69–112. [Google Scholar] [CrossRef] [PubMed]
  26. Buzrul, S.; Alpas, H.; Largeteau, A.; Demazeau, G. Inactivation of Escherichia coli and Listeria innocua in kiwifruit and pineapple juices by high hydrostatic pressure. Int. J. Food Microbiol. 2008, 124, 275–278. [Google Scholar] [CrossRef]
  27. Tiwari, B.K.; O’Donnell, C.P.; Cullen, P.J. Effect of non thermal processing technologies on the anthocyanin content of fruit juices. Trends Food Sci. Technol. 2009, 20, 137–145. [Google Scholar] [CrossRef]
  28. Guerrero-Beltrán, J.A.; Barbosa-Cánovas, G.V.; Swanson, B.G. High Hydrostatic Pressure Processing of Fruit and Vegetable Products. Food Rev. Int. 2005, 21, 411–425. [Google Scholar] [CrossRef]
  29. Song, X.; Pendenza, P.; Díaz Navarro, M.; Valderrama García, E.; Di Monaco, R.; Giacalone, D. European consumers’ perceptions and attitudes towards nonthermally processed fruit and vegetable products. Foods 2020, 9, 1732. [Google Scholar] [CrossRef] [PubMed]
  30. Song, X.; Bredahl, L.; Navarro, M.D.; Pendenza, P.; Stojacic, I.; Mincione, S.; Pellegrini, G.; Schlüter, O.K.; Torrieri, E.; Di Monaco, R.; et al. Factors affecting consumer choice of novel non-thermally processed fruit and vegetables products: Evidence from a 4-country study in Europe. Food Res. Int. 2022, 153, 110975. [Google Scholar] [CrossRef] [PubMed]
  31. Lu, L.; Hu, Z.; Hu, X.; Li, D.; Tian, S. Electronic tongue and electronic nose for food quality and safety. Food Res. Int. 2022, 162, 112214. [Google Scholar] [CrossRef]
  32. Zhu, D.; Ren, X.; Wei, L.; Cao, X.; Ge, Y.; Liu, H.; Li, J. Collaborative Analysis on Difference of Apple Fruits Flavour Using Electronic Nose and Electronic Tongue. Sci. Hortic. 2020, 260, 108879. [Google Scholar] [CrossRef]
  33. Gaggiotti, S.; Mascini, M.; Pittia, P.; Della Pelle, F.; Compagnone, D. Headspace Volatile Evaluation of Carrot Samples— Comparison of GC/MS and AuNPs-HpDNA-Based E-Nose. Foods 2019, 8, 293. [Google Scholar] [CrossRef] [PubMed]
  34. Palumbo, M.; Attolico, G.; Capozzi, V.; Cozzolino, R.; Corvino, A.; de Chiara, M.L.V.; Pace, B.; Pelosi, S.; Ricci, I.; Romaniello, R.; et al. Emerging postharvest technologies to enhance the shelf-life of fruit and vegetables: An overview. Foods 2022, 11, 3925. [Google Scholar] [CrossRef]
  35. Wang, Q.; Li, L.; Ding, W.; Zhang, D.; Wang, J.; Reed, K.; Zhang, B. Adulterant identification in mutton by electronic nose and gas chromatography-mass spectrometer. Food Control 2019, 98, 431–438. [Google Scholar] [CrossRef]
  36. Marx, Í.M.G.; Veloso, A.C.A.; Casal, S.; Pereira, J.A.; Peres, A.M. Sensory analysis using electronic tongues. In Innovative Food Analysis, 1st ed.; Galanakis, C.M., Ed.; Elsevier: Amsterdam, The Netherlands, 2021; pp. 323–343. [Google Scholar] [CrossRef]
  37. Jiang, H.; Zhang, M.; Bhandari, B.; Adhikari, B. Application of electronic tongue for fresh foods quality evaluation: A review. Food Rev. Int. 2018, 34, 746–769. [Google Scholar] [CrossRef]
  38. Vlasov, Y.; Leign, A.; Rudnitskaya, A.; Di Natale, C.; D’aminco, A. Nonspecific sensor arrays (“electronic tongue”) for chemical analysis of liquids (IUPAC Technical Report). Pure Appl. Chem. 2005, 77, 1965–1983. [Google Scholar] [CrossRef]
  39. Maimunah, M.A.; Norhashila, H.; Samsuzana, A.A.; Ola, L. Principles and recent advances in electronic nose for quality inspection of agricultural and food products. Trends Food Sci. Technol. 2020, 99, 1–10. [Google Scholar] [CrossRef]
  40. Christensen, Z.T.; Ogden, L.V.; Dunn, M.L.; Eggett, D.L. Multiple comparison procedures for analysis of ranked data. J. Food Sci. 2006, 71, S132–S143. [Google Scholar] [CrossRef]
  41. Lukács, G.Y. Színmérés, 1st ed.; Műszaki Könyvkiadó: Budapest, Hungary, 1982; p. 341. [Google Scholar]
  42. Hidas, K.I.; Nyulas-Zeke, I.C.; Szepessy, A.; Romvári, V.; Gerhart, K.; Surányi, J.; Laczay, P.; Darnay, L. Physical properties of hemp drink-based ice cream with different plant proteins guar gum and microbial transglutaminase. LWT 2023, 182, 114865. [Google Scholar] [CrossRef]
  43. Wang, S.; Lin, T.; Man, G.; Li, H.; Zhao, L.; Wu, J.; Liao, X. Effects of Anti-browning Combinations of Ascorbic Acid, Citric Acid, Nitrogen and Carbon Dioxide on the Quality of Banana Smoothies. Food Bioprocess. Technol. 2014, 7, 161–173. [Google Scholar] [CrossRef]
  44. Yakubu, H.G.; Ali, O.; Ilyés, I.; Vigyázó, D.; Bóta, B.; Bazar, G.; Tóth, T.; Szabó, A. Micro- Encapsulated Microalgae Oil Supplementation Has No Systematic Effect on the Odor of Vanilla Shake-Test of an Electronic Nose. Foods 2022, 11, 3452. [Google Scholar] [CrossRef] [PubMed]
  45. Roszkos, R.; Bazar, G.; Tóth, T.; Kovacs, Z.; Febel, H.; Mezes, M. Effect of n-3 polyunsaturated fatty acid feeding on the fatty acid profile and odor of milk in danbred sows. J. Appl. Anim. Res. 2021, 49, 447–459. [Google Scholar] [CrossRef]
  46. Worku, A.; Tóth, T.; Orosz, S.; Fébel, H.; Kacsala, L.; Húth, B.; Hoffmann, R.; Yakubu, H.G.; Bazar, G.; Tóthi, R. Aroma Profile, Microbial and Chemical Quality of Ensiled Green Forages Mixtures of Winter Cereals and Italian Ryegrass. Agriculture 2021, 11, 512. [Google Scholar] [CrossRef]
  47. Ito, M.; Ikehama, K.; Yoshida, K.; Haraguchi, T.; Yoshida, M. Bitterness prediction of H 1 -antihistamines and prediction of masking effects of artificial sweeteners using an electronic tongue. Int. J. Pharm. 2013, 441, 121–127. [Google Scholar] [CrossRef]
  48. Legin, A.; Rudnitskaya, A.; Kirsanov, D.; Frolova, Y.; Clapham, D.; Caricofe, R.; Pardo, M.; Sberveglieri, G. Assessment of bitterness intensity and suppression effects using an Electronic Tongue. In Proceedings of the 13th International Symposium on Olfaction and Electronic Nose, Brescia, Italy, 15–17 April 2009; Volume 1137, pp. 271–274. [Google Scholar]
  49. Kovacs, Z.; Szöllősi, D.; Zaukuu, J.-L.Z.; Bodor, Z.; Vitális, F.; Aouadi, B.; Zsom-Muha, V.; Gillay, Z. Factors Influencing the Long-Term Stability of Electronic Tongue and Application of Improved Drift. Biosensors 2020, 10, 74. [Google Scholar] [CrossRef] [PubMed]
  50. R Core Team. R: A Language and Environment for Statistical Computing; R Foundation for Statistical Computing: Vienna, Austria, 2023; Available online: https://www.R-project.org/ (accessed on 23 November 2023).
  51. Kovacs, Z.; Bodor, Z.; Zinia Zaukuu, J.L.; Kaszab, T.; Bazar, G.; Tóth, T.; Mohácsi-Farkas, C. Electronic nose for monitoring odor changes of Lactobacillus species during milk fermentation and rapid selection of probiotic candidates. Foods 2020, 9, 1539. [Google Scholar] [CrossRef] [PubMed]
  52. Leistner, L. Basic aspects of food preservation by hurdle technology. Int. J. Food Microbiol. 2000, 55, 181–186. [Google Scholar] [CrossRef] [PubMed]
  53. Subasi, B.G.; Alpas, H. Effect of high hydrostatic pressure processing and squeezing pressure on some quality properties of pomegranate juice against thermal treatment. High Press. Res. 2017, 37, 78–92. [Google Scholar] [CrossRef]
  54. Keenan, D.F.; Brunton, N.P.; Mitchell, M.; Gormley, R.; Butler, F. Flavour profiling of fresh and processed fruit smoothies by instrumental and sensory analysis. Food Res. Int. 2012, 45, 17–25. [Google Scholar] [CrossRef]
  55. Terefe, N.S.; Matthies, K.; Simons, L.; Versteeg, C. Combined high pressure mild temperature processing for optimal retention of physical and nutritional quality of strawberries (Fragaria × ananassa). Innov. Food Sci. Emerg. Technol. 2009, 10, 297–307. [Google Scholar] [CrossRef]
  56. Škegro, M.; Putnik, P.; Kovačević, D.B.; Kovač, A.P.; Salkić, L.; Čanak, I.; Frece, J.; Zavadlav, S.; Ježek, D. Chemometric Comparison of High-Pressure Processing and Thermal Pasteurization: The Nutritive, Sensory, and Microbial Quality of Smoothies. Foods 2021, 10, 1167. [Google Scholar] [CrossRef] [PubMed]
  57. Salamon, B.; Zakariás, F.; Csehi, B.; Kiskó, G.; Dalmadi, I. Different sequence of high-hydrostatic pressure and mild-heat treatment on the colour and sensory characteristics of strawberry puree. Acta Aliment. 2021, 50, 93–101. [Google Scholar] [CrossRef]
  58. Figura, L.O.; Teixeira, A.A. Food Physics Physical Properties—Measurement and Applications, 1st ed.; Springer: Berlin/Heidelberg, Germany, 2007; pp. 117–206. [Google Scholar] [CrossRef]
  59. de Oliveira Ribeiro, L.; Almeida, A.C.S.; de Carvalho, C.W.P.; Borguini, R.G.; Ferreira, J.C.S.; Freitas, S.P.; da Matta, V.M. Effect of Processing on Bioactive Compounds, Physicochemical and Rheological Characteristics of Juçara, Banana and Strawberry Smoothie. Plant Foods Hum. Nutr. 2018, 73, 222–227. [Google Scholar] [CrossRef] [PubMed]
  60. Keenan, D.F.; Tiwari, B.K.; Patras, A.; Gormley, R.; Butler, F.; Brunton, N.P. Effect of sonication on the bioactive, quality and rheological characteristics of fruit smoothies. Int. J. Food Sci. Technol. 2012, 47, 827–836. [Google Scholar] [CrossRef]
  61. Ozcan, G.; Barringer, S. Effect of Enzymes on Strawberry volatiles during storage, at different ripeness level, in different cultivars, and during eating. J. Food Sci. 2011, 76, 324–333. [Google Scholar] [CrossRef]
  62. Mitchell, W.C.; Jelenkovic, G. Characterizing NAD- and NADP-dependent alcohol dehydrogenase enzymes of strawberries. J. Am. Soc. Horti. Sci. 1995, 120, 798–801. [Google Scholar] [CrossRef]
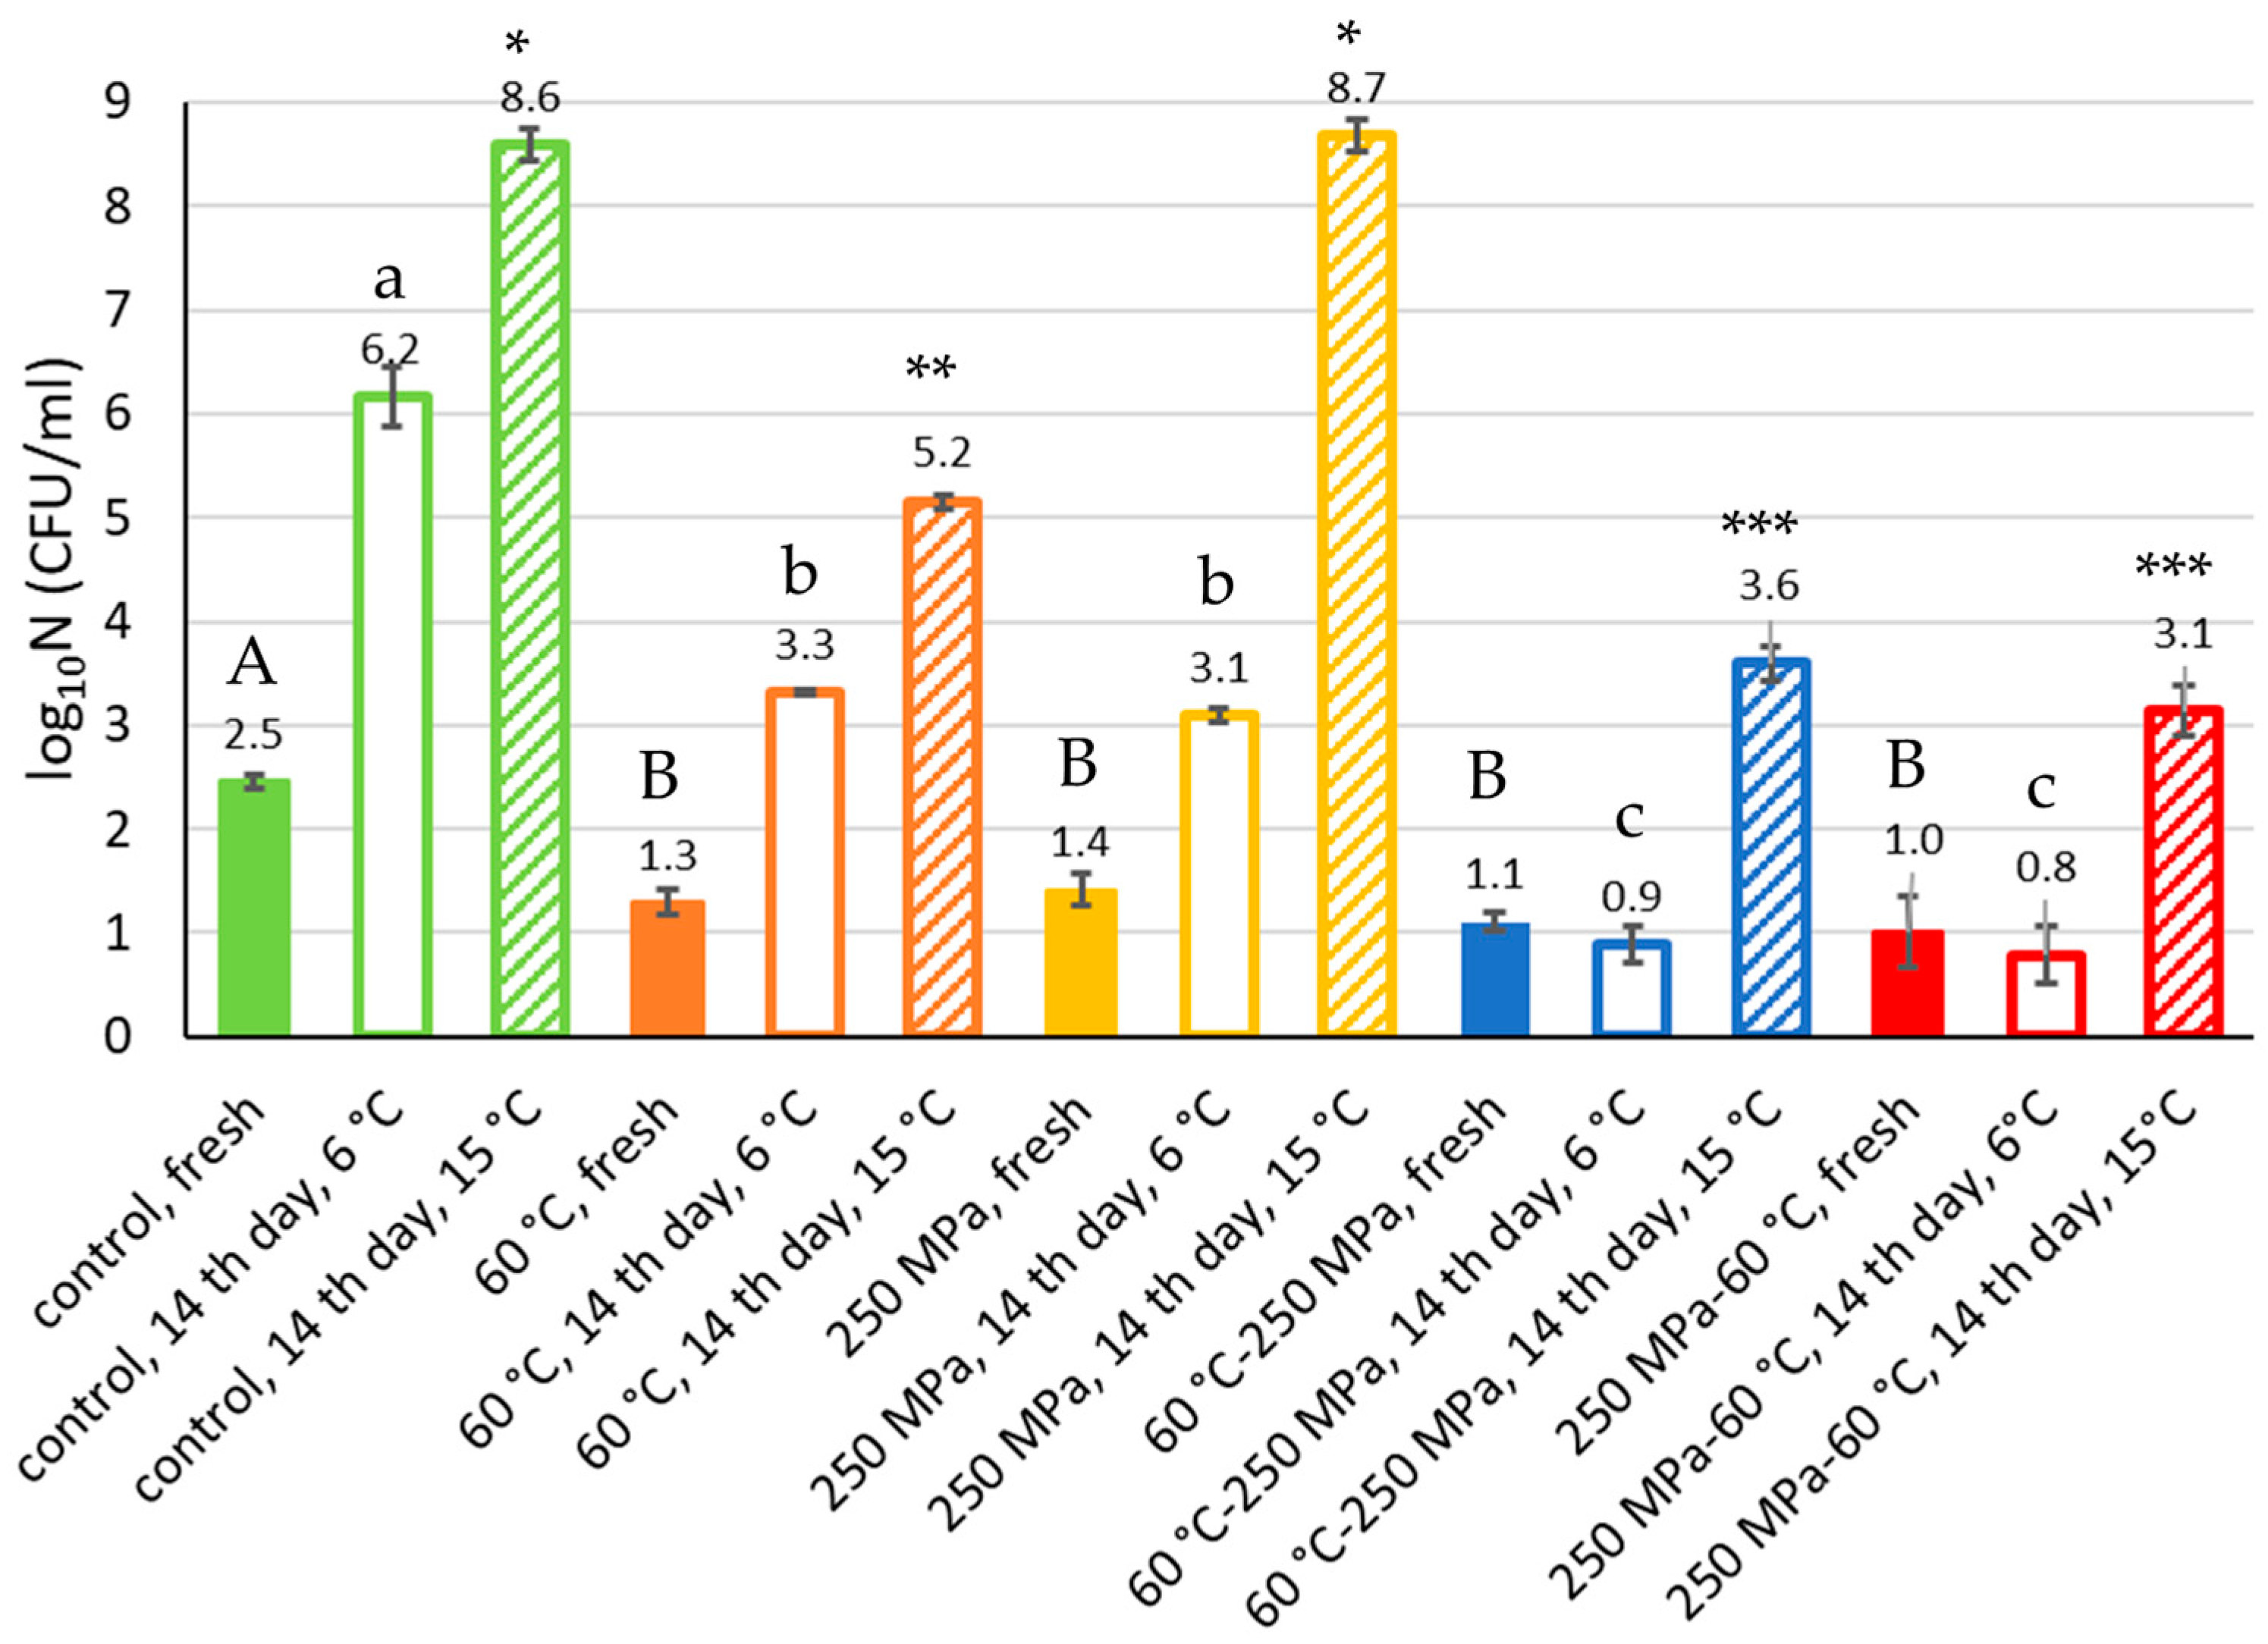
Figure 1. Total colony count of smoothie samples. A, B: comparison of fresh samples treated with different methods (Tukey’s post hoc test, p < 0.05); a, b, c: comparison of samples stored at 6 °C for 14 days and treated by different methods (Tukey’s post hoc test, p < 0.05); *, **, ***: comparison of samples stored at 15 °C for 14 days and treated by different methods (Tukey’s post hoc test, p < 0.05).
Applsci 14 11223 g001
Figure 2. Flow curves (a) and viscosity curves (b) of tested smoothie samples on days 0 and 14.
Applsci 14 11223 g002
Figure 3. Mean and standard deviation of the selected six electronic tongue sensor signals of the tested smoothie samples (n = 36).
Applsci 14 11223 g003
Figure 4. Euclidean distances calculated between the raw signals of the selected six electronic tongue sensors of the tested smoothie samples (n = 36); a neuron-like graph for the visualisation of the Euclidean distances.
Applsci 14 11223 g004
Figure 5. PCA score and loadings plots of the electronic tongue measurements of the tested smoothie samples. (a) PCA score plot (PC1-PC2) coloured by sample types, (b) PCA score plots (PC1-PC3) coloured by the applied pressure level, storage, and treatment types, respectively, and (c) PCA loadings plot (n = 36).
Applsci 14 11223 g005
Figure 6. Chromatograms recorded on the two columns of the Heracles Neo 300 electronic nose for one representative sample of each group. (a) Fresh samples, column 1-A, (b) samples 14th day, column 1-A, (c) fresh samples, column 2-A, (d) samples 14th day, column 2-A.
Applsci 14 11223 g006
Figure 7. Score plot of the principal component analysis performed with all virtual sensors of the electronic nose.
Applsci 14 11223 g007
Figure 8. Result of the discriminant factor analysis performed with all virtual sensors of the electronic nose.
Applsci 14 11223 g008
Figure 9. The average intensity values and standard deviations (dashed area) of the most distinctive virtual sensors for the six groups of samples.
Applsci 14 11223 g009
Figure 10. Result of the discriminant factor analysis performed with the selected virtual sensors indicating the impact of each sensor on the classification performance (the asterisks indicate the size of the vectors showing the effect of each sensor).
Applsci 14 11223 g010
Table 1. Relationship between visual perception and ΔE*ab colour difference [41].
ΔE*ab ValuesPerceived Difference
ΔE*ab ≤ 0.5not noticeable
0.5 < ΔE*ab ≤ 1.5barely noticeable
1.5 < ΔE*ab ≤ 3.0noticeable
3.0 < ΔE*ab ≤ 6.0clearly visible
6.0 < ΔE*ablarge
Table 2. Rank sums of samples in the case of every examined sensory character.
Fresh14th Day
Control60 °C-250 MPa250 MPa-60 °CControl60 °C-250 MPa250 MPa-60 °C
Texture60 ab47 a47 a115 c67 ab84 bc
Smell77 ab74 ab89 b80 b46 ab54 ab
Colour71 b51 ab33 a87 b87 b91 b
Taste105 b91 b97 b44 a40 a43 a
Preference102 c96 bc89 bc32 a49 a52 a
a,b,c: The difference between the ranking sums obtained in the sensory evaluation correlations at 95% significance levels.
Table 3. CIE L*a*b* parameters, chroma (C*) and hue angle (h°) of fresh and stored smoothie samples.
Fresh14th Day
Control60 °C-250 MPa250 MPa-60 °CControl60 °C-250 MPa250 MPa-60 °C
L*49.85 ± 0.55 aA50.70 ± 0.51 aA50.89 ± 0.36 aA50.87 ± 1.04 aA49.61 ± 1.15 aA49.61 ± 1.35 aA
a*11.67 ± 0.25 aA10.27 ± 0.20 aB10.33 ± 0.13 aB10.56 ± 0.31 bA12.10 ± 0.27 bB11.60 ± 0.25 bC
b*9.62 ± 0.27 aA11.06 ± 0.16 aB11.35 ± 0.18 aB10.04 ± 0.37 aA10.53 ± 0.30 bA10.53 ± 0.28 bA
C*15.12 ± 0.32 aA15.09 ± 0.14 aA15.34 ± 0.17 aA14.57 ± 0.47 aA16.04 ± 0.40 bB15.67 ± 0.34 aB
0.69 ± 0.01 aA0.82 ± 0.01 aB0.83 ± 0.01 aB0.76 ± 0.01 bA0.72 ± 0.00 bB0.74 ± 0.01 bC
Means ± standard deviations of L*, a*, b*, C* and h°; Lower case letters (a, b) are for comparison of fresh and stored samples with the same treatment (Tukey’s post hoc test, p < 0.05). Upper case letters (A, B, C) are for comparison of three fresh or three stored samples (p < 0.05).
Table 4. ΔE* colour difference values and its relationship between visual perception in the case of smoothie samples.
Control,
Fresh
60 °C-250 MPa,
Fresh
250 MPa-60 °C,
Fresh
Control,
14th Day
60 °C-250 MPa,
14th Day
250 MPa-60 °C,
14th Day
Control,
fresh
2.18
noticeable
2.42
noticeable
1.57
noticeable
1.04
barely
noticeable
0.93
barely
noticeable
60 °C-250 MPa,
fresh
0.35
barely
noticeable
1.08
barely
noticeable
2.20
noticeable
1.80
noticeable
250 MPa-60 °C,
fresh
1.33
barely
noticeable
2.34
noticeable
1.99
noticeable
Control,
14th day
2.06
noticeable
1.71
noticeable
60 °C-250 MPa,
14th day
0.50
barely
noticeable
250 MPa-60 °C,
14th day
Table 5. Rheological behaviour of smoothie samples (τ0, K, and n indicate the rheological parameters of the samples based on the Herschel–Bulkley model, (R2) is the determination coefficient of the model fitting, η100 and η1000 are apparent viscosity data at a shear rate of 100 s−1 and 1000 s−1).
Fresh14th Day
Control60 °C-250 MPa250 MPa-60 °CControl60 °C-250 MPa250 MPa-60 °C
τ0 (Pa)13.758 ± 0.384 aA14.437 ± 0.660 aA14.292 ± 0.518 aA6.837 ± 1.383 bA11.182 ± 0.505 bB9.347 ± 0.306 bAB
K (Pa·sn)0.778 ± 0.068 aA0.767 ± 0.087 aA0.780 ± 0.001 aA0.560 ± 0.169 aA0.700 ± 0.043 aA0.672 ± 0.089 aA
n0.609 ± 0.014 aA0.615 ± 0.153 aA0.612 ± 0.005 aA0.586 ± 0.042 aA0.594 ± 0.013 aA0.598 ± 0.030 aA
R20.998 ± 0.0010.999 ± 0.0010.998 ± 0.0100.979 ± 0.0170.984 ± 0.0180.982 ± 0.016
η100 (mPa·s)272.6 ± 5.4 aA277.8 ± 9.9 aA278.6 ± 4.6 aA157.4 ± 6.6 bA236.5 ± 13.1 bB218.2 ± 25.1 bB
η1000 (mPa·s)67.55 ± 0.43 aA69.15 ± 1.68 aA68.83 ± 0.39 aA37.89 ± 0.93 bA54.84 ± 0.81 bB51.33 ± 3.07 bB
Values are means ± standard deviation. Lower case letters (a, b) are for comparison of fresh and stored samples with the same treatment (Games–Howell post hoc test, p < 0.05). Upper case letters (A, B) are for comparison of three fresh or three stored samples (p < 0.05).
Disclaimer/Publisher’s Note: The statements, opinions and data contained in all publications are solely those of the individual author(s) and contributor(s) and not of MDPI and/or the editor(s). MDPI and/or the editor(s) disclaim responsibility for any injury to people or property resulting from any ideas, methods, instructions or products referred to in the content.