Article

Airfoil Design and Flow Analysis of a Multi-Blade Centrifugal Fan: An Experimental and Simulation Study

College of Metrology and Measurement Engineering, China Jiliang University, Hangzhou 310018, China
*
Authors to whom correspondence should be addressed.
Appl. Sci. 2024, 14(23), 11229; https://doi.org/10.3390/app142311229
Submission received: 14 October 2024 / Revised: 27 November 2024 / Accepted: 28 November 2024 / Published: 2 December 2024
(This article belongs to the Section Aerospace Science and Engineering)

Abstract

:
To overcome the technical challenges of the multi-blade centrifugal fan, such as low efficiency and insufficient total pressure, the blades of the fan were optimally designed in this study. The flow field of the multi-blade centrifugal fan with a single-arc blade and an airfoil blade was simulated and compared using Computational Fluid Dynamics (CFDs). Under steady-state conditions, the total pressure, velocity field distribution, and aerodynamic performance of a multi-blade centrifugal fan were analyzed. The numerical results showed that there were vortices, secondary flows, and boundary layer separation phenomena in the flow passage of the single-arc multi-blade centrifugal fan. Based on the lift-to-drag ratio theory of airfoil in aerodynamics, four different airfoil blades were designed for the multi-blade centrifugal fan. The study found that the lift-to-drag ratio of the airfoil blades was positively correlated with the fan efficiency; among them, the A-type airfoil exhibited the highest lift-to-drag ratio within the 0–10 degree angle of attack range. The three-dimensional simulation results indicated that, except for the initial operating point B, the A-type airfoil showed higher fan efficiency under other operating conditions, and its total pressure curve was the most stable. In addition, the use of airfoil blades effectively suppressed the aforementioned adverse flow phenomena and improved the flow within the blade passage. Experimental verification further confirmed the effect of airfoil blades on improving fan performance: compared to single-arc blades, the efficiency of the multi-blade centrifugal fan increased by 3–7% after using airfoil blades, and the upper limit of high-efficiency flow increased from 450 m3/h to 650 m3/h. Meanwhile, the total pressure and power of the airfoil fan were also significantly improved. The results of this work are significant for guiding the optimal design of the fan.

1. Introduction

Multi-blade centrifugal fans are widely used in ventilating household appliances such as range hoods and air conditioners because of their advantages of large flow coefficient and high-pressure performance. However, under the rotating action of fan blades and the action of a volute, the internal flow of the centrifugal fan impeller is complex. Complex flow characteristics such as turbulence, vortex, secondary flow, and jet structure will further affect the stability and operation of the fan [1], leading to fan damage and increased energy consumption. Since the 19th century, the rise of the Industrial Revolution has led to an explosive increase in demand for fans. Fans are widely used in industries such as metallurgy, chemical engineering, petroleum refining, natural gas, and refrigeration [2]. Moreover, fans are among the most important auxiliary equipment in power generation stations. The power consumption of various fans accounts for 1.5–2.5% of unit electricity output [3,4]. In the present day, the escalating energy demand and finite reserves of traditional fossil fuels have rendered the global energy situation increasingly precarious, while environmental pollution issues are also becoming increasingly serious. To improve ventilation performance and reduce energy loss, it is essential to enhance the efficiency of multi-blade centrifugal fans by conducting in-depth investigations into their internal flow characteristics and continually optimizing their structural designs [5].
The stability of the internal flow field is a pivotal issue affecting the aerodynamic performance of centrifugal fans. With the rapid advancement of computer technology, computational fluid dynamics (CFD) has found extensive applications in various fields, including aerospace, oil and gas, and turbine design [6]. Many scholars employ CFD technology to analyze the flow field in their research on centrifugal fans. For instance, Corsini et al. [7] used the Realizable k-ε model for numerical simulation to investigate the flow state within the flow channel, identifying phenomena such as secondary flow and reflux. Wang et al. [8] explored the impact of an oblique cut on the leading edge of a blade on the performance of a squirrel cage fan, revealing that an optimal oblique cutting angle could enhance inlet flow conditions, thereby shifting the fan’s performance curve toward higher flow rates. Similarly, Son et al. [9] employed the Realizable k-ε turbulence model for numerical simulation to examine the three-dimensional flow inside centrifugal blowers. Additionally, some scholars have delved into the flow regime of rotating machinery under varying operating conditions [10,11,12]. By analyzing the eddy current state within the fan flow field, they discussed energy loss in the fan flow channel, concluding that impeller loss is closely associated with the occurrence of separation flow in the blade flow channel—the more severe the separation, the greater the impeller loss. Li et al. [13] conducted numerical research on the internal flow pressure field, energy field, and loss distribution of the pump by using the SST k-ω turbulent model, emphasizing the comprehension of these parameters. Song et al. [14] investigated the influence of guide blade openings on the rotor–stator interaction between the splitter guide blade, while Li et al. [15] examined the stability of the internal flow field in the impeller passage and blade surface area, focusing on internal flow parameters such as total pressure and velocity. Their findings indicated that the maximum energy loss is concentrated near the suction front. Numerous numerical calculation studies [16,17] have demonstrated that the numerical calculation and analysis method can intuitively and effectively reveal the internal flow field characteristics of the fan, which is crucial for guiding the optimal design of the fan.
The single-arc equal-thickness blades employed in this study are prevalently utilized in centrifugal fan design due to their cost-effectiveness. Presently, three principal blade design methodologies exist: (1) implementing double or multi-arc blades to enhance profile load, (2) the exploration of optimal combination parameters for impeller structural dimensions, and (3) the optimization of fan blades through speed distribution profile design or airfoil design. Numerous scholars have leveraged bionic technology to investigate the correlation between airfoils and aerodynamic performance [18,19]. The blades are coupled and designed to analyze the interrelationship between chord length, stroke angle, and efficiency. Abreu et al. [20] also discerned the bionic design influences of noise reduction through numerical simulation and experimental comparison. Certain studies have posited that the presence of a blocking effect and secondary flow within the flow field diminishes the fan efficiency [21,22,23]. The fan impeller is parametrically designed, yielding optimal blade parameters. Post-optimization, the total pressure differential is markedly reduced, with concomitant improvements in both efficiency and flow rate [24,25]. Factors such as blade inlet clogging can significantly impair impeller efficiency. Consequently, Shen et al. [26] proposed a long–short blade impeller design, enhancing overall fan efficiency by 5.27%. Simulations indicate a strong positive correlation between stroke-plane angle and efficiency. Park and Chang [27] contended that airfoil blades generally outperform single-arc blades, attributing this to the suppression of flow separation between the impeller and the volute in airfoil blades, thereby enhancing fan performance. Suresh and Sitaram [28] examined the impact of the Gurney Flap configuration on centrifugal fan performance at varying Reynolds numbers, concluding that fan performance significantly improves with the Gurney flap at low Reynolds numbers. Lin and Huang [29] applied airfoil design principles to centrifugal fan blades. Zhuang [30] analyzed the effect of curvature on the wake, demonstrating that increased incurvature of the shear layer exacerbates the wake. Prabu et al. [31] mitigated secondary flow loss and achieved uniform flow at the impeller exit by altering the wrap angle at the trailing edge (referred to as the stacking condition). In summary, both double-arc blades and airfoil blades can enhance the aerodynamic performance of the fan, corroborating that optimizing blade shape is an efficacious method to improve fan performance.
As mentioned above, many scholars have conducted in-depth studies on the internal flow state of multi-blade centrifugal fans, significantly improving their operational efficiency. However, the relationship between the lift-to-drag ratio of airfoils and the aerodynamic performance of centrifugal fans has not been fully studied. This study innovatively combined the theory of the airfoil lift-to-drag ratio with fluid dynamics to deeply analyze the flow characteristics of airfoils. Airfoil blades were designed for multi-blade centrifugal fans, exploring the relationship between their lift-to-drag ratio and aerodynamic performance. Compared to traditional single-arc blade models, airfoil blades effectively suppressed vortices, secondary flows, and boundary layer separation in the blade passage, impeller, and volute gaps. The experimental test results were consistent with the simulation results, verifying the accuracy and feasibility of the aerodynamic performance improvement scheme proposed in this study. This provides important guidance for the optimization and performance improvement evaluation of fan performance.

2. Methodology

2.1. Geometric and Mathematical Models

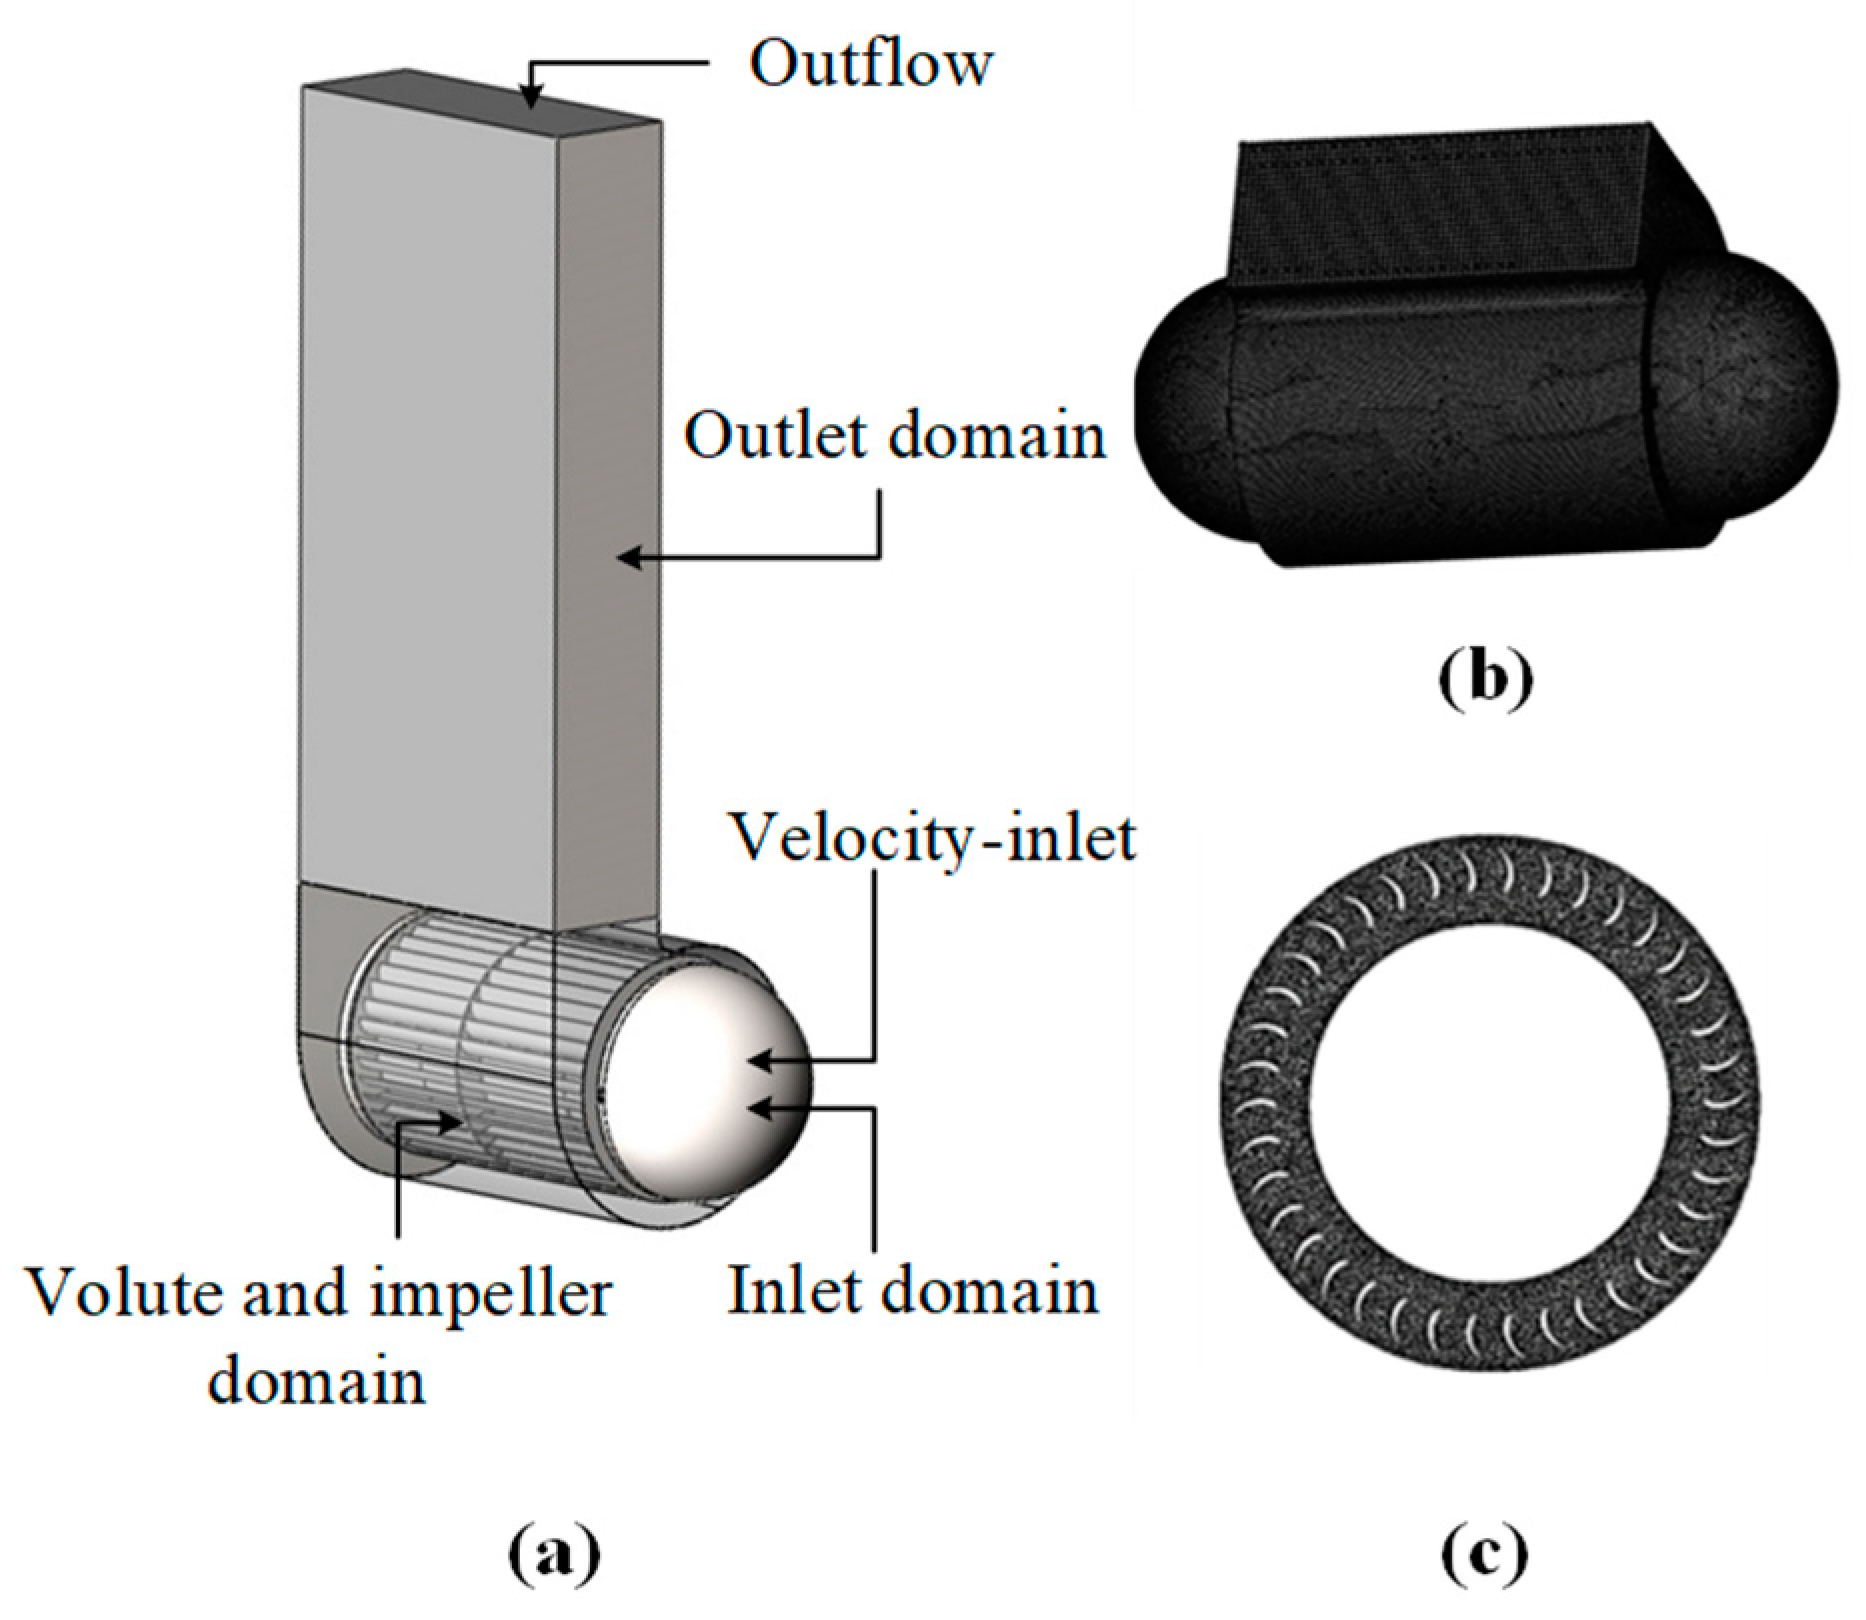
The structure of the multi-blade centrifugal fan utilized in this study is depicted in Figure 1a. Notably, the impeller, shown in Figure 1b, constitutes the primary component of the fan. Crucially, it is the blades on the impeller that dictate the fan’s performance, which is the focal point of this research. The blade with a single-arc structure is shown in Figure 1c.
The multi-blade centrifugal fan model depicted in Figure 1 was utilized for fluid simulation by CFD to obtain the fluid parameters for flow-field analysis and airfoil design. The detailed structural parameters of the multi-blade centrifugal fan are presented in Table 1.
The dynamic parameters of the fluid in the fan can be described by the fundamental equations of fluid mechanics. In the internal flow field of the multi-blade centrifugal fan, the airflow moves at a low speed, and the temperature change can be neglected. Therefore, the airflow can be considered as incompressible adiabatic flow. At the lowest flow point, the inlet velocity of the fan is 0.28 m/s. At this moment, the calculated Reynolds number is 5840, which is greater than the critical value of 4000 for turbulence. Therefore, the flow model is regarded as a turbulent model, and the Realizable k-ε model is used in the calculation, which can accurately calculate the turbulence [7,9]. During the two-dimensional simulation process of airfoils, the widely used SST k-ω turbulence model is adopted.

2.2. Airfoil Theory

In this study, the single-arc blade was designed into the airfoil blade. Figure 2 shows the schematic diagram of the airfoil, and the lift-to-drag ratio is an important parameter to describe the aerodynamic performance of an airfoil.
The force on the airfoil is mainly derived from the combined force of the upper and lower surfaces of the airfoil. The force perpendicular to the incoming flow in the infinitely distant flow field is the lift FL and the force consistent or parallel to the incoming flow is the drag FD. The angle of the component force is the lift angle λ. The lift and drag of the airfoil can be characterized as dimensional coefficients like the pressure, which are, respectively, the lift coefficient CL and the drag coefficient CD. Zhukovsky’s theorem indicates that the lift-to-drag ratio of the airfoil is correlated with the aerodynamic performance of the fan [32]. A fan with a large lift-to-drag ratio has better functional power and aerodynamic performance [33,34]. Therefore, it is crucial for the airfoil to obtain a large lift and the lowest possible drag.

2.3. Flow Effect in Impeller

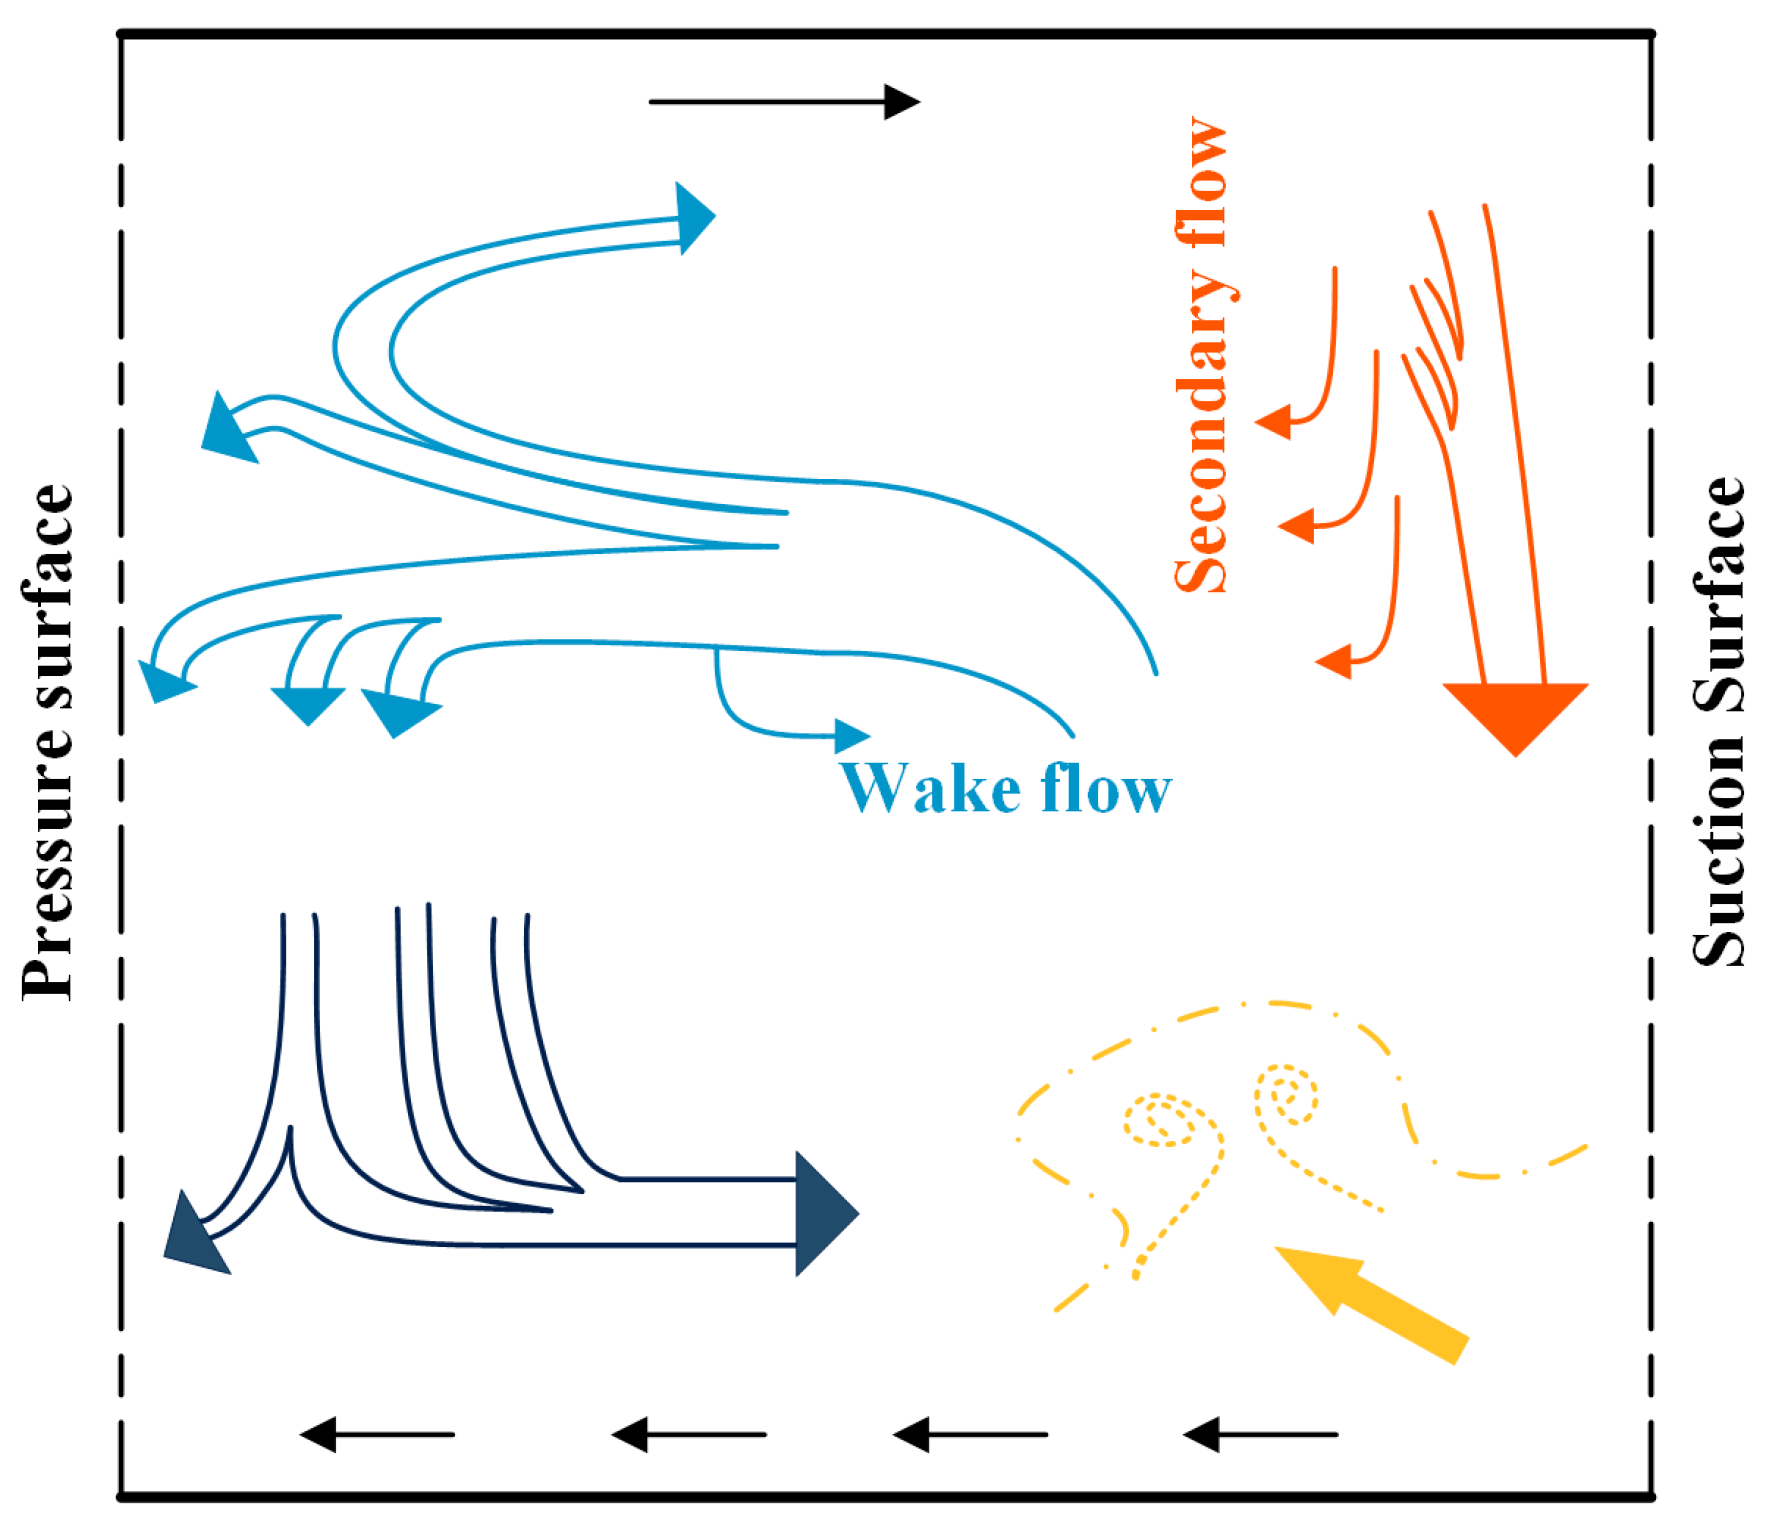
The presence of a boundary layer on the impeller surface can lead to various flow phenomena due to fluid viscosity, impeller rotation, blade curvature, and the Coriolis force. These phenomena include boundary layer growth, flow separation, secondary flow patterns, and stratification effects. The occurrence of these phenomena is the main source of energy loss in the impeller flow channel. Figure 3 shows the schematic diagram of the secondary flow in the impeller channel.
Since there is a pressure gradient between the pressure surface and the suction surface in the channel, low-energy fluid will flow to the suction surface to balance the pressure difference. Because of curvature, secondary flow occurs inside the channel. This flow carries low-energy material to the leading edge, creating a wake region between the suction surface and the leading edge, which can easily result in a blockage effect. Due to the existence of the wake region, the fluid in the impeller channel shifts to the pressure surface, and the relative velocity of the fluid is higher, forming a jet area. If the velocity gradient between the jet area and the wake area is large, a “jet wake” is formed. For the optimization design of the centrifugal impeller, it is necessary to minimize the wake area and jet wake, avoid the flow separation in the boundary layer, and inhibit the development of the boundary layer on the impeller surface.
The primary distinguishing feature of secondary flow is the movement of airflow along the leading-edge boundary layer from the high-pressure side to the low-pressure side. In comparison to the two predominant flows, there is a significant transverse flow toward the high-pressure side in the center of the channel. This flow is partly induced by vortices in the direction of the flow and partly due to the thickening of the boundary layer on the low-pressure side.

2.4. Model Simulation and Experimental Verification

Due to the intricate structure of the multi-blade centrifugal fan, the computational domain must be simplified to reduce computation time. As illustrated in Figure 4a, the Multi-Reference Frame (MRF) is employed to define the dynamic and static regions. Specifically, the impeller flow area is deemed dynamic, and its rotation axis and angular velocity are specified. Meanwhile, the other flow areas are designated static. To ensure proper fluid exchange, the interface between the two regions must be redefined to achieve one-to-one correspondence. The boundary conditions are set to velocity-inlet and outflow, whereas the remaining surfaces are defined as walls. The pressure–velocity coupling adopts the SIMPLE algorithm, and the second-order upwind scheme is used for discretization. The hybrid grid is used to improve the grid quality. As shown in Figure 4a, a structured grid is used because of the simple structure of the outlet domain and the small number of grids. It can be seen from Figure 4b,c that the volute and impeller domain structures are complex, so they need to be encrypted to ensure the quality of the computational grid.
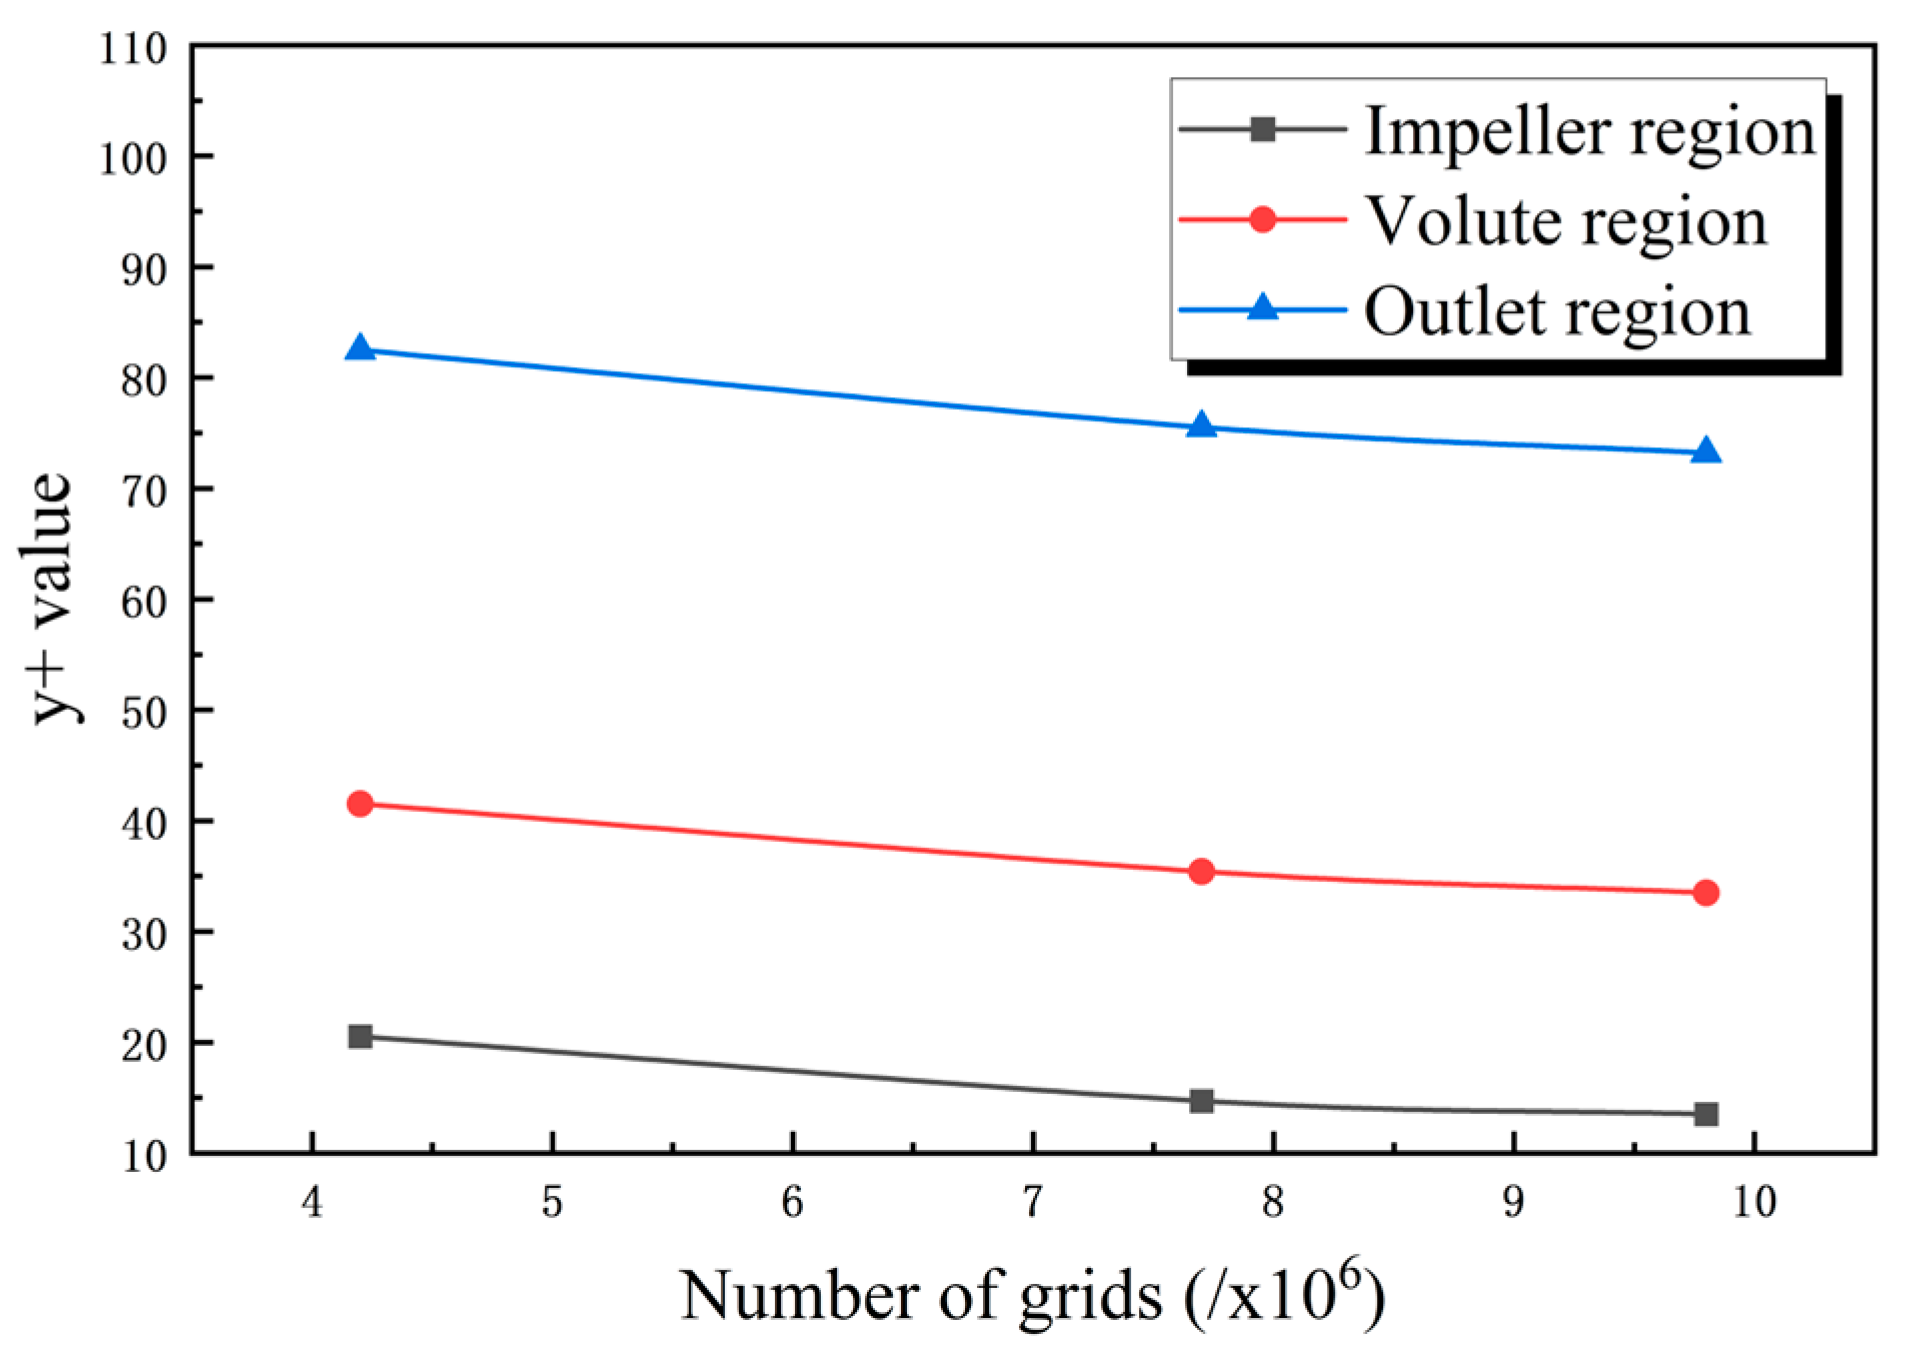
To ensure that the simulation results are no longer dependent on the level of grid refinement, it is necessary to verify the grid independence of the fan model. As shown in Table 2, in this study, total grid numbers of 4.2 million, 7.7 million, and 9.8 million were used to simulate the steady state of the centrifugal fan. By comparing the y+ values for the impeller, volute, and outlet with three different grid numbers, it was analyzed that both 7 million and 9 million grids were reasonable choices. Considering the principles of saving time and cost, the number of grids for option 2 was ultimately selected. The corresponding grid counts for the impeller flow field, volute flow field, and outlet extension section were 3.75 million, 3.27 million, and 0.6 million, respectively.
As shown in Figure 5, it presents the y+ values of different positions of the wind turbine under different grids. When the grid number is 7.7 × 10⁶ and 9.8 × 10⁶, there is little difference in the y+ values. In this case, it is a reasonable choice to select 7.7 × 10⁶.
According to the fan test standards [35], an experimental platform was established and a fan performance test was conducted. Figure 6 is the photo of the experimental setup. As shown, the core device mainly includes a test fan, an air chamber, a nozzle, a rectification, and an auxiliary fan.
This study employed ANSYS Fluent 2021 R2 [36] as the primary Computational Fluid Dynamics (CFD) simulation tool. Fluent 2021 R2 is a widely used advanced CFD software package in the engineering field, capable of simulating and analyzing various complex fluid flow phenomena, including laminar flow, turbulent flow, multiphase flow, and heat transfer problems. It also offers a rich library of physical models to meet the needs of different application scenarios.
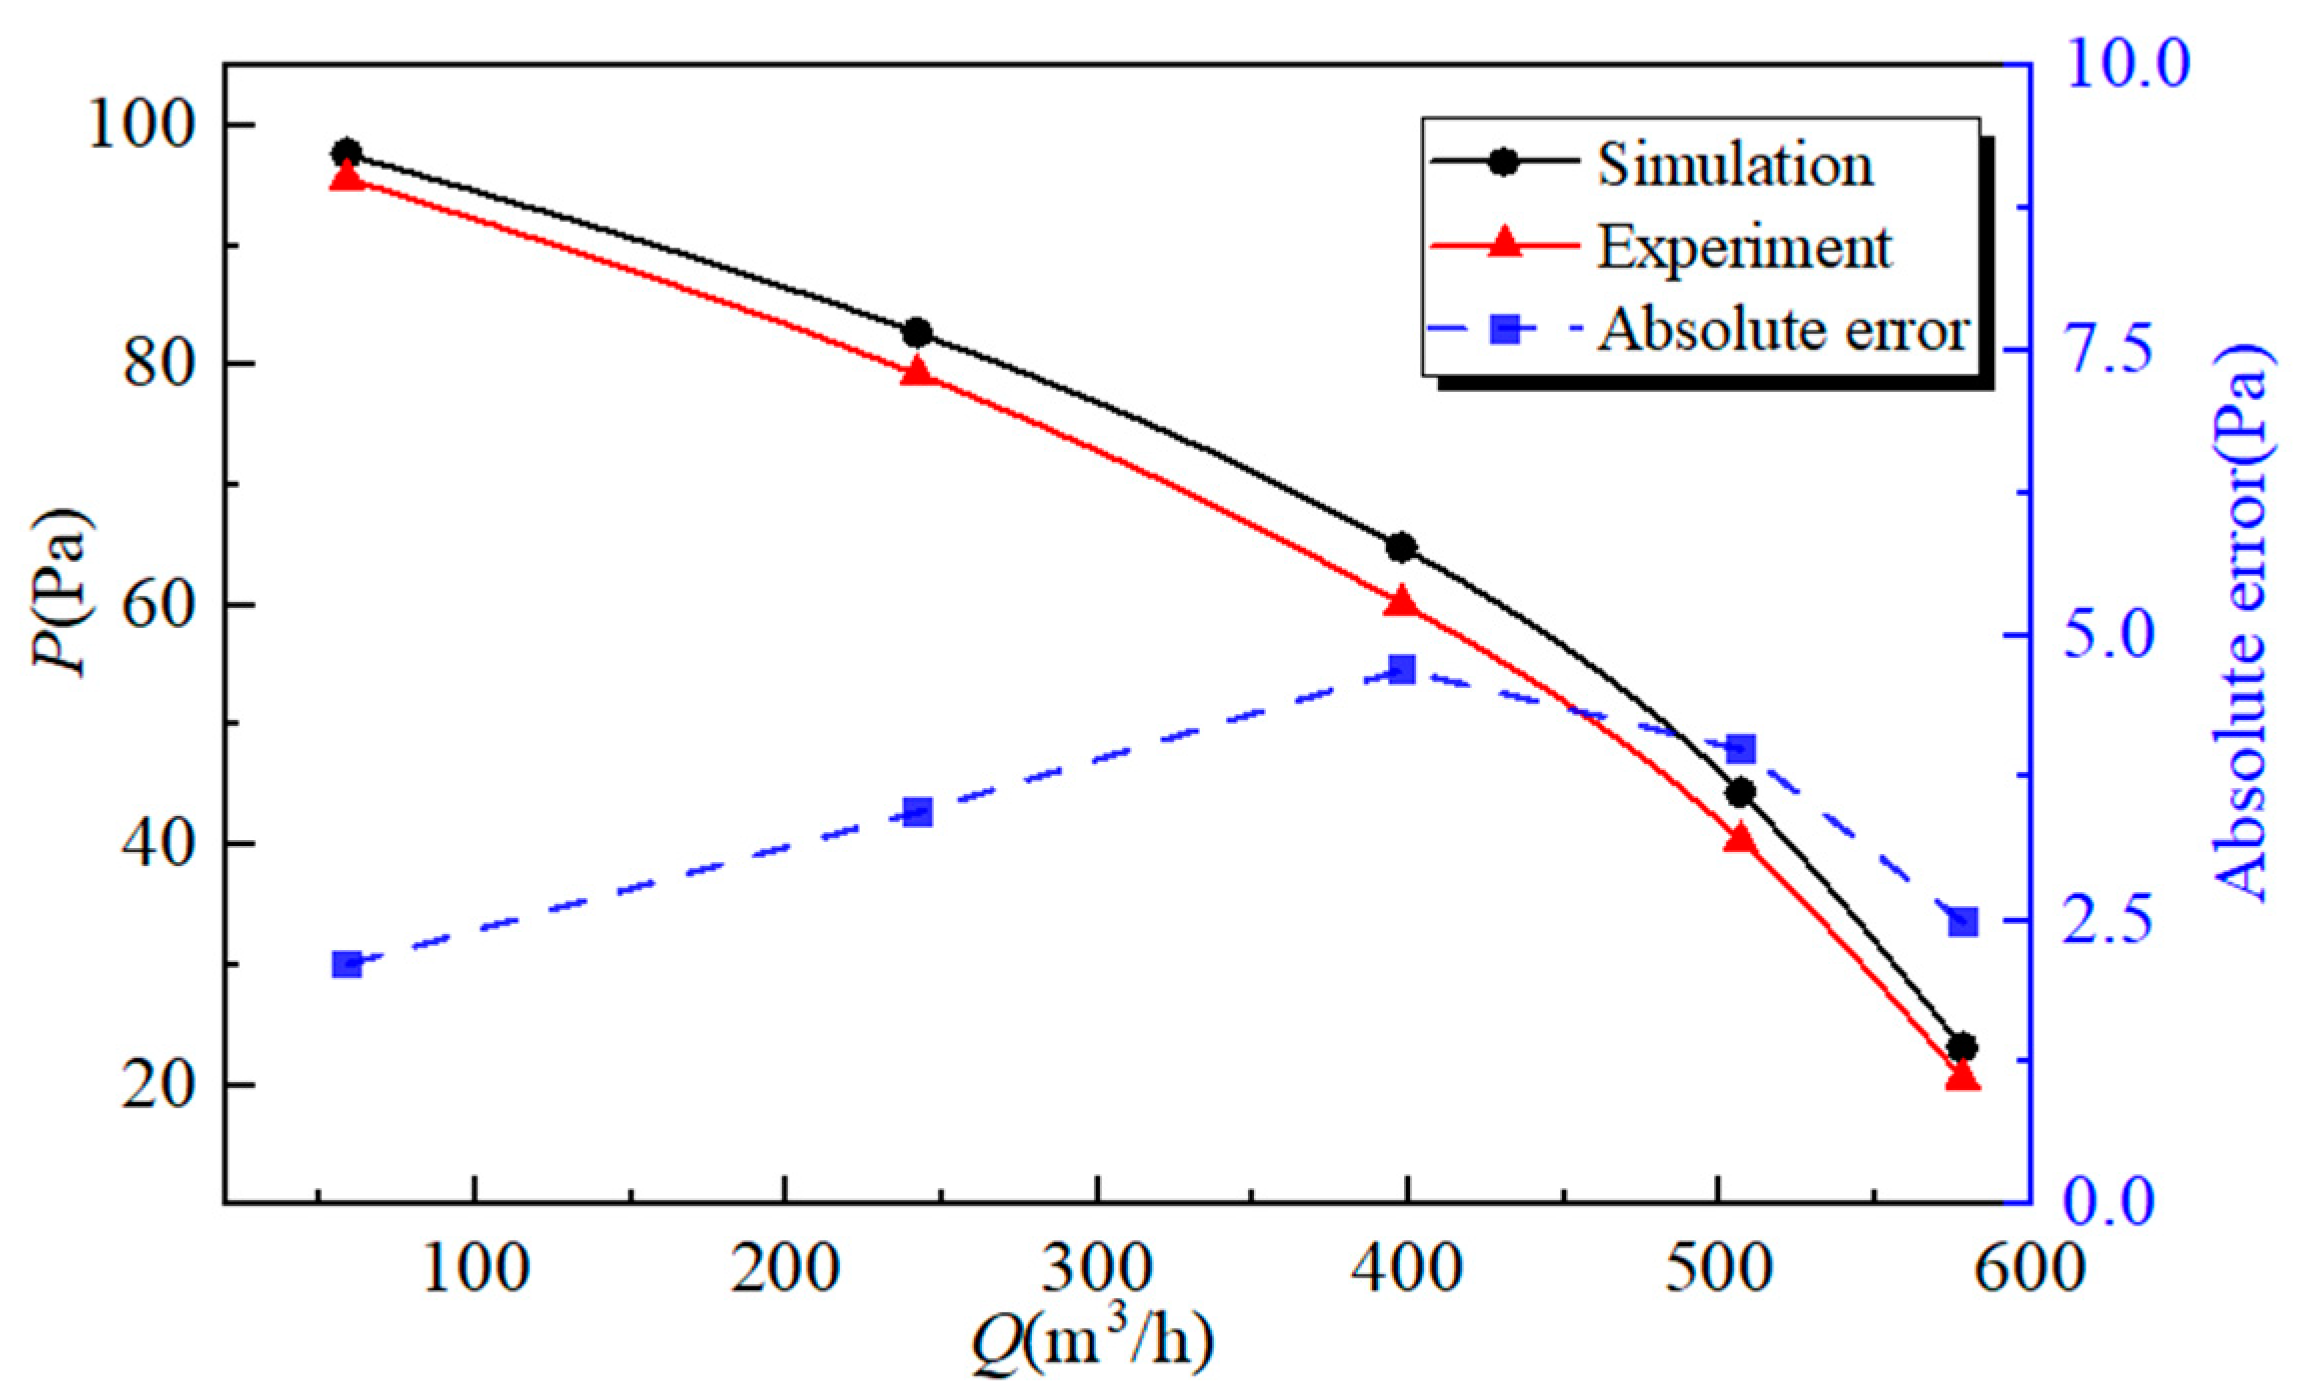
Under different working conditions, the air volume is changed by adjusting the load pressure at the fan outlet. The comparison results of total pressure (P) and flow rate (Q) of fan test data under different working conditions and the simulation data are presented in Figure 7. The results indicate that the experimental result is basically consistent with the simulation data and that the maximum absolute error between the two occurs at a flow rate of 400 m3/h, with an absolute error of 4.70 Pa. Therefore, it can be considered that the CFD calculation is reliable and a verified experiment is feasible.

3. Results and Discussion

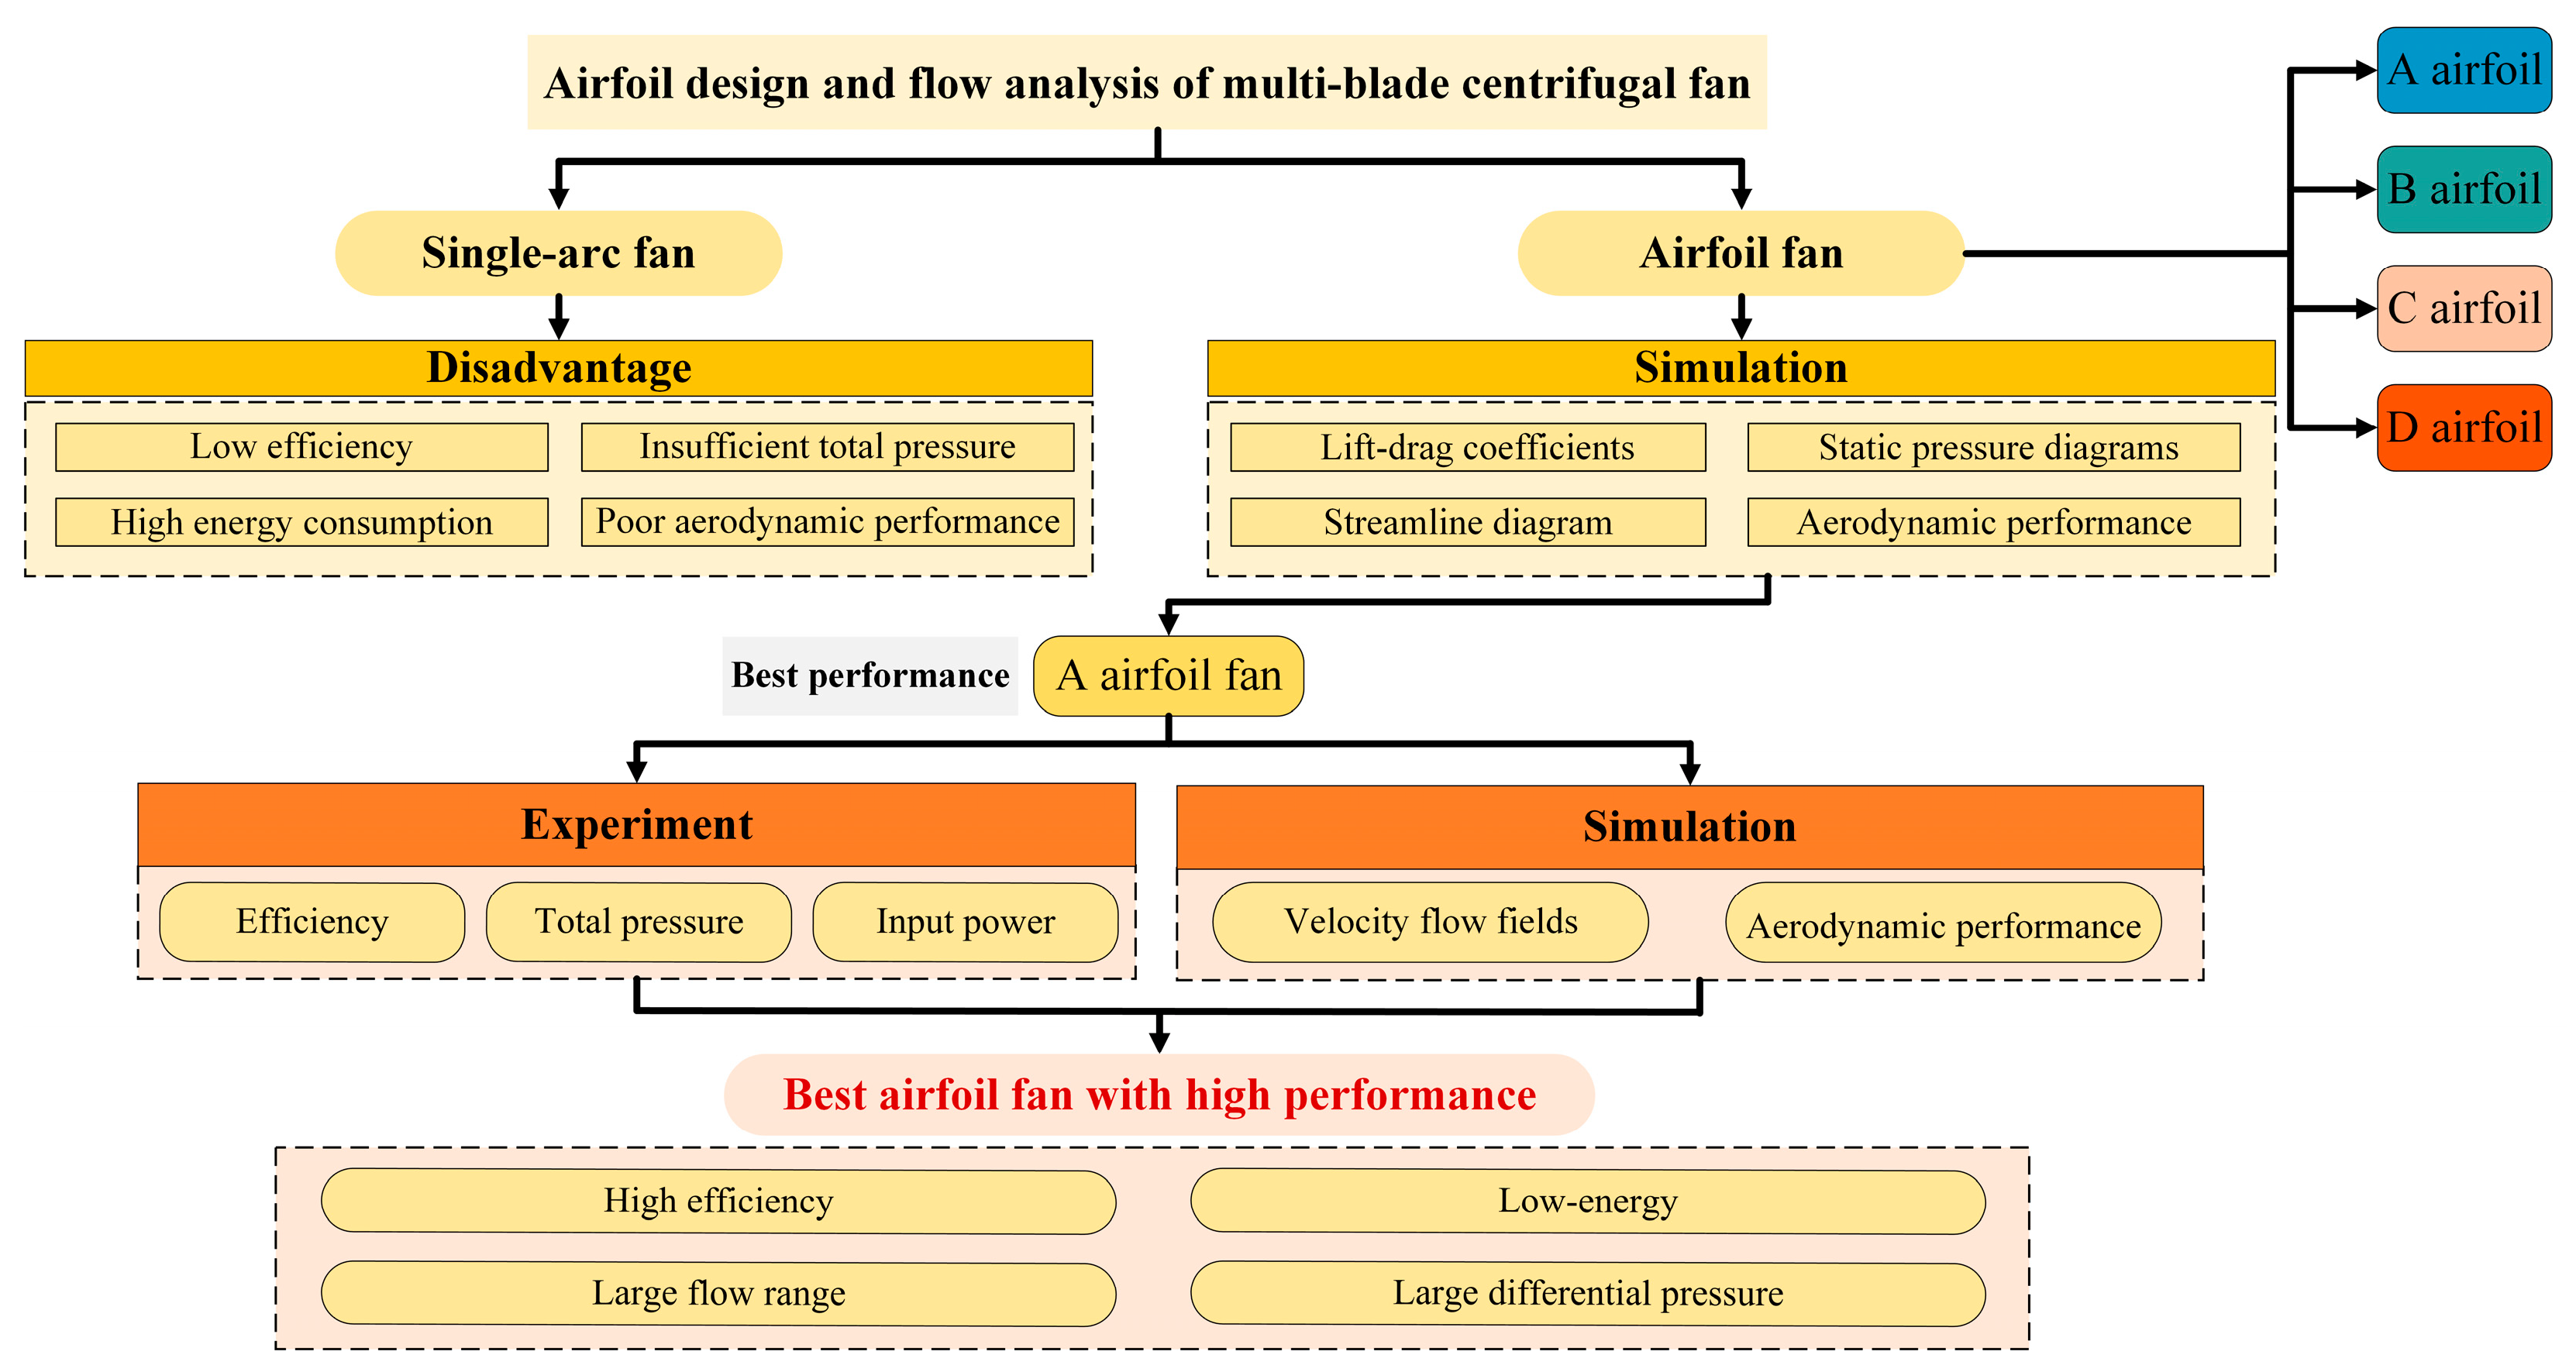
To verify that the airfoil fan can reduce energy consumption and improve ventilation rate, we employed a research method that combines simulation and experimentation. Figure 8 summarizes the research method of combining simulation and experiment. In the simulation, the relationship between the aerodynamic performance of airfoils and airfoil fans and the performance improvement in airfoil fans compared with single-arc fans are studied by designing airfoils as airfoil blades and applying them to fans. Additionally, the single-arc fan and the best airfoil fan are tested by experiment, aiming to verify the reliability of the simulation results.

3.1. Effects of Airfoil on Fan Performance

3.1.1. Lift-to-Drag Ratios of Different Airfoils

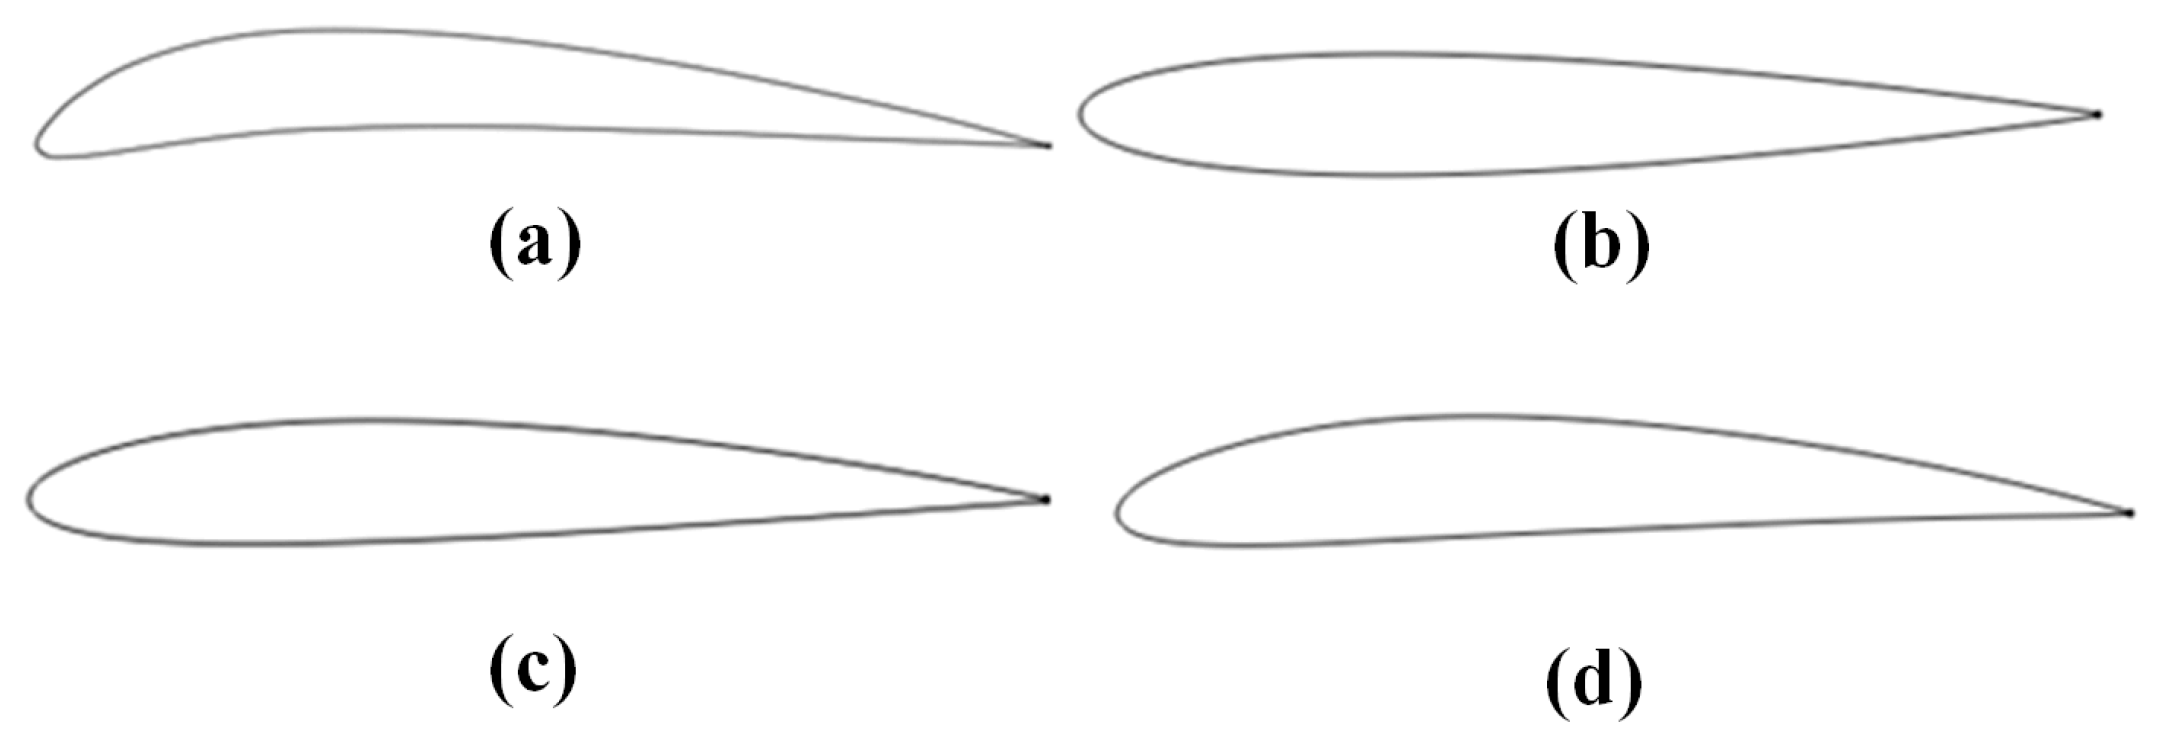
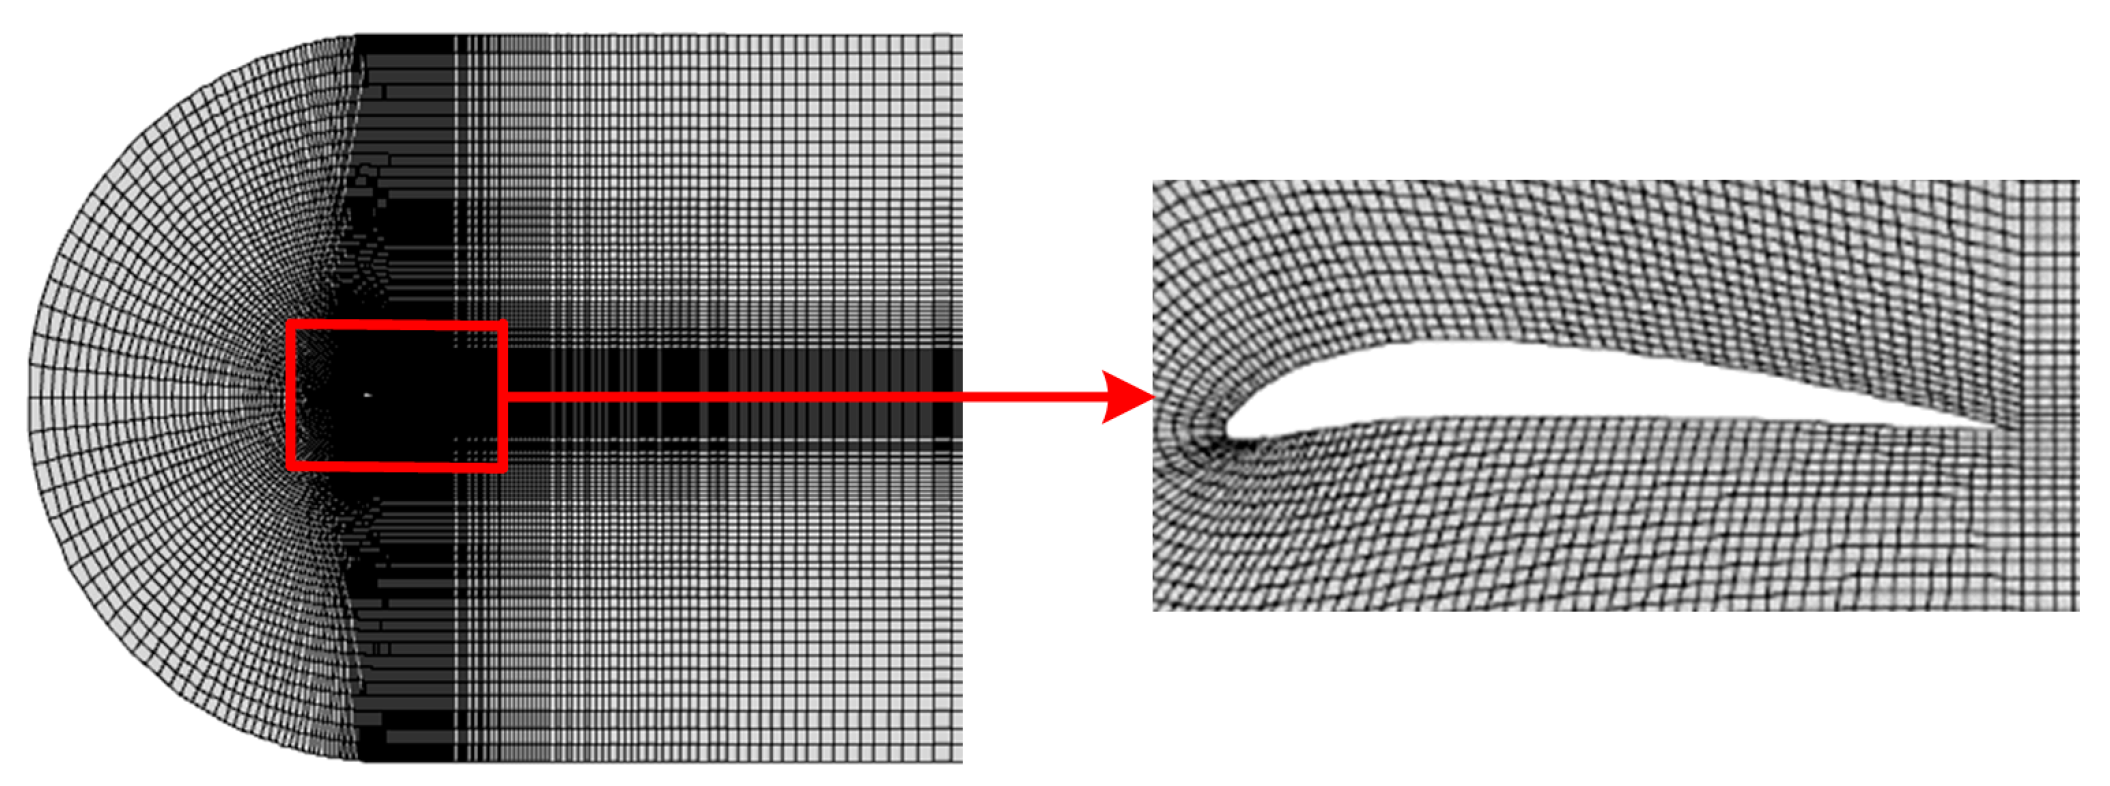
The selected models are BE10307B (A airfoil), NACA0012 (B airfoil), NACA2412 (C airfoil), and NACA4412 (D airfoil), which are used to design the airfoil of centrifugal fan blades. The shapes of the airfoil and grid distribution are shown in Figure 9 and Figure 10, respectively. The chord length of the airfoil used in the calculation is the chord length of the single-arc blade, and the value is 17 mm. The velocity of the impact airfoil is V = 50.0 m/s, Re = 2.0 × 10⁵. The calculation conditions are the same for all airfoils. The boundary conditions of the airfoil are set as follows: the semicircular arc and the upper and lower regions of the computational domain are given velocity boundaries and the outlet pressure is given at the exit position. Turbulence intensity is calculated according to Equation (1), and the value is 3.6%. The turbulence model is Realizable k-ε, and the solution algorithm adopts the Coupled Algorithm. The values for the constants in SST k-ω turbulence model are typically taken as follows: β * = 0.09 ; β = 0.075 ; σ k = 0.5 ; σ ω = 0.5 ; α 1 = 0.31 ; σ k 1 = 1.0 ; σ k 2 = 1.0 ; σ ω 1 = 0.5 ; and σ ω 2 = 0.865 . The residual convergence value is set to 1 × 10⁻⁶, the lift coefficient and drag coefficient are tested, and the relaxation factor adopts the default value of the simulation software.
I = 0.16 · R e 0.125
The grid numbers for the numerical calculation of the two-dimensional airfoil are shown in Table 3. The lift coefficient CL and drag coefficient CD at the angle of attack of 5° are taken as the independent verification data. The maximum difference of CL is 0.26%, and the maximum difference of CD is 0.032%. The errors of the three grids are all very small, which well verifies the grid independence. In order to save computation time and minimize computational errors, Grid 2 was utilized for numerical calculations.
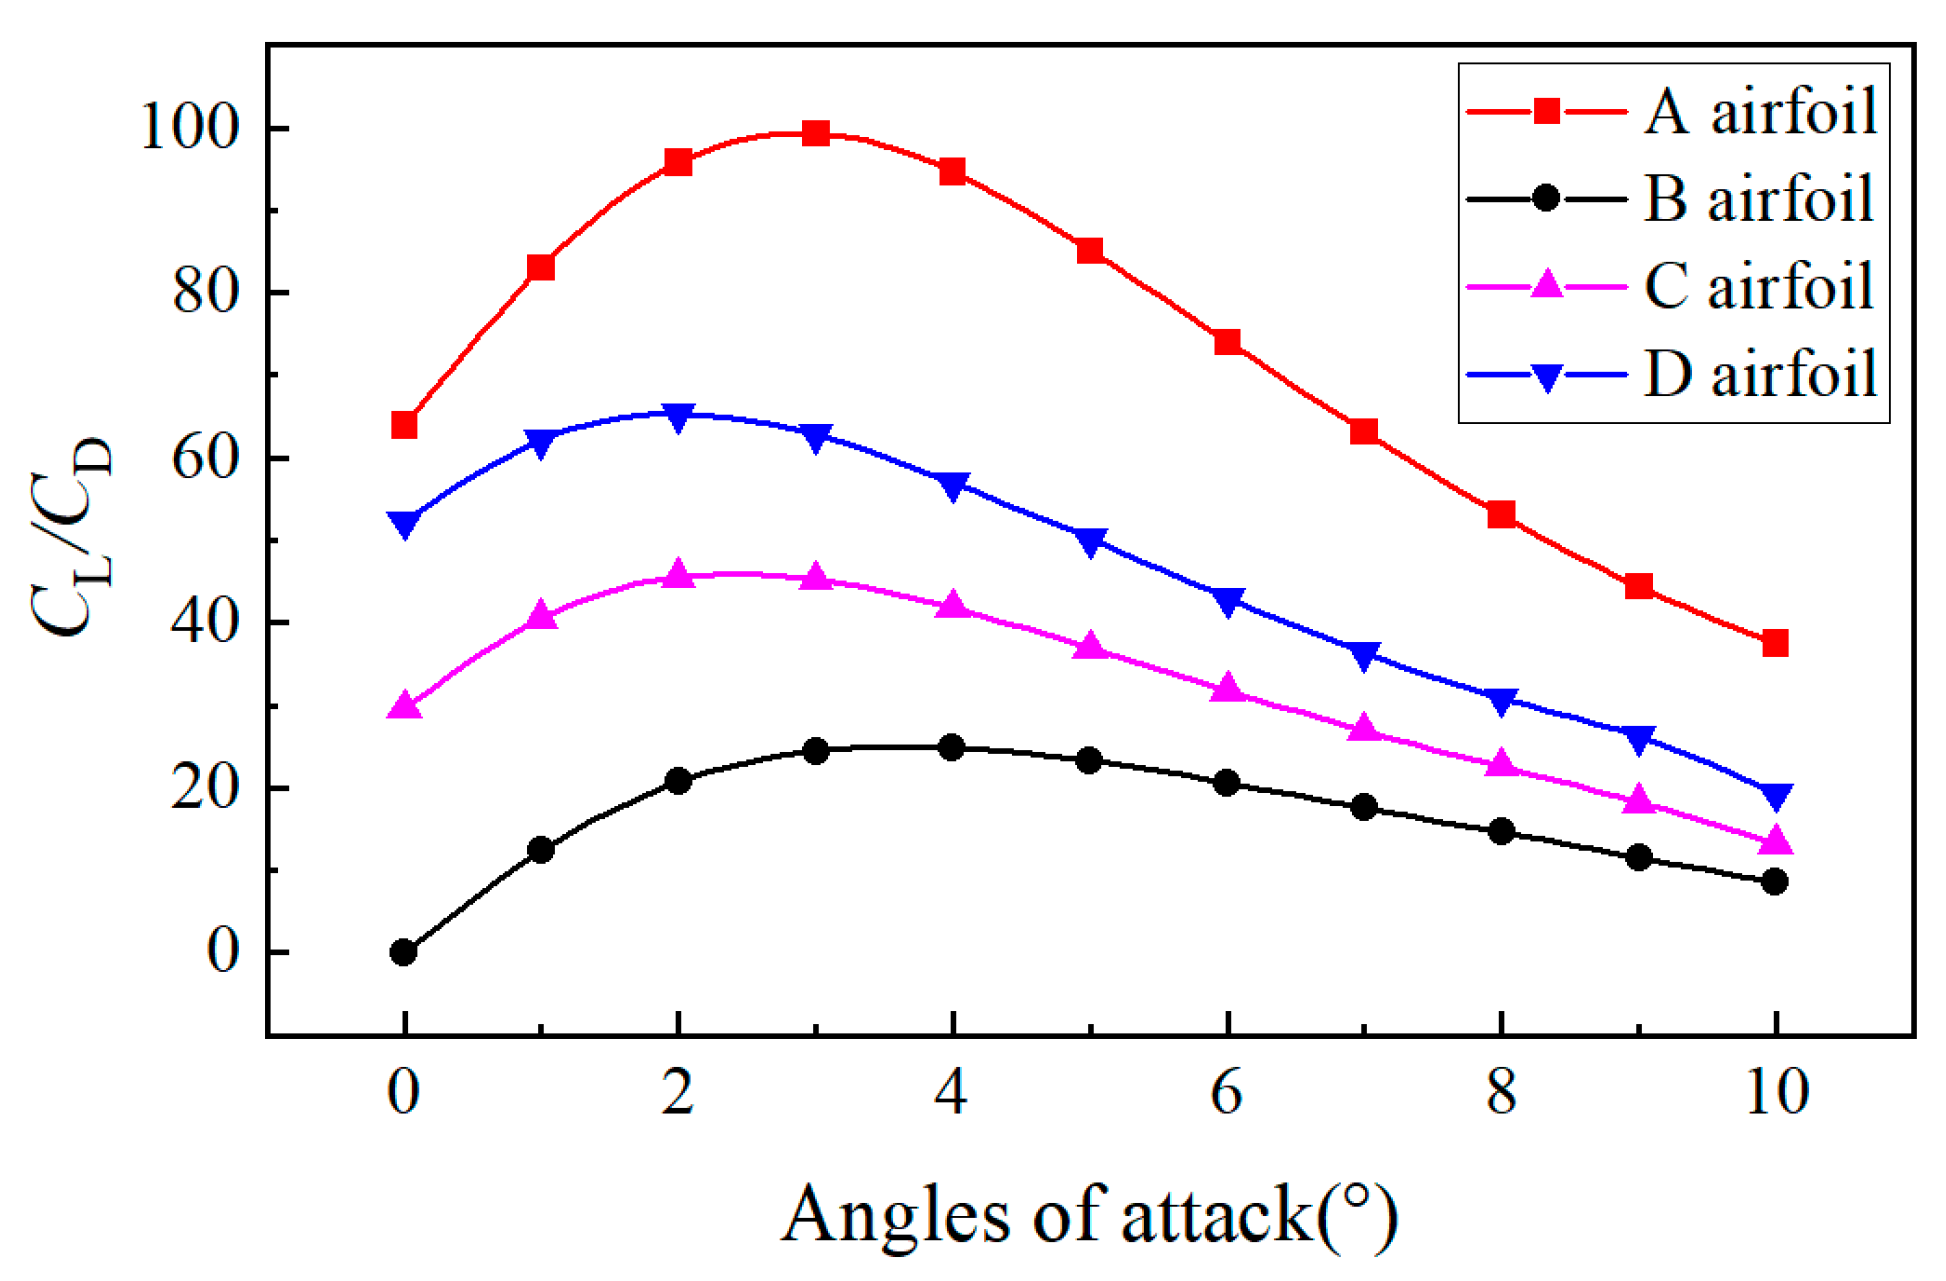
Four types of airfoils, A, B, C, and D, shown in Figure 9, are used in fans to study the effects of airfoils on fan performance by numerical simulation. The numerical calculation entails the lift-to-drag coefficients of the four airfoils under the attack angle of 0–10°. The calculated data of the lift-to-drag ratio coefficients of these four airfoils are shown in Figure 11. Within the range of angle of attack from 0° to 10°, the lift-to-drag ratio of the four types of airfoils first increased and then decreased. The A and D airfoils have a maximum lift-to-drag ratio of 3°, while B and C are at 2°. Overall, the four airfoils are sorted by a lift-to-drag ratio in descending order as follows: A, D, C, and B.
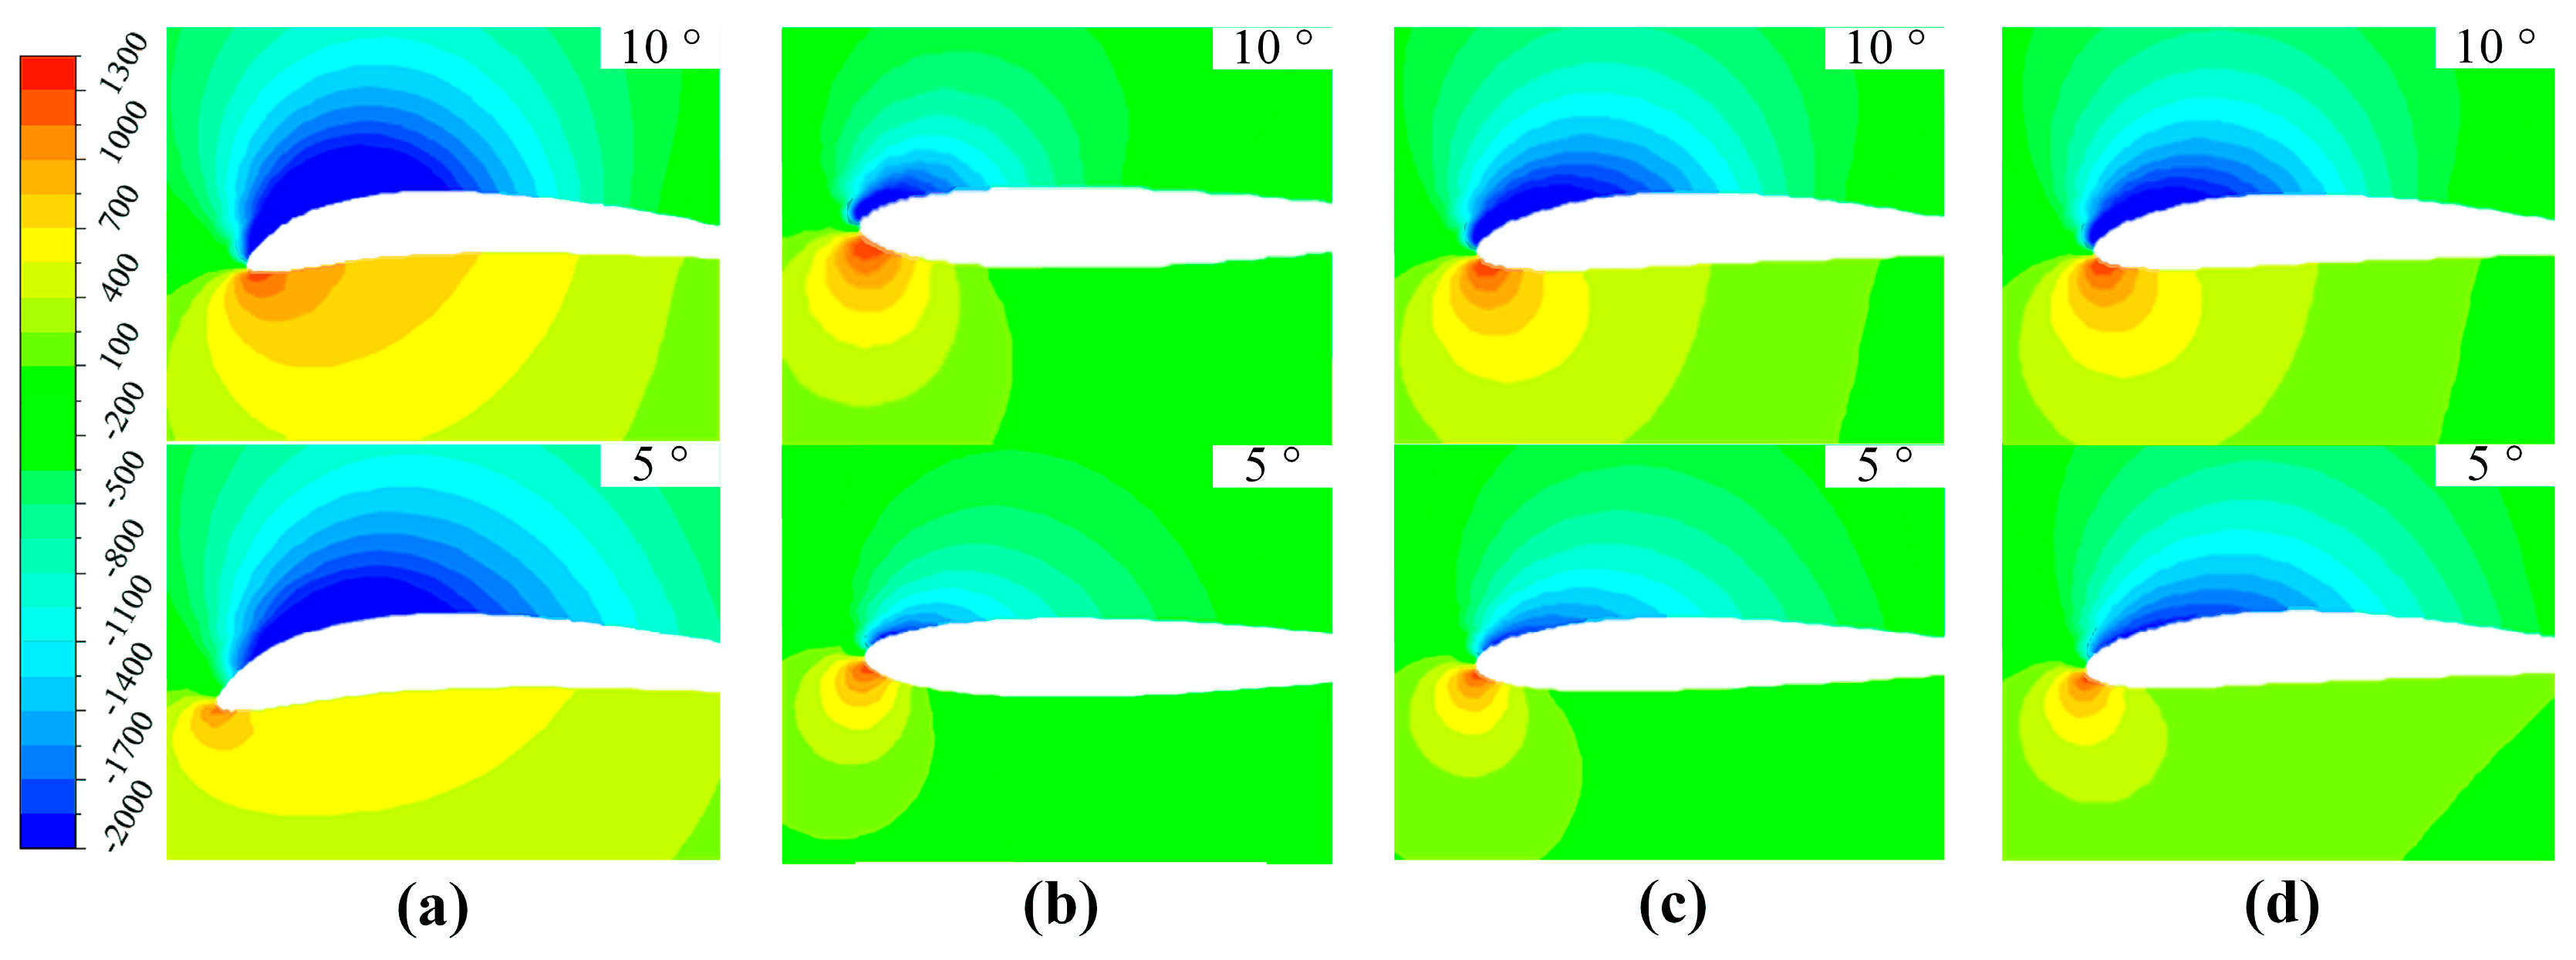
The static pressure diagrams of the four airfoils (as shown in Figure 12) indicate that the pressure gradients on the upper surfaces of the four airfoils change gently. The low-pressure area on the upper surface of the A airfoil is larger, followed by the D, C, and B airfoils. Therefore, the lift-to-drag ratio of the A airfoil is larger than that of the other airfoils, which is consistent with the trend in Figure 11. In addition, the B, C, and D airfoils all have a small range of high-pressure areas at the leading edge, and the pressure gradient is large.
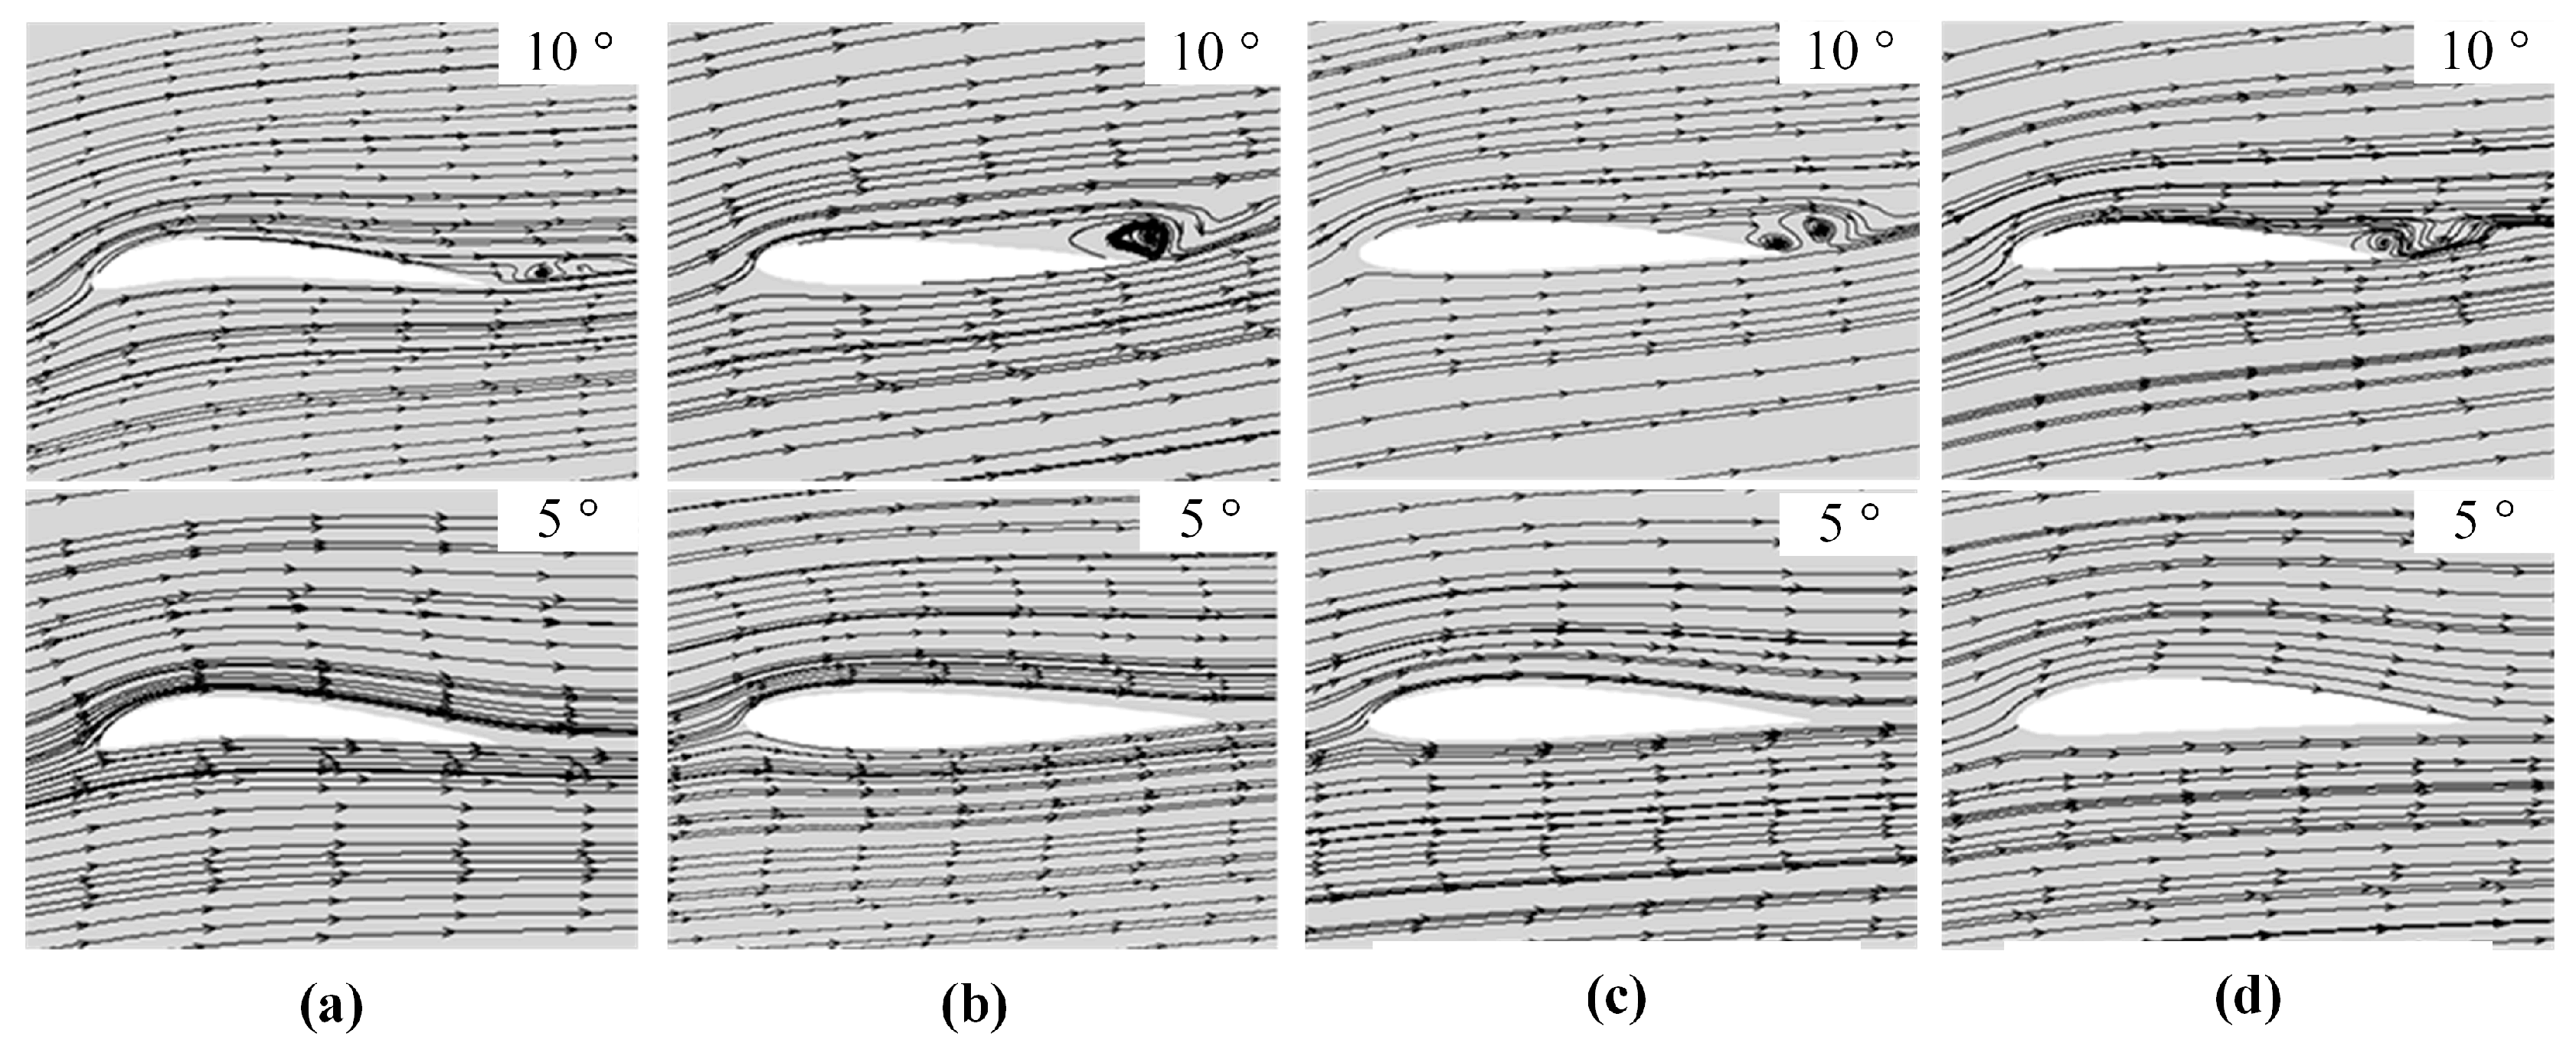
From the streamline diagram of the four airfoils shown in Figure 13, under the attack angle of 5°, there is no flow separation such as vortices for the four airfoils. When the angle of attack is 10°, the four airfoils have vortices at the trailing edge of the airfoil. The vortex area of the A airfoil is smaller than that of the other three airfoils. In addition, the tail vortex is far away from the tail of the airfoil, while the vortices of the other three airfoils are on the trailing edge of the upper surface of the airfoil. Therefore, the flow state of the A airfoil is better than the other three airfoils at an angle of attack of 10°. By comparing the states at different angles of attack, it can be clearly seen that the airfoil has flow separation at an angle of attack of 10°, indicating that the airfoil has begun to stall, so the flow condition of the airfoil at an angle of attack of 10° is an unsteady flow, especially in B, C, and D airfoils. The above analysis results show that the airfoil model A has excellent lift-to-drag ratio performance and aerodynamic performance.

3.1.2. Aerodynamic Performance of Different Airfoil Fans

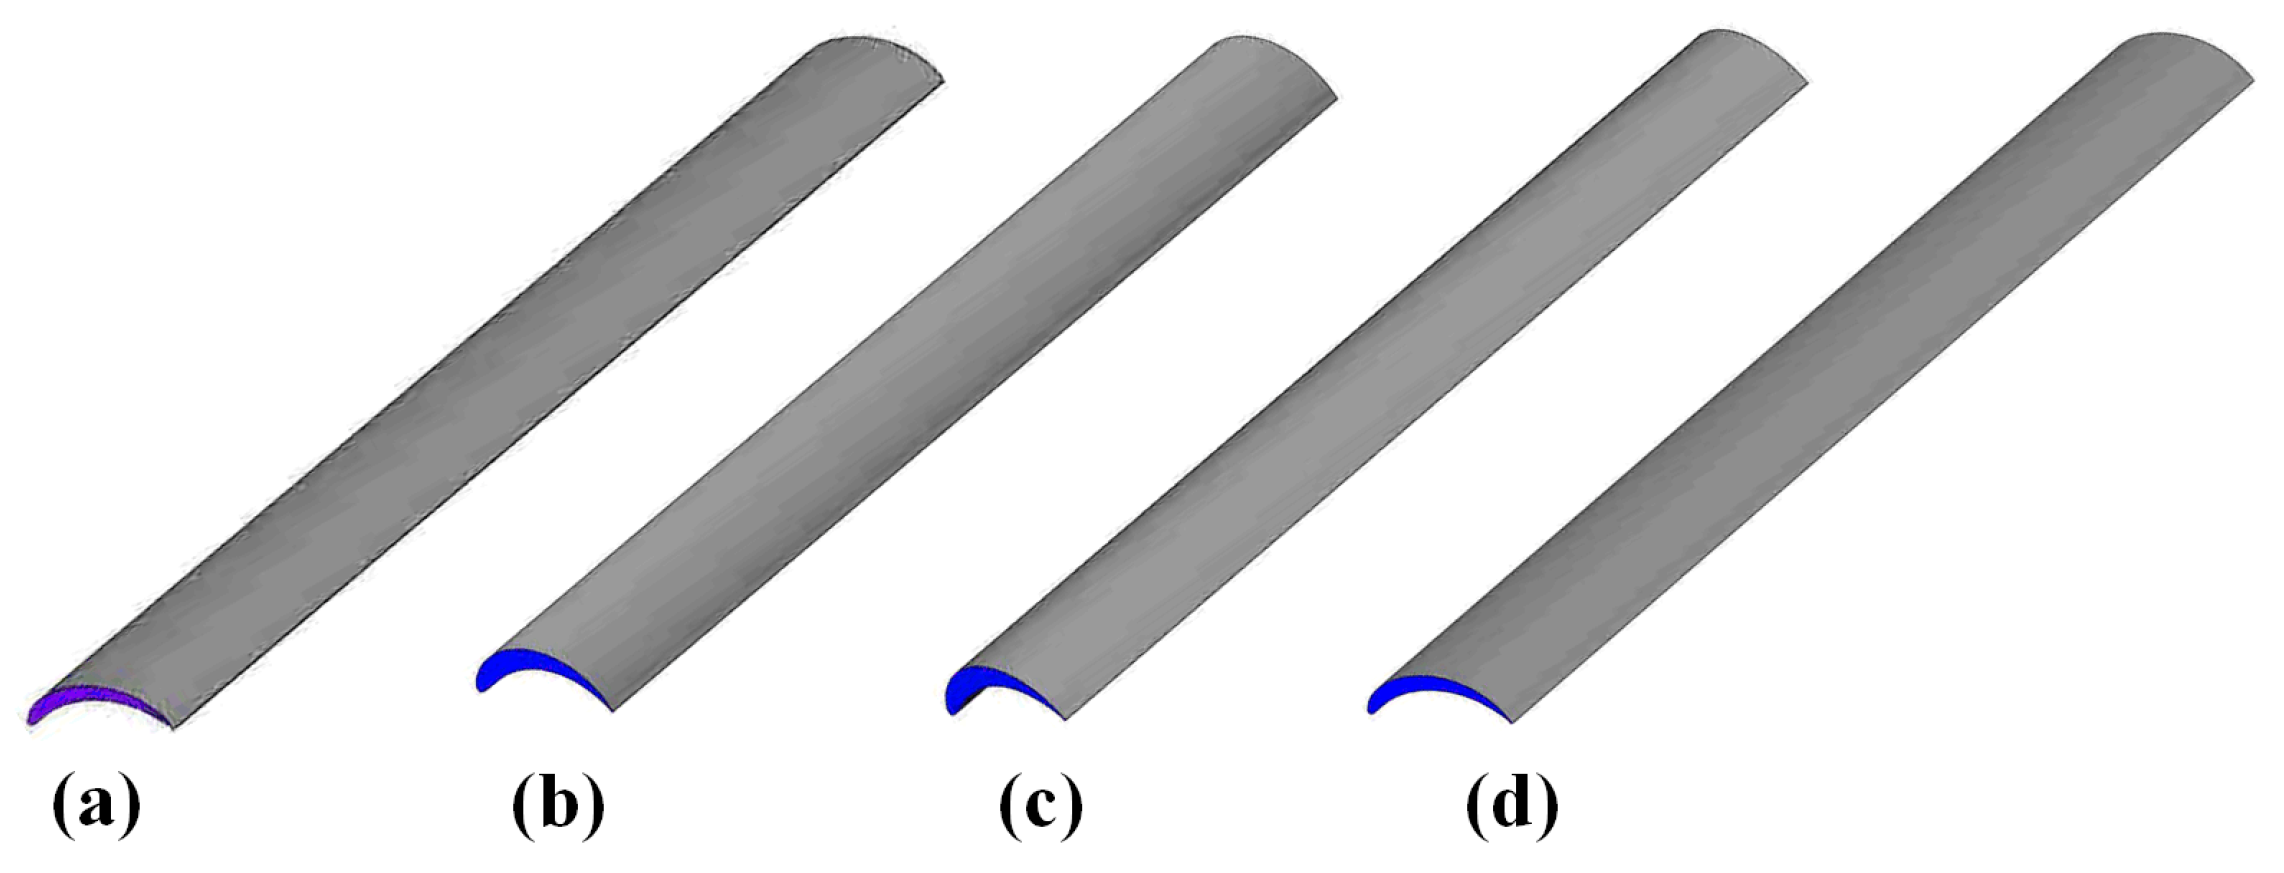
After comparing and analyzing the airfoil’s intrinsic performance, we designed three-dimensional blades and applied them to the fan model for simulation. The airfoil blade construction method involves bending the centerline of the airfoil according to the design method of the single-arc blade. Figure 14 shows the blades designed with four airfoils. A three-dimensional impeller model is established for the four airfoils, and meshing and numerical calculations are carried out following the numerical calculation method of the single-arc model. The values for the constants in the Realizable k-ε model are typically taken as follows: C 1 ε = 1.44 ; C 2 ε = 1.92 ; C u = 0.09 ; σ K = 1.0 ; and σ ε = 1.3 .
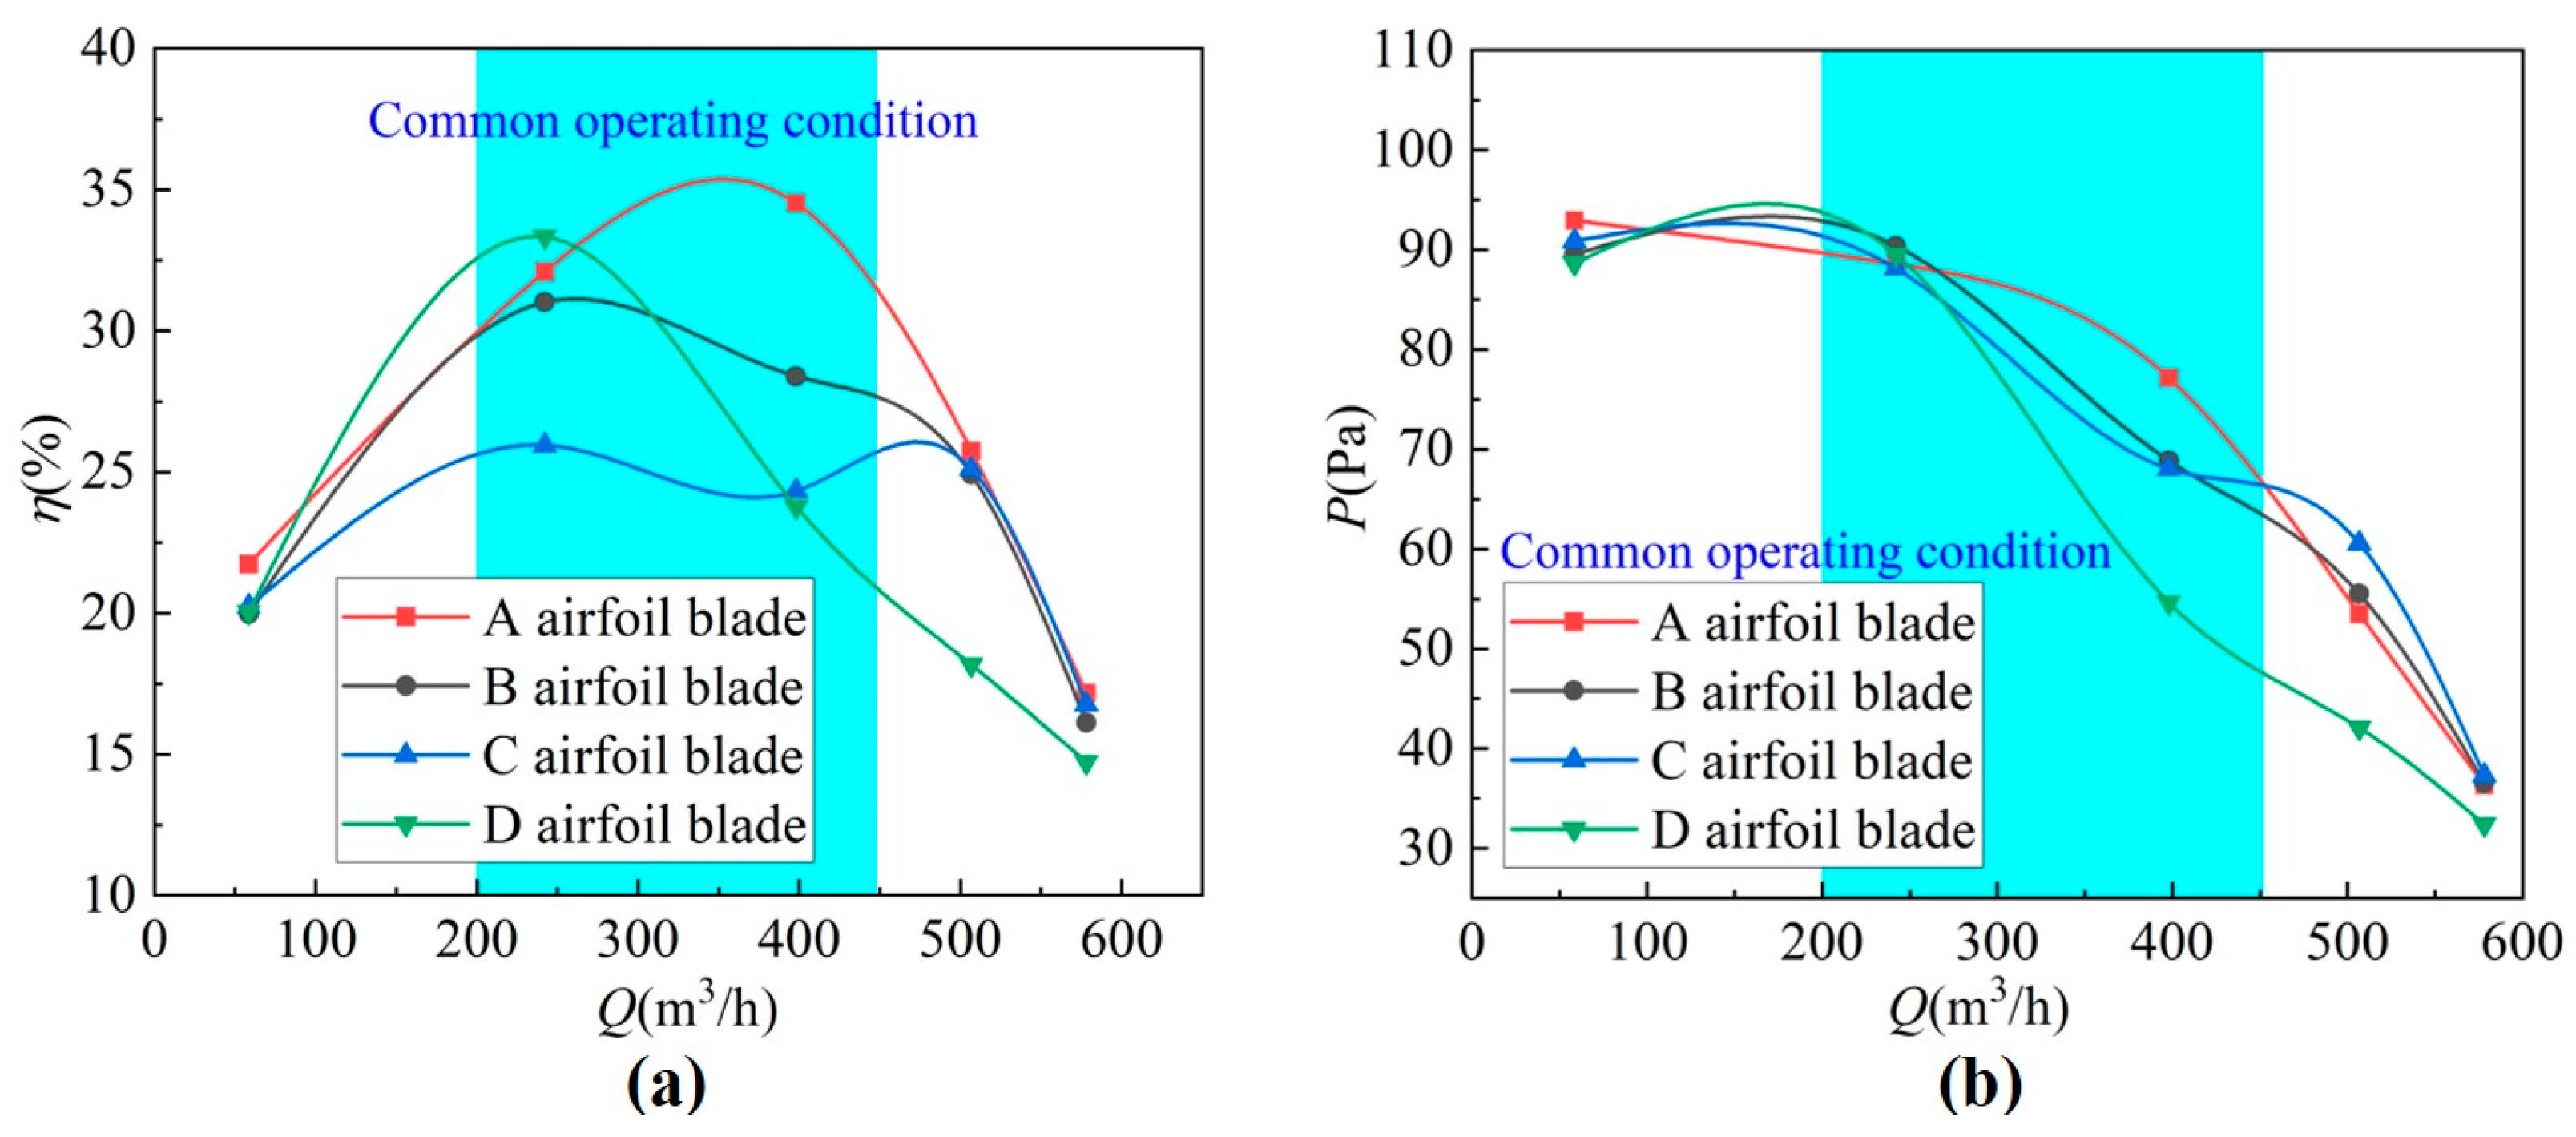
Five operating points are selected for numerical simulation as shown in Table 4. The flow rate range of 200 m3/h to 450 m3/h is the common operating condition. Therefore, the operating points Case 2, Case 3, and Case 4 within this range are selected as representatives to analyze and discuss the internal flow field of the fan.
The efficiency and total pressure curve of four airfoil fans as shown in Figure 15. The A airfoil blades have excellent fan efficiency under all operating conditions. Except for Case 2, which is lower than the B airfoil blade, the A airfoil blade is the most efficient at all other flow points. When comparing the A, C, and D airfoil blades, combined with the lift-to-drag ratio curve in Figure 9, the curve change rules of the A airfoil, C airfoil, and D airfoil are consistent with the trend of the efficiency curve. This result indicates that the lift-to-drag ratio of the airfoil has a great influence on the efficiency performance of the multi-blade centrifugal fan. However, from the efficiency curve of the B airfoil with the worst lift-to-drag ratio, it has the highest efficiency value in Case 2. Only in a specific working condition interval does the efficiency value of the fan have a positive relationship with the lift-to-drag ratio of the airfoil blade.
Except for the fact that the total pressure of the D airfoil is significantly lower than that of other airfoils in the large flow range, other airfoils show different total pressure performance under different working conditions. Although it is difficult to judge the influence of the lift-to-drag ratio of the four airfoils on the total pressure performance of the fan, the total pressure curve of the A airfoil has the highest stability, and there is no fluctuation in the other three airfoils.

3.2. Performance Comparison of Airfoil Fan and Single-Arc Fan

3.2.1. Velocity Flow Fields

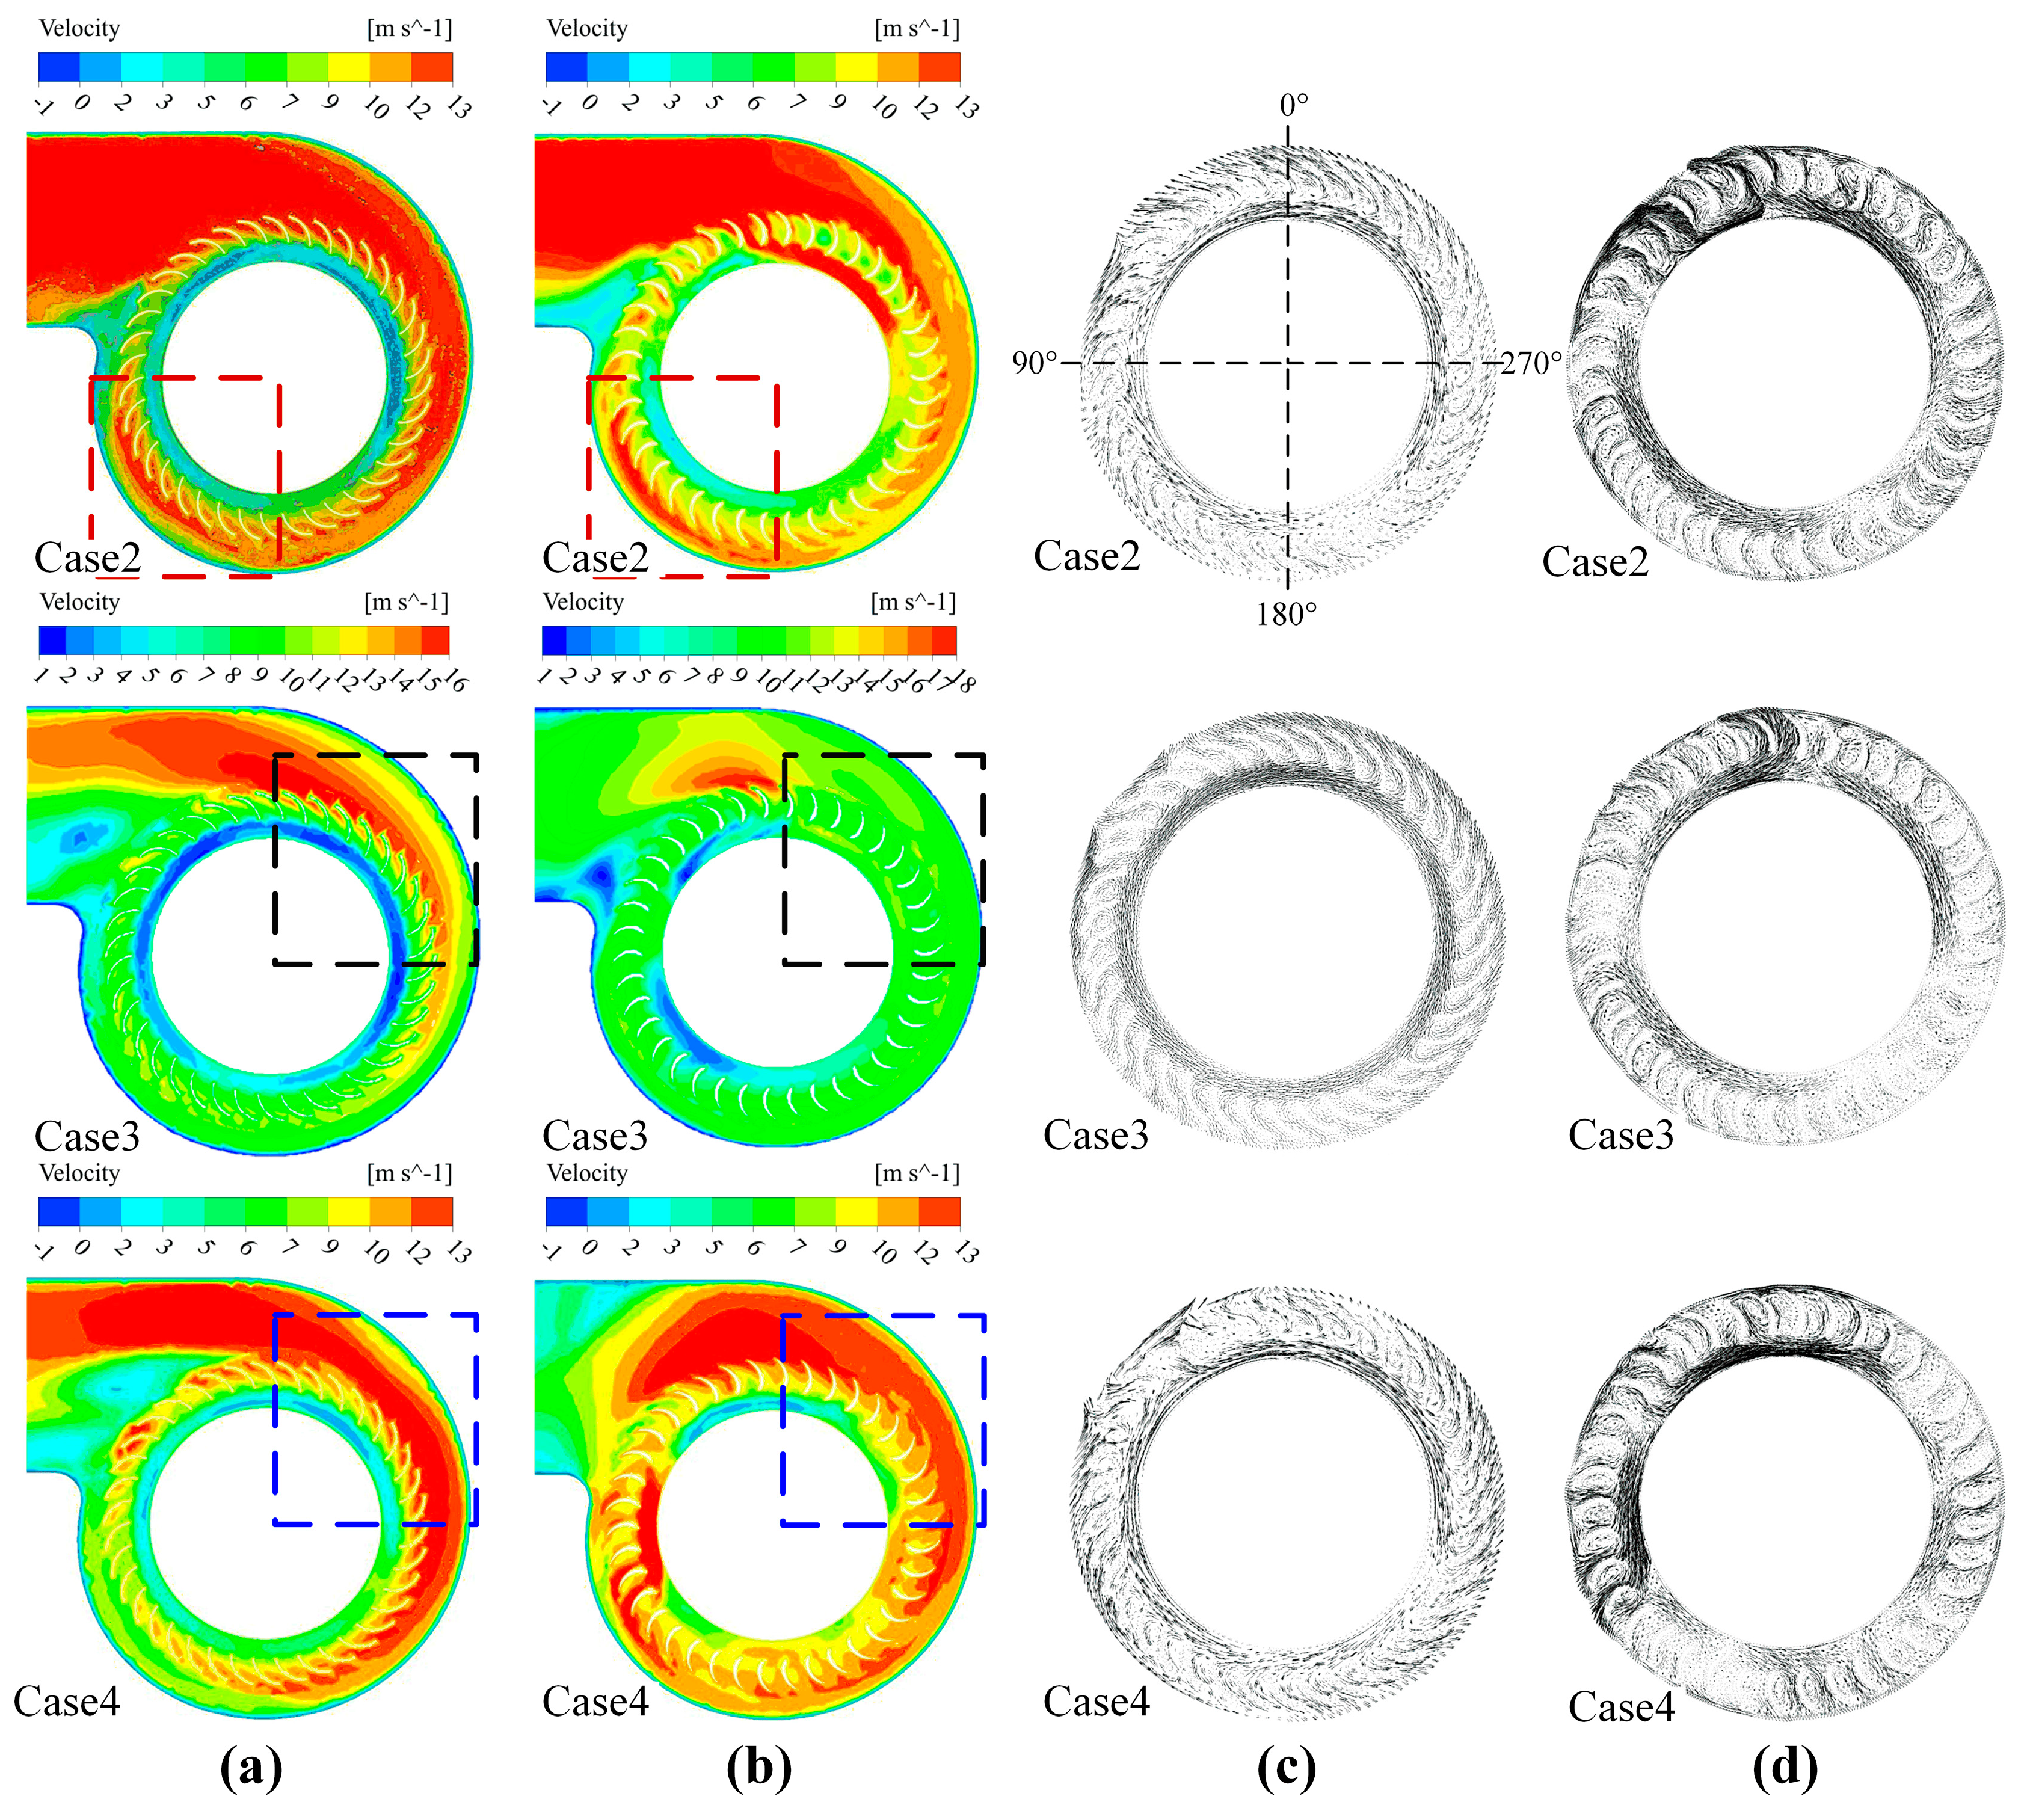
As mentioned above, the fan designed with A airfoil has excellent aerodynamic performance under common flow conditions. Therefore, the fan designed with A airfoil will be compared with the single-arc fan to analyze the internal flow field information of the fan. The velocity flow field and the velocity vector of the A airfoil fan and the single-arc fan under different working conditions (Cases 2–4) are presented in Figure 16.
As shown in Figure 16a,b, these are the velocity cloud diagrams of the fan section under different flow rates. In the case of a small flow rate (Case 2), the flow condition of the single-arc model is poor, and the velocity distribution in the impeller region is more uneven than that of the A airfoil model, which is more obvious in the red box area shown in Figure 16a,b. It should be noted that a severe blocking effect occurs in both models at the rotating surface, which is caused by the too-small gap between the motor and the impeller blades. However, at 90° < θ < 180°, the high-speed region of the A airfoil model in the impeller-volute gap is significantly higher than that of the single-arc model and the jet-wake is weaker in the tail region of the runner.
The wake structure of the A airfoil model is obviously weakened in Case 3, especially in the black box selection region of 270° < θ < 15° at the design flow point of velocity distribution nephogram, and the jet-wake structure is also suppressed compared to that of the single-arc model. With the increase in rotational speed, the jet-wake structure of the two models is suppressed, the vortex area is reduced, and the suppression degree of the A airfoil model is better. By comparing the velocity distribution of different sections, the velocity distribution of the A airfoil model in the impeller region is more uniform and the high-speed region is larger, indicating that the A airfoil model has a stronger working capability. Under the condition of a large flow (Case 4), the jet-wake structure of the single-arc model is obviously more serious than that of the A airfoil model, and the velocity distribution is more uneven. This was particularly evident in the blue boxed area in Figure 16. Under large flow, the flow state of the two models is improved due to the increase in flow, but the velocity distribution in the impeller is uneven due to the structural problem of the single-arc model, and the vortex is obvious.
As shown in Figure 16c,d, under the low flow rate condition of Case 2, the two calculated models have different degrees of vortices. Especially in the region of 0° < θ < 180°, the pressure distribution in this region is uneven due to the existence of the volute tongue. In addition, the surface is also the most serious of all surfaces. This is because the gap between the motor and the impeller in this section is too narrow, resulting in the fluid’s attack angle here being close to 90°, which thickens the boundary layer of the suction surface. Due to the rotation, a large number of vortices appear. The difference between the two models is obvious, which is manifested in the 180° < θ < 0° region of the A airfoil model. There is almost no vortex and boundary layer separation on the surfaces, and the clogging effect in the flow channel is not obvious.
Under the design flow condition of Case 3, it can be observed that the single-arc model still has an obvious reflux phenomenon in each blade channel. As the pressure on the suction surface decreases, most of the fluid on the pressure surface flows to the suction surface to form a vortex, resulting in a large energy loss. However, the vortex in the 180° < θ < 270° region of the A airfoil model has been gradually improved, and there is only a small amount of vortex in the fluid outlet region. In addition, under the Case 3 operating condition, combined with the velocity distribution diagram, it is obvious that the average speed of the A airfoil model is greater than that of the single-arc model, which indicates that the secondary flow effect of the A airfoil model is weaker and has better performance.
Under the large flow condition of Case 4, the vortex generated in the flow channel of the single-arc model is larger at the rotating surfaces. Then, the blocking effect formed by it will strengthen the wake area of the impeller channel. The velocity distribution of the A airfoil model in the impeller flow channel is relatively uniform, the flow is more stable, and the number of vortices in the flow channel is less. This shows that the secondary flow inside the impeller vane of the A airfoil model is suppressed, and the flow condition inside the runner is improved.

3.2.2. Aerodynamic Performance

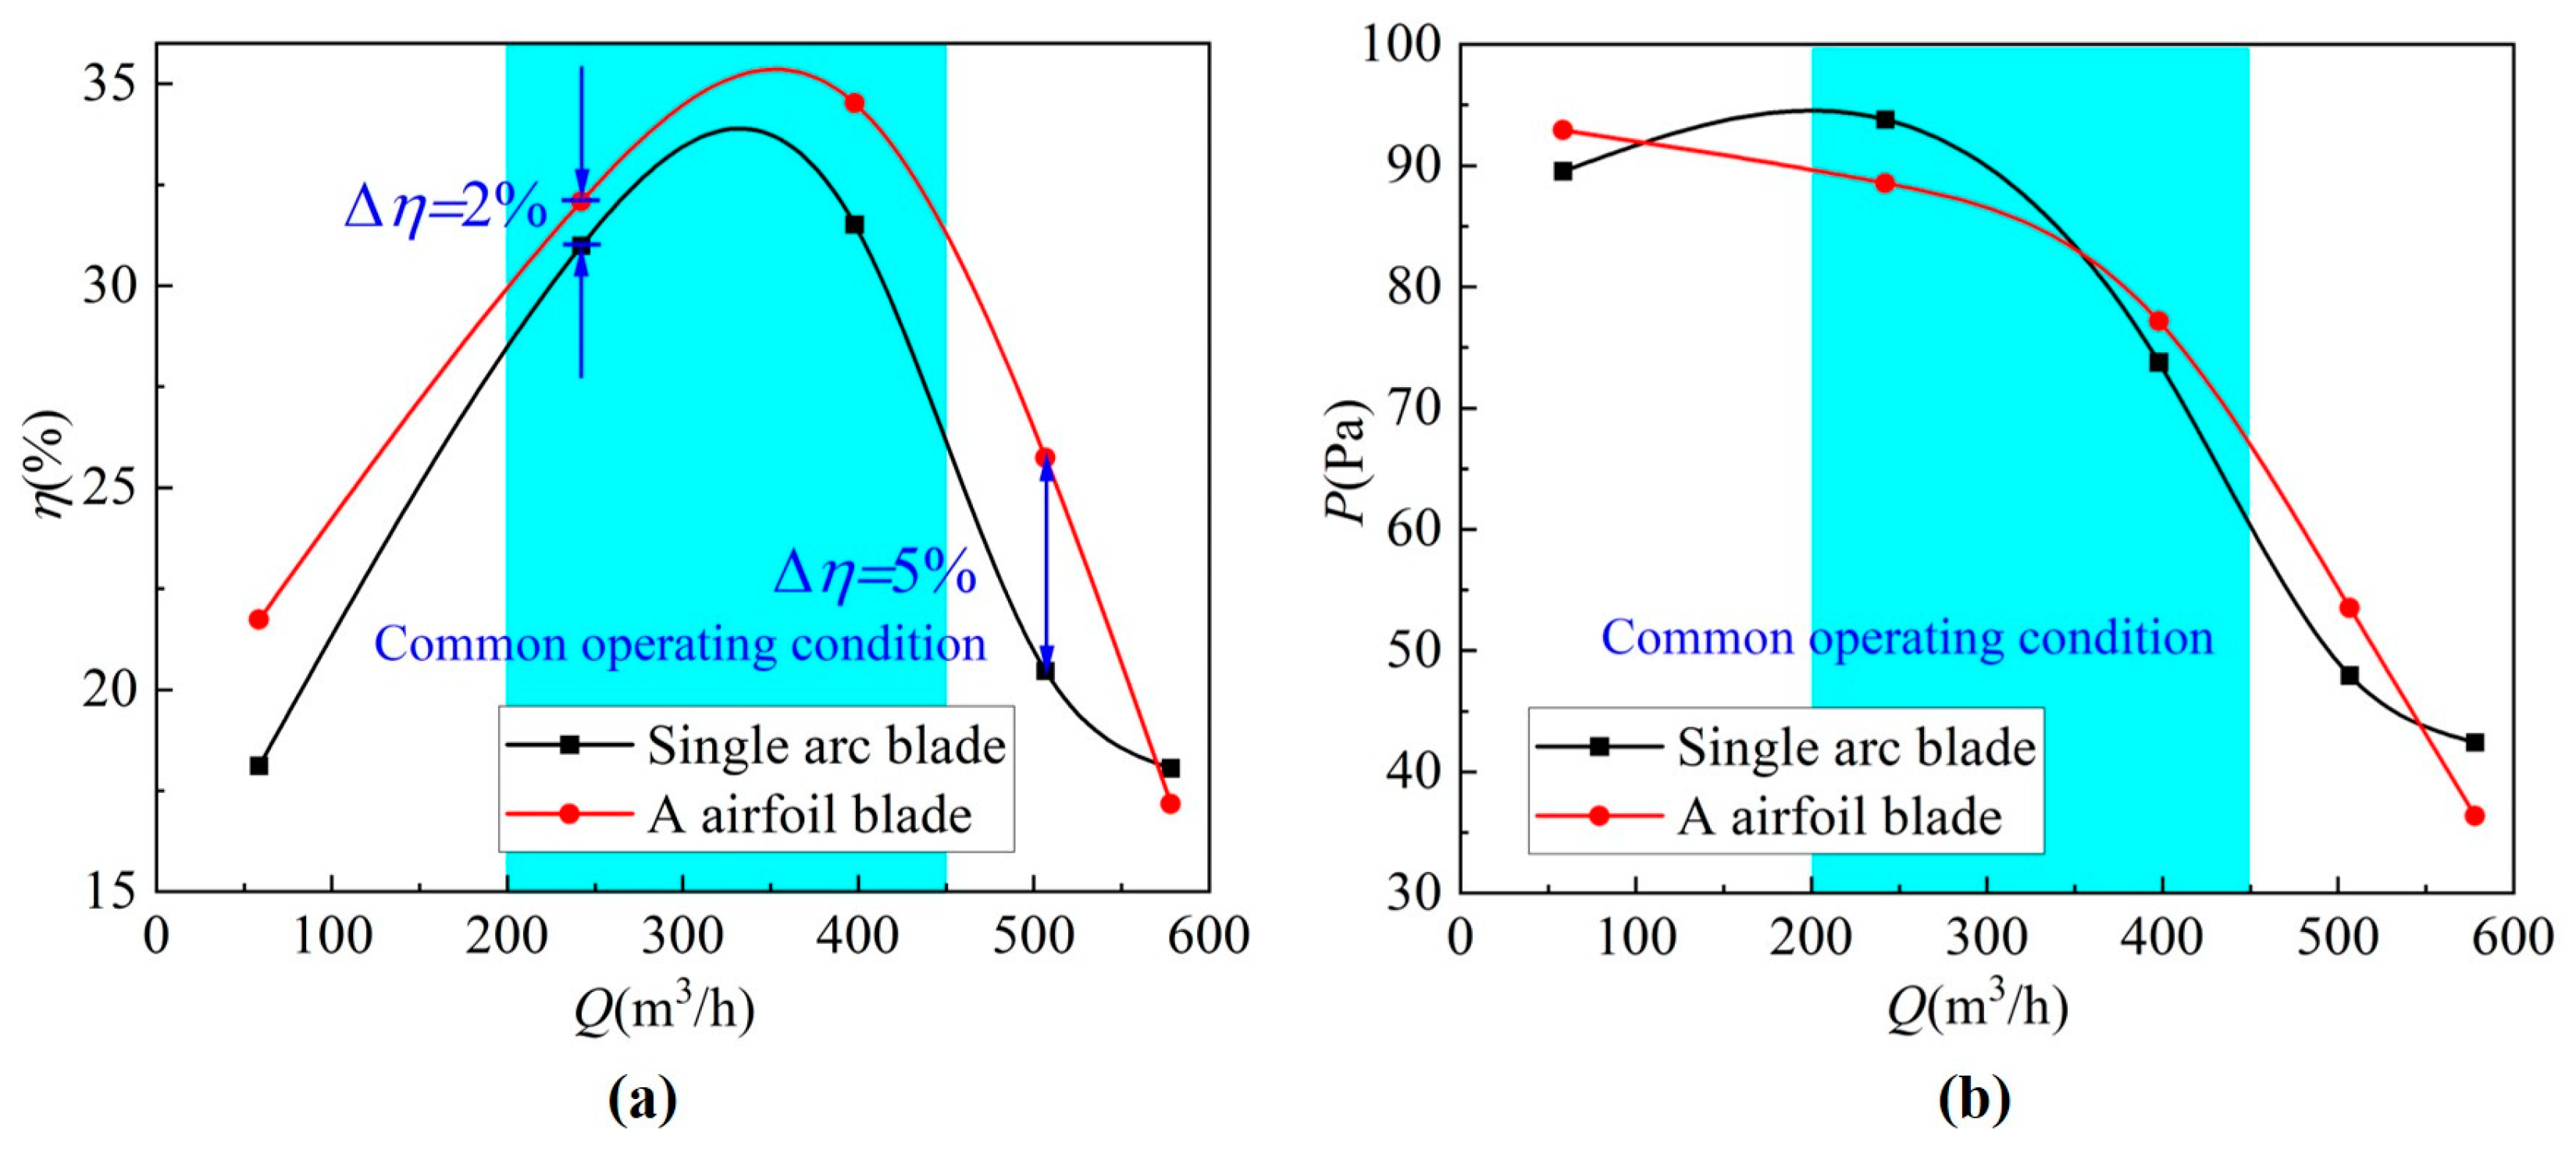
The efficiency curve of the A airfoil blade model and the single-arc blade model is shown in Figure 17. In general, the efficiency of the A airfoil blade model is generally higher than that of the single-arc blade model. The most obvious efficiency improvement was in Case 4, which increased by 5%, and the least was in Case 2, which also increased by 2%. The performance results of the total pressure performance curves are different at each operating point. The total pressure of the A airfoil model is roughly the same as that of the single-arc model, and there is no obvious difference. Combined with the results of the velocity nephograms and streamline analysis, preliminary conclusions can be drawn: the A airfoil blade of the multi-blade centrifugal fan studied in this paper can greatly improve the efficiency performance of the research object, but it is not obvious in improving the total pressure performance.

3.3. Experimental Verification of the Effects of Airfoil on Fan Performance

Figure 18 shows the original A airfoil fan model. To confirm the validity of the simulation outcomes, a multi-blade fan model incorporating the A airfoil design was constructed and subjected to separate tests for the airfoil and single-arc fan options. After designing the A airfoil fan model, a result test was conducted under the same experimental conditions as the prototype. Upon comparison, the maximum absolute error between the simulation value and the experimental value was 4.28 Pa, which is within the acceptable error range. Therefore, it can be considered that the CFD calculation is reliable and the verified experiment is feasible.
Table 5 summarizes the design parameters of the multi-blade centrifugal fan employed in the verified experiments, which were specifically optimized to satisfy the operational demands of a high-performance household range hood’s internal fan.
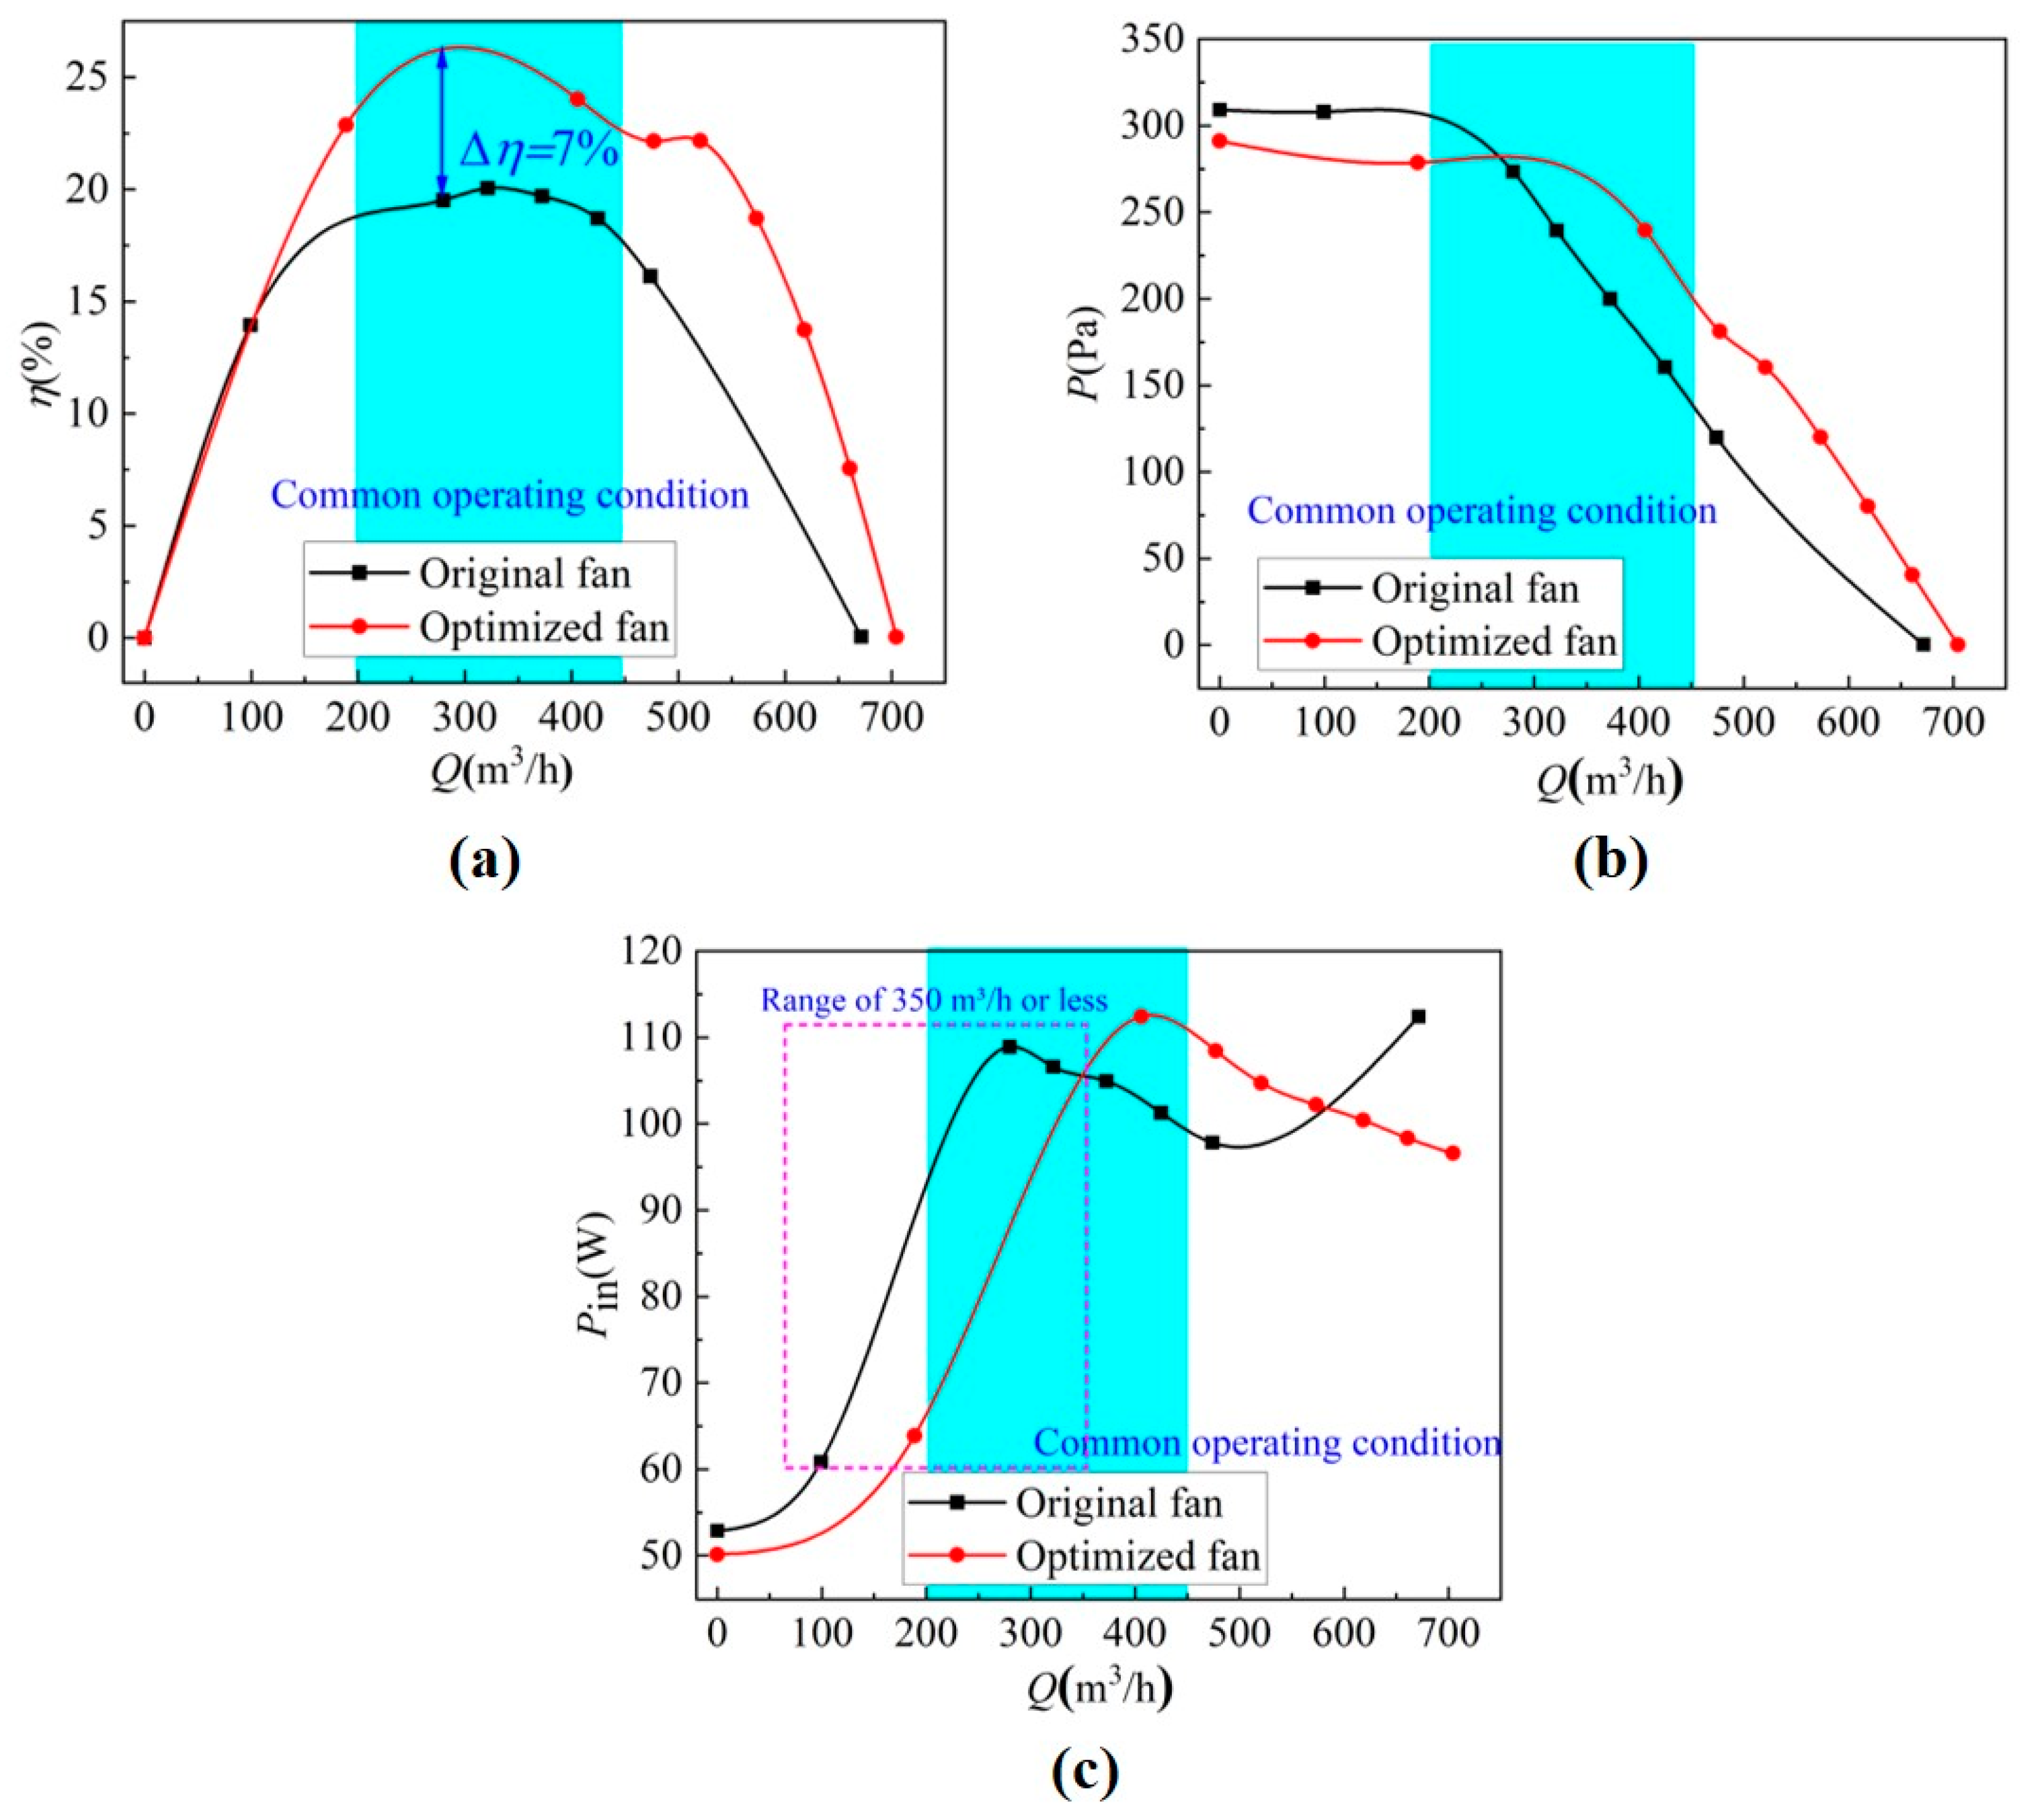
Figure 19 shows a performance comparison between the A airfoil fan and the single-arc fan. The performance efficiency of the A airfoil fan is generally higher than that of the single-arc fan when the flow starts from 100 m3/h (see Figure 19a). This indicates that the airfoil design scheme of the multi-blade centrifugal fan presented in this study can significantly improve the fan efficiency, and the maximum increase in efficiency is approximately 7%. The efficiency in the common working conditions range has also increased by 3% to 7%, and the high-efficiency flow range has been increased from 450 m3//h to 650 m³/h. In addition, the results show that the fan with the A airfoil designed as a blade improves the angle of attack of the fluid entering the impeller and reduces the sensitivity of the angle of attack.
It can be seen from Figure 19b that the total pressure of the A airfoil fan is higher than that of the single-arc fan when the flow rate exceeds 300 m3/h. In general, the average value is 50 Pa higher, and the improvement ratio reaches more than 20%. Especially in the high flow area, the pressure characteristics of the A airfoil fan are greatly improved. Figure 19c shows that the power of the A airfoil fan is lower than the single-arc fan when the flow rate is below 350 m3//h, with a maximum reduction of 25 W. The above results indicate that the airfoil design can greatly reduce the power consumption of the fan and achieve the purpose of energy conservation.

4. Conclusions

The suboptimal performance of centrifugal fans can lead to additional energy waste. In this study, the blades of the fan were optimally designed to improve ventilation efficiency and reduce energy consumption. A feasible and practical structure optimization scheme of the fan was proposed. The internal flow characteristics and flow field distribution of a multi-blade centrifugal fan were analyzed using CFD numerical calculations and verified through experiments.
Through the analysis of velocity flow fields and velocity vectors under different working conditions, it was found that the A airfoil fan exhibited more uniform velocity distribution and fewer vortex phenomena under both low and high flow conditions. Particularly under high flow conditions, the A airfoil fan had a more uniform velocity distribution, more stable flow, and fewer vortices, indicating that the A airfoil fan performed excellently in suppressing secondary flows within the impeller blades. Further analysis showed that the A airfoil fan also had a relatively uniform pressure distribution under different working conditions, especially under high flow conditions, with a smaller pressure gradient, reducing pressure fluctuations on the blade surface. This uniform pressure distribution helped to reduce noise and vibration during fan operation, improving the operational stability and lifespan of the fan. In summary, the multi-blade centrifugal fan with A airfoil blades significantly improved efficiency performance in the study object but did not show a noticeable effect in improving total pressure performance. By optimizing blade design and improving flow field distribution, the A airfoil fan demonstrated higher efficiency and better stability in practical applications.
Flow field analysis was conducted on four airfoils (A, B, C, and D) using the lift-to-drag ratio theory. The results indicated that the A airfoil exhibited the most superior flow characteristics. The numerical simulations of the fan model with airfoil blades revealed a positive correlation between the lift-to-drag ratio and efficiency under specific working conditions, while the effect of total pressure is not significant. The performance of the A airfoil centrifugal fan was compared with that of the single-arc centrifugal fan. The results demonstrated that energy consumption was significantly reduced and efficiency improved by 2–3% in the centrifugal fan with the A airfoil. This improvement is attributed to the design of the A airfoil, which reduces flow separation and inhibits secondary flow.
The efficiency, total pressure, and input power of the A airfoil blade fan were compared with that of the single-arc blade fan through verified experiments. The trial-optimized fan exhibited a 3–7% improvement in efficiency and a higher efficiency flow range compared to the prototype fan. The total pressure data showed a 20% increase in the optimized differential pressure value and the test power data demonstrated significant energy consumption reduction. Overall, the experimental results validate the reliability of the numerical simulations. However, further studies are needed to identify other factors that may affect the internal flow of the fan, and exploring even better airfoil designs is necessary.
In the course of this study, the blade profile design was carried out using airfoils, with a focus on investigating the impact of the lift-to-drag ratio on multi-blade centrifugal fans. However, the influence of structural parameters of the airfoil, such as airfoil thickness and camber, on multi-blade centrifugal fans has not been thoroughly studied. Future research needs to investigate the performance of multi-blade centrifugal fan blades under different airfoil parameter conditions. In addition to improving fan efficiency, it is also necessary to suppress noise in multi-blade centrifugal fans. Therefore, future research should focus on optimizing fan noise, which is of greater value and significance for designing high-efficiency and low-noise multi-blade centrifugal fans.

Author Contributions

Conceptualization, H.Y. and H.Z.; Methodology, Y.L.; Formal analysis, H.Z.; Investigation, Y.L.; Data curation, H.Y.; Writing—original draft, H.Y. and H.Z.; Writing—review and editing, H.Z., Y.L. and J.Z.; Visualization, H.Y.; Supervision, J.Z. and K.Z.; Funding acquisition, Y.L. All authors have read and agreed to the published version of the manuscript.

Funding

This research was funded by the National Natural Science Foundation of China (Grant number 11472260).

Institutional Review Board Statement

Not applicable.

Informed Consent Statement

Not applicable.

Data Availability Statement

The original contributions presented in the study are included in the article, further inquiries can be directed to the corresponding authors.

Acknowledgments

We would like to express our heartfelt gratitude to all the participants and students who took part in our survey experiments as your input has been instrumental in shaping our research. We also wish to thank the anonymous reviewers for their constructive feedback and valuable insights, which have significantly improved the overall quality of this work. Your contributions are deeply appreciated.

Conflicts of Interest

The authors declare no conflicts of interest.

Abbreviations

ε Turbulent dissipation rate, representing the rate at which turbulent energy is dissipated.
σ K Turbulent viscosity, calculated by the turbulence model.
k Turbulent kinetic energy, representing the energy caused by turbulent fluctuations.
C u Empirical constant.
C 1 ε , C 2 ε Empirical constants that control the relative strength of turbulent kinetic energy generation and dissipation.
σ ε Prandtl number for turbulent dissipation rate.
Re Reynolds number.
I Relaxation factor.
C L Lift coefficient.
C D Drag coefficient.
F L Lift force.
F D Drag force.
Q Flow rate.
η Efficiency.
β * Turbulent production rate factor.
β Attenuation factor in the dissipation equation.
σ k Turbulent prandtl number for k equation.
σ ω Turbulent prandtl number for ω equation.
α 1 Limiting factor for shear stress transport term.
σ k 1 Turbulent prandtl number for k in wall region.
σ k 2 Turbulent prandtl number for k in free-stream region.
σ w 1 Turbulent prandtl number for ω in wall region.
σ w 2 Turbulent prandtl number for ω in the free-stream region.

References

  1. Mansy, R.E.; Bergadà, J.M.; Sarwar, W.; Mellibovsky, F. Aerodynamic performances and wake topology past a square cylinder in the interface of two different-velocity streams. Phys. Fluids 2022, 34, 064106. [Google Scholar] [CrossRef]
  2. He, Y.; Li, R.; Fan, Y.; Zheng, Y.; Chen, G. Study on the performance of a solid-state thermoelectric refrigeration system equipped with ionic wind fans for ultra-quiet operation. Int. J. Refrig. 2021, 130, 441–451. [Google Scholar] [CrossRef]
  3. Ye, X.; Zhang, J.; Li, C. Effect of blade tip pattern on performance of a twin-stage variable-pitch axial fan. Energy 2017, 126, 535–563. [Google Scholar] [CrossRef]
  4. Amirat, Y.; Benbouzid, M.E.H.; Al-Ahmar, E.; Bensaker, B.; Turri, S. A brief status on condition monitoring and fault diagnosis in wind energy conversion systems. Renew. Sustain. Energy Rev. 2009, 13, 2629–2636. [Google Scholar] [CrossRef]
  5. Xiao, M.; Xiao, Q.; Dou, H.S.; Ma, X.; Chen, Y.; He, H.; Ye, X. Study of flow instability in a centrifugal fan based on energy gradient theory. J. Mech. Sci. Technol. 2016, 30, 507–517. [Google Scholar] [CrossRef]
  6. Horcas, S.G.; Sørensen, N.N.; Zahle, F.; Pirrung, G.R.; Barlas, T. Vibrations of wind turbine blades in standstill: Mapping the influence of the inflow angles. Phys. Fluids 2022, 34, 054105. [Google Scholar] [CrossRef]
  7. Corsini, A.; Delibra, G.; Rispoli, F.; Sheard, A.G.; Venturini, P. Aerodynamic Simulation of a High-Pressure Centrifugal Fan for Process Industries. In Proceedings of the ASME Turbo Expo 2013: Turbine Technical Conference and Exposition, San Antonio, TX, USA, 3–7 June 2013. [Google Scholar] [CrossRef]
  8. Wang, K.; Ju, Y.; Zhang, C. Experimental and numerical investigations on effect of blade trimming on aerodynamic performance of squirrel cage fan. Int. J. Mech. Sci. 2020, 177, 105579. [Google Scholar] [CrossRef]
  9. Son, P.; Kim, J.; Ahn, E. Effects of bell mouth geometries on the flow rate of centrifugal blowers. J. Mech. Sci. Technol. 2011, 25, 2267–2276. [Google Scholar] [CrossRef]
  10. Huang, Q.; Qin, D.; Pan, G. Numerical simulation of the wake dynamics of the pumpjet propulsor in oblique inflow. Phys. Fluids 2022, 34, 065103. [Google Scholar] [CrossRef]
  11. Ottersten, M.; Yao, H.-D.; Davidson, L. Tonal noise of voluteless centrifugal fan generated by turbulence stemming from upstream inlet gap. Phys. Fluids 2021, 33, 075110. [Google Scholar] [CrossRef]
  12. Hofer, D.; Krieger, M.; Kirchhofer, M. Particle image velocimetry and constant temperature anemometer measurements of the jet produced by a centrifugal fan. Phys. Fluids 2021, 33, 065126. [Google Scholar] [CrossRef]
  13. Li, D.Y.; Gong, R.Z.; Wang, H.J.; Zhang, J.; Wei, X.Z.; Shu, L.F. Numerical Investigation in the Vaned Distributor under Different Guide Vanes Openings of a Pump Turbine in Pump Mode. J. Appl. Fluid Mech. 2016, 9, 253–266. [Google Scholar] [CrossRef]
  14. Song, H.; Zhang, J.; Huang, P.; Cai, H.; Cao, P.; Hu, B. Analysis of Rotor-Stator Interaction of a Pump-Turbine with Splitter Blades in a Pump Mode. Mathematics 2020, 8, 1465. [Google Scholar] [CrossRef]
  15. Li, K.; Chen, X.; Dou, H.S.; Zhu, Z.; Zheng, L.; Luo, X. Study of Flow Instability in a Miniature Centrifugal Pump Based on Energy Gradient Method. J. Appl. Fluid Mech. 2019, 12, 701–713. [Google Scholar] [CrossRef]
  16. Yang, H.; Yu, P.; Xu, J.; Ying, C.; Cao, W.; Wang, Y.; Zhu, Z.; Wei, Y. Experimental investigations on the performance and noise characteristics of a forward-curved fan with the stepped tongue. Meas. Control. 2019, 52, 002029401987748. [Google Scholar] [CrossRef]
  17. Tantakitti, P.; Pattana, S.; Wiratkasem, K. The performance of backward curved centrifugal fan with various impeller inlet and outlet angles. In Proceedings of the International Conference on Engineering Science and Innovative Technology, North Bangkok, Thailand, 19–22 April 2018; IEEE: Piscataway, NJ, USA, 2018; pp. 1–3. [Google Scholar] [CrossRef]
  18. Xue, Y.-J.; Cai, X.-F.; Liu, H. Effects of wing–body interaction on hawk moth aerodynamics and energetics at various flight velocities. Phys. Fluids 2022, 34, 051915. [Google Scholar] [CrossRef]
  19. Yu, H.; Sheng, K.; Lan, B.; Hsu, K.L.; Yang, J.T. Optimal thrust efficiency for a tandem wing in forward flight using varied hindwing kinematics of a damselfly. Phys. Fluids 2022, 34, 061909. [Google Scholar] [CrossRef]
  20. Abreu, L.I.; Tanarro, A.; Cavalieri, A.V.; Schlatter, P.; Vinuesa, R.; Hanifi, A.; Henningson, D.S. Spanwise-coherent hydrodynamic waves around flat plates and airfoils. J. Fluid Mech. 2021, 927, A1. [Google Scholar] [CrossRef]
  21. Liu, T.; Zhang, Y.; Li, K.; Wang, Y.; Li, J. Aerodynamic Optimization of a Centrifugal Fan Using Response Surface Methodology. Open J. Fluid Dyn. 2019, 9, 92. [Google Scholar] [CrossRef]
  22. Clemen, C. Aero-mechanical optimisation of a structural fan outlet guide vane. Struct. Multidiscip. Optim. 2011, 44, 125–136. [Google Scholar] [CrossRef]
  23. Huang, C.-H.; Hung, M.-H. An optimal design algorithm for centrifugal fans: Theoretical and experimental studies. J. Mech. Sci. Technol. 2013, 27, 761–773. [Google Scholar] [CrossRef]
  24. Zhou, S.; Zhou, H.; Yang, K.; Dong, H.; Gao, Z. Research on blade design method of multi-blade centrifugal fan for building efficient ventilation based on Hicks-Henne function. Sustain. Energy Technol. Assess. 2021, 43, 100971. [Google Scholar] [CrossRef]
  25. Zuo, K.-C.; Wang, Y.; Zheng, X. Simulation study on the time-invariant air-flow characterization of centrifugal fan. In Proceedings of the INTER-NOISE and NOISE-CON Congress and Conference Proceedings, Seoul, Republic of Korea, 23 August 2020. [Google Scholar]
  26. Shen, Y.; Li, Y.; Wang, H.; Shen, W.; Chen, Y.; Si, H. Numerical simulation and performance optimization of the centrifugal fan in a vacuum cleaner. Mod. Phys. Lett. B 2019, 33, 1950440. [Google Scholar] [CrossRef]
  27. Park, K.; Chang, H. Application of Airfoil Impeller for Enhancement of Aerodynamic Performance of High Speed Centrifugal Fan. Trans. Korean Soc. Mech. Eng. B 2016, 40, 321–327. [Google Scholar] [CrossRef]
  28. Suresh, M.; Sitaram, N. Effect of Gurney Flap Configuration on the Performance of a Centrifugal Fan. J. Appl. Fluid Mech. 2019, 12, 565–571. [Google Scholar] [CrossRef]
  29. Lin, S.-C.; Huang, C.-L. An integrated experimental and numerical study of forward–curved centrifugal fan. Exp. Therm. Fluid Sci. 2002, 26, 421–434. [Google Scholar] [CrossRef]
  30. Zhuang, M. The effects of curvature on wake-dominated incompressible free shear layers. Phys. Fluids 1999, 11, 3106–3115. [Google Scholar] [CrossRef]
  31. Prabu, T.; Viswanathan, P.; Gokul Kannan, N.; Rudramoorthy, R.; Firthouse, A. Optimization of Wrap Angle in the Mixed Flow Impeller for Reducing Flow Losses. J. Appl. Fluid Mech. 2020, 13, 1949–1957. [Google Scholar] [CrossRef]
  32. Acarer, S. Peak lift-to-drag ratio enhancement of the DU12W262 airfoil by passive flow control and its impact on horizontal and vertical axis wind turbines. Energy 2020, 201, 117659. [Google Scholar] [CrossRef]
  33. Jeong, J.-H.; Kim, S.-H. Optimization of thick wind turbine airfoils using a genetic algorithm. J. Mech. Sci. Technol. 2018, 32, 3191–3199. [Google Scholar] [CrossRef]
  34. Oukassou, K.; El Mouhsine, S.; El Hajjaji, A.; Kharbouch, B. Comparison of the power, lift and drag coefficients of wind turbine blade from aerodynamics characteristics of Naca0012 and Naca2412. Procedia Manuf. 2019, 32, 983–990. [Google Scholar] [CrossRef]
  35. 210-16/ASHRAE; Ansi/Amca. Laboratory Methods of Testing Fans for Certified Aerodynamic Performance Rating. Air Movement and Control Association International Inc.: Arlington Heights, IL, USA, 2016.
  36. ANSYS, Inc. ANSYS Fluent 2021R2 [Computer Software]. 2021. Available online: https://www.ansys.com/products/fluids/ansys-fluent (accessed on 7 August 2022).
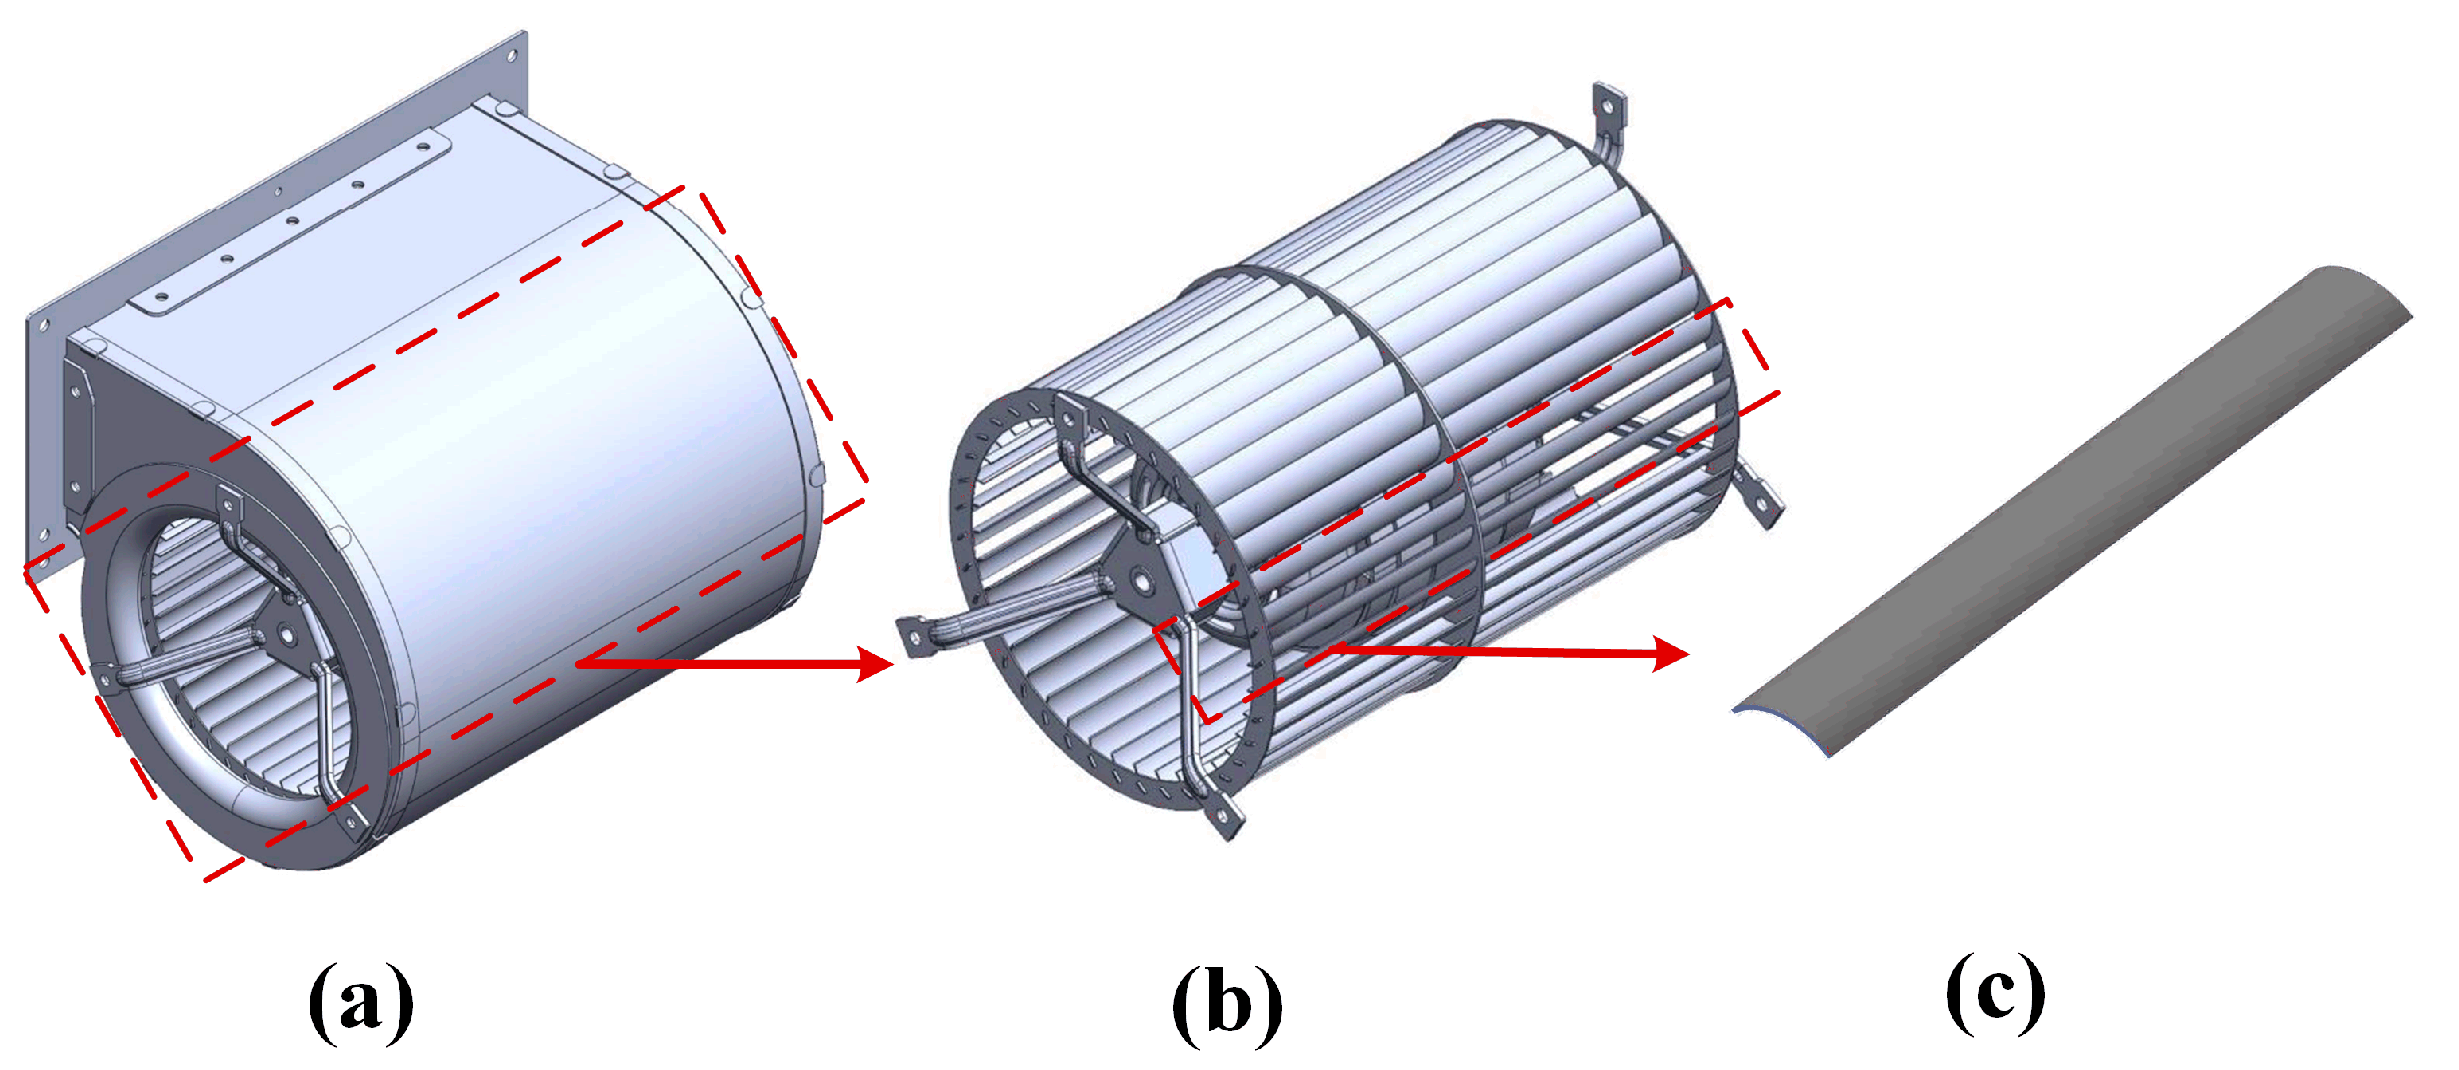
Figure 1. Schematic diagram of fan structure: (a) fan, (b) impeller, and (c) single-arc blade.
Applsci 14 11229 g001
Figure 2. Schematic diagram of airfoil and its related parameters.
Applsci 14 11229 g002
Figure 3. Schematic diagram of partial flow effect in impeller channel.
Applsci 14 11229 g003
Figure 4. (a) Calculation domain and boundary conditions, (b) rid of volute and impeller, and (c) grid of impeller cross-section.
Applsci 14 11229 g004
Figure 5. The y+ values of each part of the wind turbine under different grid numbers.
Applsci 14 11229 g005
Figure 6. The photo of the experimental setup.
Applsci 14 11229 g006
Figure 7. Comparison of experimental and simulation results.
Applsci 14 11229 g007
Figure 8. Technical route of this study.
Applsci 14 11229 g008
Figure 9. Four airfoil shapes: (a) BE10307B (A airfoil), (b) NACA0012 (B airfoil), (c) NACA2412 (C airfoil), and (d) NACA4412 (D airfoil).
Applsci 14 11229 g009
Figure 10. Meshing of A airfoils.
Applsci 14 11229 g010
Figure 11. Lift-to-drag ratio of four different airfoils at the attack angle of 0–10°.
Applsci 14 11229 g011
Figure 12. Static pressure distribution of 5° and 10° attack angles for four airfoils: (a) A airfoil, (b) B airfoil, (c) C airfoil, and (d) D airfoil.
Applsci 14 11229 g012
Figure 13. Streamline distribution of 5°and 10° attack angles for four airfoils: (a) A airfoil, (b) B airfoil, (c) C airfoil, and (d) D airfoil.
Applsci 14 11229 g013
Figure 14. Four airfoil blades: (a) A airfoil blade, (b) B airfoil blade, (c) C airfoil blade, and (d) D airfoil blade.
Applsci 14 11229 g014
Figure 15. Aerodynamic performance of four airfoil blades: (a) efficiency and (b) total pressure.
Applsci 14 11229 g015
Figure 16. The velocity flow field and the velocity vector of the models: (a) the velocity flow field of the single-arc model, (b) the velocity flow field of the A airfoil model, (c) the velocity vector of the single-arc model, and (d) the velocity vector of the A airfoil model.
Applsci 14 11229 g016
Figure 17. Comparison results of (a) efficiency and (b) total pressure.
Applsci 14 11229 g017
Figure 18. The experimental fan of the A airfoil.
Applsci 14 11229 g018
Figure 19. Performance comparison of the A airfoil fan and the single-arc fan: (a) efficiency, (b) total pressure, and (c) input power.
Applsci 14 11229 g019
Table 1. Structural parameters of the multi-blade centrifugal fan.
ParameterValue
Inner diameter of impeller D1 (mm)108
Outer diameter of impeller D2 (mm)133
Installation angle of blade inlet β1 (°)81
Installation angle of blade outlet β2 (°)173
Number of blades Z38
Volute width B (mm)215
Table 2. The number of grids and the y+ values.
Number of GridsImpeller RegionVolute RegionOutlet Region
Grid 14.2 × 10620.5241.5182.47
Grid 27.7 × 10614.735.475.5
Grid 39.8 × 10613.533.573.2
Table 3. Comparison of lift-to-drag coefficients at a 5° angle of attack.
Total ElementsCLCD
Grid 12.9 × 1067.51 × 10−13.23 × 10⁻²
Grid 24.7 × 1067.52 × 10−13.25 × 10⁻²
Grid 36.8 × 1067.50 × 10−13.23 × 10⁻²
Table 4. Parameter conditions under various working conditions.
Flow (m3/h)Rotating Speed (rpm)Inlet Speed (m/s)
Case 158.6014660.29
Case 2242.1014491.19
Case 3398.0014291.95
Case 4506.7014102.49
Case 5578.1013892.84
Table 5. Design parameters of the multi-blade centrifugal fan.
Fan ParameterSingle-Arc FanA Airfoil Fan
Volume flow (m3/h)0–7000–701
Total pressure (Pa)0–3100–310
Rotating speed (r/min)1500–27001500–2700
Axle power (W)50–11050–111
Temperature (°C)2525
Disclaimer/Publisher’s Note: The statements, opinions and data contained in all publications are solely those of the individual author(s) and contributor(s) and not of MDPI and/or the editor(s). MDPI and/or the editor(s) disclaim responsibility for any injury to people or property resulting from any ideas, methods, instructions or products referred to in the content.