Article

Response Characteristics of Anchored Surrounding Rock in Roadways Under the Influence of Vibrational Waves

1
School of Energy Engineering, Xi’an University of Science and Technology, Xi’an 710054, China
2
Institute of Rock Burst Prevention and Control, Xi’an University of Science and Technology, Xi’an 710054, China
*
Author to whom correspondence should be addressed.
Appl. Sci. 2024, 14(23), 11266; https://doi.org/10.3390/app142311266
Submission received: 11 November 2024 / Revised: 26 November 2024 / Accepted: 29 November 2024 / Published: 3 December 2024
(This article belongs to the Special Issue Novel Technologies in Intelligent Coal Mining)

Abstract

:
The vibration waves generated by pressure fluctuations can substantially impair and jeopardize the structural integrity of roadway anchorage within adjacent rock formations, thereby presenting a significant risk to the safety and operational efficiency of mining activities. In order to address this issue and elucidate the response characteristics of roadway-anchored surrounding rock subjected to P-wave and S-wave influences, this study employs a roadway that is experiencing actual impact instability within a mine situated in Xinjiang as the engineering context. The synchrosqueezing wavelet transform, enhanced by a Butterworth filter, is utilized to isolate and filter seismic wave data, thereby facilitating the extraction of time-frequency signals corresponding to both P-waves and S-waves. Subsequently, a dynamic numerical model is developed to simulate the propagation of these vibration waves. An analysis of the dynamic behavior and response characteristics of P-waves and S-waves is performed, focusing on their interaction with roadway anchoring within the surrounding rock at various stages of propagation. The results indicate that weak rock and plastic zones can absorb vibrational waves, with S-waves exhibiting a stronger absorption effect than P-waves. S-waves contribute to increased stress and displacement in the surrounding rock, leading to the accumulation of elastic energy and an expansion of the plastic zone. The rapid fluctuations in the axial force of bolts along the roadway, caused by S-waves, can result in instability within the roadway. The research findings possess considerable reference value and practical applicability for the design of anti-scour support systems in roadways.

1. Introduction

With the increasing depth and intensity of mining operations, pressure bumping disasters are occurring more frequently. During the excavation and mining processes, the impact of vibration waves generated makes the surrounding rock of the roadway more susceptible to instability, leading to pressure bumping disasters [1,2,3,4]. With the extensive use of monitoring systems, such as microseismic and ground sound technologies, researchers have increasingly recognized that impact vibration waves are one of the primary contributors to pressure bumping incidents in roadways [5,6]. However, not all vibration waves lead to impact accidents. Some vibration waves, due to their insufficient frequency or energy, may only result in significant vibrations of the roadway without causing any damage [7]. It is crucial to analyze the response characteristics of the surrounding rock in roadway anchoring by utilizing field-measured vibration waves. This analysis holds significant importance for the support design of roadways affected by pressure bumping.
A considerable number of researchers have investigated the response characteristics of the surrounding rock in relation to roadway anchorage. Wang Zhengyi et al. [8,9] simplified the impact of vibration waves as a plane P-wave and established an interaction model with a circular anchoring roadway. Their findings indicated that the impact of vibration waves on the wave-facing side of the roadway was particularly significant. Through similar simulation experiments and theoretical modeling analyses, the near-field mechanical response and failure mechanisms of anchored surrounding rock were examined. The results indicate that as the energy of the vibration wave increases, the mechanical response of the surrounding rock occurs more rapidly; however, the attenuation rate also increases correspondingly. Jing Hongwen et al. [10] simulated the bearing characteristics and fracture processes of the anchorage structure in surrounding rock within deep roadways under various support conditions. They concluded that increasing support strength enhances the stability of the anchorage structure and reduces the fracture range in areas with high confining pressure. Liu Yubin et al. [11] investigated the failure mechanism of bottom coal pressure relief induced by strong vibrations at the heading face of thick coal seams using numerical simulations and other methodologies. The study concluded that shear failure results in significant vibrations of the coal body, with the energy of the vibration waves primarily absorbed by the loose coal, ultimately leading to impact. Chang Jucai et al. [12] systematically analyzed the propagation of stress waves and the failure characteristics of the anchorage body under varying impact pressures using the Hopkinson bar test system. The study found that the spall strength of the anchorage body increased with rising pressure. Additionally, the strain and failure induced by the stress wave in different regions occurred sequentially and inconsistently. It was observed that higher impact pressures led to more severe deterioration of the anchorage body. Wu Yongzheng et al. [13,14] investigated the dynamic load response characteristics of anchored surrounding rock under impact loading using a plane strain model. They found that impact loads can easily induce repeated tension and compression in the roadway anchorage system, leading to system failure and a reduction in the strength of the surrounding rock. By analyzing the deformation and failure characteristics of the surrounding rock and supporting structures of roadways under strong impact loads, they concluded that the surface of the roadway on the front wave side is most affected by the impact, followed by the side, while the back wave side experiences the least impact. The superposition of dynamic and static loads results in a larger damage range for the roadway. Jiao Jiankang et al. [15] analyzed the dynamic load response characteristics and impact failure processes of roadway anchorage-bearing structures under the combined effects of dynamic and static loads using the FLAC3D dynamic module. Their findings indicated that the failure of roadway anchorage-bearing structures during pressure bumping was primarily influenced by the mechanisms of energy accumulation, overload, and release. Furthermore, the stability of the anchorage structure was closely linked to dynamic load energy, bearing capacity, and deformation characteristics. Gao Mingshi et al. [16] applied cosine waves with varying impact energies to study the propagation process of vibration waves and the response characteristics of the roadway surrounding the rock support system. They found that the attenuation of vibration wave energy and propagation distance follows a power relationship. The vibration waves employed in the aforementioned studies predominantly utilize synthetic waves or simplify the actual vibration waves in order to analyze the dynamic response characteristics of roadway-anchored surrounding rock. However, these approaches do not adequately account for the complexity of real vibration waves and their effects on the surrounding rock in roadway anchoring contexts.
Durrheim et al. [17] noted that the field-measured vibration wave can more accurately reflect the failure characteristics of the roadway. The vibrational waves generated by rock bursts primarily consist of longitudinal waves (P-waves) and transverse waves (S-waves). These two types of waves exhibit significant differences in their effects and the mechanisms of instability they induce in the mechanical response of the surrounding anchored rock. To accurately represent the response behavior of P-waves and S-waves to the anchored surrounding rock within the context of FLAC3D numerical simulations, it is essential to isolate and calibrate the recorded vibration waves. This process ensures that the signals corresponding to P-waves and S-waves can be precisely extracted and subsequently integrated into the numerical model in accordance with their distinct propagation characteristics. This study investigates the roadway impact accident that occurred at the (4-5) 06w working face of a mine in Xinjiang, providing the engineering context for the analysis. This study utilizes the synchronous compression transformation method of the Barworth filter to improve the separation of vibration waves. A comprehensive analysis of the dynamic response characteristics of P-waves and S-waves in relation to the surrounding rock of roadway anchorage in the near field is conducted. This provides a scientific foundation for the design of roadway anti-scour supports.

2. Engineering Background

2.1. Engineering Geology

A mining operation situated in Xinjiang, specifically at the 4-5 working face, is involved in the extraction of coal from the 4-5 coal seam. This coal seam has an average thickness of 6.15 m, is located at a depth of 550 m, and exhibits a dip angle ranging from 24° to 26°. Upon identification, the coal seam demonstrates a moderate tendency for impact. The research is concentrated on the head-on region of the (4-5) 06w belt roadway, which is situated approximately 3000 m from the concentrated return air uphill extension blasting site. According to the geological drilling conducted at site 32-3 within the study area, the direct roof above the 4-5 working face consists of 12.48 m of coarse sandstone. The basic roof is composed of 5.12 m of fine sandstone, while the direct bottom of the coal seam is characterized by 4.38 m of mudstone. The geological profile is illustrated in Figure 1.
The 4-5 (06w) belt crossheading is a rectangular tunnel with dimensions of 4.95 m by 3.7 m, which is reinforced with an anchor net and truss beam for structural support. The anchor rod has a diameter of 22 mm and a length of 2400 mm, with a row spacing of 800 mm by 900 mm, and a pre-tightening force of 130 kN. The roof anchor cable measures 22 mm in diameter and 11,000 mm in length, with a row spacing of 1600 mm by 1800 mm, also exhibiting a pre-tightening force of 130 kN. The support scheme employs a bolt-cable support pattern, as illustrated in Figure 2.

2.2. Failure Characteristics of Roadway Failures

According to the investigation report on the ‘1·1’ pressure bumping accident in a mine in Xinjiang, along with the corresponding data: on 1 January 2023, at 21:09, a seismic wave with an energy measurement of 2.8 × 10⁵ J was detected by the ARAMIS M/E microseismic monitoring system at coordinates (4-5) 06w. The recorded seismic event exhibited an approximate magnitude of 1.9, with its epicenter located 55.78 m from the head, 11.00 m from the upper side of the roadway, and at an elevation of +601 m. Between 1 December 2022 and 1 January 2023, a total of 129 microseismic events were recorded in the (4-5) 06W working face and its surrounding area. Of these events, 18 exceeded an energy threshold of 103 J, accounting for 13.9% of the total occurrences. Furthermore, there was one microseismic event with energy surpassing 105 J, which represents 0.7% of the overall events. As depicted in Figure 3, the (4-5) 06w belt crossheading serves as a prevalent excavation roadway for thick coal seams, which are subjected to considerable static and dynamic loads. This situation results in significant dynamic impact hazards during the excavation process. The perturbation induced by tunneling can result in a rapid release of elastic deformation energy that has accumulated within the coal seam, as well as in the roof and floor of the surrounding geological formations, particularly in tectonically active regions. This phenomenon has led to the subsidence of the roof along the (4-5) 06w belt adjacent to the roadway, the displacement of the coal mass on the right side, and the fracturing of the rock section at the lower corner on the left side of the roadway, as depicted in Figure 4.

3. Vibration Wave Splitting and Loading

According to the seismic wave monitoring data of microseismic positioning, this chapter selects the seismic waveform curve with the energy level of 2.8 × 10⁵ J as the research object. According to the microseismic positioning data obtained from seismic wave monitoring, this chapter focuses on the seismic waveform curve characterized by an energy level of 2.8 × 10⁵ J as the primary subject of investigation. Initially, the empirical scaling law [18] is utilized to estimate and calibrate the peak vibration velocity (PPV) at the source. Following this, the calibrated vibration wave is subjected to separation and filtering through the application of the synchrosqueezed wavelet transform. Finally, the dynamic analysis is carried out by inputting the vibration modes of the P-wave and S-wave into the FLAC3D model. Ultimately, the P-wave and S-wave vibration modes are integrated into the FLAC3D model to perform a dynamic analysis.

3.1. Measured Waveform Calibration

The vibration velocity V0(t) of the wave particle, as recorded by the microseismic sensor, is illustrated in Figure 5a. The particle vibration velocity at the seismic wave source, denoted as V1(t), is calculated using Formula (1).
V 1 ( t ) = P P V 1 P P V 0 × V 0 ( t )
In the formula, PPV0 is the PPV of the vibration wave received by the sensor, m/s, and PPV1 is the PPV of the vibration wave particle at the source position, m/s.
Where PPV1 is estimated by the empirical scaling law, according to the scaling rate proposed by McGarr, there are [18]:
P P V 1 = 10 6.479 + 0.57 lg E 1.9 R
In the formula, E represents the dynamic load energy, measured in joules (J), and R is the distance between the source point and the target point, m.
Considering that the scaling law is derived from ensemble data related to the global wave attenuation rate, the methodology described may lead to an overestimation of the monitored peak particle. The calibration procedure is delineated as follows: the sensor records the actual vibration wave, referred to as PPV0, which measures 0.21 m/s, while the calculated PPV1 is 1.12 m/s. By employing Formula (1), the input vibration wave, V1(t), at the source is ascertained, as depicted in Figure 5b.
The scaling law is predicated on a spherical radiation pattern and is derived from the wave attenuation rates recorded in the global database. It is essential to recognize that the empirical scaling method may lead to an overestimation of the PPV values, as 95% of the data within the global database are positioned below the regression line. Therefore, it is imperative to calibrate the vibration wave in accordance with the attenuation effects specific to different mines. Vibration waves are employed in FLAC3D for computational analyses, and their calibration is conducted using the PPV2 measured at the monitoring location within the roadway. Furthermore, Maxwell damping is utilized to simulate the attenuation of seismic wave intensity [19]. The attenuation ratio N is defined by PPV2 and PPV0:
N = P P V 1 P P V 2 P P V 1 × 100 %
In the formula, N represents the reduction ratio of the amplitude of the vibration wave from the source to the monitoring point.
In the current study, the sensor is strategically positioned at a distance of 35 m from the source. The PPV2 recorded at the monitoring location is 0.153 m/s, accompanied by an attenuation ratio (N) of 86.3%. The field-measured PPV0 is 0.21 m/s, whereas the P P V 1 at the source, calibrated using Formula (4), is determined to be 1.694 m/s.
P P V 1 = P P V 0 1 N
This calibrated P P V 1 is subsequently integrated into Formula (1) to derive the calibrated vibration wave, as depicted in Figure 5b.

3.2. Separation and Filtering of Vibration Waveforms

The vibration waves identified by the microseismic monitoring system generally comprise a combination of P-waves and S-waves, accompanied by a certain degree of noise. The presence of this noise complicates the process of isolating the waveform. Recent advancements in signal processing technology have facilitated the growing application of the synchrosqueezed wavelet transform within the domain of seismic signal processing. This technique has been utilized to enhance time-frequency resolution and to improve the accuracy of signal feature extraction. By employing the technique of instantaneous frequency redistribution and estimation [19,20], it is feasible to attain a high-resolution representation in the time-frequency domain. This approach facilitates the differentiation and separation of P-waves and S-waves that possess distinct frequency components.
Because microseismic monitoring systems collect extraneous noise, Butterworth filters are commonly employed in noise processing due to their advantages in preserving waveform fidelity [21]. Ultimately, the processed P-waves and S-waves are reconstructed from the time-frequency domain signal back to the time domain signal by applying the inverse synchrosqueezing wavelet transform. Drawing upon the foundational principles of the synchrosqueezed wavelet transform in conjunction with the Butterworth filter, the following sections present a comprehensive discussion of the methodologies employed for the extraction and separation of features within vibration waveforms.
The acquired vibration wave signal is expressed as illustrated in Formula (5) [19].
f ( t ) = k = 1 K A k ( t ) cos ( 2 π φ k ( t ) ) + e ( t )
In the formula, Ak(t) denotes the amplitude of this component; φ k ( t ) is the instantaneous phase of the above components; and e(t) is a white noise with zero mean and variance of σ 2 .
Initially, the original vibration waveform that has been acquired is subjected to a continuous wavelet transform [20]. The continuous wavelet transform of the vibration wave signal f(t) is expressed in Equation (6).
W s ( a , b ) = 1 a f ( t ) ψ * ( t b a ) d t
In the formula, ψ * is the complex conjugate of the mother wavelet, and b denotes the time offset applied to the mother wavelet, and will also be scaled by the scale factor a.
The continuous wavelet transform involves the convolution of the signal f(t) with a scaled and translated mother wavelet. The wavelet coefficients of the signal f(t) are derived by scaling and shifting the mother wavelet.
Ws(a, b) represents the coefficients of the signal ft after the continuous wavelet transform and describes the characteristics of the signal at different scales a and positions b [20].
When W s ( a , b ) ≠ 0, use Formula (7) to calculate the instantaneous frequency Ws(a, b):
ω s ( a , b ) = j W s ( a , b ) W s ( a , b ) b
where W s ( a , b ) b represents the rate of change of wavelet coefficients in the b direction of displacement, which is utilized to describe the local frequency variation of the signal.
The final step is to map the speed plane of the signal to the time-frequency plane; specifically, (b, a) is converted to ws(a, b).
The methodology that integrates continuous wavelet transform with instantaneous frequency reassignment is known as the synchrosqueezing transform technique [20].
Given that the variables a and b are discretized, a time step of Δ a k = a k 1 a k is established for the computation of ak across all Ws(a, b). Additionally, a frequency band of Δ ω is selected due to its primary concentration of energy within the signal, thereby facilitating a more effective capture of the signal’s essential characteristics.
Ts(wl, b) is calculated exclusively at the central wl of [ ω l Δ ω / 2 , ω l + Δ ω / 2 ] within the specified frequency range, as indicated in Formula (8).
T s ω l , b = 1 Δ ω a k : ω ( a k , b ) ω l Δ ω 2 W s a k , b a 1.5 Δ a k
The high-frequency components of the signal are filtered using a Butterworth filter to suppress noise while retaining the primary components of the signal. The difference equation for the Butterworth filter is presented in Formula (9) [22].
y [ n ] = i = 1 N a i y [ n i ] + j = 0 M b j x [ n j ]
In the formula, x [ n ] represents the input signal sequence; y [ n ] denotes the filtered signal; and a i and b j are the feedback and feedforward coefficients of the filter, respectively, which are associated with the filter’s order.
The filtered signal is separated from the P-wave and S-wave through signal reconstruction, as illustrated in Formula (10). Each component of the signal undergoes a discrete synchrosqueezing wavelet transform on the overlapping component l L k t and discrete time t m = t 0 + m Δ t , where Δ t represents the sampling time interval.
s k t m = 2 C ϕ 1 T ~ ω l , t m
In the formula, C ϕ 1 represents the phase difference constant associated with the chosen wavelet, whereas the real component of the discrete synchrosqueezing transform within the designated frequency band is utilized to reconstruct the real component t m .
The original signal is recovered from the rearranged frequency domain signal using the inverse synchrosqueezing wavelet transform, as demonstrated in Formula (11).
x ( t ) = 1 C ψ S x ( t , f ) ψ f ( t ) d f
In the formula, C ψ is the normalized constant of the wavelet function, ψ f represents the wavelet function in the frequency domain, and S x ( t , f ) is a time-frequency spectrum that is compressed synchronously.
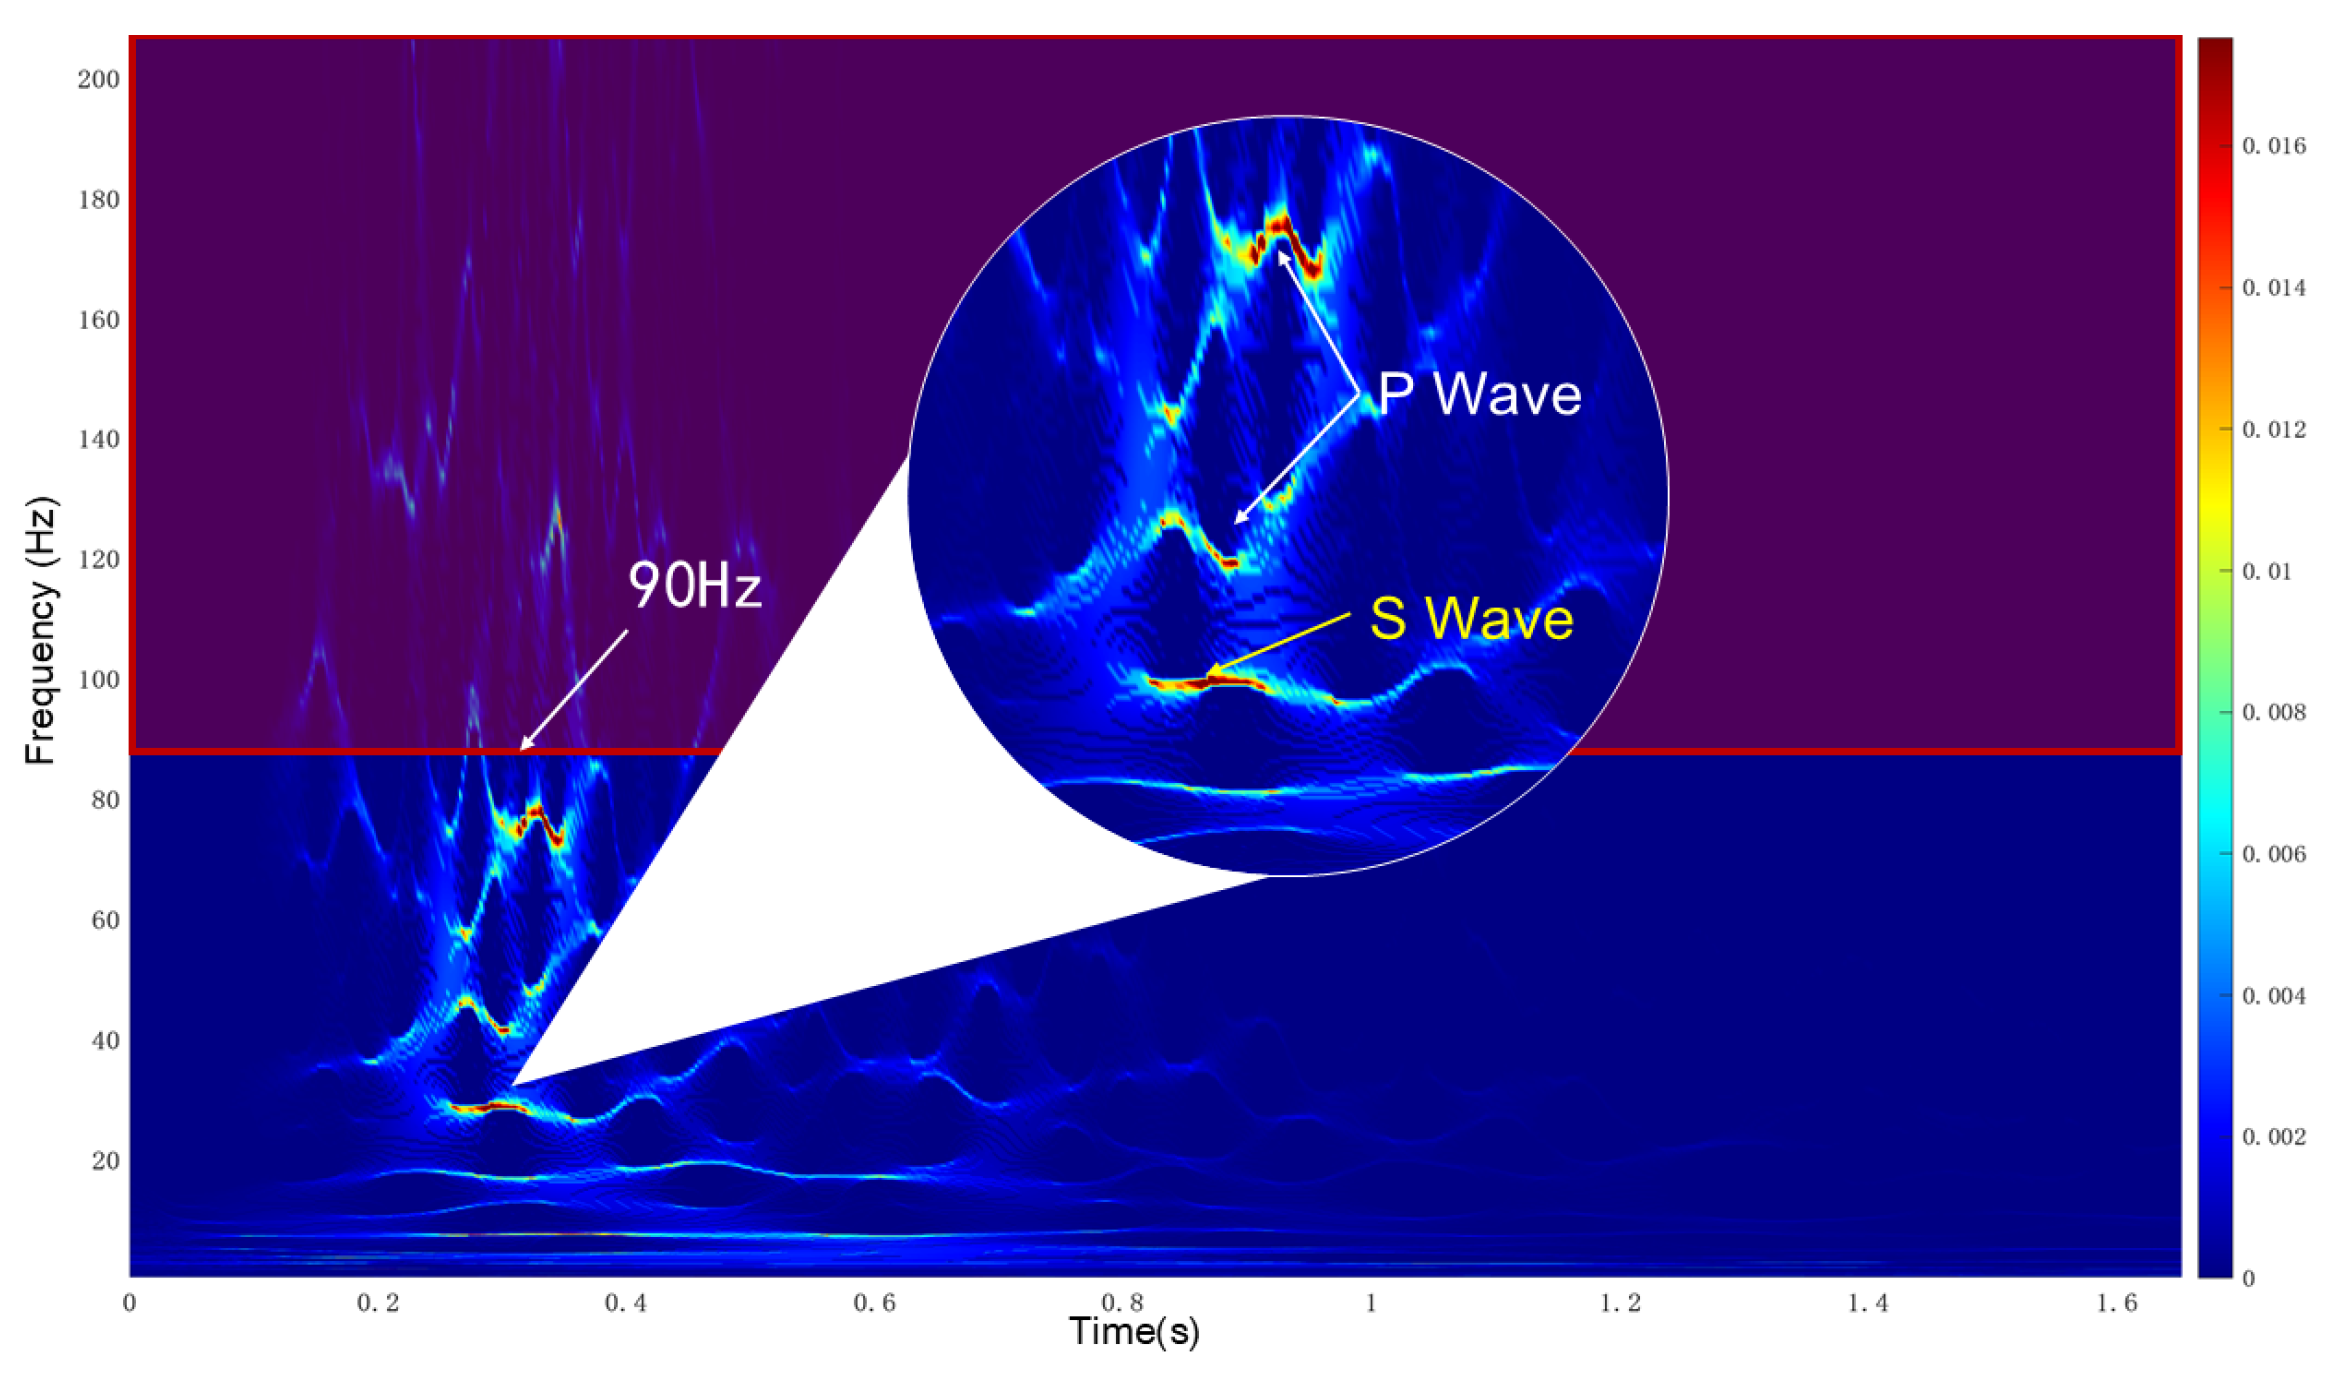
In accordance with the research requirements, the code for data segmentation based on microseismic data has been developed using MATLAB (R2023a(9.14)), facilitating the noise filtering and separation of seismic wave data. The concave–convex wavelet is employed in the process of synchronous compression changes. After the synchronous compression wavelet transformation and noise reduction, a high-resolution time-frequency domain representation of the vibration wave is produced. The results are depicted in Figure 6. Based on the distinct frequency components of P-waves and S-waves, these waves are extracted individually. The frequency range of P-waves, as determined by short-time Fourier transform analysis, is identified to be between 35 Hz and 82 Hz, which is notably higher than the frequency range of S-waves, which spans from 18 Hz to 30 Hz. Kaiser et al. [23] observed that only low-frequency, high-energy waves can potentially damage rock masses, which is why waveforms above 90 Hz are filtered out. The study by Kuhlemeyer et al. [24] demonstrates that to accurately represent the propagation of vibration waves in the FLAC3D model, the non-physical effect of superimposed oscillations is avoided. The maximum mesh size, denoted as Δ l , required for modeling should be less than approximately one-tenth to one-eighth of the wavelength corresponding to the highest frequency component of the input wave, as indicated in Formula (12).
Δ l ( 1 8 1 10 ) C s f max
In the formula, C s is the velocity of the S-wave, and f max is the maximum frequency.
The vibration wave has been subjected to filtering in MATLAB. However, after the separation of the P-wave and S-wave for input into the FLAC3D model, residual velocity resulting from baseline drift continues to be present even after the vibration has ceased. To mitigate its impact on the analysis outcomes, the Fast Fourier Transform technique in FLAC3D is utilized for secondary calibration, ensuring that the final velocity of the input vibration wave is zero, as illustrated in Figure 7. An examination of the waveforms before and after the second filtering reveals that the difference in input power is less than 1%. This finding confirms that the input waveform meets the modeling criteria and reduces the potential impact of baseline drift on the results.

3.3. Longitudinal and Transverse Wave Propagation and Loading Modes

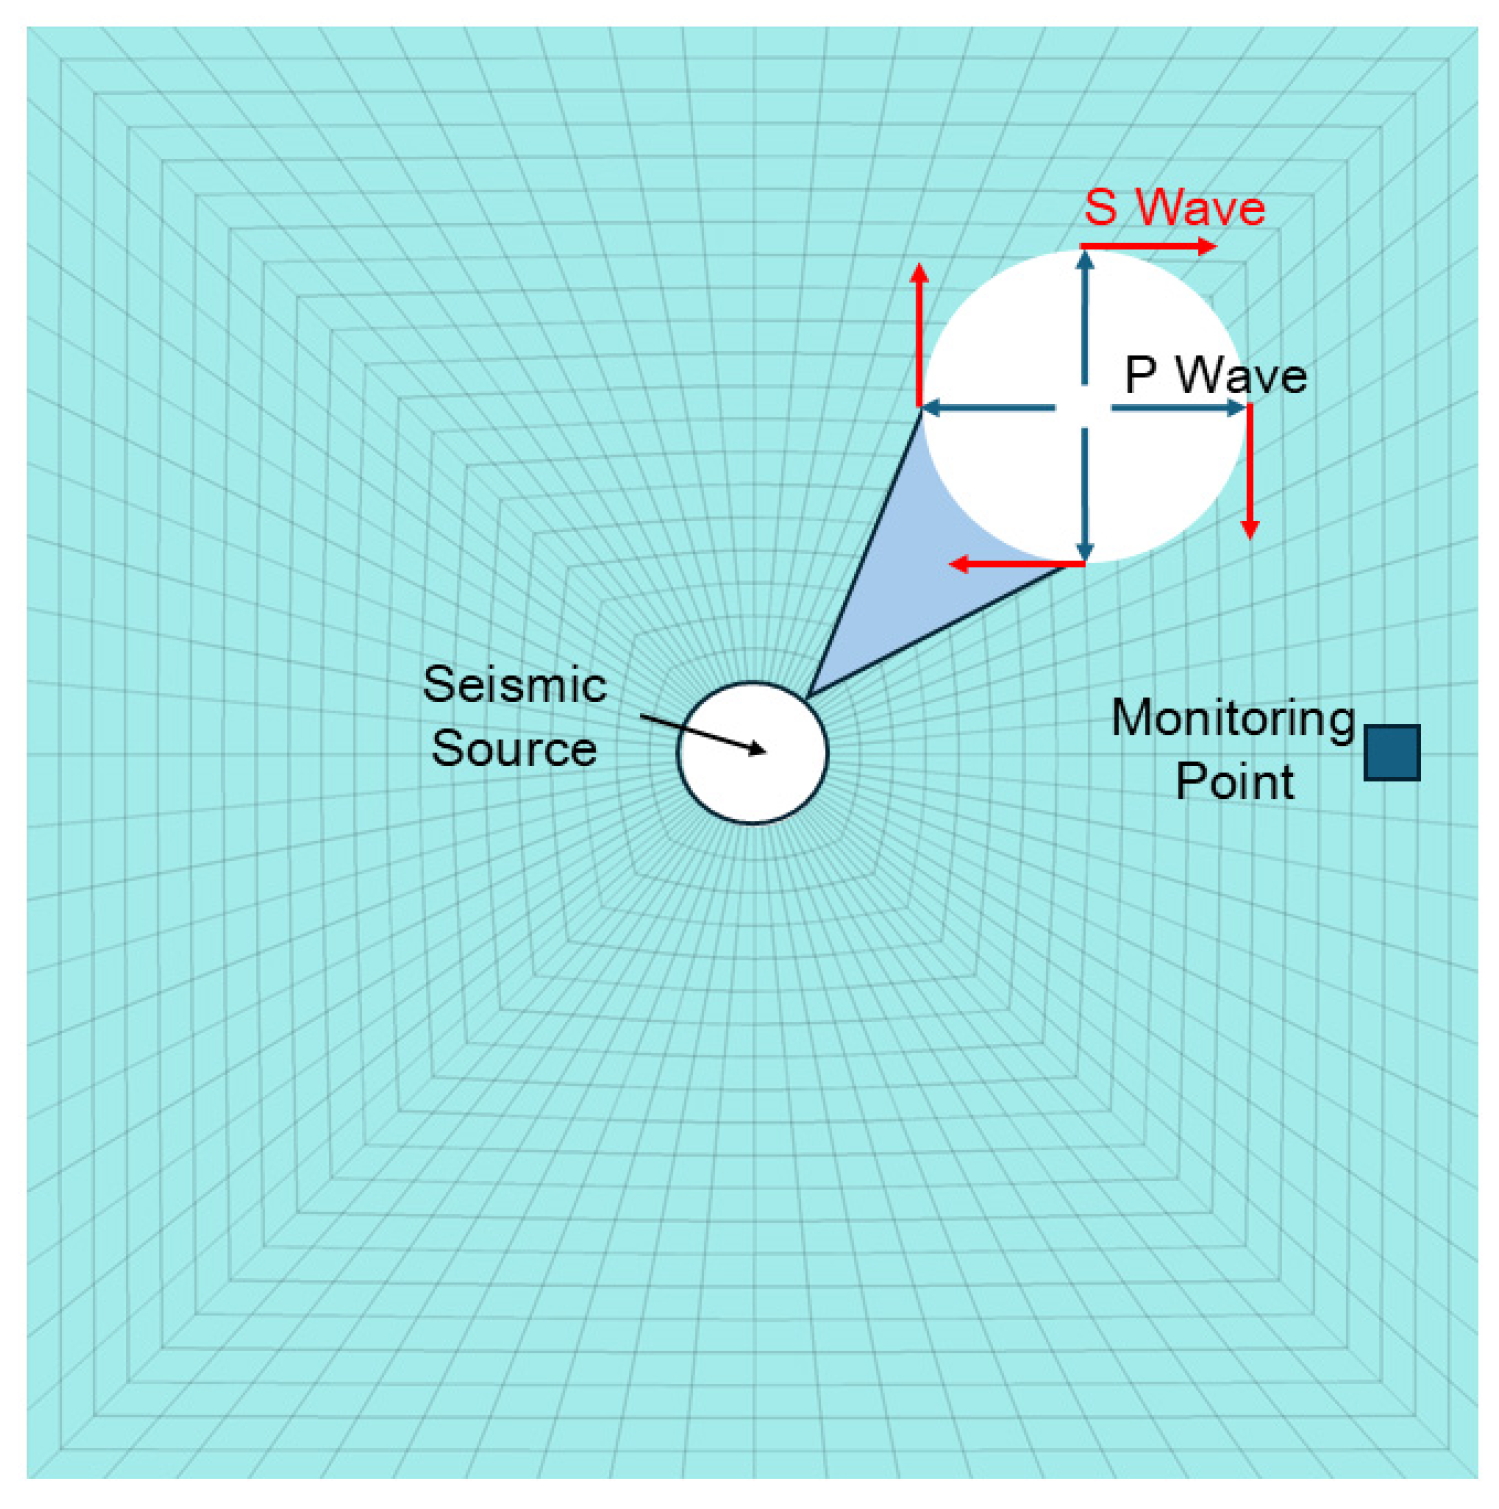
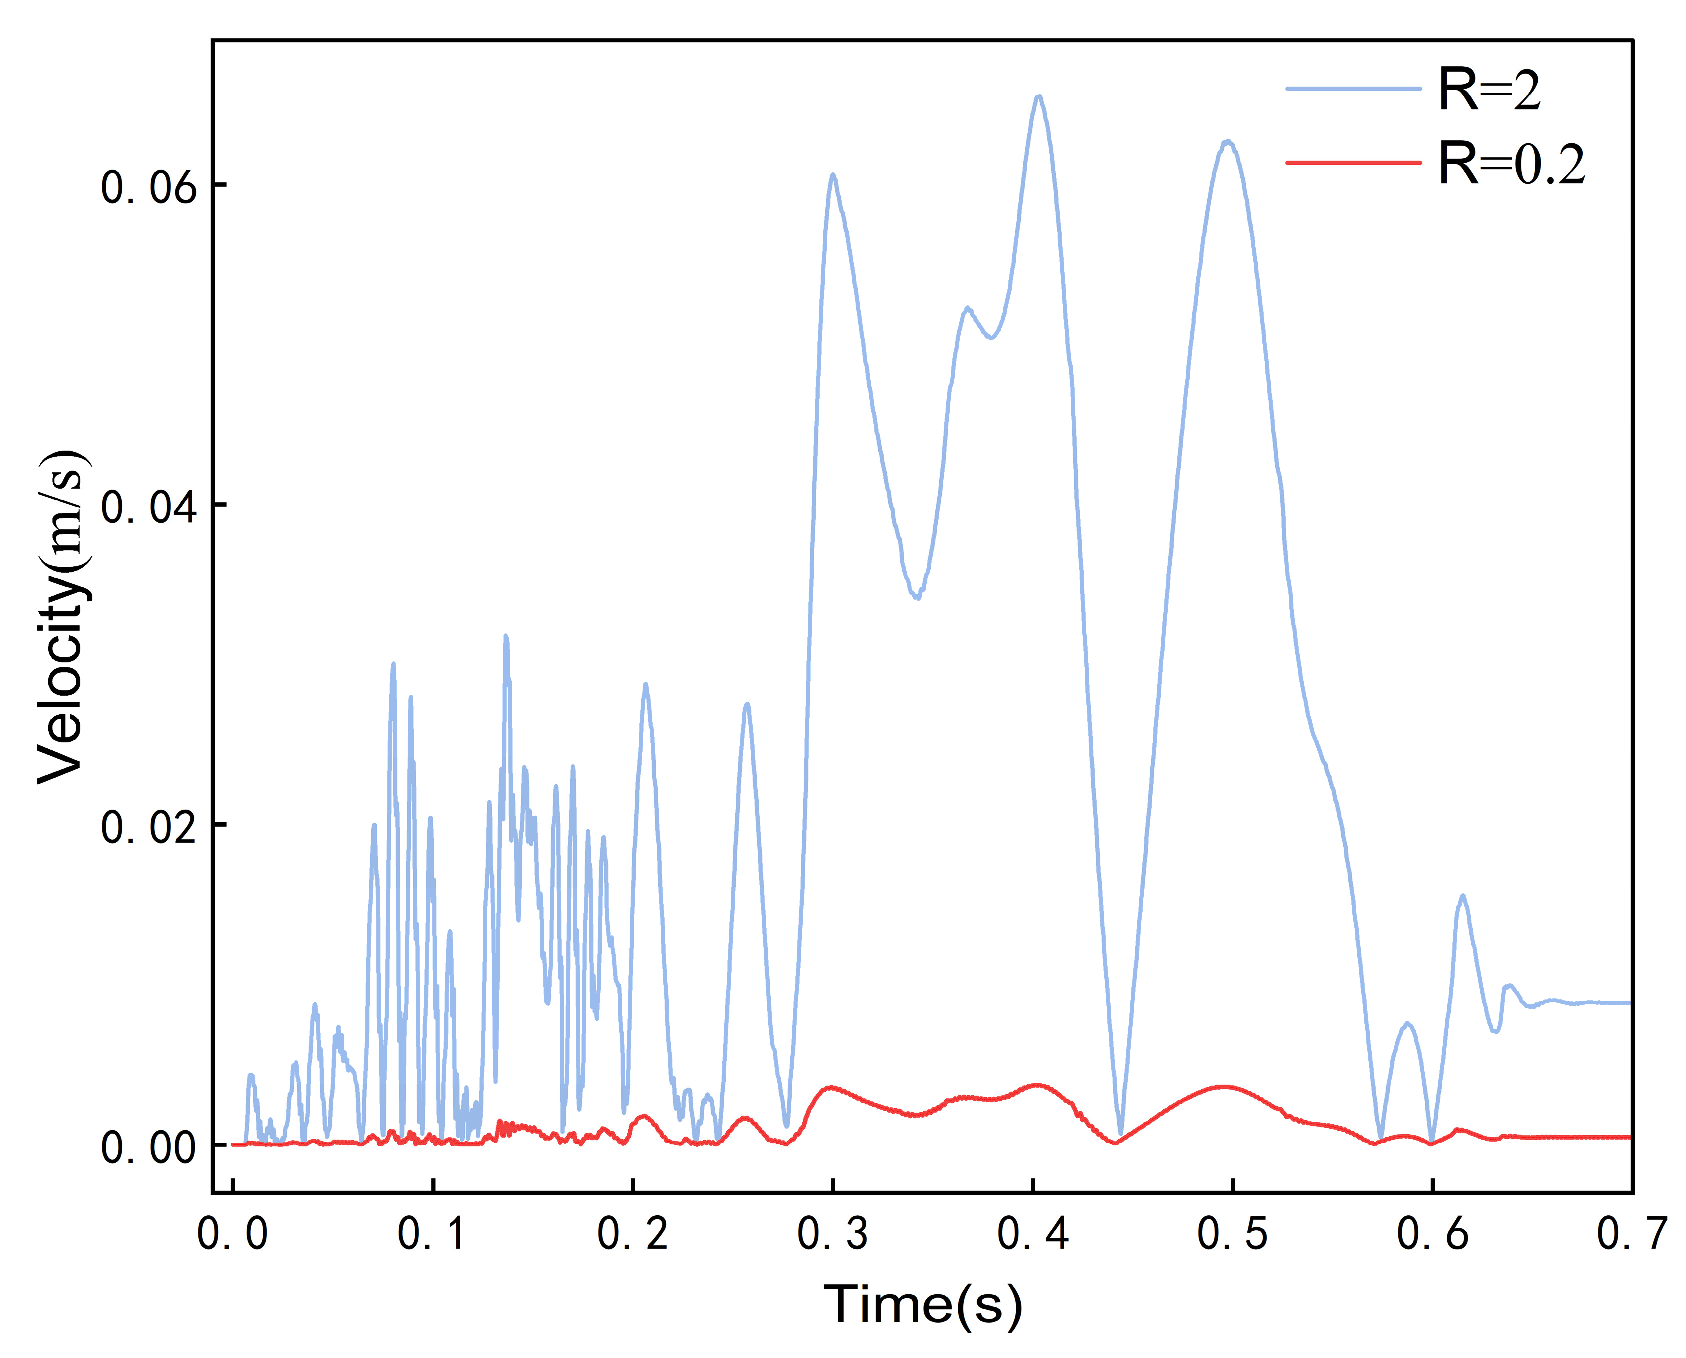
The vibration waves caused by pressure bumping are mainly P-waves (longitudinal waves) and S-waves (transverse waves). Because of the different propagation modes of the two waves, they need to be applied according to their respective vibration propagation modes [25]. The direction of particle vibration in P-waves aligns with their propagation direction, while the vibration direction of S-waves is perpendicular to their propagation direction. In underground mining operations, a roof collapse can precipitate the abrupt release of elastic energy stored within the rock mass, thereby resulting in considerable dynamic hazards. From a mechanical perspective, pressure bumping functions as a comprehensive representation of external loads, internal structures, structural characteristics, and the physical and mechanical properties of materials. The formation of pressure bumping is a complex process that involves multiple interdisciplinary fields, such as geology, mining, geophysics, rock mechanics, and nonlinear dynamics. Furthermore, it demonstrates the unique characteristics of temporal and spatial evolution. The geographical positioning of the mine’s microseismic monitoring system indicates that sources located near the roadway are typically modeled as point sources. However, the inherent characteristics of split vibration waves, which are defined by time–velocity curves, render direct application to grid nodes impractical. To address this challenge, a source sphere is proposed as a simplified representation of the point source. In this model, the split P-wave is oriented in the normal direction relative to the surface of the sphere, whereas the split S-wave is oriented in the tangential direction [25,26]. To investigate the influence of sphere size on the propagation of vibration waves, a linear elastic model is utilized within the FLAC3D software (7.00.126). A spherical boundary with radii of 0.2 m and 2 m is established as the source, while a viscous boundary is employed to absorb the reflected vibration wave, as depicted in Figure 8. Figure 9 presents the observed particle vibration velocities associated with different source sizes. The mechanical parameters utilized in this simulation consist of a density of 2580 kg/m³, a bulk modulus of 9.73 × 10⁹ Pa, and a shear modulus of 5.84 × 10⁹ Pa. When a vibrational wave is applied to a smaller sphere, the energy released from the inner surface is more concentrated, resulting in a relatively rapid dissipation of energy during the propagation process. The larger sphere can disperse energy more gently, and the monitoring points receive a higher amplitude at the same distance. As depicted in Figure 9, the waveforms generated by different sources demonstrate a general trend of similarity; however, the vibration amplitude produced by the 2 m sphere is significantly greater. This enhanced amplitude is beneficial for investigating the response characteristics of the surrounding rock, which is anchored to the roadway, in reaction to vibrational waves. Therefore, the 2 m sphere has been chosen as the source point for the subsequent numerical analysis.

4. Model Establishment and Instability Evaluation Method

4.1. Development of a Numerical Model

Select (4-5) 06w belt groove head-on end to the rear 80 m to establish the model. The model adopts the Mohr–Coulomb constitutive model, based on the geomechanical parameters obtained from a mine in Xinjiang, along with the accompanying report. The mechanical properties of each rock layer within the model are presented in Table 1.
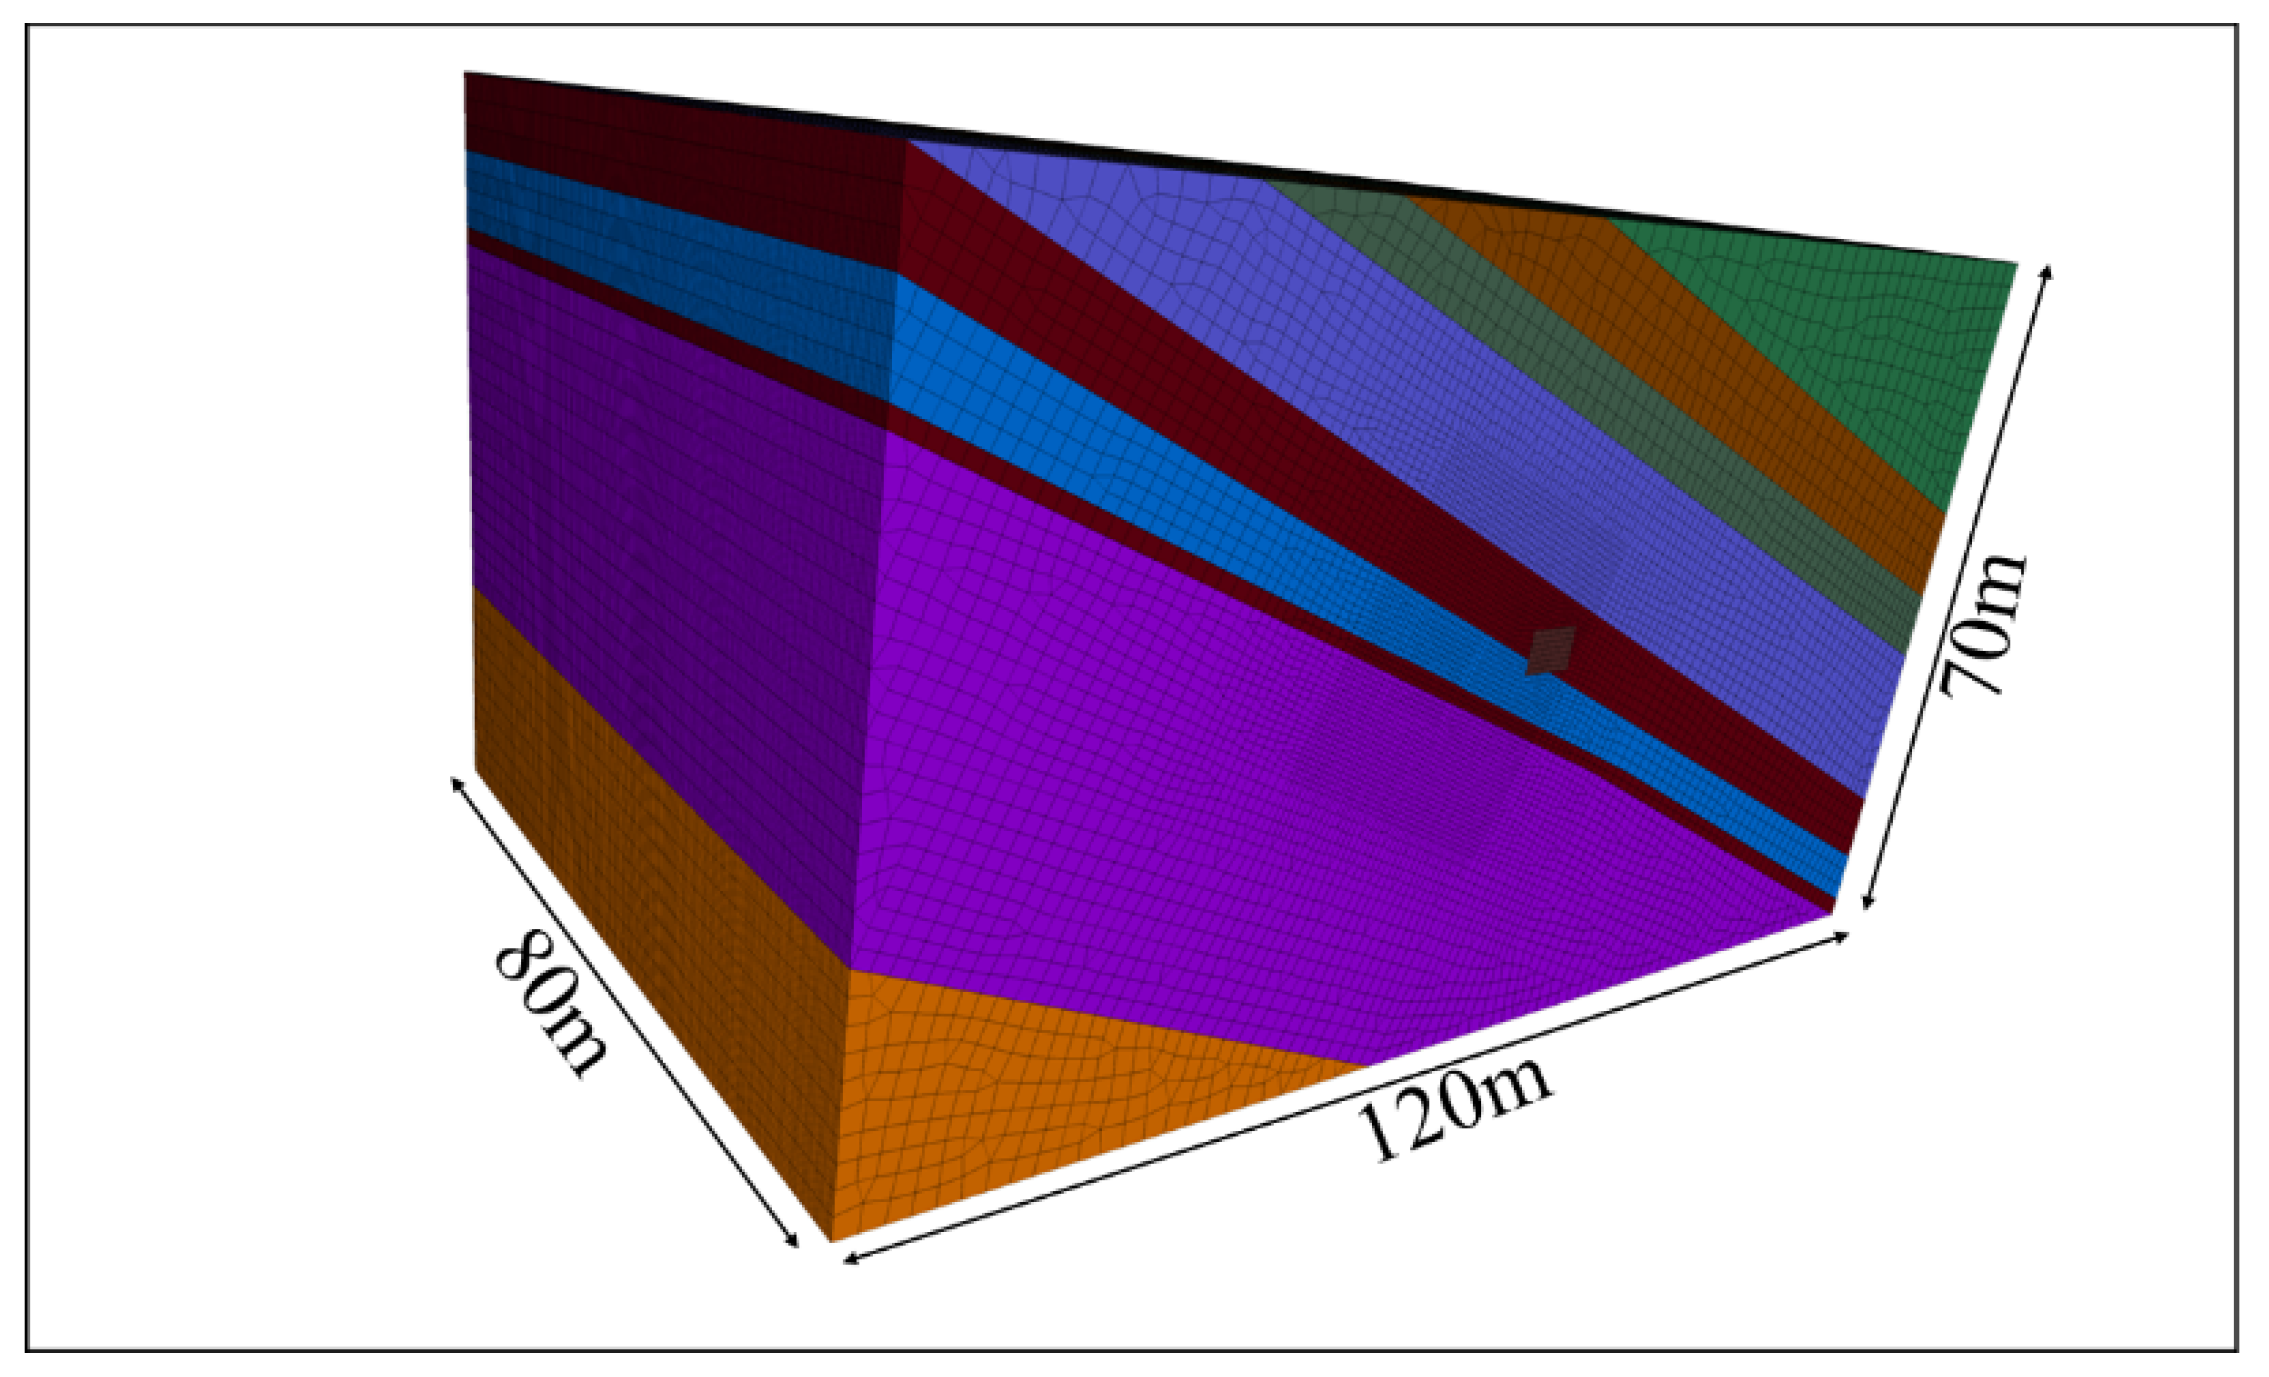
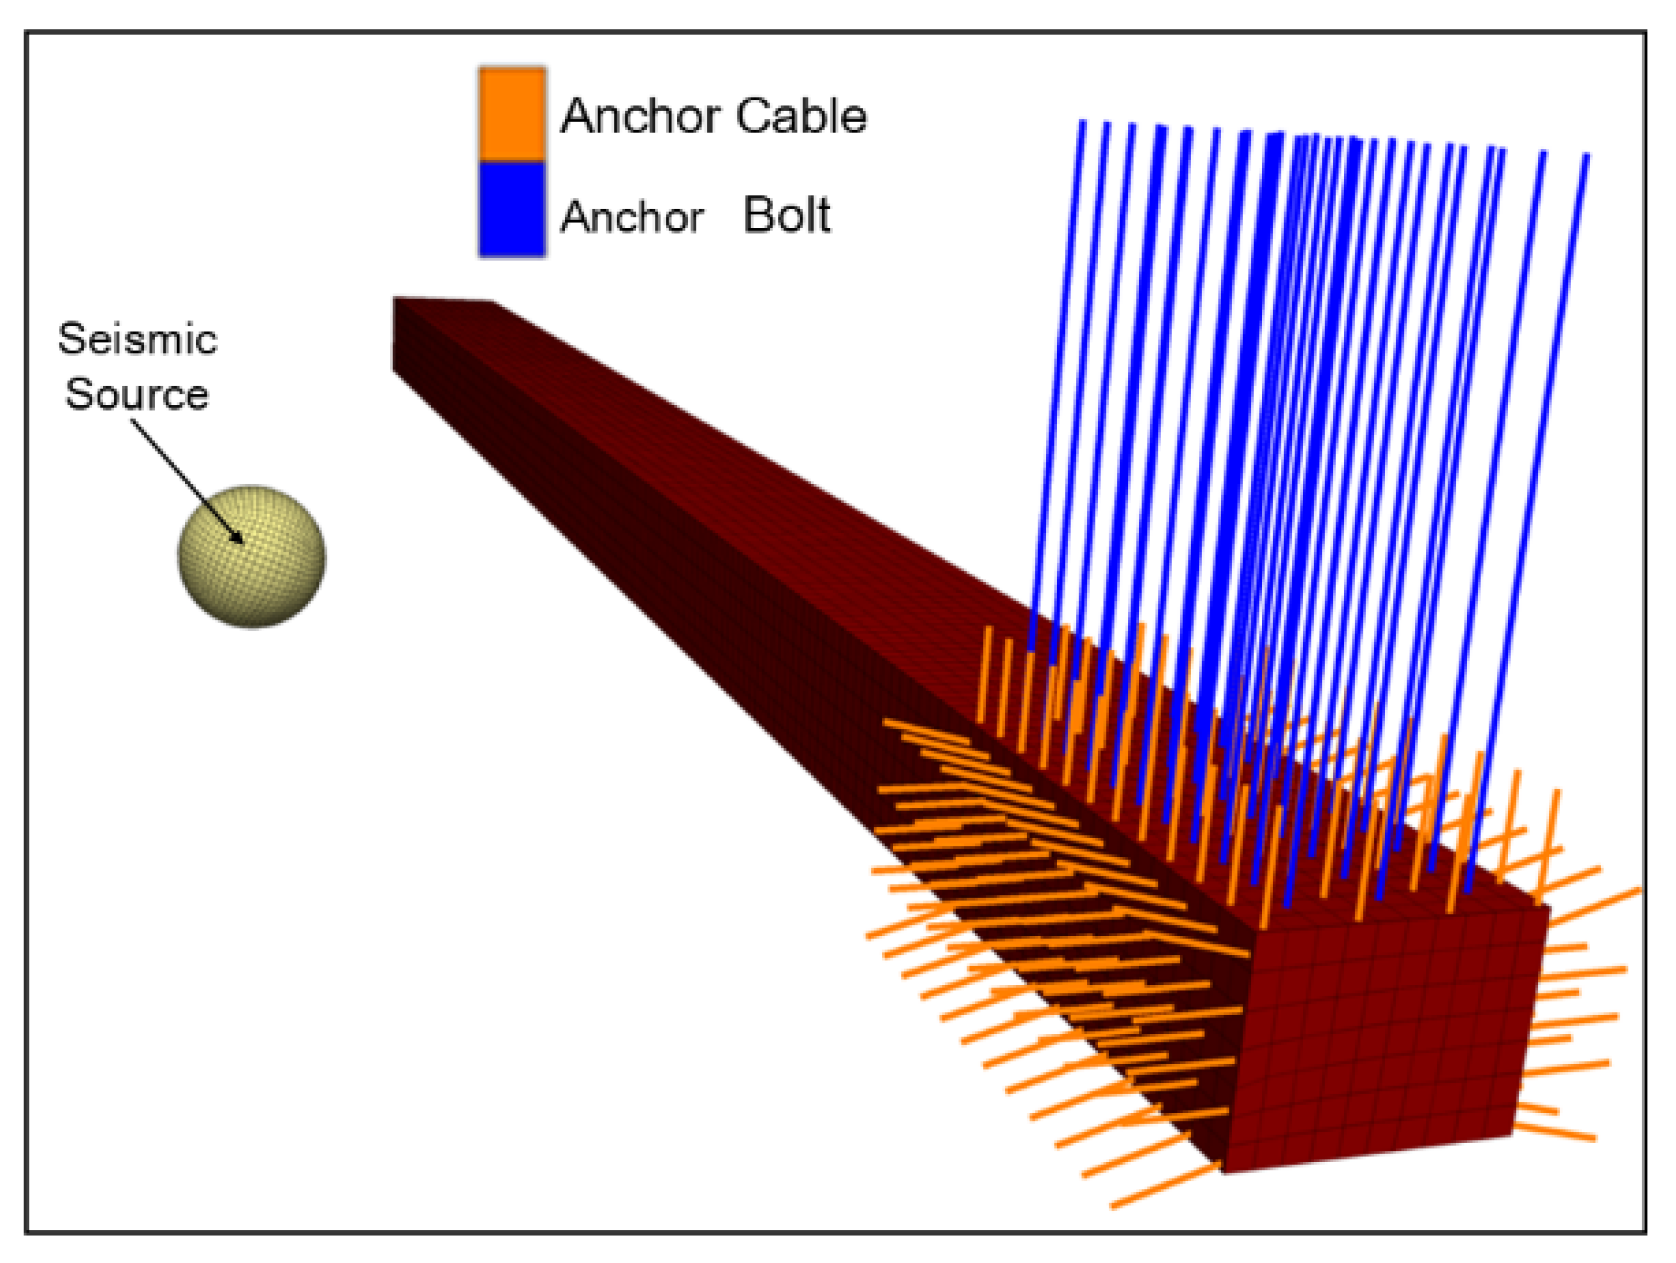
The dimensions of the research model are specified as length × width × height = 120 m × 80 m × 70 m. The roadway is designed in a rectangular configuration, with a net width and net height of the section measuring 4.95 m × 3.7 m, as depicted in Figure 10. In FLAC3D, the propagation of stress waves within the medium can be effectively simulated through appropriate element division and node placement. Through the application of Hypermesh modeling software (2021), we determine the minimum modeling dimensions and the criteria for discretization quality relevant to vibration waves. Additionally, we incorporate the quality assessment and optimization tools provided by Hypermesh to ensure that the constructed model is consistent with the propagation characteristics of the vibration wave. This methodology significantly improves the accuracy and reliability of the numerical simulation. The anchor bolt and anchor cable are represented by cable elements, while the prestressed anchor bolt and anchor cable are modeled by assigning distinct attributes to the free segment and the anchorage segment, as illustrated in Figure 11. The anchor bolt and anchor cable are represented by cable elements, while the prestressed anchor bolt and anchor cable are modeled by assigning distinct attributes to the free segment and the anchorage segment, as illustrated in Figure 11. As a result, once the shock wave is introduced, the sphere is removed from the model. Following the removal of the sphere, a plastic zone will develop around it, leading to excessive absorption of the vibrational wave, which will cause the level of attenuation to exceed the true attenuation.
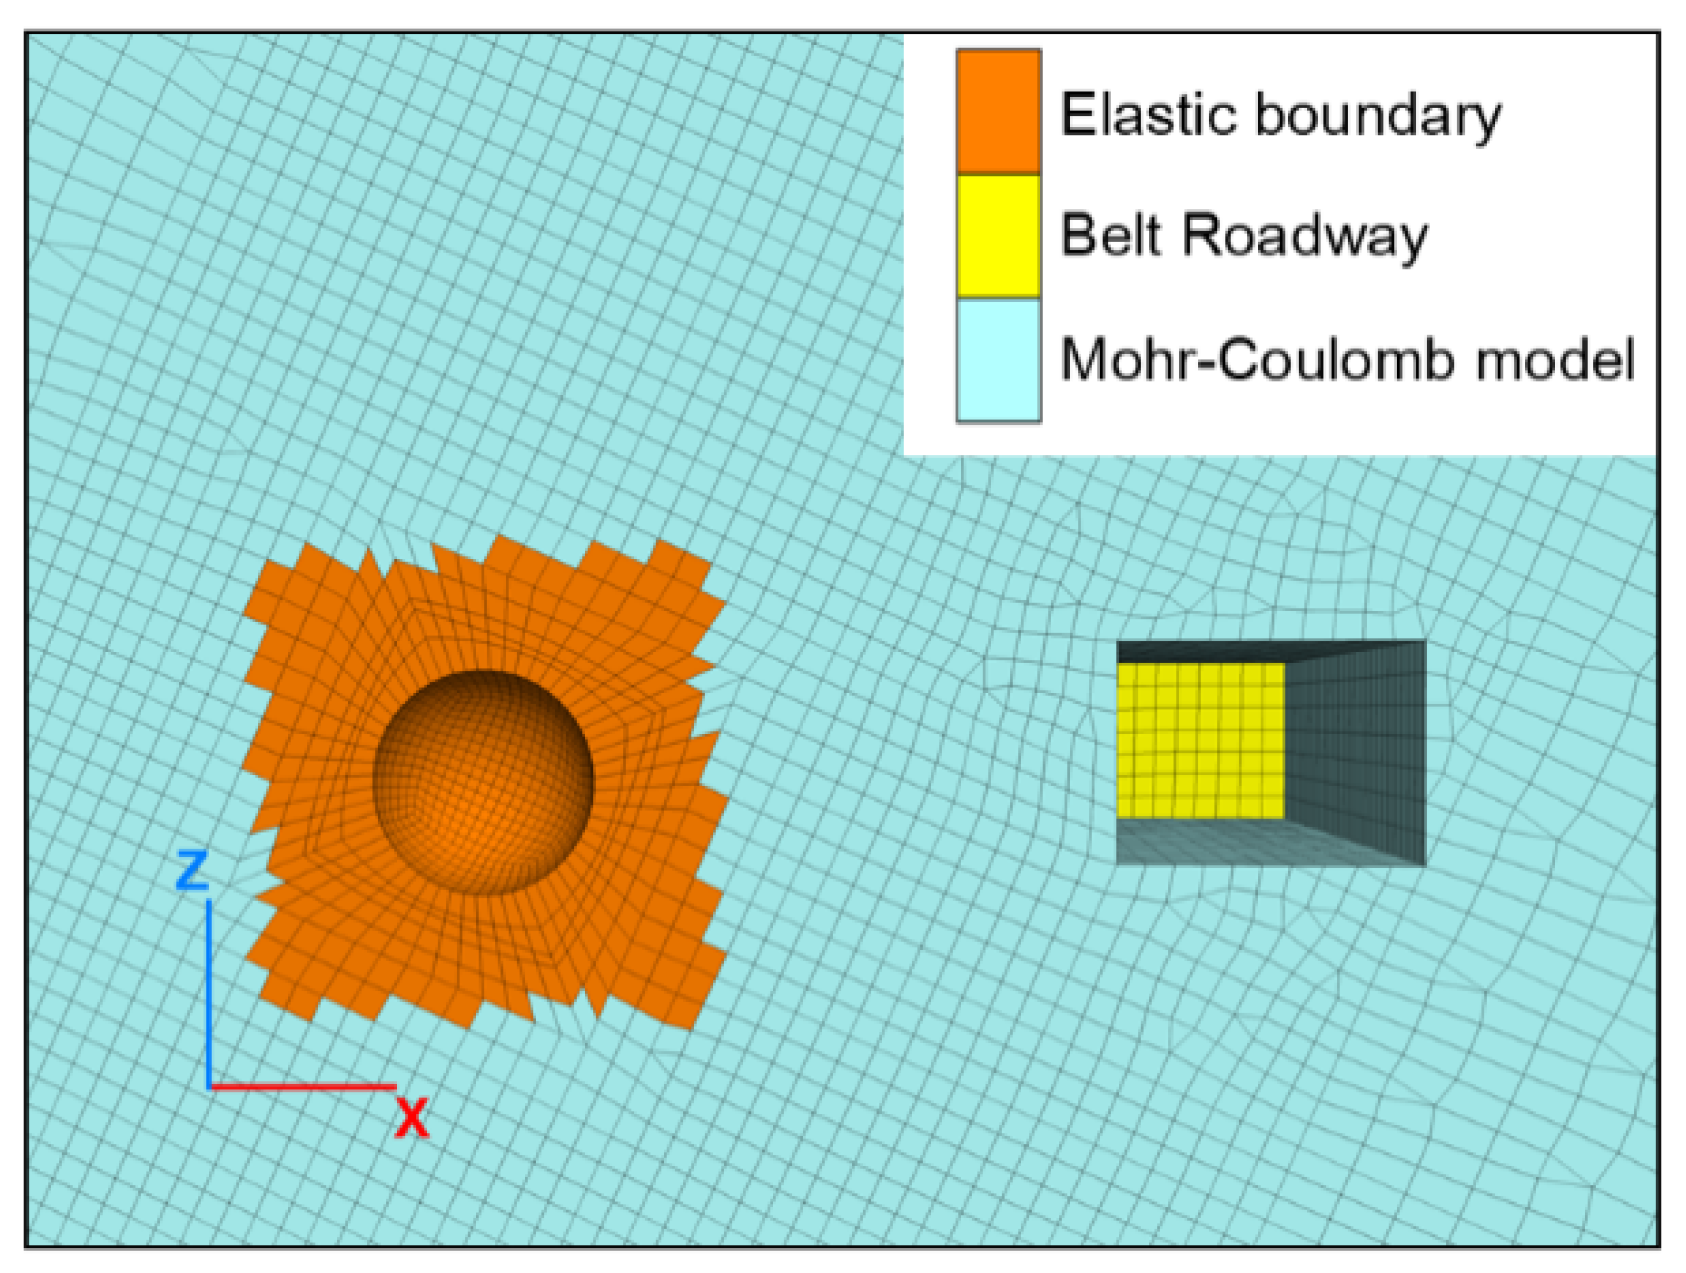
Therefore, the corresponding FISH function is developed to calculate the range of the plastic zone generated by the removal of the spherical source. This region is defined using an elastic constitutive model to mitigate the impact of the plastic zone created by the excavation on the propagation of vibration waves, as illustrated in Figure 12.

4.2. Boundary Condition Setting

During the mining process, the initial stress field is generally influenced by both the tectonic stress field and the stress field generated by self-weight. In the FLAC3D model, the internal stress is equilibrated exclusively through redistribution mechanisms. The self-weight of the rock mass is applied to the model in the form of body force. The initial stress field obtained by stress redistribution is usually expressed as the self-weight stress field, which is inconsistent with the actual situation. As a result, following the rapid stress boundary fitting technique proposed by Li et al. [27], the numerical model does not impose a velocity boundary condition. Instead, it applies a stress boundary condition to the model’s surface based on the measured ground stress data. The force applied is considered to be the stress acting on the exterior of the model. The initial stress field obtained from the rapid stress boundary fitting technique can be regarded as a combination of the tectonic stress field and the vertical stress field. Finally, the displacement velocity generated after the initial stress field is balanced is cleared, the corresponding static boundary conditions are set, and the roadway excavation is carried out. The relationship between horizontal and vertical in situ stress applied on the surface of the model is defined as follows. The ratio is calculated from the in situ stress test results of 4-5 coal seams:
σ z z 0 = γ H
σ y y 0 = 1.243 σ z z 0
σ x x 0 = 1.184 σ z z 0
In the formula, γ is the bulk density of the material, and H is the depth from the surface.
When conducting dynamic calculations in the excavated roadway, it is crucial to accurately replicate the natural energy dissipation. Rayleigh damping is implemented by utilizing a specified damping ratio at two particular frequencies. Within this frequency spectrum, the model’s actual damping ratio is observed to be lower than the true attenuation effect present at the site. When the frequency exceeds this range, the damping will increase significantly, and attenuation inconsistent with the field vibration wave will occur. Zhao Cheng et al. [19] conducted a validation of the damping scheme using three Maxwell components, as proposed by earlier researchers, as an alternative to Rayleigh damping. The findings suggest that, in the majority of seismic deformation analyses, this methodology is effective in producing a relatively stable damping effect within the designated frequency range. In dynamic analysis, it is essential to modify the static boundary conditions employed in static analysis to viscous boundary conditions in order to minimize the reflection and refraction of vibration waves [28]. Under viscous boundary conditions, the normal and tangential viscous forces produced by the damper are determined using the following equation:
t n = ρ C p ν n
t s = ρ C s ν s
In the formula, vn is the normal velocity component at the model boundary, and vs is the tangential velocity component.

4.3. Impact Instability Energy Evaluation Method

Rock failure is a phenomenon of instability driven by energy. Evaluating the safety and stability of engineering rock masses can be effectively achieved by describing the strength and deformation behavior of rock from an energy perspective [29,30]. Consequently, elastic strain energy serves as a measure for evaluating the safety and stability of rock masses in response to vibrational wave activity.
The elastic deformation energy of the surrounding rock in a roadway is a scalar quantity that characterizes the energy of the surrounding rock within a specific range. It is a function of the density of elastic deformation energy. The elastic strain energy released by the surrounding rock of the roadway can be calculated using the following formula [26]:
E 0 = 1 2 E ¯ σ 1 2 + σ 2 2 + σ 3 2 2 ν ¯ σ 1 σ 2 + σ 2 σ 3 + σ 1 σ 3
In the formula, E ¯ represents the unloading elastic modulus, while ν ¯ denotes the average Poisson’s ratio.
According to the theory of pressure bumping low pressure starting proposed by Pan Junfeng et al. [31], pressure bumping occurs when the elastic strain accumulated in the limit equilibrium zone exceeds the minimum energy required to fracture the coal and rock in that area, as indicated in Formula (19).
E 0 E c > 0
In the formula, E0 is the released elastic energy, and Ec is the minimum energy required for the destruction of coal.
The minimum energy principle related to the dynamic failure of coal and rock masses, as described in reference [32], asserts that the energy required for the dynamic failure of a rock mass—irrespective of whether it is subjected to a one-dimensional, two-dimensional, or three-dimensional stress state—remains consistently equal to the energy utilized during failure under a one-dimensional stress state.
Therefore, the minimum energy required for the destruction of the 4-5 coal seam can be calculated. The corresponding energy consumption criterion is as follows:
E c = σ 2 / ( 2 E )
In the formula, σ is the body’s uniaxial compressive strength, and E is the elastic modulus of coal.
The uniaxial compressive strength of the 4-5 coal seam is 13.30 MPa, and its elastic modulus is 1.96 GPa. The minimum energy required for the failure of 4-5 coal is 45 kJ/m³.
When the accumulated energy exceeds the maximum load-bearing capacity of the rock mass, it will lead to impact failure.
In order to describe the energy accumulated during the propagation of vibrational waves, the formula for calculating rock elastic strain energy is incorporated into the static and dynamic models of FLAC3D using Fish language.
By analyzing the variations in elastic strain energy levels near the roadway before and after excavation, an assessment is conducted to evaluate whether the roadway is at risk of experiencing impact instability.

5. Numerical Simulation Results Analysis

5.1. Seismic Wave Propagation Characteristics

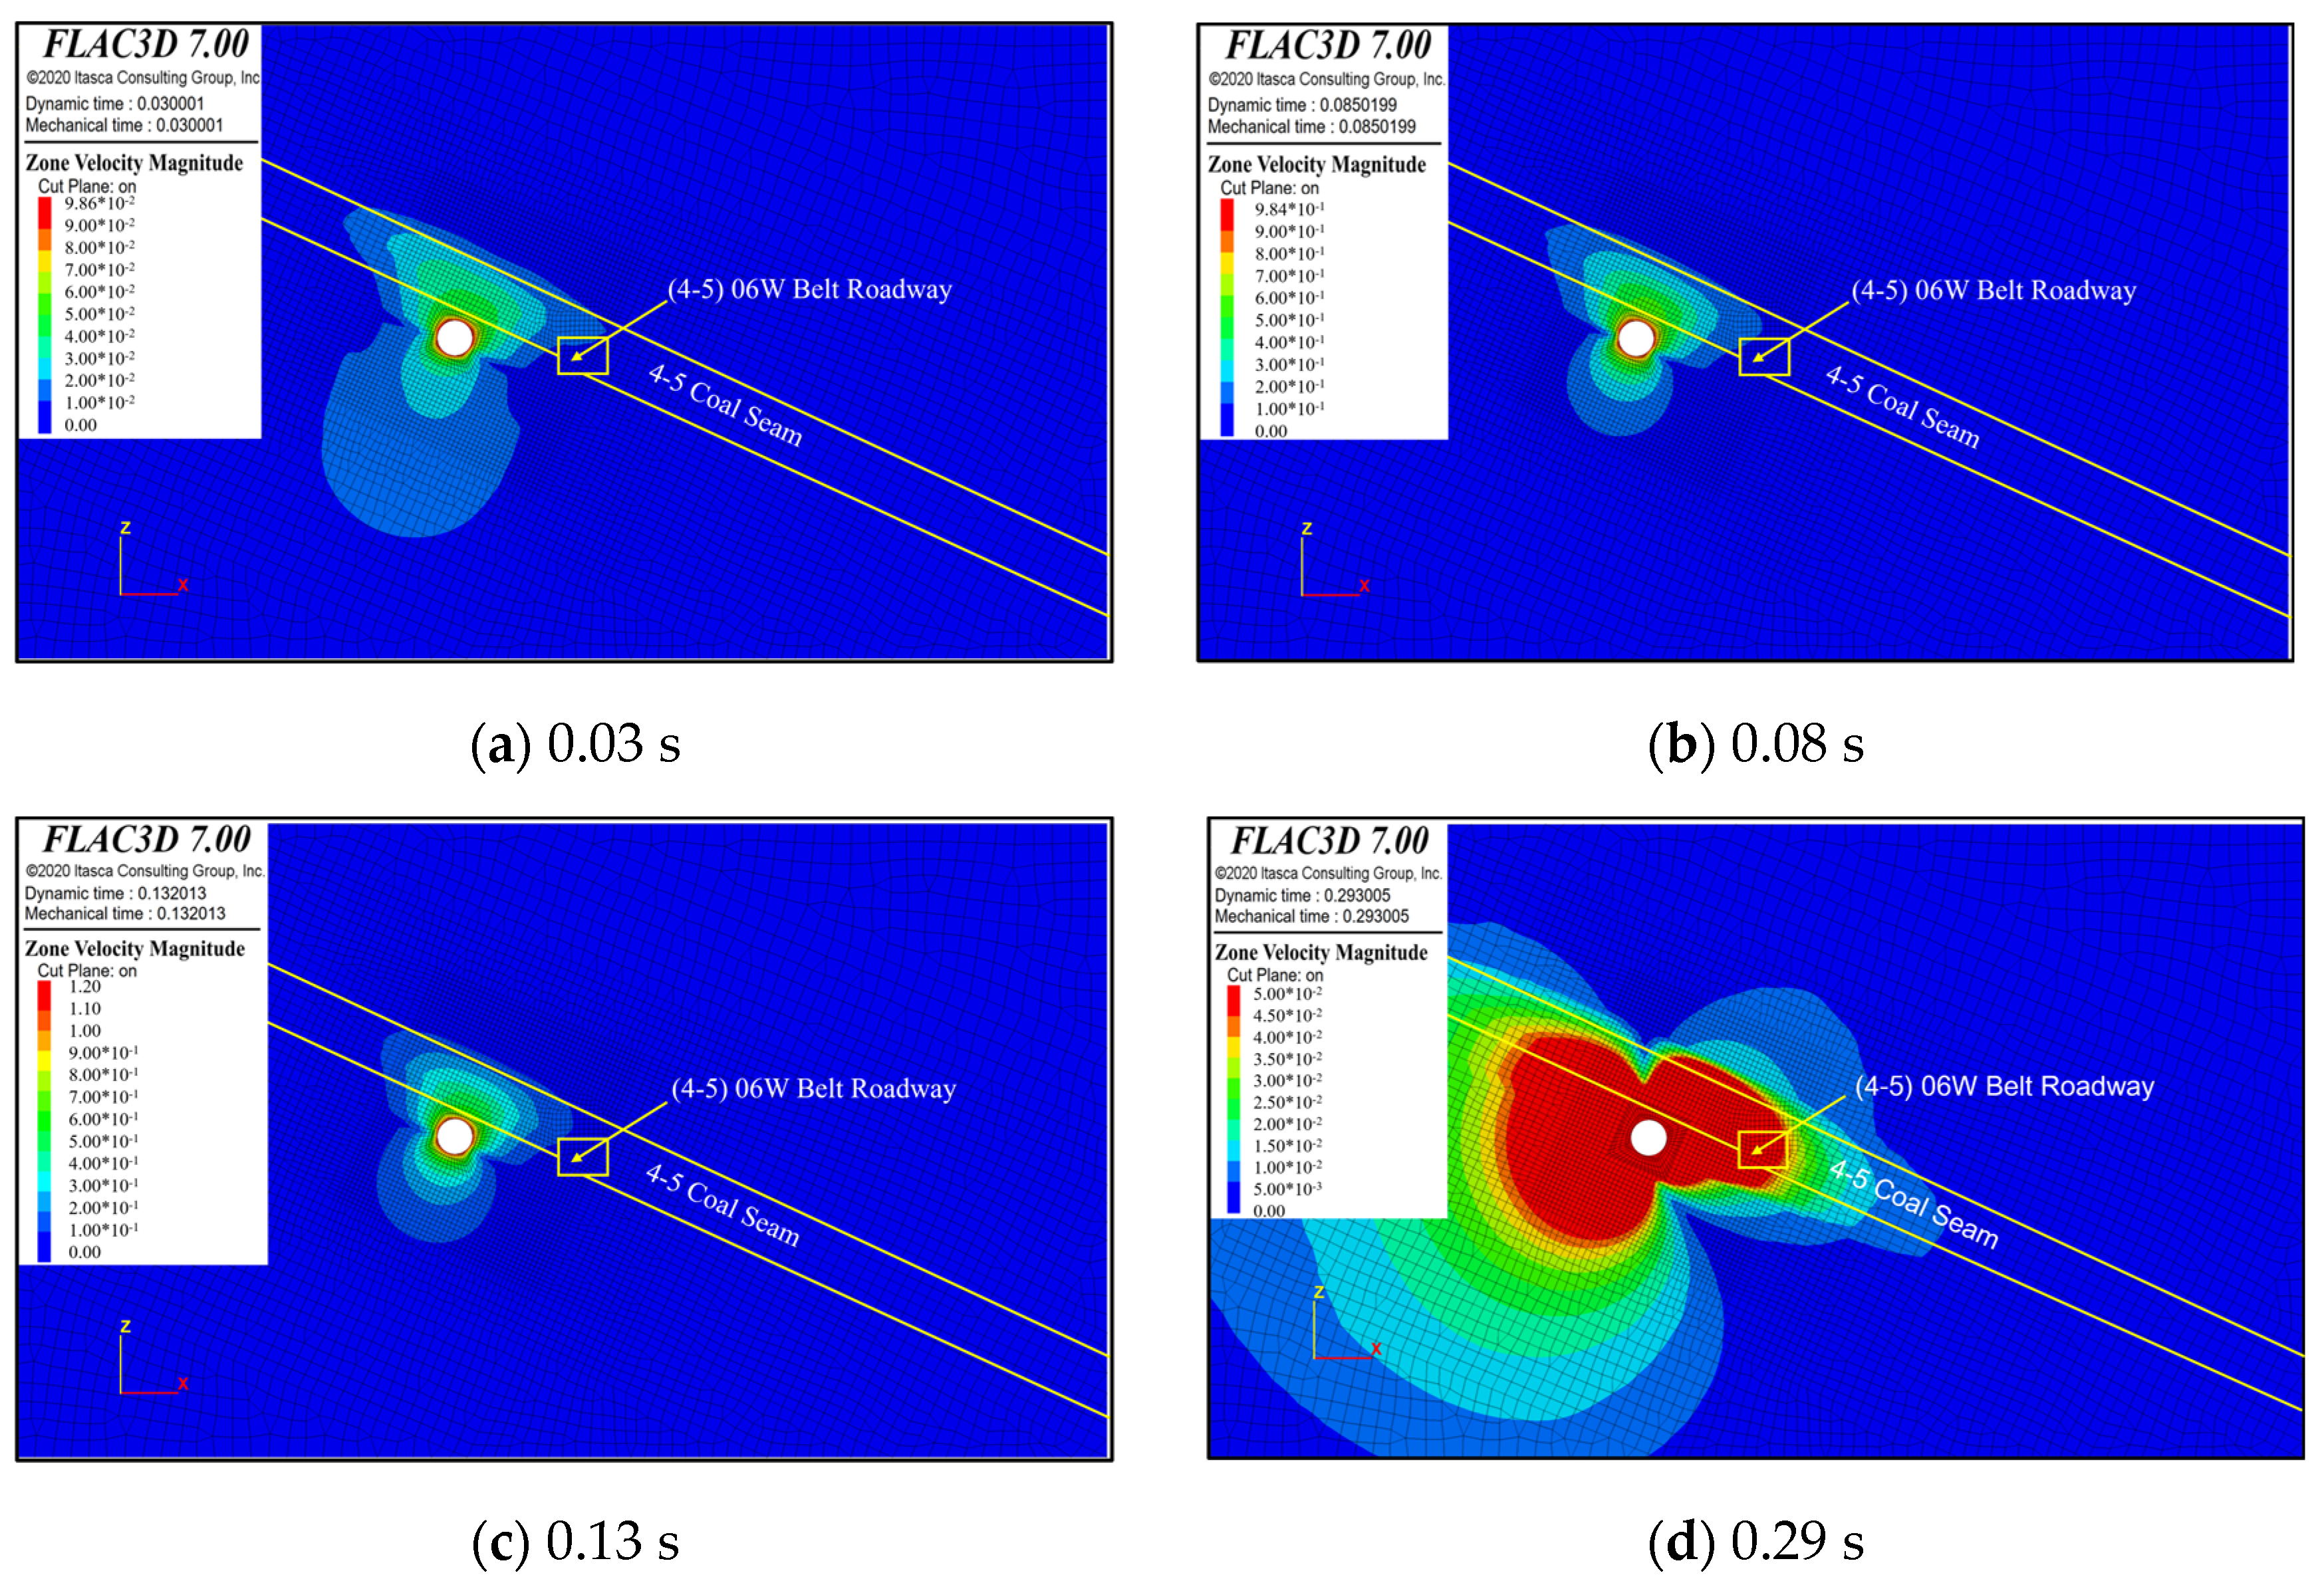
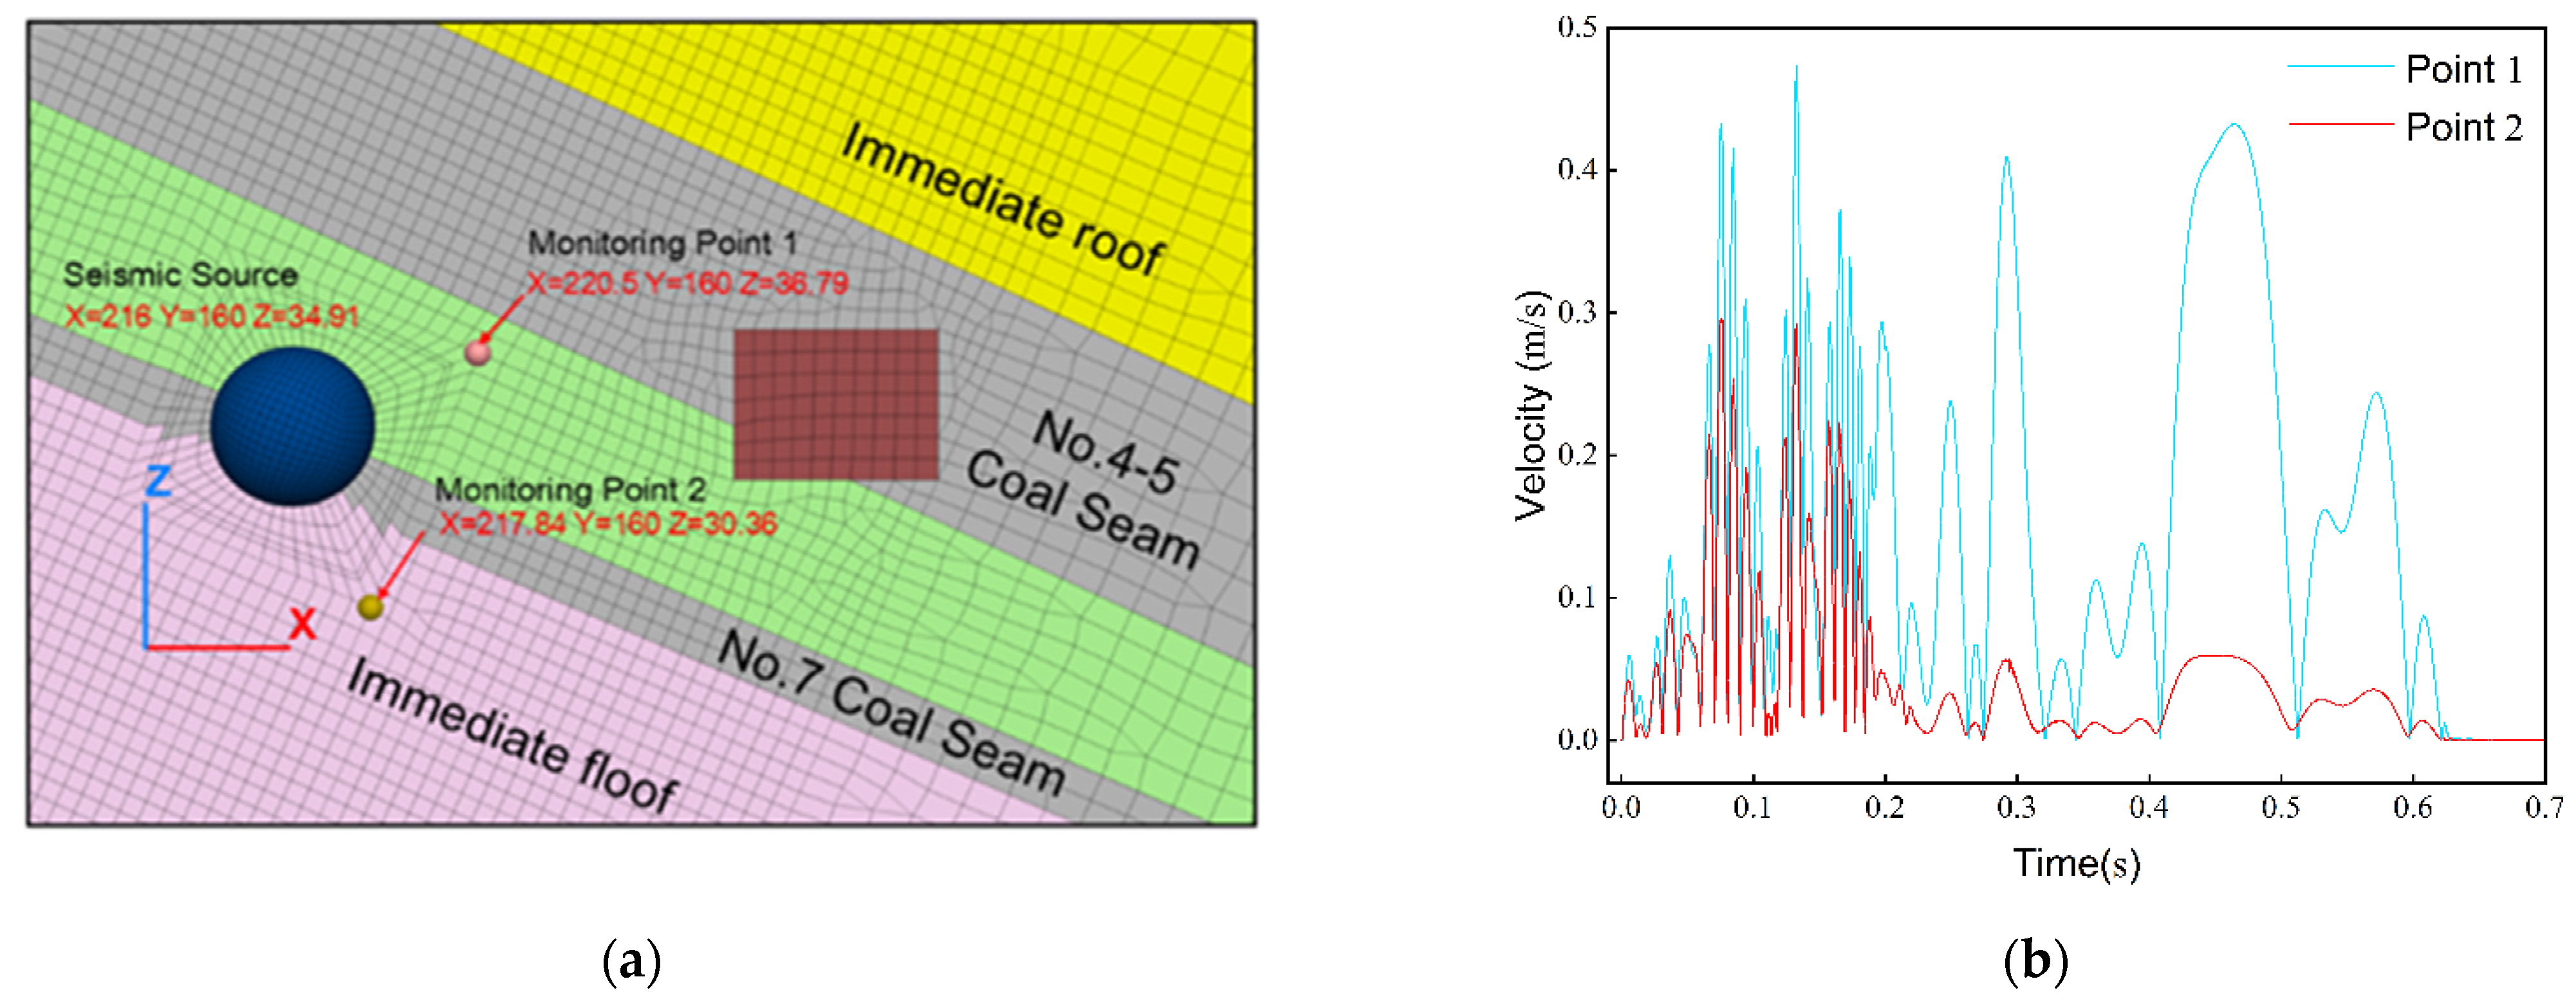
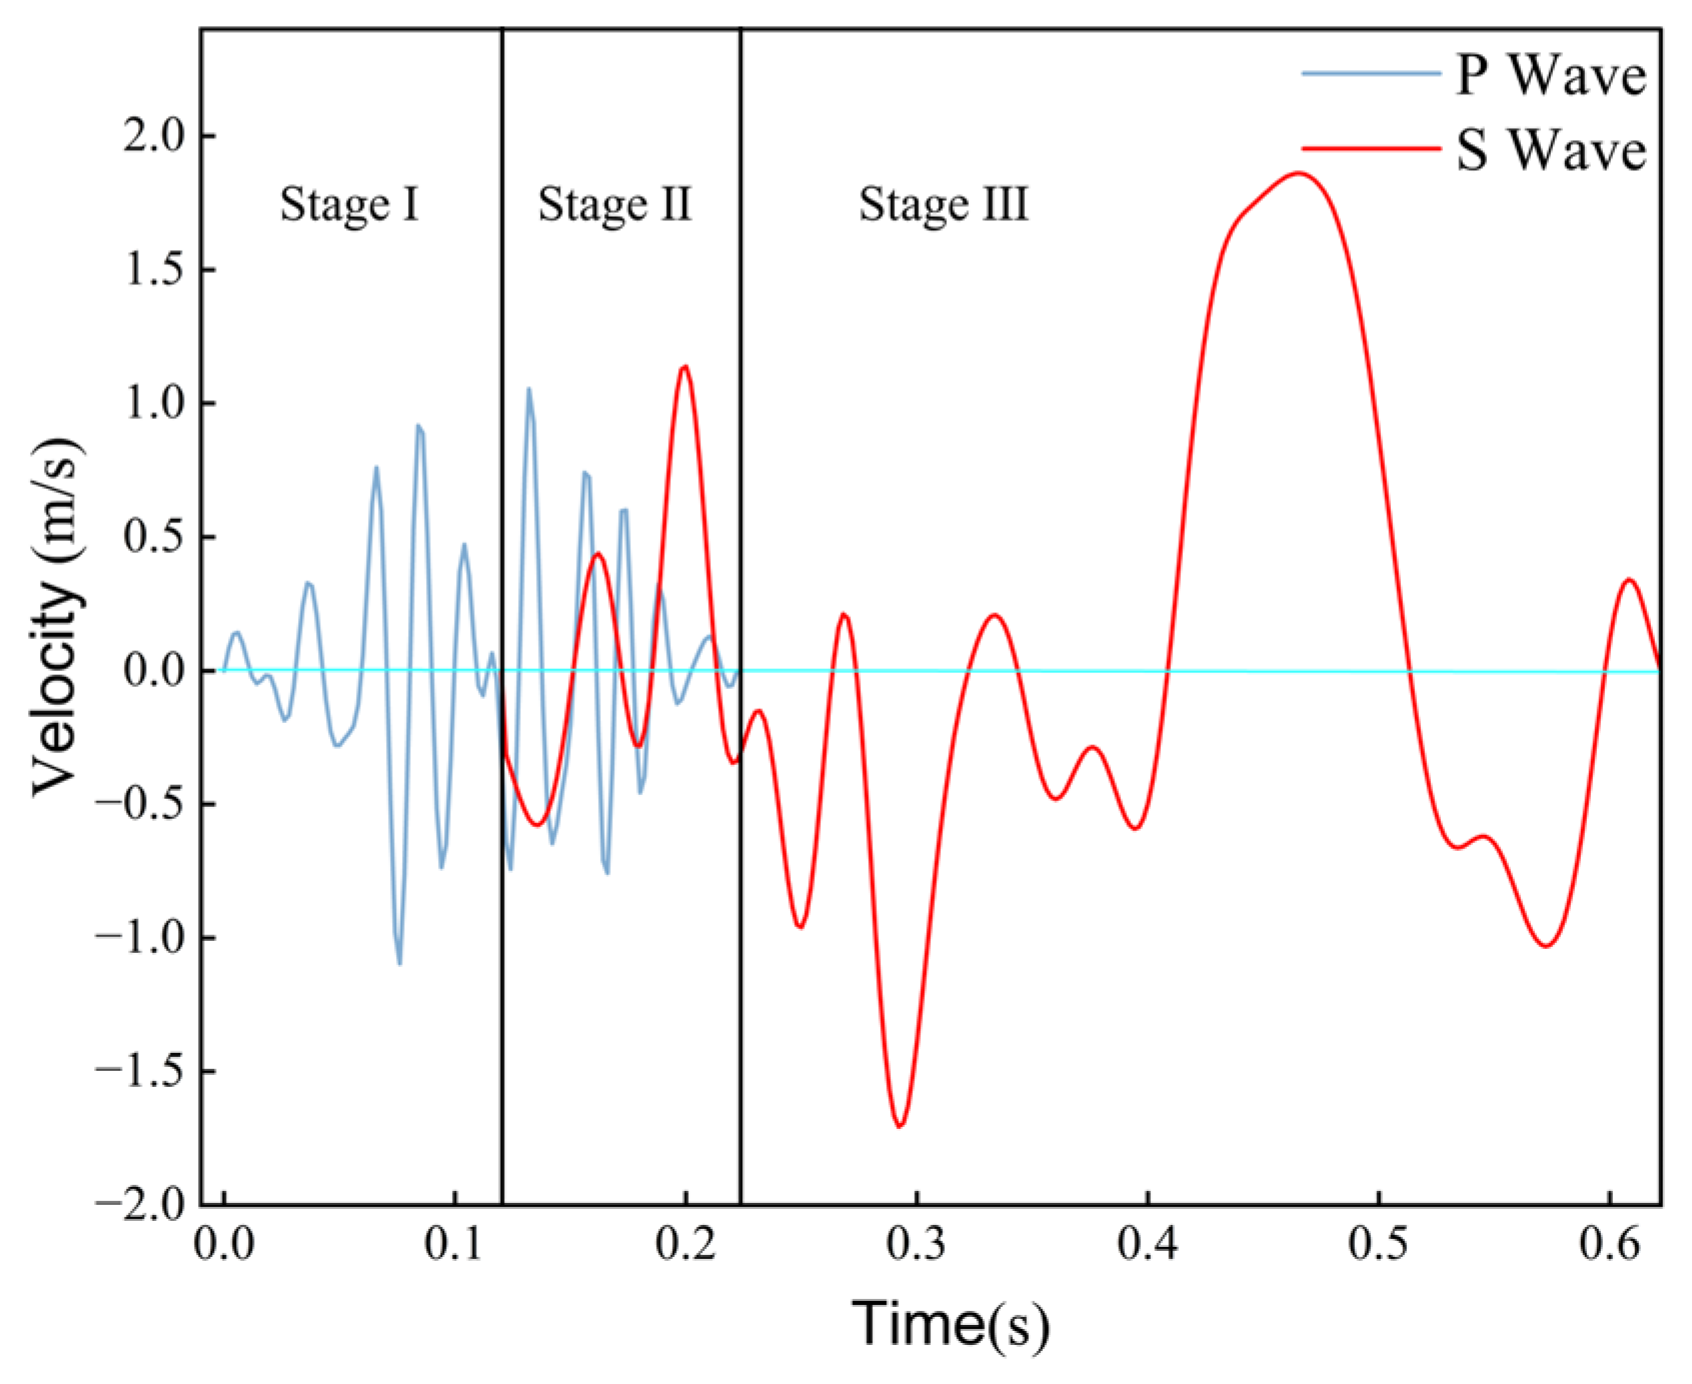
As illustrated in Figure 7, the propagation time for the P-wave is recorded at 0.22 s. Furthermore, the S-wave initiates its propagation 0.12 s subsequent to the onset of the P-wave, with a total duration of 0.501 s. Figure 13 presents the velocity slice diagram for P-waves and S-waves, as obtained from dynamic calculations. This diagram is utilized to examine the attenuation characteristics of vibrational waves across different media. The vibrational wave demonstrates spherical radiation characteristics within a homogeneous medium, indicating that the vibrational energy propagates uniformly in all directions. Monitoring locations have been established at both the direct floor and the foundational floor of the source region, as depicted in Figure 14a. Figure 14b presents the velocity time history curves for the two measurement points. It is apparent from the figure that the overall vibration patterns at both locations exhibit similarities, with the primary distinction being the amplitude of the vibrations.
As demonstrated in Figure 14b, both measurement points display identical peak directions and timings of vibration; however, the recorded amplitudes differ. This variation may be ascribed to the differing geological contexts of measurement points 1 and 2, which likely result in varying degrees of attenuation of the vibrational waves during their propagation. Specifically, as the seismic wave passes through the No. 7 coal seam on its way to measurement point 2, phenomena of partial transmission and reflection occur, leading to a substantial reduction in the energy of the seismic wave. In the process of vibration wave propagation, the degree of attenuation of velocity and energy is influenced by the density, elastic modulus, and porosity of the rock. Hard rock exhibits a strong propagation capability due to its high density and elastic modulus. In contrast, coal seams possess low density and elastic modulus, coupled with high porosity, which results in rapid attenuation of vibration waves and a limited influence range. As illustrated in Figure 13d and Figure 14b, the disparity between the two measurement points during the propagation of S-waves shows a significant increase. This observation indicates that S-waves undergo greater attenuation than P-waves, especially in the context of weak rock strata, as well as in relation to transmission and reflection phenomena.

5.2. Response Characteristics of Roadway-Anchored Surrounding Rock

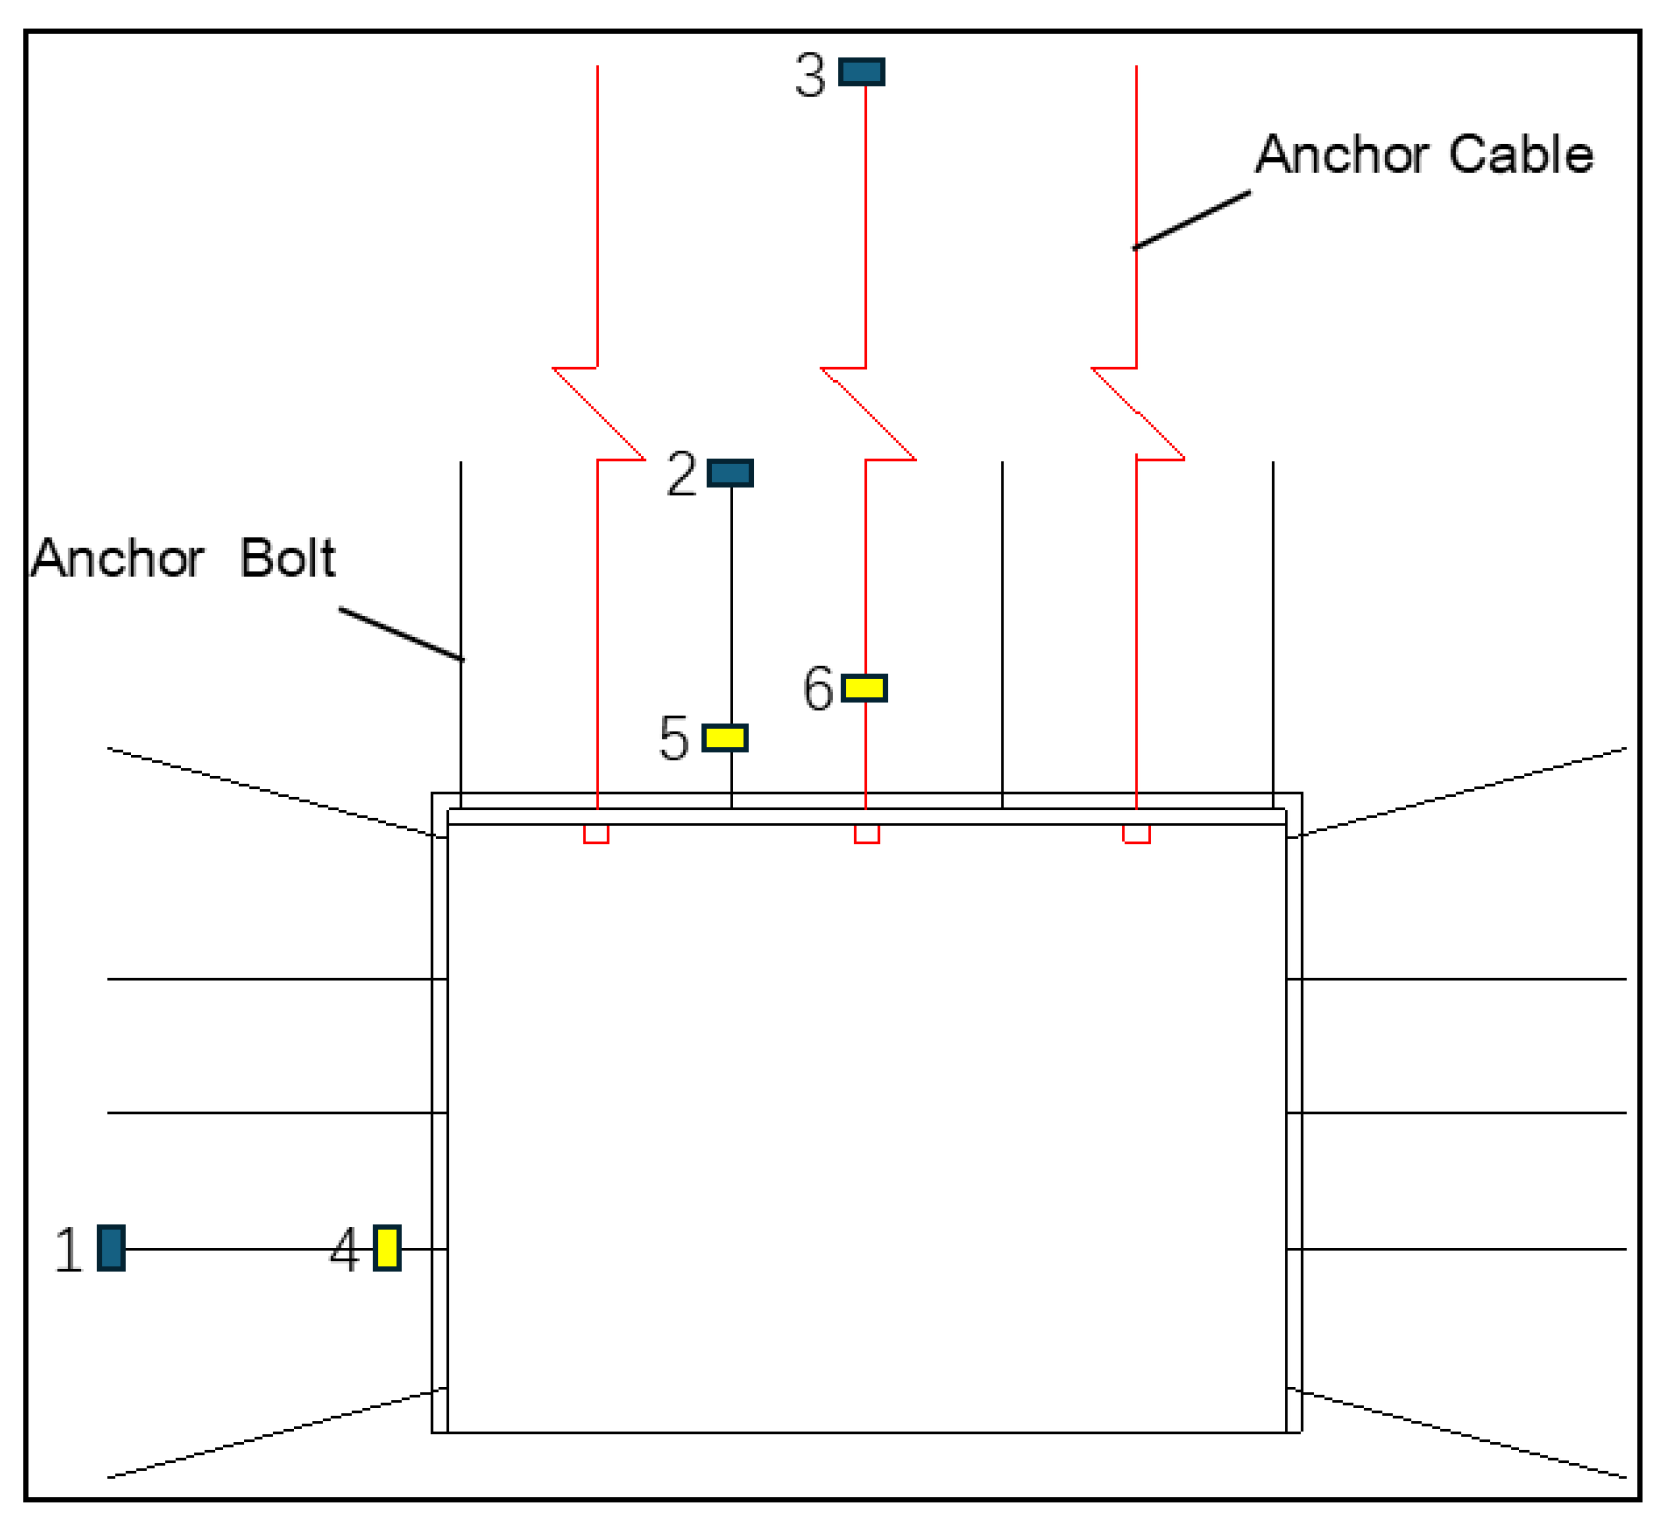
In order to analyze the influence of vibration waves on the surrounding rock around the anchorage, measuring points for velocity, stress, and displacement are arranged at the anchorage of the left-side bolt, the top anchor cable, and the top bolt of the roadway. Additionally, the variation range of the surrounding rock in the anchorage section is monitored. Axial force and displacement measurement points are positioned at the free end of the bolt and anchor cable, as illustrated in Figure 15. According to the input curve of the P-wave and S-wave, it is divided into the following three stages, as shown in Figure 16. The time velocity monitoring curve of each measuring point is shown in Figure 17, Figure 18 and Figure 19.
Stage I (0~0.12 s): This stage is characterized by the activity of P-waves. During this interval, the surrounding anchored rock undergoes damage exclusively due to the tension and compression effects generated by the P-waves. Stage II (0.12~0.23 s): At this stage, both the P-waves and S-waves exert their influence on the surrounding anchored rock. Following 0.19 s, the energy of the P-waves begins to diminish, resulting in a progressive reduction in amplitude. Stage III (0.23~0.7 s): This stage involves the action of S-waves. Research conducted by Kaiser et al. [19] indicates that only low-frequency waves with long wavelengths can cause damage to rock masses. Consequently, the response characteristics of low-frequency, high-energy S-waves on the anchored surrounding rock are analyzed.

5.2.1. Response Characteristics of Rock at the Anchorage End

(1)
Anchorage end of left-side anchor bolt
Stage I (0~0.12 s): During the initial phase of P-wave propagation, the variations in vibration velocity at the measurement point are minimal, the stress values remain constant, and the displacement approaches zero. This observation indicates that the surrounding rock is not significantly affected by the dynamic load and is in a state of static compression. When the amplitude of the P-wave vibration hits its initial peak, it results in significant vibrations in the surrounding rock of the anchorage area. The maximum velocity in the horizontal direction is measured at 0.16 m/s, whereas in the vertical direction, it is recorded at 0.02 m/s. The tension and compression experienced in the horizontal direction, as a consequence of the P-wave, resulted in periodic fluctuations in stress within a limited range. The horizontal displacement demonstrates a pattern of periodic migration, whereas the range of vertical displacement is not clearly discernible. This shows that the anchored surrounding rock is in the elastic response stage at this time; no plastic deformation occurs, and the surrounding rock can be restored to the initial state.
Stage II (0.12~0.23 s): The simultaneous propagation of P-waves and S-waves leads to a significant increase in both the frequency and amplitude of vibrational velocity in horizontal and vertical directions. Between 0.12 s and 0.19 s, the horizontal vibrations primarily induced by the P-wave remain elevated. After 0.19 s, the horizontal vibration velocity associated with the P-wave begins to progressively diminish, while the horizontal displacement approaches a state of stability. During this period, the energy of the P-wave gradually decays. At this time, the energy of the S-wave is low, and the monitored amplitude is primarily generated by the P-wave. After 0.19 s, the vertical velocity caused by the S-wave began to exhibit high-frequency vibrations, and the vertical displacement showed an increasing trend during this phase.
Stage III (0.23~0.7 s): The low-frequency, high-energy S-wave peak nodes occur at 0.29 s and 0.46 s. During these intervals, the horizontal vibration velocity of the surrounding rock experiences two substantial increases, while the vibration frequency of the vertical velocity exhibits a significant rise. The shear failure caused by low-frequency, high-energy S-waves within the rock mass leads to an increase in horizontal stress from 3 MPa to 11.5 MPa, a displacement increase of 5.5 mm, and a trend towards stabilization after 0.62 s. Due to the direct floor located beneath the measuring point of the side bolt, the range of vertical stress fluctuations caused by the low-frequency, high-energy S-wave is minimal, resulting in a vertical displacement increase of 2.2 mm.
(2)
Roof anchor bolt anchorage end
Stage I (0~0.12 s): The propagation of the vibrational wave through the roadway floor and the 4-5 coal seam to the monitoring point is characterized by low wave impedance in the coal seam, resulting in a rapid decay of energy during transmission. Consequently, the peak particle vibration velocity induced by the vibrational wave is lower than that observed in the surrounding rock on the left side of the roadway. The transmission and reflection effects of vibrational waves across different media currently lead to variations in vibration velocity in both horizontal and vertical directions. These fluctuations, however, tend to stabilize over time. Upon reaching the initial peak of the P-wave vibration interval, a rapid change in horizontal vibration velocity occurs, characterized by an amplitude range of 1.2 m/s. At this point, the variations in stress and displacement induced by the P-wave, in conjunction with the vibration velocity, demonstrate a high degree of synchronization. This observation indicates that the surrounding rock maintains a stable stress condition, with no significant damage or instability apparent.
Stage II (0.12~0.23 s): Between 0.12 and 0.19 s, the velocity, stress, and displacement measurements at roadway points exhibit a periodic vibration pattern as a collective response to the influence of vibrational waves. After a duration of 0.19 s, the overall changes in vibration amplitude, stress, and displacement induced by the vibrational wave demonstrate a tendency to decrease. However, the vibration frequency associated with the S-wave is significantly higher than that associated with the P-wave, as illustrated in Figure 18.
Stage III (0.23~0.7 s): At the low-frequency and high-energy vibration nodes occurring at 0.29 s and 0.46 s, two S-waves are detected. The vibration frequency of the surrounding rock of the roof induced by these S-waves is significantly higher than that observed during the initial two stages. Simultaneously, the horizontal stress demonstrated a rapid increase from 3.8 MPa to 5.1 MPa. The horizontal displacement exhibits an initial trend of rapid increase, followed by a subsequent rapid decrease. This phenomenon occurs when the surface of the roadway is influenced by vibrational waves, resulting in a net horizontal displacement away from the originating source. Subsequently, due to tectonic stress, this horizontal displacement undergoes a rebound effect. The vertical stress exhibits a periodic upward trend, and the vibration amplitude is linearly correlated with the vertical particle vibration velocity. The vertical displacement of the roof increases linearly at a rate of 0.5 mm/s, with the direction oriented towards the roadway.
(3)
Roof anchor cable anchorage end
Stage I (0~0.12 s): The monitoring points are located within the surrounding roof rock mass adjacent to the anchorage end of the upper anchor cable. The vibration wave first travels through the direct bottom and the 4-5 coal seam before reaching the anchor cable measurement point, which is situated on the direct roof. s depicted in Figure 19, the vibration velocity measured at the designated point is considerably lower than that of the upper bolt. At this stage, the variations in particle vibration velocity, displacement, and stress induced by the P-wave demonstrate a high degree of synchronization, with their phases being predominantly congruent. During the initial peak phase of the P-wave, a significant increase in the amplitude of the vibration velocity is observed at the measurement point. As depicted in Figure 19b, the horizontal displacement demonstrates a gradual overall decrease.
Stage II (0.12~0.23 s): At this juncture, the horizontal and vertical stresses, as well as the displacement at the measurement location, exhibit synchronous changes in relation to the vibration velocity at that point, with their phases being nearly congruent. Following a duration of 0.19 s, the particle vibration velocity commenced a gradual stabilization.
Stage III (0.23~0.7 s): At the low-frequency, high-energy vibration node of the two S-waves, the response at the measuring point induced by the S-wave is minimal due to the significant attenuation of the S-wave. The horizontal stress decreases by 0.15 MPa, while the vertical stress increases by 0.6 MPa. The immediate roof is less affected by tectonic stress, resulting in horizontal displacement that does not exhibit a downward trend. In contrast, the vertical displacement demonstrates a linear increasing trend, with an increment of 0.3 mm/s, directed towards the roadway.

5.2.2. Axial Force Response Characteristics of Anchor Bolt and Anchor Cable

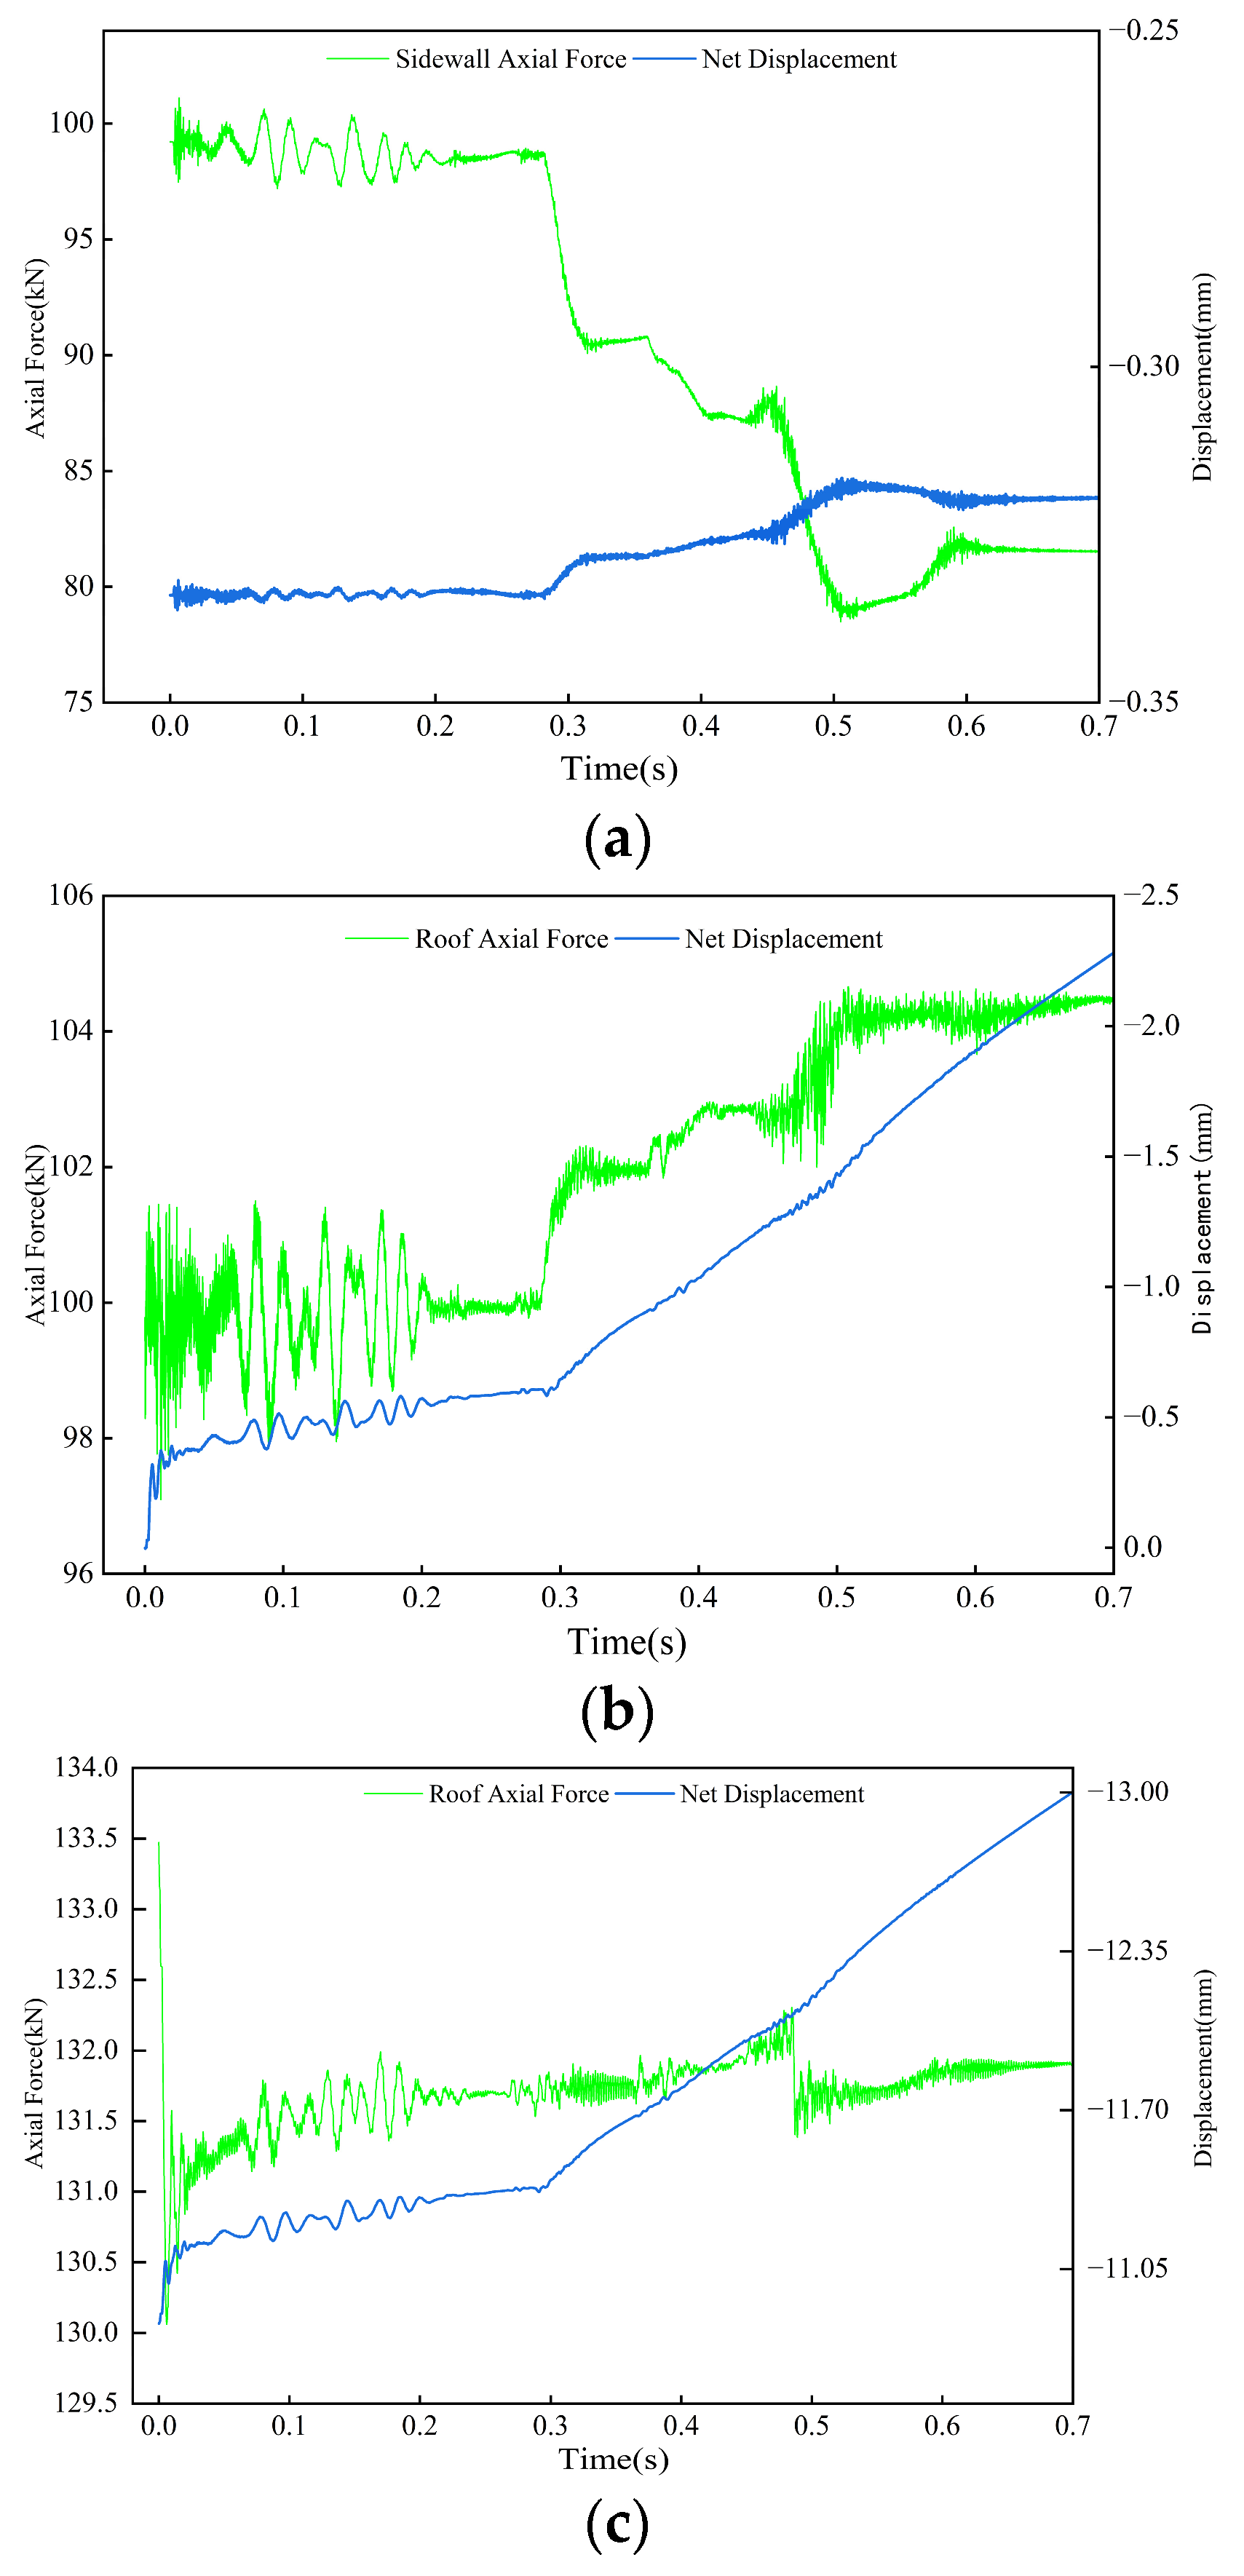
In order to analyze the variation law of the axial force of the bolt and anchor cable under the action of the vibration wave, the axial force measuring points at the free end of the bolt and anchor cable in the roadway are analyzed from three stages of vibration wave action, and the monitoring curve is shown in Figure 20.
Stage I (0~0.12 s): Before the commencement of the vibration wave, the axial forces recorded for the anchor rod, the upper anchor rod, and the upper anchor cable on the left side of the roadway were 101 kN, 99 kN, and 133 kN, respectively. It is noteworthy that the axial force of the anchor cable has reached the specified value associated with the initial preload. In the initial phase, the axial force undergoes a rapid variation due to the influence of the P-wave on the anchor cable, as depicted in Figure 15. This axial force demonstrates a pronounced vibrational response before gradually evolving into a stage characterized by a stable vibrational response. The axial force and displacement of the left-side bolt demonstrate a comparable frequency vibration pattern. The axial force of the roof bolt fluctuates within a range of ±2.2 kN, whereas the net displacement of the left-side bolt tends toward zero. Furthermore, the axial force of the roof anchor cable undergoes a sudden reduction prior to entering a stable vibration phase. The displacement of the roof bolt (cable) shows a rapid increase during the initial phase; subsequently, both the displacement and axial force exhibit vibrations at the same frequency.
Stage II (0.12~0.23 s): This phase is characterized by a combination of wave actions. Prior to 0.19 s, the P-wave is predominant, and both the axial force and displacement at the measurement point display a synchronous frequency vibration pattern. Following a duration of 0.19 s, a significant increase in the frequency of axial force fluctuations induced by S-waves is observed. During this interval, the displacement recorded at each measurement point demonstrates minimal vibration, indicating that the roadway support system remains intact and undamaged at this stage.
Stage III (0.23~0.7 s): During the initial interval characterized by high-frequency, low-energy S-wave action, the axial force applied to the side bolt undergoes a rapid reduction to 90 kN due to the influence of the high-frequency shear force. Concurrently, the increase in displacement remains negligible. The second interval of high-frequency and low-energy S-wave action leads to a reduction in the axial force of the left-side bolt to 77 kN, accompanied by a 23% decrease in the pre-tightening force. This observation suggests that the left-side bolt experiences shear failure due to the influence of low-frequency and high-energy S-waves. During this phase, the axial force of the roof anchor bolt demonstrated two notable increases, ascending from 99 kN to 104 kN, while the horizontal displacement increased from 2.1 mm to 2.9 mm. The transmission of the vibrational wave to the measurement point of the roof anchor cable occurs after it passes through the 4-5 coal seam, leading to a gradual attenuation of the S-wave energy. As a result, the impact on the roof anchor cable is minimal. The variation in axial force remains limited, with an overall displacement increase recorded at 2 mm. In the initial phase, the vibration wave generates a corresponding vibration within the roadway support system, thereby aiding in the restoration of stability. Throughout this period, the roadway support system maintains its operational functionality. Following the third stage, alterations in high-frequency vibrations and axial forces are observed in both the bolt and anchor cable. Notably, a reduction in the axial force of the side bolt is recorded, which coincides with an increase in the linear displacement of the roof support structure. It can be concluded that the anchorage performance of roadway anchorage systems deteriorates as a result of the influence of low-frequency, high-energy S-waves.

5.3. Response Characteristics of Roadway Surrounding Rock

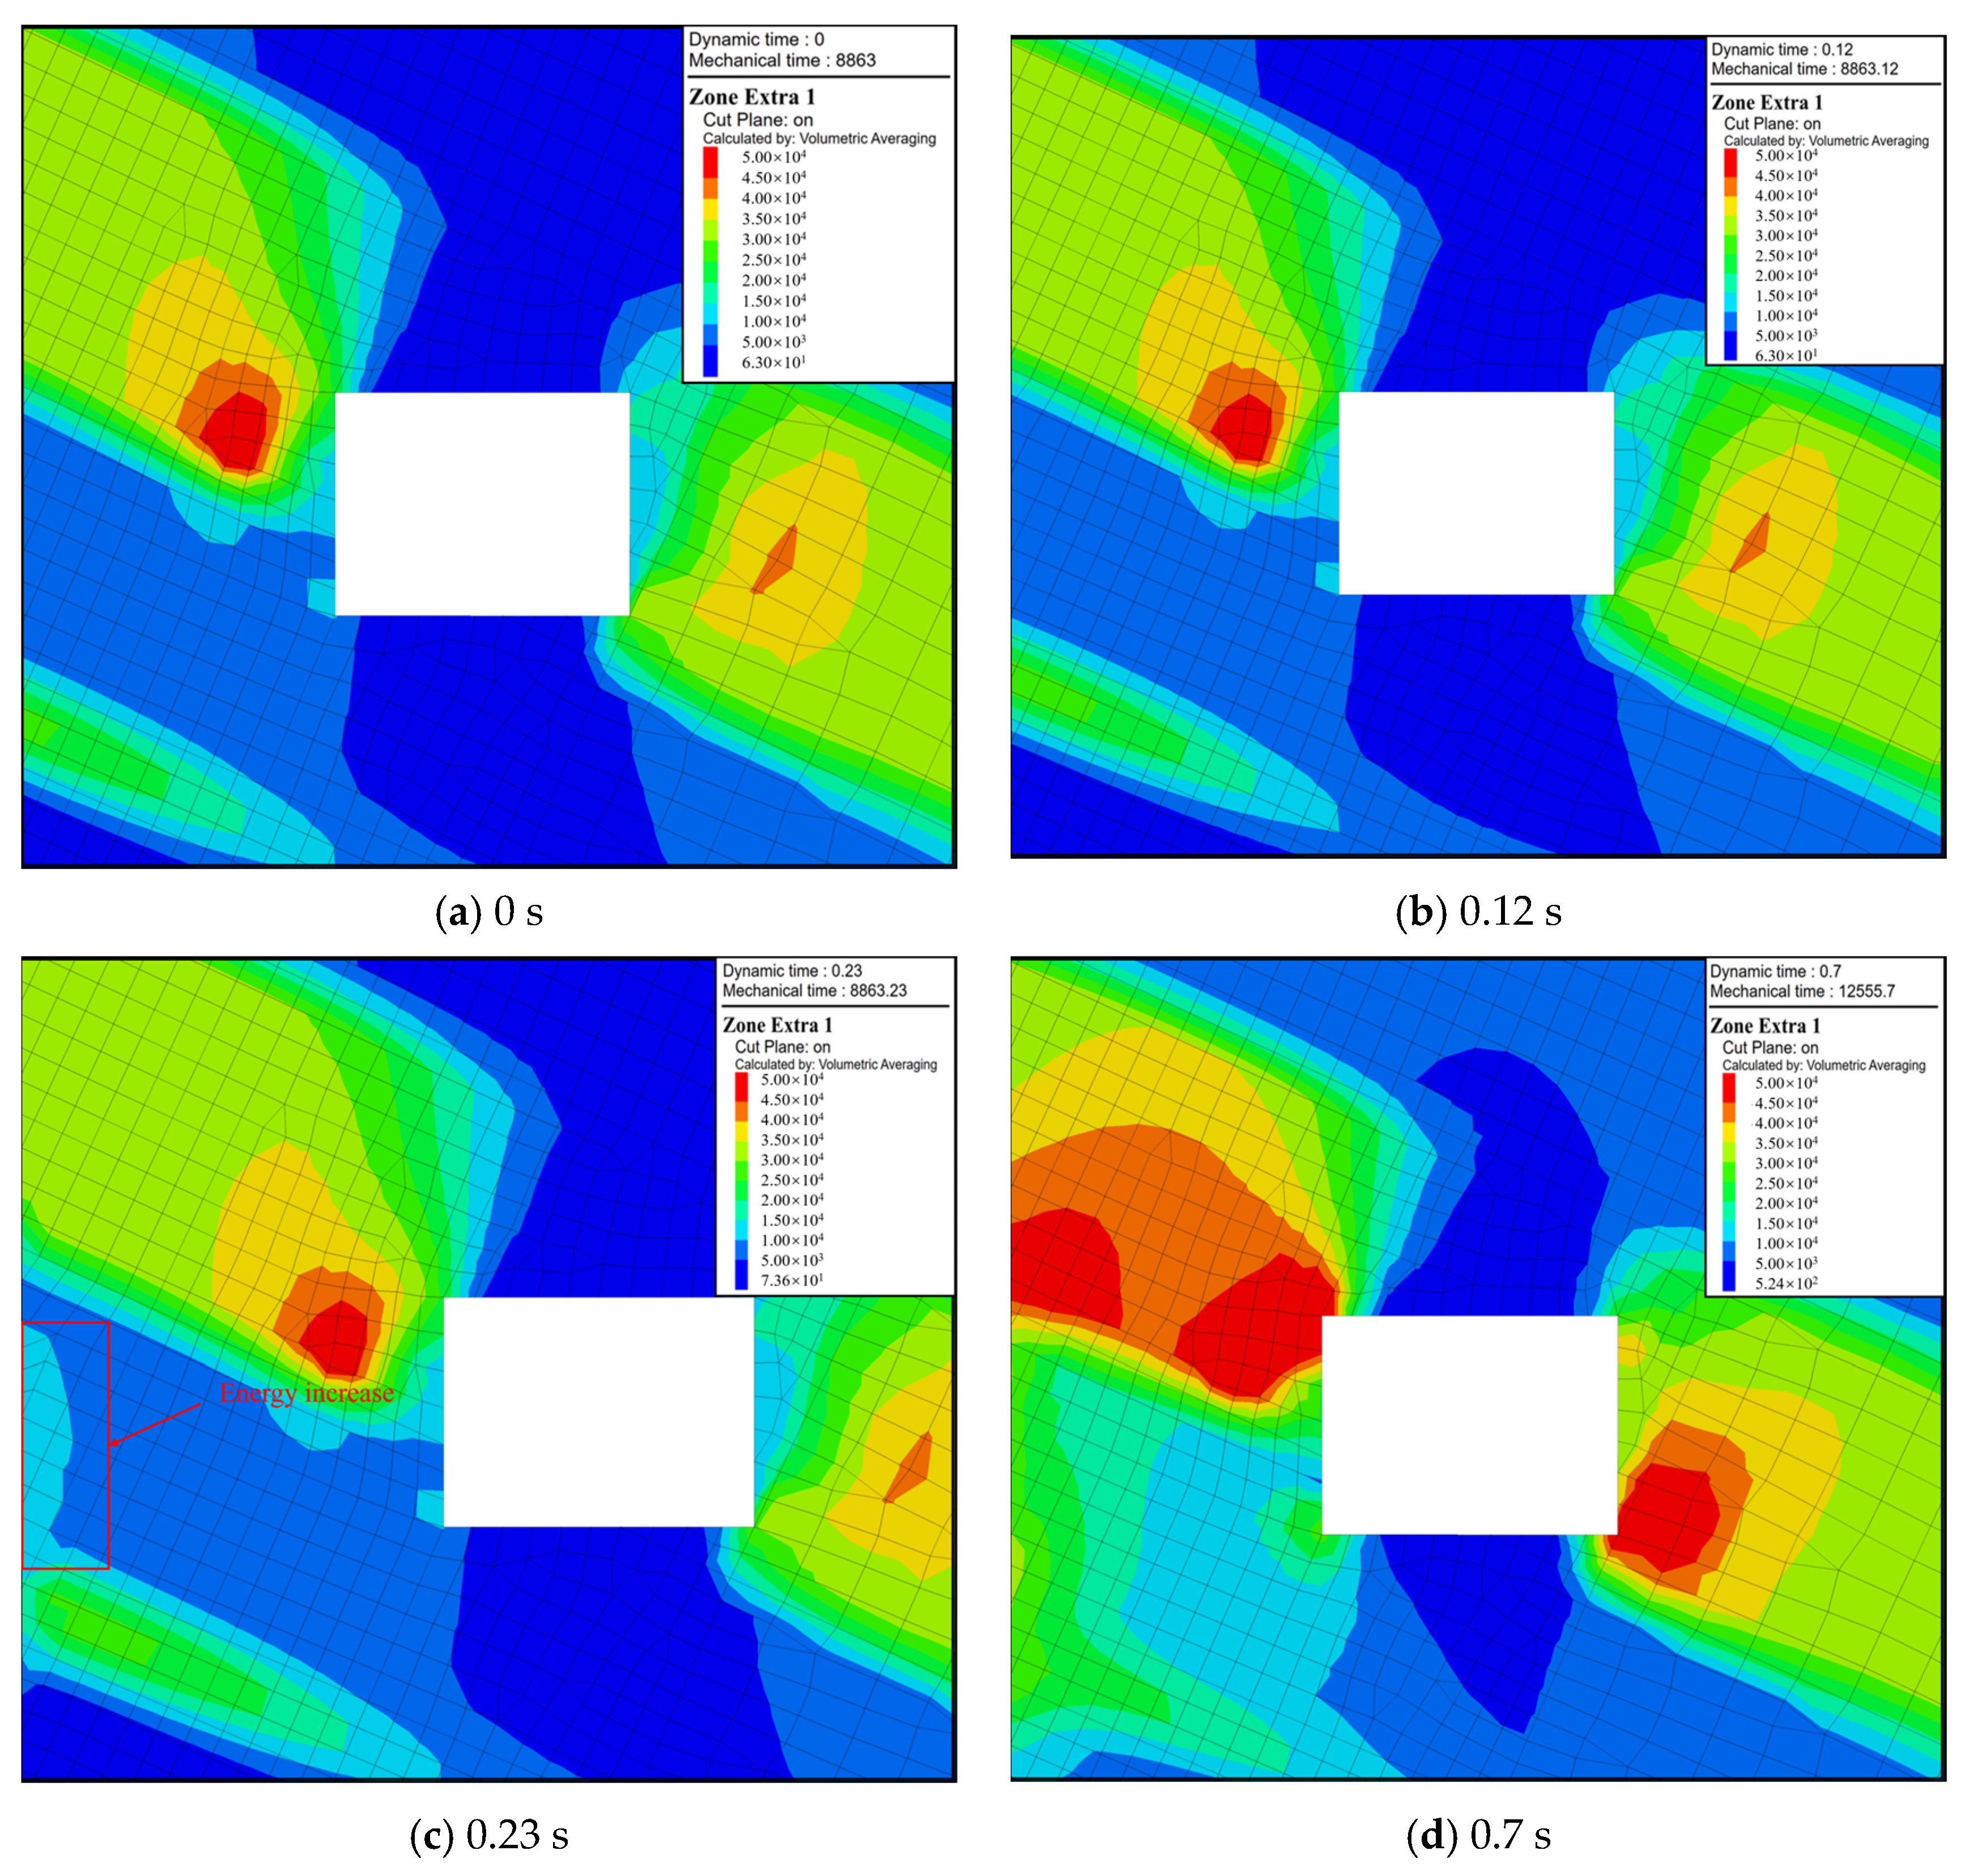
The distribution of elastic strain energy before and after the application of vibrational waves is analyzed using the impact instability energy assessment methodology. Figure 21 illustrates the distribution of elastic strain energy that has accumulated around the roadway at various time intervals. As depicted in Figure 21a, prior to the application of vibrational waves, the elastic energy is primarily concentrated within the coal seams adjacent to the roadway. Notably, the accumulation of energy in the upper section of the left side of the roadway is approximately 5 × 10⁵ J, which signifies a greater concentration in comparison to the right side. Additionally, the volume of the area demonstrating this concentration is relatively larger, leading to an increased energy density. This is consistent with previous research [26], which indicates that the elastic energy of coal and rock masses primarily accumulates on both sides of the roadway. At 0.12 s, the distribution of elastic energy in the vicinity of the roadway is largely comparable to that observed in the absence of the vibrational wave. This observation indicates that the P-wave has not yet exerted a significant influence on the surrounding roadway, which remains in a stable condition. At 0.23 s, the elastic energy on the left side of the roadway increased by approximately 1.5 × 10⁴ J, accompanied by a minimal overall growth rate. Simultaneously, there was no notable increase in the area of elastic energy available for release around the roadway. As illustrated in Figure 21d, following the application of low-frequency, high-energy S-waves, there is a notable enhancement in both the range and amplitude of elastic energy on the left side of the roadway. Additionally, a significant accumulation of energy is observed in the upper region of the left side of the roadway, as well as at the bottom angle of the right side of the roadway. Due to the placement of the seismic source on the left side of the roadway, the area of concentrated high elastic performance extends over a larger region, approaching the boundary of the roadway. As a result, there is a substantial increase in the accumulation of elastic energy in the coal surrounding the roadway.
As illustrated in Figure 22, the excavation process has led to the formation of a plastic zone around the roadway, which exhibits an approximately ellipsoidal shape. Notably, the severity of the plastic zone is more pronounced in the upper regions on both the left and right sides. When a vibrational wave is applied for a duration of 0.12 s, the P-wave, which primarily induces tensile and compressive failure, has not yet produced a corresponding plastic failure zone in the vicinity of the source. During the interval from 0.12 to 0.23 s, a slight degree of plastic deformation was observed to commence in the vicinity of the source, attributable to the influence of S-wave shear. During the time interval from 0.23 to 0.7 s, the impact of two low-frequency, high-energy S-waves led to a significant incidence of shear failure in the vicinity of the source. This observation suggests that low-frequency, high-energy S-waves play a crucial role in inducing shear failure within the roadway. Importantly, when the energy levels are sufficiently high, the shear effects result in a widespread area of plastic failure.
It can be seen from Figure 23 that after the action of the vibration wave, a large-scale horizontal stress concentration area appears on the left side of the roadway, which extends from the upper part of the roadway to the bottom angle of the left side. A significant concentration of stress is observed in the vertical direction on the left side of the roadway, particularly at the lower left corner. The horizontal and vertical stress values at this location are measured at 22 MPa and 20 MPa, respectively, which are approaching the failure threshold of the surrounding rock mass. This finding indicates an increased risk of instability in the lower left corner of the roadway.
According to Figure 24a, at 0.7 s, the upper half of both sides of the roadway exhibited significant displacement. The direction indicated by the arrow represents the displacement direction of the surrounding rock. The maximum net displacement on the upper side of the left side was 21.2 mm, while the maximum net displacement of the right side as a whole was 10.1 mm. As illustrated in Figure 24b, the application of the vibration wave results in a general downward displacement of the roadway roof. This displacement exhibits an increasing trend with depth into the roadway, reaching a maximum vertical displacement of 23.1 mm. The findings from the calculations regarding the minimum energy required for the destruction of 4-5 coal, as assessed through the impact instability energy evaluation I have modified the picture method, reveal that a substantial amount of elastic energy, exceeding the energy necessary for coal destruction, was detected in the upper section of the left side of the roadway and in the lower corner of the right side. When the accumulated energy exceeds its energy storage limit, the energy is dissipated in the form of plastic deformation of the surrounding rock mass, while the elastic energy of the roof and the upper part of the right side of the roadway is low, and the displacement increment is large. The net displacement of the surrounding rock and the free-end support structure of the roof anchorage section shows a linear increasing trend. Consequently, it can be inferred that a significant portion of the elastic energy within the roadway roof and the right side is dissipated through the plastic deformation of the adjacent rock, resulting in the destabilization of both the roof and the right side. The region of displacement change aligns with the observed failure characteristics at the site.

6. Conclusions

The Mohr–Coulomb constitutive model assumes that the soil is homogeneous. The dynamic numerical model proposed in this paper simulates the dynamic response of near-field seismic waves interacting with the anchored surrounding rock of the roadway. Within a specific range, the rock mass can be approximated as a uniform medium. Consequently, the propagation characteristics of the vibration waves discussed in this paper are applicable solely to the response of the anchored surrounding rock of the roadway induced by near-field vibration waves.
(1)
The weak rock layer demonstrates a significant capacity for energy absorption and attenuation of vibrational waves, particularly affecting the energy absorption and propagation velocity of the S-wave. This interaction results in a notable decrease in the energy of the S-wave during propagation, as well as a reduction in its propagation speed.
(2)
The response phase of anchorage within the surrounding rock of a roadway can be categorized into three distinct stages: the P-wave action stage, the mixed wave action stage, and the S-wave action stage. During the P-wave action stage, the surrounding rock experiences vibrations at a uniform frequency. The stress and displacement recorded at each measurement point exhibit synchronous variations in relation to the vibration velocity, indicating that the overall stability of the surrounding rock is preserved. During the mixed wave action phase, the vibration velocity at the measurement point is predominantly influenced by P-waves, resulting in a tendency for the measurement point to exhibit periodic vibrations at a consistent frequency. The elastic energy within the surrounding rock on the source side of the roadway undergoes significant accumulation due to the influence of the S-wave. This phenomenon results in the creation and subsequent expansion of a stress concentration zone, which is particularly pronounced in the upper region of the left side of the roadway. The low-frequency, high-energy S-waves generate significant horizontal and vertical stress concentration zones on the left side of the roadway, leading to considerable displacement of both sides and the roof structure. The maximum recorded displacement on the left side is 21.2 mm, whereas the maximum vertical displacement of the roof attains a value of 23.1 mm.
(3)
Under the influence of P-waves, the stress, velocity, and displacement of the surrounding rock in the anchorage section demonstrate oscillatory vibration characteristics at a consistent frequency, with no structural failure detected in the anchorage system. Under the influence of low-frequency, high-energy S-waves, the axial force exerted on the bolts surrounding the roadway exhibits rapid fluctuations. Notably, the axial force of the bolt positioned on the side facing the wave experienced a reduction of 23 kN, whereas the axial force of the bolt located at the top demonstrated a significant increase. The significant attenuation of the S-wave during its propagation to the top anchor cable results in negligible variation in the axial force experienced by the top anchor cable. The fluctuations in high-frequency reciprocating vibrations of axial force suggest that the predominant factor contributing to the localized failure of the support system and the instability of the roadway is the influence of low-frequency, high-energy S-waves. The accumulation of high energy, along with the localized stress concentration associated with these low-frequency, high-energy S-waves, significantly intensifies the instability of the surrounding rock.

Author Contributions

H.W., G.Z. and S.W. conceived this article and put forward the overall framework. S.W., H.W. and Y.Y. wrote this study. S.W., Y.Y. and W.G. split and processed the data; H.W., G.Z. and S.W. analyzed the data. All authors contributed to the revision of this article. All authors have read and agreed to the published version of the manuscript.

Funding

This research received no external funding.

Institutional Review Board Statement

Not applicable.

Informed Consent Statement

Not applicable.

Data Availability Statement

The original contributions presented in the study are included in the article. Further inquiries can be directed to the corresponding author.

Conflicts of Interest

The authors declare no conflicts of interest.

References

  1. Qi, Q.; Dou, L. Theory and Technology of Rockburst; China University of Mining and Technology Press: Xuzhou, China, 2008; pp. 32–38. [Google Scholar]
  2. Jiang, Y.D.; Pan, Y.S.; Jiang, F.X.; Dou, L.M.; Ju, Y. State of the art review on mechanism and prevention of coal bumps in China. J. China Coal Soc. 2014, 39, 205–213. [Google Scholar]
  3. Xie, H.; Gao, F.; Ju, Y. Research and development of rock mechanics in deep ground engineering. Chin. J. Rock Mech. Eng. 2015, 34, 2161–2178. [Google Scholar]
  4. Pan, Y.S.; Xiao, Y.H.; Li, Z.H.; Wang, K.X. Study of tunnel support theory of rockburst in coal mine and its application. J. China Coal Soc. 2014, 39, 222–228. [Google Scholar]
  5. Wang, G.; Gong, S.; Dou, L.; Wang, H.; Cai, W.; Cao, A. Rockburst characteristics in syncline regions and microseismic precursors based on energy density clouds. Tunn. Undergr. Space Technol. 2018, 81, 83–93. [Google Scholar] [CrossRef]
  6. Cai, W.; Dou, L.; Zhang, M.; Cao, W.; Shi, J.Q.; Feng, L. A fuzzy comprehensive evaluation methodology for rock burst forecasting using microseismic monitoring. Tunn. Undergr. Space Technol. 2018, 80, 232–245. [Google Scholar] [CrossRef]
  7. Qi, Q.; Pan, Y.; Shu, L.; Li, H.; Jiang, D.; Zhao, S.; Li, H. Theory and technical framework of prevention and control with different sources in multiscales for coal and rock dynamic disasters in deep mining of coal mines. J. China Coal Soc. 2018, 43, 1801–1810. [Google Scholar]
  8. Wang, Z.; Dou, L.; Wang, G. Failuer mechanism of anchored bolts supporting structure of circular roadway under dynamic load. Chin. J. Geotech. Eng. 2015, 37, 1901–1909. [Google Scholar]
  9. Wang, Z.; Dou, L.; Wang, G.; He, J.; Hu, J. Failure mechanism of anchored roadway surrounding rocks under near-field dynamic disturbance. KSCE J. Civ. Eng. 2024, 28, 2454–2468. [Google Scholar] [CrossRef]
  10. Jing, H.; Yin, Q.; Zhu, D. Experimental study on the whole process of instability and failure of anchorage structure in surrounding rock of deep-buried roadway. J. China Coal Soc. 2020, 45, 889–901. [Google Scholar]
  11. Liu, Y.; Zhu, S.; Zhang, X.; Wang, X.; Li, Z.; Zhou, J.; Zhang, B.; Wang, G. Study on mechanism of pressure relief failure of bottom coal induced by strong vibration in driving face of thick coal seam. J. Min. Strata Control Eng. 2024, 6, 053021. [Google Scholar]
  12. Chang, J.; Qi, C.; Yin, Z. Propagation and failure characteristics of stress wave of full anchor solid under dynamic load. J. China Coal Soc. 2023, 48, 1996–2007. [Google Scholar]
  13. Wu, Y.Z.; Chen, J.Y.; Jiao, J.K.; Zheng, Y.; He, J. Damage and failure mechanism of anchored surrounding rock with impact loading. J. China Coal Soc. 2018, 43, 2389–2397. [Google Scholar]
  14. Wu, Y.; Fu, Y.; He, S.; Li, J.; Jiao, J. Characteristics of deformation and failure of surrounding rock in roadway under strong impact load and control technology. Coal Sci. Tech. 2024, 52, 76–87. [Google Scholar]
  15. Jiao, J.; Ju, W. Burst failure mechanism of roadway anchorage bearing structure under dynamic load disturbance. J. China Coal Soc. 2021, 46, 94–105. [Google Scholar]
  16. Gao, M.; Xu, D.; Wang, H.; Yu, X.; Liu, R. Shock failure mechanism of roadway in extra thick coal seam and full anchor cable support technology. J. China Coal Soc. 2023, 48, 1943–1956. [Google Scholar]
  17. Durrheim, R.J. Functional specifications for in-stope support based on seismic and rockburst observations in South African mines. In Proceedings of the Sixth International Seminar on Deep and High Stress Mining, Australian Centre for Geomechanics, Perth, Australia, 28–30 March 2012. [Google Scholar]
  18. Mcgarr, A. Scaling of ground motion parameters, state of stress, and focal depth. J. Geophys. Res. 1984, 89, 6969–6979. [Google Scholar] [CrossRef]
  19. Zhao, C.; Dawson, E. Applications of Maxwell Damping for Time Domain Seismic Analyses. In Geo-Congress 2022: Geophysical and Earthquake Engineering and Soil Dynamics; ASCE: Reston, VA, USA, 2022. [Google Scholar] [CrossRef]
  20. Flandrin, P.; Rilling, G.; Goncalves, P. Empirical mode decomposition as a filter bank. IEEE Signal Process Lett. 2004, 11, 112–114. [Google Scholar] [CrossRef]
  21. Daubechies, I.; Lu, J.; Wu, H. Synchro squeezed wavelet transforms: An empirical mode decomposition-like tool. Appl. Comput. Harmon. Anal. 2011, 30, 243–261. [Google Scholar] [CrossRef]
  22. Li, Z. The design of Butterworth Lowpass filter based on MATLAB. Inf. Technol. 2003, 27, 49–50+52. [Google Scholar]
  23. Kaiser, P.K.; Maloney, S.M. Scaling laws for the design of rock support. Pure Appl. Geophys. 1997, 150, 415–434. [Google Scholar] [CrossRef]
  24. Kuhlemeyer, R.L.; Lysmer, J. Finite element method accuracy for wave propagation problems. J. Soil Mech. Found. Div. 1973, 99, 421–427. [Google Scholar] [CrossRef]
  25. Aki, K.; Richards, P.G. Quantitative Seismology; University Science Books: Sausalito, CA, USA, 2002. [Google Scholar]
  26. Cao, A. Research on seismic effort of burst and failure of coal-rock mass associated with mining and its application. J. China Coal Soc. 2011, 36, 177–178. [Google Scholar]
  27. Li, Z.; Dai, R.; Jiang, Y. Improvement of the generation of the initial stress field by using FLAC3D and application in a huge underground cavern group. Chin. J. Rock Mech. Eng. 2002, 21, 2387–2392. [Google Scholar]
  28. Raffaldi, M.J.; Loken, M.C. Rock mass modeling approach for simulating wave propagation, rock fracture, and rock ejection. In Proceedings of the 50th US Rock Mechanics Symposium, American Rock Mechanics Association, Alexandria, WV, USA, 26–29 June 2016. [Google Scholar]
  29. Xie, H.P.; Ju, Y.; Li, L.Y.; Peng, R.D. Energy mechanism of deformation and failure of rock masses. Chin. J. Rock Mech. Eng. 2008, 27, 1729–1740. [Google Scholar]
  30. Wang, M.; Song, Z.; Zheng, D.; Shen, W.; Gou, P.; Wei, S. Development and application of rock energy dissipation model in FLAC3D. J. China Coal Soc. 2021, 46, 2565–2573. [Google Scholar]
  31. Pan, J.F.; Ning, Y.; Mao, D.B.; Lan, H.; Du, T.T.; Peng, Y.W. Theory of rockburst start-up during coal mining. Chin. J. Rock Mech. Eng. 2012, 31, 586–596. [Google Scholar]
  32. Zhao, Y.; Wan, Z.; Feng, Z. Least energy priciple of dynamical failure of rock mass. Chin. J. Rock Mech. Eng. 2003, 22, 1781–1783. [Google Scholar]
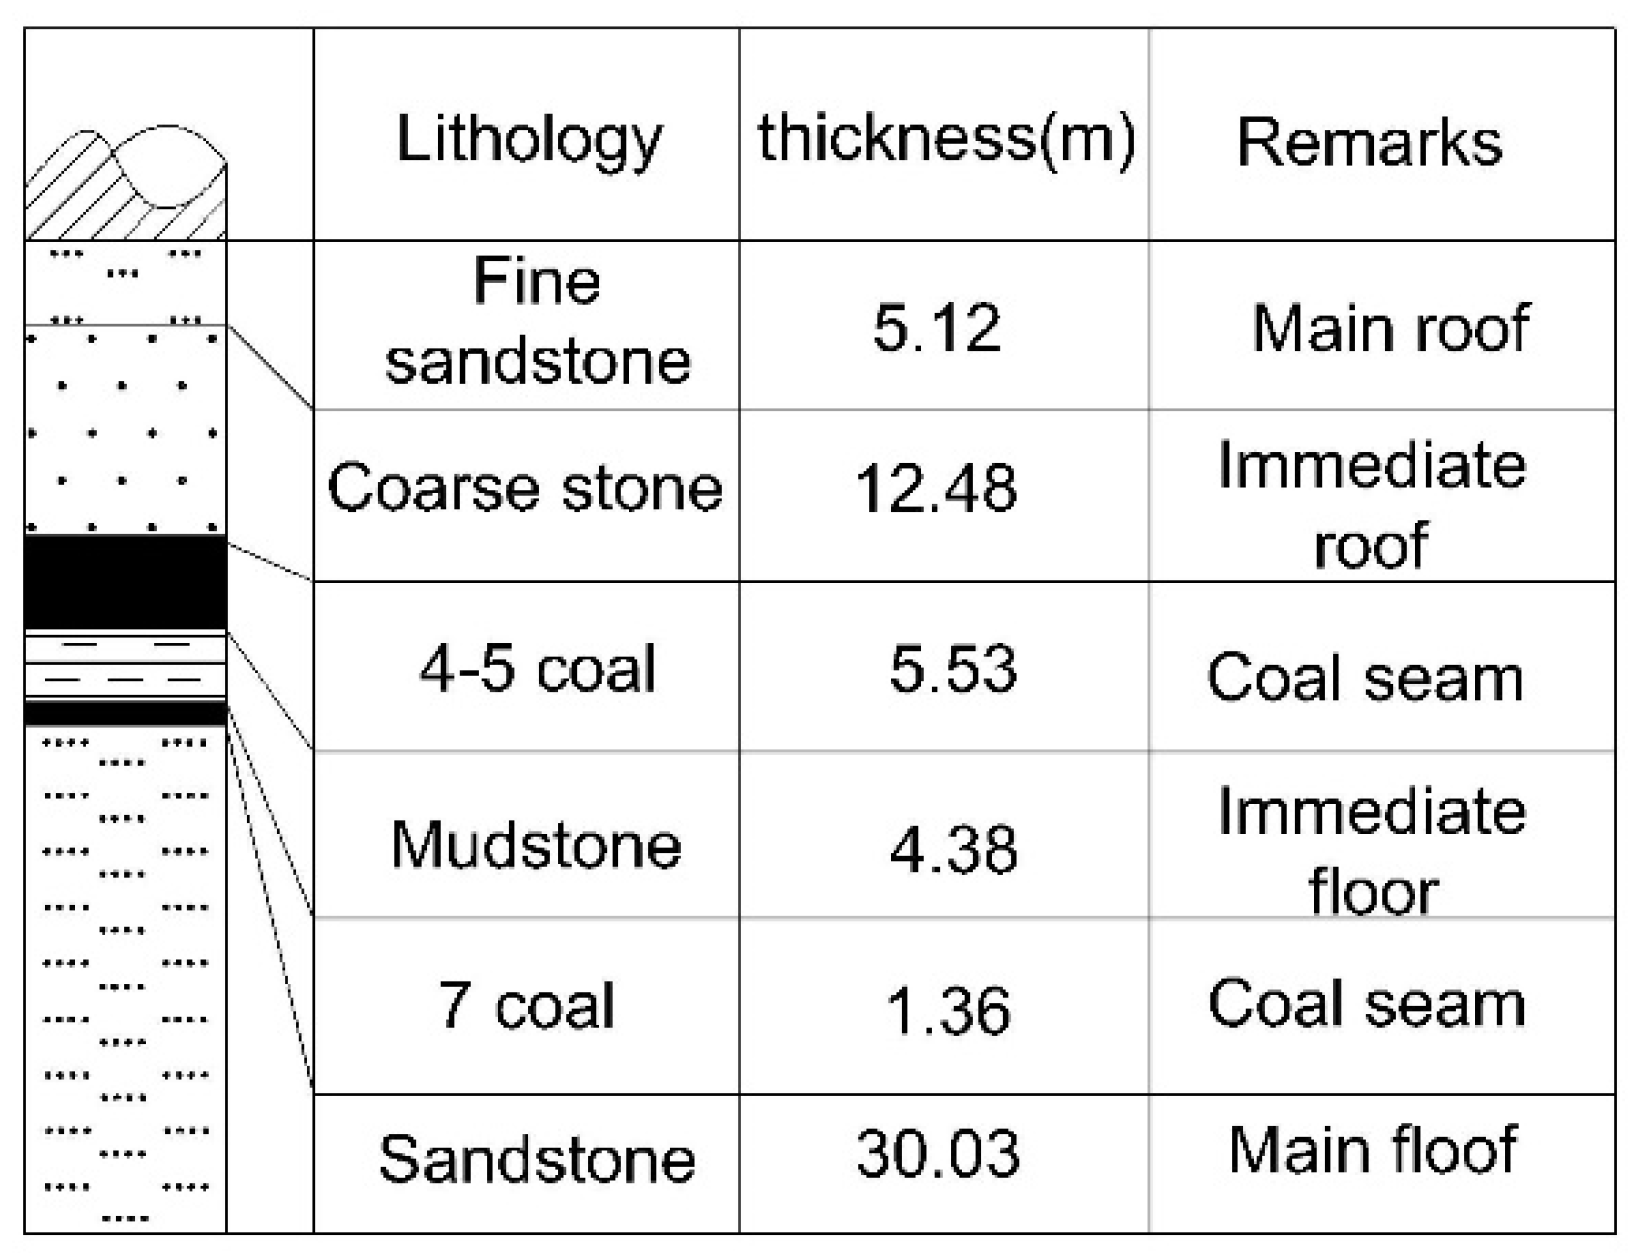
Figure 1. Geological profile.
Applsci 14 11266 g001
Figure 2. Support scheme of headentry.
Applsci 14 11266 g002
Figure 3. Microseismic energy distribution map.
Applsci 14 11266 g003
Figure 4. Deformation and failure characteristics of roadway: (a) roof settlement; (b) roadway spalling; (c) bottom drum phenomenon.
Applsci 14 11266 g004
Figure 5. Vibrating wave velocity curve: (a) V0(t) is the particle vibration velocity measured at the sensor; (b) V1(t) is the calculated particle vibration velocity, and V 1 ( t ) is the calibrated particle vibration velocity.
Applsci 14 11266 g005
Figure 6. Time-frequency domain diagram.
Applsci 14 11266 g006
Figure 7. Vibration wave velocity curve pre- and post-filtering: (a) P-wave; (b) S-wave.
Applsci 14 11266 g007
Figure 8. Numerical model.
Applsci 14 11266 g008
Figure 9. Velocity diagram for different source radii.
Applsci 14 11266 g009
Figure 10. Numerical model geometry.
Applsci 14 11266 g010
Figure 11. Arrangement of seismic sources and anchor.
Applsci 14 11266 g011
Figure 12. Boundary conditions at the source.
Applsci 14 11266 g012
Figure 13. Propagation law diagram of vibrational waves in different media: (a) is the 0.03 s propagation diagram; (b) is the 0.08 s propagation diagram; (c) is the 0.13 s propagation diagram; (d) is the 0.29 s propagation diagram.
Applsci 14 11266 g013
Figure 14. Position and curve of the measuring point: (a) measurement point position; (b) speed–time curve.
Applsci 14 11266 g014
Figure 15. Arrangement of measuring points: 1—measuring point of the left-side anchor bolt surrounding rock; 2—roof anchor bolt surrounding rock measuring point; 3—roof anchor cable surrounding rock measuring point; 4—left-side anchor bolt axial force measurement point; 5—roof anchor bolt axial force measurement point; and 6—roof anchor cable axial force measurement point.
Applsci 14 11266 g015
Figure 16. Diagram of vibrating wave velocity.
Applsci 14 11266 g016
Figure 17. The velocity, stress, and displacement curves of the left-side anchor bolt anchoring surrounding rock: (a) horizontal direction; (b) vertical direction.
Applsci 14 11266 g017
Figure 18. Velocity, stress, and displacement curves of roof anchor bolt anchoring surrounding rock: (a) horizontal direction; (b) vertical direction.
Applsci 14 11266 g018
Figure 19. Velocity, stress, and displacement curves of roof anchor cable anchoring surrounding rock: (a) horizontal direction; (b) vertical direction.
Applsci 14 11266 g019
Figure 20. Dynamic curve of axial force-displacement of surrounding rock: (a) left-side anchor bolt; (b) roof anchor bolt; (c) roof anchor cable.
Applsci 14 11266 g020
Figure 21. Elastic energy stress nephogram (J): (a) is the elastic energy diagram at 0 s; (b) is the elastic energy diagram at 0.12 s; (c) is the elastic energy diagram at 0.23 s; (d) is the elastic energy diagram at 0.7 s.
Applsci 14 11266 g021
Figure 22. Variation diagram of the plastic zone of surrounding rock.
Applsci 14 11266 g022
Figure 23. The 0.7 s stress nephogram (Pa): (a) horizontal stress; (b) vertical stresses.
Applsci 14 11266 g023
Figure 24. The 0.7 s displacement cloud map and vector distribution map (m): (a) horizontal displacement; (b) vertical displacement.
Applsci 14 11266 g024
Table 1. Geomechanical material properties.
LithologyElastic Modulus
(GPa)
Poisson RatioInternal Friction Angle (°)Cohesion
(MPa)
Tensile Strength
(MPa)
Sandstone14.00.3638.0612.603.28
Mudstone12.360.2438.3619.695.24
Fine sandstone15.550.2946.8211.837.95
Coarse sandstone20.550.2135.9412.66.3
NO. 4-5 coal seam2.560.2424.002.41.34
Mudstone11.700.2436.618.763.56
NO. 7 coal seam2.560.2424.002.41.34
Sandstone30.730.2841.2112.66.84
Coarse sandstone16.210.4146.8211.837.95
Disclaimer/Publisher’s Note: The statements, opinions and data contained in all publications are solely those of the individual author(s) and contributor(s) and not of MDPI and/or the editor(s). MDPI and/or the editor(s) disclaim responsibility for any injury to people or property resulting from any ideas, methods, instructions or products referred to in the content.