
Quantitative Analysis of Caffeine in Roasted Coffee: A Comparison of Brewing Methods


Abstract
1. Introduction
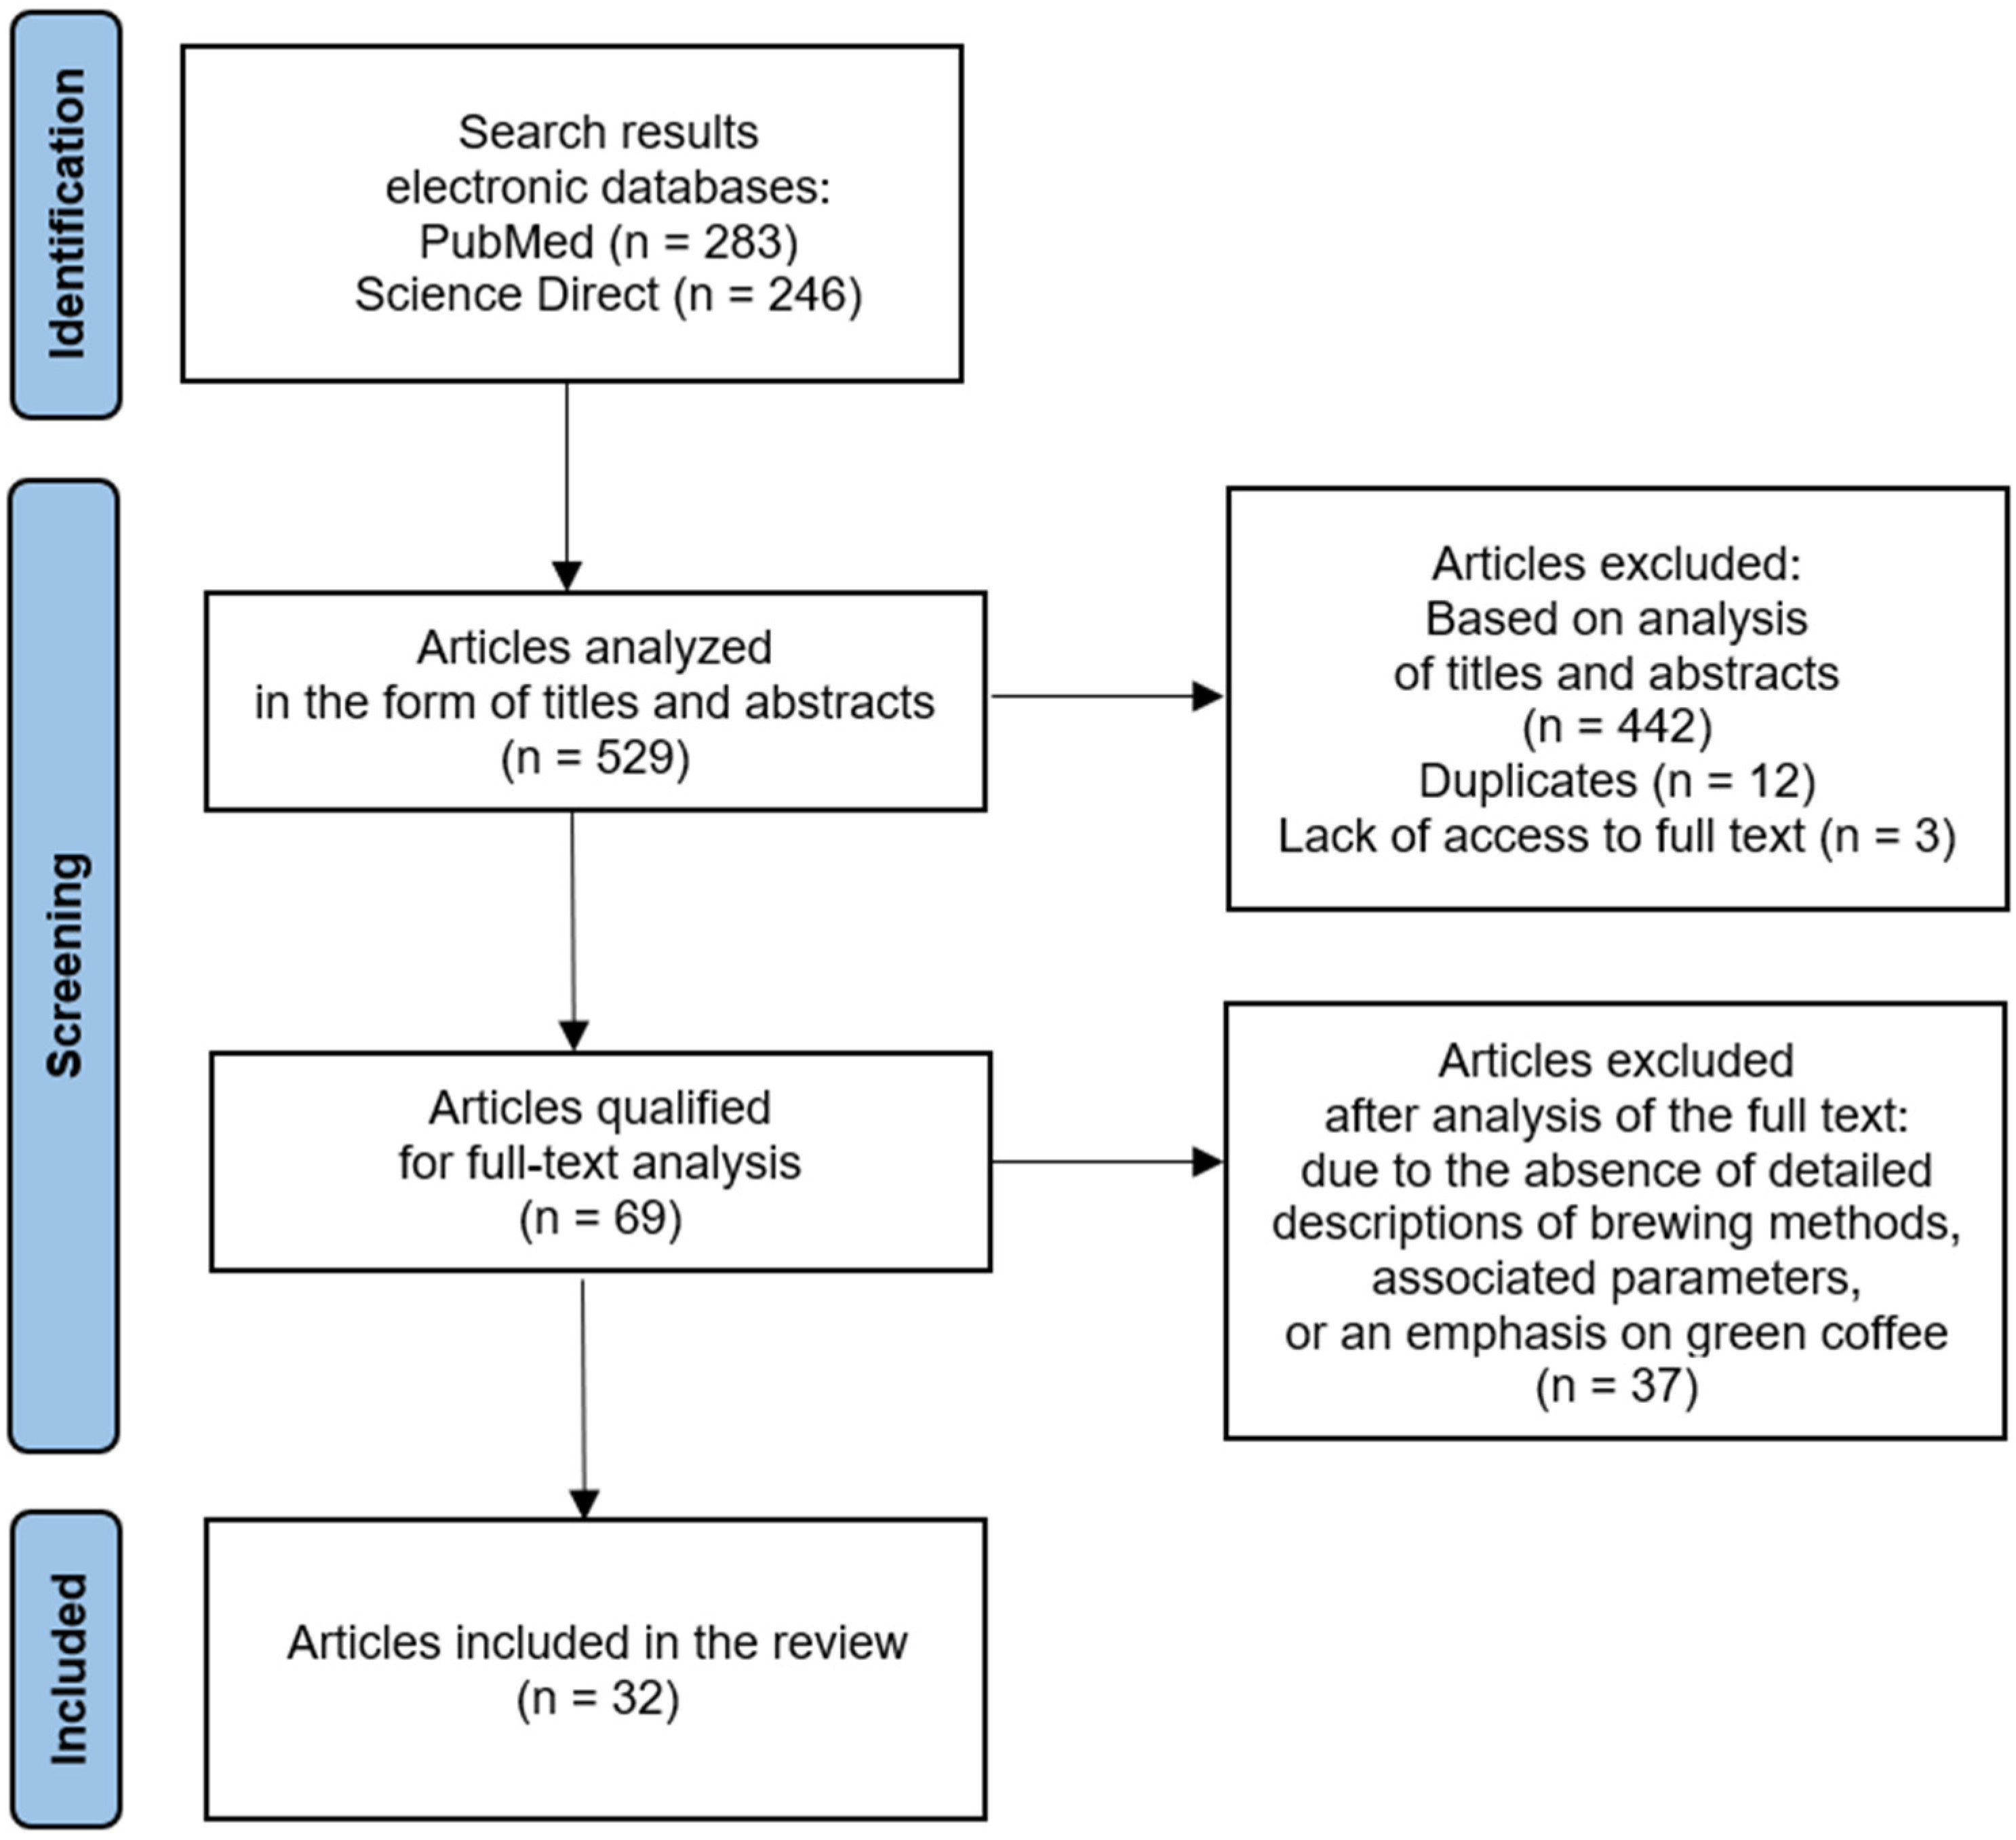
2. Methods
3. Results and Discussion
3.1. Coffee Characteristics
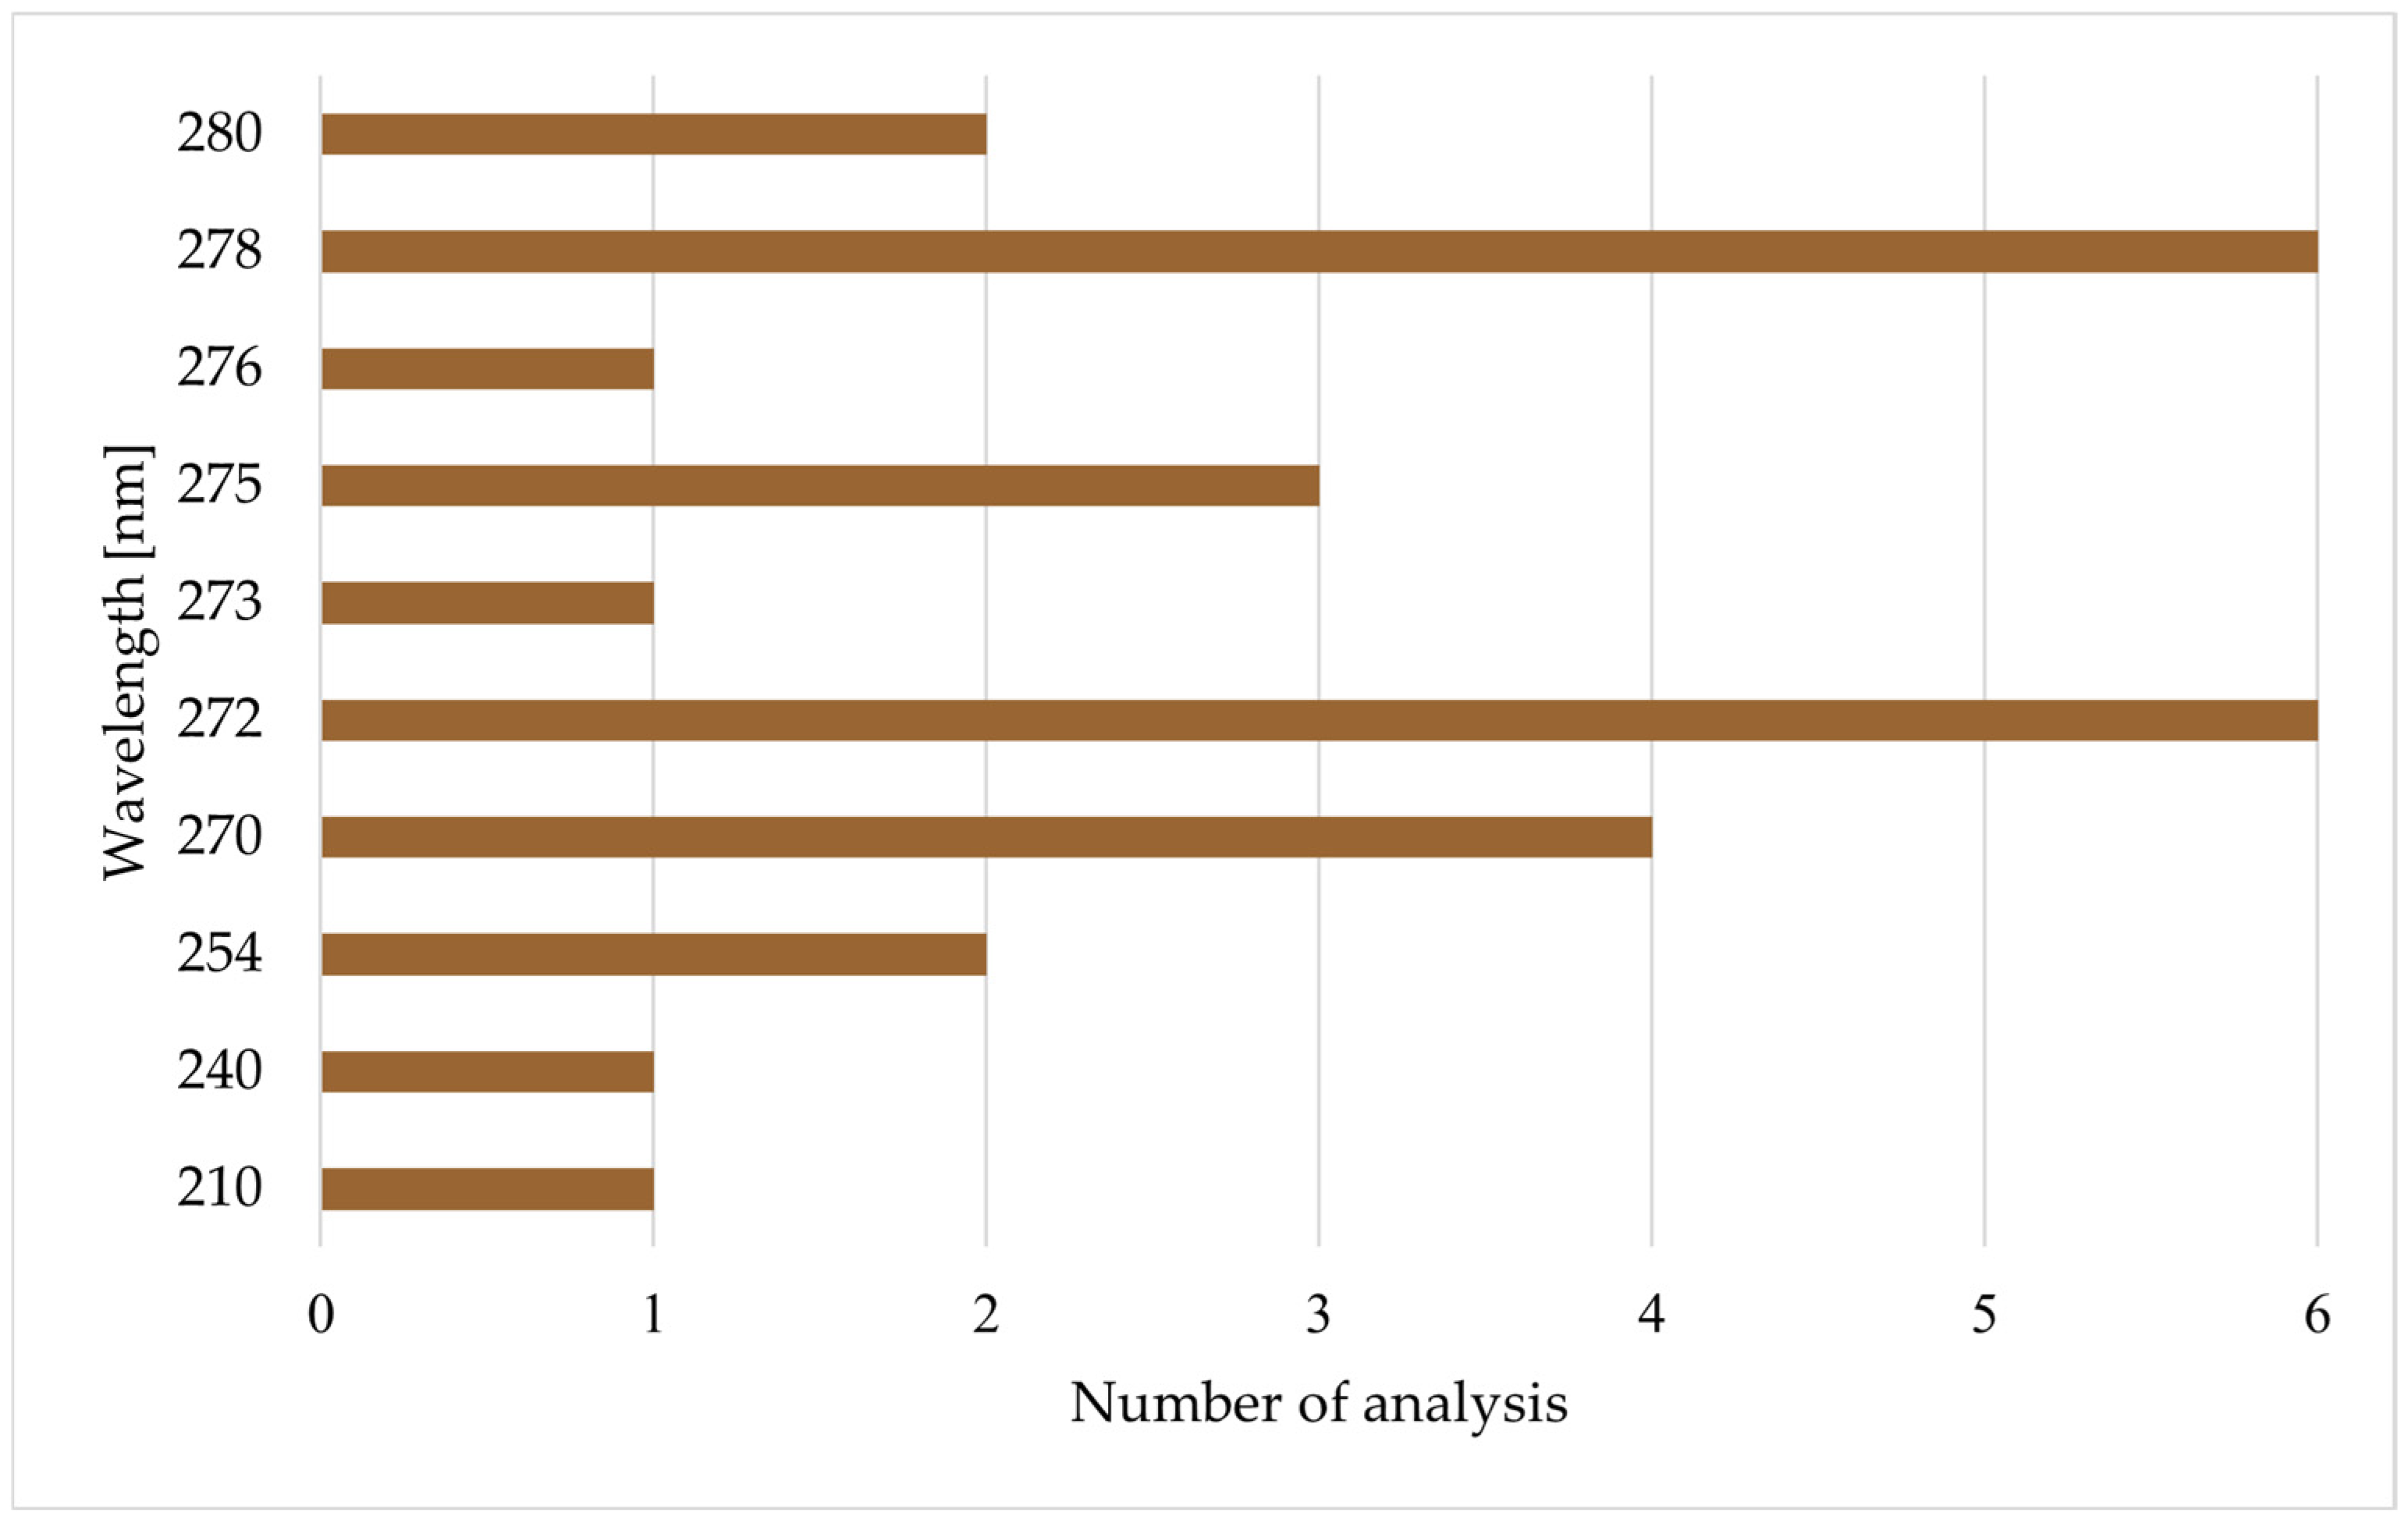
3.2. Caffeine Determination Methods
3.3. Brewing Methods
3.3.1. Cold Brew
3.3.2. Espresso
3.3.3. French Press
3.3.4. AeroPress
3.3.5. Moka
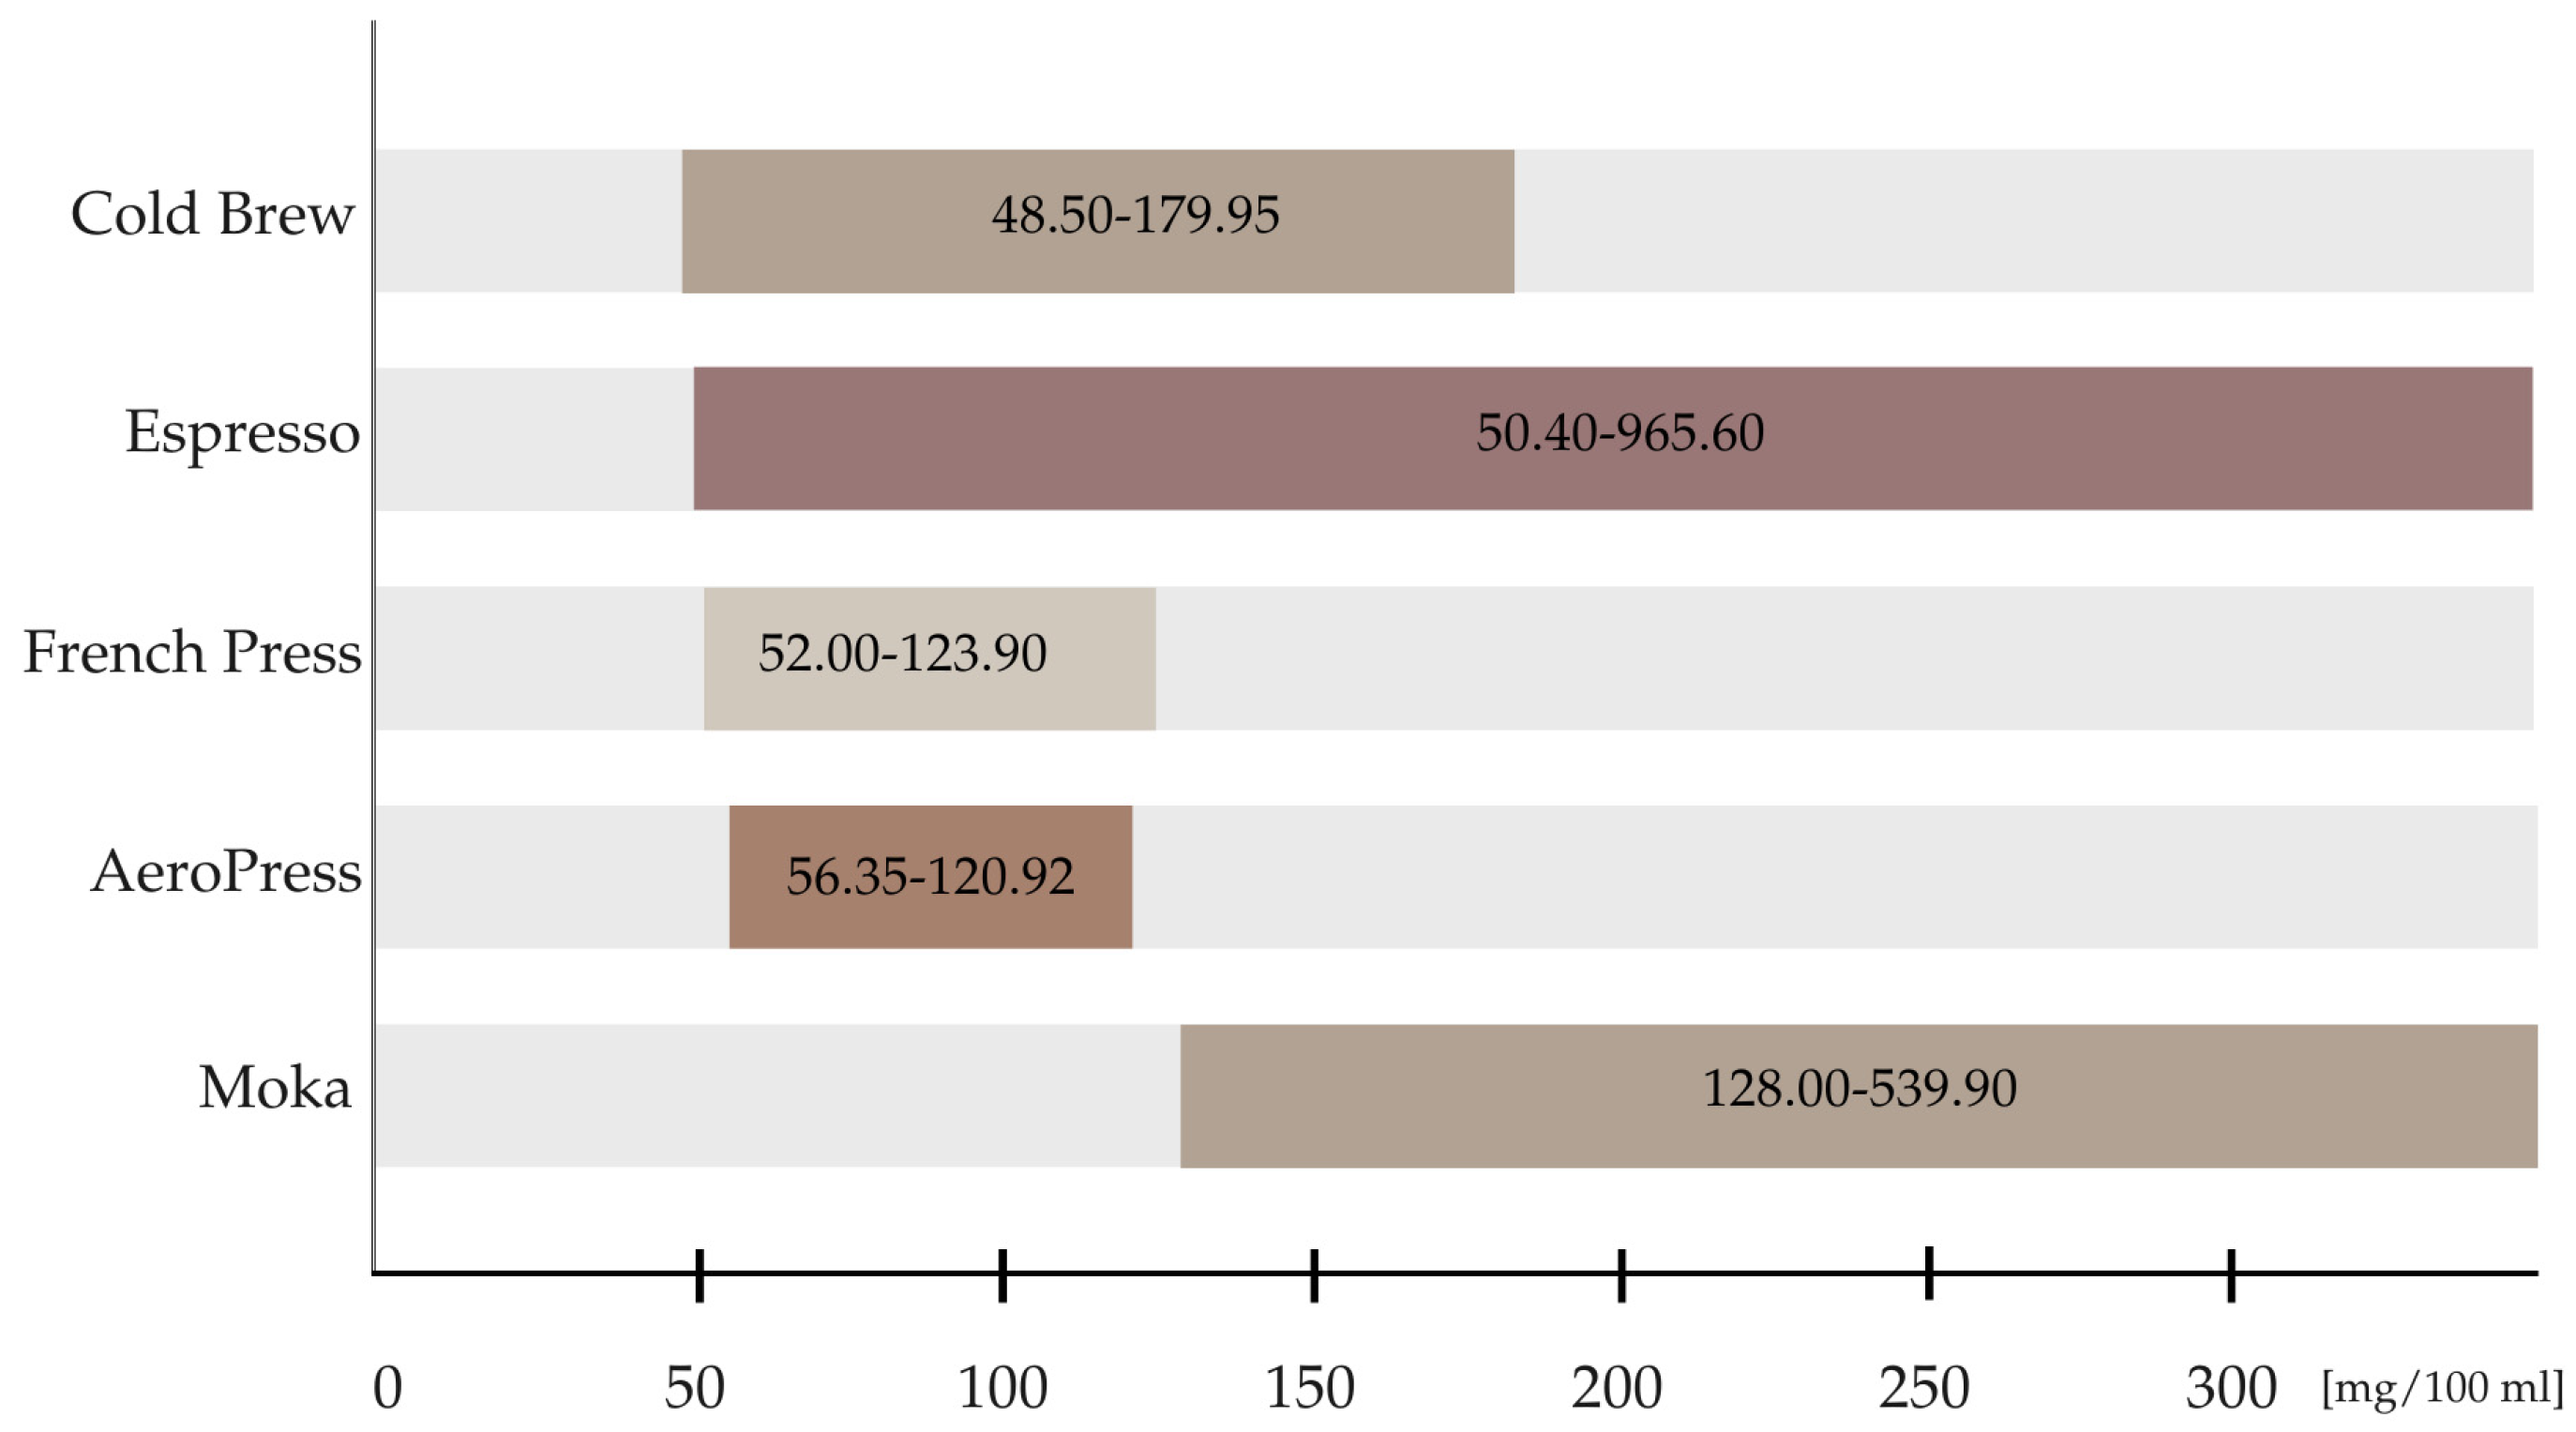
3.4. Brewing Methods’ Comparison
4. Conclusions
Author Contributions
Funding
Conflicts of Interest
References
- International Cofee Organization. Coffee Report and Outlook. 2023. Available online: https://ico.org/coffee-development-report-2/ (accessed on 24 July 2024).
- Quadra, G.R.; Paranaíba, J.R.; Vilas-Boas, J.; Roland, F.; Amado, A.M.; Barros, N.; Dias, R.J.P.; Cardoso, S.J. A Global Trend of Caffeine Consumption over Time and Related-Environmental Impacts. Environ. Pollut. 2020, 256, 113343. [Google Scholar] [CrossRef]
- MIT Observatory of Economic Complexity (OEC), Coffee. Available online: https://oec.world/en/profile/hs/coffee (accessed on 16 October 2024).
- Ludwig, I.A.; Clifford, M.N.; Lean, M.E.J.; Ashihara, H.; Crozier, A. Coffee: Biochemistry and Potential Impact on Health. Food Funct. 2014, 5, 1695–1717. [Google Scholar] [CrossRef]
- Yeager, S.E.; Batali, M.E.; Guinard, J.-X.; Ristenpart, W.D. Acids in Coffee: A Review of Sensory Measurements and Meta-Analysis of Chemical Composition. Crit. Rev. Food Sci. Nutr. 2023, 63, 1010–1036. [Google Scholar] [CrossRef]
- Tajik, N.; Tajik, M.; Mack, I.; Enck, P. The Potential Effects of Chlorogenic Acid, the Main Phenolic Components in Coffee, on Health: A Comprehensive Review of the Literature. Eur. J. Nutr. 2017, 56, 2215–2244. [Google Scholar] [CrossRef]
- Haghighatdoost, F.; Hajihashemi, P.; De Sousa Romeiro, A.M.; Mohammadifard, N.; Sarrafzadegan, N.; De Oliveira, C.; Silveira, E.A. Coffee Consumption and Risk of Hypertension in Adults: Systematic Review and Meta-Analysis. Nutrients 2023, 15, 3060. [Google Scholar] [CrossRef]
- Shang, F.; Li, X.; Jiang, X. Coffee Consumption and Risk of the Metabolic Syndrome: A Meta-Analysis. Diabetes Metab. 2016, 42, 80–87. [Google Scholar] [CrossRef]
- Ding, P.; Yue, W.; Wang, X.; Zhang, Y.; Liu, Y.; Guo, X. Effects of Sugary Drinks, Coffee, Tea and Fruit Juice on Incidence Rate, Mortality and Cardiovascular Complications of Type2 Diabetes Patients: A Systematic Review and Meta-Analysis. J. Diabetes Metab. Disord. 2024, 23, 1113–1123. [Google Scholar] [CrossRef] [PubMed]
- Wijarnpreecha, K.; Thongprayoon, C.; Ungprasert, P. Coffee Consumption and Risk of Nonalcoholic Fatty Liver Disease: A Systematic Review and Meta-Analysis. Eur. J. Gastroenterol. Hepatol. 2017, 29, e8–e12. [Google Scholar] [CrossRef] [PubMed]
- Kanbay, M.; Siriopol, D.; Copur, S.; Tapoi, L.; Benchea, L.; Kuwabara, M.; Rossignol, P.; Ortiz, A.; Covic, A.; Afsar, B. Effect of Coffee Consumption on Renal Outcome: A Systematic Review and Meta-Analysis of Clinical Studies. J. Ren. Nutr. 2021, 31, 5–20. [Google Scholar] [CrossRef] [PubMed]
- Nila, I.S.; Villagra Moran, V.M.; Khan, Z.A.; Hong, Y. Effect of Daily Coffee Consumption on the Risk of Alzheimer’s Disease: A Systematic Review and Meta-Analysis. J. Lifestyle Med. 2023, 13, 83–89. [Google Scholar] [CrossRef] [PubMed]
- Kennedy, O.J.; Roderick, P.; Buchanan, R.; Fallowfield, J.A.; Hayes, P.C.; Parkes, J. Coffee, Including Caffeinated and Decaffeinated Coffee, and the Risk of Hepatocellular Carcinoma: A Systematic Review and Dose–Response Meta-Analysis. BMJ Open 2017, 7, e013739. [Google Scholar] [CrossRef]
- Yu, J.; Liang, D.; Li, J.; Liu, Z.; Zhou, F.; Wang, T.; Ma, S.; Wang, G.; Chen, B.; Chen, W. Coffee, Green Tea Intake, and the Risk of Hepatocellular Carcinoma: A Systematic Review and Meta-Analysis of Observational Studies. Nutr. Cancer 2023, 75, 1295–1308. [Google Scholar] [CrossRef]
- Miranda, J.; Monteiro, L.; Albuquerque, R.; Pacheco, J.; Khan, Z.; Lopez-Lopez, J.; Warnakulasuryia, S. Coffee Is Protective against Oral and Pharyngeal Cancer: A Systematic Review and Meta-Analysis. Med. Oral 2017, 22, e554. [Google Scholar] [CrossRef]
- Gunter, M.J.; Murphy, N.; Cross, A.J.; Dossus, L.; Dartois, L.; Fagherazzi, G.; Kaaks, R.; Kühn, T.; Boeing, H.; Aleksandrova, K.; et al. Coffee Drinking and Mortality in 10 European Countries: A Multinational Cohort Study. Ann. Intern. Med. 2017, 167, 236–247. [Google Scholar] [CrossRef]
- Dludla, P.V.; Cirilli, I.; Marcheggiani, F.; Silvestri, S.; Orlando, P.; Muvhulawa, N.; Moetlediwa, M.T.; Nkambule, B.B.; Mazibuko-Mbeje, S.E.; Hlengwa, N.; et al. Potential Benefits of Coffee Consumption on Improving Biomarkers of Oxidative Stress and Inflammation in Healthy Individuals and Those at Increased Risk of Cardiovascular Disease. Molecules 2023, 28, 6440. [Google Scholar] [CrossRef]
- Socała, K.; Szopa, A.; Serefko, A.; Poleszak, E.; Wlaź, P. Neuroprotective Effects of Coffee Bioactive Compounds: A Review. Int. J. Mol. Sci. 2020, 22, 107. [Google Scholar] [CrossRef]
- Liguori, A. Absorption and Subjective Effects of Caffeine from Coffee, Cola and Capsules. Pharmacol. Biochem. Behav. 1997, 58, 721–726. [Google Scholar] [CrossRef]
- Nehlig, A. Interindividual Differences in Caffeine Metabolism and Factors Driving Caffeine Consumption. Pharmacol. Rev. 2018, 70, 384–411. [Google Scholar] [CrossRef] [PubMed]
- EFSA Panel on Dietetic Products, Nutrition and Allergies (NDA). Scientific Opinion on the Safety of Caffeine. EFSA J. 2015, 13, 4102. [Google Scholar] [CrossRef]
- World Health Organization. WHO Recommendations on Antenatal Care for a Positive Pregnancy Experience; World Health Organization: Geneva, Switzerland, 2016. [Google Scholar]
- Wikoff, D.; Welsh, B.T.; Henderson, R.; Brorby, G.P.; Britt, J.; Myers, E.; Goldberger, J.; Lieberman, H.R.; O’Brien, C.; Peck, J.; et al. Systematic Review of the Potential Adverse Effects of Caffeine Consumption in Healthy Adults, Pregnant Women, Adolescents, and Children. Food Chem. Toxicol. 2017, 109, 585–648. [Google Scholar] [CrossRef] [PubMed]
- Rusinek, R.; Dobrzański, B.; Oniszczuk, A.; Gawrysiak-Witulska, M.; Siger, A.; Karami, H.; Ptaszyńska, A.A.; Żytek, A.; Kapela, K.; Gancarz, M. How to Identify Roast Defects in Coffee Beans Based on the Volatile Compound Profile. Molecules 2022, 27, 8530. [Google Scholar] [CrossRef]
- Rusinek, R.; Dobrzański, B., Jr.; Gawrysiak-Witulska, M.; Siger, A.; Żytek, A.; Karami, H.; Umar, A.; Lipa, T.; Gancarz, M. Effect of the Roasting Level on the Content of Bioactive and Aromatic Compoundsin Arabica Coffee Beans. Int. Agrophys. 2023, 38, 31–42. [Google Scholar] [CrossRef] [PubMed]
- Lu, T.; Sun, Y.; Huang, Y.; Chen, X. Effects of Roasting on the Chemical Compositions, Color, Aroma, Microstructure, and the Kinetics of Changes in Coffee Pulp. J. Food Sci. 2023, 88, 1430–1444. [Google Scholar] [CrossRef] [PubMed]
- Olechno, E.; Puścion-Jakubik, A.; Zujko, M.E.; Socha, K. Influence of Various Factors on Caffeine Content in Coffee Brews. Foods 2021, 10, 1208. [Google Scholar] [CrossRef] [PubMed]
- Page, M.J.; Moher, D.; Bossuyt, P.M.; Boutron, I.; Hoffmann, T.C.; Mulrow, C.D.; Shamseer, L.; Tetzlaff, J.M.; Akl, E.A.; Brennan, S.E.; et al. PRISMA 2020 Explanation and Elaboration: Updated Guidance and Exemplars for Reporting Systematic Reviews. BMJ 2021, 372, n160. [Google Scholar] [CrossRef] [PubMed]
- Ahmed, M.; Jiang, G.; Park, J.S.; Lee, K.; Seok, Y.Y.; Eun, J.B. Effects of Ultrasonication, Agitation and Stirring Extraction Techniques on the Physicochemical Properties, Health-promoting Phytochemicals and Structure of Cold-brewed Coffee. J. Sci. Food Agric. 2019, 99, 290–301. [Google Scholar] [CrossRef]
- Angeloni, G.; Guerrini, L.; Masella, P.; Bellumori, M.; Daluiso, S.; Parenti, A.; Innocenti, M. What Kind of Coffee Do You Drink? An Investigation on Effects of Eight Different Extraction Methods. Food Res. Int. 2019, 116, 1327–1335. [Google Scholar] [CrossRef]
- Angeloni, G.; Guerrini, L.; Masella, P.; Innocenti, M.; Bellumori, M.; Parenti, A. Characterization and Comparison of Cold Brew and Cold Drip Coffee Extraction Methods. J. Sci. Food Agric. 2019, 99, 391–399. [Google Scholar] [CrossRef] [PubMed]
- Bellumori, M.; Angeloni, G.; Guerrini, L.; Masella, P.; Calamai, L.; Mulinacci, N.; Parenti, A.; Innocenti, M. Effects of Different Stabilization Techniques on the Shelf Life of Cold Brew Coffee: Chemical Composition, Flavor Profile and Microbiological Analysis. LWT 2021, 142, 111043. [Google Scholar] [CrossRef]
- Caporaso, N.; Genovese, A.; Canela, M.D.; Civitella, A.; Sacchi, R. Neapolitan Coffee Brew Chemical Analysis in Comparison to Espresso, Moka and American Brews. Food Res. Int. 2014, 61, 152–160. [Google Scholar] [CrossRef]
- Caprioli, G.; Cortese, M.; Maggi, F.; Minnetti, C.; Odello, L.; Sagratini, G.; Vittori, S. Quantification of Caffeine, Trigonelline and Nicotinic Acid in Espresso Coffee: The Influence of Espresso Machines and Coffee Cultivars. Int. J. Food Sci. Nutr. 2014, 65, 465–469. [Google Scholar] [CrossRef] [PubMed]
- Ciaramelli, C.; Palmioli, A.; Airoldi, C. Coffee Variety, Origin and Extraction Procedure: Implications for Coffee Beneficial Effects on Human Health. Food Chem. 2019, 278, 47–55. [Google Scholar] [CrossRef] [PubMed]
- Córdoba, N.; Moreno, F.L.; Osorio, C.; Velásquez, S.; Fernandez-Alduenda, M.; Ruiz-Pardo, Y. Specialty and Regular Coffee Bean Quality for Cold and Hot Brewing: Evaluation of Sensory Profile and Physicochemical Characteristics. LWT 2021, 145, 111363. [Google Scholar] [CrossRef]
- Córdoba, N.; Moreno, F.L.; Osorio, C.; Velásquez, S.; Ruiz, Y. Chemical and Sensory Evaluation of Cold Brew Coffees Using Different Roasting Profiles and Brewing Methods. Food Res. Int. 2021, 141, 110141. [Google Scholar] [CrossRef]
- Derossi, A.; Ricci, I.; Caporizzi, R.; Fiore, A.; Severini, C. How Grinding Level and Brewing Method (Espresso, American, Turkish) Could Affect the Antioxidant Activity and Bioactive Compounds in a Coffee Cup. J. Sci. Food Agric. 2018, 98, 3198–3207. [Google Scholar] [CrossRef]
- Fuller, M.; Rao, N.Z. The Effect of Time, Roasting Temperature, and Grind Size on Caffeine and Chlorogenic Acid Concentrations in Cold Brew Coffee. Sci. Rep. 2017, 7, 17979. [Google Scholar] [CrossRef] [PubMed]
- Heo, J.; Adhikari, K.; Choi, K.S.; Lee, J. Analysis of Caffeine, Chlorogenic Acid, Trigonelline, and Volatile Compounds in Cold Brew Coffee Using High-Performance Liquid Chromatography and Solid-Phase Microextraction—Gas Chromatography-Mass Spectrometry. Foods 2020, 9, 1746. [Google Scholar] [CrossRef]
- Khamitova, G.; Angeloni, S.; Fioretti, L.; Ricciutelli, M.; Sagratini, G.; Torregiani, E.; Vittori, S.; Caprioli, G. The Impact of Different Filter Baskets, Heights of Perforated Disc and Amount of Ground Coffee on the Extraction of Organics Acids and the Main Bioactive Compounds in Espresso Coffee. Food Res. Int. 2020, 133, 109220. [Google Scholar] [CrossRef]
- Kyroglou, S.; Thanasouli, K.; Vareltzis, P. Process Characterization and Optimization of Cold Brew Coffee: Effect of Pressure, Temperature, Time and Solvent Volume on Yield, Caffeine and Phenol Content. J. Sci. Food Agric. 2021, 101, 4789–4798. [Google Scholar] [CrossRef]
- Kyroglou, S.; Laskari, R.; Vareltzis, P. Optimization of Sensory Properties of Cold Brew Coffee Produced by Reduced Pressure Cycles and Its Physicochemical Characteristics. Molecules 2022, 27, 2971. [Google Scholar] [CrossRef]
- Lapčíková, B.; Lapčík, L.; Barták, P.; Valenta, T.; Dokládalová, K. Effect of Extraction Methods on Aroma Profile, Antioxidant Activity and Sensory Acceptability of Specialty Coffee Brews. Foods 2023, 12, 4125. [Google Scholar] [CrossRef] [PubMed]
- Ludwig, I.A.; Mena, P.; Calani, L.; Cid, C.; Del Rio, D.; Lean, M.E.J.; Crozier, A. Variations in Caffeine and Chlorogenic Acid Contents of Coffees: What Are We Drinking? Food Funct. 2014, 5, 1718–1726. [Google Scholar] [CrossRef] [PubMed]
- Miłek, M.; Młodecki, Ł.; Dżugan, M. Caffeine Content and Antioxidant Activity of Various Brews of Specialty Grade Coffee. Acta Sci. Pol. Technol. Aliment. 2021, 20, 179–188. [Google Scholar] [CrossRef]
- Muzykiewicz-Szymańska, A.; Nowak, A.; Wira, D.; Klimowicz, A. The Effect of Brewing Process Parameters on Antioxidant Activity and Caffeine Content in Infusions of Roasted and Unroasted Arabica Coffee Beans Originated from Different Countries. Molecules 2021, 26, 3681. [Google Scholar] [CrossRef] [PubMed]
- Niseteo, T.; Komes, D.; Belščak-Cvitanović, A.; Horžić, D.; Budeč, M. Bioactive Composition and Antioxidant Potential of Different Commonly Consumed Coffee Brews Affected by Their Preparation Technique and Milk Addition. Food Chem. 2012, 134, 1870–1877. [Google Scholar] [CrossRef]
- Portela, C.D.S.; Almeida, I.F.D.; Mori, A.L.B.; Yamashita, F.; Benassi, M.D.T. Brewing Conditions Impact on the Composition and Characteristics of Cold Brew Arabica and Robusta Coffee Beverages. LWT 2021, 143, 111090. [Google Scholar] [CrossRef]
- Salamanca, C.A.; Fiol, N.; González, C.; Saez, M.; Villaescusa, I. Extraction of Espresso Coffee by Using Gradient of Temperature. Effect on Physicochemical and Sensorial Characteristics of Espresso. Food Chem. 2017, 214, 622–630. [Google Scholar] [CrossRef] [PubMed]
- Santanatoglia, A.; Angeloni, S.; Bartolucci, D.; Fioretti, L.; Sagratini, G.; Vittori, S.; Caprioli, G. Effect of Brewing Methods on Acrylamide Content and Antioxidant Activity: Studying Eight Different Filter Coffee Preparations. Antioxidants 2023, 12, 1888. [Google Scholar] [CrossRef]
- Santanatoglia, A.; Caprioli, G.; Cespi, M.; Ciarlantini, D.; Cognigni, L.; Fioretti, L.; Maggi, F.; Mustafa, A.M.; Nzekoue, F.; Vittori, S. A Comprehensive Comparative Study among the Newly Developed Pure Brew Method and Classical Ones for Filter Coffee Production. LWT 2023, 175, 114471. [Google Scholar] [CrossRef]
- Santanatoglia, A.; Angeloni, S.; Fiorito, M.; Fioretti, L.; Ricciutelli, M.; Sagratini, G.; Vittori, S.; Caprioli, G. Development of New Analytical Methods for the Quantification of Organic Acids, Chlorogenic Acids and Caffeine in Espresso Coffee by Using Solid-Phase Extraction (SPE) and High-Performance Liquid Chromatography-Diode Array Detector (HPLC-DAD). J. Food Compos. Anal. 2024, 125, 105732. [Google Scholar] [CrossRef]
- Santini, A.; Ferracane, R.; Mikušová, P.; Eged, Š.; Šrobárová, A.; Meca, G.; Mañes, J.; Ritieni, A. Influence of Different Coffee Drink Preparations on Ochratoxin A Content and Evaluation of the Antioxidant Activity and Caffeine Variations. Food Control 2011, 22, 1240–1245. [Google Scholar] [CrossRef]
- Schmieder, B.K.L.; Pannusch, V.B.; Vannieuwenhuyse, L.; Briesen, H.; Minceva, M. Influence of Flow Rate, Particle Size, and Temperature on Espresso Extraction Kinetics. Foods 2023, 12, 2871. [Google Scholar] [CrossRef] [PubMed]
- Severini, C.; Derossi, A.; Fiore, A.G.; De Pilli, T.; Alessandrino, O.; Del Mastro, A. How the Variance of Some Extraction Variables May Affect the Quality of Espresso Coffees Served in Coffee Shops. J. Sci. Food Agric. 2016, 96, 3023–3031. [Google Scholar] [CrossRef]
- Stanek, N.; Zarębska, M.; Biłos, Ł.; Barabosz, K.; Nowakowska-Bogdan, E.; Semeniuk, I.; Błaszkiewicz, J.; Kulesza, R.; Matejuk, R.; Szkutnik, K. Influence of Coffee Brewing Methods on the Chromatographic and Spectroscopic Profiles, Antioxidant and Sensory Properties. Sci. Rep. 2021, 11, 21377. [Google Scholar] [CrossRef] [PubMed]
- Zakaria, N.H.; Whanmek, K.; Thangsiri, S.; Chathiran, W.; Srichamnong, W.; Suttisansanee, U.; Santivarangkna, C. Optimization of Cold Brew Coffee Using Central Composite Design and Its Properties Compared with Hot Brew Coffee. Foods 2023, 12, 2412. [Google Scholar] [CrossRef] [PubMed]
- Zhai, X.; Yang, M.; Zhang, J.; Zhang, L.; Tian, Y.; Li, C.; Bao, L.; Ma, C.; Abd El-Aty, A.M. Feasibility of Ultrasound-Assisted Extraction for Accelerated Cold Brew Coffee Processing: Characterization and Comparison with Conventional Brewing Methods. Front. Nutr. 2022, 9, 849811. [Google Scholar] [CrossRef] [PubMed]
- Zhang, L.; Wang, X.; Manickavasagan, A.; Lim, L.-T. Extraction and Physicochemical Characteristics of High Pressure-Assisted Cold Brew Coffee. Future Foods 2022, 5, 100113. [Google Scholar] [CrossRef]
- Heo, J.; Choi, K.S.; Wang, S.; Adhikari, K.; Lee, J. Cold Brew Coffee: Consumer Acceptability and Characterization Using the Check-All-That-Apply (CATA) Method. Foods 2019, 8, 344. [Google Scholar] [CrossRef] [PubMed]
- Kwok, R.; Lee Wee Ting, K.; Schwarz, S.; Claassen, L.; Lachenmeier, D.W. Current Challenges of Cold Brew Coffee—Roasting, Extraction, Flavor Profile, Contamination, and Food Safety. Challenges 2020, 11, 26. [Google Scholar] [CrossRef]
- Claassen, L.; Rinderknecht, M.; Porth, T.; Röhnisch, J.; Seren, H.Y.; Scharinger, A.; Gottstein, V.; Noack, D.; Schwarz, S.; Winkler, G.; et al. Cold Brew Coffee—Pilot Studies on Definition, Extraction, Consumer Preference, Chemical Characterization and Microbiological Hazards. Foods 2021, 10, 865. [Google Scholar] [CrossRef]
- Polanco-Estibález, B.; García-Santa-Cruz, R.; Queirós, R.P.; Serment-Moreno, V.; González-Angulo, M.; Tonello-Samson, C.; Rivero-Pérez, M.D. High-Pressure Processing for Cold Brew Coffee: Safety and Quality Assessment under Refrigerated and Ambient Storage. Foods 2023, 12, 4231. [Google Scholar] [CrossRef]
- Maksimowski, D.; Oziembłowski, M.; Kolniak-Ostek, J.; Stach, M.; Zubaidi, M.A.; Nawirska-Olszańska, A. Effect of Cold Brew Coffee Storage in Industrial Production on the Physical-Chemical Characteristics of Final Product. Foods 2023, 12, 3840. [Google Scholar] [CrossRef] [PubMed]
- Cai, Y.; Xu, Z.; Pan, X.; Gao, M.; Wu, M.; Wu, J.; Lao, F. Comparative Profiling of Hot and Cold Brew Coffee Flavor Using Chromatographic and Sensory Approaches. Foods 2022, 11, 2968. [Google Scholar] [CrossRef] [PubMed]
- Morris, J. Making Italian Espresso, Making Espresso Italian. Food Hist. 2010, 8, 155–183. [Google Scholar] [CrossRef]
- Angeloni, S.; Mustafa, A.M.; Abouelenein, D.; Alessandroni, L.; Acquaticci, L.; Nzekoue, F.K.; Petrelli, R.; Sagratini, G.; Vittori, S.; Torregiani, E.; et al. Characterization of the Aroma Profile and Main Key Odorants of Espresso Coffee. Molecules 2021, 26, 3856. [Google Scholar] [CrossRef]
- Caprioli, G.; Cortese, M.; Cristalli, G.; Maggi, F.; Odello, L.; Ricciutelli, M.; Sagratini, G.; Sirocchi, V.; Tomassoni, G.; Vittori, S. Optimization of Espresso Machine Parameters through the Analysis of Coffee Odorants by HS-SPME–GC/MS. Food Chem. 2012, 135, 1127–1133. [Google Scholar] [CrossRef]
- Klotz, J.A.; Winkler, G.; Lachenmeier, D.W. Influence of the Brewing Temperature on the Taste of Espresso. Foods 2020, 9, 36. [Google Scholar] [CrossRef] [PubMed]
- Illy, E.; Navarini, L. Neglected Food Bubbles: The Espresso Coffee Foam. Food Biophys. 2011, 6, 335–348. [Google Scholar] [CrossRef] [PubMed]
- Wang, X.; Lim, L.-T.; Tan, S.; Fu, Y. Investigation of the Factors That Affect the Volume and Stability of Espresso Crema. Food Res. Int. 2019, 116, 668–675. [Google Scholar] [CrossRef]
- Brommer, E.; Stratmann, B.; Quack, D. Environmental Impacts of Different Methods of Coffee Preparation. Int. J. Consum. Stud. 2011, 35, 212–220. [Google Scholar] [CrossRef]
- Caprioli, G.; Cortese, M.; Sagratini, G.; Vittori, S. The Influence of Different Types of Preparation (Espresso and Brew) on Coffee Aroma and Main Bioactive Constituents. Int. J. Food Sci. Nutr. 2015, 66, 505–513. [Google Scholar] [CrossRef] [PubMed]
- Wadsworth, F.B.; Vossen, C.E.J.; Heap, M.J.; Kushnir, A.; Farquharson, J.I.; Schmid, D.; Dingwell, D.B.; Belohlavek, L.; Huebsch, M.; Carbillet, L.; et al. The Force Required to Operate the Plunger on a French Press. Am. J. Phys. 2021, 89, 769–775. [Google Scholar] [CrossRef]
- Espitia-López, J.; Rogelio-Flores, F.; Angel-Cuapio, A.; Flores-Chávez, B.; Arce-Cervantes, O.; Hernández-León, S.; Garza-López, P.M. Characterization of Sensory Profile by the CATA Method of Mexican Coffee Brew Considering Two Preparation Methods: Espresso and French Press. Int. J. Food Prop. 2019, 22, 967–973. [Google Scholar] [CrossRef]
- Mestdagh, F.; Glabasnia, A.; Giuliano, P. The Brew—Extracting for Excellence. In The Craft and Science of Coffee; Elsevier: Amsterdam, The Netherlands, 2017; pp. 355–380. [Google Scholar] [CrossRef]
- Santanatoglia, A.; Alessandroni, L.; Fioretti, L.; Sagratini, G.; Vittori, S.; Maggi, F.; Caprioli, G. Discrimination of Filter Coffee Extraction Methods of a Medium Roasted Specialty Coffee Based on Volatile Profiles and Sensorial Traits. Foods 2023, 12, 3199. [Google Scholar] [CrossRef] [PubMed]
- Janda, K.; Jakubczyk, K.; Baranowska-Bosiacka, I.; Kapczuk, P.; Kochman, J.; Rębacz-Maron, E.; Gutowska, I. Mineral Composition and Antioxidant Potential of Coffee Beverages Depending on the Brewing Method. Foods 2020, 9, 121. [Google Scholar] [CrossRef]
- Navarini, L.; Nobile, E.; Pinto, F.; Scheri, A.; Suggi-Liverani, F. Experimental Investigation of Steam Pressure Coffee Extraction in a Stove-Top Coffee Maker. Appl. Therm. Eng. 2009, 29, 998–1004. [Google Scholar] [CrossRef]
- Petracco, M. Technology IV: Beverage Preparation: Brewing Trends for the New Millennium. In Coffee; Clarke, R.J., Vitzthum, O.G., Eds.; Wiley: Hoboken, NJ, USA, 2001; pp. 140–164. [Google Scholar] [CrossRef]
- Gianino, C. Experimental Analysis of the Italian Coffee Pot “Moka”. Am. J. Phys. 2007, 75, 43–47. [Google Scholar] [CrossRef]


| Authors | Type | Roasting Degree | Origin | ||||
|---|---|---|---|---|---|---|---|
| Arabica | Robusta | Blend | Light | Medium | Dark | ||
| [29] | ⏺ | n.d. | Brazil | ||||
| [30] | ⏺ | n.d. | Ethiopia | ||||
| [31] | ⏺ | n.d. | n.d. | ||||
| [32] | ⏺ | ⏺ | Ethiopia | ||||
| [33] | ⏺ | ⏺ | n.d. | ||||
| [34] | ⏺ | ⏺ | n.d. | Colombia | |||
| [35] | ⏺ | ⏺ | ⏺ | Colombia, Brazil, Burundi, Kenya, Guatemala, Tanzania, Uganda, Vietnam, India | |||
| [36] | ⏺ | ⏺ | Colombia | ||||
| [37] | ⏺ | ⏺ | Colombia | ||||
| [38] | n.d. | ⏺ | n.d. | ||||
| [39] | ⏺ | ⏺ | ⏺ | USA | |||
| [40] | n.d. | ⏺ | Brazil, Kenya, Colombia, Ethiopia, Aricha | ||||
| [41] | ⏺ | ⏺ | ⏺ | Central America, Indonesia | |||
| [42] | ⏺ | ⏺ | ⏺ | n.d. | |||
| [43] | ⏺ | ⏺ | Colombia | ||||
| [44] | ⏺ | ⏺ | ⏺ | Colombia, Costa Rica, Kenya, Ethiopia | |||
| [45] | ⏺ | ⏺ | ⏺ | ⏺ | n.d. | ||
| [46] | ⏺ | n.d. | Peru, Nicaragua | ||||
| [47] | ⏺ | ⏺ | ⏺ | ⏺ | Brazil, Colombia, India, Peru, Rwanda | ||
| [48] | ⏺ | n.d. | Croatia | ||||
| [49] | ⏺ | ⏺ | ⏺ | Brazil | |||
| [50] | ⏺ | ⏺ | ⏺ | n.d. | |||
| [51] | ⏺ | ⏺ | ⏺ | ⏺ | Ethiopia, Kenya | ||
| [52] | ⏺ | ⏺ | ⏺ | ⏺ | El Salvador, Uganda | ||
| [53] | ⏺ | ⏺ | ⏺ | ⏺ | Kenya | ||
| [54] | ⏺ | n.d. | n.d. | ||||
| [55] | ⏺ | n.d. | n.d. | ||||
| [56] | n.d. | n.d. | n.d. | ||||
| [57] | ⏺ | n.d. | El Salvador, Guatemala Bolivia, Brazil | ||||
| [58] | n.d. | n.d. | Jamaica | ||||
| [59] | ⏺ | n.d. | Brazil | ||||
| [60] | n.d. | ⏺ | Colombia | ||||
| Reference | Method | Column | Mobile Phase | Elution | Injection [µL] | Flow Rate [mL/min] | Column T [°C] | Wavelength (nm) | Sample Preparation | Other Labeled Compounds |
|---|---|---|---|---|---|---|---|---|---|---|
| [29] | HPLC-DAD | C18—250 × 4.6 mm | water, methanol, acetic acid (79.9, 20.0, 0.1) | isocratic | 10 | 1.0 | 25 | 278 | filtered (0.45 µm filter) | – |
| [30] | HPLC-DAD | C18—150 × 3 mm, 2.7 μm precolumn of the same phase | formic acid, water (A), acetonitrile (B) | gradient, 0–24 min: from 95% A to 10% A | 5 | 0.4 | room | 278 | centrifuged (12,000 rpm, 5 min), diluted (1:10 with water) | CGAs |
| [31] | HPLC-DAD | C18—150 × 3 mm, 2.7 μm; precolumn of the same phase | formic acid, water (A), acetonitrile (B) | gradient, 0–5 min: 95% A 5–15 min: from 95% A to 56% A 15–17 min: from 56% A to 10% A 17–24 min: 10% A | 5 | 0.4 | room | 278 | centrifuged 12,074× g, 5 min), diluted (1:10 with water) | CGAs |
| [32] | HPLC-DAD | C18—150 × 3 mm, 2.7 μm; precolumn of the same phase | formic acid, water (A), acetonitrile (B) | gradient | 5 | 0.4 | room | 278 | diluted (1:10 with water) centrifuged (16,900× g, 5 min) | CGAs |
| [33] | HPLC-PDA | C18—250 × 4.6 mm, 4 μm | 3% formic acid (A), methanol (B) | gradient, 0–20 min: from 2% B to 32% B 20–30 min: from 32% B to 40% B 30–40 min: t from 40% B to 95% B 40–45 min: isocratic at 95% B | 20 | 1.0 | n.d. | 278 | filtered (0.45 μm filter) | – |
| [34] | HPLC-VWD | C18—250 × 3 mm, 5 μm | 0.3% formic acid, water (A), methanol (B) | gradient, 0 min: 25% B 0–10 min: from 25% B to 60% B 10–15 min: 60% B 15–20 min: from 60% B to 25% B 20–25 min: 25% B | 10 | 0.4 | n.d. | 270 | diluted (1:50 in the mobile phase) centrifuged (10,000 rpm, 10 min) filtered (0.45 μm filter) | nicotinic acid, trigonelline |
| [36] | HPLC-PDA | C18—250 × 4.6 mm, 5 μm | 1% acetic acid (A), methanol (B) | gradient, 0–8 min: 96% A, 4% B 8–20 min: 72% A, 28% B 20–28 min: 58% A, 42% B | 10 | 1.5 | 25 | 275 | n.d. | CQAs, trigonelline |
| [37] | HPLC-DAD (UV/VIS) | C18—250 × 4.6 mm, 5 μm | 1% acetic acid (A), methanol (B) | gradient, 0–8 min: 96% A, 4% B 8–20 min: 72% A, 28% B 20–28 min: 58% A, 42% B | 10 | 1.5 | 25 | 275 | n.d. | CQAs, trigonelline |
| [38] | HPLC-VWD | C18—125 × 4 mm, 5 μm | water, methanol, acetic acid (74.0, 25.0, 1.0) | isocratic | 20 | 0.9 | 25 | 254 | filtered (0.22 µm filter) | – |
| [39] | HPLC-DAD | C18—150 × 4.6 mm, 5 μm | 95% 2.0 mM phosphoric acid, 5% methanol (A), 95% methanol, 5% 2.0 mM phosphoric acid (B) | isocratic (75% A, 25% B) | 10 | 1.0 | 40 | 280 | dilution (1:4 with water), filtered (0.20 µm filter) added water | 3-chlorogenic acid |
| [40] | HPLC-UV | C18—250 × 4.6 mm, 5 μm | 10 mM citric acid (A), methanol (B) | gradient, 0–10 min: 85% A, 15% B 10–30 min: from 85% A, 15% B to 60% A, 40% B | 20 | 1.0 | n.d. | 276 | added Carrez reagents I, II and mixed, centrifuged (45,000× g, 10 min), filtered (0.45 μm filter) | CGAs—total |
| [41] | HPLC-VWD | C18—250 × 3 mm, 5 μm | phosphoric acid, water (A), acetonitrile (B) | gradient, 0–5 min: 2% B 5–10 min: from 2% B to 15% B 10–15 min: from 15% B to 20% B 15–20 min: from 20% B to 50% B 20–40 min: 100% B 40–50 min: from 100% B to 2% B | 5 | 0.4 | n.d. | 200 (for 10 min) after 240 (for the rest run time) | diluted (1:50 in mobile phase), centrifuged (13,000 rpm, 10 min) filtered (0.45 μm filter) | mix compounds (acetic acid, caffeic acid, caffeine, 5-caffeoylquinic acid, citric acid, malic acid, nicotinic acid, tartaric acid, and trigonelline) |
| [42] | HPLC-UV | C18—250 × 4 mm, 5 μm | water, methanol (80.0, 20.0) | isocratic, 10 min | 20 | 0.5 | 25 | 275 | n.d. | – |
| [44] | HPLC-UV/Vis | C18—150 × 4.6 mm, 2.6 μm | 0.05% phosphoric acid, water | isocratic, 54 min | 10 | 0.5 to 0.8 | 25 | 210 | filtered (0.20 μm filter) | chlorogenic acid |
| [45] | HPLC-PDA | Polar-RP—250 × 4.6 mm, 4 μm | 1% formic acid, water (A), acetonitrile (B) | gradient, 0–35 min: 5% B to 8% B | 100 | 1.0 | 40 | 280 | diluted (1:20 with water and methanol) centrifuged (16,200× g, 5 min) | CQAs—total |
| [46] | HPLC-DAD | C18— 250 × 4.6 mm, 5 μm | water, methanol (95.0, 5.0) | isocratic, 7 min | 10 | 1.0 | n.d. | 272 | n.d. | – |
| [47] | HPLC-UV | C18—125 × 4 mm, 5 μm | 0.5 M H3PO4 (pH 2.5), acetonitrile, methanol | isocratic | 20 | 1.0 | n.d. | 272 | filtered (papers filter) | – |
| [48] | HPLC-PDA | C18—250 × 4.6 mm, 5 μm | 3% formic acid (A), methanol (B) | gradient, 0–20 min: from 2% B to 32% B 20–30 min: from 32% B to 40% B 30–40 min: from 40% B to 95% B 40–45 min: 95% B | 20 | 1.0 | n.d. | 278 | filtered (0.45 μm filter) | phenolic compounds |
| [49] | HPLC-UV/Vis | C18—250 × 4.6 mm, 5 μm | 5% acetic acid (A), acetonitrile (B) | gradient, 0–5 min: 3% B 5–25 min: from 3% B to 20% B 27–30 min: 3% B | 20 | 1.0 | n.d. | 272 | filtered (0.45 μm filter) | CGAs—total |
| [50] | HPLC-UV | C18—100 × 4.6 mm, 5 μm | methanol, water (40.0, 60.0) | isocratic | 20 | 1.0 | n.d. | 270 | diluted, filtered (0.2 μm filter) | – |
| [51] | HPLC-DAD | C18—250 × 3.0 mm, 5 μm; precolumn C18—40 × 3.0 mm, 5 μm | 0.1% formic acid, water (A), 0.1% formic acid, methanol (B) | gradient | 3 | 0.8 | 40 | 270 | n.d. | CGAs |
| [52] | UHPLC-MS/MS | Kinetex PFP—100 × 2.1 mm, 2.6 μm | 0.1% formic acid, water (A), 0.1% formic acid, methanol (B) | gradient, 0–2 min: 20% B 2–15 min: 80% B 15–18 min: 80% B 18–23 min: 100% B 23–35 min: 20% B | 2 | 0.2 | 30 | - | centrifuged (15,000 rpm, 5 min), filtered | bioactive compounds (thirteen) |
| [53] | HPLC-DAD | C18—250 × 3.0 mm, 5 μm precolumn C18—40 × 3.0 mm, 5 μm | 0.1% formic acid, water (A), 0.1% formic acid, methanol (B) | gradient, 0–10 min: 20% B (isocratic) 10–15 min: 20% B to 35% B 15–20 min: 35% B to 55% B 20 min: 85% B (isocratic) 20–25 min: 85% B to 20% B | 3 | 0.8 | 40 | 270 | diluted (1:50), centrifuged (10,000 rpm, 5 min), filtered (0.45 μm filter) | CGAs, phenolic acids |
| [55] | HPLC-UV/Vis | C18—150 × 4.6 mm, 5 μm | 0.5% formic acid, water (A), 0.5% formic acid, methanol (B) | gradient, 0–1.2 min: 2% B 1.2–2.5 min: 2% B to 20% B 2.5–13 min: 20% B to 40% B 13–14.5 min: 40% B to 95% B 14.5–15 min: 95% B 15–21 min: 95% B to 2% B | 10 | 1.2 | n.d. | 272 | diluted (1:5–50), (filtered 0.2 μm filter), centrifuged (4700 rpm, 10 min) | trigonelline, 5-caffeoylquinic acid |
| [56] | HPLC-UV/Vis | C18—125 × 4 mm, 5 μm | water, methanol, acetic acid (74.0, 25.0,1.0) | isocratic | 20 | 0.9 | 25 | 254 | filtered (0.22 µm filter) | – |
| [57] | HPLC-PDA (UV/Vis) | C18—100 × 4.6 mm, 3.5 μm; guard column with similar composition | 0.1% formic acid, water (A), methanol (B) | gradient, 0–12 min: 85% A, 15% B | 1 | 1.0 | 30 | 272 | n.d. | CGAs, gallic acid, trigonelline, furfural 5-(hydroxymethyl)furfural |
| [58] | LC-ESI-MS/MS | C18—100 × 2.1 mm, 2.6 μm | acetonitrile (A), 0.1% formic acid (B) | gradient, 0–10 min: 10% A, 90% B | 10 | 0.5 | 35 | – | filtered (0.22 μm filter) | phenolic compounds |
| [59] | HPLC-DAD | C18—250 × 4.6 mm | 0.1% phosphoric acid, water (A), acetonitrile (B) | isocratic, 90% A, 10% B | 10 | 1.0 | 30 | 272 | filtered (paper filter) | – |
| [60] | HPLC-PDA | C18—250 × 4.6 mm, 5 μm | 10 mM citric acid, water (A), methanol (B) | isocratic, 40 min, 75% A, 25% B | 10 | 0.4 | n.d. | 273 | diluted (1:20 with water), filtered (0.22 µm filter) | CGAs—total |
| Reference | R2 | LOQ | LOD | RSD (%) | Other Parameters/Information |
|---|---|---|---|---|---|
| [29] | n.d. | n.d. | n.d. | n.d. | 5-point calibration curve (calibration range: 20–100 ppm) |
| [30] | 0.9994 | n.d. | n.d. | n.d. | 6-point calibration curve (calibration range: 0–0.632 μg) |
| [31] | 0.999 | n.d. | n.d. | n.d. | 6-point calibration curve |
| [32] | 0.9993 | n.d. | n.d. | n.d. | 6-point calibration curve (calibration range: 0–0.7575 μg) |
| [33] | n.d. | n.d. | n.d. | n.d. | external caffeine standard |
| [34] | >0.9985 | 0.1–0.2 mg/L | 0.03–0.06 mg/L | 0.74–4.44% | 5-point calibration curve (calibration range 10, 20, 50, 100, 250 mg/L) |
| [36] | >0.994 | n.d. | n.d. | n.d. | external caffeine standard |
| [37] | n.d. | n.d. | n.d. | n.d. | external caffeine standard |
| [38] | n.d. | n.d. | n.d. | n.d. | external caffeine standard |
| [39] | n.d. | n.d. | n.d. | n.d. | external caffeine standard |
| [40] | n.d. | n.d. | n.d. | n.d. | external caffeine standard |
| [41] | 0.9963 | 0.3 mg/L | 0.10 mg/L | 1.54–2.47% | 5-point calibration curve (calibration range: 5, 10, 25, 50, 100 mg/L) |
| [42] | n.d. | n.d. | n.d. | n.d. | n.d. |
| [44] | 0.9994 | 0.8134 μg/mL | 0.2684 μg/mL | calibration range: 0.225–1.125 mg/mL; y = 1217.2x − 2.5241 | |
| [45] | 0.9999 | n.d. | n.d. | n.d. | calibration range: 20–1000 ng |
| [46] | 0.9881 | 2 μg/mL | 0.5 μg/mL | n.d. | calibration range: 0.0625–1 mg; y = 18,940x + 944.19 |
| [47] | 0.999 | n.d. | n.d. | n.d. | y = 370,683x + 32.205 |
| [48] | n.d. | n.d. | n.d. | n.d. | external caffeine standard |
| [49] | ≥0.999 | n.d. | n.d. | n.d. | 5-point calibration curve (calibration range: 10–35 μg/mL) |
| [50] | n.d. | n.d. | n.d. | external caffeine standard | |
| [51] | n.d. | n.d. | n.d. | n.d. | n.d. |
| [52] | 1.000 | 0.004 μg/mL | 0.001 μg/mL | interday 4.00%; intraday 0.40% | calibration range: 0.005–5 µg/mL; y = 135,892x + 1311.1 |
| [53] | 0.9992 | 1.75 mg/L | 0.52 mg/L | interday 0.22%; intraday 1.46% | calibration range: 50–1000 mg/L; y = 1.509x − 6.93 |
| [54] | n.d. | n.d. | n.d. | n.d. | 5-point calibration curve |
| [56] | n.d. | n.d. | n.d. | n.d. | external caffeine standard |
| [57] | >0.99 | 151.0 mg/100 g | 45.0 mg/100 g | n.d. | 5/8-point calibration curve (calibration range: 23–117 mg/100 g); y = 1.6474x − 1.2918 |
| [58] | 0.9978 | 0.35 µg/mL | 0.10 µg/mL | interday: 0.35% | linear range: 0.0195−10 µg/mL; y = 10,373 x + 985.93 |
| [58] | n.d. | n.d. | n.d. | n.d. | 5-point calibration curve |
| [60] | n.d. | n.d. | n.d. | n.d. | external caffeine standard |
| Authors | Cold Brew | Espresso | French Press | AeroPress | Moka |
|---|---|---|---|---|---|
| [29] | ⏺ | ⏺ | |||
| [30] | ⏺ | ⏺ | ⏺ | ⏺ | ⏺ |
| [31] | ⏺ | ||||
| [32] | ⏺ | ||||
| [33] | ⏺ | ⏺ | |||
| [34] | ⏺ | ||||
| [35] | ⏺ | ⏺ | |||
| [36] | ⏺ | ⏺ | |||
| [37] | ⏺ | ||||
| [38] | ⏺ | ||||
| [39] | ⏺ | ⏺ | |||
| [40] | ⏺ | ||||
| [41] | ⏺ | ||||
| [42] | ⏺ | ||||
| [43] | ⏺ | ||||
| [44] | ⏺ | ⏺ | ⏺ | ⏺ | |
| [45] | ⏺ | ||||
| [46] | ⏺ | ||||
| [47] | ⏺ | ||||
| [48] | ⏺ | ||||
| [49] | ⏺ | ||||
| [50] | ⏺ | ||||
| [51] | ⏺ | ⏺ | ⏺ | ||
| [52] | ⏺ | ⏺ | |||
| [53] | ⏺ | ||||
| [54] | ⏺ | ||||
| [55] | ⏺ | ||||
| [56] | ⏺ | ||||
| [57] | ⏺ | ||||
| [58] | ⏺ | ⏺ | |||
| [59] | ⏺ | ||||
| [60] | ⏺ |
| Brewing Parameters | Caffeine Determination Method | Caffeine Content | Reference | |||||
|---|---|---|---|---|---|---|---|---|
| Brewing Time [h] | T of Water [°C] | Amount of Water [mL] | Amount of Coffee [g] | Coffee:Water Ratio | ||||
| [mg/100 mL] | ||||||||
| 4, 7 | 20 | 250 | 25 | 10:100 | HPLC | 125.00 | [30] | |
| 3 | 5 | 250 | 25 | 10:100 | HPLC | 76.10 | [31] | |
| 22 | 78.40 | |||||||
| 6 | 5 | 89.30 | ||||||
| 22 | 97.30 | |||||||
| 16 | 20 | 30k | 1800 | 6:100 | HPLC | 72.00 | [23] | |
| 14 | 19 | 330 | 31.5 | 9:100 | HPLC | 75.05–80.50 | [34] | |
| 24 | 21–25 | 350 | 35 | 10:100 | HPLC | 108.00–118.00 | [39] | |
| 9 | 4 | 100 | 7 | 7:100 | HPLC | 63.00–95.00 | [40] | |
| 12 | 24 | 250 | 25 | 10:100 | HPLC | 96.30–120.40 | [44] | |
| 9 | 23–25 | n.d. | n.d. | 5:100 | HPLC | 48.87–66.60 | [47] | |
| 24 | 54.01–78.30 | |||||||
| 15 | 5 | 150 | 15 | 10:100 | HPLC | 116.60–120.10 (A) | [49] | |
| 10 | 120.10–121.30 (A) | |||||||
| 15 | 122.50–125.70 (A) | |||||||
| 5 | 175.3–180.10 (R) | |||||||
| 10 | 179.90–180.00 (R) | |||||||
| 15 | 178.60–178.80 (R) | |||||||
| 12 | 4 | 150 | 30 | 20:100 | HPLC | 137.00 | [59] | |
| 10 | 135.00 | |||||||
| 18 | 22 | n.d. | n.d. | 10:100 | HPLC | 48.00–49.00 | [60] | |
| [mg/100 g] | ||||||||
| 24 | n.d. | 3000 | 450 | 15:100 | HPLC | 1288.00 | [29] | |
| 5, 16, 24 | 10 | n.d. | n.d. | 17–20:100 | HPLC | 761.00–1002.00 | [42] | |
| n.d. | 20 | n.d. | n.d. | 5–11:100 | SP | 2670.00 | [43] | |
| 24 | 19.3 | 5000 | 300 | 6:100 | HPLC | 605.00–743.00 | [57] | |
| 7, 15.5, 24 | 4, 17, 30 | n.d. | n.d. | 6–16:100 | HPLC | 4080.76 | [58] | |
| Brewing Parameters | Caffeine Determination Method | Caffeine Content | Reference | ||||
|---|---|---|---|---|---|---|---|
| Brewing Time [s] | T of Water [°C] | Amount of Water [mL] | Amount of Coffee [g] | Coffee:Water Ratio | |||
| [mg/100 mL] | |||||||
| 27 | 93 | n.d. | 14 | n.d. | HPLC | 410.00 | [30] |
| n.d. | 93 | 25 | 7 | 28:100 | HPLC | 244.00 | [33] |
| 25 | 92 | 25 | 7.5 | 28:100 | HPLC | 526.80–576.00 (A) | [34] |
| 911.20–1020.00 (R) | |||||||
| n.d. | 92 | 25 | 7 | 28:100 | HPLC | 248.68 | [38] |
| n.d. | 93 | n.d. | 14 | 50:100 | HPLC | 311.30–576.60 (A) | [41] |
| 505.70–1210.80 (R) | |||||||
| 30 | 90 | 25 | 7 | 28:100 | HPLC | 47.30–53.50 | [44] |
| n.d. | 92 | 15–53 | 9, 18 | n.d. | HPLC | 240.00–700.00 | [45] |
| n.d. | 95–97 | 50 | 7 | 14:100 | HPLC | 97.71 | [48] |
| 25 | 88–93 | 25 | 15 | 60–100 | HPLC | 174.00 (A) | [50] |
| 90 | 256.00 (A) | ||||||
| 93–88 | 214.00 (A) | ||||||
| 88–93 | 281.00 (R) | ||||||
| 90 | 245.00 (R) | ||||||
| 93–88 | 119.00 (R) | ||||||
| 25–26 | 93 | n.d. | 8 | n.d. | HPLC | 83.90–108.00 | [53] |
| 8–24 | 92 | 25 | 6, 7, 8 | 24–32:100 | HPLC | 320.12–521.44 | [56] |
| [mg/100 g] | |||||||
| 30 | 90 | 50 | 14 | 28:100 | NMR | 2868.00–3871.00 (A) | [35] |
| 4835.00–6379.00 (R) | |||||||
| n.d. | 79.1–96.5 | n.d. | 20 | n.d. | HPLC | 457.00 | [55] |
| Brewing Parameters | Caffeine Determination Method | Caffeine Content | Reference | ||||
|---|---|---|---|---|---|---|---|
| Brewing Time [min] | T of Water [°C] | Amount of Water [mL] | Amount of Coffee [g] | Coffee:Water Ratio | |||
| [mg/100 mL] | |||||||
| 5.00 | 93 | 250 | 15 | 6:100 | HPLC | 52.00 | [30] |
| 5.00 | 95 | 250 | 25 | 10:100 | HPLC | 109.40 | [31] |
| 5.00 | 90 | 330 | 31.5 | 9:100 | HPLC | 82.87–85.24 | [36] |
| 5.00 | 90 | 250 | 22.5 | 9:100 | HPLC | 82.00 | [37] |
| 6.00 | 98 | 350 | 35 | 10:100 | HPLC | 104.00–106.00 | [39] |
| 8.00 | 93 | 250 | 15 | 6:100 | HPLC | 55.40–77.0 | [44] |
| 4.00 | 93 | 300 | 20 | 7:100 | HPLC | 99.28–148.52 | [51] |
| 4.00 | 93 | 300 | 20 | 7:100 | UHPLC | 52.66–73.47 | [52] |
| [mg/100 g] | |||||||
| 6.00 | 93 | 660 | 36 | 5:100 | LC–ESI–MS/MS | 2971.02 | [58] |
| Brewing Parameters | Caffeine Determination Method | Caffeine Content [mg/100 mL] | Reference | ||||
|---|---|---|---|---|---|---|---|
| Brewing Time [min] | T of Water [°C] | Amount of Water [mL] | Amount of Coffee [g] | Coffee:Water Ratio | |||
| 1.35 | 93 | 250 | 16.5 | 7:100 | HPLC | 78.00 | [30] |
| 1.25 | 93 | 250 | 18 | 7:100 | HPLC | 49.80–62.90 | [44] |
| 1.67 | 88 | 200 | 12 | 6:100 | HPLC | 46.00–75.00 | [46] |
| 3.75 | 93 | 225 | 15 | 7:100 | HPLC | 83.10–158.73 | [51] |
| 2.00 | 93 | 300 | 20 | 7:100 | UHPLC | 52.05–60.77 | [52] |
| Brewing Parameters | Caffeine Determination Method | Caffeine Content | Reference | ||||
|---|---|---|---|---|---|---|---|
| Brewing Time [min] | T of Water [°C] | Amount of Water [mL] | Amount of Coffee [g] | Coffee:Water Ratio | |||
| [mg/100 mL] | |||||||
| 2.13 | 100 | 150 | 15 | 10:100 | HPLC | 128.00 | [31] |
| 3.00 | 100 | 80 | 11.3 | 15:100 | HPLC | 168.00 | [33] |
| 3.67–4.00 | 100 | 250 | 20 | 8:100 | HPLC | 234.23–290.31 | [51] |
| n.d. | n.d. | n.d. | 10 | n.d. | SP | 539.90 | [54] |
| [mg/100 g] | |||||||
| 10.00 | 93 | 100 | 12 | 12:100 | NMR | 3194.00–4476.00 (A) | [35] |
| 4657.00–6564.00 (R) | |||||||
Disclaimer/Publisher’s Note: The statements, opinions and data contained in all publications are solely those of the individual author(s) and contributor(s) and not of MDPI and/or the editor(s). MDPI and/or the editor(s) disclaim responsibility for any injury to people or property resulting from any ideas, methods, instructions or products referred to in the content. |
© 2024 by the authors. Licensee MDPI, Basel, Switzerland. This article is an open access article distributed under the terms and conditions of the Creative Commons Attribution (CC BY) license (https://creativecommons.org/licenses/by/4.0/).
Share and Cite
Mystkowska, I.; Dmitrowicz, A.; Sijko-Szpańska, M. Quantitative Analysis of Caffeine in Roasted Coffee: A Comparison of Brewing Methods. Appl. Sci. 2024, 14, 11395. https://doi.org/10.3390/app142311395
Mystkowska I, Dmitrowicz A, Sijko-Szpańska M. Quantitative Analysis of Caffeine in Roasted Coffee: A Comparison of Brewing Methods. Applied Sciences. 2024; 14(23):11395. https://doi.org/10.3390/app142311395
Chicago/Turabian StyleMystkowska, Iwona, Aleksandra Dmitrowicz, and Monika Sijko-Szpańska. 2024. "Quantitative Analysis of Caffeine in Roasted Coffee: A Comparison of Brewing Methods" Applied Sciences 14, no. 23: 11395. https://doi.org/10.3390/app142311395
APA StyleMystkowska, I., Dmitrowicz, A., & Sijko-Szpańska, M. (2024). Quantitative Analysis of Caffeine in Roasted Coffee: A Comparison of Brewing Methods. Applied Sciences, 14(23), 11395. https://doi.org/10.3390/app142311395