Article

REDUCE—A Tool Supporting Inconsistencies Reduction in the Decision-Making Process

Department of Complex Systems, Rzeszów University of Technology, Al. Powstańców Warszawy 12, 35-959 Rzeszów, Poland
*
Author to whom correspondence should be addressed.
Appl. Sci. 2024, 14(23), 11465; https://doi.org/10.3390/app142311465
Submission received: 11 September 2024 / Revised: 19 November 2024 / Accepted: 29 November 2024 / Published: 9 December 2024
(This article belongs to the Special Issue Decision-Making Methods: Applications and Perspectives)

Abstract

:
This paper presents REDUCE, a free online tool designed to support decision-making processes by addressing inconsistency in multiplicative pairwise comparison (PC) matrices, a key element of many multi-criteria decision-making (MCDM) methods, including the analytic hierarchy process (AHP). AHP relies on pairwise comparisons to assign weights to decision criteria or alternatives, but human-generated PC matrices often exhibit inconsistencies. Consistency is evaluated using Saaty’s consistency ratio ( C R ), where a value below 0.10 is considered acceptable. Higher inconsistency levels necessitate matrix corrections, which are challenging if the original expert is unavailable or revision constraints exist. REDUCE autonomously reduces inconsistency in PC matrices using two different algorithms that require no expert intervention. The tool accommodates different PC matrices, enabling users to specify the desired CR threshold (e.g., C R 0.10 ) and select the algorithm for adjustment. It ensures the resulting matrix is consistent while preserving the original preference structure to the greatest extent possible. Additionally, REDUCE calculates weights for the compared entities, making it a valuable tool for applications of AHP and related methodologies. Quantitative evaluations demonstrate that REDUCE can improve matrices with high inconsistency (e.g., C R = 0.25 ) to acceptable levels (e.g., C R = 0.08 ) while retaining up to 95% of the original preference integrity, depending on the chosen algorithm. By addressing the accessibility gap for small and medium enterprises (SMEs) that lack resources for costly decision-making software or expert consultants, REDUCE facilitates broader adoption of MCDM tools. This work highlights the potential of REDUCE to enhance decision-making reliability and accessibility in resource-constrained environments.

1. Introduction

Pairwise comparisons (PC) are a critical method used across a wide range of disciplines for evaluating entities by comparing them in pairs to determine which entity is preferred or possesses more of a particular attribute. This technique is foundational in areas such as decision making, psychometrics, machine learning, statistical analysis, and ranking systems. A prominent application of pairwise comparisons is in decision analysis, particularly through Saaty’s analytic hierarchy process (AHP). AHP structures complex decision-making problems into a hierarchy, making them easier to handle by breaking them into sub-problems that can be analyzed independently [1]. AHP has found extensive use in resource allocation, project prioritization, and strategic planning [2,3,4]. In psychometrics, pairwise comparisons are instrumental in developing scales for measuring attitudes, preferences, and perceptions. Thurstone’s Law of Comparative Judgment is a classical model utilizing pairwise comparisons to quantify subjective experiences [5]. This approach has been used effectively in studies that assess consumer preferences, social attitudes, and educational assessments [6,7]. The field of machine learning also benefits significantly from pairwise comparisons, especially in classification and ranking algorithms. Algorithms such as support vector machines (SVM) and RankNet use pairwise comparison principles to train models to distinguish between classes or ranking items based on certain criteria [8]. These techniques have demonstrated substantial effectiveness in bioinformatics, information retrieval, and recommendation systems [9,10]. In statistical analysis, pairwise comparisons are commonly employed for multiple comparisons among group means in analysis of variance (ANOVA). techniques, such as Tukey’s honestly significant difference (HSD) test and Bonferroni correction, and are used to control Type I errors in multiple pairwise tests [11,12]. These methods are crucial in experimental research for determining significant differences between group means [13,14]. Sports and gaming also heavily utilize pairwise comparisons for ranking systems. The Elo rating system, initially developed for chess, is a notable application that updates player ratings based on match outcomes [15]. This system has been adapted for various sports and online gaming platforms, ensuring a dynamic and equitable ranking method [16,17]. Recent advancements in computational techniques and the availability of large datasets have further highlighted the importance of pairwise comparisons. Algorithms that handle large pairwise comparison matrices facilitate more complex applications [18,19]. For example, in crowdsourcing platforms, pairwise comparisons are used to aggregate human judgments for tasks such as image labeling, sentiment analysis, and quality assessment of content [20,21].
Pairwise comparisons are also central to preference learning and decision theory. Models predicting individual or group preferences from pairwise comparison data enhance decision support systems in healthcare, finance, and marketing [22,23]. These models leverage probabilistic and statistical methods to manage inconsistencies and uncertainties in human judgments, thus improving the reliability of derived preferences [24,25]. Despite their wide application, pairwise comparisons face challenges, particularly inconsistency in judgments due to human error, cognitive biases, or lack of information [26,27,28]. The potential for path dependency and its impact on decision outcomes has also been empirically demonstrated in recent studies [29].
If, for pairwise comparisons, a reciprocal matrix A = ( a i j ) is defined, where a i j = 1 a j i , a i i = 1 , i , j refers to the value of comparison (e.g., preference of object A over the object B), the pairwise comparisons are consistent if the condition a i j · a j k = a i k ; i , j , k is satisfied.
Methods to detect and mitigate inconsistencies include consistency indices and optimization techniques [30,31,32]. Additionally, scaling pairwise comparison methods for large datasets remains a research focus, with efforts directed towards developing efficient algorithms and computational frameworks [33,34,35]. When such methods and algorithms are proposed, one of the key challenges is the problem of large set matrices generation with assumed consistency ratio ( C R ) in order to test proposed solutions according to several measures. Inconsistency is a pervasive problem in PCs because human experts are rarely completely consistent in expressing their judgments, especially when the number of objects being compared is relatively high. A low level of inconsistency is usually tolerated, but if the inconsistency exceeds a certain threshold, for example, C R = 0.10 , pairwise comparisons must be revised. However, in many situations, it may not be possible for an expert to revise the PC. In such cases, appropriate software comes into play. To the best authors’ knowledge, there was no known free (non-commercial) online tool for reducing inconsistency in pairwise comparisons; here, the proposed solution is an expansion of system that was initially developed in [36]. Therefore, the purpose of this paper is to present and demonstrate the use of REDUCE, a free online tool designed to reduce inconsistency within the PC.
The novelties of REDUCE lie primarily in its accessible, free online format and its specific focus on inconsistency reduction within pairwise comparisons, a feature not typically emphasized in other decision-support tools. Additionally, while other approaches may employ different methodologies, REDUCE was developed to meet the practical needs of small and medium-sized enterprises, which often lack access to costly or complex decision-support software. For these reasons, our primary aim in this paper is to highlight REDUCE’s contributions as a streamlined, user-friendly, and cost-effective tool for enhancing decision-making processes.
The main motivation for proposed paper is to prepare a user-friendly, simple-to-use tool that can support different users when they use AHP-based approaches for decision making and meet with different problems related to the following: inconsistency of experts’ assessment, limited amount of resources (especially money), no desire to use sophisticated tools that usually require extended knowledge about the methodology, and limited knowledge about all theoretical details. Moreover, the proposed solution should be available online, with requirements according to WCAG standards, it should be safe for end-users, and its interface should be limited only to the necessary details.
The paper is divided into two parts. The first, major one (Section 2) is devoted to presentation of the REDUCE application: its main features, used technologies, server and administration solutions, performance, and security tests. The second part is related to descriptions of further development (Section 3) and conclusions (Section 4).

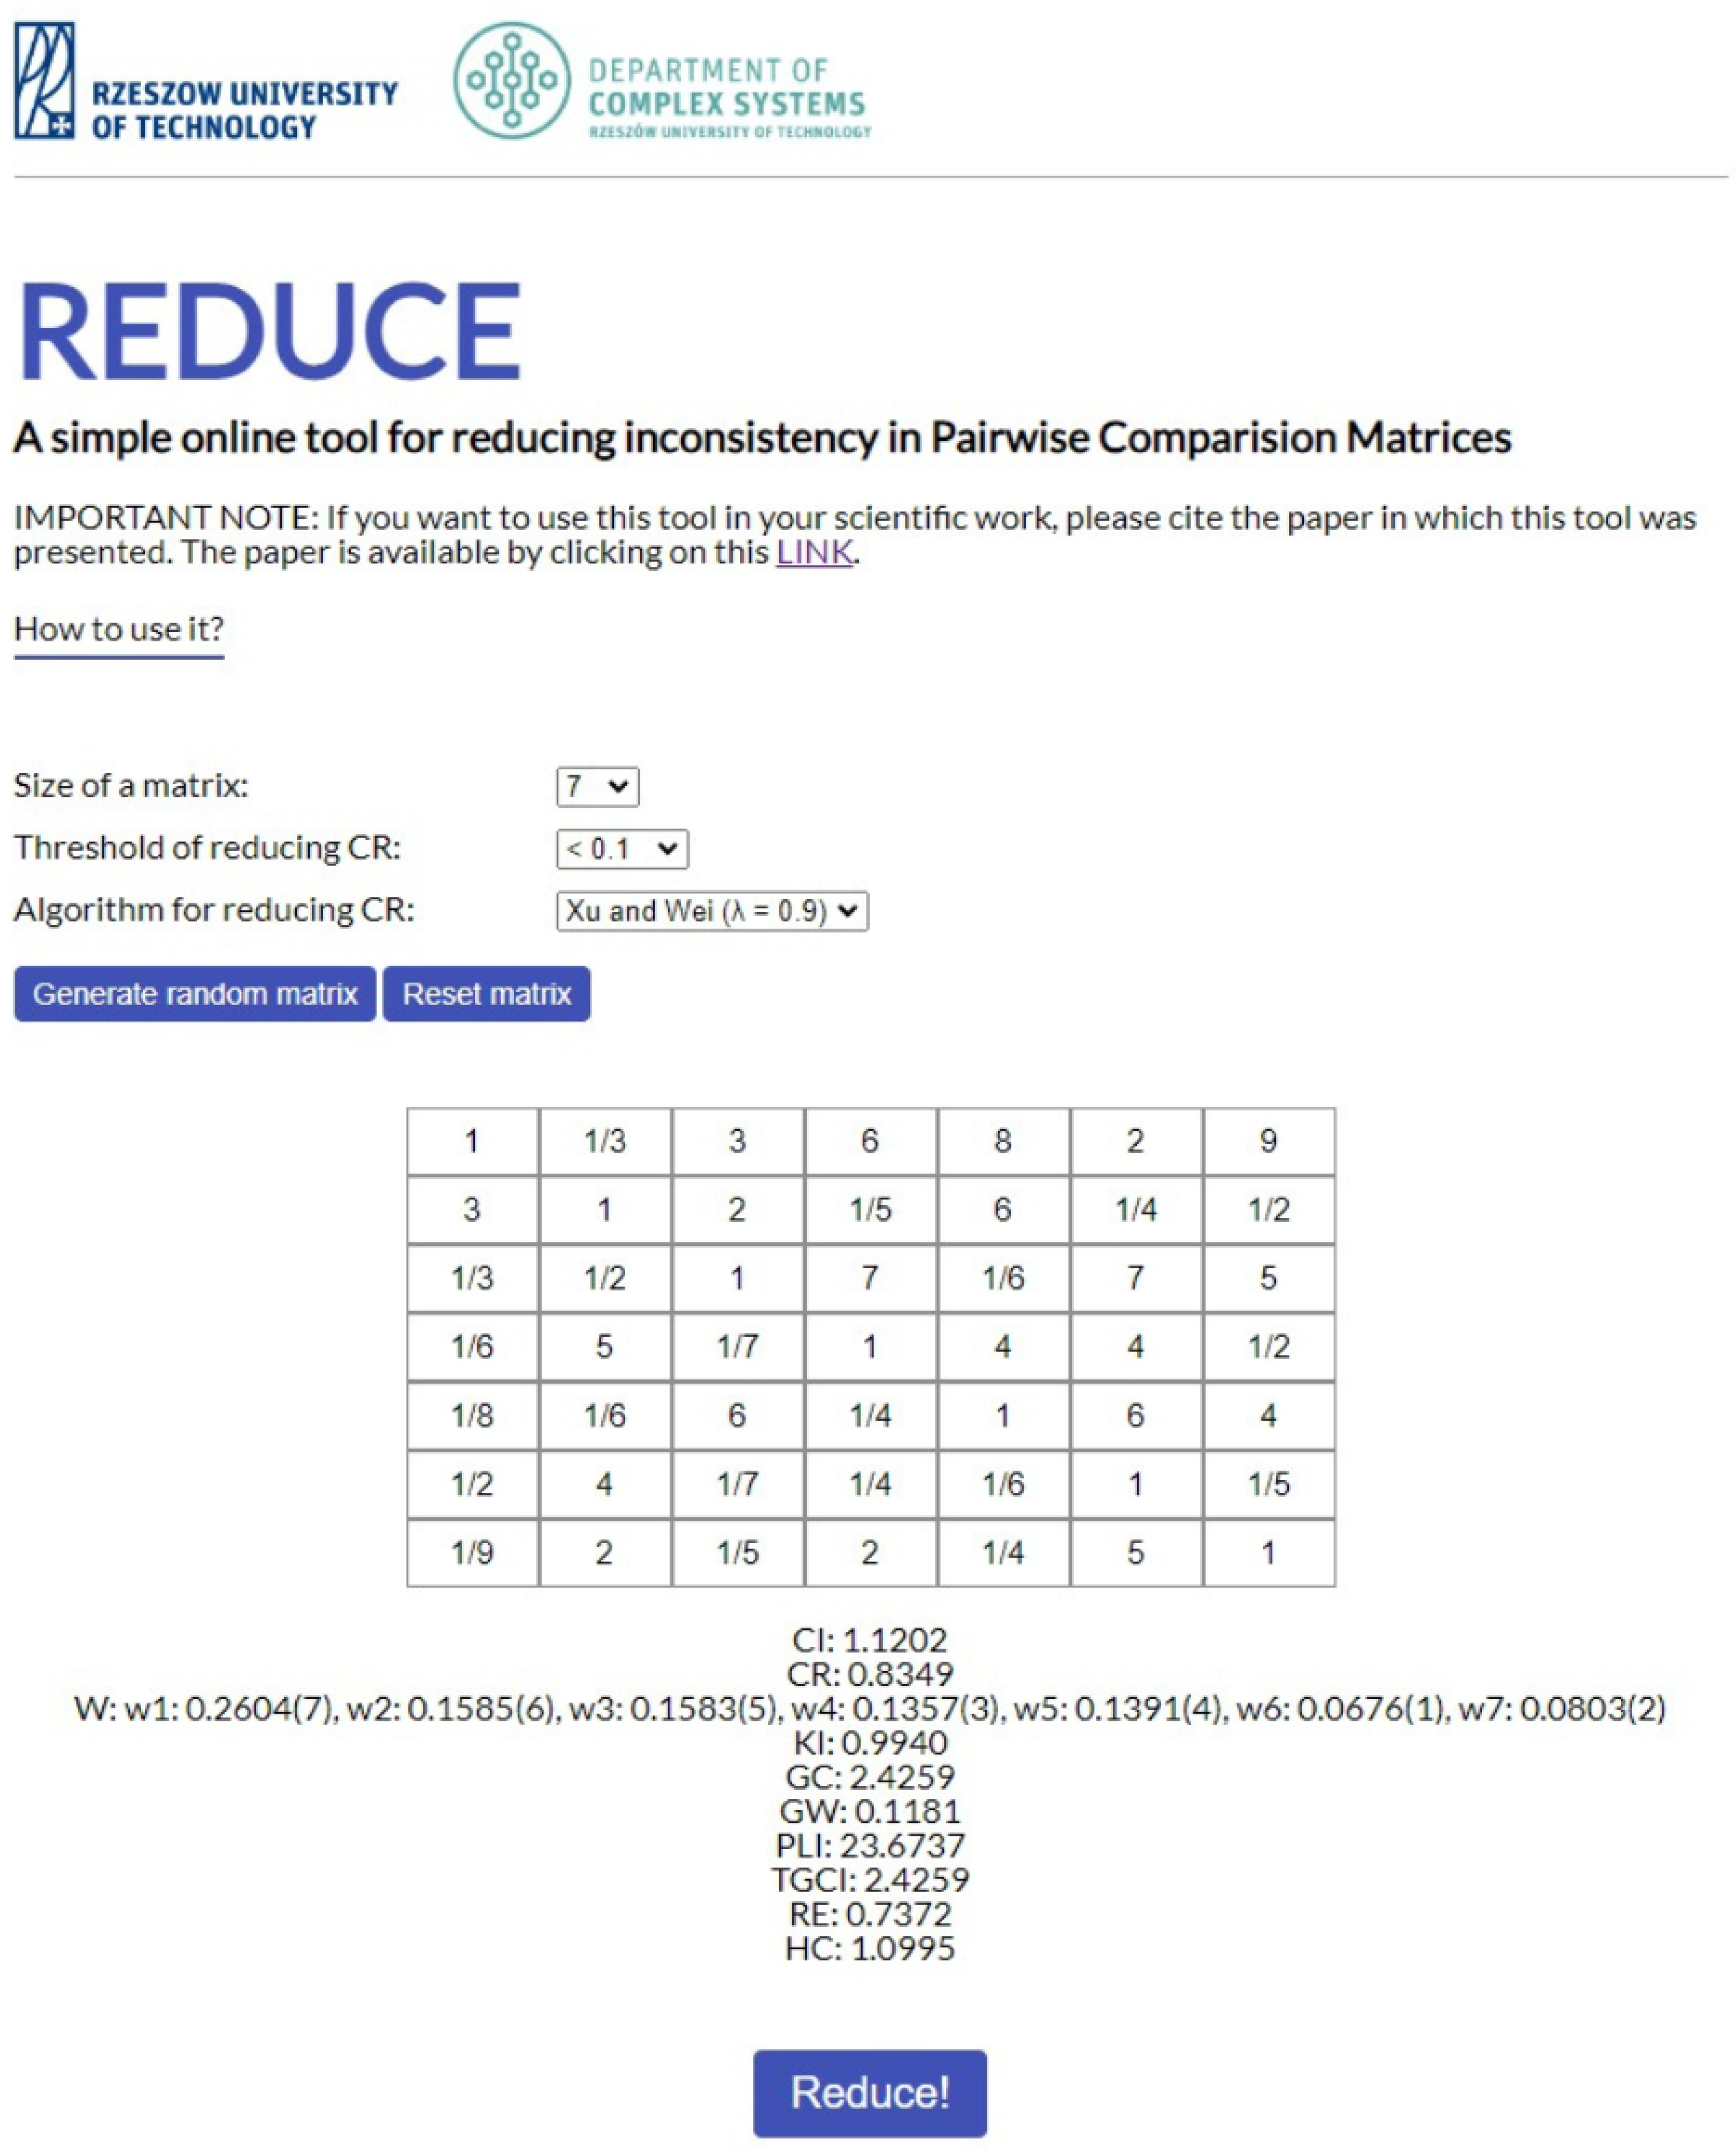
2. Overall Structure and Features of the Application

REDUCE is an online tool available at [37], based on the Flask framework, which enables the integration of Python logic with a web application [38] (Figure 1). In addition to its primary functionality, the application also includes a second module available at [39]. This module allows users to efficiently generate multiple pairwise comparison matrices with desired parameters, streamlining the process of creating matrices with specified inconsistency coefficients. This functionality is described in detail in a separate publication by Kuraś and Gerka [40]. Python was chosen as the programming language because the core library of the application, REDUCE.py [41], is written in Python. The front end of the application is built using standard web technologies, such as HTML, CSS, JavaScript, and the jQuery library [42], which handles AJAX requests [43] to the Flask service [44,45]. The back end utilizes Python, REDUCE.py, Flask, and additional packages such as NumPy [46], SciPy [47], and SymPy [48], which support the implementation of matrix reduction algorithms and eigenvector calculations. The application is hosted on a server at the Department of Complex Systems [49] as a part of the Faculty of Electrical and Computer Engineering, Rzeszów University of Technology, Poland, running Ubuntu Server [50], with services like Gunicorn [51], NGINX [52], and Certbot [53] for SSL certificate management. The entire system is protected by a Cisco ASA 5505 firewall [54], the Snort system [55], and a virtual firewall ufw [56], and it is accessible via a public address in the University Computer Network [57].
REDUCE allows for the input of pairwise comparison matrices of size n × n ( n 10 ) , where comparisons are manually entered into the appropriate cells using Saaty’s scale from 1 to 9 [58,59]. The application offers two inconsistency reduction algorithms: Xu and Wei [60], and Szybowski [61], with the latter requiring integer comparison values. These two algorithms were chosen as the most popular, frequently used, proven, and effective working methods that can be implemented in REDUCE tool for both real and integer input values. In this paper, these algorithms will not be analyzed since they are not the main topic of the paper.
From a practical point of view, the REDUCE interface allows the user to select the matrix size (Figure 1, Size of a matrix), then, the expected inconsistency threshold C R (Figure 1, Threshold of reducing CR) in accordance to [59], next, the reduction algorithm (Figure 1, Algorithm for reducing CR), and, finally, to fill the pairwise matrix according to available numbers after the assessing process. After pressing the REDUCE button, the results of processing are seen, as shown in Figure 2. There are also possibilities for generating a random matrix, or for resetting the values in the matrix. The results of processing include the reduced matrix, the consistency index C I [59], the consistency ratio C R [59], the priority vector, and various inconsistency indices calculated by the Reduce.py library, such as KI [62], GCI [63], GWI [64], PLI [65], TGCI [66], REI [67], and HCI [68] (Figure 2).
These indices were taken into account as the most popular and frequently used ones.
Data validation occurs on the client side, ensuring compliance with application requirements, such as restricting input values to the range of 1 to 9 and verifying that the selected Szybowski algorithm only accepts integer values. Form data are serialized and sent via a POST request in AJAX to the server, where they are converted into a SymPy matrix object, allowing for further calculations. After processing, the results are returned to the client for display, and upon clicking the “REDUCE” button, the server also returns the reduced matrix.

2.1. Analysis of the Application Structure

The REDUCE application (Figure 3) is divided into three main areas:
  • Front-end layer (HTML + CSS + JS) responsible for the appearance and handling of the application, as well as input data validation, including the intermediary layer (AJAX) ensuring communication between the front end and back end, “integrated” with the front end;
  • Back-end layer (Flask + Python libraries) handles server-side computations and transfers the results to the front-end layer;
  • Server and administrative solutions (Ubuntu Server, NGINX, Gunicorn, Certbot).

2.1.1. Front-End Layer

The front-end layer of the REDUCE tool begins with the main container, which encompasses all the content of the page. The central element is a form that allows the user to interact with the application by submitting data to the server. This form, with the auto-complete function disabled, maintains the structural integrity of the page, containing all interactive elements such as matrix size selection, CR reduction threshold, and the inconsistency reduction algorithm. The matrix is presented as a set of lists <ul>, where each row is represented by <li> elements and each cell by an <input> field, allowing for dynamic data entry and validation via JavaScript scripts (Figure 4, Figure 5 and Figure 6). The page also includes logos and headers with links to the Rzeszów University of Technology and the Department of Complex Systems, enhancing the aesthetics and facilitating navigation. Instructions for using the tool are clearly placed to help users understand how to use the application. Additionally, buttons are available for generating a random matrix and resetting entered values, which facilitates testing different configurations. The “Reduce!” button (Figure 2) is a crucial element that activates after the required data are entered into the matrix. Upon clicking, the matrix is sent to the back end for processing. The results, including the reduced matrix and related parameters, are then displayed on the page, allowing the user to further analyze and interact with the data. The entire interface has been designed to ensure an intuitive and smooth user experience.

2.1.2. Back-End Layer

The REDUCE application uses the Flask framework, supported by libraries such as numpy, scipy, sympy, and REDUCE.py for advanced scientific and engineering computations. Key back-end functions are defined in Python and run via Flask, as shown in [69]:
  • main(): renders the main page of the application;
  • if name == “main”: app.run: runs the application when the file is executed as the main script.
Function computeCI_CR() [70] handles POST request at the /computeCI_CR path and is used to calculate coefficients for the matrix based on values entered by user. The matrix is initialized, filled with values, and then subjected to calculations, returning various indicators such as CI, CR, EV, KI, GC, and others needed for data analysis. Function reduceButton() [71] handles POST request at the /reduceButton path, processing the “Reduce!” button. Depending on the matrix size and selected algorithm, the function performs the necessary calculations, including CI, CR, and EV, and returns a dictionary of results. Both functions lack direct error handling, which is compensated for by data validation at the front-end level, minimizing server-side errors and improving the efficiency of the application.

2.1.3. Server and Administrative Solutions

In the development of the REDUCE application, a key element was the implementation of appropriate server and administrative solutions aimed at ensuring both the system’s performance and security. The selection of Gunicorn as the application server, working in conjunction with NGINX as a proxy server, allowed optimal management of network traffic while securing connections through SSL, which is crucial for secure communication. NGINX handles static files and redirects traffic to Gunicorn, enabling load balancing and increasing the system’s flexibility. Certbot was integrated to automatically manage SSL certificates, minimizing the risk associated with outdated certificates [72,73]. Furthermore, the use of firewalls such as ufw, intrusion detection systems such as Snort, and the Cisco ASA hardware firewall provides multilayered protection against threats [74,75,76]. Ufw allows for access control to the server, blocking unauthorized traffic, while Snort detects and prevents attacks such as SQL Injection, XSS, and DDoS through precisely defined security rules [77,78,79,80,81,82,83,84,85,86]. The configuration of administrative access, implemented via the Rzeszów University of Technology’s VPN and RSA key authentication, further strengthens security by restricting server access to authorized users only. This complex server architecture ensures that the REDUCE application not only operates efficiently but is also well protected against potential threats. The following are among the possible threats we can indicate:
  • Malware infections;
  • Denial of service (DoS);
  • Distributed denial of service (DDoS);
  • Ransomware attacks;
  • SQL Injection;
  • Cross-site scripting.

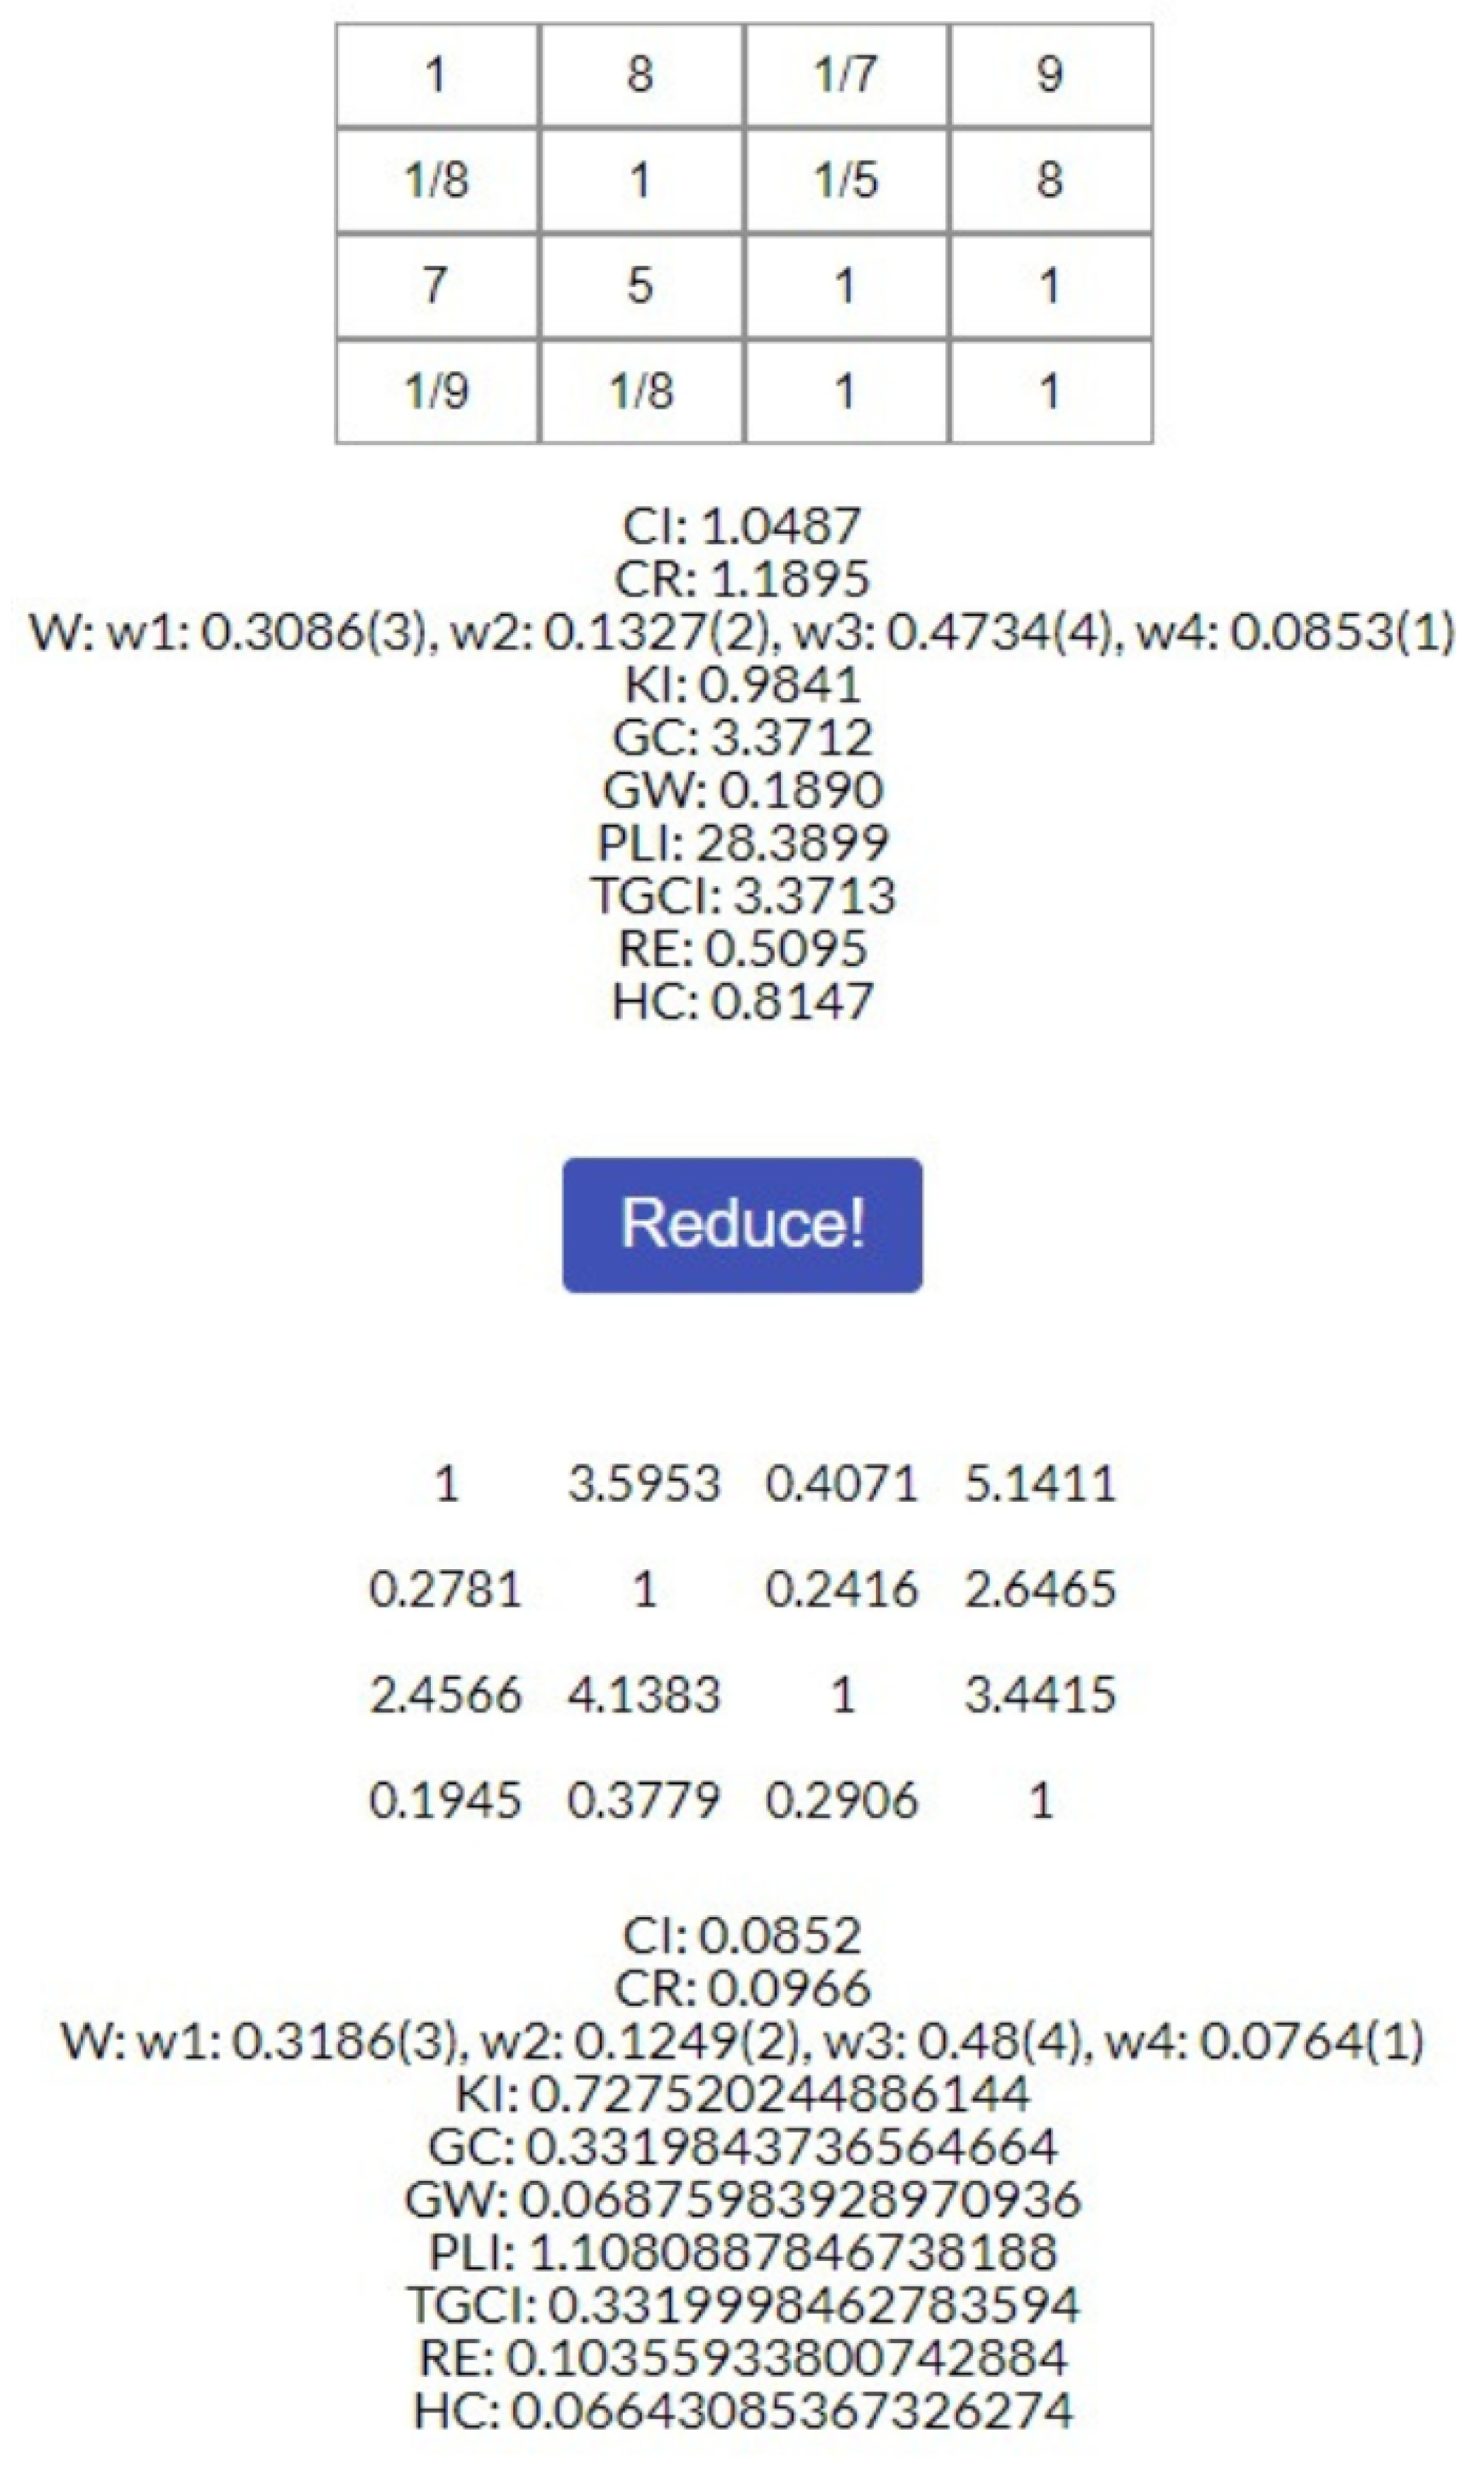
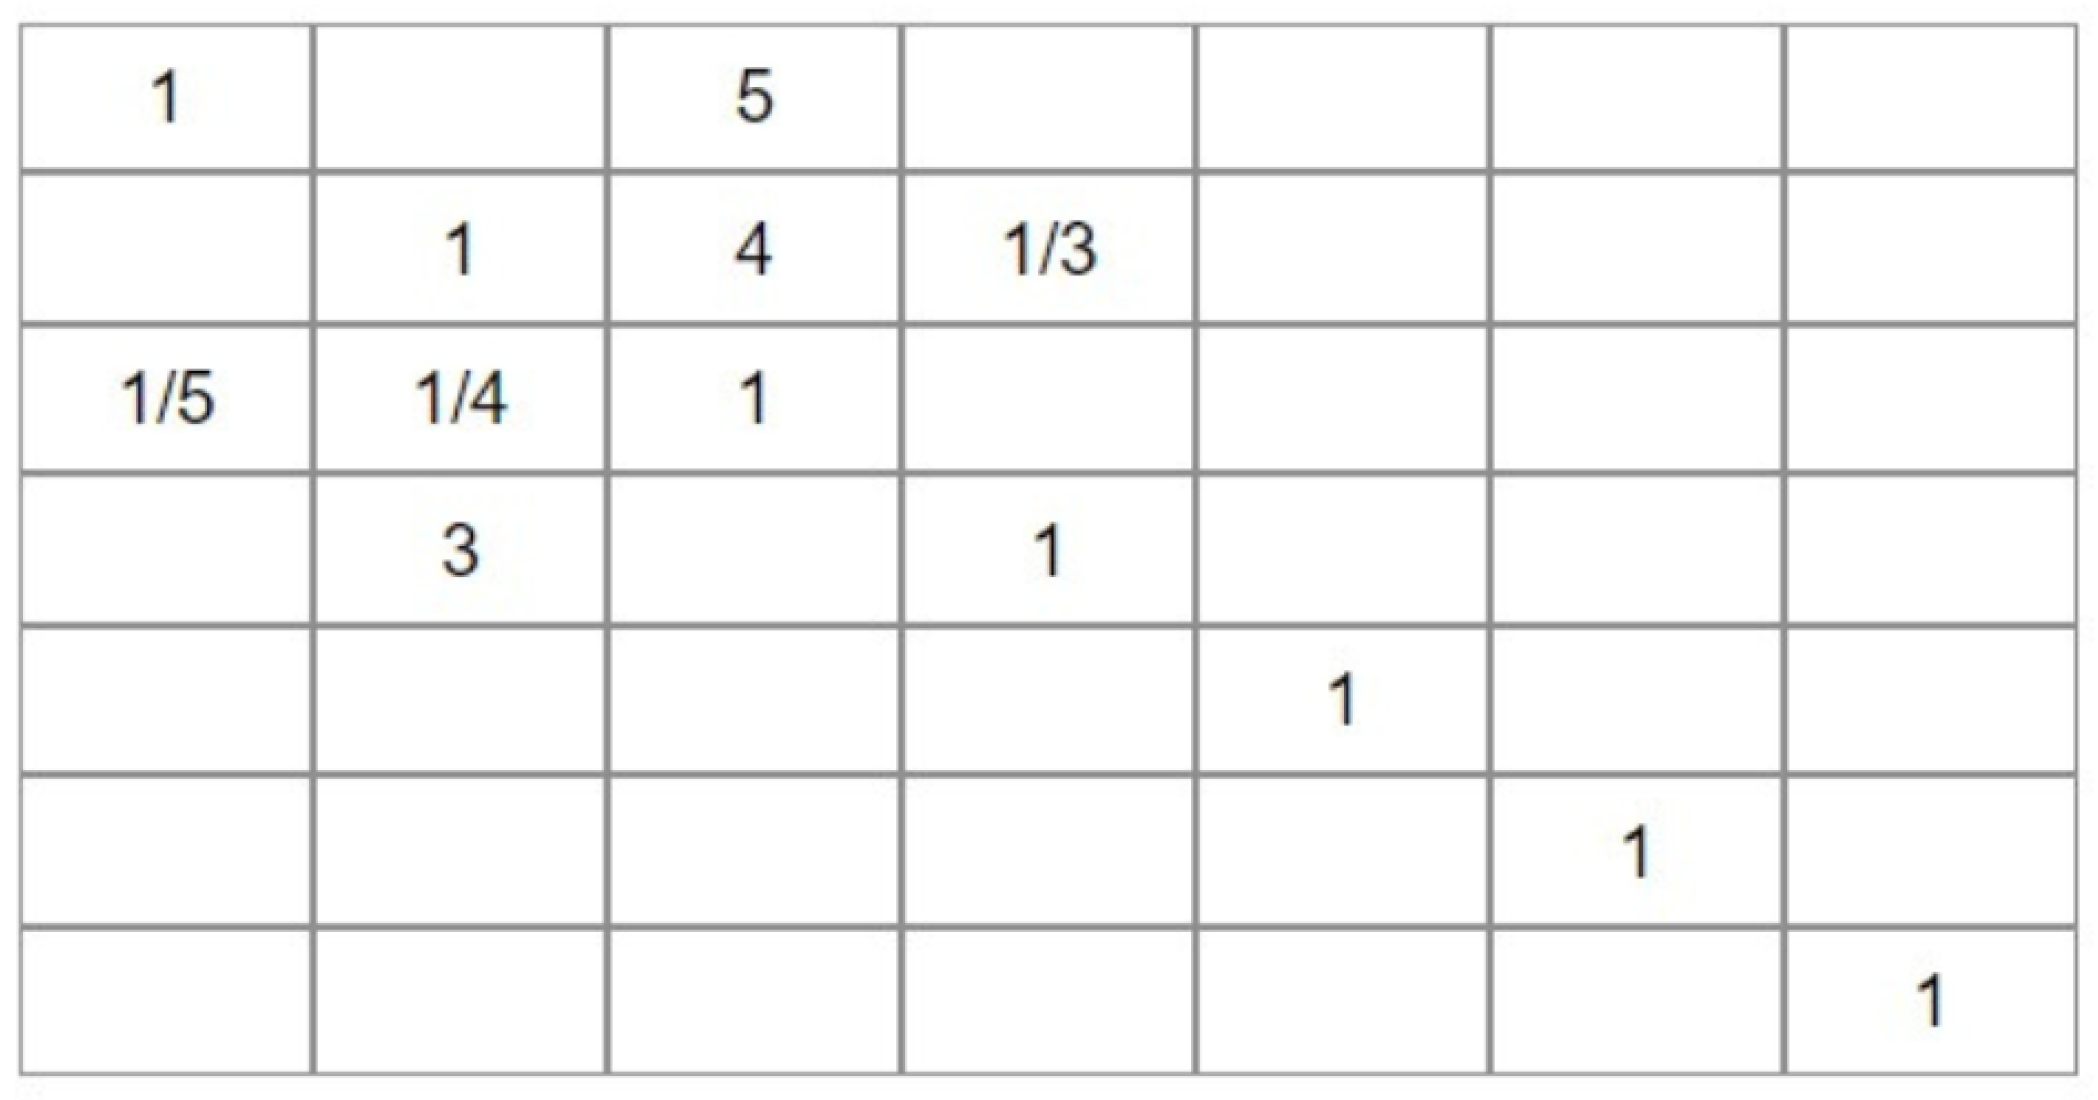
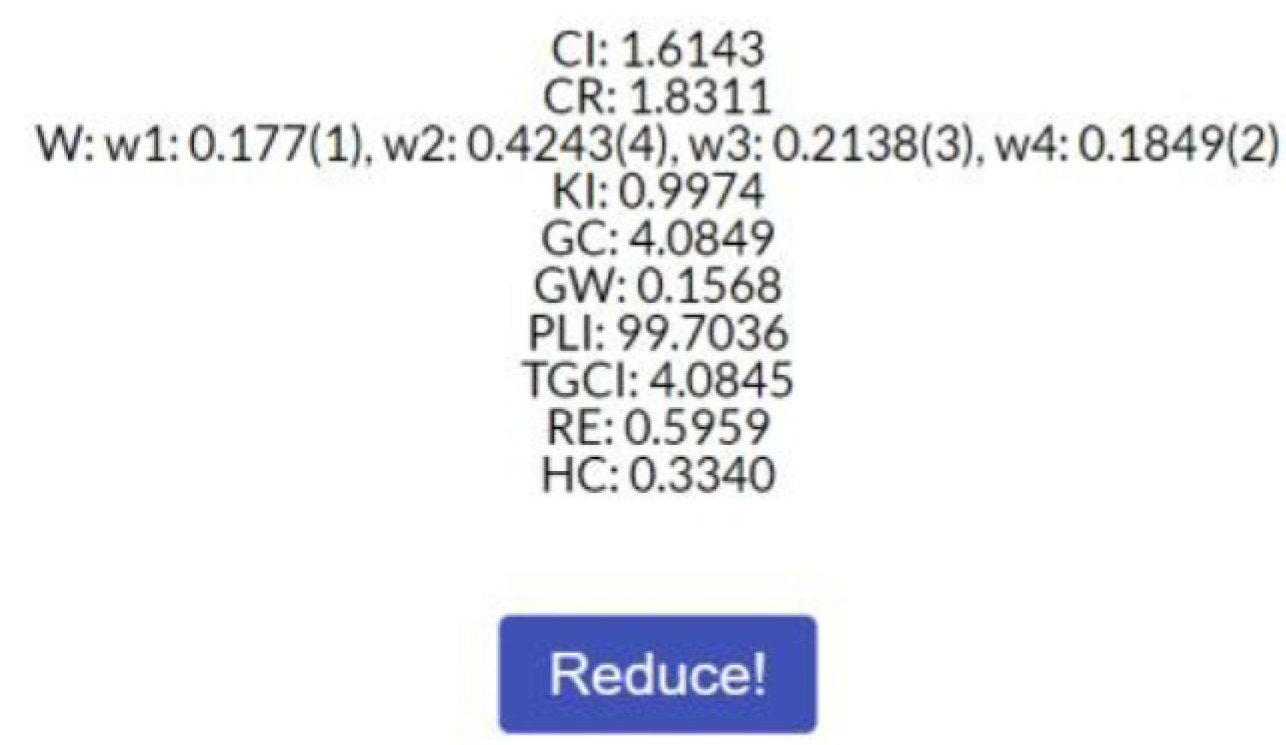
2.1.4. Comparison of Inconsistency Reduction Algorithms in REDUCE

In the REDUCE application, two algorithms are available for reducing inconsistencies in pairwise comparison matrices: the Xu & Wei algorithm [60] and the Szybowski algorithm [61]—the tool is designed to help users improve the consistency of pairwise comparison matrices (PC matrices) by offering these two algorithms, each with distinct characteristics. The Xu & Wei algorithm is an iterative method integrated into REDUCE to reduce inconsistency while balancing the preservation of the original preference values. This method uses a regulatory parameter α to control the adjustment intensity. For instance, in REDUCE, with α = 0.5 , the algorithm makes moderate adjustments to achieve a higher consistency level without excessively altering the original matrix. Consider the matrix
A = 1 3 2 4 1 / 3 1 4 2 1 / 2 1 / 4 1 5 1 / 4 1 / 2 1 / 5 1
with C R = 0.2425 .
In REDUCE, applying the Xu & Wei algorithm with α = 0.5 results in
A Xu & Wei = 1 2.1088 2.1366 4.6456 0.4742 1 2.4817 2.6980 0.4680 0.4029 1 3.4379 0.2153 0.3706 0.2909 1
This adjusted matrix has a significantly lower consistency ratio ( C R = 0.0574 ), making it suitable for cases where reducing inconsistency is crucial.
The Szybowski algorithm, also integrated into REDUCE, focuses on minimizing deviations while preserving the original reciprocal values. This method is intuitive and user friendly, making it ideal for users who prioritize maintaining the integrity of their original inputs. Applying the Szybowski algorithm in REDUCE to the same initial matrix results in
A Szybowski = 1 3 2 4 0.3333 1 1.4372 2 0.5000 0.6958 1 5 0.2500 0.5000 0.2000 1
with C R = 0.0781 .
The Szybowski method preserves original preferences more closely while still achieving a reasonable level of consistency. The Xu & Wei algorithm is best used when aiming for a higher consistency level, even if moderate changes to the original values are necessary—the Szybowski algorithm is recommended when preserving the original preferences is a priority, especially if only minor reductions in inconsistency are needed [87].

2.2. Compatibility, Security, and Performance Testing of Application

Testing the REDUCE application is crucial to ensure its quality, security, and efficiency. The application was tested on various devices and platforms to make sure it provides a consistent experience for all users. Security tests, including firewall evaluations, were conducted to assess how well the system defends against attacks. Additionally, performance tests focused on page loading times helped identify and address bottlenecks, resulting in a smoother and more satisfying user experience.

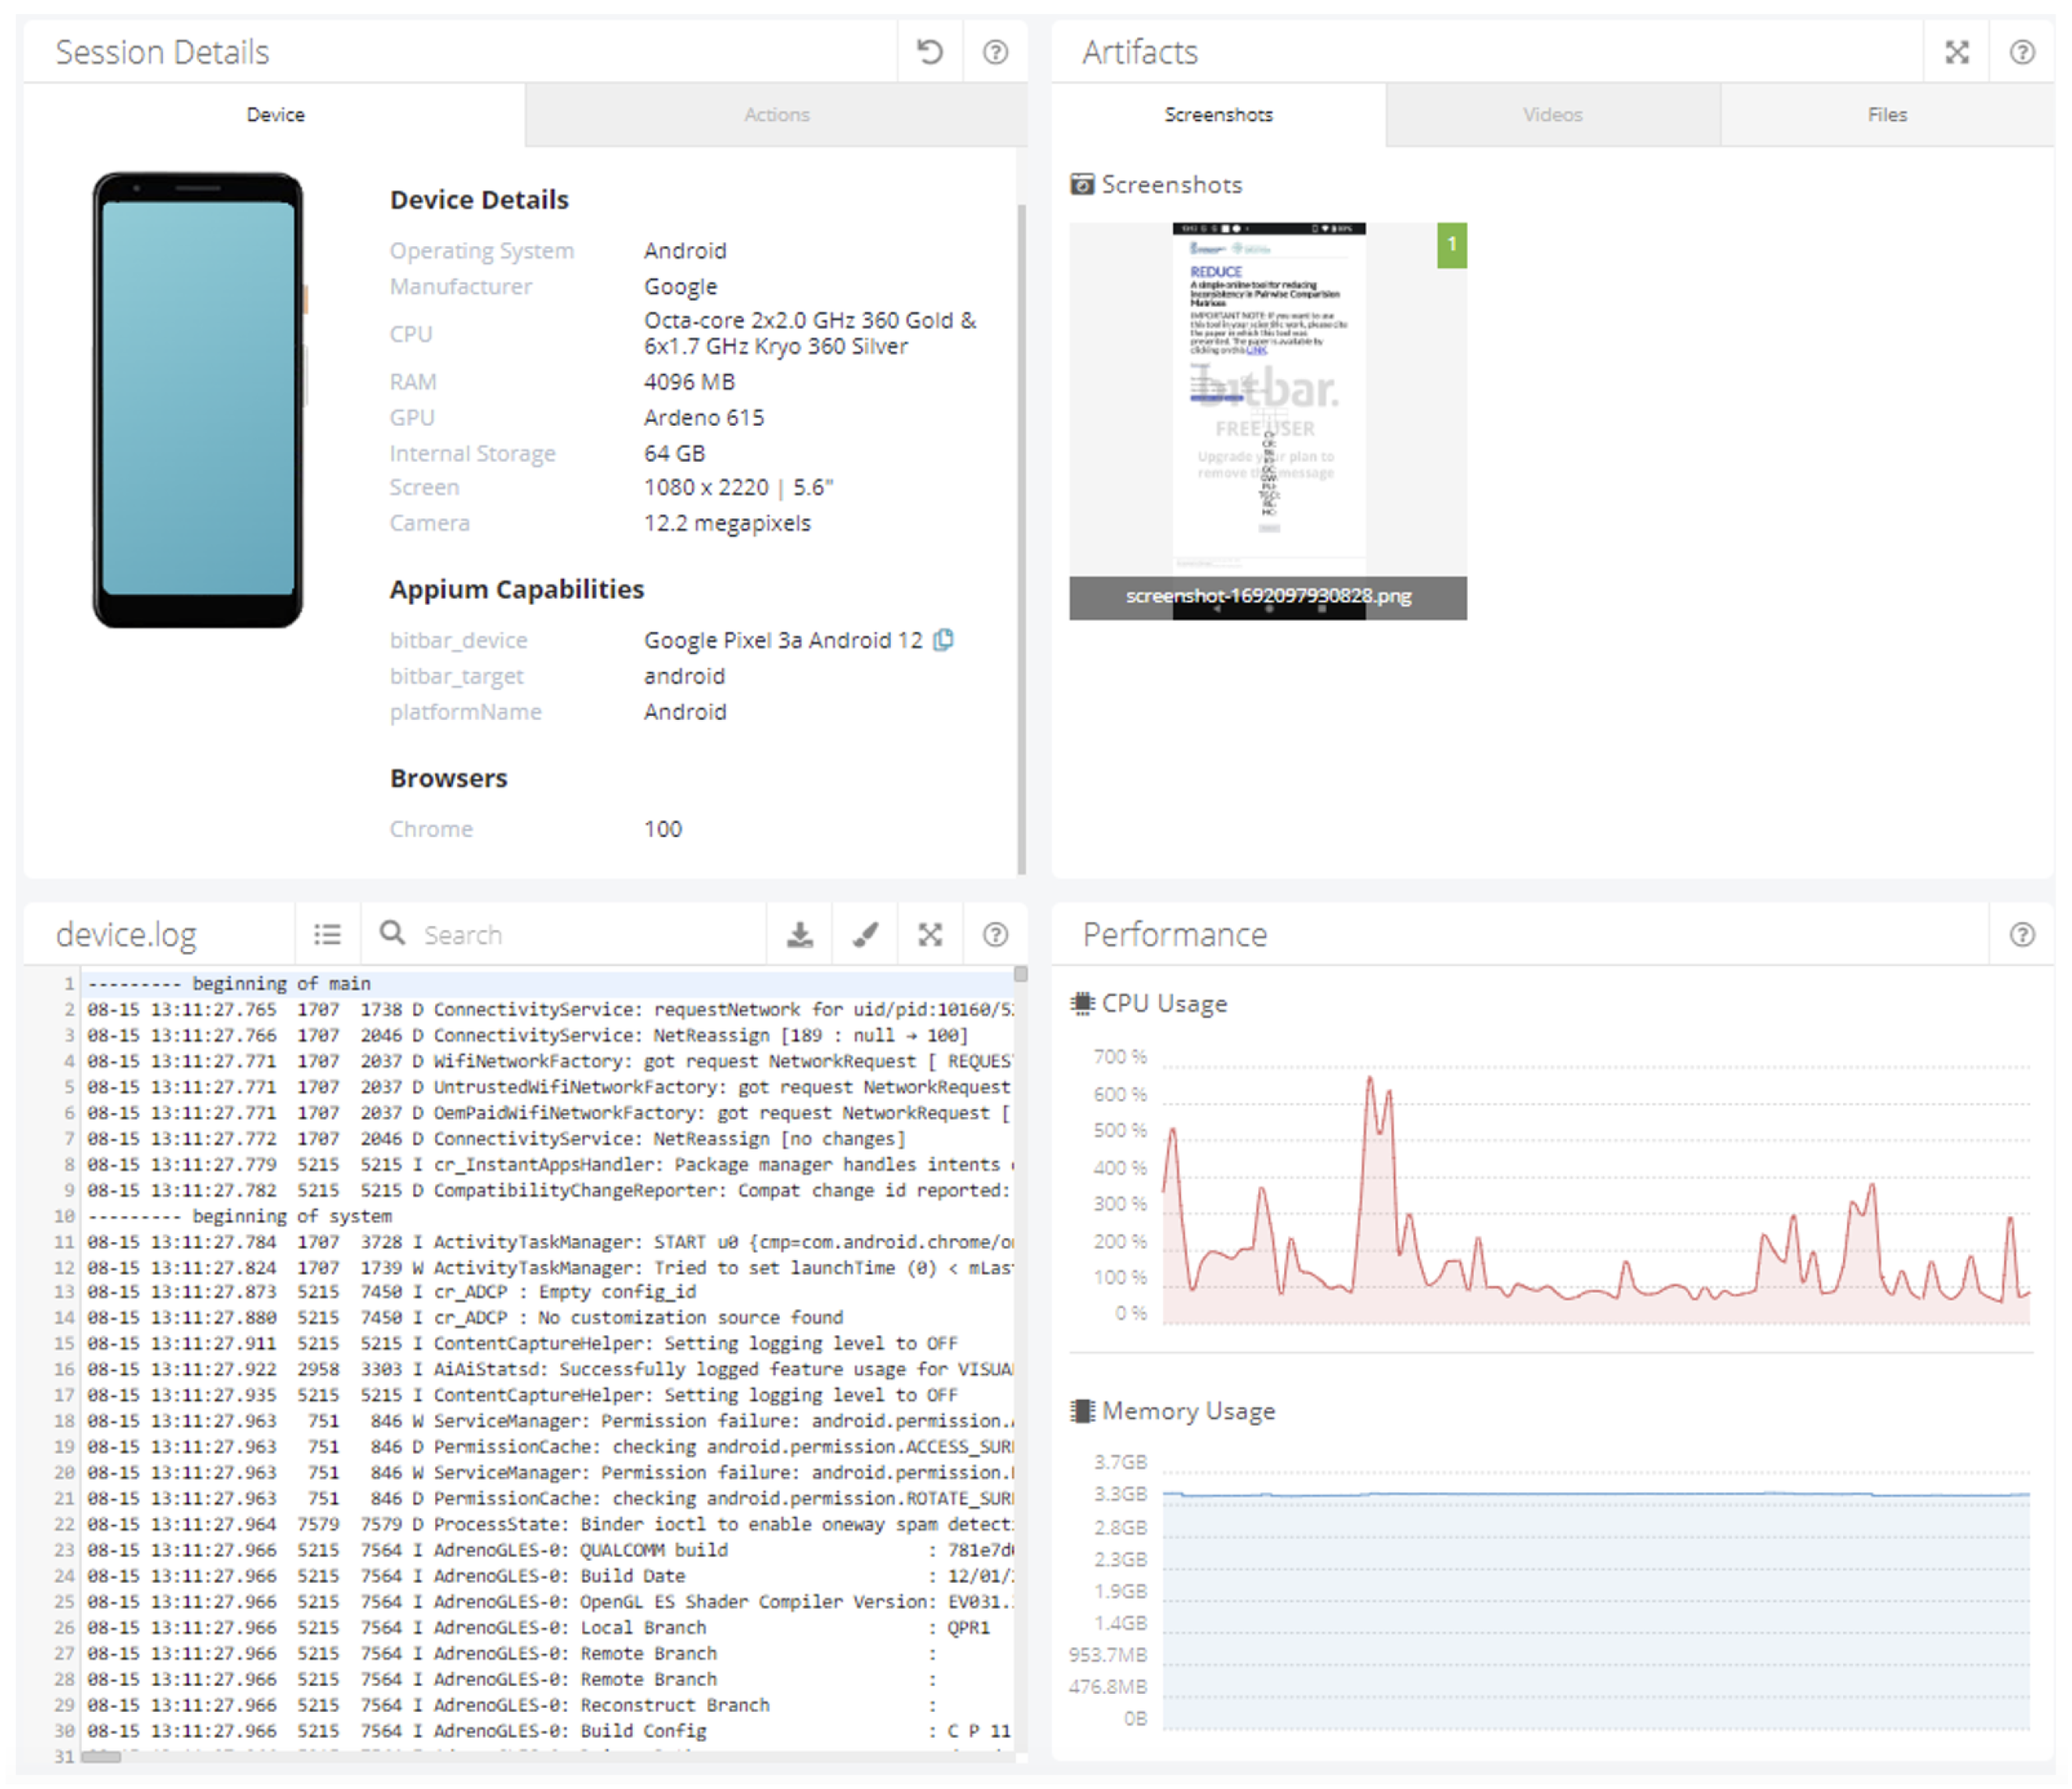
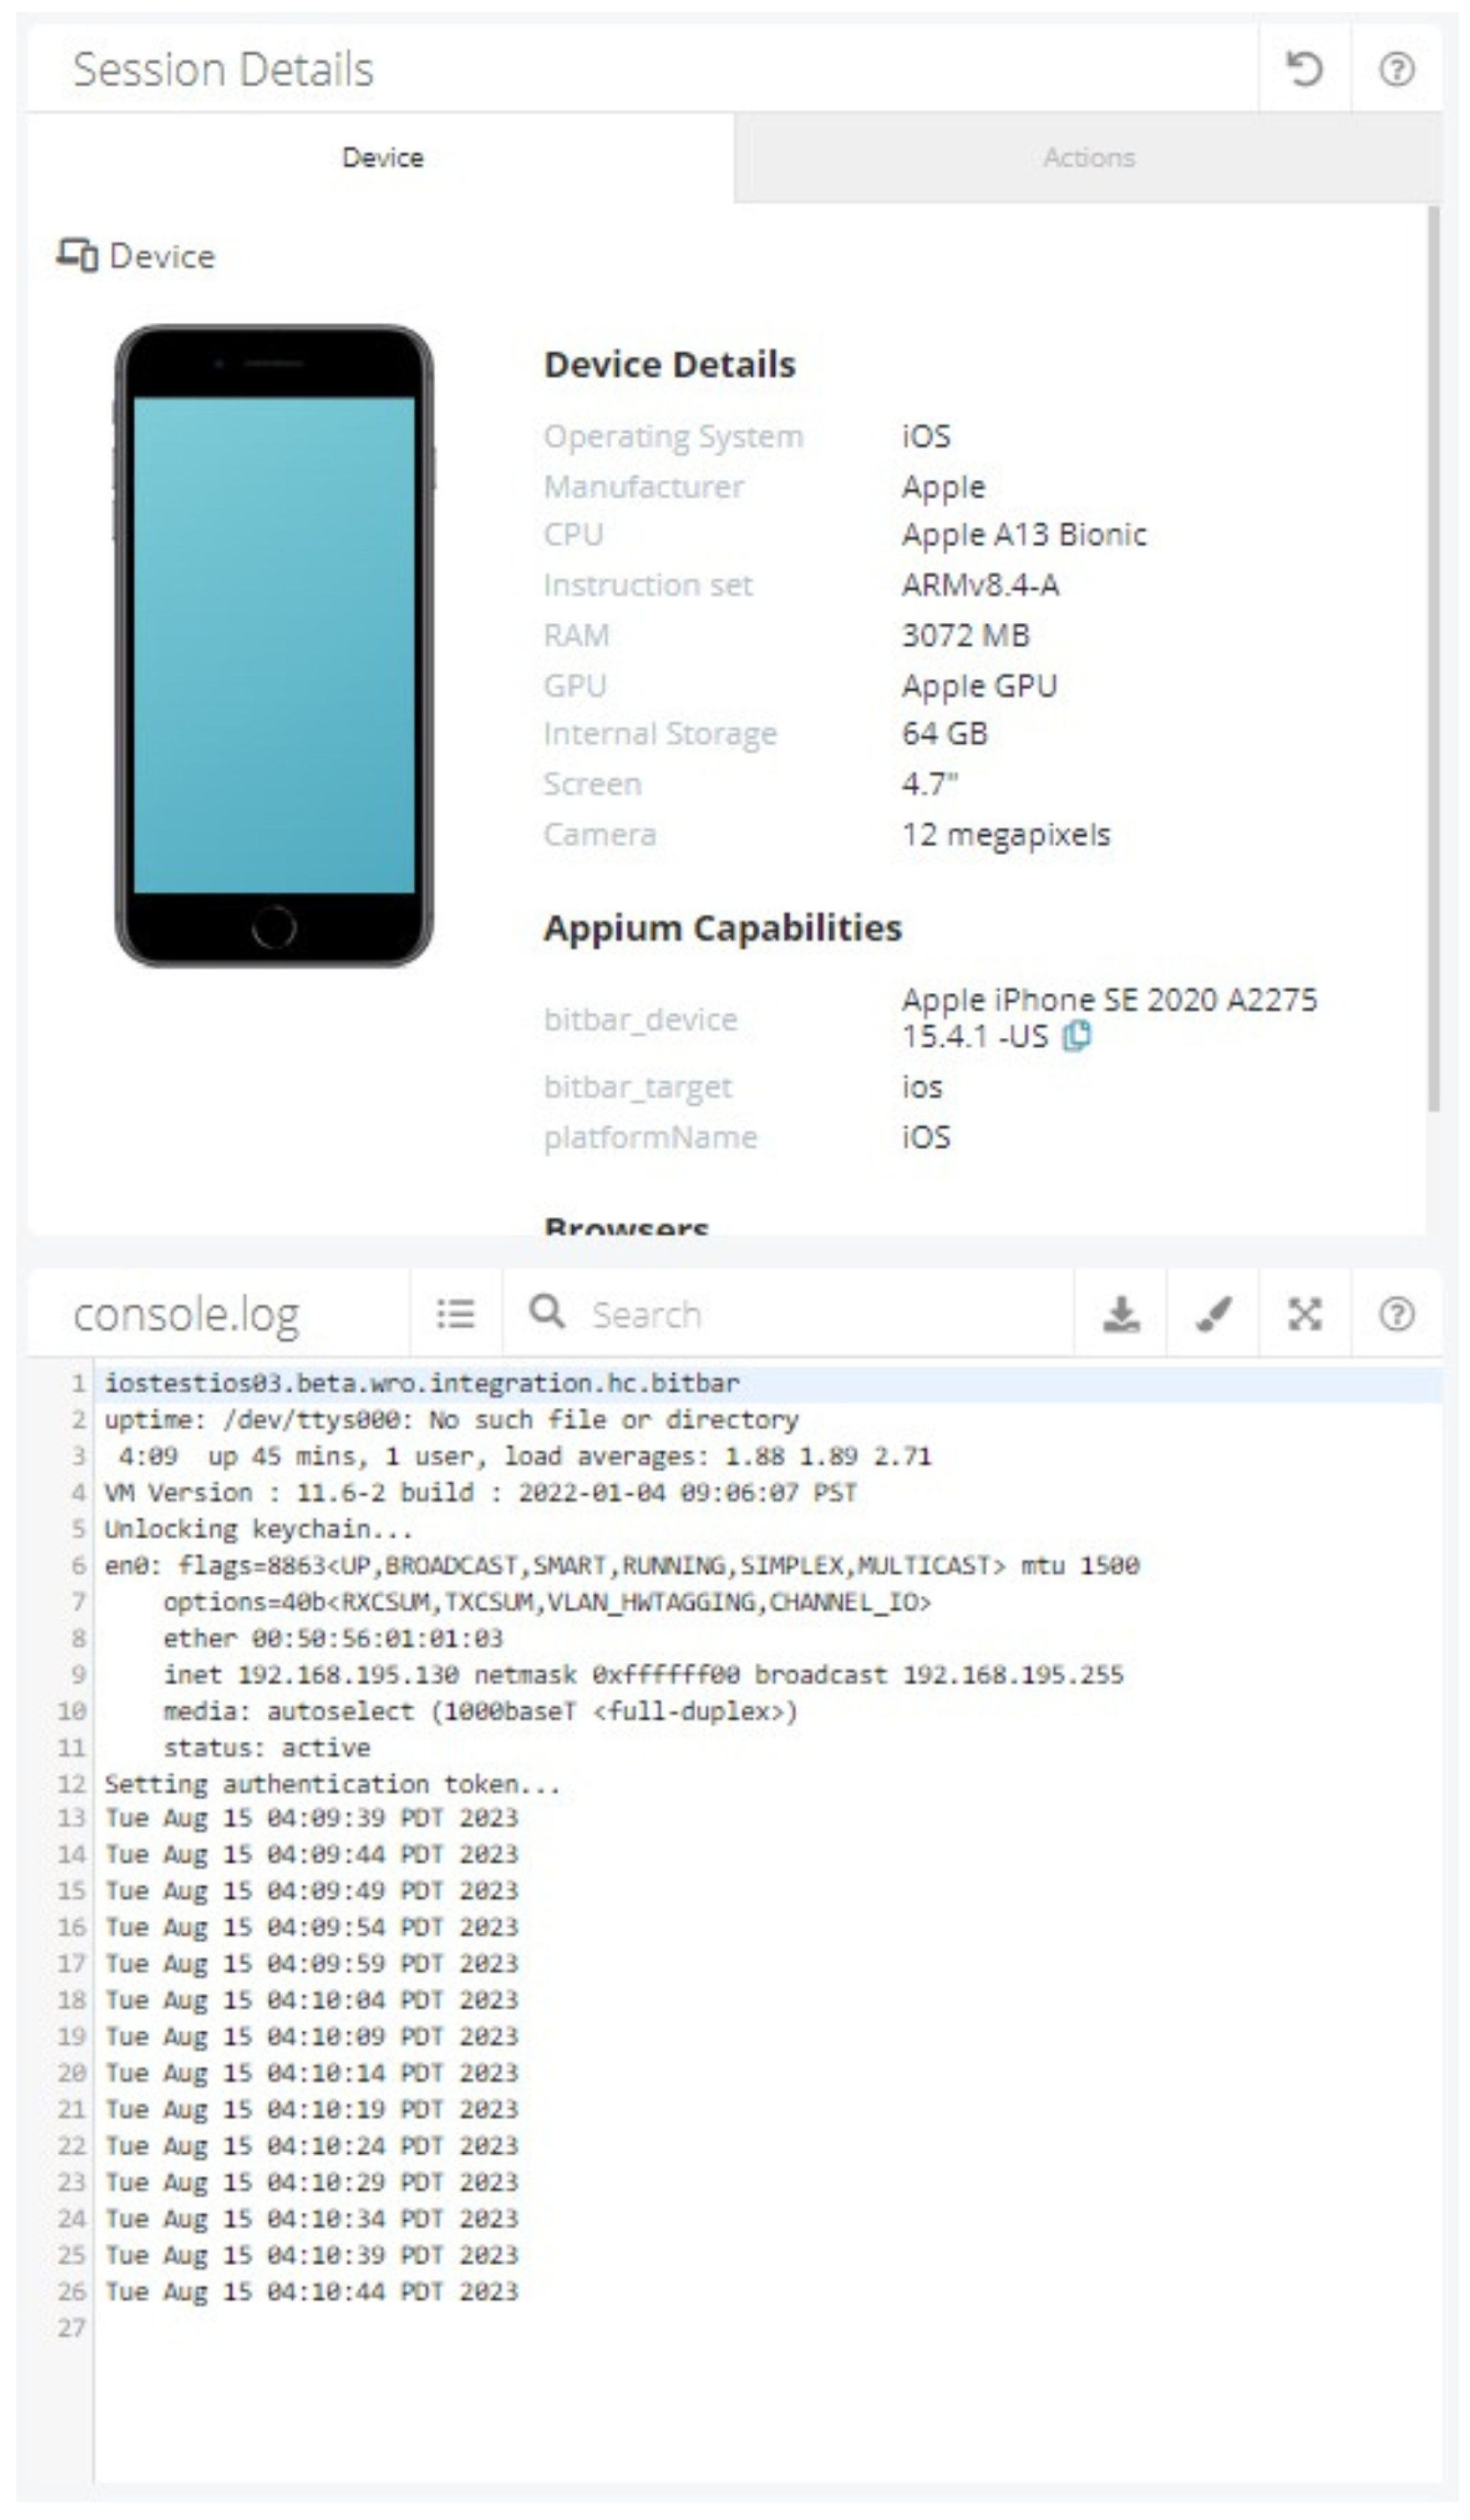
2.2.1. Compatibility Testing on Various Devices and Platforms

Testing the compatibility of the REDUCE application on different devices and platforms was a key aspect to ensure its functionality in a complex digital environment. To achieve this, the BitBar tool was used, allowing tests to be run simultaneously on various browsers and devices, which increased the efficiency and reliability of the test results [88]. Tests were conducted on a range of devices, including smartphones with Android and iOS, as well as computers running Windows and macOS. BitBar facilitated testing on real devices and browsers, providing realistic test conditions. The results indicated that the application displays correctly on most browsers and screen resolutions, although minor visual inconsistencies were noted on mobile devices [89,90]. Analysis of log files from mobile devices, such as console.log and device.log, showed that the application runs stably and manages resources effectively, without generating errors or performance issues (Figure 7 and Figure 8). This confirms the high quality of the code and the effectiveness of the testing process. In summary, the tests demonstrated that the REDUCE application is well-optimized and compatible with various devices and platforms, ensuring its functionality and stability across a wide range of usage conditions.

2.2.2. Security and Firewall Testing

In the next phase of testing, the focus shifted to evaluating the security of the REDUCE application, including the performance of the firewall and intrusion detection systems. Tests were conducted to assess the application’s resilience against various threats, including port scanning, XSS attacks, SQL injection, and DDoS attacks. Using nmap for port scanning revealed that the firewall successfully blocks unnecessary ports, keeping only those essential for the website’s operation, such as HTTP and HTTPS [91]. The XSS attack simulation involved injecting malicious JavaScript code and monitoring the response of the Snort system. The system responded correctly to the attack attempt, as confirmed by the generated logs [92]. The SQL injection simulation was also carried out, but it did not achieve the desired effects due to the absence of a database connection. However, Snort detected the attack attempt and generated appropriate logs [93]. The DDoS attack simulation was conducted using the LOIC tool. The Cisco firewall identified the attack and blocked malicious traffic, as confirmed by Snort logs, demonstrating the effectiveness of the system’s defense mechanisms [94,95]. These tests confirmed that the REDUCE application has robust security measures in place, effectively protecting against various types of threats.
Performance tests for the REDUCE.prz.edu.pl (accessed on 19 August 2024) website were conducted using GTMetrix, which provides a comprehensive analysis of website performance. In the test carried out on 15 August 2023, from a server in Vancouver, the site achieved an A rating, with scores of 100% in the Performance category and 94% in the Structure category (Figure 9). This score is based on adherence to the best practices in web development, such as minimizing resource load times, reducing the number of render-blocking resources, and ensuring efficient file sizes for images and other assets. Achieving a structure score of 94% indicates that the REDUCE website is well-optimized, with only a few minor improvements suggested, such as properly sizing images and utilizing next-generation image formats for additional performance gains. Key metrics such as First Contentful Paint (435 ms), Time to Interactive (439 ms), and Speed Index (510 ms) indicate excellent website optimization, resulting in a fast and smooth user experience (Figure 10) [96,97,98]. Figure 11 shows the structure of the impact of individual elements on the website’s loading time, and Figure 12 presents a waterfall chart detailing the loading times of individual page resources. The analysis revealed that the site is well-optimized, with minimal blocking time (0 ms) and layout stability (Cumulative Layout Shift of 0.02) [99,100,101,102].
Particular attention was paid to connection speed and server response, where connection time was 176 ms and Time to First Byte (TTFB) was 343 ms, indicating areas for potential optimization [103,104]. Figure 13 summarizes statistics on various types of elements used on the site, which could be useful for further optimization. In general, the tests confirmed that the REDUCE.prz.edu.pl website is well-optimized, with some areas for further analysis to be addressed in future software updates [97,98,100,101,105].

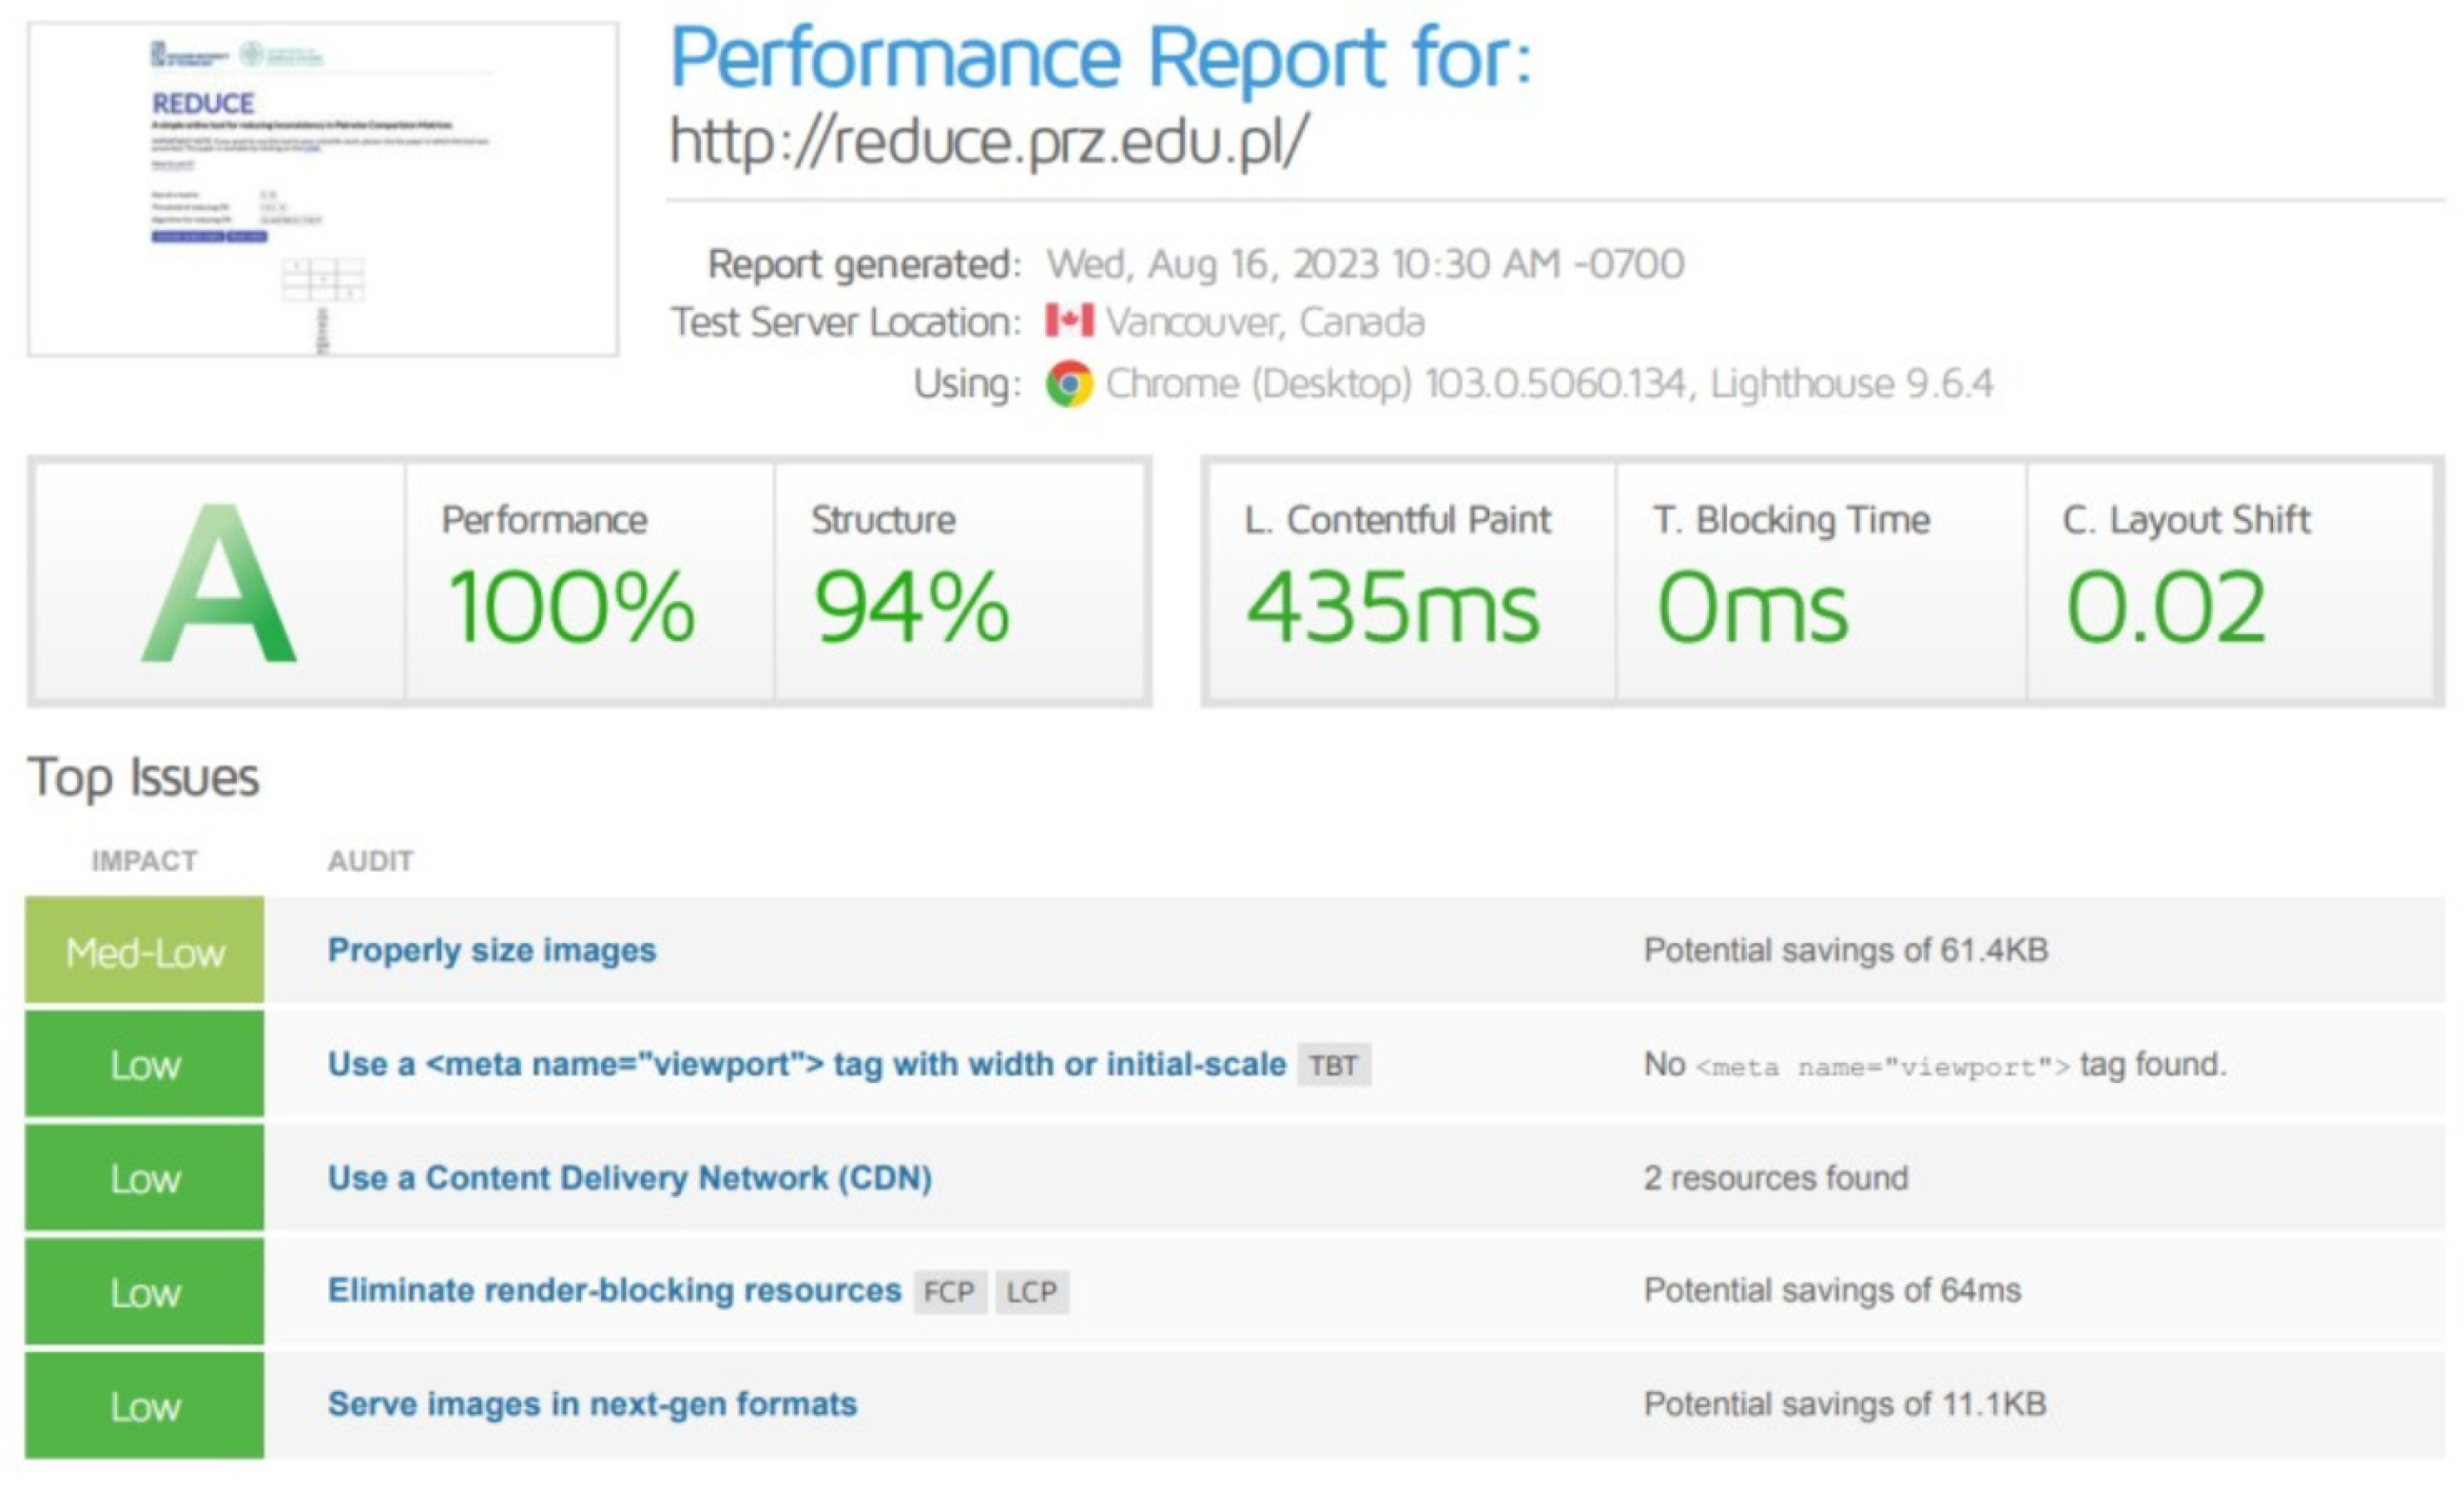
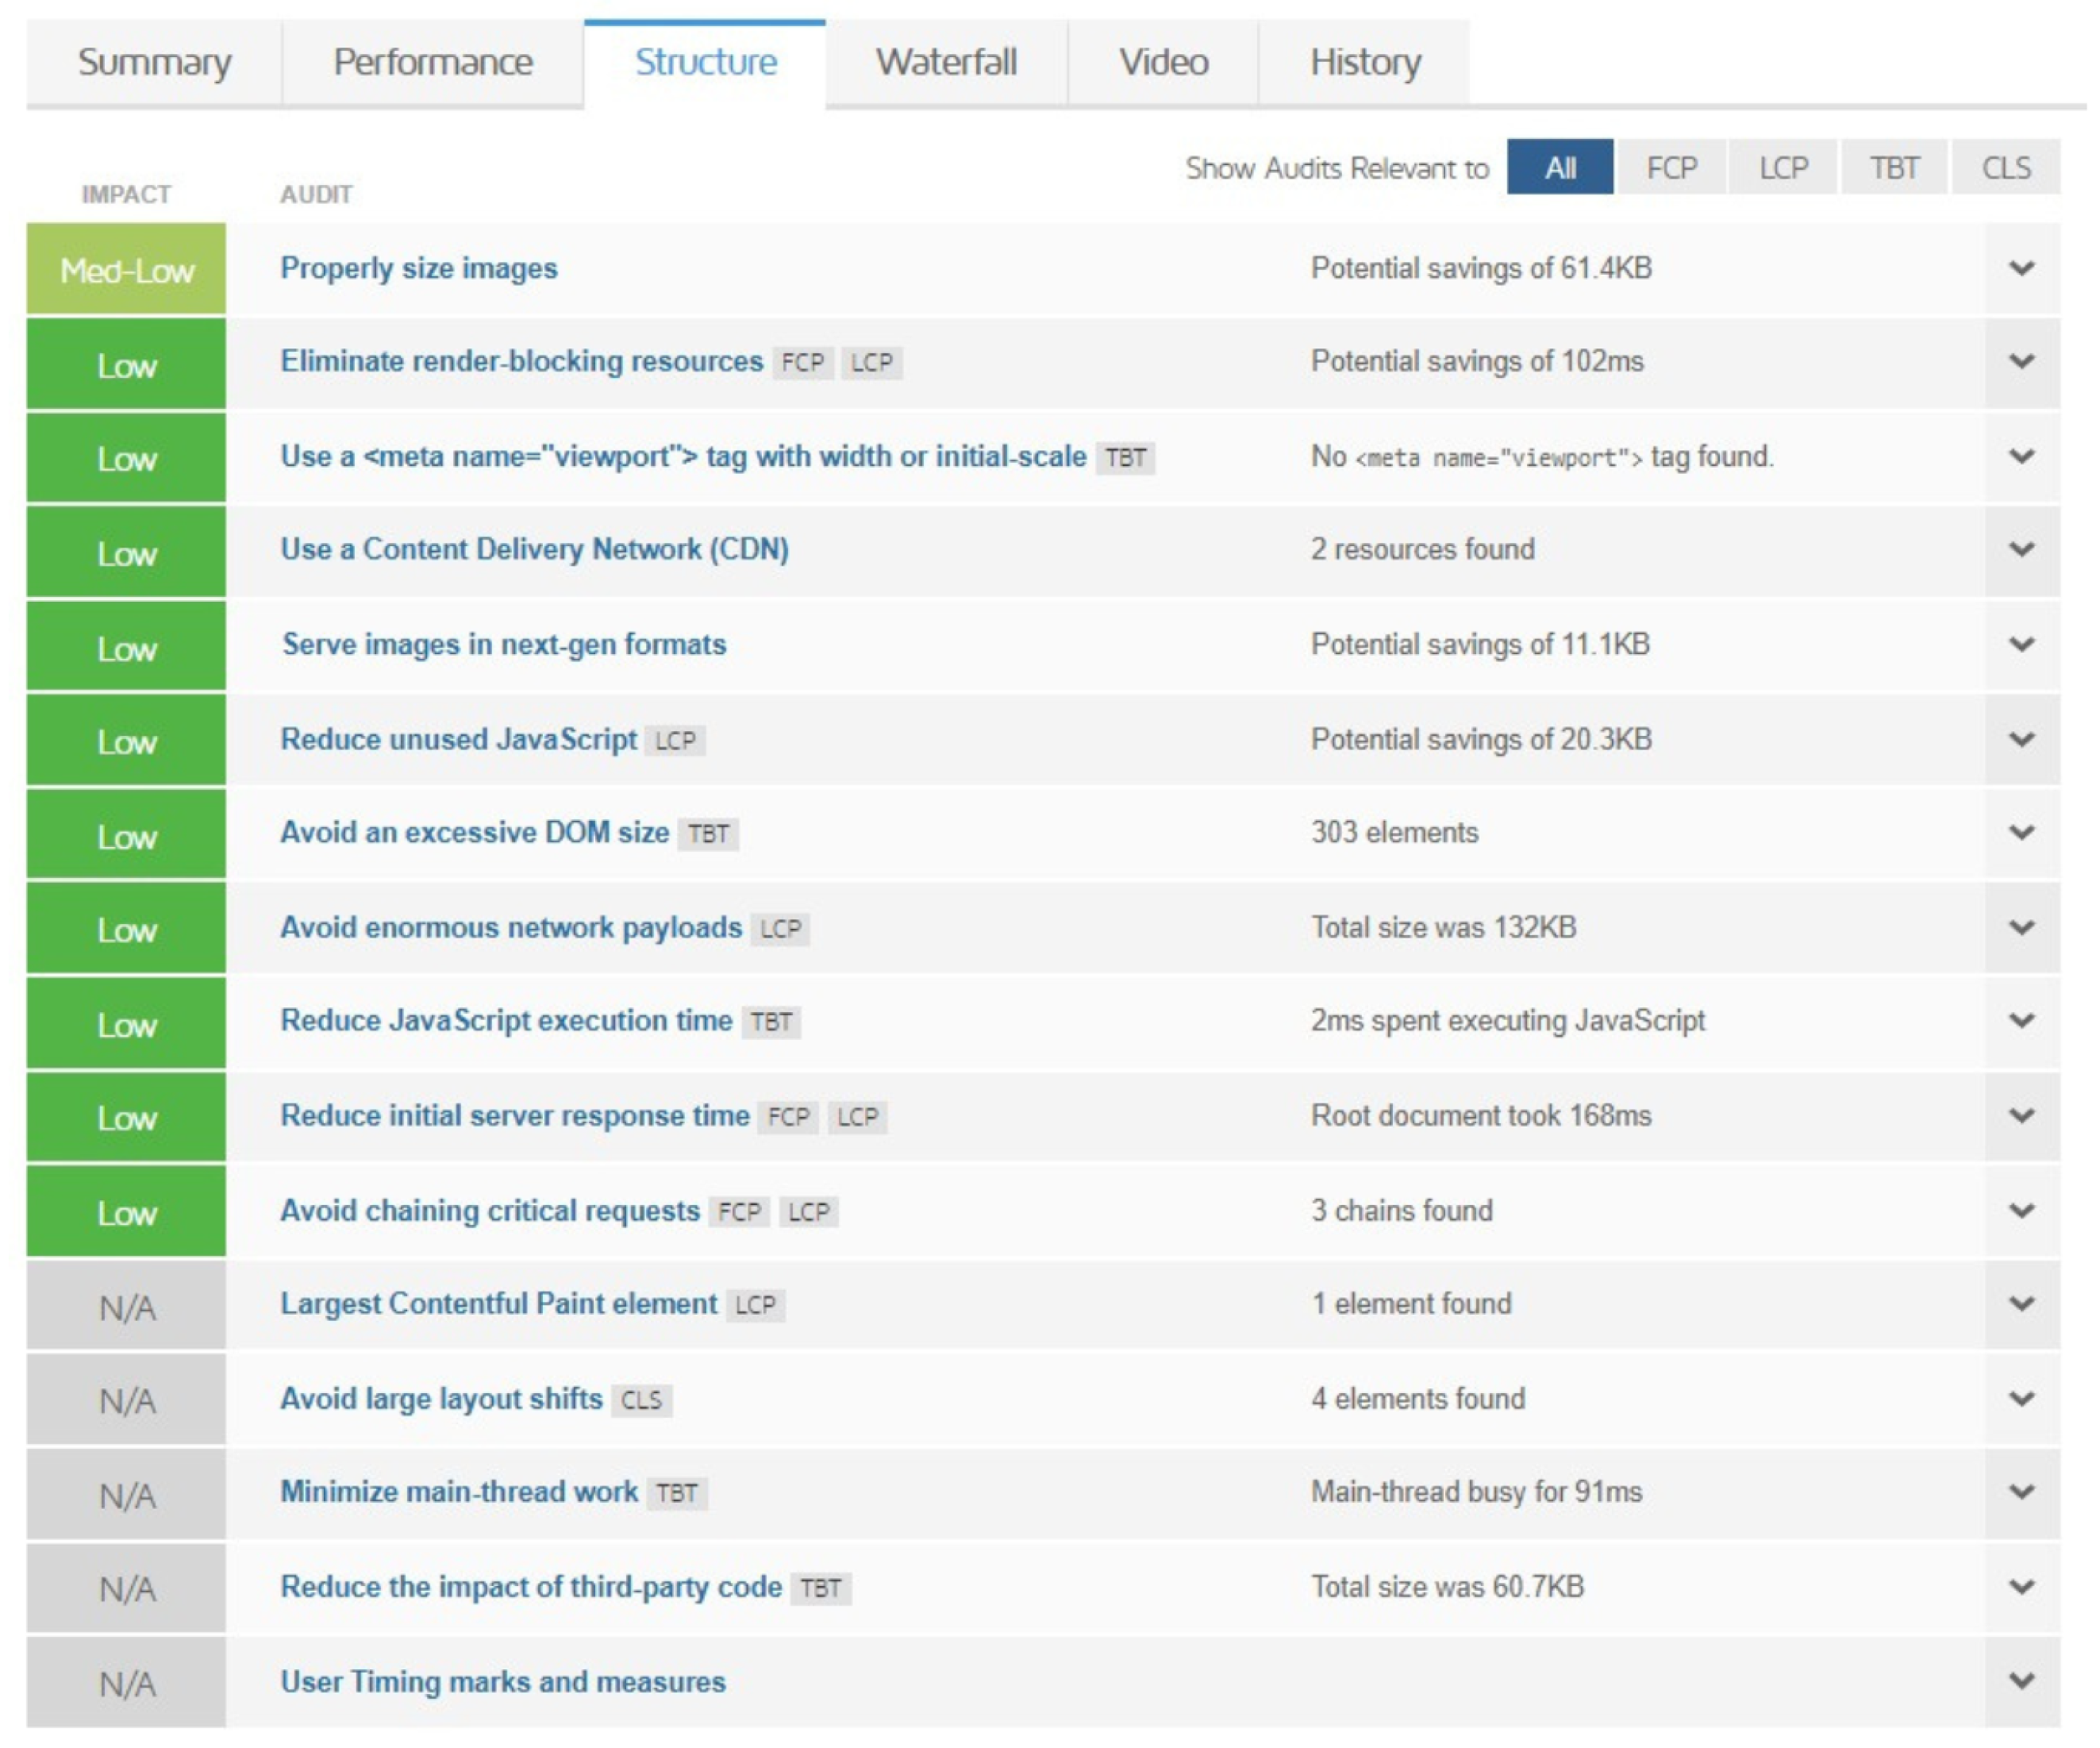
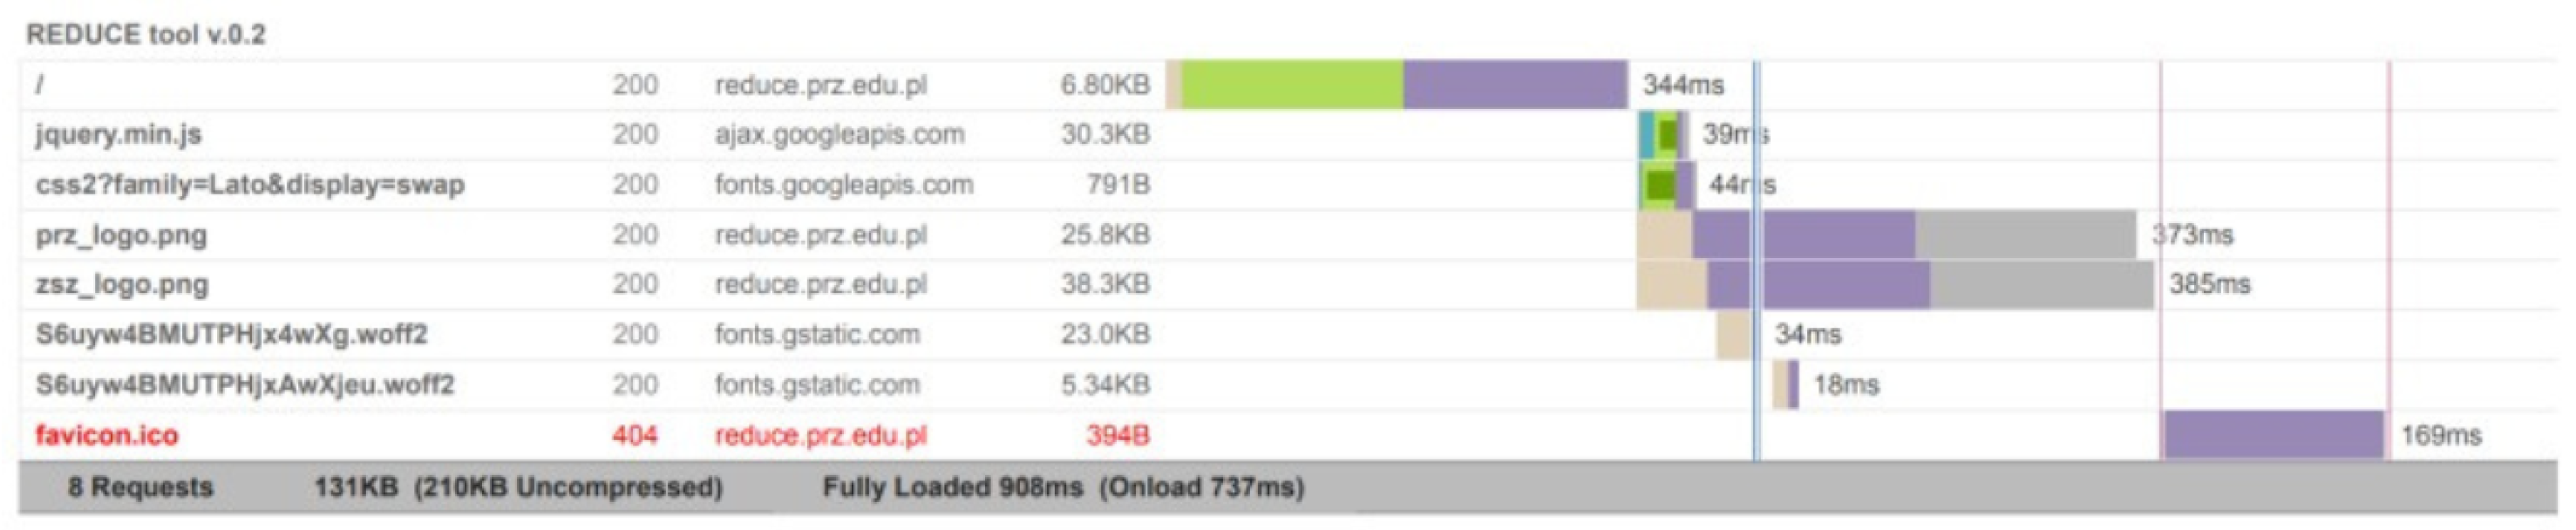
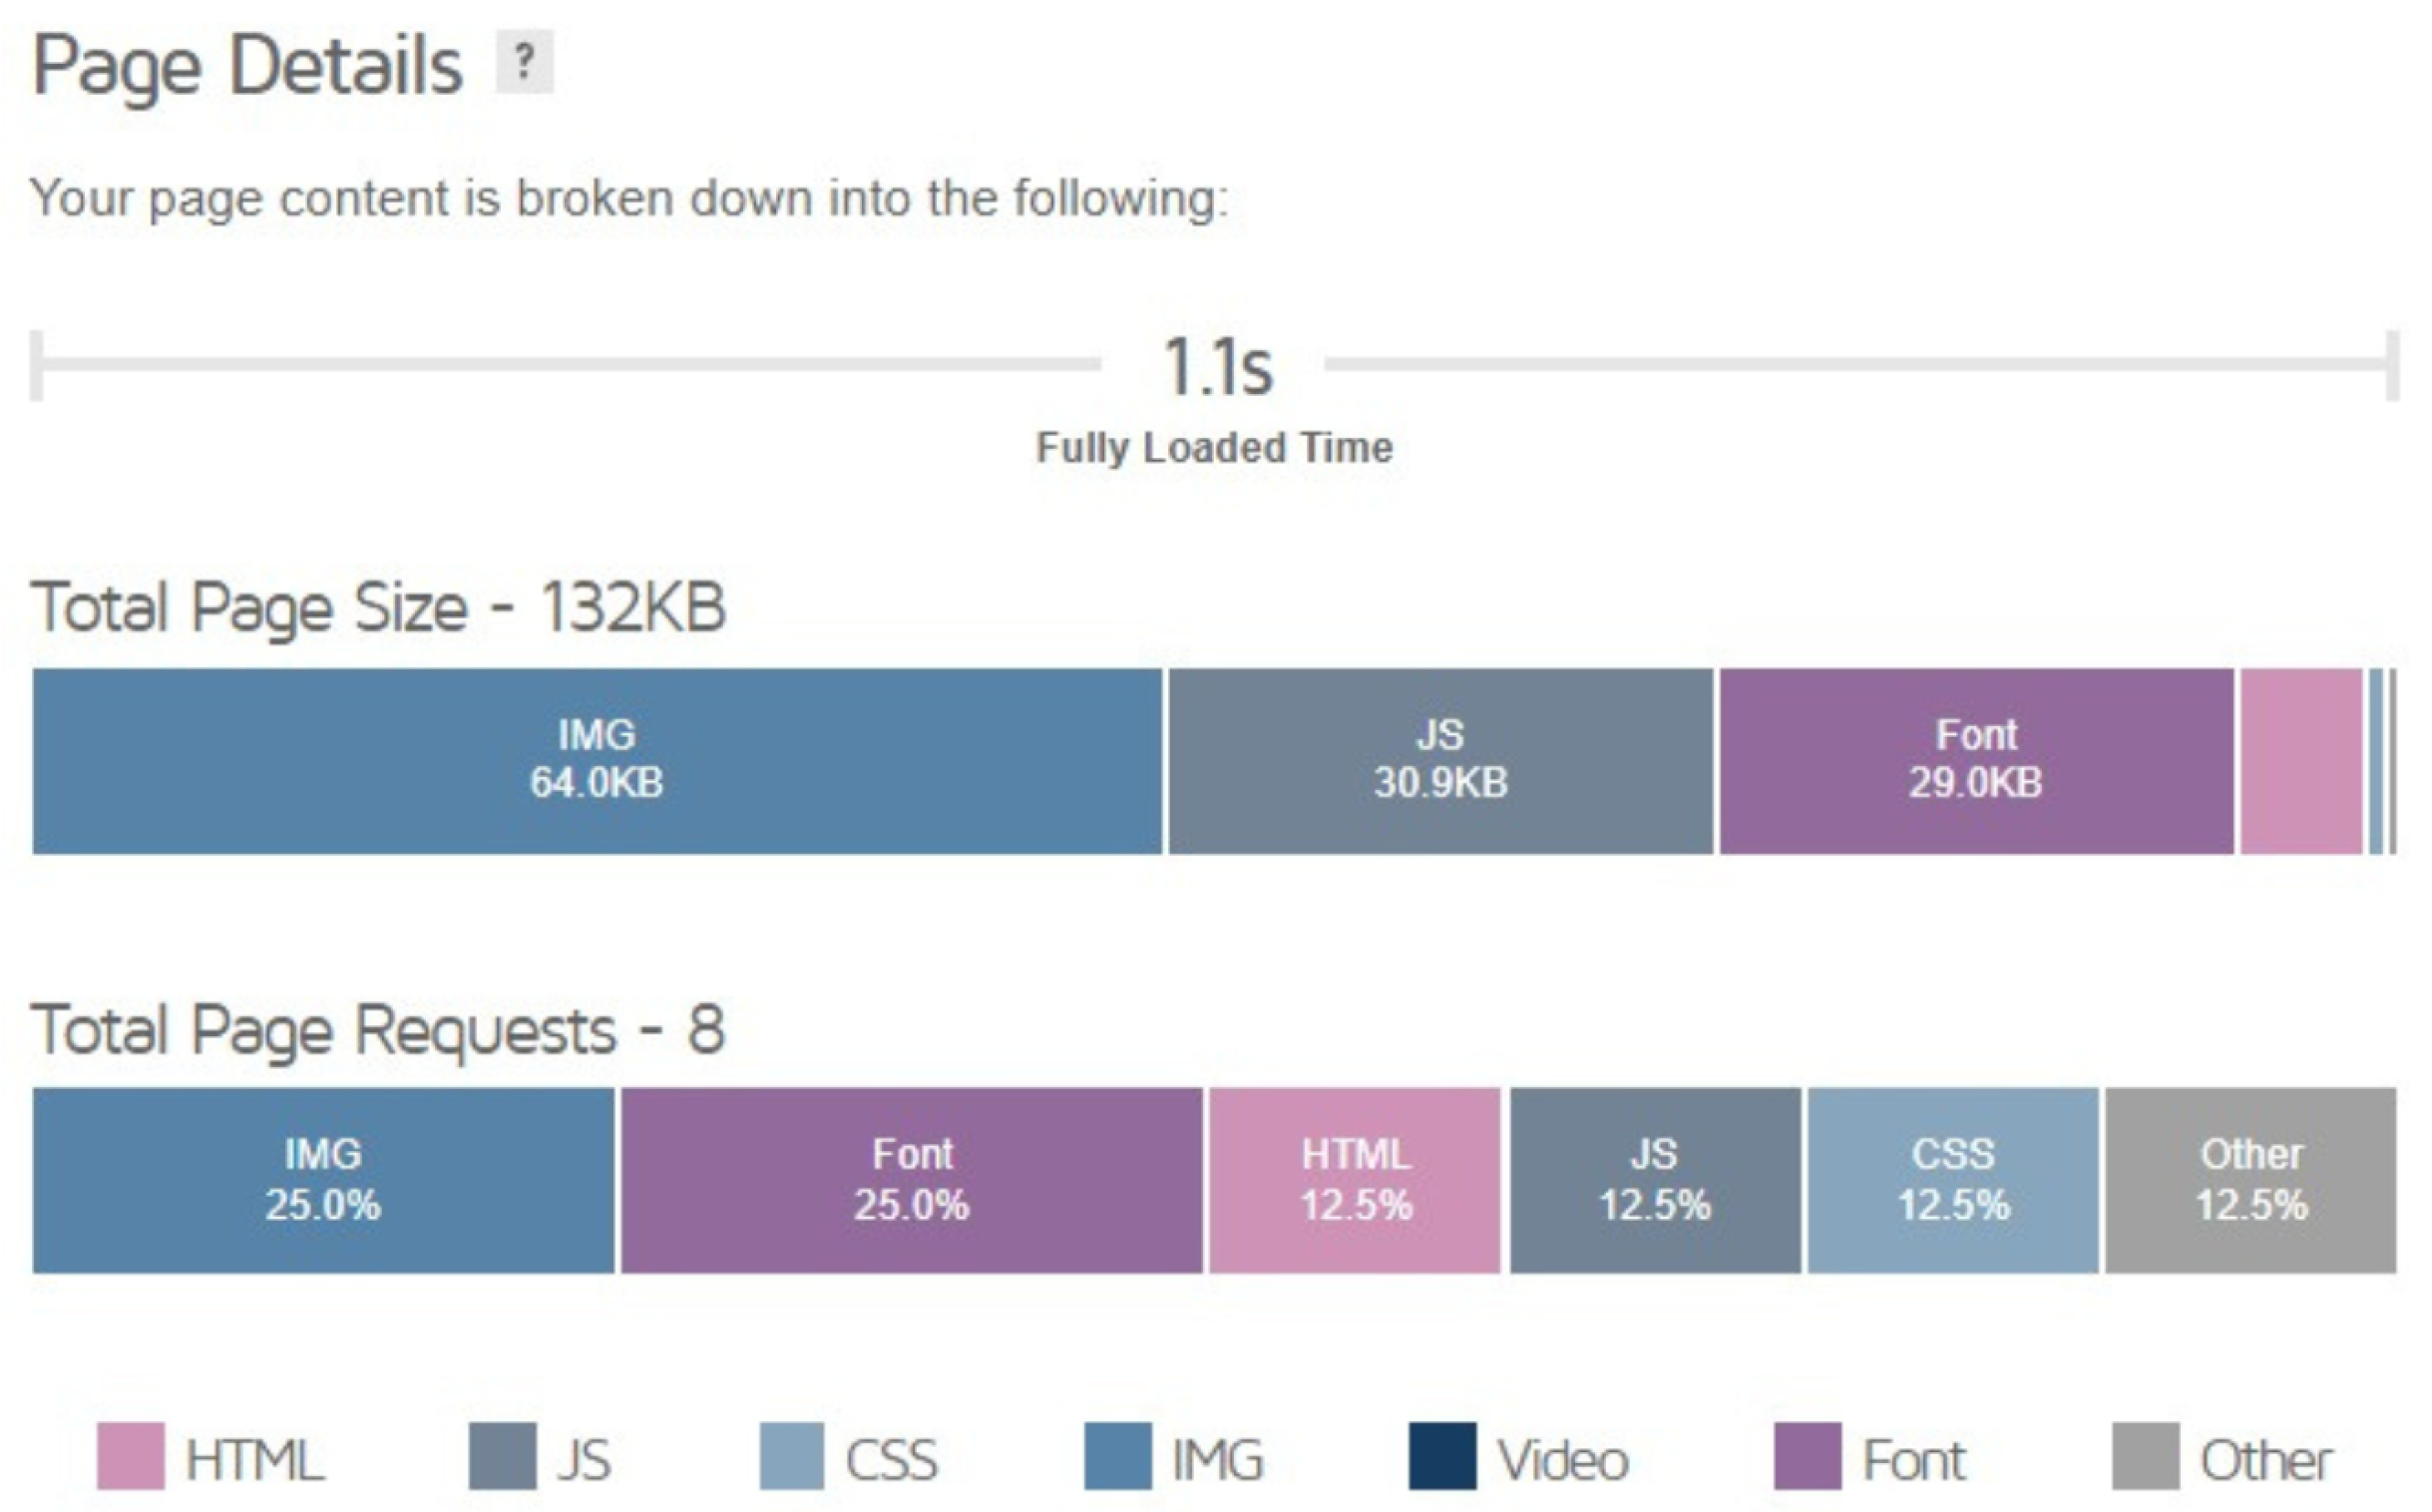
2.2.3. Performance Testing of Application Loading

Validation of the Application Compliance with Current Standards

The validation of the REDUCE application was a crucial step in ensuring its quality, covering three main areas: compliance with W3C HTML, W3C CSS, and WCAG 2.1 standards. Validation of W3C HTML compliance focused on checking the correctness of the HTML code, which forms the foundation of web page structure. The validation performed using the W3C tool identified several issues, such as incorrect attributes and improper placement of tags, which required correction. Properly structured HTML code is essential for compatibility across different browsers and to ensure better content accessibility [91,106,107,108]. W3C CSS compliance validation confirmed that the stylesheets were designed following best practices. The W3C CSS validator did not detect any errors, reflecting the high quality of the code that ensures a consistent and aesthetically pleasing appearance of the application on various devices and browsers [109,110,111,112,113]. An accessibility audit according to the WCAG 2.1 standard aimed to assess whether the application is accessible to users with various disabilities. The audit results indicated that, while the site meets most guidelines, there are areas, such as keyboard navigation and color contrast, that require further improvement. Adherence to the WCAG 2.1 standards is crucial not only for regulatory compliance but also to ensure broad access to content [114,115,116,117,118,119].

3. Paths for Further Development and Commercialization of the Software

In the next version of the REDUCE software, v.0.3 several improvements to enhance its functionality and user experience are planned. These include:
  • Fixing known bugs and improving performance—identification, analysis, and correction issues within the software that affect its functionality, performance, or stability;
  • Adding new features and refining existing ones;
  • Enhancing data security to protect user privacy—implementation and update of security measures to safeguard user data against unauthorized access, breaches, or misuse, update of encryption protocols, secure authentication methods, and regularly auditing access controls;
  • Updating documentation and technical support—to ensure that they reflect the latest features, configuration settings, troubleshooting procedures, latest FAQs, live chat, or helpdesk services, addressing customer queries, and training sessions.
The ongoing development of REDUCE will be based on user feedback and needs, allowing us to implement innovations that make the product more appealing and useful. The feedback will be gathered with the use surveys that should cover the different areas of expected improvements. Such a survey will be mandatory for the freemium model, assumed as one of the possible ways of commercialization. Moreover, this tool can also be extended to handle incomplete pairwise comparison matrices, since weighting methods have been extended to this set and inconsistency thresholds are also available [120]. Another useful extension can be to give a threshold for an inconsistency index other than C R . It is also assumed that we will explore the integration or comparison with alternative methods like best–worst method (BWM) and full consistency method (FUCOM) in future research to enhance the tool’s versatility.
In addition, an accessibility audit of the REDUCE website was conducted according to the WCAG 2.1 guidelines. The audit showed partial compliance with accessibility standards, with identified areas for improvement to enhance usability for users with disabilities. These adjustments are planned for the next software update.
A key part of commercialization is finding out if there is a market need for a decision-support tool. Today’s challenges, like information overload, time constraints, and complex problems, require advanced tools to help with decision making [121,122,123]. REDUCE, with its advanced features, aims to compete with existing tools such as Expert Choice, QVISTORP, and Paramount Decisions by offering a freemium model. This model provides basic features for free while generating revenue through advertising [124,125].
A comparison of the advantages and disadvantages of these software tools is presented in Table 1, which helps to understand the place of REDUCE in the market.
REDUCE is aimed at a wide range of users, from small and medium businesses to large companies, government agencies, and nonprofits [128,129,130]. The main users will be executives, managers, and analysts who need to make strategic decisions. However, there are risks associated with deploying a new tool, such as user resistance, technical issues, and data security challenges [131,132,133]. It is important to involve users in the deployment process, provide adequate training, and implement effective data protection measures. The commercialization path for the REDUCE decision-support tool, based on the analytic hierarchy process (AHP), includes developing features such as managing criteria hierarchies, pairwise comparisons, consistency checks, and sensitivity analysis [134]. Future development will also focus on creating a mobile version and enhancing data security. Implementing a freemium model with Pro and Premium packages will help achieve profitability while meeting the needs of a broad user base [135]. This approach gives REDUCE the potential to become a competitive tool in the market, particularly among small and medium-sized businesses seeking affordable decision-support solutions.

4. Conclusions

This article provides an analysis of the REDUCE software, a decision-support tool designed to manage multiplicative pairwise comparisons and reduce inconsistencies. REDUCE has been developed with flexibility and efficiency in mind, allowing for effective decision-making management. The analysis of both the front-end and back-end layers highlights the tool’s complexity and technological advancement. The chosen technologies have been well justified, aligning with the project’s goals:
  • User-friendly interface;
  • Application of at least two methods for inconsistency reduction;
  • System available online via webpage;
  • Visual presentation of processed data and obtained results;
  • The use of developer’s tools based on: Flask, Apache, Python, NumPy, SciPy, SymPy, and jQuery;
  • Safe and secure server system.
The conducted security, compatibility, and performance tests confirm that the application meets required standards and is resilient to various types of attacks. The application has successfully passed validation against W3C HTML and W3C CSS standards and the WCAG 2.1 accessibility standard. There is a clear path for further development and commercialization of the software. Market needs and target market analysis reveal opportunities for expansion and adaptation of the tool for various applications.
In this context, it is noteworthy that the software has already been recognized in the literature [136], highlighting key features such as flexibility and efficiency, as well as its significance in decision-making processes. Recognition by other researchers confirms its value and potential for further development and application in various research and practical contexts. In summary, REDUCE represents a significant advancement in the field of decision support and inconsistency reduction. Its complex structure, advanced features, and potential for further development and commercialization make it a valuable tool with potential applications across different contexts. It contributes to both scientific progress and practical applications in this field.
The scientific contribution of the REDUCE approach lies in its unique ability to autonomously reduce inconsistencies in pairwise comparison matrices without requiring expert intervention. This is achieved through the integration of two established inconsistency reduction algorithms within an accessible online tool, which differentiates REDUCE from other decision-support tools currently available, especially in the non-commercial sector. By providing this service for free, REDUCE facilitates wider adoption of multi-criteria decision-making methods, making it particularly suitable for small and medium-sized enterprises that may lack resources for costly commercial software or in-house decision analysis expertise.
The practical applications of REDUCE are broad, as the tool is designed to support decision makers in various domains where prioritization and ranking are essential, such as project management, resource allocation, and strategic planning. By helping users achieve less inconsistent pairwise comparisons, REDUCE enhances the reliability of decision-making processes, leading to more robust outcomes. In the future, we plan to expand REDUCE’s capabilities, such as enabling the handling of incomplete pairwise comparison matrices and supporting additional consistency indices, to further broaden its applicability.

Author Contributions

Conceptualization, P.K., K.D. and D.S.; methodology, D.S. and P.K.; software, P.K. and B.K; validation, V.V., B.K. and P.O.; formal analysis, D.S.; investigation, P.O.; resources, B.K. and V.V.; data curation, B.K. and K.D.; writing—original draft preparation, D.S., P.K. and K.D.; writing—review and editing, D.S., P.K. and K.D.; visualization, P.O.; supervision, D.S.; project administration, P.K. and P.O; funding acquisition, D.S. All authors have read and agreed to the published version of the manuscript.

Funding

This research received no external funding.

Institutional Review Board Statement

Not applicable.

Informed Consent Statement

Not applicable.

Data Availability Statement

Datasets are available on request from the authors, some parts of data can be generated on: https://reduce.prz.edu.pl/ (accessed on 19 August 2024).

Conflicts of Interest

The authors declare no conflicts of interest.

References

  1. Saaty, T.L. Decision making with the analytic hierarchy process. Int. J. Serv. Sci. 2008, 1, 83–98. [Google Scholar] [CrossRef]
  2. Dyer, J. A review of multi-criteria decision-making techniques. Eur. J. Oper. Res. 2001, 130, 440–449. [Google Scholar]
  3. Xu, L.D. Information architecture for supply chain quality management. Int. J. Prod. Res. 2011, 49, 183–198. [Google Scholar] [CrossRef]
  4. Saaty, T.L.; Vargas, L.G. Models, Methods, Concepts & Applications of the Analytic Hierarchy Process; Springer: Berlin/Heidelberg, Germany, 2012. [Google Scholar]
  5. Thurstone, L.L. A law of comparative judgment. Psychol. Rev. 1927, 34, 273–286. [Google Scholar] [CrossRef]
  6. Lee, S.; Li, D. TTCM: A Tensor-Based Technique for Classifying Multi-Aspect Data. IEEE Trans. Pattern Anal. Mach. Intell. 2019, 41. [Google Scholar]
  7. Abedin, M.M.T.; Rahman, M.M. Decision Support System for Product Customization in E-Commerce. IEEE Access 2019, 7, 140522–140531. [Google Scholar]
  8. Burges, C.J.C.; Shaked, T.; Renshaw, E.; Lazier, A.; Deeds, M.; Hamilton, N.; Hullender, G. Learning to rank using gradient descent. In Proceedings of the 22nd International Conference on Machine Learning (ICML), Bonn, Germany, 7–11 August 2005; pp. 89–96. [Google Scholar]
  9. Al-Ameen, M.; Lee, S.Y.; Neoh, A.Y.L. A hybrid finite state machine and data mining approach for multi-agent plan recognition. Pattern Recognit. 2014, 47, 1291–1301. [Google Scholar]
  10. Ning, X.; Karypis, G. SLIM: Sparse linear methods for top-N recommender systems. In Proceedings of the 11th IEEE International Conference on Data Mining (ICDM), Vancouver, BC, Canada, 11–14 December 2011; pp. 497–506. [Google Scholar]
  11. Tukey, J.W. The Problem of Multiple Comparisons; Academic Press: Cambridge, MA, USA, 1953. [Google Scholar]
  12. Kim, G.; Hwang, C. Flexible modification of the Bonferroni method for multiple tests. IEEE Trans. Neural Netw. Learn. Syst. 2020, 31. [Google Scholar]
  13. Fisher, R.A. The Design of Experiments; Oliver & Boyd: Edinburgh, UK, 1935. [Google Scholar]
  14. Benjamini, Y.; Hochberg, Y. Controlling the false discovery rate: A practical and powerful approach to multiple testing. J. R. Stat. Soc. Ser. B (Methodol.) 1995, 57, 289–300. [Google Scholar] [CrossRef]
  15. Elo, A.E. The Rating of Chess Players, Past and Present; Ishi Press: London, UK, 1978. [Google Scholar]
  16. Schaefer, M.W. Sports Ratings and Rankings; Springer: Berlin/Heidelberg, Germany, 2008. [Google Scholar]
  17. FIFA. Revision of the FIFA/Coca-Cola World Ranking. Available online: https://img.fifa.com/image/upload/edbm045h0udbwkqew35a.pdf (accessed on 29 October 2024).
  18. Deb, K. Multi-Objective Optimization Using Evolutionary Algorithms; John Wiley & Sons: Hoboken, NJ, USA, 2001. [Google Scholar]
  19. Xu, F.; Zhang, J.A.; Chen, Y.J. Pairwise comparison matrix reduction for large-scale decision making: A graph-based approach. IEEE Trans. Syst. Man, Cybern. Syst. 2021, 51, 5768–5778. [Google Scholar]
  20. Horton, J.J.; Chilton, L.B. The labor economics of paid crowdsourcing. In Proceedings of the 11th ACM Conference on Electronic Commerce (EC), Cambridge, MA, USA, 7–11 June 2010; pp. 209–218. [Google Scholar]
  21. Lieberman, M.D.; Sorensen, J.T.; Goodenough, J.D. Crowdsourced pairwise comparisons of social relationships. IEEE Trans. Vis. Comput. Graph. 2020, 26, 296–305. [Google Scholar]
  22. Hooker, J.N.; Hajiaghayi, M.G. Principles of distributed decision making. IEEE Trans. Syst. Man, Cybern. Syst. 2021, 51, 4140–4151. [Google Scholar]
  23. Brafman, R.I.; Domshlak, C. Preference handling—An introductory tutorial. AI Mag. 2009, 30, 58–69. [Google Scholar] [CrossRef]
  24. Pearl, J. Probabilistic Reasoning in Intelligent Systems: Networks of Plausible Inference; Morgan Kaufmann: San Francisco, CA, USA, 1988. [Google Scholar]
  25. Smith, A.C.; Emmenegger, J.P. Preference learning from pairwise comparisons: A survey. IEEE Trans. Knowl. Data Eng. 2004, 31, 1106–1120. [Google Scholar]
  26. Tversky, A.; Kahneman, D. Judgment under uncertainty: Heuristics and biases. Science 1974, 185, 1124–1131. [Google Scholar] [CrossRef]
  27. Kahneman, D. Thinking, Fast and Slow; Farrar, Straus and Giroux: New York, NY, USA, 2011. [Google Scholar]
  28. Kulakowski, K. On the Properties of the Priority Deriving Procedure in the Pairwise Comparisons Method. Fundam. Informaticae 2015, 139, 403–419. [Google Scholar] [CrossRef]
  29. Mazurek, J.; Perzina, R.; Strzałka, D.; Rajs, R. Is the best–worst method path dependent? Evidence from an empirical study. 4OR 2023, 22, 387–409. [Google Scholar] [CrossRef]
  30. Saaty, T.L. How to make a decision: The analytic hierarchy process. Interfaces 1994, 24, 19–43. [Google Scholar] [CrossRef]
  31. de Boer, L.; Labro, E.; Morlacchi, P. A review of methods supporting supplier selection. Eur. J. Purch. Supply Manag. 2001, 7, 75–89. [Google Scholar] [CrossRef]
  32. Kulakowski, K. On the Geometric Mean Method for Incomplete Pairwise Comparisons. Mathematics 2020, 8, 1873. [Google Scholar] [CrossRef]
  33. Chen, C.; Zhang, S. An efficient algorithm for large-scale pairwise comparison matrix completion. IEEE Trans. Neural Networks Learn. Syst. 2020, 31, 3586–3596. [Google Scholar]
  34. Hu, J.; Liu, R.X.; Choi, T.M. Data-driven approaches for managing consumer behavior in fashion retail: A review. IEEE Trans. Eng. Manag. 2020, 67, 1117–1130. [Google Scholar]
  35. Kulakowski, K.; Grobler-Debska, K.; Was, J. Heuristic rating estimation: Geometric approach. J. Glob. Optim. 2015, 62, 529–543. [Google Scholar] [CrossRef]
  36. Kowal, B.; Kuras, P.; Strzalka, D.; Mazurek, J.; Perzina, R. REDUCE—An online decision support tool for reduction of inconsistency in multiplicative pairwise comparisons. In Proceedings of the 3rd International Conference on Decision Making for Small and Medium-Sized Enterprises, Opava, Czech Republic, 18–19 May 2023; pp. 294–300. [Google Scholar] [CrossRef]
  37. REDUCE. 2024. Available online: https://reduce.prz.edu.pl/ (accessed on 19 August 2024).
  38. Grinberg, M. Flask Web Development: Developing Web Applications with Python; O’Reilly Media, Inc.: Sebastopol, CA, USA, 2018. [Google Scholar]
  39. REDUCE Module for Generating Pairwise Comparison Matrices. Available online: https://reduce.prz.edu.pl/pc_matrices_generator (accessed on 4 November 2024).
  40. Kuraś, P.; Gerka, A. Using Inconsistency Reduction Algorithms in Comparison Matrices to Improve the Performance of Generating Random Comparison Matrices with a Given Inconsistency Coefficient Range. Adv. Sci. Technol. Res. J. 2023, 17, 222–229. [Google Scholar] [CrossRef]
  41. Kuraś, P.; Strzalka, D.; Kowal, B.; Mazurek, J. REDUCE: A Python module for reducing inconsistency in Pairwise Comparison Matrices. Adv. Sci. Technol. Res. J. 2023, 17, 227–234. [Google Scholar] [CrossRef]
  42. Bibeault, B.; De Rosa, A.; Katz, Y. jQuery in Action; Simon and Schuster: New York, NY, USA, 2015. [Google Scholar]
  43. Eichorn, J. Understanding AJAX: Using JavaScript to Create Rich Internet Applications; Prentice Hall PTR: Lebanon, IN, USA, 2006. [Google Scholar]
  44. Ghimire, D. Comparative Study on Python Web Frameworks: Flask and Django. Bachelor’s Thesis, Metropolia University of Applied Science, Metropolia, Finland, 2020. [Google Scholar]
  45. Rajabov, S.B. The role of backend and frontend information systems infrastructure. Sci. Educ. 2023, 4, 212–216. [Google Scholar]
  46. Harris, C.R.; Millman, K.J.; Van Der Walt, S.J.; Gommers, R.; Virtanen, P.; Cournapeau, D.; Wieser, E.; Taylor, J.; Berg, S.; Smith, N.J.; et al. Array programming with NumPy. Nature 2020, 585, 357–362. [Google Scholar] [CrossRef]
  47. Virtanen, P.; Gommers, R.; Oliphant, T.E.; Haberland, M.; Reddy, T.; Cournapeau, D.; Burovski, E.; Peterson, P.; Weckesser, W.; Bright, J.; et al. SciPy 1.0: Fundamental algorithms for scientific computing in Python. Nat. Methods 2020, 17, 261–272. [Google Scholar] [CrossRef]
  48. Meurer, A.; Smith, C.P.; Paprocki, M.; Čertík, O.; Kirpichev, S.B.; Rocklin, M.; Kumar, A.M.; Ivanov, S.; Moore, J.K.; Singh, S.; et al. SymPy: Symbolic computing in Python. PeerJ Comput. Sci. 2017, 3, e103. [Google Scholar] [CrossRef]
  49. Laboratorium Eksploatacji Systemów Informatycznych i Sieci Komputerowych. 2024. Available online: https://zsz.prz.edu.pl/laboratoria/laboratorium-eksploatacji-systemow-informatycznych (accessed on 19 August 2024).
  50. LaCroix, J. Mastering Ubuntu Server: Master the Art of Deploying, Configuring, Managing, and Troubleshooting Ubuntu Server 18.04; Packt Publishing Ltd.: Birmingham, UK, 2018. [Google Scholar]
  51. Chesneau, B. Gunicorn Documentation, 2017. Available online: https://docs.gunicorn.org/en/stable/ (accessed on 19 August 2024).
  52. Reese, W. Nginx: The high-performance web server and reverse proxy. Linux J. 2008, 2008, 2. [Google Scholar]
  53. Aas, J.; Barnes, R.; Case, B.; Durumeric, Z.; Eckersley, P.; Flores-López, A.; Halderman, J.A.; Hoffman-Andrews, J.; Kasten, J.; Rescorla, E.; et al. Let’s Encrypt: An automated certificate authority to encrypt the entire web. In Proceedings of the 2019 ACM SIGSAC Conference on Computer and Communications Security, London, UK, 11–15 November 2019; pp. 2473–2487. [Google Scholar]
  54. Denney, R. Configuring a Cisco ASA 5505 in Basic Interface Configuration (ASA 5505). Available online: https://www.cisco.com/c/en/us/td/docs/security/asa/asa92/configuration/general/asa-general-cli/interface-basic-5505.pdf (accessed on 19 August 2024).
  55. Gupta, A.; Sharma, L.S. Performance evaluation of snort and suricata intrusion detection systems on ubuntu server. In Proceedings of the ICRIC 2019: Recent Innovations in Computing; Springer International Publishing: Cham, Switzerland, 2019; pp. 811–821. [Google Scholar]
  56. Kyambadde, G.; Ngubiri, J. A tool to mitigate denial of service attacks on wired networks. Int. J. Comput. Technol. 2018, 5, 102–107. [Google Scholar]
  57. Usługi Uczelnianej Sieci Komputerowej Przeznaczone dla Pracowników PRz. 2024. Available online: https://usk.prz.edu.pl/ (accessed on 19 August 2024).
  58. Saaty, T.L. A Scaling Method for Priorities in Hierarchical Structures. J. Math. Psychol. 1977, 15, 234–281. [Google Scholar] [CrossRef]
  59. Saaty, T.L. Analytic Hierarchy Process; McGraw-Hill: New York, NY, USA, 1980. [Google Scholar]
  60. Xu, Z.; Wei, C. A Consistency Improving Method in the Analytic Hierarchy Process. Eur. J. Oper. Res. 1999, 116, 443–449. [Google Scholar] [CrossRef]
  61. Szybowski, J. The improvement of data in pairwise comparison matrices. Procedia Comput. Sci. 2018, 126, 1006–1013. [Google Scholar] [CrossRef]
  62. Koczkodaj, W.W. A new definition of consistency of pairwise comparisons. Math. Comput. Model. 1993, 18, 79–84. [Google Scholar] [CrossRef]
  63. Ramík, J.; Korviny, P. Inconsistency of pairwise comparison matrix with fuzzy elements based on geometric mean. Fuzzy Sets Syst. 2010, 161, 1604–1613. [Google Scholar] [CrossRef]
  64. Golden, B.; Wang, Q. An alternate measure of consistency. In The Analytic Hierarchy Process, Applications and Studies; B. Golden, E.W., Harker, P.T., Eds.; Springer: Berlin/Heidelberg, Germany, 1989; pp. 68–81. [Google Scholar]
  65. Peláez, J.I.; Lamata, M.T. A new measure of inconsistency for positive reciprocal matrices. Comput. Math. Appl. 2003, 46, 1839–1845. [Google Scholar] [CrossRef]
  66. Salo, A.A.; Hämäläinen, R. Preference Programming through Approximate Ratio Comparisons. Eur. J. Oper. Res. 1995, 82, 458–475. [Google Scholar] [CrossRef]
  67. Barzilai, J. Consistency measures for pairwise comparison matrices. J. Multi-Criteria Decis. Anal. 1998, 7, 123–132. [Google Scholar] [CrossRef]
  68. Stein, W.E.; Mizzi, P.J. The Harmonic Consistency Index for the Analytic Hierarchy Process. Eur. J. Oper. Res. 2007, 177, 488–497. [Google Scholar] [CrossRef]
  69. Hastebin. 2024. Available online: https://hastebin.com/share/anidodekur.python (accessed on 19 August 2024).
  70. Hastebin. 2024. Available online: https://hastebin.com/share/afopubusuy.python (accessed on 19 August 2024).
  71. Hastebin. 2024. Available online: https://hastebin.com/share/abiguzudur.less (accessed on 19 August 2024).
  72. Keller, M.S. Take command: Cron: Job scheduler. Linux J. 1999, 1999, 15-es. [Google Scholar]
  73. Reznick, L. Using cron and crontab. Sys Admin 1993, 2, 29–32. [Google Scholar]
  74. Panda, S.; Ramani, S. Protection of web application against SQL injection attacks. Int. J. Mod. Eng. Res. (IJMER) 2013, 3, 166–168. [Google Scholar]
  75. Mohanty, S.; Acharya, A.A.; Mishra, D.B.; Panda, N. Security Testing of Web Applications Using Threat Modeling: A Systematic Review. IJCSMC Int. J. Comput. Sci. Mob. Comput. 2019, 8, 50–57. [Google Scholar]
  76. Shar, L.K.; Tan, H.B.K. Defeating SQL injection. Computer 2012, 46, 69–77. [Google Scholar] [CrossRef]
  77. Gupta, S.; Gupta, B.B. Cross-Site Scripting (XSS) attacks and defense mechanisms: Classification and state-of-the-art. Int. J. Syst. Assur. Eng. Manag. 2017, 8, 512–530. [Google Scholar] [CrossRef]
  78. Hydara, I.; Sultan, A.B.M.; Zulzalil, H.; Admodisastro, N. Current state of research on cross-site scripting (XSS)—A systematic literature review. Inf. Softw. Technol. 2015, 58, 170–186. [Google Scholar] [CrossRef]
  79. Sarmah, U.; Bhattacharyya, D.K.; Kalita, J.K. A survey of detection methods for XSS attacks. J. Netw. Comput. Appl. 2018, 118, 113–143. [Google Scholar] [CrossRef]
  80. Grossman, J. XSS Attacks: Cross Site Scripting Exploits and Defense; Syngress: Burlington, MA, USA, 2007. [Google Scholar]
  81. Klein, A. DOM based cross site scripting or XSS of the third kind. Web Appl. Secur. Consortium Artic. 2005, 4, 365–372. [Google Scholar]
  82. Dayanandam, G.; Rao, T.V.; Babu, D.B.; Durga, S.N. DDoS attacks—Analysis and prevention. In Innovations in Computer Science and Engineering: Proceedings of the Fifth ICICSE 2017; Springer: Singapore, 2019; pp. 1–10. [Google Scholar]
  83. Bhattacharyya, D.K.; Kalita, J.K. DDoS Attacks: Evolution, Detection, Prevention, Reaction, and Tolerance; CRC Press: Boca Raton, FL, USA, 2016. [Google Scholar]
  84. Zhang, B.; Zhang, T.; Yu, Z. DDoS detection and prevention based on artificial intelligence techniques. In Proceedings of the 2017 3rd IEEE International Conference on Computer and Communications (ICCC), Chengdu, China, 13–16 December 2017; pp. 1276–1280. [Google Scholar]
  85. Badotra, S.; Panda, S.N. SNORT based early DDoS detection system using Opendaylight and open networking operating system in software defined networking. Clust. Comput. 2021, 24, 501–513. [Google Scholar] [CrossRef]
  86. Saboor, A.; Akhlaq, M.; Aslam, B. Experimental evaluation of Snort against DDoS attacks under different hardware configurations. In Proceedings of the 2013 2nd National Conference on Information Assurance (NCIA), Rawalpindi, Pakistan, 11–12 December 2013; pp. 31–37. [Google Scholar]
  87. Mazurek, J. Advances in Pairwise Comparisons; Springer: Cham, Switzerland, 2023. [Google Scholar] [CrossRef]
  88. BitBar. 2024. Available online: https://smartbear.com/product/bitbar/ (accessed on 19 August 2024).
  89. Madhusudhan, R.; Surashe, S.V. Privacy and Security Comparison of Web Browsers: A Review. In Proceedings of the International Conference on Advanced Information Networking and Applications, Sydney, Australia, 13–15 April 2022; pp. 459–470. [Google Scholar]
  90. Tewari, N.; Datt, G. A study on the systematic review of security vulnerabilities of popular web browsers. In Proceedings of the 2021 International Conference on Technological Advancements and Innovations (ICTAI), Tashkent, Uzbekistan, 10–12 November 2021; pp. 314–318. [Google Scholar]
  91. Vaughan-Nichols, S.J. Will HTML 5 restandardize the web? Computer 2010, 43, 13–15. [Google Scholar] [CrossRef]
  92. Alajarmeh, N. Evaluating the accessibility of public health websites: An exploratory cross-country study. Univers. Access Inf. Soc. 2022, 21, 771–789. [Google Scholar] [CrossRef]
  93. Aronson, L. HTML Manual of Style: A Clear, Concise Reference for Hypertext Markup Language (Including HTML5); Pearson Education: Upper Saddle River, NJ, USA, 2010. [Google Scholar]
  94. Batishchev, A.M. LOIC (Low Orbit Ion Cannon). Available online: http://sourceforge.net/projects/loic (accessed on 19 August 2024).
  95. Cheepborisuttikul, T.; Teng-amnuay, Y. Using Low Orbit Ion Cannon for Denial of Service Attack Based on CVE. In Proceedings of the Second International Conference on Advances in Information Technology-AIT 2013, Chikkamagaluru, India, 24–27 July 2013; pp. 145–149. [Google Scholar]
  96. GTmetrix. 2024. Available online: https://gtmetrix.com/ (accessed on 19 August 2024).
  97. Widyani, N.P.K.; Sudana, A.K.O.; Piarsa, I.N. Pengujian Performa Sistem Informasi Perpustakaan Online pada Universitas Hindu Indonesia (Astakali UNHI) Menggunakan Tools GTmetrix. J. Ilm. Teknol. Dan Komput. 2021, 545–551. [Google Scholar] [CrossRef]
  98. REDUCE. 2024. Available online: https://reduce.prz.edu.pl/pliki/raport_gmetric.pdf (accessed on 19 August 2024).
  99. Semma, A. Speed Matters: Measuring Time to First Byte and Other Key Metrics in VueJS Components Frameworks: Array. Int. J. Impot. Res. 2023, 4, 1–7. [Google Scholar]
  100. Janssen, K.; Pelle, T.; De Geus, L.; Van Der Gronden, R.; Islam, T.; Malavolta, I. On the impact of the critical css technique on the performance and energy consumption of mobile browsers. In Proceedings of the 26th International Conference on Evaluation and Assessment in Software Engineering, Gothenburg, Sweden, 13–15 June 2022; pp. 130–139. [Google Scholar]
  101. Budiman, E.; Puspitasari, N.; Alam, S.N.; Akbar, M.A.; Indra, D. Performance Analysis of the Resource Loading Time for Borneo Biodiversity Information System. In Proceedings of the 2018 Third International Conference on Informatics and Computing (ICIC), Palembang, Indonesia, 17–18 October 2018; pp. 1–5. [Google Scholar]
  102. Nilsson, S. Evaluation of the Blazor and Angular Frameworks Performance for Web Applications. Bachelor’s Thesis, Dalarna University, Falun, Sweden, 2021. [Google Scholar]
  103. Iliev, I.; Dimitrov, G.P. Front end optimization methods and their effect. In Proceedings of the 2014 37th International Convention on Information and Communication Technology, Electronics and Microelectronics (MIPRO), Opatija, Croatia, 26–30 May 2014; pp. 467–473. [Google Scholar]
  104. Halepovic, E.; Pang, J.; Spatscheck, O. Can you GET me now? Estimating the time-to-first-byte of HTTP transactions with passive measurements. In Proceedings of the 2012 Internet Measurement Conference, Boston, MA, USA, 14–16 November 2012; pp. 115–122. [Google Scholar]
  105. Asrese, A.S.; Eravuchira, S.J.; Bajpai, V.; Sarolahti, P.; Ott, J. Measuring web latency and rendering performance: Method, tools, and longitudinal dataset. IEEE Trans. Netw. Serv. Manag. 2019, 16, 535–549. [Google Scholar] [CrossRef]
  106. Beatty, P.; Dick, S.; Miller, J. Is HTML in a race to the bottom? A large-scale survey and analysis of conformance to W3C standards. IEEE Internet Comp. 2008, 12, 76–80. [Google Scholar] [CrossRef]
  107. Hantke, F.; Stock, B. HTML violations and where to find them: A longitudinal analysis of specification violations in HTML. In Proceedings of the 22nd ACM Internet Measurement Conference, Nice, France, 25–27 October 2022; pp. 358–373. [Google Scholar]
  108. HTML (HyperText Markup Language). 2022. Available online: https://developer.mozilla.org/en-US/docs/Web/HTML (accessed on 24 August 2024).
  109. McManus, S. Web Design in Easy Steps; In Easy Steps Limited: Warwickshire, UK, 2023. [Google Scholar]
  110. Lie, H.W.; Saarela, J. Multipurpose Web publishing using HTML, XML, and CSS. Commun. ACM 1999, 42, 95–101. [Google Scholar] [CrossRef]
  111. Cyroň, M. CSS-Kaskádové Styly: Praktický Manuál; Grada Publishing: Prague, Czech Republic, 2006. [Google Scholar]
  112. Baker, S.C. Making it work for everyone: HTML5 and CSS level 3 for responsive, accessible design on your library’s web site. J. Libr. Inf. Serv. Distance Learn. 2014, 8, 118–136. [Google Scholar] [CrossRef]
  113. Durango, A. Diseño Web con CSS: 2ª Edición; IT Campus Academy: Columbus, Georgia, 2015. [Google Scholar]
  114. Caldwell, B.; Cooper, M.; Reid, L.G.; Vanderheiden, G.; Chisholm, W.; Slatin, J.; White, J. Web content accessibility guidelines (WCAG) 2.0. WWW Consort. (W3C) 2008, 290, 1–34. [Google Scholar]
  115. Rømen, D.; Svanæs, D. Validating WCAG versions 1.0 and 2.0 through usability testing with disabled users. Univers. Access Inf. Soc. 2012, 11, 375–385. [Google Scholar] [CrossRef]
  116. Kelly, B.; Sloan, D.; Phipps, L.; Petrie, H.; Hamilton, F. Forcing standardization or accommodating diversity? A framework for applying the WCAG in the real world. In Proceedings of the 2005 International Cross-Disciplinary Workshop on Web Accessibility (W4A), Chiba, Japan, 10–14 May 2005; pp. 46–54. [Google Scholar]
  117. Zadrożny, J. Web Content Accessibility Guidelines (WCAG) 2.0—Zasady i wytyczne do tworzenia dostępnych serwisów internetowych. Niepełnosprawność-Zagadnienia Probl. Rozw. 2014, 3, 17–23. [Google Scholar]
  118. Reid, L.G.; Snow-Weaver, A. WCAG 2.0: A web accessibility standard for the evolving web. In Proceedings of the 2008 International Cross-Disciplinary Conference on Web Accessibility (W4A), Beijing China, 21–22 April 2008; pp. 109–115. [Google Scholar]
  119. Maliszewska, S. Zarządzanie Dostępnością Cyfrową w Instytucjach Kultury. Bachelor’s Thesis, Uniwersytet Jagielloński w Krakowie, Kraków, Poland, 2023. [Google Scholar]
  120. Agoston, K.C.; Csató, L. Inconsistency thresholds for incomplete pairwise comparison matrices. Omega 2022, 108, 102576. [Google Scholar] [CrossRef]
  121. Kumar, V. Making ’freemium’ work. Harv. Bus. Rev. 2014, 92, 27–29. [Google Scholar]
  122. Gu, X.; Kannan, P.K.; Ma, L. Selling the premium in freemium. J. Mark. 2018, 82, 10–27. [Google Scholar] [CrossRef]
  123. Prasanna, R.P.I.R.; Jayasundara, J.M.S.B.; Naradda Gamage, S.K.; Ekanayake, E.M.S.; Rajapakshe, P.S.K.; Abeyrathne, G.A.K.N.J. Sustainability of SMEs in the competition: A systemic review on technological challenges and SME performance. J. Open Innov. Technol. Mark. Complex. 2019, 5, 100. [Google Scholar] [CrossRef]
  124. Expert Choice Inc. Expert Choice. Analytical Hierarchy Process (AHP) Software, version 9; Expert Choice Inc.: Arlington, VI, USA; Available online: https://www.expertchoice.com/ahp-software (accessed on 19 August 2024).
  125. Ishizaka, A.; Labib, A. Analytic hierarchy process and expert choice: Benefits and limitations. Insight 2009, 22, 201–220. [Google Scholar] [CrossRef]
  126. Qvistorp. Qvistorp Growth: Strategic Planning and Investment Decision Software. 2023. Available online: https://www.qvistorp.com/ (accessed on 19 August 2023).
  127. Paramount Decisions. Paramount Decisions: Collaborative Decision Making Software. 2023. Available online: https://www.paramountdecisions.com/ (accessed on 19 August 2023).
  128. Salles, M. Decision making in SMEs and information requirements for competitive intelligence. Prod. Plan. Control 2006, 17, 229–237. [Google Scholar] [CrossRef]
  129. Gilmore, A.; Carson, D. The demonstration of a methodology for assessing SME decision making. J. Res. Mark. Entrep. 2000, 2, 108–124. [Google Scholar] [CrossRef]
  130. O’Regan, N.; Sims, M.; Ghobadian, A. High performance: Ownership and decision-making in SMEs. Manag. Decis. 2005, 43, 382–396. [Google Scholar] [CrossRef]
  131. Xu, H.; Gupta, S.; Rosson, M.B.; Carroll, J.M. Measuring mobile users’ concerns for information privacy. In Proceedings of the Thirty Third International Conference on Information Systems, Orlando, FL, USA, 16–19 December 2012. [Google Scholar]
  132. Zukowski, T.; Brown, I. Examining the influence of demographic factors on internet users’ information privacy concerns. In Proceedings of the 2007 Annual Research Conference of the South African Institute of Computer Scientists and Information Technologists on IT Research in Developing Countries, Port Elizabeth, South Africa, 2–3 October 2007. [Google Scholar]
  133. Schwartz, P.M. Information privacy in the cloud. Univ. Pa. Law Rev. 2012, 161, 1623–1647. [Google Scholar]
  134. Al-Harbi, K.M.A.S. Application of the AHP in project management. Int. J. Proj. Manag. 2001, 19, 19–27. [Google Scholar] [CrossRef]
  135. Han Rebekah Wong, S. Which platform do our users prefer: Website or mobile app? Ref. Serv. Rev. 2012, 40, 103–115. [Google Scholar] [CrossRef]
  136. Kaushik, S.; Pant, S.; Joshi, L.K.; Kumar, A.; Ram, M. A review based on various applications to find a consistent pairwise comparison matrix. J. Reliab. Stat. Stud. 2024, 17, 45–76. [Google Scholar] [CrossRef]
Figure 1. The tool REDUCE (https://reduce.prz.edu.pl/, accessed on 19 August 2024).
Applsci 14 11465 g001
Figure 2. The results of processing by the REDUCE (https://reduce.prz.edu.pl/, accessed on 19 August 2024) tool.
Applsci 14 11465 g002
Figure 3. Structure of the web application REDUCE (https://reduce.prz.edu.pl/, accessed on 19 August 2024).
Applsci 14 11465 g003
Figure 4. Appearance of the matrix input section.
Applsci 14 11465 g004
Figure 5. Changing the size of the input matrix.
Applsci 14 11465 g005
Figure 6. Appearance of the matrix input section.
Applsci 14 11465 g006
Figure 7. Panel with statistics from the test conducted on an Android mobile device.
Applsci 14 11465 g007
Figure 8. Content of the console.log file on an iPhone device.
Applsci 14 11465 g008
Figure 9. Overall performance evaluation of the REDUCE (https://reduce.prz.edu.pl/, accessed on 19 August 2024) website.
Applsci 14 11465 g009
Figure 10. Performance metrics of the REDUCE (https://reduce.prz.edu.pl/, accessed on 19 August 2024) website.
Applsci 14 11465 g010
Figure 11. Structure of the impact of individual elements on website loading time.
Applsci 14 11465 g011
Figure 12. Waterfall chart showing loading times of individual elements.
Applsci 14 11465 g012
Figure 13. Detailed statistics on the types of page elements used.
Applsci 14 11465 g013
Table 1. Comparison of REDUCE with existing decision-making tools.
SoftwareKey FeaturesAdvantagesDisadvantages
REDUCEFree online decision-making tool with support for inconsistency reduction in pairwise comparisons; offers algorithms for inconsistency reduction; supports AHP to some extentFree to use; accessible online without installation; focuses on inconsistency reduction; suitable for small and medium enterprises; user-friendly interfaceLimited features compared to commercial software; currently supports only two inconsistency reduction algorithms; lacks advanced AHP functionalities
Expert Choice [124]Comprehensive decision-making software based on AHP; provides various tools for modeling, analyzing, and visualizing decisionsWell-established and trusted; rich feature set; advanced analysis and reporting capabilities; support and training availableExpensive; may be unaffordable for small and medium enterprises; requires installation; steep learning curve
Qvistorp [126]Strategic planning and investment decision software; focuses on financial modeling and evaluationAdvanced financial modeling; supports complex investment decisions; provides strategic planning toolsHigh cost; may be overly complex for simple decision making; less focus on inconsistency reduction in pairwise comparisons
Paramount Decisions [127]Web-based decision-making tool using choosing by advantages (CBA) methodology; facilitates collaborative decision makingUser-friendly interface; promotes transparency and collaboration; accessible online; suitable for group decisionsSubscription-based; may lack advanced analytical features; less focus on pairwise comparisons and inconsistency reduction
Disclaimer/Publisher’s Note: The statements, opinions and data contained in all publications are solely those of the individual author(s) and contributor(s) and not of MDPI and/or the editor(s). MDPI and/or the editor(s) disclaim responsibility for any injury to people or property resulting from any ideas, methods, instructions or products referred to in the content.

