Article

The Influence of Grain Size on the Abrasive Wear Resistance of Hardox 500 Steel

1
Department of Vehicle Engineering, Faculty of Mechanical Engineering, Wroclaw University of Science and Technology, Wybrzeże Wyspiańskiego 27 Str., 50-370 Wrocław, Poland
2
Department of Light Elements Engineering, Foundry and Automation, Faculty of Mechanical Engineering, Wrocław University of Science and Technology, Wybrzeże Wyspiańskiego 27 Str., 50-370 Wrocław, Poland
3
Faculty of Mechanical Engineering, Wrocław University of Science and Technology, Wybrzeże Wyspiańskiego 27 Str., 50-370 Wrocław, Poland
*
Authors to whom correspondence should be addressed.
Appl. Sci. 2024, 14(24), 11490; https://doi.org/10.3390/app142411490
Submission received: 8 November 2024 / Revised: 3 December 2024 / Accepted: 6 December 2024 / Published: 10 December 2024

Abstract

:
High-strength martensitic steels with boron are among the leading materials widely recognized for their exceptional resistance to abrasive wear. These steels exhibit some of the highest strength indices among bulk steels, a result of their specific chemical composition, thermomechanical rolling processes at the steel mill, and the use of pure, high-quality ores. With hardness values ranging from 400 to 650 HBW, they are ideal for demanding applications such as excavator buckets, plow blades, shafts, wear-resistant bars, and container liners. One critical microstructural property contributing to their high mechanical performance is the prior austenite grain size (PAG). A finer grain structure is associated with enhanced plasticity, and plastic deformation plays a significant role in abrasive wear mechanisms. However, this relationship between grain size and wear resistance is not well-documented in the literature, with few studies providing specific quantitative data. To address this gap, the authors conducted a study to examine the effect of prior austenite grain size on wear resistance when exposed to loose abrasive electrofused alumina no. 90. The findings indicate that applying targeted heat treatment can increase hardness by 58 Brinell units compared to the as-delivered condition. Moreover, as grain size increases from 18 µm to 130 µm, the relative abrasive wear resistance coefficient Kb decreases from 1.00 (for Hardox 500 steel in its as-delivered state) to 0.80 for austenitized material treated at 1200 °C.

1. Introduction

Abrasive wear is a process in which the surface layers of interacting components degrade through the detachment of material particles, resulting in a loss of mass and thickness (dimensional reduction), as well as alterations to the structure and physical properties of the surface layer. For materials in these components, essential properties include high hardness, resistance to dynamic loads, and brittle fracture resistance, alongside compatibility with specific metal joining and processing techniques [1]. Among the materials with improved resistance to abrasive wear, high-strength martensitic boron steels are a leading group [2,3]. These steels are widely applied in machine components exposed to abrasive wear. The use of boron in steel production, however, has a historical background, with initial studies on boron’s effects on steel properties dating back to 1907. Early experiments added excessive amounts of boron (0.2–1.5% by weight) to the melt, which produced undesirable results due to the formation of coagulated intermetallic boron phases that lowered mechanical properties [4]. In 1921, researchers attempted boron additions at lower concentrations, leading to the development of self-hardening steels. Nevertheless, inconsistent results, attributed to the low metallurgical purity of available ores, hindered the widespread adoption of these promising materials. This situation persisted until 1935, when an American steel mill introduced an Al-Si-Zr-Ti ferroalloy during steel deoxidation. The addition of these elements mitigated boron compounds’ adverse effects on hardenability, facilitating the production of bainitic steels with tensile strengths (Rm) up to 1200 MPa. In this case, boron was an incidental addition due to insufficient ore purification [5]. Limited by the research technology of the era, scientists were unable to fully explain boron’s mechanism on hardenability. However, during World War II and later, the Korean War, boron microalloyed steels saw increasing use, as shortages of costly alloying elements like nickel, chromium, and molybdenum drove a shift towards less expensive alternatives. Today, economic pressures continue to motivate the use of boron in steel, with applications across industries like mining, agriculture, construction, and machinery, where components undergo intensive abrasive wear [4,6]. The influence of boron on microstructural properties, specifically as defined by the grain size of the prior austenite, also warrants examination. Although martensitic boron steels are classified as fine-grained, with an initial grain size of approximately 20 µm as delivered from the mill [7], these materials are subject to heat treatments that may lead to grain growth, such as during welding of components made from them [8]. It is essential to consider that martensite has a hierarchical structure, comprising packets, blocks, and laths within the prior austenite grain. Research suggests that boron positively affects grain refinement by reducing bainite lath thickness [9], facilitating high tensile strengths (Rm) exceeding 2000 MPa in mass-produced steels [10]. Nonetheless, boron may have adverse effects on the examined microstructural aspects if improper processing of these steels leads to the formation of boron nitrides (BN) [11,12]. The most effective inhibitors of grain growth are primarily nitrogen compounds with titanium (TiN), which remain stable even at temperatures of 1150 °C [13], as well as nitrogen compounds with aluminum (AlN).
The microstructural aspect of grain boundary strengthening is crucial in enhancing steel strength, as described by the Hall–Petch relationship. According to this theory, increasing the yield strength at room temperature is achievable by reducing grain size within the microstructure [14,15,16]. This mechanism relies on grain boundaries to hinder dislocation movement by introducing changes in the crystal lattice orientation and atomically mismatched regions. In larger grains, dislocations tend to accumulate at boundaries, creating stresses that can surpass the energy barrier, allowing for further atomic diffusion.
The Hall–Petch relationship is described by Equations (1) and (2) [17]:
σ y = σ 0 + k y d
where:
σy is the yield strength,
σ0 is the friction stress of the network, yield strength of the single crystal,
ky is the strengthening coefficient, a constant value for each material, and
d is the average grain size.
k y ~ 3 2 G b τ b q π 1 / 2
where:
G is the shear modulus,
b is Burgers vector,
q is a geometric factor (dependent on the type of lattice), and
τb is critical stress required for passing the slide through the grain boundary.
A similar correlation can also be formulated for the brittle decohesion of high-strength steels, as seen in (3) and (4) [17,18]:
σ f = σ 0 f k f d
where:
σf is the material strength, and
σ0f and kf are constants determined experimentally, for kf > ky.
k f 6 π γ G 1 v 2
where:
γ is the surface fracture energy, and
ν is Poisson’s ratio.
In martensitic and bainitic steels, this relationship extends to hierarchical substructures such as packets, blocks, and laths. The refinement of prior austenite grains (PAGs) leads to a higher density of these substructures, particularly high-angle grain boundaries (HAGBs), which effectively impede crack propagation and enhance the toughness of the steel. Studies [19,20,21,22] have shown that uniform refinement of prior austenite grains significantly improves the mechanical performance of bainitic and martensitic steels. For example, finer prior austenite grains increase the density of high-angle grain boundaries, creating a microstructure that is more resistant to brittle fracture, while low-angle grain boundaries (LAGBs) are less effective at arresting cracks. Crack propagation in steel extends along the boundary of a block within a packet but bends when it encounters the packet boundary [22]. The presence of these boundaries increases energy dissipation during fracture events by deflecting and arresting cracks, which is particularly evident in Charpy impact tests. For instance, steels with refined prior austenite grains exhibit smaller cleavage facets and delayed brittle fracture tendencies, indicating superior performance under high-stress conditions.
This microstructural refinement also has implications for tribological applications. Smaller grains contribute to increased surface hardness and resistance to abrasive wear, while maintaining sufficient ductility to absorb energy during wear processes. Plastic deformation also plays a role in abrasive wear mechanisms, such as grooving, scratching, and fatigue wear. In steels exhibiting plasticity, a single pass of an abrasive particle may not result in material detachment. Instead, a prow forms at the grain’s leading edge, with material displacing to the sides and forming ridges along the groove. However, volume loss may still occur due to repeated abrasive actions or ongoing impact by individual grains, eventually leading to material detachment through low-cycle fatigue or micro-fatigue [16]. Notably, plastic deformation within the surface layer can positively influence abrasion resistance [3,23]. At the same time, a decrease in yield strength associated with grain growth can negatively impact materials subjected to micro-cutting and brittle fracture wear mechanisms. Additionally, materials with smaller grain sizes display higher fracture resistance, as energy dissipates during directional changes in crack propagation; larger grain boundary areas introduce more obstacles for progressing structural discontinuities. Grain size can also indirectly affect tribological resistance by modifying strength and plastic properties. For instance, Chintha [24] identified prior austenite grain size as a potential factor in abrasive wear intensity, citing a reduction in steel ductility as grain size increases. However, this correlation is not universally applicable, with limited studies examining steels with a homogeneous martensitic microstructure. Some studies [25,26] found that stresses generated by hard abrasive particle impacts exceeded those experienced during cold plastic deformation, restricting findings to extreme conditions. The authors of [14] concluded that reducing grain size increases wear resistance, though the steels compared varied in composition, and grain size changes did not consistently correlate with hardness changes. Research on the effect of prior austenite grain size on the abrasive wear of Hardox 450 steel [1] also revealed no significant changes in tribological resistance, aligning with the findings in [27] for steels with microstructures similar to Hardox.
Given the importance of these findings, Hardox 500 steel was selected for research on grain size effects in martensitic boron steels. According to its manufacturer, Hardox 500 is weldable and bendable, making it suitable for a broad range of applications. This versatility outperforms that of Hardox 600 and Hardox Extreme steels, which face stricter limitations in structural applications [28,29]. Hardox 500 is widely used in plow blades, consistently surpassing 38GSA steel (548 HBW hardness), commonly applied in agriculture [30,31]. Additional applications include excavator buckets, cultivator tines, liners, and wear-resistant bars [32,33]. In abrasive wear tests, Hardox 500 has demonstrated lower mass loss than steels S355JR, S355J2, and AISI304 [34] as well as carburized 20MnCr5 steel [31]. Furthermore, when exposed to soil-based abrasive materials, its abrasion resistance is comparable to Hardox Extreme steel [35]. Recent investigations into low alloy boron steels underscore the pivotal influence of grain size on wear resistance, highlighting a direct correlation between finer grains and enhanced performance under abrasive conditions [7,15,19,24]. These studies emphasize that the increased density of grain boundaries in finer-grained microstructures impedes dislocation motion and crack propagation, thereby significantly augmenting material durability in high-stress environments. This evidence underscores the imperative to refine grain size through precisely controlled heat treatment protocols, as explored comprehensively in this work.

2. Materials and Methods

2.1. Material

The study utilized 10 mm thick sheets of Hardox 500 steel, supplied by an authorized distributor, STAL-HURT. The chemical composition analysis was conducted using the spectral method with a Leco GDS500A glow discharge emission analyzer. The following parameters were applied to enable ionization of the inert gas: U = 1250 V; I = 45 mA; 99.999% argon. The obtained results represented the arithmetic mean of at least five measurements. According to the chemical composition, Hardox 500 steel is classified as medium-carbon steel (C = 0.29% by weight), with the key elements enhancing hardenability being manganese (0.74% by weight), chromium (0.61% by weight), and a micro-addition of boron (0.0009% by weight). The inclusion of aluminum and titanium prevents an undesirable reduction in hardenability by minimizing boron depletion at grain boundaries through the formation of BN and B2O3 compounds. These elements bind oxygen and nitrogen into intermetallic phases, thereby preserving the required boron content within the interstitial sites of the crystal structure. Niobium can also positively influence hardenability by inhibiting the precipitation of the Fe23(C,B)6 compound [36], binding carbon into niobium and titanium carbonitrides (Nb, Ti) (C, N) or molybdenum and titanium carbonitrides (Ti, Mo) (C, N). However, niobium is not present in Hardox 500 steel. Additionally, the low levels of harmful elements (P and S) help maintain high mechanical properties. The chemical composition of the analyzed material is presented in Table 1.
Heat treatments were carried out in gas-tight chamber furnaces (FCF 12SHM/R by Czylok, Jastrzębie-Zdrój, Poland) with a protective atmosphere of 99.95% argon. Austenitizing was performed at five target temperatures: 850 °C, 900 °C, 1000 °C, 1100 °C, and 1200 °C. Samples were held at the specified temperature for 120 min, followed by water quenching at 30 °C. Temperature and holding time were controlled using automated furnace settings, with deviations monitored and maintained within ±2 °C and thermocoupled.
For prior austenite grain size analysis, additional tempering was applied after austenitizing. The samples were heated to 550 °C, held for 30 min in the furnace, and subsequently cooled in the furnace. This tempering step was essential for carbide precipitation along the prior austenite grain boundaries, which enabled their visualization during etching with reagent No. 8, as specified in ASTM E407 [37].
In contrast, for hardness testing and abrasive wear resistance evaluation, samples were not tempered after quenching. This was to preserve the as-quenched martensitic microstructure, as tempering significantly alters both the microstructure and mechanical properties. The lack of tempering ensured that the tested samples reflected the direct effects of austenitizing conditions, enabling accurate comparisons of wear resistance and hardness across the different heat treatments. Detailed parameters of the heat treatment are presented in Table 2.

2.2. Microstructural Analysis

The microstructural examination was conducted using a Nikon Eclipse MA200 light microscope (LM) to assess the steel’s microstructure. The specimens were etched using reagent No. 3 according to ASTM E407 standards [37]. To reveal prior austenite grain boundaries, reagent No. 8 (5 mL picric acid, 0.5% sodium alkyl sulfonate, 100 mL H2O) at approximately 55 °C, as specified in ASTM E407 [37], was utilized. These analyses were performed on both as-delivered and heat-treated samples.
Surface observations after laboratory abrasion resistance testing were conducted on unetched specimens using a Phenom XL scanning electron microscope (SEM) equipped with a secondary electron (SE) detector at an accelerating voltage of 15 kV. The samples were examined in their as-delivered state and post-heat treatment.
Quantitative assessment of the prior austenite grain size in representative sample areas was conducted using Image J software, version 1.54g. Through planimetric methods, cross-sectional areas (a) of 100 randomly selected grains were measured, and the flat grain diameter (d) was calculated as a . The results were analyzed using Statistica software version 13, which was used to generate grain diameter distribution patterns. A constant class count of 10 was maintained. The empirical distributions obtained were analyzed for conformity with theoretical distributions (log-normal, exponential, and gamma). Pearson’s chi-squared ( χ 2 ) test was used to evaluate the fit of experimental distributions to theoretical models.
For surface reconstruction, a HITACHI TM-3000 SEM and dedicated graphic-analytical software 3D Image Viewer Version 2.1.0 were employed. Prior to surface roughness assessment, the samples were cleaned with dry compressed air, checked for mechanical damage, and marked at three points, P1, P2, and P3 (Figure 1), where the surface reconstruction procedures would be conducted. All surface reconstructions were performed at a uniform magnification, allowing the elementary segment length lr = 198.03 μm or its tenfold (1980.26 µm), and consistent electron beam settings at 15 kV, ensuring detailed observation and recording of the steel sample surface features. Before examining the steel samples, a working distance (WD) calibration was conducted using a standard with a notched roughness profile.
The following roughness parameters were analyzed:
  • Ra, the arithmetic mean deviation of the profile,
  • Rq, the root mean square deviation of the profile,
  • Rz, the maximum height of the roughness profile based on 10 points,
  • Rp, the height of the highest peak in the profile,
  • Rv, the depth of the deepest valley in the profile, and
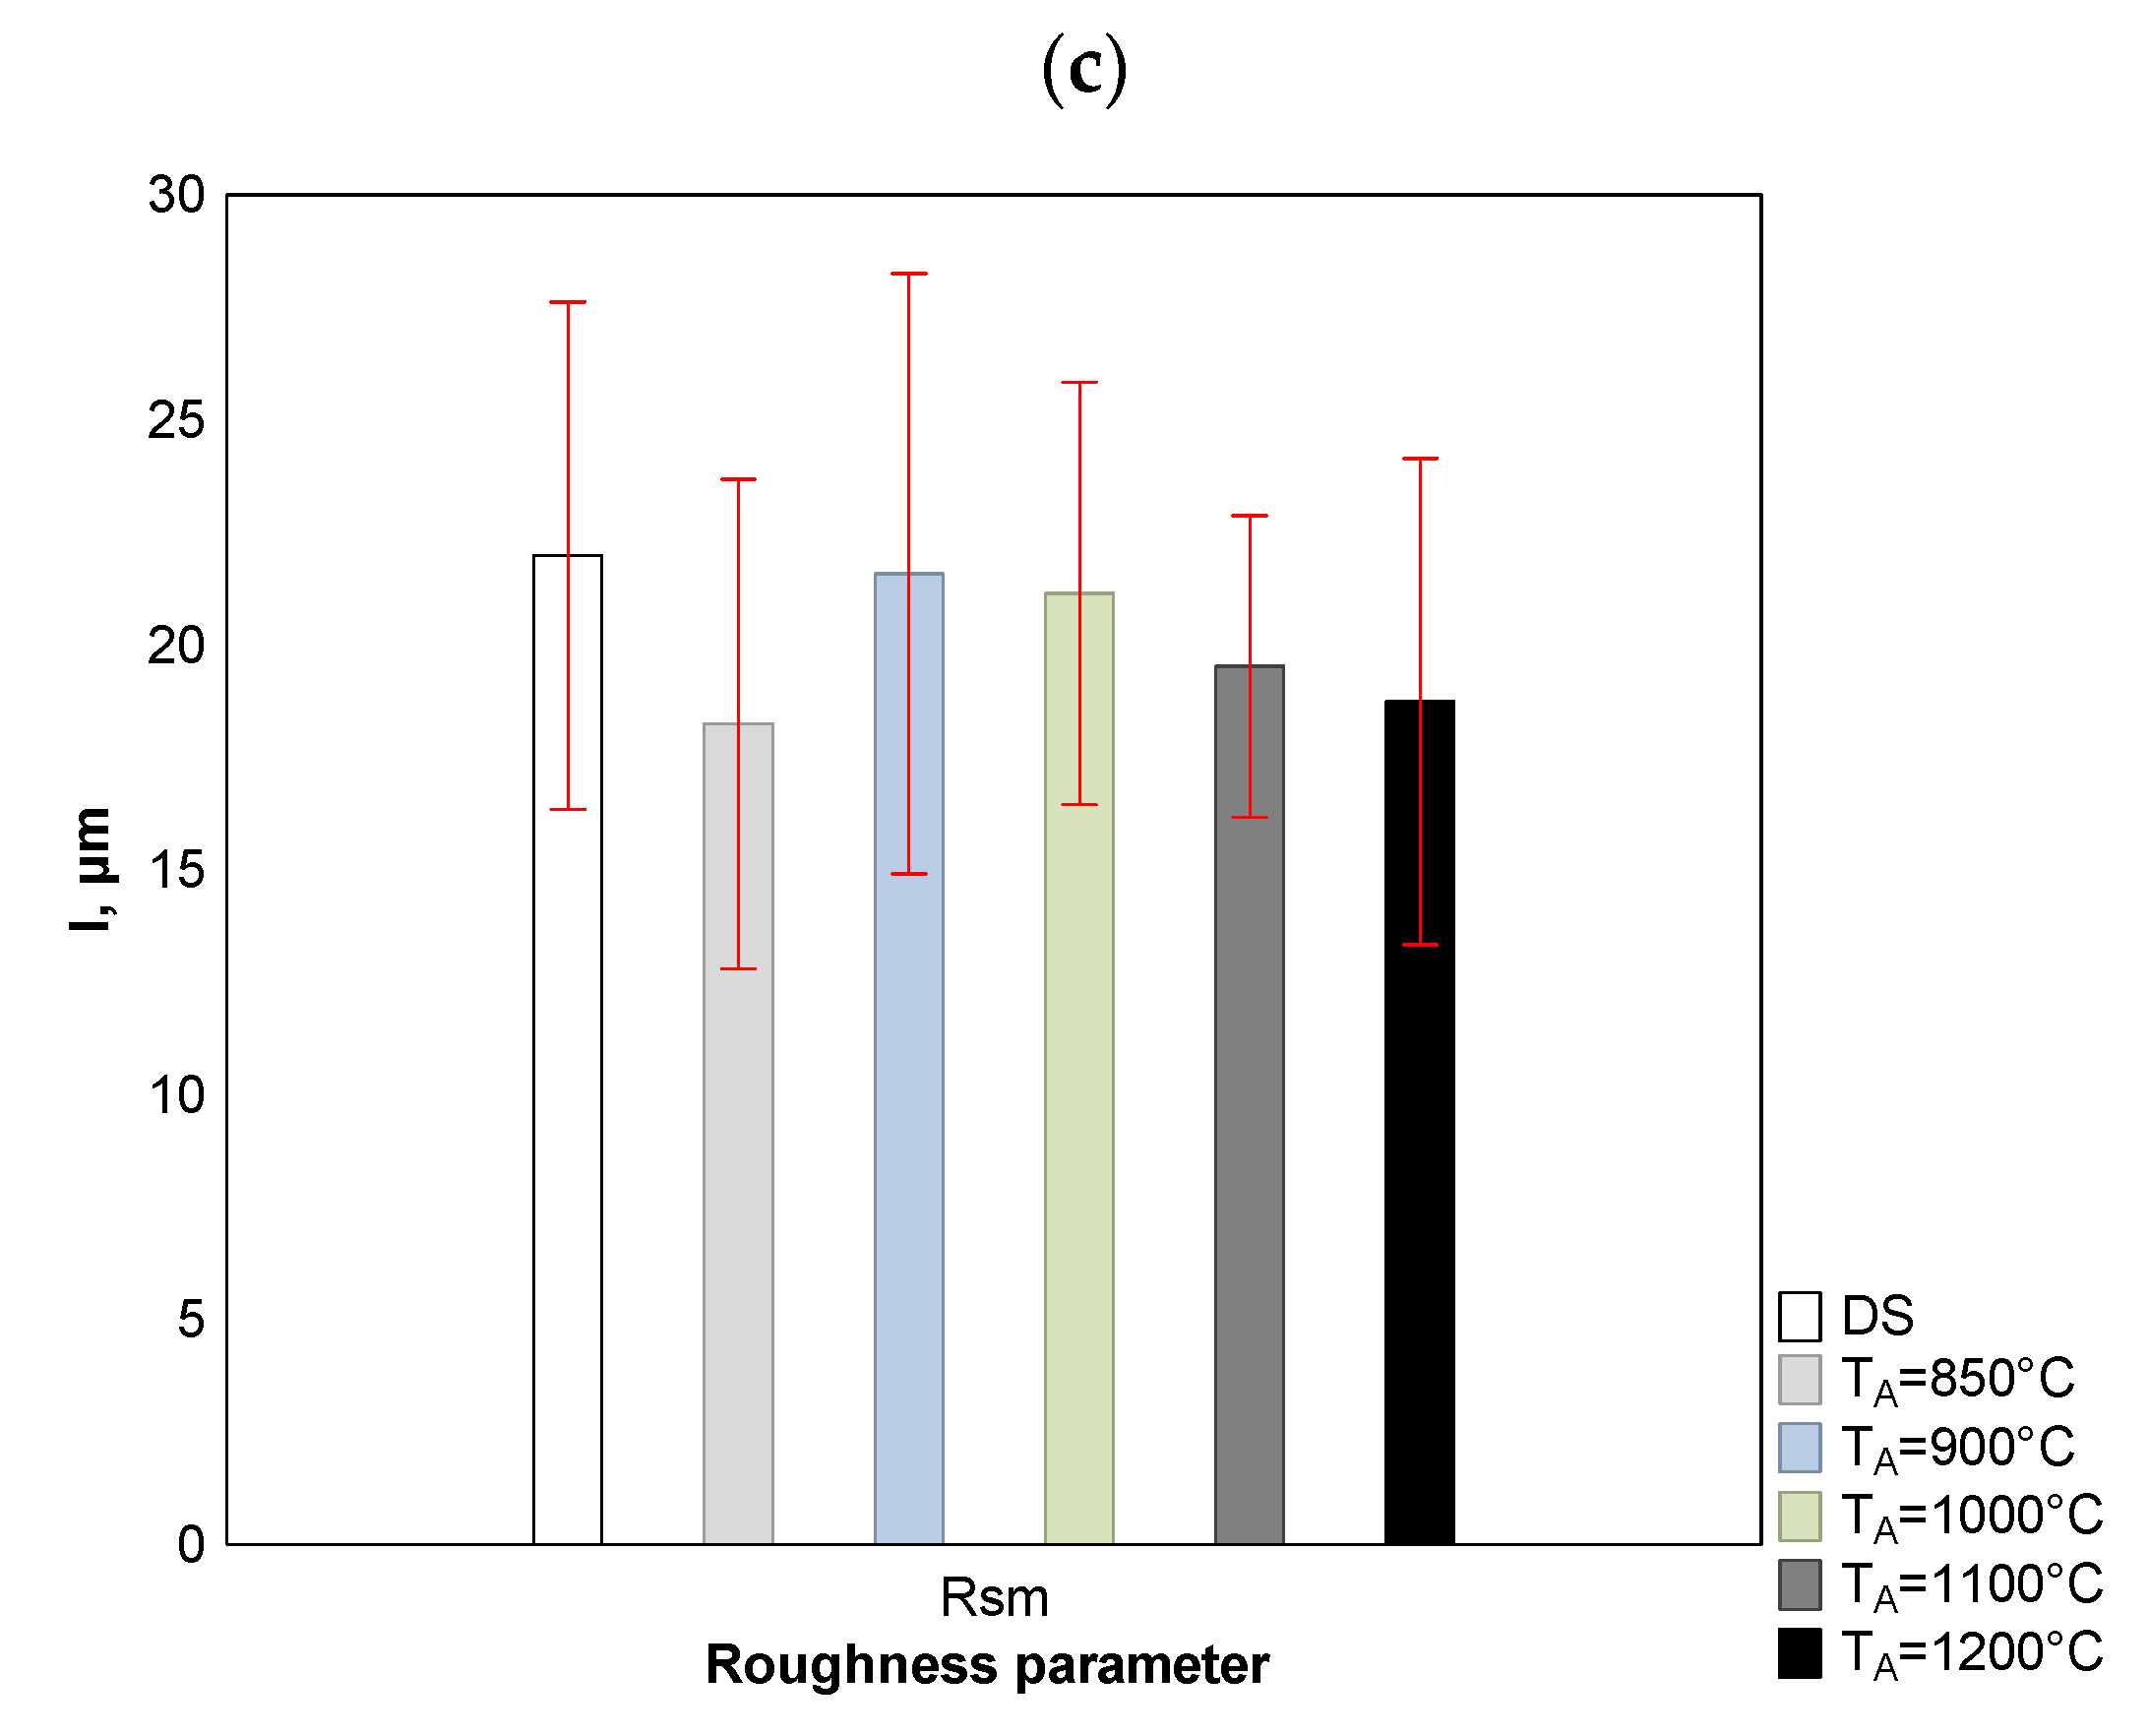
  • RSm, the mean spacing of the roughness profile.

2.3. Mechanical Property Testing

Hardness tests were conducted using a Zwick/Roel ZHU 187.5 universal hardness tester according to the Brinell method, following ISO 6506-1:2014 standards [38]. A 2.5 mm diameter tungsten carbide ball was applied, with a load of 187.5 kgf (1838.7469 N) for a duration of 15 s. Tests were performed on samples in the as-delivered state and after heat treatment.

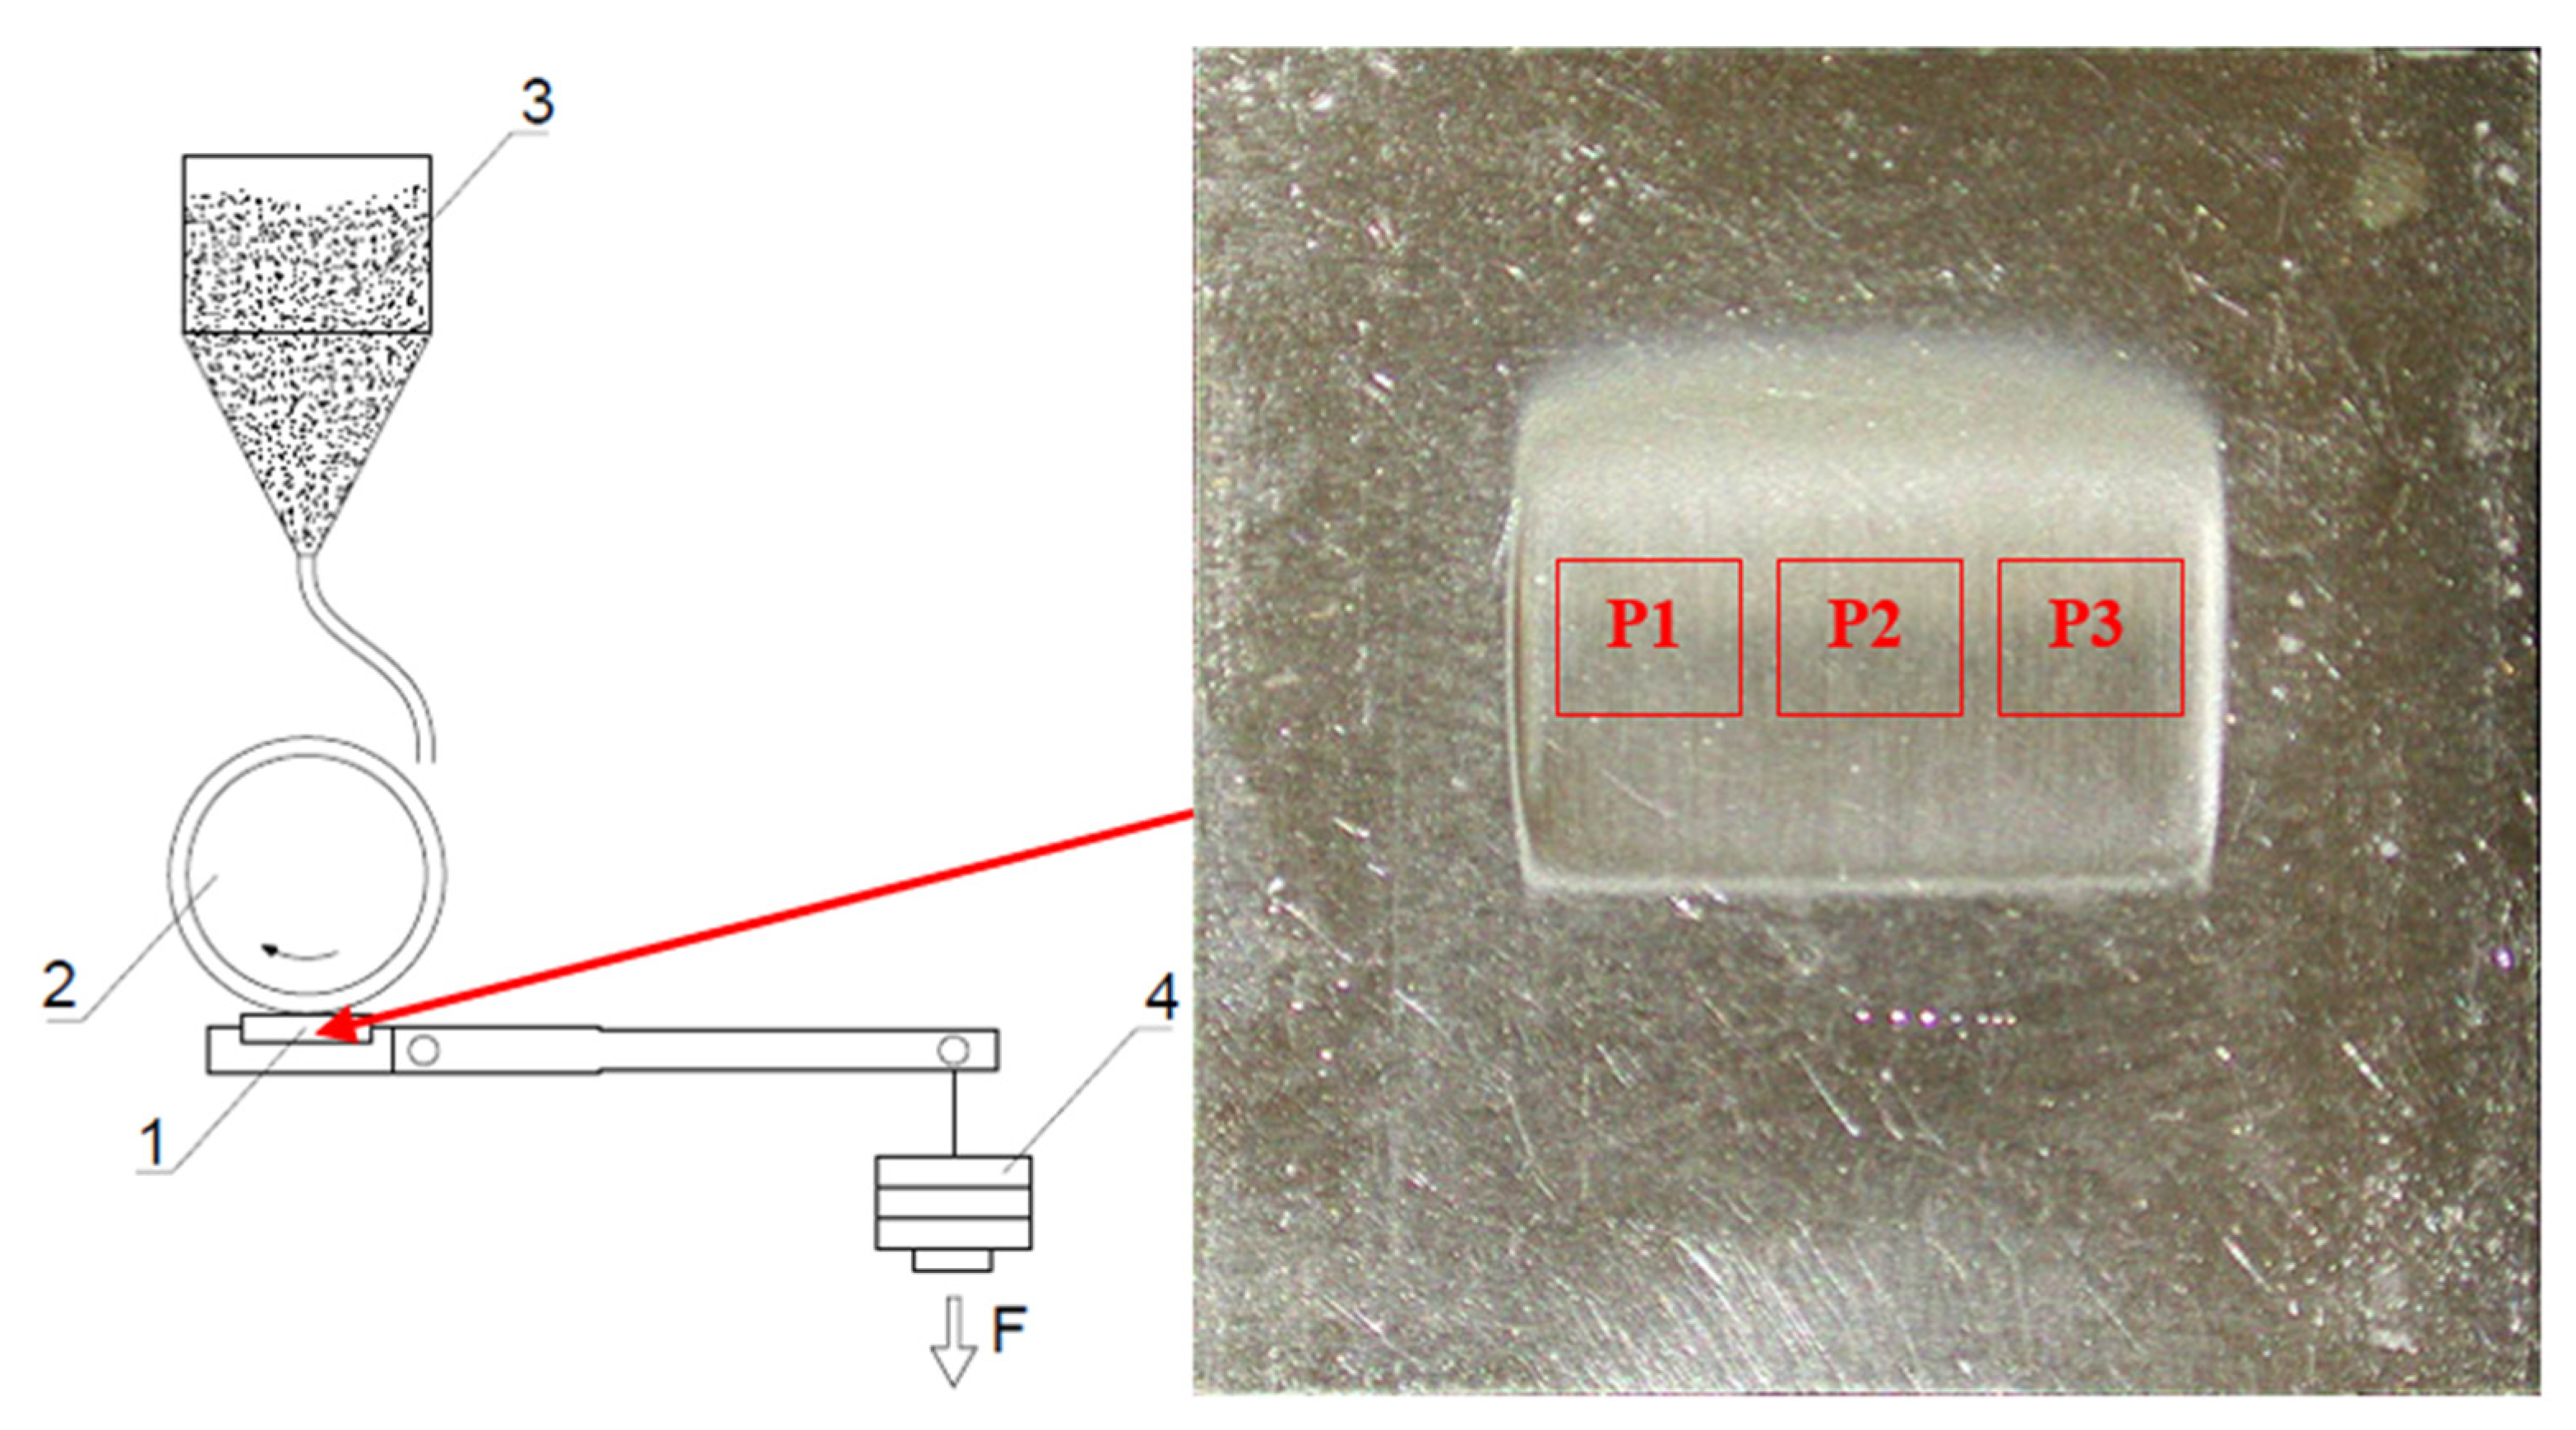
2.4. Abrasive Wear Resistance Testing

Laboratory testing of abrasive wear resistance was carried out using a T-07 abrasive wear tester in the presence of loose abrasive, in accordance with GOST23.208-79 [39], a standard analogous to ASTM G65 [40]. The choice of this testing methodology was driven by its practical relevance, as the analyzed group of low-alloy martensitic steels is commonly used in excavator bucket parts and agricultural machinery components, which operate under intense wear conditions when extracting mineral deposits and processing soil abrasives. This method aligns well with field test results [41]. Each test was performed in six repetitions. The T-07 device, manufactured by the Institute for Sustainable Technologies, a research institution in Poland, differs from the device described in ASTM G65 in that the sample is positioned horizontally instead of vertically. The T-07 tribotester comprises a rubber-rimmed steel wheel of diameter Ø = 50 (+0.2) mm and width 15 (−0.1) mm, an abrasive reservoir allowing for adjustable abrasive flow, and a lever with weights that generates a vertical pressing force of the sample against the roller. The hardness of the rubber applied to the roller falls within the range of 78–85 ShA. Testing was conducted under a constant load of F = 44 N (±0.25 N). Electrofused alumina with a particle size of #90, according to PN-M-59115:1976 [42], was used as the abrasive. The test duration, dependent on the hardness of the tested material, was set to 30 min (1800 roller cycles). The sample dimensions were 30 × 30 × 3 mm. The goal of the study was to determine the relative abrasive wear resistance coefficient Kb in relation to the reference sample, which was Hardox 500 steel in its as-delivered state. This wear resistance coefficient was defined by the following Formula (5):
K b = Z w × ρ b × N b Z b × ρ w × N w
where:
  • K b is the relative abrasive wear resistance coefficient,
  • Z w is the weight loss of the reference samples [g],
  • Z w b is the weight loss of the tested material [g],
  • N w is the number of roller revolutions during testing of the reference sample,
  • N b is the number of roller revolutions during testing of the sample, and
  • ρ w and ρ b represent the density of the reference and test sample materials [g/cm3].
The differences in density for Hardox 500 steel after heat treatment are negligible and therefore do not significantly impact the results.
A schematic of the testing method is shown in Figure 1.

2.5. Statistical Analysis

Statistical analyses were performed using Statistica software, version 13. To assess the impact of heat treatment (and consequently, prior austenite grain size) on abrasive wear resistance and hardness, an ANOVA (analysis of variance) was applied. ANOVA is a parametric test requiring key assumptions of normal distribution and homogeneity of variance. In cases where these assumptions are not met, this does not necessarily preclude the use of a parametric test. As Lindman demonstrated [43,44], the F-statistic remains robust even when the assumption of variance homogeneity is violated. To evaluate the homogeneity of variances, the Brown–Forsythe test was used (Table 3). Normality of distributions was assessed using the Shapiro–Wilk test (Figure 2a,b). Tukey’s post hoc test was applied to determine which means differed significantly from one another.

3. Results and Discussion

3.1. Microstructural Analysis

Figure 3a–f illustrates the microstructures of Hardox 500 steel in its as-delivered state and after quenching from temperatures ranging from 850 °C to 1200 °C. In its as-delivered state, Hardox 500 steel exhibits a lath martensite microstructure characterized by a three-tier hierarchical structure of laths, blocks, and packets. The martensite laths forming a block share the same crystallographic orientation, indicating that they represent the same martensite microstructure variant. In contrast, packets consist of blocks with a uniform habit plane, corresponding to the {111} plane of the primary austenite. Additionally, regions of coalesced quenched martensite are evident, which is attributed to the steel’s low tendency for spontaneous tempering. This occurs because martensite blocks with the same habit plane and similar crystallographic orientation relative to austenite tend to overlap without intermediary phases, forming thicker structures. However, regions with stronger etching effects can be distinguished, potentially indicating fine-dispersed phases suggestive of lower bainite or tempered martensite. Furthermore, the fine-lath microstructure displays lighter bands resulting from thermomechanical treatment applied by the manufacturer (Figure 3a). The microstructure of the steel quenched from 850 °C (Figure 3b) exhibits similar morphological characteristics to the as-delivered state. However, this sample shows more regions of brighter martensite laths undergoing coalescence, with wider laths. In addition, laths subjected to more intense etching are interspersed, which may suggest chemical microsegregation resulting in carbon-rich micro-areas or fine-dispersed carbide phases in these regions, potentially indicating the presence of tempered martensite or lower bainite. As the austenitizing temperature increases, a gradual thickening of coalesced martensitic regions is observed, accompanied by a reduction in the presence of laths undergoing intense etching (Figure 3c). Notably, the microstructure remains fine-grained without the ability to distinguish prior austenite grain boundaries. In contrast, the grain boundaries of the former austenite become more distinct in the micrographs of the sample quenched from 1000 °C (Figure 3d). The morphological characteristics of this microstructure also indicate selective growth of martensite laths, packets, and blocks, marking this temperature as the onset of growth in these microstructural elements. Areas delineated by prior austenite grain boundaries exhibit needles that undergo intensive etching and contrast against a bright background, confirming the presence of more pronounced microsegregation. Moreover, the structure of the darker, carbon-rich regions shifts from a lath to a needle-like form, typical of steels with higher carbon content, further suggesting potential microsegregation of this element.
The microstructures obtained after austenitizing at the two highest temperatures (Figure 3e,f) display large laths and needles, along with clear prior austenite grain boundaries. The contrast between the dark needles and laths and the bright background becomes even more pronounced. The described morphological characteristics of the martensitic microstructure, based on the obtained micrographs, are reflected in the quantitative assessment of prior austenite grain size and the qualitative evaluation based on the revealed grain boundaries, which will be discussed below.
Based on the grain growth analysis of prior austenite (Figure 4), it can be concluded that the proposed heat treatment in the temperature range of 850–900 °C is safe for maintaining a fine-grained microstructure. The average grain size of prior austenite in the as-delivered state is 15 µm, similar to that observed after austenitizing at 850 °C and 900 °C. In these states, the mean values closely align with the median size of 14 µm. Increasing the austenitizing temperature to 1000 °C results in significant grain growth, with an average grain size of 41 µm (an increase of 173% compared to the previous states) and a greater difference between the mean and median, which rises to 31 µm (a 130% increase). These noted differences in parameters clearly indicate selective growth of certain grains, identifying 1000 °C as the threshold temperature for grain growth, especially as the maximum recorded grain size reaches 158 µm.
Raising the austenitizing temperature by an additional 100 °C further intensifies boundary migration processes, leading to an increase in the average grain size to 68 µm and the median to 60 µm (with observed grain sizes ranging from 17 to 156 µm). Compared to the previous state, these sizes represent an increase of 66% and 93%, respectively. At the highest applied heat treatment temperature (TA = 1200 °C), the average austenite grain size rises to 115 µm, with a maximum size of 312 µm and a minimum of 31 µm. The relationship between grain size and temperature, including data from the as-delivered state, can be approximated by an exponential distribution, as shown in Figure 3. This visualization also reveals additional patterns: starting from the austenitizing temperature of 1000 °C, the difference between the smallest and largest grains increases markedly, ranging from 139 to 281 µm, reaching its peak after austenitizing at 1200 °C. Similarly, the interquartile range, or the difference between the third and first quartiles, also expands. Overall, the increase in average grain size from 850 to 1200 °C is 667%, with median growth of 664% and a maximum value increase of 743%.
Differences in martensitic microstructure morphology prompted a comparative analysis of prior austenite grain growth under different austenitizing conditions. Based on micrographs depicting prior austenite grains (Figure 5a–f) and the grain size distributions in each heat treatment condition (Figure 6a–f), unique morphological characteristics of the obtained microstructures can be illustrated. In the as-delivered state, the small grains display uniform size (Figure 5a), with the distribution approximated by a log-normal model. A similar uniform and fine-grained microstructure is observed after austenitizing at 850 °C and 900 °C (Figure 5b,c), with grain size analysis indicating dominant grain sizes in the ranges of 10–17 µm and 9–23 µm, respectively (Figure 6b,c). Significant microstructural changes appear after heat treatment at 1000 °C (Figure 5d), where substantial grain growth occurs, with grain sizes ranging from 7 to 158 µm (Figure 6d). This state is characterized by heterogeneous grain growth (abnormal growth), resulting in a marked division of the microstructure into larger grains surrounded by colonies of smaller grains. Moreover, the resulting distribution does not match any theoretical distribution model. After heat treatment at 1100 °C (Figure 5e), grain growth intensifies further, leading to a clearly coarse-grained microstructure. At this temperature, small grain colonies remain, although these grains also grow compared to the lower-temperature heat-treated state, with the dominant fraction ranging from 45 to 59 µm (Figure 6e). After austenitizing at the highest temperature, 1200 °C (Figure 5f), further microstructural evolution occurs, marked by extensive grain growth. A key morphological feature of this microstructure is the predominance of large grains, with smaller fractions nearly absent, as confirmed by the grain size distribution (Figure 6f). High temperatures promote intensive grain boundary migration, resulting in uncontrolled growth, which likely reduces the material’s mechanical properties, including wear resistance. It is noteworthy that at elevated heat treatment temperatures, such as 1000 °C, 1100 °C, and 1200 °C, grain growth processes are dynamic, leading to considerable grain size variation. Additionally, abnormal grain growth is observed, where some grains undergo rapid growth while others remain relatively small, resulting in a heterogeneous microstructure. Based on the above-described grain size changes at various austenitizing temperatures, for Hardox 500 steel, an austenitizing temperature of 950 °C should be considered safe, which is essential to account for when planning its heat treatment processes.

3.2. Abrasive Wear Resistance

Figure 7a displays the parameters of Hardox 500 steel obtained during abrasive wear testing in the presence of loose abrasive. Alongside the relative abrasion resistance indices Kb, mass wear per meter of sliding distance is shown to illustrate the standard deviation of the results and to facilitate statistical analysis. However, the Kb index offers greater comparative value and will be the primary focus of further discussion. All results are referenced to the as-delivered state, with a baseline Kb value of 1.00. After austenitizing at 850 °C and 900 °C, the Kb index remains unchanged at 1.01 and 1.00, respectively, indicating that the highest abrasion resistance is exhibited by the fine-grained microstructures in the as-delivered state and after austenitizing at the two lowest temperatures. A slight reduction in Kb (0.96) is observed after austenitizing at 1000 °C. Starting at 1100 °C, this trend becomes more pronounced, resulting in a clear reduction in abrasive wear resistance, represented by a Kb value of 0.87. The lowest abrasion resistance is observed in material quenched from the highest austenitizing temperature (1200 °C) with a Kb of 0.78. Examining these results in relation to the microstructures showing prior austenite grain size reveals that, from the onset of abnormal grain growth, Hardox 500 steel exhibits a successive reduction in tribological resistance.
The results were analyzed statistically. ANOVA results are presented in Table 4, and Tukey’s post hoc test results are shown in Table 5. The Tukey test identified statistically significant differences between various heat treatment conditions. The results indicate that the abrasion resistance after austenitizing at 850 °C, 900 °C, and 1000 °C does not differ significantly from the as-delivered state (p > 0.05), suggesting that heat treatment within this temperature range does not lead to significant changes in this material property. However, beginning with austenitizing at 1100 °C, a statistically significant reduction in abrasive wear resistance is observed compared to lower temperatures and the as-delivered state. The p-values for comparisons between the 1100 °C condition and the as-delivered state and between the 850 °C and 900 °C conditions are 0.000195, 0.000169, and 0.000187, respectively (p < 0.05). The largest differences are observed in samples austenitized at 1200 °C, where the p-values were the lowest relative to other states, emphasizing the significant impact of high austenitizing temperature on reducing abrasion resistance.
Changes in hardness with heat treatment state were also considered (Figure 7b). The lowest hardness for the steel was recorded in the as-delivered state (445 HBW), lower than the manufacturer’s specification. Austenitizing at 850 °C and 900 °C increased hardness to 503 HBW and 508 HBW, respectively. Differences in hardness between these three conditions suggest that the steel manufacturer may have applied tempering processes that reduced hardness relative to heat-treated states at 850 °C and 900 °C, which have similar grain sizes. Further increases in austenitizing temperature result in gradual hardness reductions; however, even after heat treatment at the highest temperature, hardness (482 HBW) remains above that of the as-delivered state. Notably, after austenitizing at 1200 °C, hardness is over 8% higher than in the reference state. The results were statistically analyzed. Tukey’s test p-values (Table 6) indicate that heat treatment at each temperature significantly influences the increase in hardness compared to the as-delivered state. After austenitizing at 850 °C, hardness differs significantly compared to samples heat-treated at 1100 °C (p = 0.000140) and 1200 °C (p = 0.000138). Similarly, for the 900 °C condition, comparisons with higher austenitizing temperatures (1000 °C, 1100 °C, and 1200 °C) indicate statistically significant differences. For samples austenitized at 1000 °C, further significant differences were noted compared to samples treated at 1100 °C (p = 0.030820) and 1200 °C (p = 0.000162). The highest austenitizing temperatures showed statistically significant differences from other states, as well as between each other.
These findings align with limited data available in the literature. For example, studies on commercially available 500 HBW hardness steel show that material quenched from 860 °C and 960 °C exhibited grain sizes of 14 µm and 34 µm, respectively, which partially coincides with the results of this study. In high-stress abrasive dry-pot tests [15], the best abrasive wear indices were obtained for the first of these heat treatment variants. Additionally, microhardness tests showed that steel quenched from 860 °C achieved the highest surface hardness after wear tests (793 ± 63 HV), indicating superior hardening capability compared to the as-delivered and 960 °C-quenched conditions, where hardness was 589 ± 22 HV and 602 ± 38 HV, respectively.
Analysis of the results shows that prior austenite grain size significantly affects the abrasive wear resistance of Hardox 500 steel. Grain growth, especially the appearance of abnormal grains, leads to a noticeable increase in mass loss. This relationship between grain size and wear intensity is illustrated in Figure 8a, where the data is approximated by a quadratic function with an R2 of 0.82, indicating a strong correlation. Given the uncertainty regarding the treatment conducted by the steel manufacturer in the as-delivered state (with hardness suggesting possible tempering), this material state was excluded from further analysis. The results for Hardox 500 steel can be compared with findings from similar studies on lower-grade steel, such as Hardox 450 [1]. In Hardox 450, as prior austenite grain size increased, the weight-based wear rate and abrasion resistance changed linearly. However, the differences in Kb values were less pronounced than for Hardox 500 steel, and no correlation was found between the relative abrasion resistance and hardness of Hardox 450. In contrast, for Hardox 500, both the correlation between average grain size and hardness and the relationship between hardness and abrasion resistance were well-represented by quadratic functions with high R2 values of 0.97 and 0.87, respectively (Figure 8b and Figure 9). This parameter has long been recognized as a key indicator of steel wear resistance, especially when comparing steels with similar microstructures but differing hardness levels. Examples include martensitic steels, where higher hardness, often due to varied carbon content, correlates with improved wear resistance [45,46,47]. Although widely used for assessing tribological resistance in similar microstructures, some studies have reported no such correlation [45,48]. Haiko [15] also analyzed commercial 500 HBW wear-resistant steel, concluding that surface deformation hardness, rather than initial hardness, better correlated with abrasive wear resistance. However, it is worth noting that the described tribological test involved impact-abrasive phenomena, which could not be replicated in T-07 tests. Only a narrow, deformed subsurface zone, similar across all heat treatments, was observed and will be described below. Furthermore, Valtonen et al. [45] observed that the transition from a highly deformed layer to the core material should be smooth to minimize the risk of local stresses that could lead to premature failure or cracking during operation. Results aligned with findings on grain size’s effect on tribological behavior, showing that reducing austenite grain size improves wear resistance in martensitic steels of comparable hardness [15]. Haiko et al. [15] noted critical phenomena regarding initial hardness, with the lowest mass loss recorded in steel austenitized at 860 °C, which also had the highest initial hardness among the studied variants. This outcome parallels the findings for Hardox 500 steel. However, volumetric hardness differences alone did not fully explain wear results. For instance, steel austenitized at 960 °C exhibited lower mass loss than in the as-delivered state, despite its lower initial hardness. Thus, for tribological tests under high-impact conditions, microstructural morphology and subsurface mechanisms are more significant than initial hardness. Consequently, further investigation into Hardox 500 steel’s impact-abrasive resistance is well justified.
Representative sample wear surfaces are shown in Figure 10. Three heat treatment conditions were selected to analyze the micromechanisms at play: the as-delivered state (reference condition), quenching from 850 °C (highest wear resistance), and quenching from 1200 °C (lowest wear resistance). The surface analysis of Hardox 500 in the as-delivered state, and after quenching from 850 °C and 1200 °C, revealed different wear mechanisms directly related to the microstructure, particularly the grain size. Additionally, Figure 11a–f shows 3D images of all analyzed surfaces.
In the as-delivered state and after heat treatment at 850 °C, conditions that demonstrated the highest abrasion resistance, abrasive wear manifests with less intense surface deformation (Figure 10a–d). In both cases, the primary wear mechanism is microplowing and plastic deformation, indicating localized plastic deformation processes due to contact with hard abrasive particles. Microcutting is also observed, though its contribution to the overall wear mechanisms is limited. Long and narrow grooves predominate, running parallel to the direction of loose abrasive movement on the sample surface. There are few scratches oriented at different angles, and these are shallow and short. These steel surfaces also show traces of chips breaking off from the edges of grooves and pits. The similarity of surface conditions between these two states, despite significant hardness differences, suggests that hardness does not influence the abrasive wear mechanisms or their intensity in martensitic microstructures.
For the steel quenched from 1200 °C, significantly more intense wear is observed due to the increased grain size (Figure 10e,f). Deformations, primarily in the form of numerous pits, are deeper and cover a larger surface area. These pits lead to the detachment of substantial material fragments. Grooves dominate the surface, with signs of plastic deformation around them and chips breaking off from their edges. The grooves are relatively deep, increasing the amount of material displaced to their edges. Numerous fine scratches oriented at various angles to the direction of abrasive movement on the sample surface also appear, suggesting that the material could not effectively resist the multidirectional movement of abrasive particles. This may indicate a lower tendency for edge strengthening through plastic deformation. Abrasive particles move where it is easiest, indicating that the wear mechanism in this heat treatment condition also relies heavily on intensive microplowing. Thus, the greater mass wear is primarily influenced by the increased number of deep pits. It can be inferred that grain growth resulting in a coarse-grained microstructure increases susceptibility to mechanical surface damage, leading to a more intense abrasive wear process.
The microstructural analysis of subsurface layer changes was performed on both transverse (Figure 12a–f) and longitudinal sections (Figure 13a–f) relative to the abrasive movement direction. Plastic deformation in the martensitic microstructure is observed in all heat-treated states, indicating retained material ductility despite high hardness. These deformations are especially evident in the thin subsurface layer directly exposed to abrasives, as well as within abrasive grooves where martensite grains deformed under intense contact with hard abrasive particles. Additionally, sample surfaces exhibit pits, with characteristics depending on the heat treatment state. Material ridges can be observed along pit edges, resulting from plastic buildup during wear. The deepest pits were recorded in samples heat-treated at the highest temperatures, 1100 °C and 1200 °C (Figure 12e,f), where extensive grain growth contributes to increased susceptibility to deeper surface damage. In finer-grained microstructures, achieved at lower heat treatment temperatures, pits are noticeably shallower, with smoother edges. Smaller grains promote an even stress distribution and higher resistance to localized mechanical damage, offering enhanced stability against abrasive wear, resulting in less deformation and shallower subsurface damage.
Surface roughness analysis after the abrasive wear test revealed notable differences depending on the material state and applied heat treatment (Figure 14a,b). The as-delivered state exhibits relatively high roughness parameters: Ra, Rq, Rp, Rv, and Rz values of 0.41 µm, 0.51 µm, 1.38 µm, 1.62 µm, and 3.00 µm, respectively, indicating pronounced peaks and deep valleys. High isolated peaks and valleys contribute to the elevated Rq (root mean square deviation of the profile). After austenitizing at 850 °C, all roughness parameters decrease, with Ra reducing to 0.31 µm and Rq to 0.40 µm, suggesting a smoother surface. Maximum peaks average 1.30 µm (a 6% reduction from the as-delivered state), while the deepest valleys reach 1.54 µm (a 5% reduction), reflected in the Rz value of 2.85 µm. This indicates reduced plastic deformation at shallower groove edges. Further austenitizing at 900 °C improves the abrasion surface quality compared to the as-delivered state. Ra (0.37 µm) and Rq (0.45 µm) are slightly higher than those of samples treated at 850 °C but do not approach the baseline state. Rv and Rp values are similar to those after austenitizing at 850 °C (Rv is 3% higher and Rp 2% lower), reflecting shallower grooves but increased plastic deformation at their edges. After austenitizing at 1000 °C, Ra and Rq values rise to 0.42 µm and 0.52 µm, respectively, exceeding those of the as-delivered state, indicating increased surface roughness. This trend is also evidenced by the Rz value of 3.14 µm, 10% higher than in samples austenitized at 850 °C and 900 °C. Thus, austenitizing at 1000 °C may worsen surface quality compared to lower austenitizing temperatures and the as-delivered state, correlating with the observed reduction in abrasion resistance at this treatment level. At 1100 °C, Rv and Rp values decrease even relative to the lowest austenitizing temperatures, directly impacting Ra and Rq, which measure 0.36 µm and 0.45 µm, respectively. These values suggest a more homogeneous surface post-heat treatment. The Rz (2.73 µm) and Rp (1.11 µm) values are the lowest among all samples, indicating minimal plastic deformation around formed grooves. The highest austenitizing temperature (1200 °C) leads to increased surface roughness, as reflected in parameters such as Rz (3.38 µm), Rv (1.82 µm), and Rp (1.57 µm), the highest among all heat-treated samples. Ra and Rq values of 0.39 µm and 0.51 µm, respectively, further reflect this increased roughness.
The mean groove width across profile elements is shown in Figure 14c. Heat treatment starting from 900 °C reduces this parameter, with the greatest decrease (17% compared to the reference state) recorded for the sample austenitized at 850 °C and the smallest (4%) for samples austenitized at 900 °C and 1000 °C. Moreover, all surfaces exhibit considerable groove width variability, evidenced by relatively high coefficients of variation.
In tribological surface property analysis, the literature often explores additional parameters to enable a more comprehensive topographical description [49,50]. One of the key factors influencing the tribological behavior of a surface is the shape of surface irregularities, which can significantly affect wear mechanisms and surface interactions during friction. Wolf [50] proposed using dimension of standard vertical roughness parameters to differentiate two primary types of topography: surfaces with sharp indentations and surfaces with sharp protrusions. These shape indices provide precise characterization of both depressions and protrusions, which is crucial for assessing surface behavior under frictional conditions. These indices respond to various aspects of surface irregularities:
R t R p indicates the symmetry of irregularity distribution. Higher values suggest a profile dominated by distinct protrusions.
R t R a reflects both peaks and valleys in the surface profile. High values indicate a diverse profile with prominent peaks and valleys, which may significantly affect tribological properties.
R p R a , R t R a R p 2 , and R t R p R a 2 are particularly sensitive to sharp peaks. Higher values suggest a surface with sharp, well-defined protrusions, potentially leading to accelerated wear due to intense contact on limited surface areas.
Table 7 presents combinations of Wolf’s roughness shape indices calculated from measured roughness values. The R t R p ratio in this study ranges from 1.83 to 2.29, suggesting a profile with numerous moderate-amplitude protrusions. These values, close to 2.0, indicate a relatively symmetrical distribution of surface irregularities regardless of the heat treatment condition. The R t R a R p 2 ratio, ranging from 7.65 to 11.41, reflects surface profile variability in terms of height versus average deviation. The highest value, 11.41, is observed for the sample austenitized at 850 °C, indicating significant protrusions, while lower values, such as 7.65 for the as-delivered state and 7.76 for the 1000 °C-treated state, suggest a more even profile compared to other states. The R p R a ratio, ranging from 1.01 to 1.76, and particularly the R t R p R a 2 ratio for the 1200 °C austenitized sample (1.76), indicate the presence of distinct protrusions. Additionally, high R t R a , values, between 6.49 and 7.73, suggest the presence of sharp peaks. Comparing the ratio values reveals similarities within each index, regardless of austenitizing temperature. The R v R p ratio, consistently around 0.11–0.14 for all samples, indicates that protrusions predominate over indentations in the surface topography. This consistency across heat treatment states suggests a recurring profile character irrespective of austenitizing temperature. Table 7 also includes calculated R a R z values, all of which approximate 2.0, further supporting these conclusions regarding surface topography characteristics.
The analysis of roughness parameters did not establish a strict correlation between changes in surface layer characteristics and the steel microstructure, defined by prior austenite grain size. However, a weak correlation with surface hardness was observed for several indices (Figure 15a–c). The strongest correlation with hardness was noted for the parameter describing the depth of the deepest indentation (Rv). An initial increase in the hardness of Hardox 500 steel led to a rise in the Rv parameter, followed by a decrease. This relationship was approximated by a quadratic function with an R2 value of 0.51 (Figure 15b). The quadratic function, though with a lower determination coefficient R2 = 0.43, also approximates the change in mean groove width (RSm) with hardness (Figure 15c). The weakest correlation with hardness was observed for the peak height (Rp) (Figure 15b) and the arithmetic mean of the absolute heights of the five highest peaks and five lowest valleys (Rz) (Figure 15b). All parameters, except RSm, belong to the group of vertical (amplitude) indicators. According to Ratia et al. [23], the Rq parameter is more sensitive to deep valleys and high formations on the surface than Ra. An important observation from their study, which subjected steels with diverse microstructures and hardness ranging from 186 HV to 712 HV to impact-abrasive wear tests, was that softer materials exhibited significantly higher surface roughness than harder materials. Similarly, prolonged test durations yielded slightly higher Rq values, though these differences were less pronounced. These observations were only partially confirmed for Hardox 500, as the Rq parameter was lower for samples austenitized at 1100 °C and 1200 °C than in the as-delivered state, despite the higher hardness achieved in this state compared to the reference (Figure 15a).
An increase in austenitizing temperature plays a pivotal role in altering the microstructural characteristics of Hardox 500 steel. At elevated temperatures, the dissolution of carbides such as MoCrC or Cr7C3 that occur in Hardox 500 steel [51] takes place, releasing carbon into the austenite matrix. This process increases the carbon solubility in austenite, which enhances grain boundary mobility due to reduced pinning effects exerted by carbides. This phenomenon has been extensively documented in martensitic and low-alloy steels, where the dissolution of fine carbides directly correlates with abnormal grain growth [9,36]. The redistribution of carbon within the matrix at high austenitizing temperatures also leads to microsegregation, forming carbon-rich regions observable as darker etched areas in micrographs. These regions may act as sites for carbide precipitation during slower cooling or tempering processes. Such carbides can nucleate at grain boundaries or within grains, depending on the cooling rate and chemical composition of the steel. The precipitation of secondary phases at grain boundaries may reduce the cohesive strength of the boundaries, increasing the material’s susceptibility to wear and crack propagation. Grain boundary migration at elevated temperatures is a key driver of grain coarsening. The mobility of grain boundaries increases exponentially with temperature due to enhanced atomic diffusion. This is particularly true in steels with low amounts of grain boundary stabilizers, such as titanium nitrides (TiN) or aluminum nitrides (AlN), which remain stable at temperatures up to 1150 °C [4]. In Hardox 500 steel, the absence of significant concentrations of these inhibitors may explain the pronounced grain growth observed at 1000 °C, 1100 °C, and 1200 °C. The consequences of grain coarsening are manifold. Coarse grains reduce the total grain boundary area, thereby diminishing obstacles to dislocation motion and weakening the Hall–Petch effect. This phenomenon not only reduces the yield strength and hardness of the steel but also impacts its wear resistance. Larger grains provide fewer barriers to crack propagation under abrasive loading conditions, making the material more prone to surface damage and material detachment [14,33]. Additionally, microstructural heterogeneity caused by abnormal grain growth exacerbates stress concentrations, further reducing the steel’s ability to resist abrasive forces.

4. Conclusions

This study aligns with current research trends focused on modern steel groups with enhanced abrasion resistance. In microstructural analysis, austenite grain growth is pivotal, as grain size directly influences phase transformation kinetics. The microstructure is closely correlated with key mechanical properties, including hardness, yield strength, tensile strength, and impact resistance. Additionally, grain size significantly impacts tribological resistance in Hardox 500 steel, making precise grain size control during heat treatment essential for optimizing mechanical properties and durability. This research yielded the following conclusions:
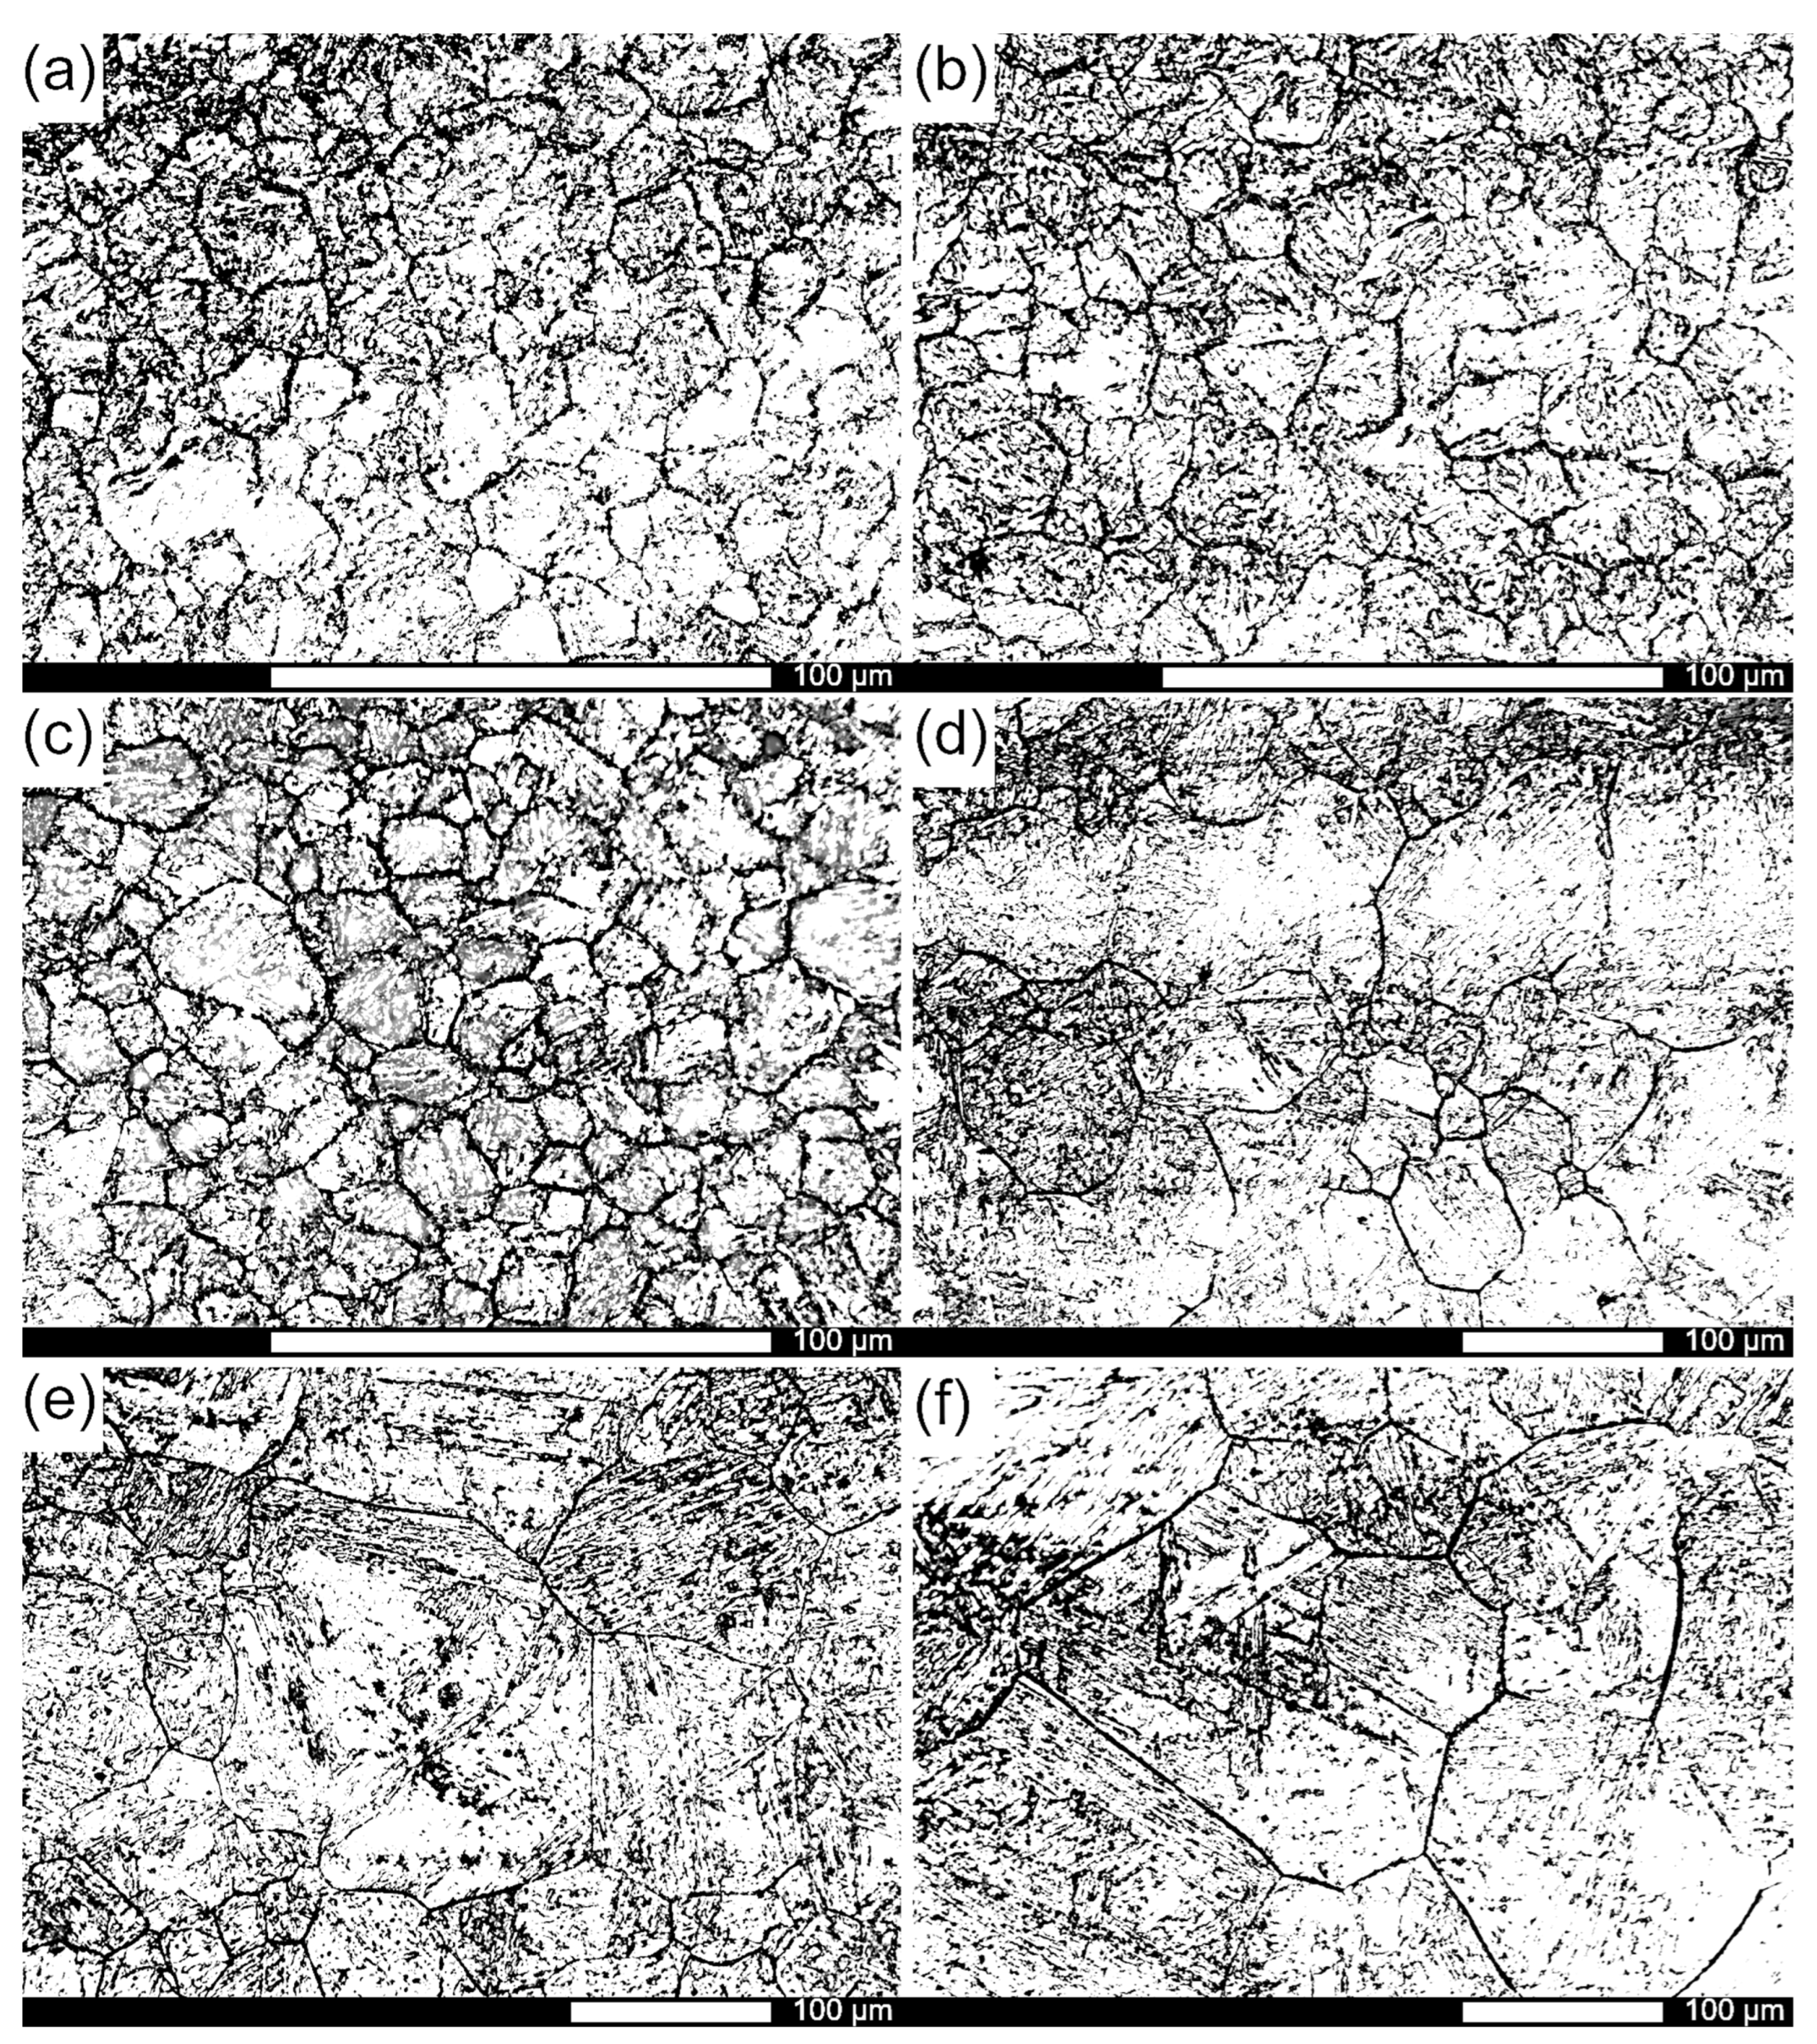
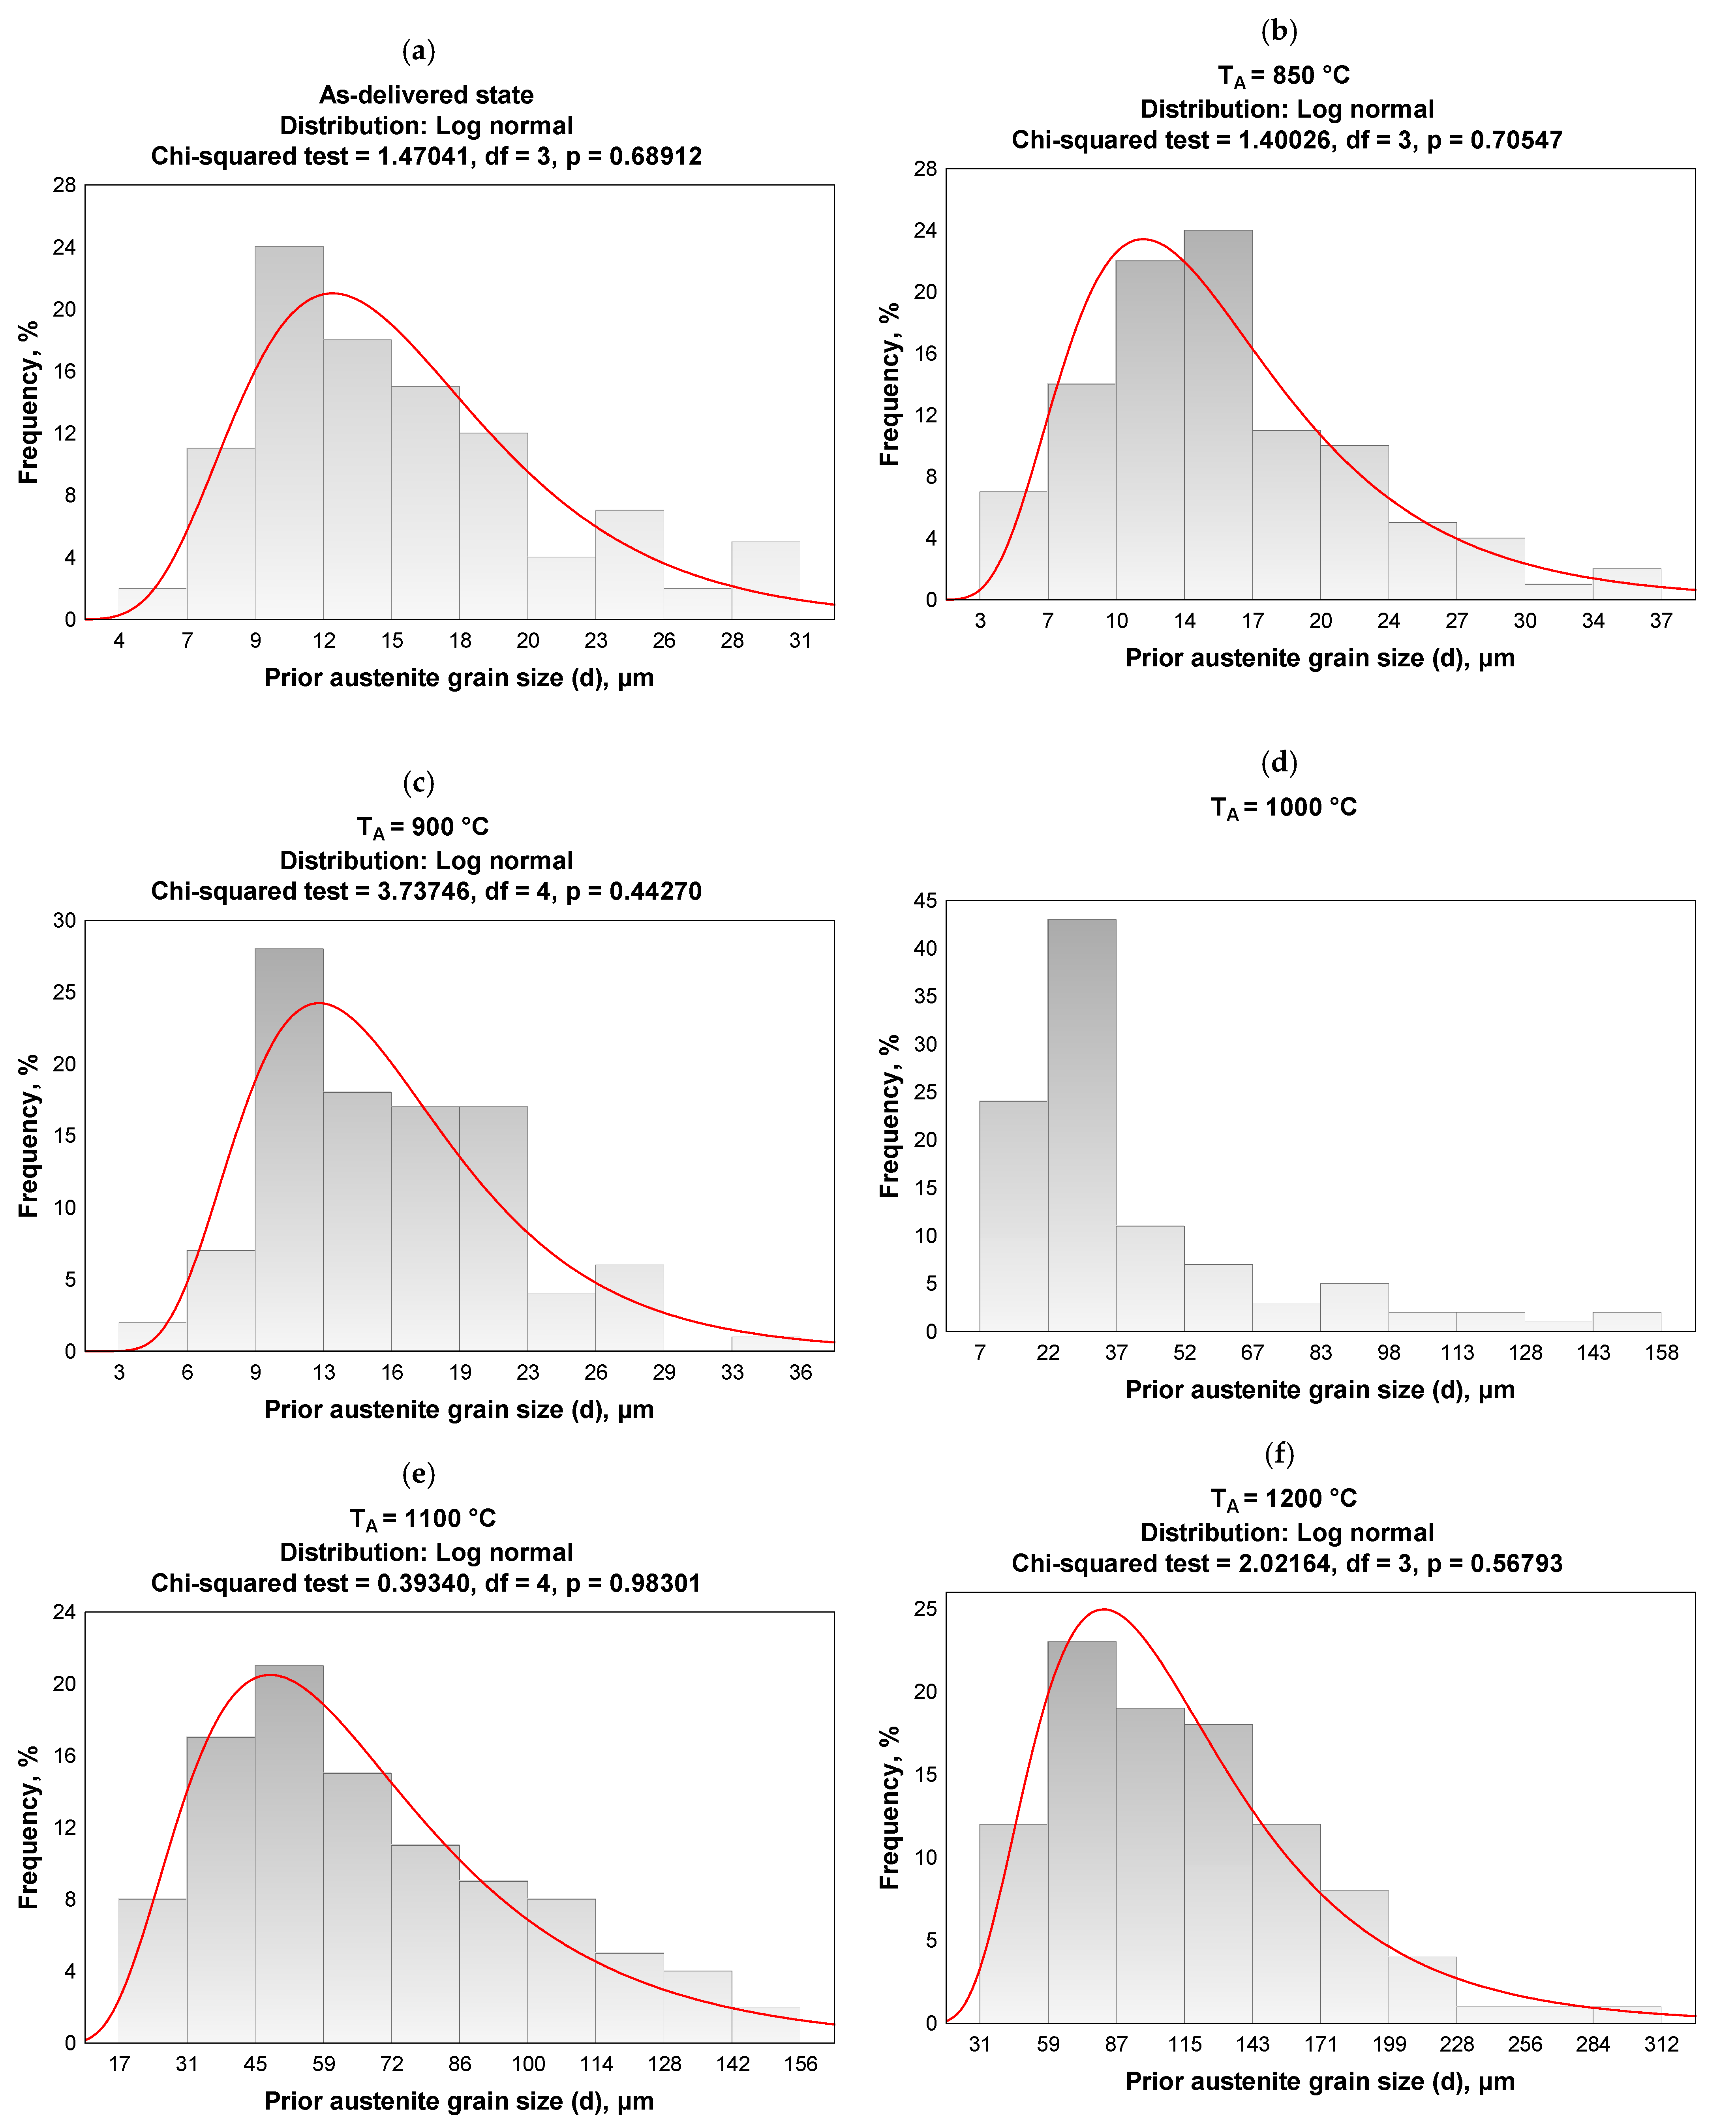
  • Prior austenite grain size shows a clear correlation with austenitizing temperature, described by an exponential function. At lower temperatures (850–900 °C), the grain remains fine, while grain growth intensifies above 1000 °C, l leading to a significant increase in average grain diameter to over 100 µm after austenitizing at 1200 °C.
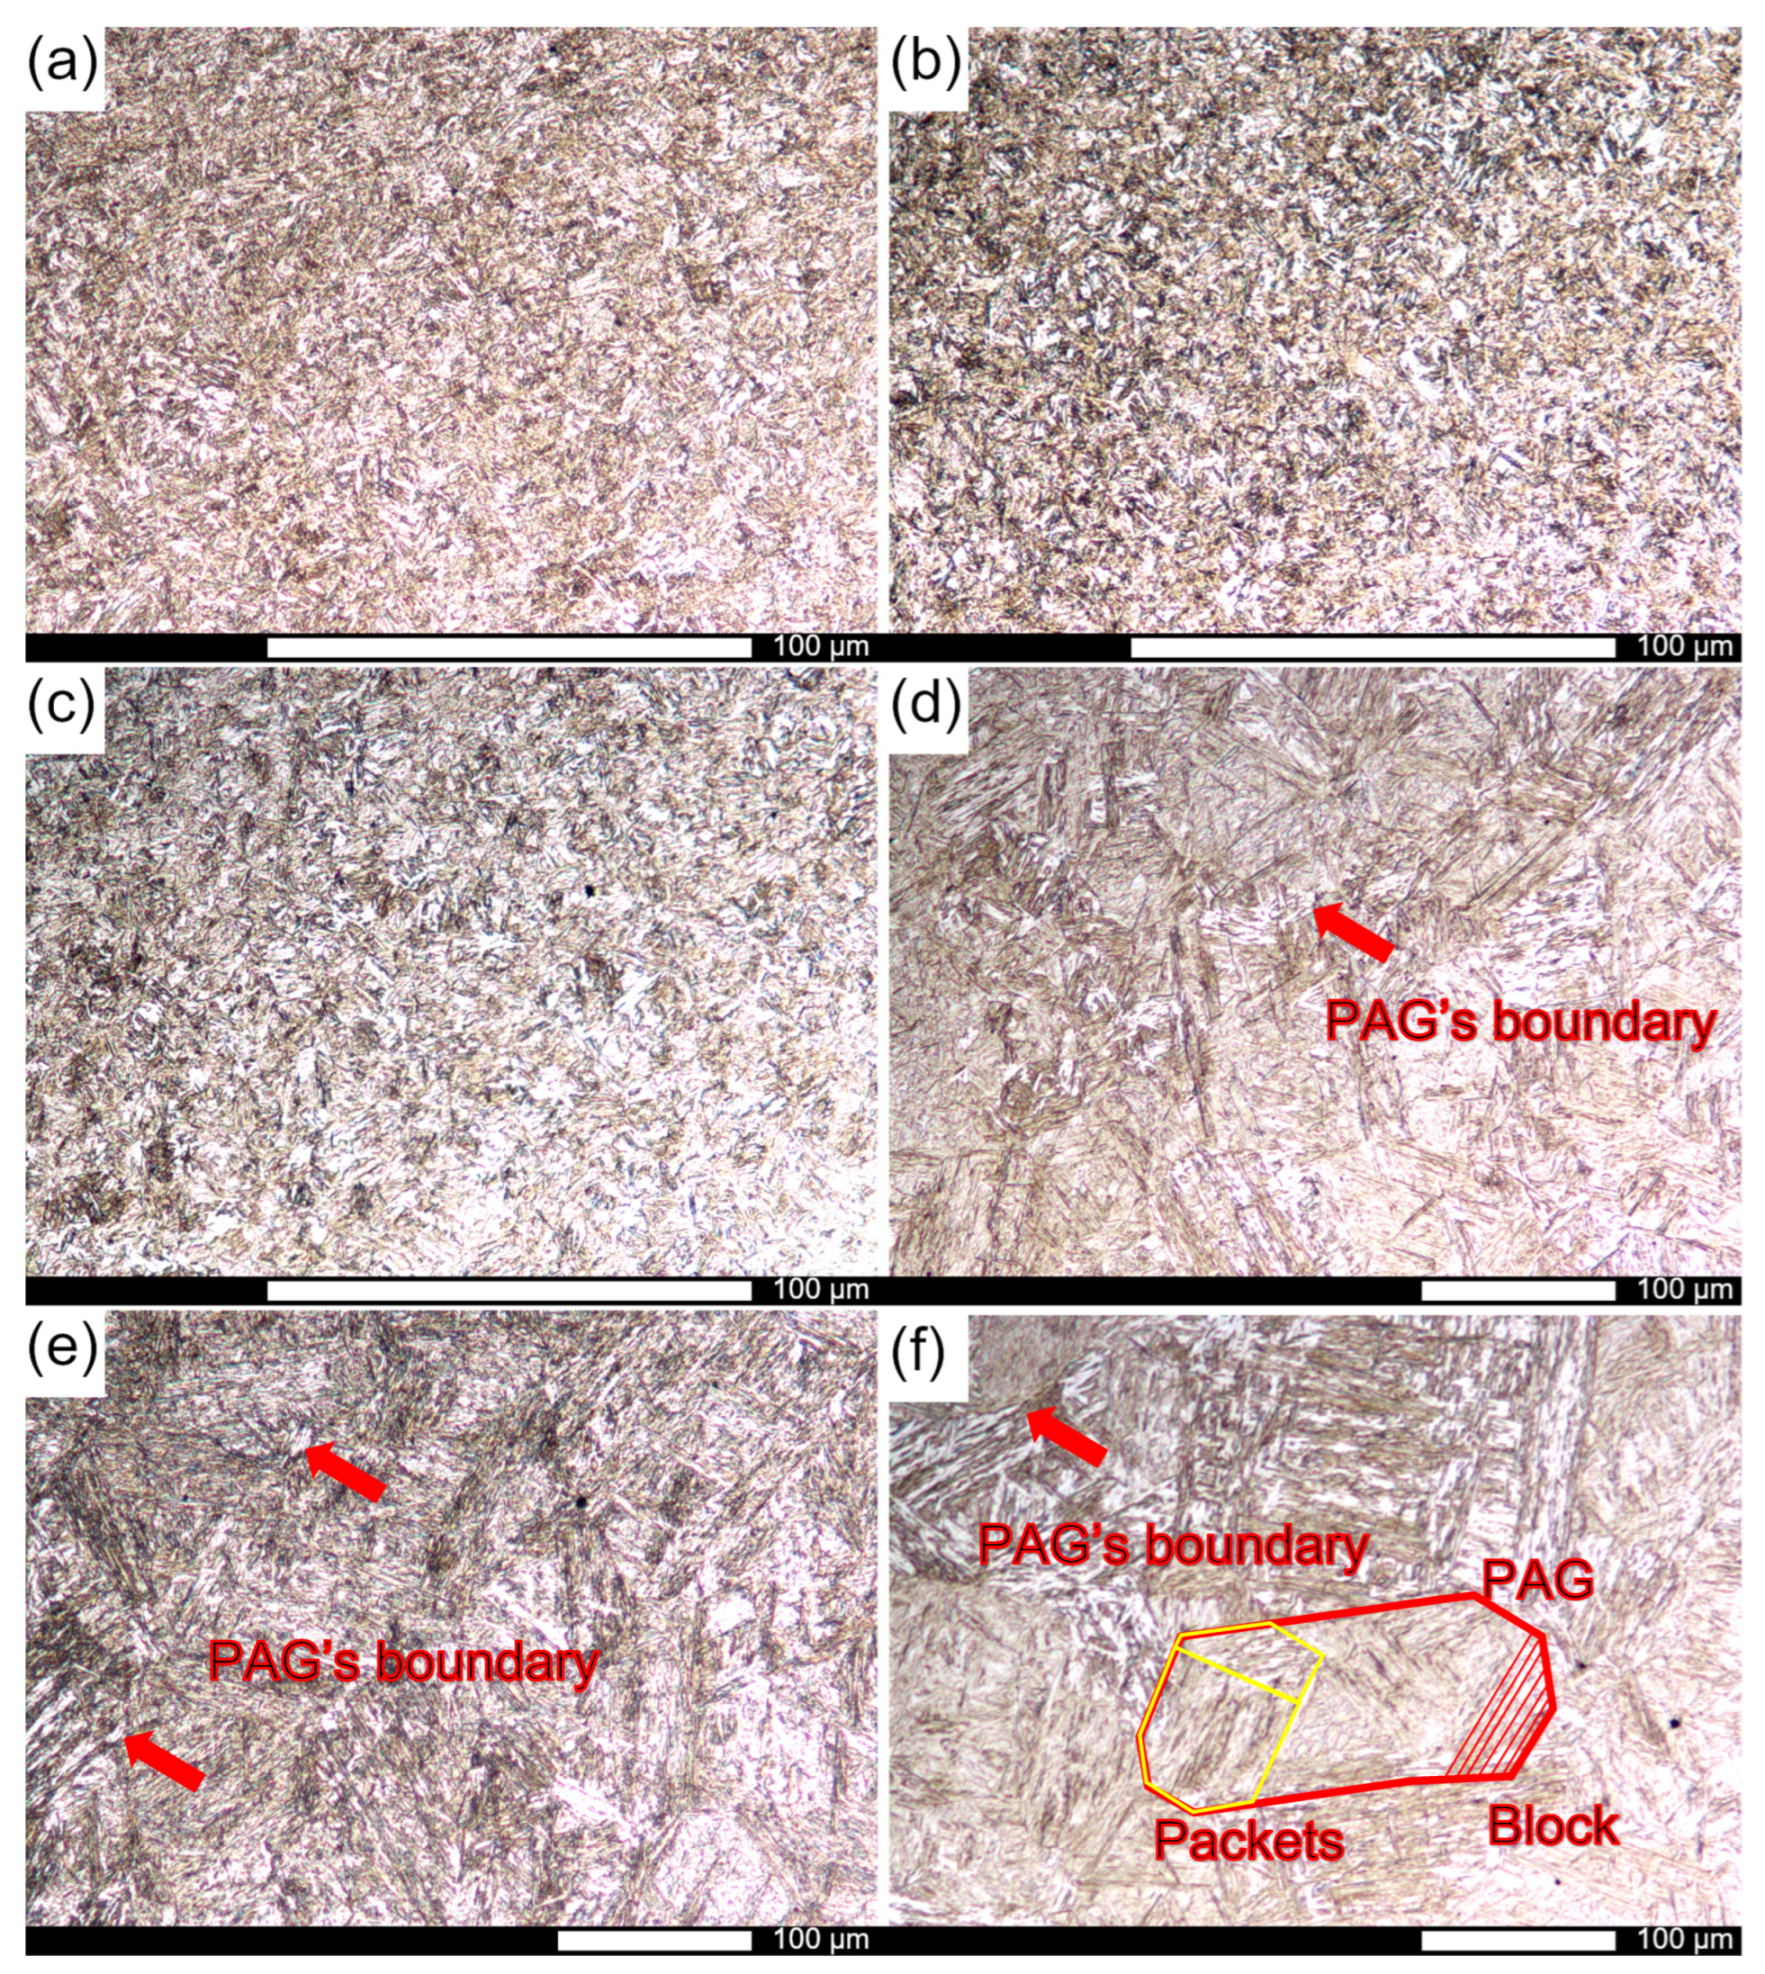
  • Hardox 500 steel in the as-delivered state exhibits a homogeneous martensitic microstructure with a three-tier hierarchical structure. Increasing the heat treatment temperature consistently produces a uniform martensitic structure. The presence of martensitic laths and needles, which are more strongly etched, may indicate chemical composition microsegregation, resulting in carbon-enriched microareas.
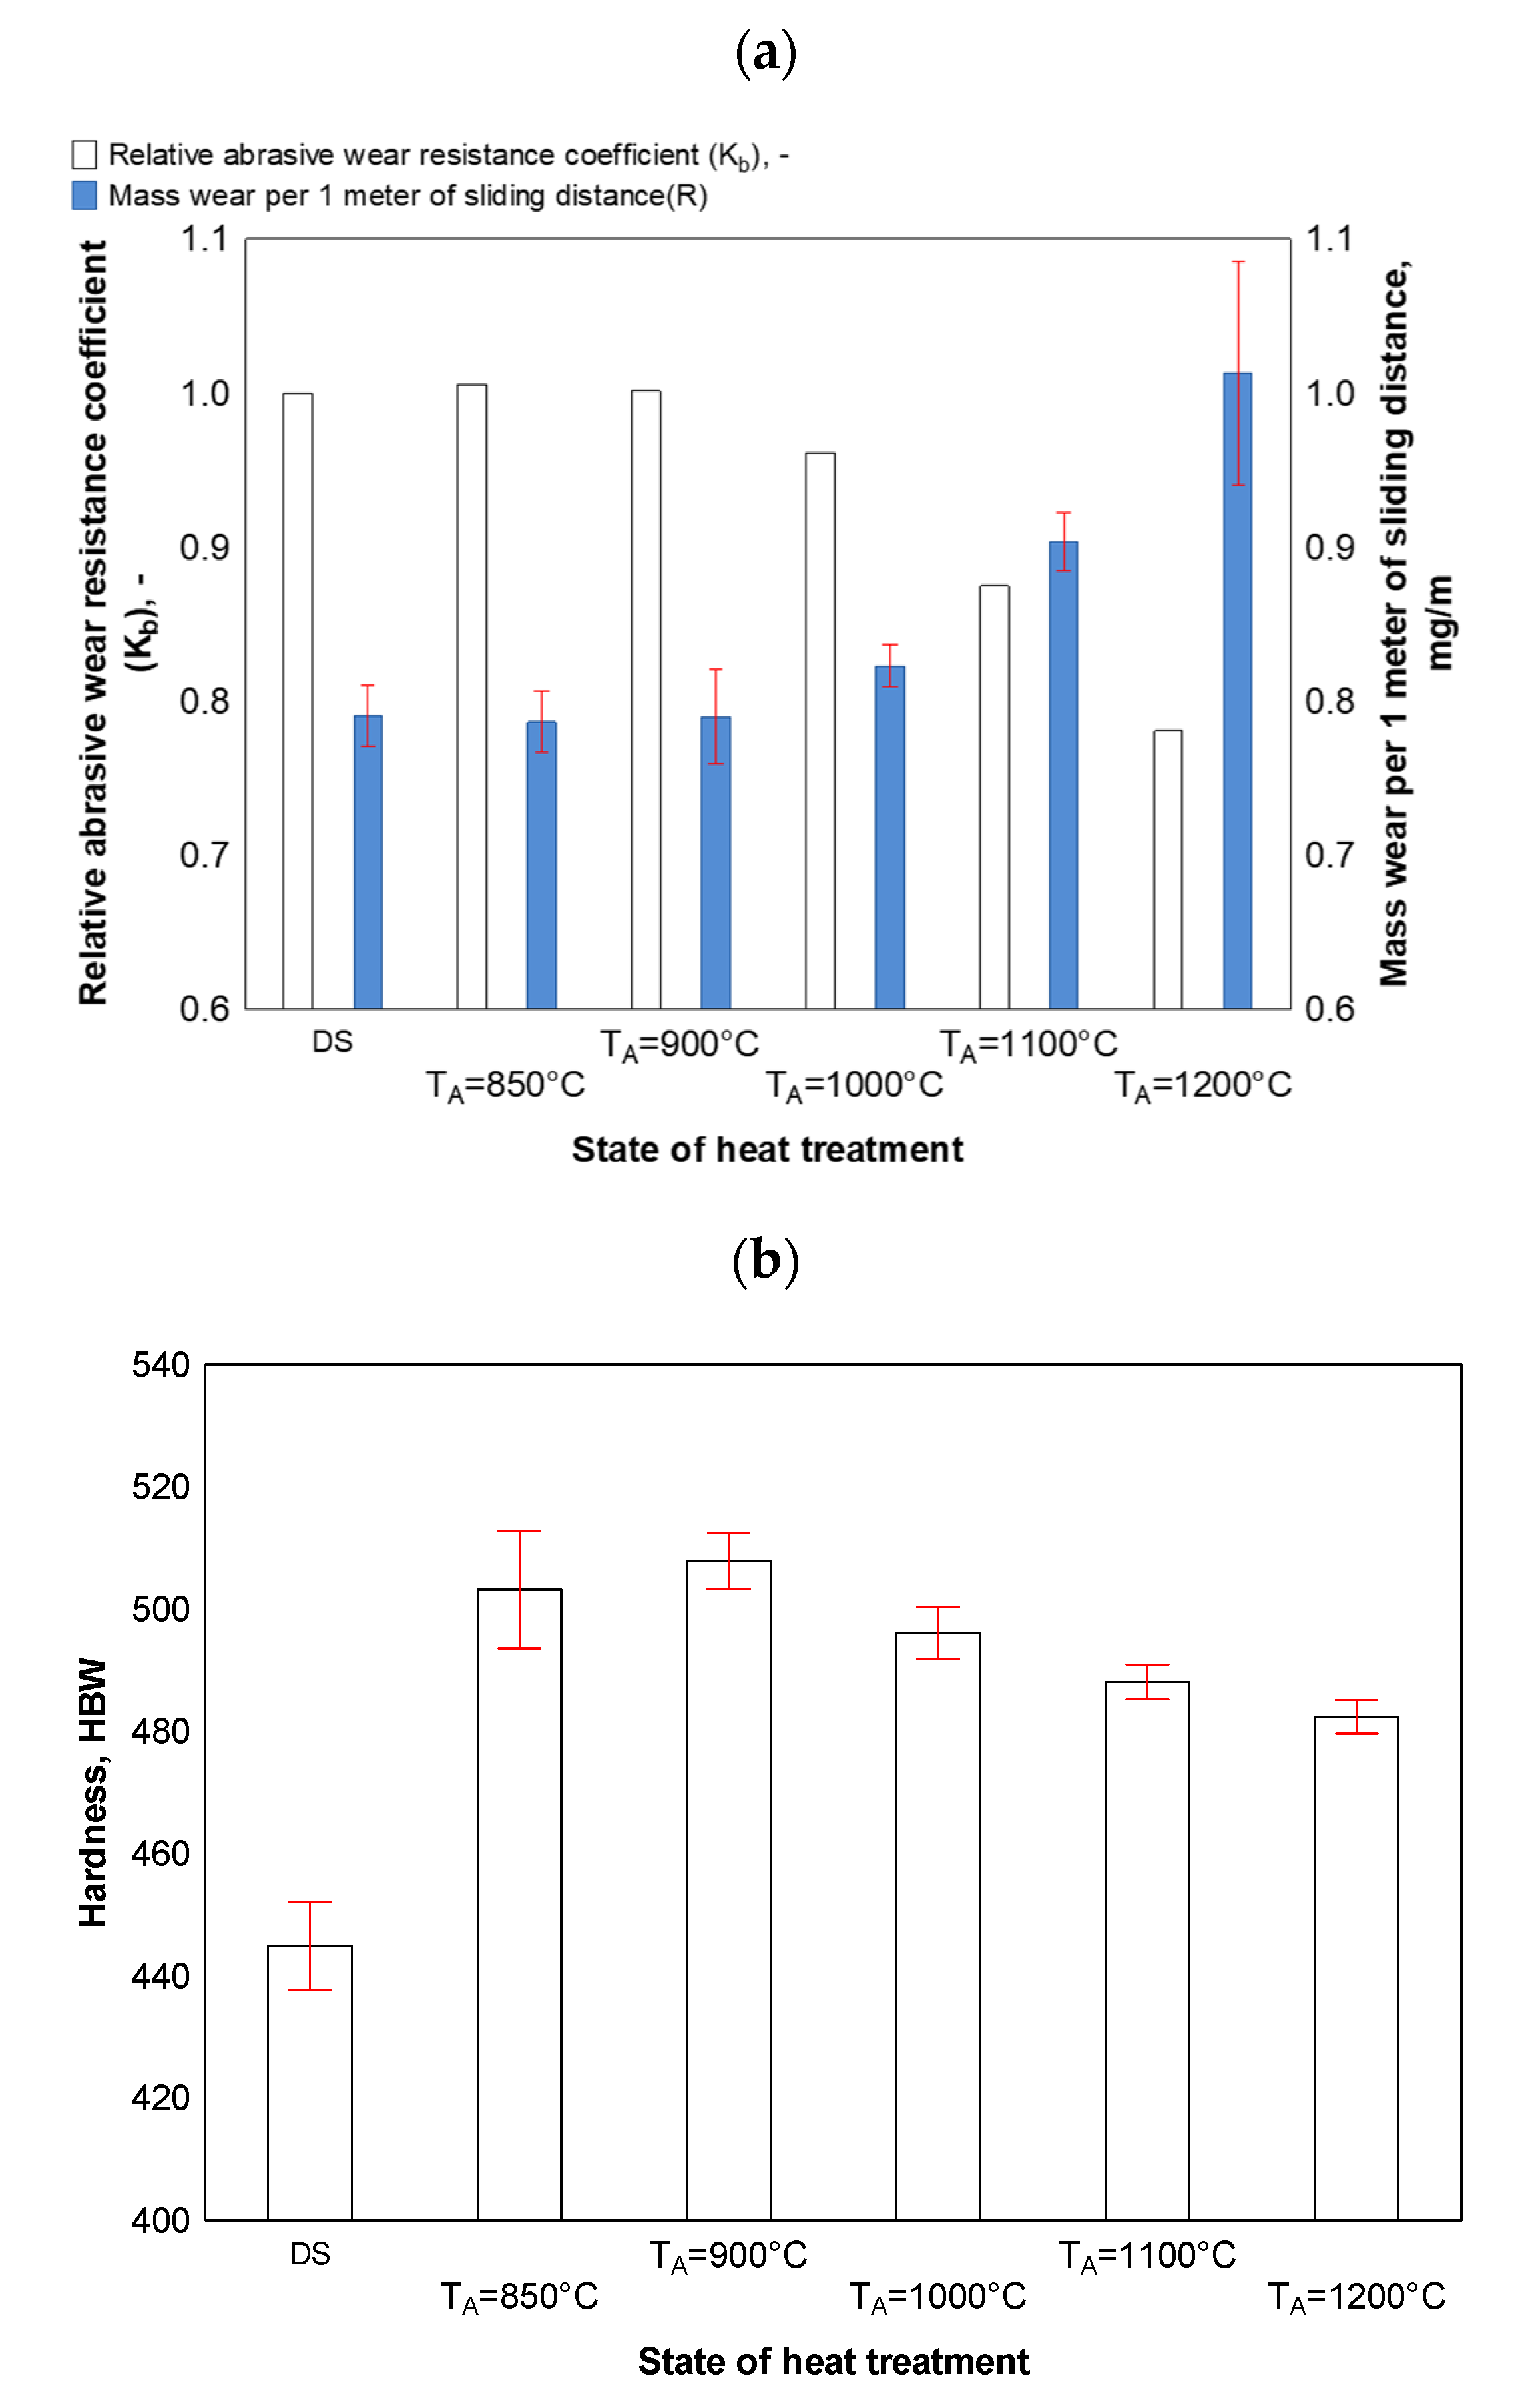
  • Selecting the appropriate heat treatment temperature is critical to optimizing both the abrasion resistance and hardness of Hardox 500 steel. Increasing the heat treatment temperature, which leads to coarse-grained structures, significantly reduces its wear resistance. Notably, even after heat treatment at 1200 °C, the steel’s hardness was over 8% higher than in the as-delivered state. These results highlight the essential role of austenitizing in controlling the mechanical properties of steel, and they emphasize that heat treatment can enhance abrasion resistance through increased hardness relative to the initial material, provided that grain size is controlled to prevent the formation of abnormal grain.
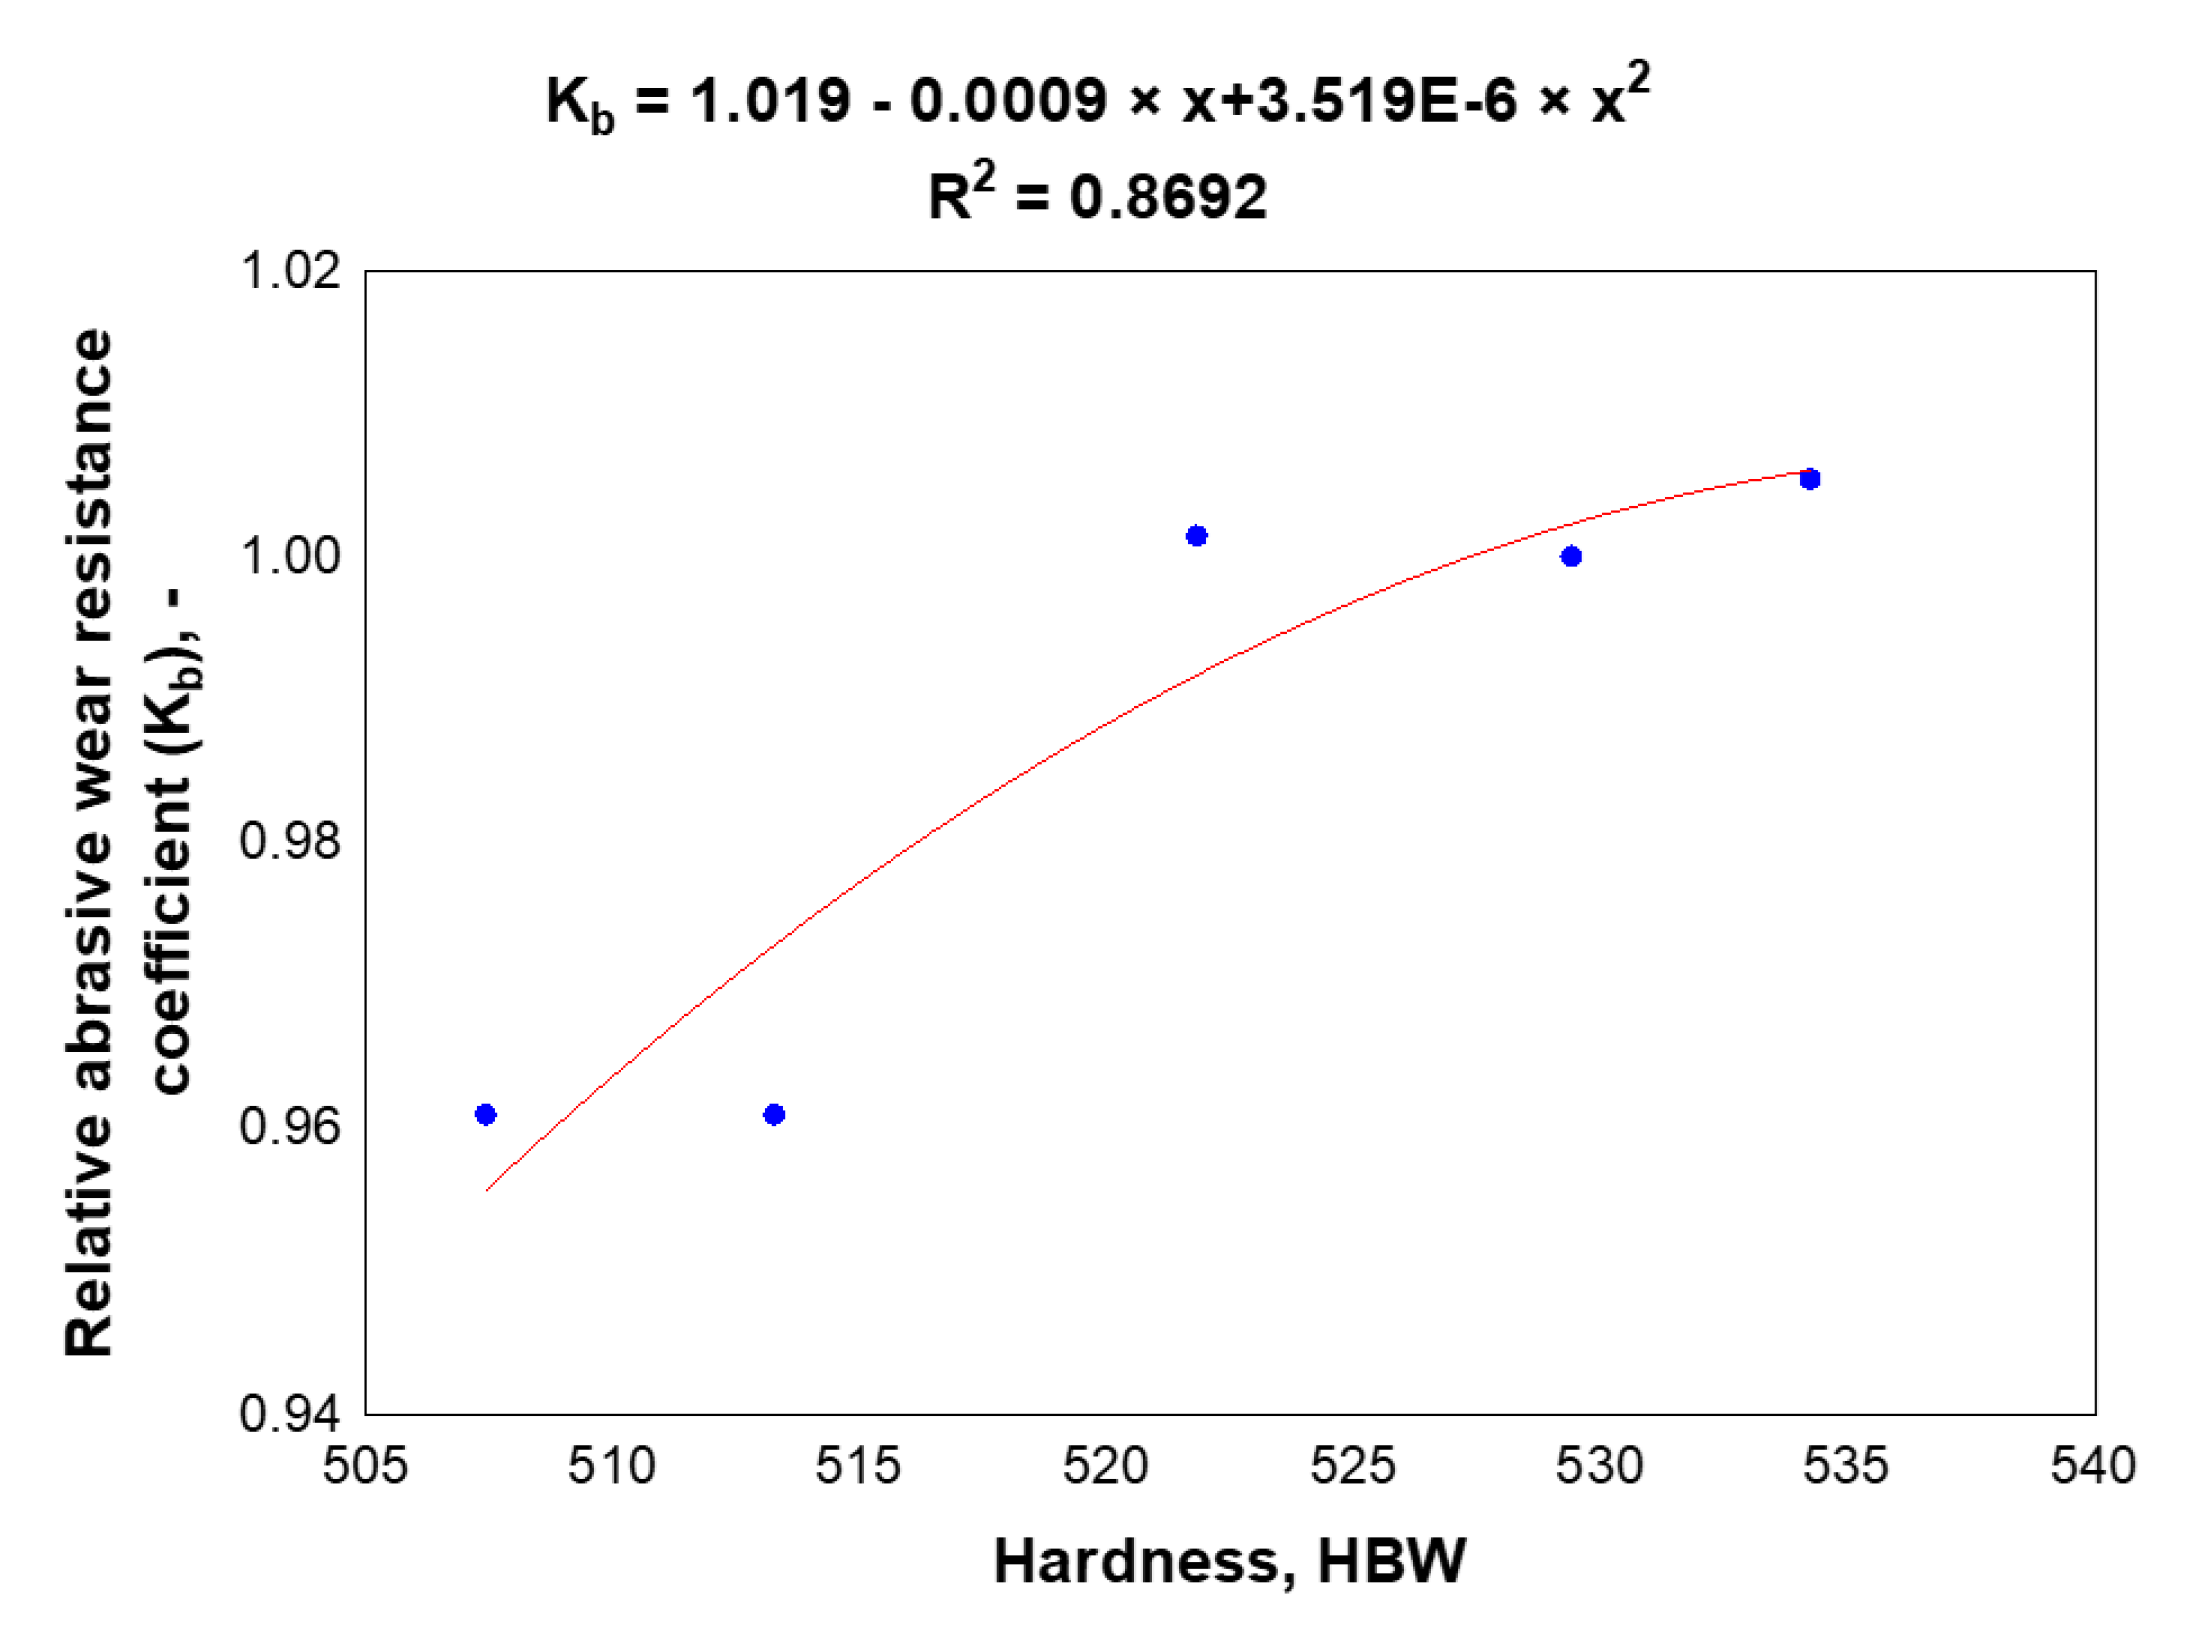
  • The relationship between grain size and wear intensity was approximated by a quadratic function with an R2 value of 0.82. Meanwhile, the correlations between average grain size and hardness, as well as between hardness and abrasion resistance, were better represented by quadratic functions with higher R2 values of 0.97 and 0.87, respectively.
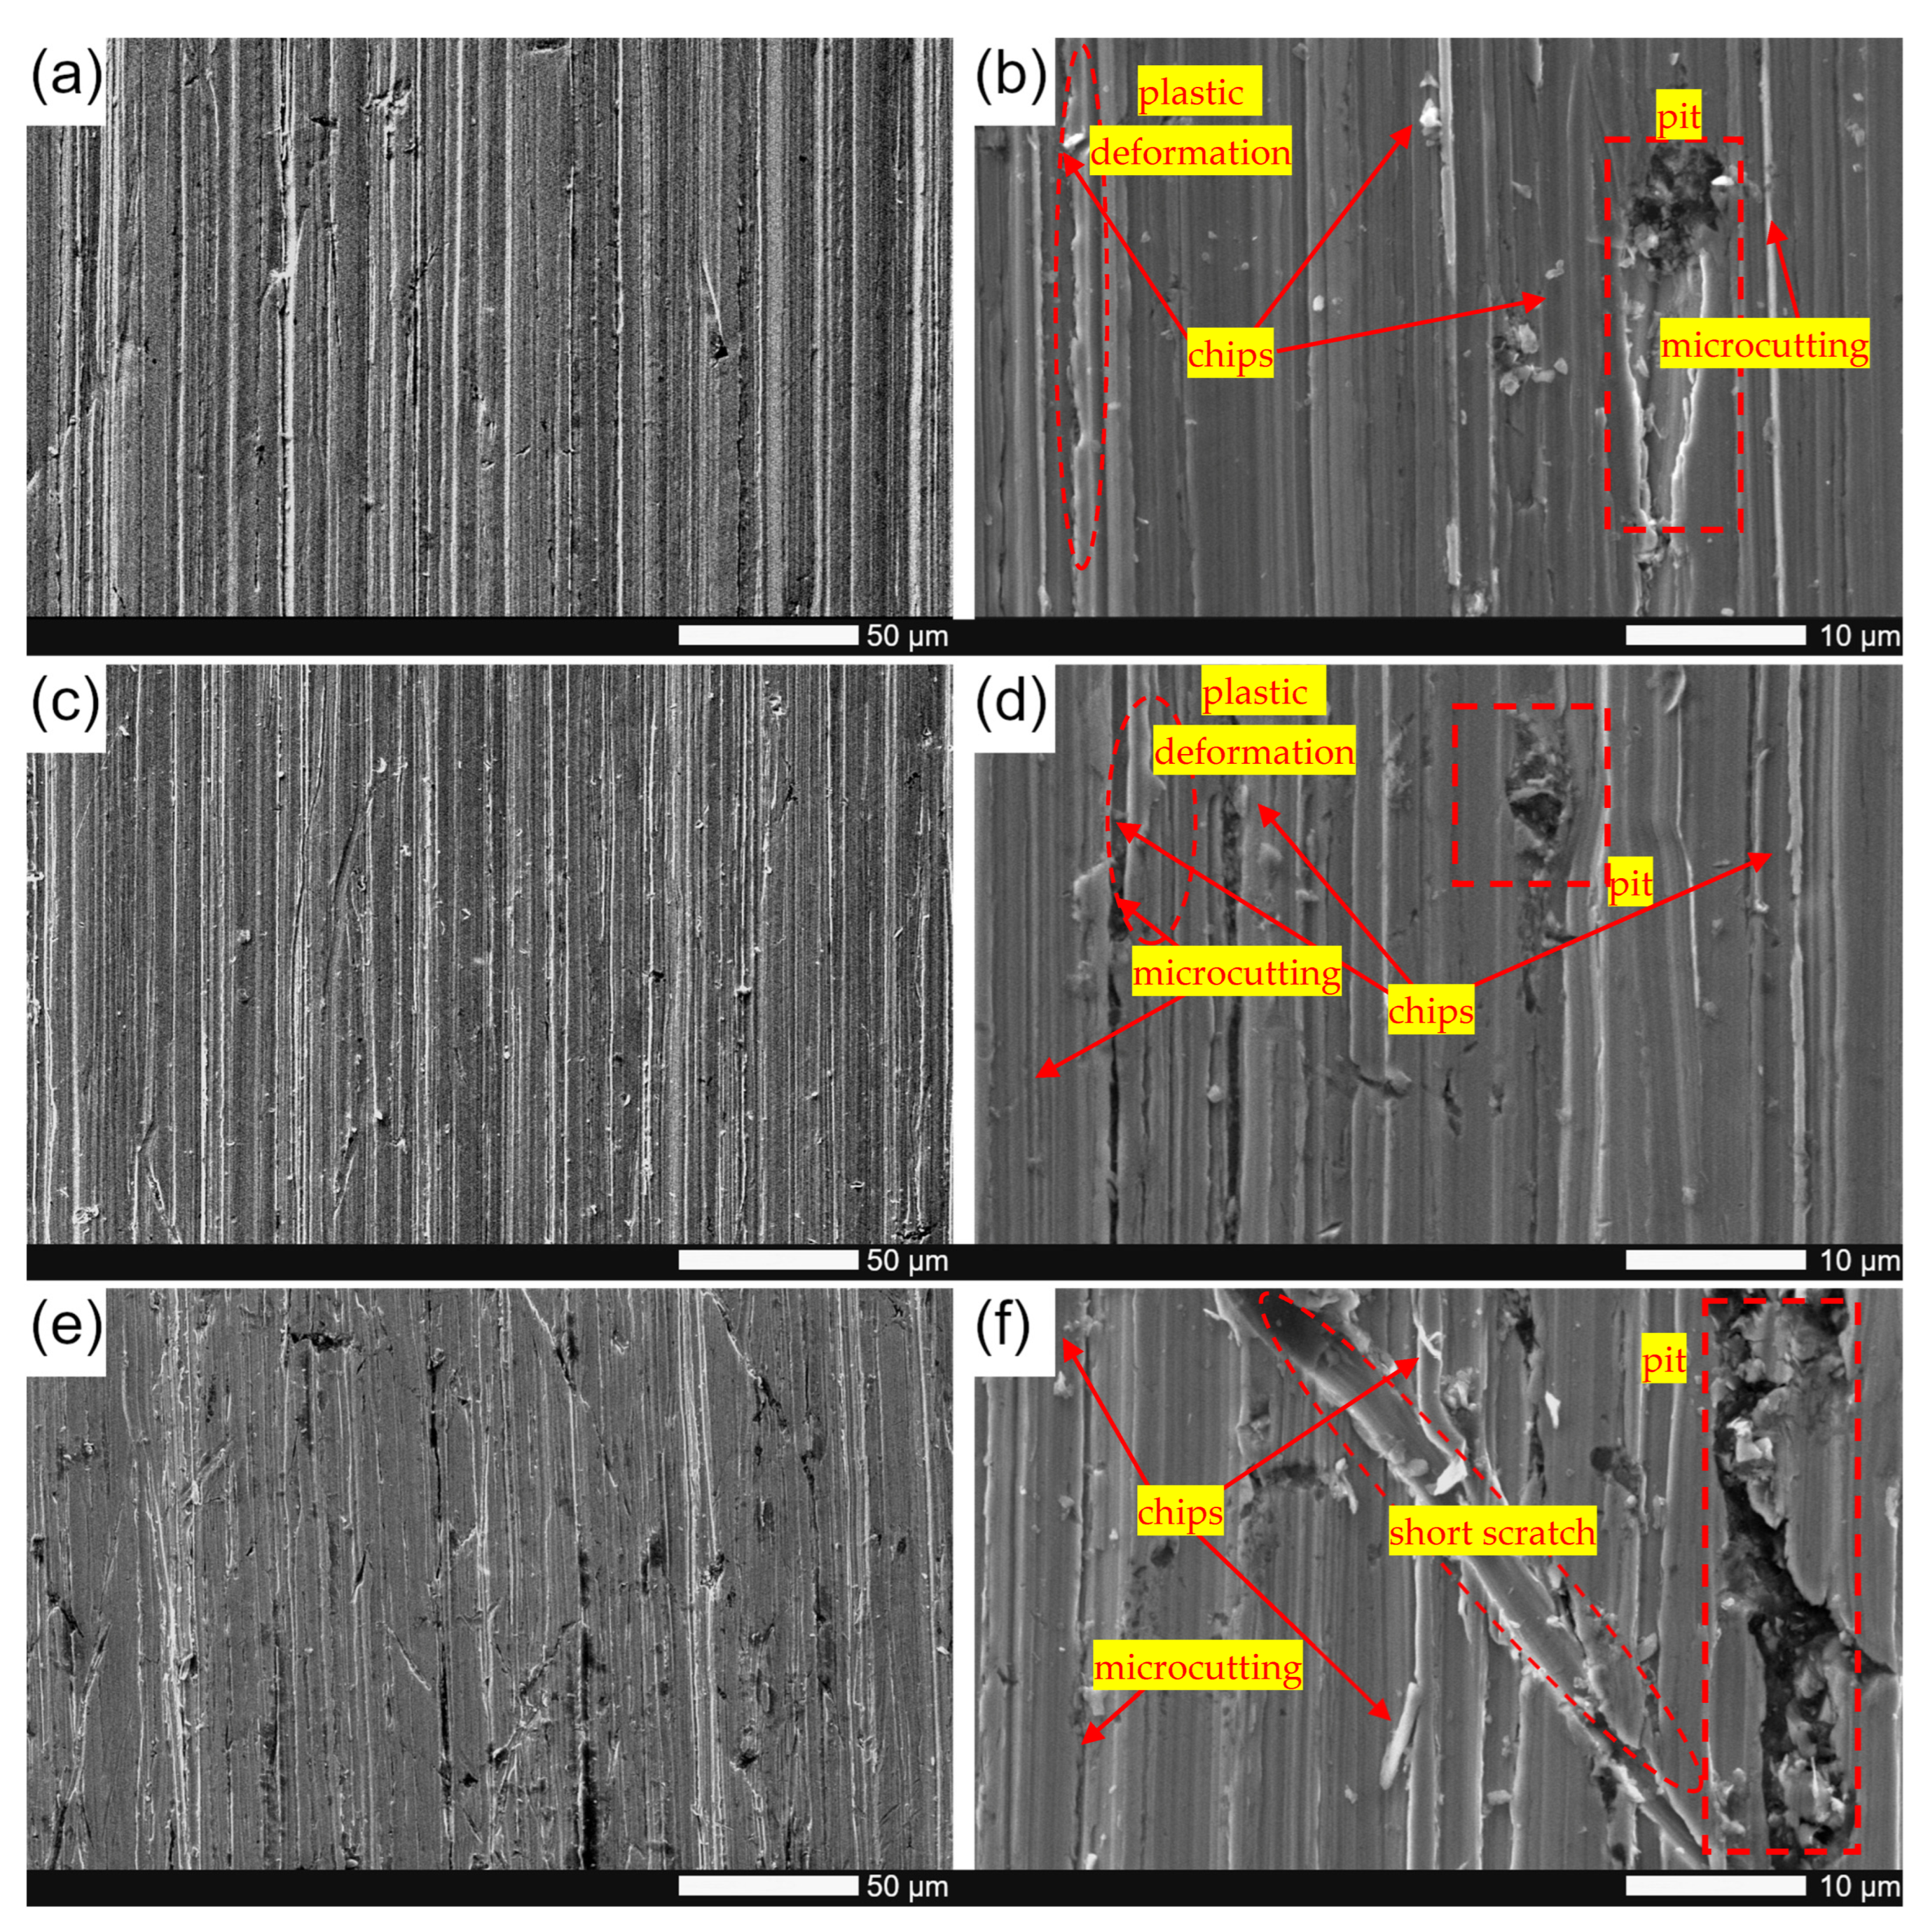
  • The primary wear mechanisms for Hardox 500 in the as-delivered state and after quenching at 850 °C are microplowing and plastic deformation. After quenching at 1200 °C, the surface shows significantly greater wear intensity, with deeper and more numerous pits and fine scratches oriented at various angles to the direction of abrasive particle movement.
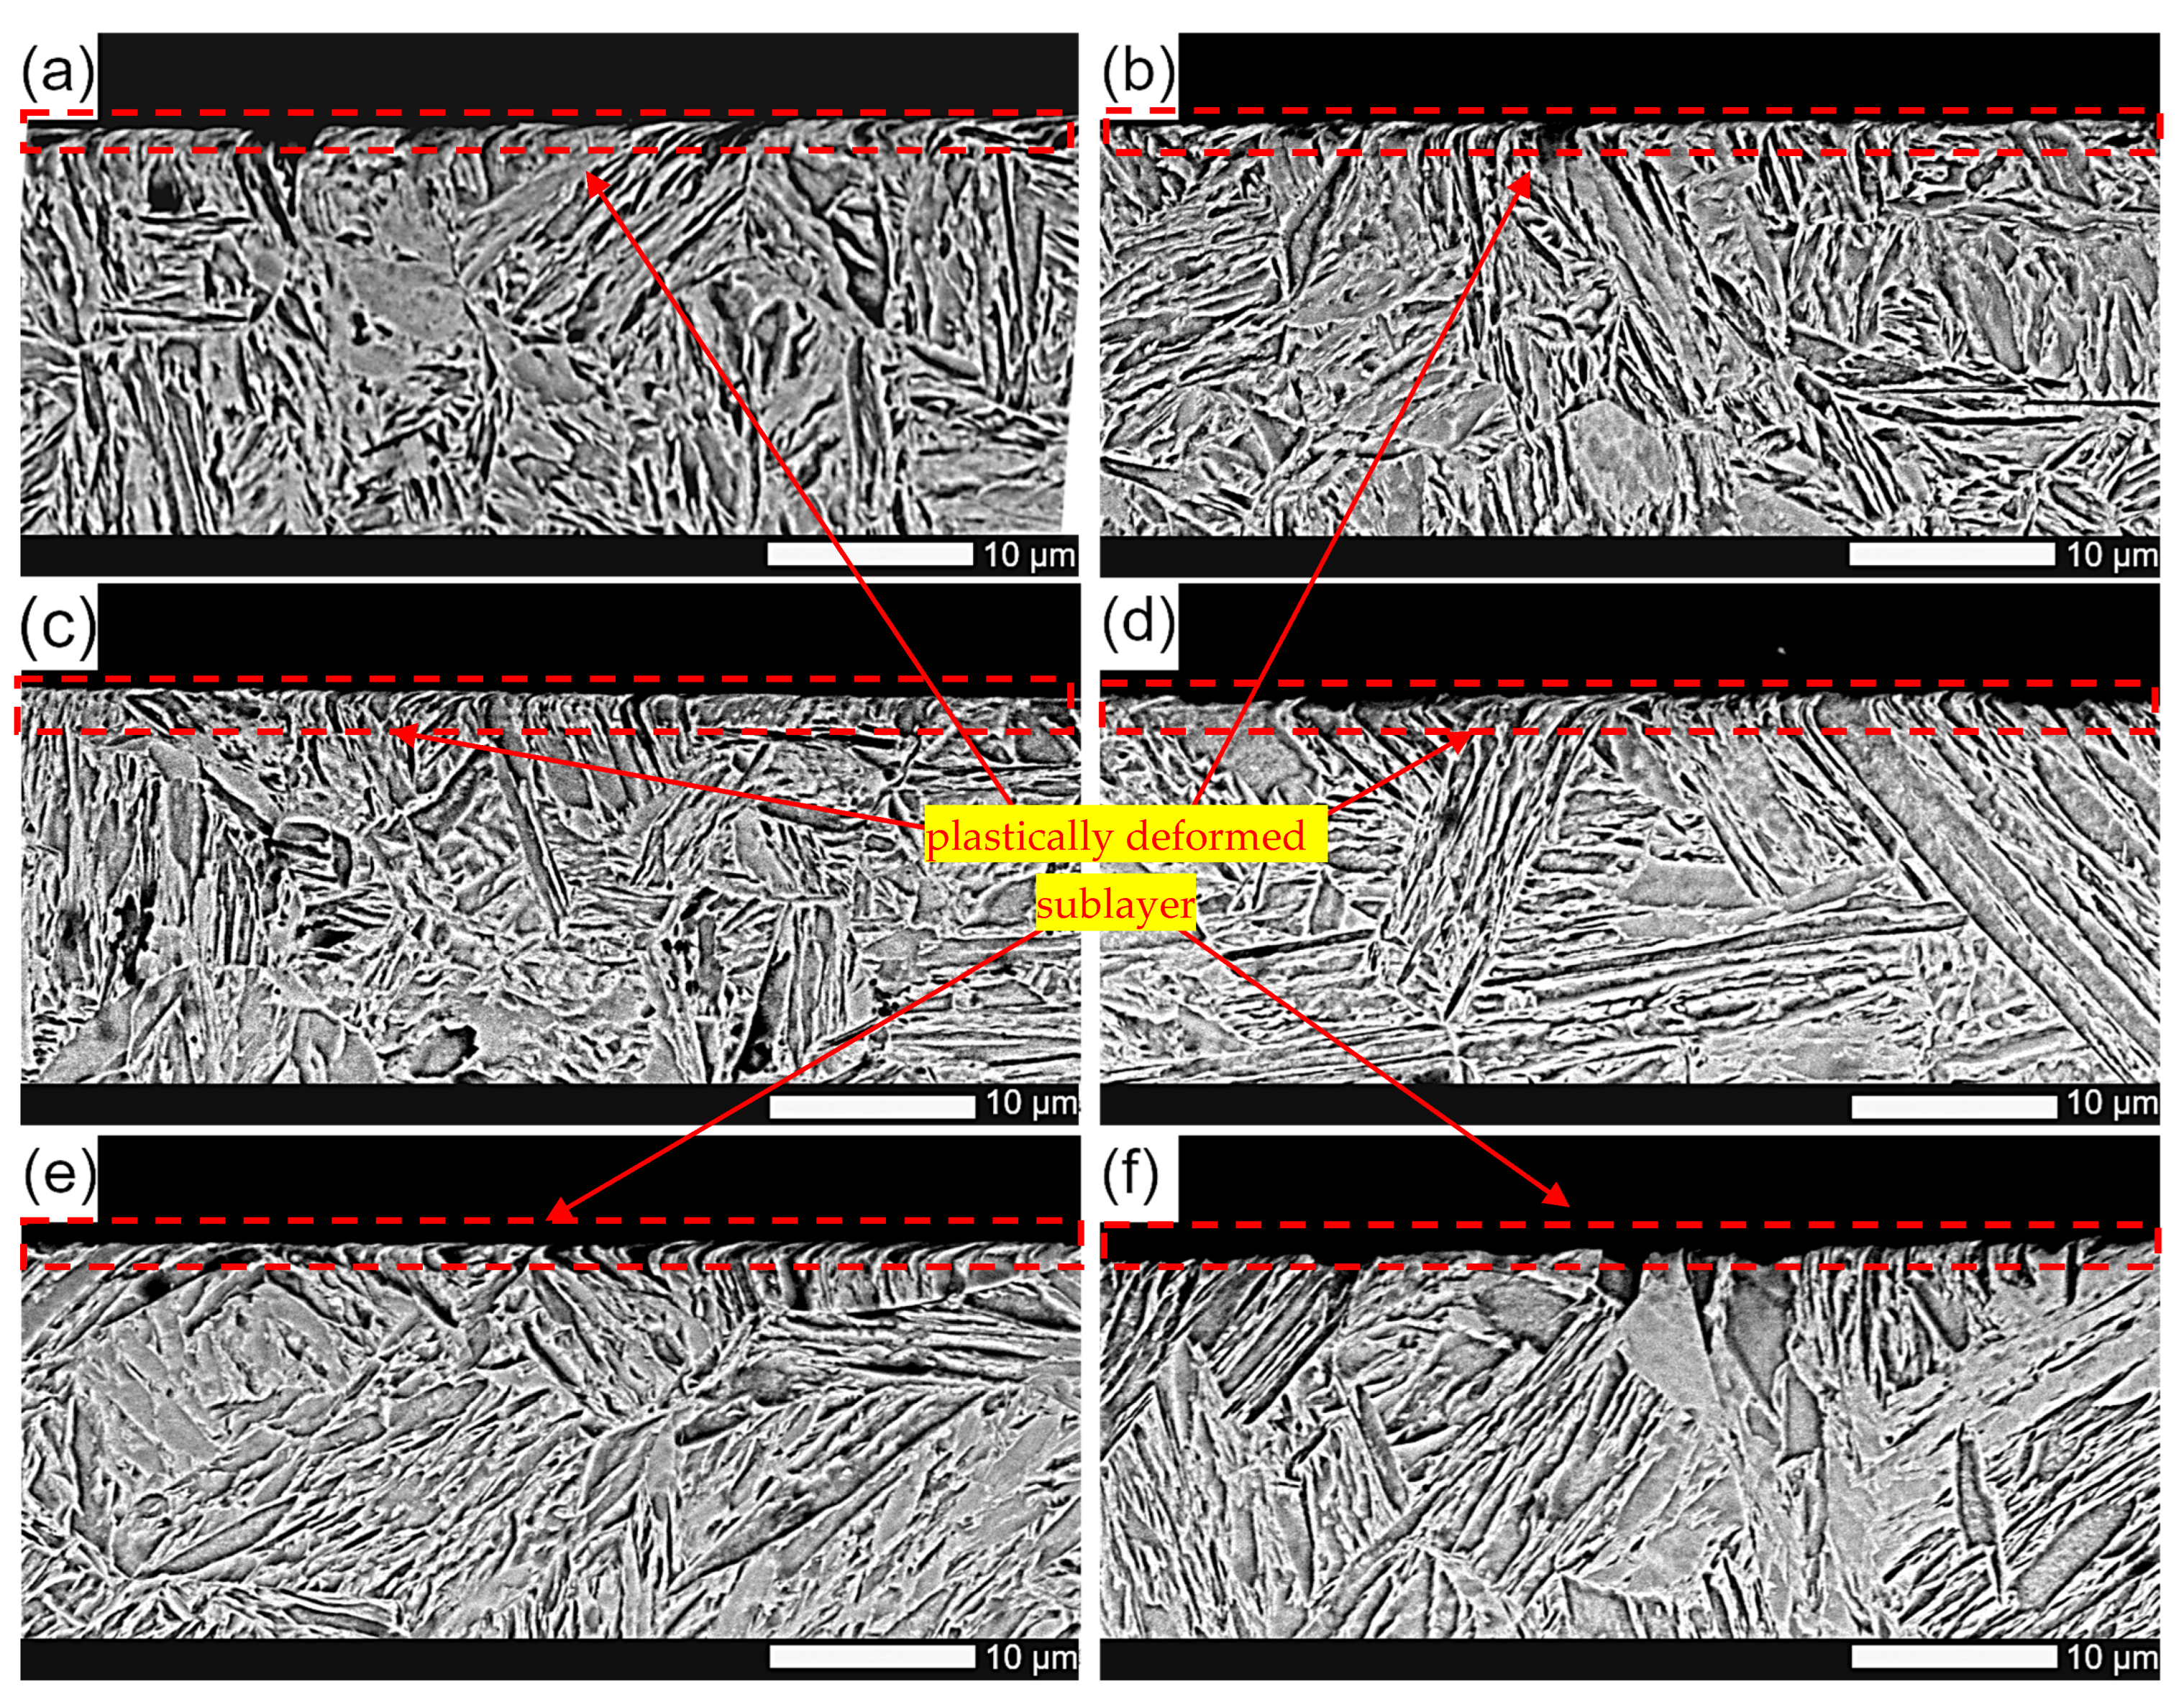
  • Plastic deformations, and consequently the retention of martensitic microstructure ductility despite high hardness, play a crucial role in abrasion resistance. The observed deformations and pits are highly dependent on grain size, with the largest ones appearing in Hardox 500 steel subjected to the highest heat treatment temperatures (1100 °C and 1200 °C), due to greater susceptibility of the microstructure to intense abrasive action.
  • Austenitizing temperature also affects the surface roughness of steel after abrasive wear testing. Lower temperatures, particularly 850 °C and 900 °C, yield smoother surfaces with lower roughness, whereas austenitizing at 1000 °C and 1200 °C increases roughness parameters, particularly Rz, Rp, and Rv, compared to the as-delivered state. An austenitizing temperature of 1100 °C provides low roughness parameters, though this does not directly translate to improved functional properties, as represented by abrasion resistance in this treatment state.
  • The analysis of Wolf’s shape indices indicates that surface topographies of samples subjected to different austenitizing temperatures are relatively similar, with minor differences due to higher heat treatment temperatures, which may result in more pronounced protrusions.

Author Contributions

Conceptualization, M.Z. and B.B.; methodology, M.Z., B.B. and M.S.; validation, M.Z. and B.B.; formal analysis, M.Z., B.B. and M.S.; investigation, M.Z., B.B., M.S. and J.H.; resources, M.Z. and B.B.; data curation, M.Z., B.B. and M.S.; writing—original draft preparation, M.Z. and B.B.; writing—review and editing, M.Z. and B.B.; visualization, M.Z. and B.B.; supervision, M.Z. and B.B.; project administration, M.Z. and B.B. All authors have read and agreed to the published version of the manuscript.

Funding

This research received no external funding.

Institutional Review Board Statement

Not applicable.

Informed Consent Statement

Not applicable.

Data Availability Statement

Data available on request due to restrictions.

Conflicts of Interest

The authors declare no conflicts of interest.

References

  1. Pawlak, K.; Białobrzeska, B.; Konat, Ł. The Influence of Austenitizing Temperature on Prior Austenite Grain Size and Resistance to Abrasion Wear of Selected Low-Alloy Boron Steel. Arch. Civ. Mech. Eng. 2016, 16, 913–926. [Google Scholar] [CrossRef]
  2. Lindroos, M.; Valtonen, K.; Kemppainen, A.; Laukkanen, A.; Holmberg, K.; Kuokkala, V.-T. Wear Behavior and Work Hardening of High Strength Steels in High Stress Abrasion. Wear 2015, 322–323, 32–40. [Google Scholar] [CrossRef]
  3. Ratia, V.; Rojacz, H.; Terva, J.; Valtonen, K.; Badisch, E.; Kuokkala, V.-T. Effect of Multiple Impacts on the Deformation of Wear-Resistant Steels. Tribol. Lett. 2015, 57, 15. [Google Scholar] [CrossRef]
  4. Pelczar, M. The Effect of Microalloying Elements on the Hardenability of Boron Treated Steel. Ph.D. Thesis, AGH University of Science and Technology in Krakow, Cracow, Poland, 2010. [Google Scholar]
  5. Sharma, M.; Ortlepp, I.; Bleck, W. Boron in Heat-Treatable Steels: A Review. Steel Res. Int. 2019, 90, 1900133. [Google Scholar] [CrossRef]
  6. Konat, Ł.; Pękalski, G. Overview of Materials Testing of Brown-Coal Mining Machines (Years 1985–2017). In Mining Machines and Earth-Moving Equipment; Sokolski, M., Ed.; Springer: Cham, Switzerland, 2020; pp. 21–58. [Google Scholar]
  7. Konat, Ł.; Zemlik, M.; Jasiński, R.; Grygier, D. Austenite Grain Growth Analysis in a Welded Joint of High-Strength Martensitic Abrasion-Resistant Steel Hardox 450. Materials 2021, 14, 2850. [Google Scholar] [CrossRef]
  8. Zemlik, M.; Konat, Ł.; Białobrzeska, B. Analysis of the Possibilities to Increase Abrasion Resistance of Welded Joints of Hardox Extreme Steel. Tribol. Int. 2025, 201, 110271. [Google Scholar] [CrossRef]
  9. Liu, W.; Li, J.; Shi, C.; Wang, C. Effect of Micro-Alloying Element Boron on the Strengthening of High-Strength Steel Q690D. Metallogr. Microstruct. Anal. 2015, 4, 102–108. [Google Scholar] [CrossRef]
  10. Konat, Ł.; Jasiński, R.; Białobrzeska, B.; Szczepański, Ł. Analysis of the Static and Dynamic Properties of Wear-Resistant Hardox 600 Steel in the Context of Its Application in Working Elements. Mater. Sci. 2021, 39, 86–102. [Google Scholar] [CrossRef]
  11. Gao, Y.; Xue, X.; Yang, H. Influence of Boron on Initial Austenite Grain Size and Hot Deformation Behavior of Boron Microalloyed Steels. Crystals 2015, 5, 592–607. [Google Scholar] [CrossRef]
  12. Ruan, S.; Zhao, A.; Wang, L. Effect of Boron on Microstructure and Properties of Ultra-Low Carbon Steel. IOP Conf. Ser. Mater. Sci. Eng. 2020, 774, 12023. [Google Scholar] [CrossRef]
  13. Białobrzeska, B. Effect of Boron Accompanied by Chromium, Vanadium and Titanium on Kinetics of Austenite Grain Growth. Ironmak. Steelmak. 2021, 48, 649–676. [Google Scholar] [CrossRef]
  14. Sundström, A.; Rendón, J.; Olsson, M. Wear Behaviour of Some Low Alloyed Steels under Combined Impact/Abrasion Contact Conditions. Wear 2001, 250, 744–754. [Google Scholar] [CrossRef]
  15. Haiko, O.; Javaheri, V.; Valtonen, K.; Kaijalainen, A.; Hannula, J.; Kömi, J. Effect of Prior Austenite Grain Size on the Abrasive Wear Resistance of Ultra-High Strength Martensitic Steels. Wear 2020, 454–455, 203336. [Google Scholar] [CrossRef]
  16. Zum Gahr, K.H. Wear by Hard Particles. Tribol. Int. 1998, 31, 587–596. [Google Scholar] [CrossRef]
  17. Białobrzeska, B.; Konat, Ł.; Jasiński, R. The Influence of Austenite Grain Size on the Mechanical Properties of Low-Alloy Steel with Boron. Metals 2017, 7, 26. [Google Scholar] [CrossRef]
  18. Maciejny, A. Brittleness of Metals; Publishing House “Śląsk”: Katowice, Poland, 1973. [Google Scholar]
  19. Li, X.; Lu, G.; Wang, Q.; Zhao, J.; Xie, Z.; Misra, R.D.K.; Shang, C. The Effects of Prior Austenite Grain Refinement on Strength and Toughness of High-Strength Low-Alloy Steel. Metals 2021, 12, 28. [Google Scholar] [CrossRef]
  20. Field, D.M.; Cluff, S.R.; Limmer, K.R.; Montgomery, J.S.; Magagnosc, D.J.; Cho, K.C. Heat Treatment and Austenitization Temperature Effect on Microstructure and Impact Toughness of an Ultra-High Strength Steel. Metals 2021, 11, 723. [Google Scholar] [CrossRef]
  21. Maropoulos, S.; Karagiannis, S.; Ridley, N. The Effect of Austenitising Temperature on Prior Austenite Grain Size in a Low-Alloy Steel. Mater. Sci. Eng. A 2008, 483–484, 735–739. [Google Scholar] [CrossRef]
  22. Wu, B.B.; Wang, X.L.; Wang, Z.Q.; Zhao, J.X.; Jin, Y.H.; Wang, C.S.; Shang, C.J.; Misra, R.D.K. New Insights from Crystallography into the Effect of Refining Prior Austenite Grain Size on Transformation Phenomenon and Consequent Mechanical Properties of Ultra-High Strength Low Alloy Steel. Mater. Sci. Eng. A 2019, 745, 126–136. [Google Scholar] [CrossRef]
  23. Ratia, V.; Miettunen, I.; Kuokkala, V.-T. Surface Deformation of Steels in Impact-Abrasion: The Effect of Sample Angle and Test Duration. Wear 2013, 301, 94–101. [Google Scholar] [CrossRef]
  24. Chintha, A.R. Metallurgical Aspects of Steels Designed to Resist Abrasion, and Impact-Abrasion Wear. Mater. Sci. Technol. 2019, 35, 1133–1148. [Google Scholar] [CrossRef]
  25. Moore, M.A.; Richardson, R.C.D.; Attwood, D.G. The Limiting Strength of Worn Metal Surfaces. Metall. Trans. 1972, 3, 2485–2491. [Google Scholar] [CrossRef]
  26. Kashcheev, V.N. Some Aspects of Improving Abrasive Resistance. Wear 1983, 89, 265–272. [Google Scholar] [CrossRef]
  27. Białobrzeska, B. The Influence of Boron on the Resistance to Abrasion of Quenched Low-Alloy Steels. Wear 2022, 500–501, 204345. [Google Scholar] [CrossRef]
  28. Konat, Ł. Structural Aspects of Execution and Thermal Treatment of Welded Joints of Hardox Extreme Steel. Metals 2019, 9, 915. [Google Scholar] [CrossRef]
  29. Konat, Ł. Technological, Microstructural and Strength Aspects of Welding and Post-Weld Heat Treatment of Martensitic, Wear-Resistant Hardox 600 Steel. Materials 2021, 14, 4541. [Google Scholar] [CrossRef]
  30. Konat, Ł.; Napiórkowski, J. The Effect of the Method and Parameters of the Heat Treatment on Abrasive Wear Resistance of 38GSA Steel. Q. Tribol. 2019, 2, 61–69. [Google Scholar] [CrossRef]
  31. Tarasiuk, W.; Napiórkowski, J.; Ligier, K.; Krupicz, B. Comparison of the Wear Resistance Between HARDOX 500 Steel and 20MnCr5 Steel. Q. Tribol. 2017, 273, 165–170. [Google Scholar] [CrossRef]
  32. Napiórkowski, J.; Lemecha, M.; Konat, Ł. Forecasting the Wear of Operating Parts in an Abrasive Soil Mass Using the Holm-Archard Model. Materials 2019, 12, 2180. [Google Scholar] [CrossRef]
  33. Valtonen, K.; Keltamäki, K.; Kuokkala, V.-T. High-Stress Abrasion of Wear Resistant Steels in the Cutting Edges of Loader Buckets. Tribolpgy Int. 2018, 119, 707–720. [Google Scholar] [CrossRef]
  34. Szala, M.; Szafran, M.; Macek, W.; Marchenko, S.; Hejwowski, T. Abrasion Resistance of S235, S355, C45, AISI 304 and Hardox 500 Steels with Usage of Garnet, Corundum and Carborundum Abrasives. Adv. Sci. Technol. Res. J. 2019, 13, 151–161. [Google Scholar] [CrossRef] [PubMed]
  35. Ligier, K.; Zemlik, M.; Lemecha, M.; Konat, Ł.; Napiórkowski, J. Analysis of Wear Properties of Hardox Steels in Different Soil Conditions. Materials 2022, 15, 7622. [Google Scholar] [CrossRef] [PubMed]
  36. Hara, T.; Asahi, H.; Uemori, R.; Tamehiro, H. Role of Combined Addition of Niobium and Boron and of Molybdenum and Boron on Hardnenability in Low Carbon Steels. ISIJ Int. 2004, 44, 1431–1440. [Google Scholar] [CrossRef]
  37. ASTM E407(2015); Practice for Microetching Metals and Alloys. ASTM International: West Conshohocken, PA, USA, 2015.
  38. ISO 6506-1:2014; Metallic Materials—Brinell Hardness Test—Part 1: Test Method. International Organization for Standardization: Geneva, Switzerland, 2014.
  39. GOST 23.208-79; Ensuring of Wear Resistance of Products. Wear Resistance Testing of Materials by Friction Against Loosely Fixed Abrasive Particles. Rosstandart: Moscow, Russian, 1979.
  40. ASTM G65-16(2021); Standard Test Method for Measuring Abrasion Using the Dry Sand/Rubber Wheel Apparatus. ASTM International: West Conshohocken, PA, USA, 2021.
  41. Vargova, M.; Tavodova, M.; Monkova, K.; Dzupon, M. Research of Resistance of Selected Materials to Abrasive Wear to Increase the Ploughshare Lifetime. Metals 2022, 12, 940. [Google Scholar] [CrossRef]
  42. PN-M-59115:1976; Wyroby ścierne—Ścierniwo—Skład ziarnowy. Polski Komitet Normalizacji: Miar i Jakości, Poland, 1976.
  43. Box, G.E.P. Some Theorems on Quadratic Forms Applied in the Study of Analysis of Variance Problems: II. Effect of Inequality of Variances and of Correlation of Errors in the Two-Way Classification. Ann. Math. Stat. 1954, 25, 484–498. [Google Scholar] [CrossRef]
  44. Box, G.E.P. Some Theorems on Quadratic Forms Applied in the Study of Analysis of Variance Problems: I. Effect of Inequality of Variances in the One-Way Classification. Ann. Math. Stat. 1954, 25, 290–302. [Google Scholar] [CrossRef]
  45. Valtonen, K.; Ojala, N.; Haiko, O.; Kuokkala, V.-T. Comparison of Various High-Stress Wear Conditions and Wear Performance of Martensitic Steels. Wear 2019, 426–427, 3–13. [Google Scholar] [CrossRef]
  46. Haiko, O.; Valtonen, K.; Kaijalainen, A.; Uusikallio, S.; Hannula, J.; Liimatainen, T.; Kömi, J. Effect of Tempering on the Impact-Abrasive and Abrasive Wear Resistance of Ultra-High Strength Steels. Wear 2019, 440–441, 203098. [Google Scholar] [CrossRef]
  47. Haiko, O.; Kaijalainen, A.; Pallaspuro, S.; Hannula, J.; Porter, D.; Liimatainen, T.; Kömi, J. The Effect of Tempering on the Microstructure and Mechanical Properties of a Novel 0.4C Press-Hardening Steel. Appl. Sci. 2019, 9, 4231. [Google Scholar] [CrossRef]
  48. Ojala, N.; Valtonen, K.; Heino, V.; Kallio, M.; Aaltonen, J.; Siitonen, P.; Kuokkala, V.T. Effects of Composition and Microstructure on the Abrasive Wear Performance of Quenched Wear Resistant Steels. Wear 2014, 317, 225–232. [Google Scholar] [CrossRef]
  49. He, B.; Ding, S.; Shi, Z. A Comparison between Profile and Areal Surface Roughness Parameters. Metrol. Meas. Syst. 2021, 28, 413–438. [Google Scholar] [CrossRef]
  50. Wiśniewski, M.; Szczerek, M. Tribology and Tribotechnics; Publishing House: Institute for Sustainable Technologies: Radom, Poland, 2000. [Google Scholar]
  51. Konat, Ł. Structures and Properties of Hardox Steels and Their Application Possibilities in Conditions of Abrasive Wear and Dynamic Loads. Ph.D. Thesis, Wrocław University of Science and Technology, Wrocław, Poland, 2007. [Google Scholar]
Figure 1. Schematic of the T-07 Tribotester operation: 1, sample; 2, rubber-rimmed steel wheel; 3, abrasive; 4 , load, P1, P2, P3, points of surface reconstruction.
Applsci 14 11490 g001
Figure 2. Shapiro-Wilk normality plot with statistics: (a) abrasive wear resistance, (b) hardness. DS, as-delivered state.
Applsci 14 11490 g002
Figure 3. Microstructure of Hardox 500 steel in its as-delivered state and after heat treatment at various austenitizing temperatures: (a) as-delivered state; (b) TA = 850 °C; (c) TA = 900 °C; (d) TA = 1000 °C; (e) TA = 1100 °C; and (f) TA = 1200 °C. LM, etched with reagent No. 3 per ASTM E407.
Applsci 14 11490 g003
Figure 4. Descriptive statistics for the grain size distribution of Hardox 500 steel at various austenitizing temperatures. DS, as-delivered state.
Applsci 14 11490 g004
Figure 5. Microstructures of Hardox 500 steel showing prior austenite grain boundaries: (a) as-delivered state; (b) TA = 850 °C; (c) TA = 900 °C; (d) TA = 1000 °C; (e) TA = 1100 °C; and (f) TA = 1200 °C. LM, etched with reagent No. 81 per ASTM E407.
Applsci 14 11490 g005
Figure 6. Distribution of austenite grain diameters in Hardox 500 steel: (a) as-delivered state; (b) TA = 850 °C; (c) TA = 900 °C; (d) TA = 1000 °C; (e) TA = 1100 °C; and (f) TA = 1200 °C.
Applsci 14 11490 g006
Figure 7. Relative abrasion resistance coefficient Kb and mass wear per meter of sliding distance (a), and hardness (b) of Hardox 500 steel at various austenitizing temperatures. DS, as-delivered state.
Applsci 14 11490 g007
Figure 8. Influence of prior austenite grain size on abrasion resistance (a) and hardness (b).
Applsci 14 11490 g008
Figure 9. Influence of hardness on abrasion resistance.
Applsci 14 11490 g009
Figure 10. Surface images of Hardox 500 steel samples after abrasive wear testing: (a) as-delivered state, magnification 2000×; (b) as-delivered state, magnification 10,000×; (c) TA = 850 °C, magnification 2000×; (d) TA = 850 °C, magnification 10,000×; (e) TA = 1200 °C, magnification 2000×; and (f) TA = 1200 °C, magnification 10,000×. Unetched, SEM.
Applsci 14 11490 g010
Figure 11. 3D images of sample surfaces subjected to wear testing along the longitudinal direction of abrasive movement: (a) as-delivered state; (b) TA = 850 °C; (c) TA = 900 °C; (d) TA = 1000 °C; (e) TA = 1100 °C; and (f) TA = 1200 °C. SEM.
Applsci 14 11490 g011
Figure 12. Microstructure of sample cross-sections subjected to wear testing surfaces subjected to wear testing along the perpendicular direction of abrasive movement: (a) as-delivered state; (b) TA = 850 °C; (c) TA = 900 °C; (d) TA = 1000 °C; (e) TA = 1100 °C; and (f) TA = 1200 °C. SEM.
Applsci 14 11490 g012
Figure 13. Microstructure of sample cross-sections subjected to wear testing, longitudinal to abrasive movement direction: (a) as-delivered state; (b) TA = 850 °C; (c) TA = 900 °C; (d) TA = 1000 °C; (e) TA = 1100 °C; and (f) TA = 1200 °C. SEM, etched with reagent No. 3 per ASTM E407.
Applsci 14 11490 g013
Figure 14. Surface roughness parameters of samples subjected to wear testing: (a) Ra and Rq; (b) Rz, Rp, and Rv; (c) RSm. DS, as-delivered state.
Applsci 14 11490 g014aApplsci 14 11490 g014b
Figure 15. Change in roughness parameters of samples subjected to wear testing as a function of hardness: (a) Ra and Rq; (b) Rz, Rp, and Rv; (c) RSm.
Applsci 14 11490 g015
Table 1. Chemical composition of Hardox 500 steel.
CMnSiPSCrNiMo
0.290.740.280.0070.0010.610.060.018
VCuAlTiNbCoBZr
0.0120.0100.0540.0030.0009
Table 2. Detailed parameters of heat treatment procedures applied to Hardox 500 steel; H500, Hardox 500.
DesignationHeat Treatment Parameters
H500-DSAs-delivered state
H500-A (850–1200 °C)
Abrasion and hardness measurements
Normalizing: 890 °C, 30 min
Austenitizing: 850 °C, 900 °C, 1000 °C, 1100 °C, 1200 °C, 120 min, water
H500, H500-A (850–1200 °C)
Prior austenite grain size testing
Normalizing: 890 °C, 30 min
Austenitizing: 850 °C, 900 °C, 1000 °C, 1100 °C, 1200 °C, 120 min, water
Tempering: 550 °C, 30 min, furnace cooling
Table 3. Results of the Brown–Forsythe homogeneity of variance test.
SS Effectdf EffectMS EffectSS Errordf ErrorMS ErrorFp
Mass wear per 1 m of sliding distance0.00988550.0019770.011121300.0003715.3334050.001268
Hardness243.9613548.79227822.36105415.228913.2039240.013227
Table 4. Results of ANOVA.
SS Effectdf EffectMS EffectSS Errordf ErrorMS ErrorFp
Mass wear per 1 m of sliding distance0.24780450.0495610.037302300.00124339.858620.000000
Hardness28,525.4355705.0861987.4265436.80419155.01190.00
Table 5. Tukey’s post hoc test results for abrasion resistance. DS, as-delivered state.
State of Heat Treatment{1} M = 0.79082{2} M = 0.78652{3} M = 0.78970{4} M = 0.82289{5} M = 0.90382{6} M = 1.0128
DS {1} 0.9999401.0000000.6204800.0001950.000134
TA = 850 °C {2}0.999940 0.9999860.4891370.0001690.000134
TA = 900 °C {3}1.0000000.999986 0.5860880.0001870.000134
TA = 1000 °C {4}0.6204800.4891370.586088 0.0050790.000134
TA = 1100 °C {5}0.0001950.0001690.0001870.005079 0.000240
TA = 1200 °C {6}0.0001340.0001340.0001340.0001340.000240
Table 6. Tukey’s post hoc test results for hardness. DS, as-delivered state.
State of Heat Treatment{1} M = 468.01{2} M = 529.42{3} M = 534.26{4} M = 521.83{5} M = 513.30{6} M = 507.42
DS {1} 0.0001380.0001380.0001380.0001380.000138
TA = 850 °C {2}0.000138 0.4844970.0733270.0001400.000138
TA = 900 °C {3}0.0001380.484497 0.0005080.0001380.000138
TA = 1000 °C {4}0.0001380.0733270.000508 0.0308200.000162
TA = 1100 °C {5}0.0001380.0001400.0001380.030820 0.269951
TA = 1200 °C {6}0.0001380.0001380.0001380.0001620.269951
Table 7. Wolf’s shape parameter ratios calculated for results from own tests. DS, as-delivered state.
Shape Parameter Ratios [-]Heat Treatment—Sample Designation
DSTA = 850 °CTA = 900 °CTA = 1000 °CTA = 1100 °CTA = 1200 °C
R t R p 1.951.842.051.942.291.83
R t R a 6.497.737.096.666.987.37
R p R a 1.201.231.381.161.761.01
R t   R a R p 2 7.6511.419.897.7610.818.59
R t   R p R a 2 1.171.191.251.201.451.16
R v R p 0.140.110.130.130.130.12
R a R z 1.951.842.051.942.291.83
Rt, total height of the profile: the sum of the height of the highest peak in the profile (Rp) and the depth of the deepest valley in the profile (Rv).
Disclaimer/Publisher’s Note: The statements, opinions and data contained in all publications are solely those of the individual author(s) and contributor(s) and not of MDPI and/or the editor(s). MDPI and/or the editor(s) disclaim responsibility for any injury to people or property resulting from any ideas, methods, instructions or products referred to in the content.

