Abstract
Addressing the low accuracy and slow detection speed experienced by algorithms based on deep learning for a leather defect detection task, a lightweight and improved leather defect detection algorithm, dubbed YOLOv8-AGE, has been proposed based on YOLOv8n. In the backbone network, the EMA attention mechanism and C2f module have been fused into the C2f-EMA module, achieving performance enhancement with lower computational overhead. In the neck, the AFPN structure has been combined with the VoV-GSCSP module constructed using GSConv, to reduce the number of parameters while enhancing the model’s multi-scale detection capability. Finally, a shared convolutional layer has been introduced for simplifying the design of the detection head. Experimental results demonstrate that the improved algorithm achieves an improvement of 1.39% in mAP50 and reduces the number of parameters and GFLOPs by 9.3% and 7.41%, respectively, as compared to the original YOLOv8 model. On the dataset in this paper, there is an improvement in accuracy and detection speed over mainstream algorithms.
1. Introduction
Leather plays a crucial role in the industry as a key raw material widely used in the manufacture of products such as clothing, bags, and footwear. Ensuring the high quality of leather materials is essential. In this context, leather defect detection is particularly important as it directly influences the production quality and efficiency of leather products, crucial for meeting high standards. Through accurate defect detection, problems in the production process are detected and eliminated in a timely manner, thereby enhancing the overall quality of the final product and market competitiveness. However, current research in leather defect detection struggles to meet the requirements for accuracy and speed in detection. Therefore, proposing an accurate, reliable, and fast intelligent detection algorithm is the current focus of research.
In the field of leather defect detection, the initial approach primarily relied on manual defect detection and marking. However, this method encountered several issues, including inconsistencies in detection results due to varying inspector skills, the absence of standardized criteria, and the subjectivity and fatigue experienced by inspectors [1]. These issues not only hinder the efficiency and quality of leather production but also increase enterprise costs associated with training and employing high-level inspectors.
In order to overcome the drawbacks, researchers have started to introduce new automated methods to replace manual testing, largely utilizing machine learning methods based on image analysis and deep learning techniques [2]. These include texture-based methods [3,4,5], wavelet-based methods [6,7,8], and classifier-based methods [9]. However, these methods are evaluated on small test sets and rely on human-designed features, which may not ensure robustness on highly variable real-world leather images. Additionally, the uncertainties in leather images, such as morphology and contrast, as well as variability in defects both between and within images, prevent simultaneous detection of multiple defects with traditional machine learning methods. Deep learning technology automatically learns features to effectively accomplish defect target detection and classification, thus making it the optimal solution for leather defect detection.
Therefore, domestic and foreign researchers have proposed solutions based on deep neural network models in recent years. For example, Smith et al. [10] introduced a leather defect detection method based on ViT (vision transformer), leveraging low-resolution images for anomaly detection and classification. The proposed method surpasses current lightweight techniques in classification accuracy, with minimal computational requirements and reduced dependency on image resolution and training sample size. Masood et al. [11] proposed a robust leather defect detection method using trainable guided attention, integrating an optimized backbone network with a Feature Pyramid Network and attention mechanism to accurately detect and classify leather defects of various sizes and characteristics. This approach introduces cross-channel guidance and spatial attention, enhancing its applicability in real-time industrial inspection environments and achieving a validation accuracy of 93.89%. Deng et al. [12] introduced a novel framework based on parameter-optimized residual networks for automatic classification of leather surface defects. They utilized an ultra-high-definition imaging system to capture leather surface images, optimized image dataset size and sliding patch window size using the least-squares method, addressed gradient vanishing issues in deep learning with residual modules, and achieved automatic defect classification with a classification accuracy of 94.6%.
However, the above studies focus on the accuracy of the model and the speed of real-time detection, respectively, while in the industrial environment, the speed and accuracy of leather defect detection are equally important. In this context, Chen et al. [13] conducted extensive experiments on leather defect detection using state-of-the-art YOLO (You Only Look Once) series real-time inspection models. The results demonstrate that the YOLO series adequately meets the speed and accuracy requirements for real-time inspection in industrial environments. Among them, the YOLOv5 [14] model is lightweight and eco-friendly, making it easy to deploy and train on devices. YOLOv6 [15] is an improved model tailored for industrial detection, resulting in a high recall rate. YOLOv7 [16] performs excellently in single target detection. Finally, YOLOv8 [17] achieves the best performance with the highest detection accuracy and comparable detection speeds, demonstrating the strongest overall performance in detecting multiple defects.
In conclusion, the current research on leather defect detection has made considerable progress. However, leather defect data exhibit a variety of spatial scales and aspect ratios: defects occur in different spatial scales, and defects of the same type vary significantly in size and shape. This poses significant challenges for defect detection. Therefore, we propose a lightweight and improved model, YOLOv8-AGE, for leather defect detection based on YOLOv8 as the baseline model. Our contributions are as follows:
- (1)
- The EMA [18] (Efficient Multi-scale Attention) mechanism has been incorporated into the backbone of the model, enabling better focus on key defect information in images and resistance to interference from leather texture.
- (2)
- Based on the multi-scale structure concept of AFPN (Asymptotic Feature Pyramid Network), AFPN [19] is integrated with the VOVGSCSP module containing GSConv [20] (Grouped Shuffle Convolution) into the model’s architecture, aiming to enhance the model’s multi-scale detection capability and reduce model complexity.
- (3)
- The concept of shared convolutional layers is introduced to optimize the design of the YOLOv8 detection head, thereby reducing model parameters.
- (4)
- We have created a well-labeled leather defect dataset containing common leather defect classes, which facilitates training of the leather defect detection model.
2. Dataset Preprocessing
2.1. Image Acquisition
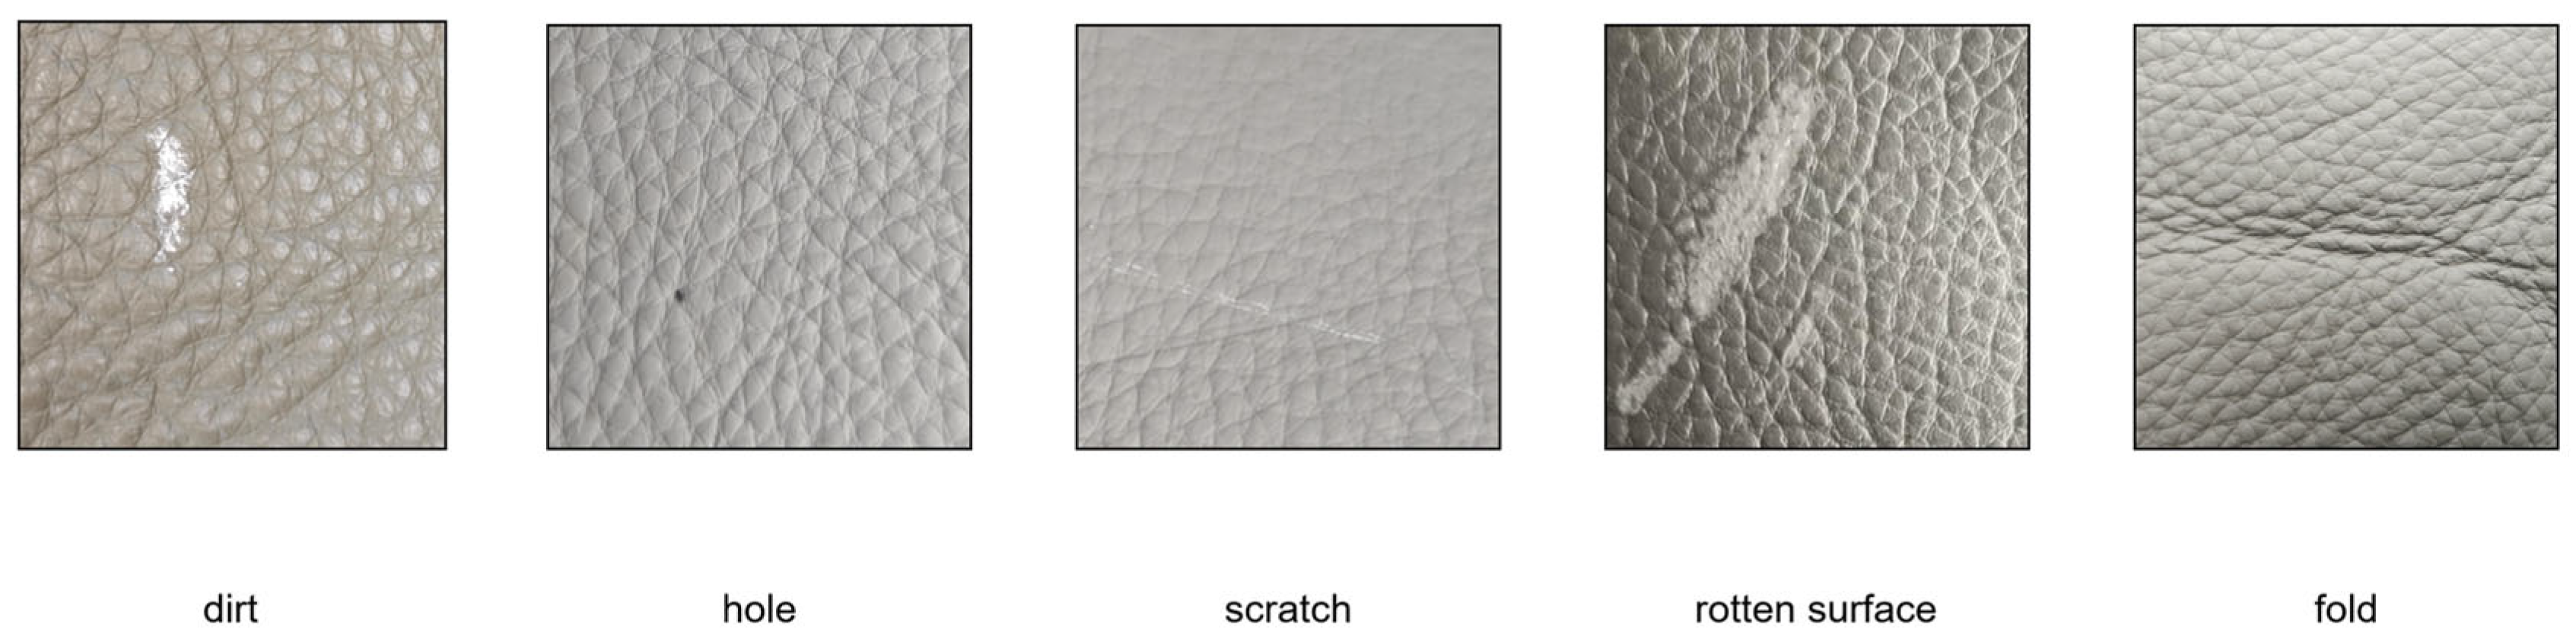
Due to the lack of a public dataset for leather defect detection, this study was conducted to select and take pictures of defects in a sample from a leather factory. Five common leather defects were collected: scratches, holes, dirt, rotten surfaces and folds. To minimize interference from the acquisition environment and sample variability, we preprocessed the captured images to exclude those unsuitable for training, including those that were blurry or poorly lit. Subsequently, we cropped the images to focus on the defects, creating defect-centered images each measuring 2048 × 2048 pixels. Ultimately, we obtained 1065 such defective images. The example pictures of the five defects are shown in Figure 1. The following are descriptions of the various defects: Dirt is an uneven color or foreign substance on the surface of the leather, which may be caused by uneven dyeing, oil penetration or external pollution. Holes are defects formed when a needle or thread passes through the leather leaving small holes during leather processing. Scratch is a line damage on the surface of leather caused by friction, cutting or other external force. Rotten surface is the leather surface being damaged due to moisture, mold or other environmental factors and appearing rotten. Fold is a permanent wrinkle or crack formed in the leather due to folding or compression during processing or use.
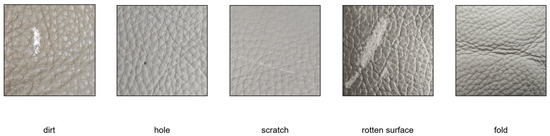
Figure 1.
Example of defect categories.
2.2. Data Tagging and Enhancement
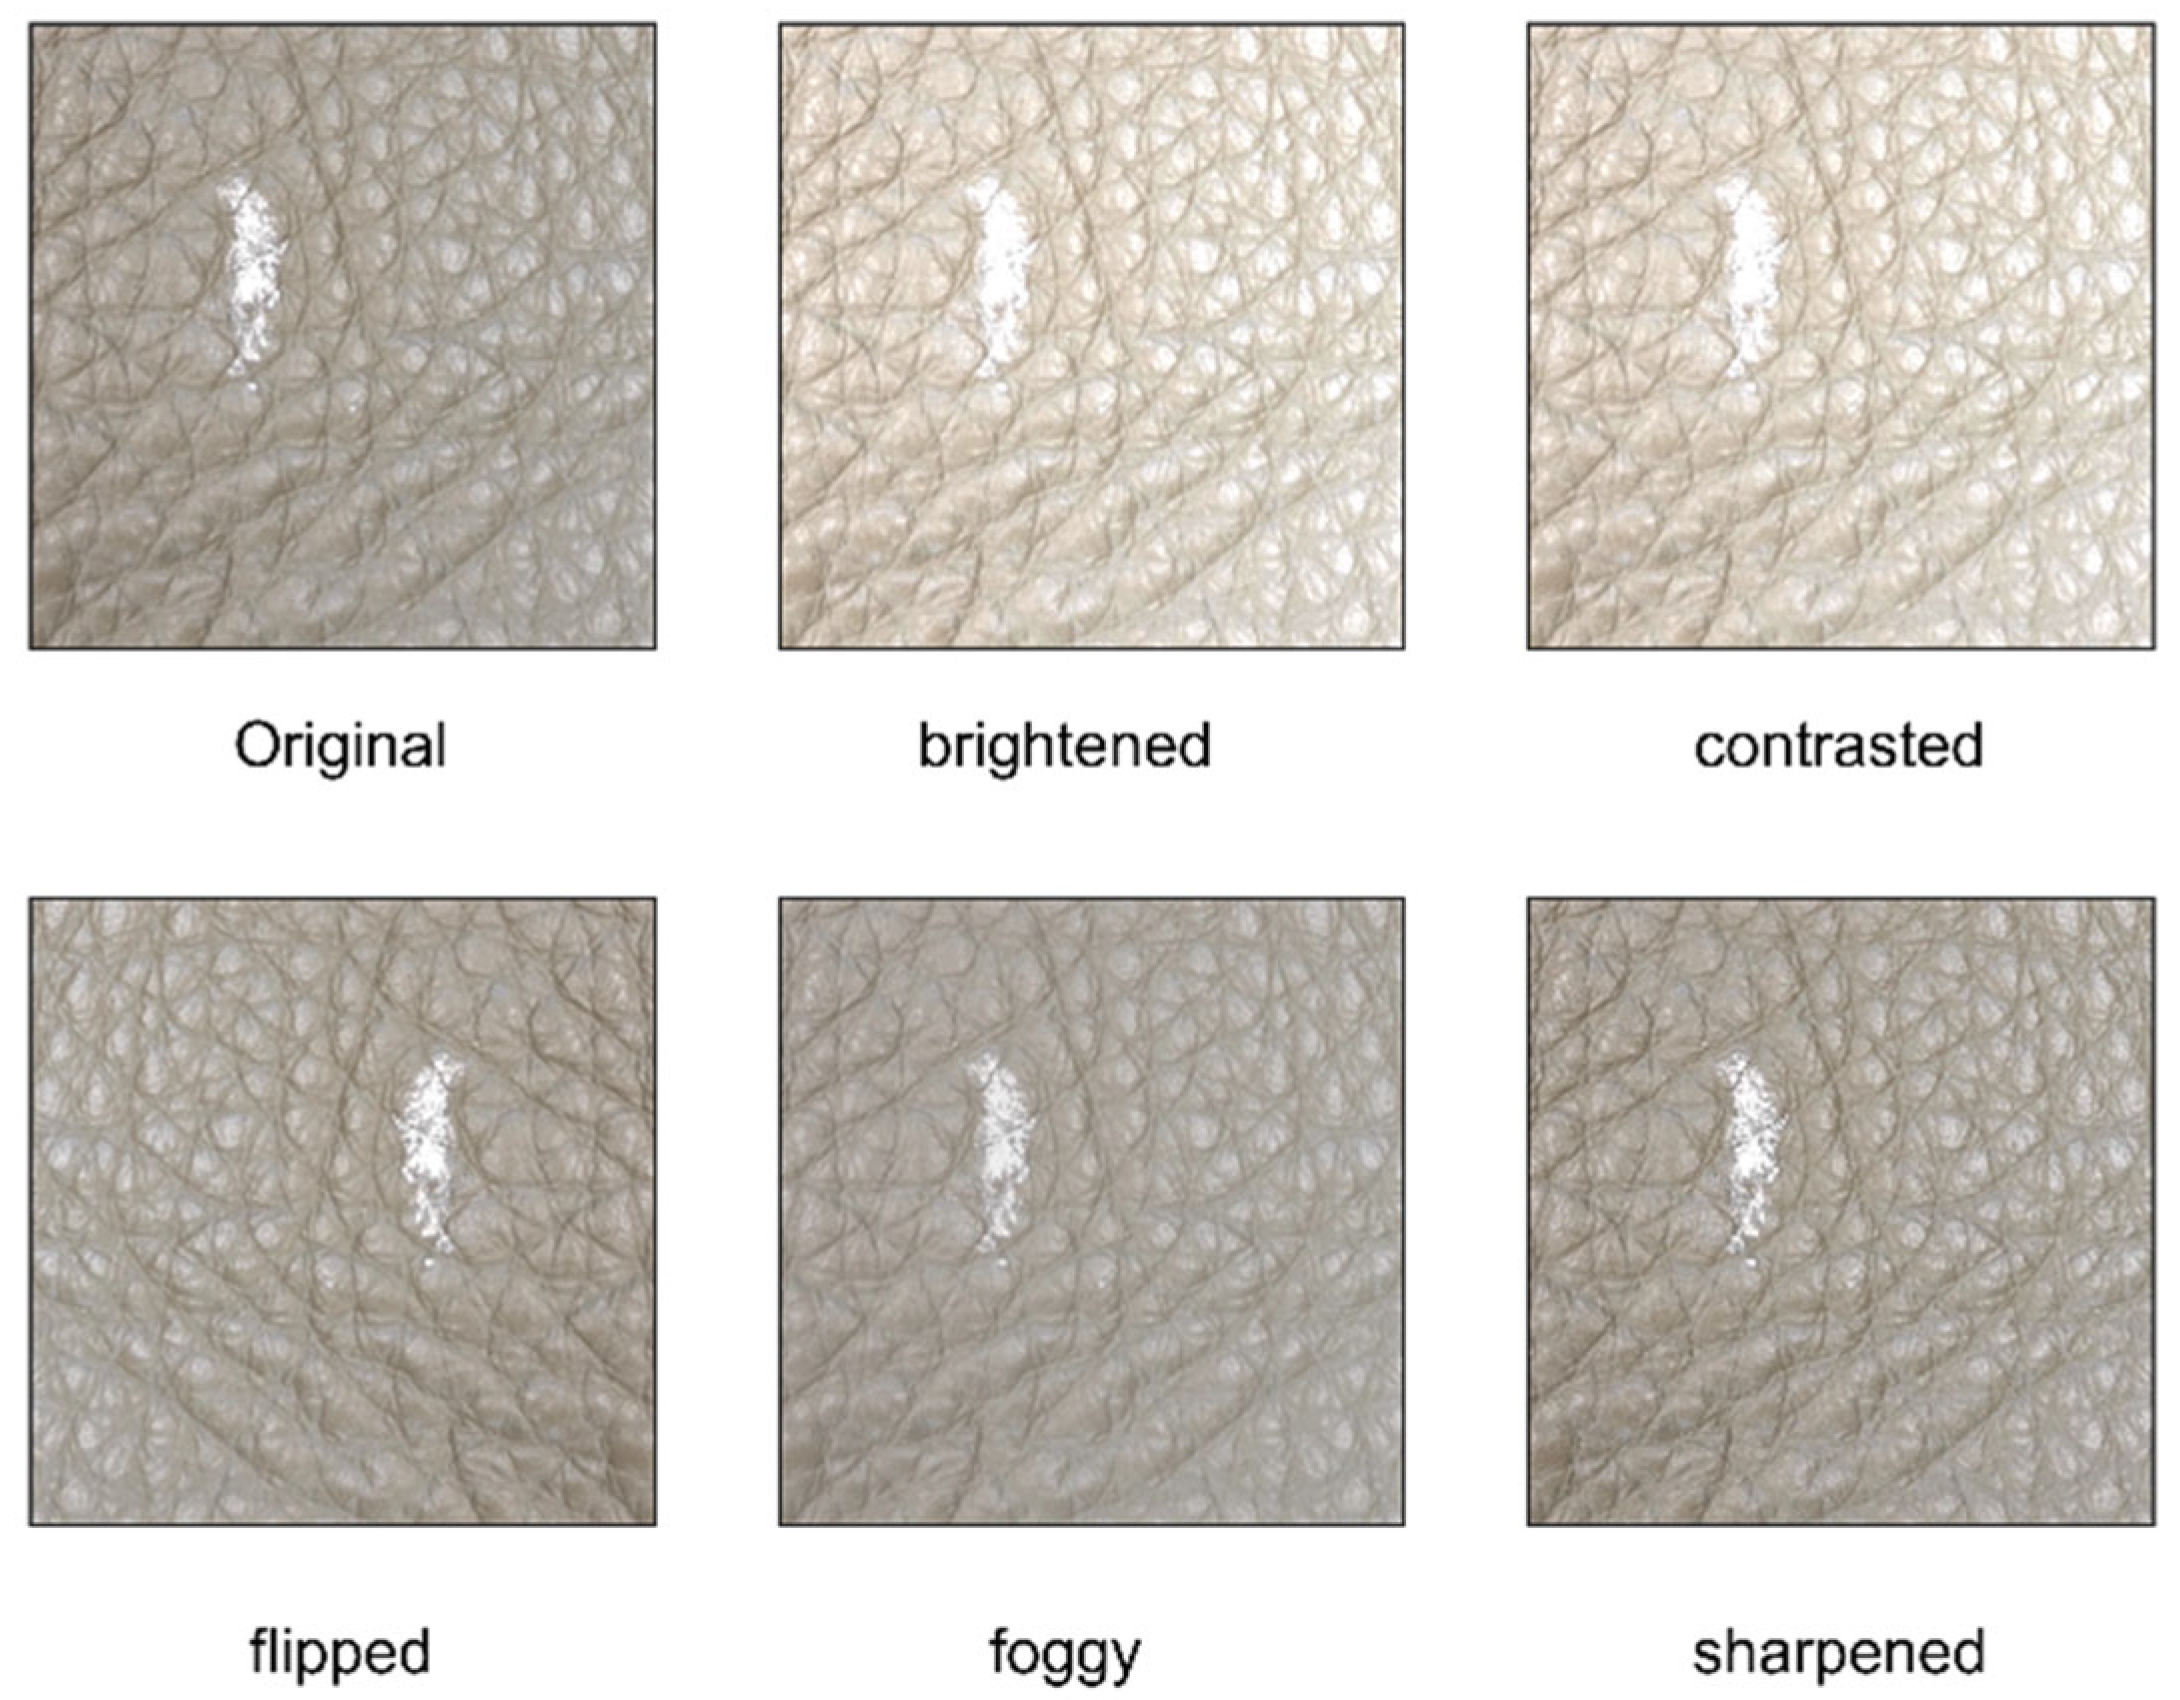
LabelImg software was used to annotate defects obtained during acquisition, saving the annotations in YOLO format. Due to the substantial data requirements for training deep learning models, the collected images underwent data augmentation, including sharpening, brightness and contrast adjustments, horizontal flipping, and adding fog effects. In the end, a dataset comprising 5325 images was generated, split into a training set of 3728 images and a validation set of 1597 images. Table 1 shows the specific number of images of each type of defect in the dataset. An example image after processing is displayed in Figure 2.

Table 1.
Number of images of each type of defect in the dataset.
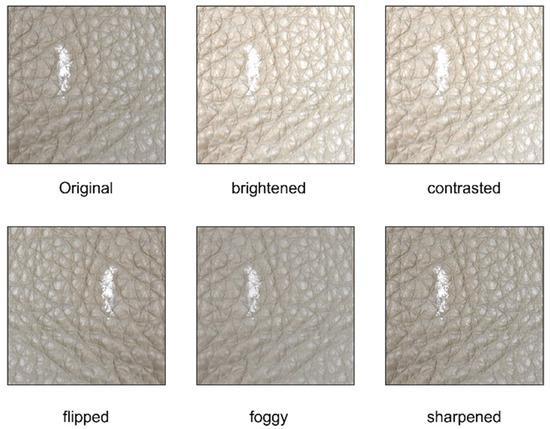
Figure 2.
Defective picture after image transformation.
3. YOLOv8
YOLOv8 is one of the most cutting-edge object detection models, with exceptional detection speed and precision, surpassing most current models. In this research, we utilized YOLOv8 as a base model for further refinement. As shown in Figure 3, the YOLOv8 architecture consists of a backbone and a head, further divided into a neck network and a detection head. The backbone employs the CSPDarknet-53 architecture to improve feature extraction and reduce computational load through hierarchical partitioning and gradient guidance. The neck part incorporates the FPN [21] (Feature Pyramid Network) and PAN [22] (Path Aggregation Network) structures to promote feature fusion, effectively integrating feature maps using upsampling techniques. The detection head adopts an anchor-free detection approach, abandoning the traditional anchor-based method for direct estimation of the object’s center and dimensions, simplifying the detection process and increasing efficiency, positioning it as a leading algorithm among one-stage algorithms.
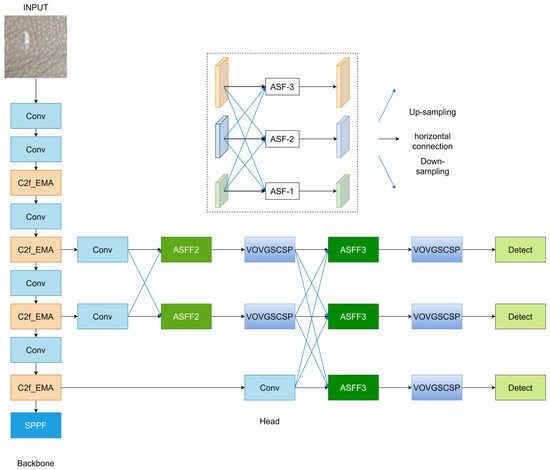
Figure 3.
Structure of the YOLOv8-age algorithm.
4. Improved YOLOv8-AGE Algorithm
Although the detection accuracy and speed of YOLOv8 have reached an excellent level, its performance in multi-scale detection and resistance to leather texture interference remains insufficient. Additionally, there is considerable room for improvement in its parameters and computational complexity. Therefore, this paper introduces the AFPN, VoV-GSCSP module, EMA, and a lightweight shared parameter detection head to enhance the YOLOv8 model. The structure of the improved model is shown in Figure 3.
4.1. AFPN
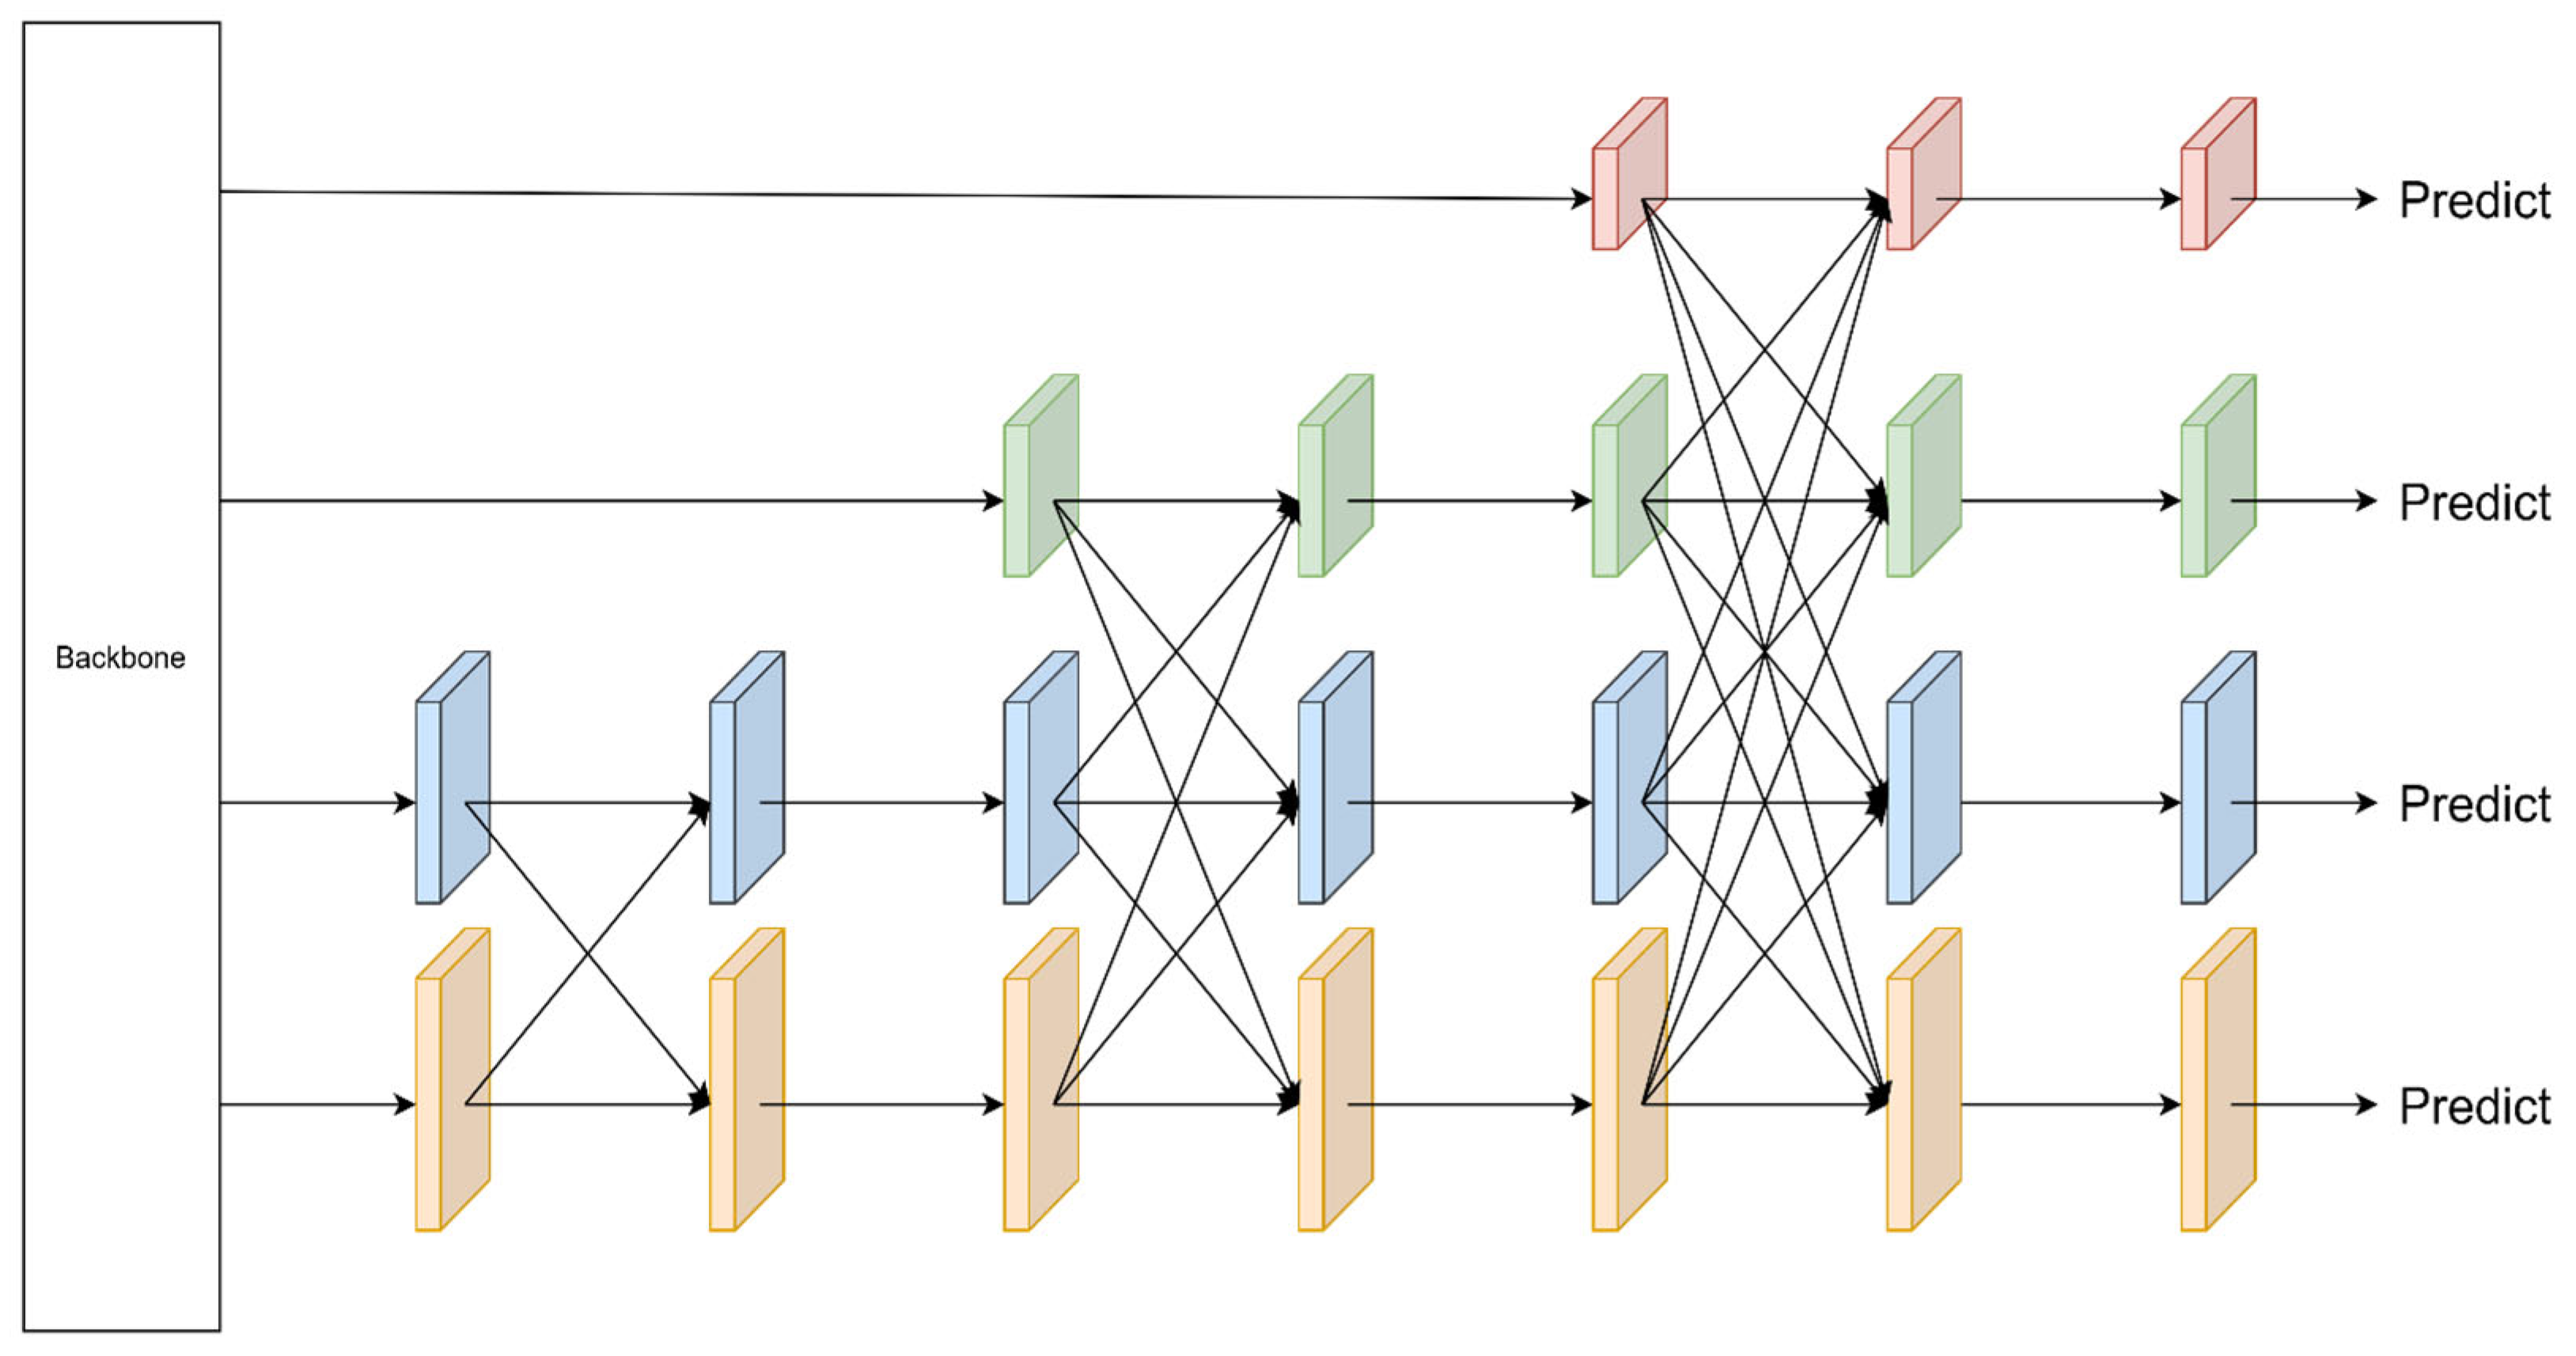
The scale of different defects in leather varies significantly. Moreover, the same type of defects also exhibits multiple aspect ratios. Therefore, enhancing the model’s performance in handling multiple scales can be effective in detecting leather defects. YOLOV8 adopts the PA-FPN concept, which utilizes top-down and bottom-up Feature Pyramid Networks. However, this approach leads to the loss and degradation of feature information during the transmission and fusion process, impairing the fusion of features at non-adjacent levels. Therefore, this study introduces the AFPN structure to improve the utilization efficiency of feature information. The AFPN structure is illustrated in Figure 4.
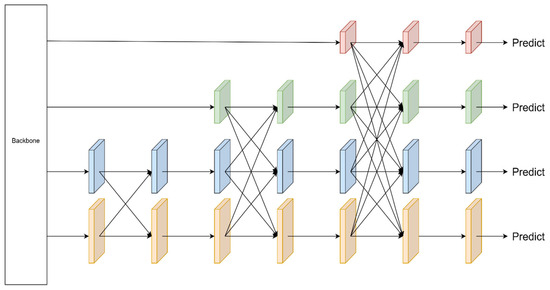
Figure 4.
Structure of the AFPN.
Two low-level features are first input for Adaptive Spatial Fusion, followed by high-level features one by one. At the end of the feature fusion, a set of multi-scale features is output. To ensure the consistency of dimensionality during feature fusion, AFPN adopts convolution kernels with different step sizes to achieve multiple scales of downsampling. Specifically, a 2 × 2 convolutional kernel with a step size of 2 was used for 2-fold downsampling, a 4 × 4 convolutional kernel with a step size of 4 for 4-fold downsampling, and an 8 × 8 convolutional kernel with a step size of 8 for 8-fold downsampling. The AFPN structure takes four sets of input features {C2, C3, C4, C5} and processes them to output a set of features {P2, P3, P4, P5}. Since YOLO only inputs {C3, C4, C5} into the feature pyramid, the improved structure proposed in this study is shown in Figure 5.
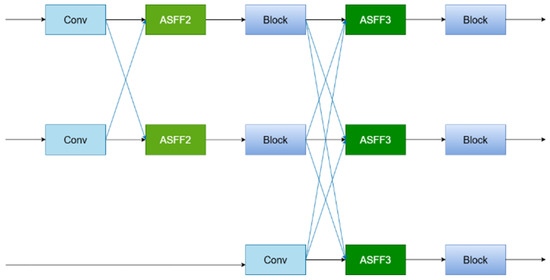
Figure 5.
Schematic diagram of the ASFF structure.
The keyword of AFPN is progressive fusion, utilizing the ASF (Adaptive Spatial Fusion) module. After the different feature inputs are aligned dimensionally through sampling, the weight vectors for each feature are computed using a 1 × 1 convolution. These vectors are then concatenated, and a 1 × 1 convolution computes the fusion weights, which are then normalized using softmax. The output weights are then used to weight and sum the feature maps to obtain the fused feature map. Finally, the feature map is processed using a 3 × 3 convolution and then output.
The adaptive fusion process set to be the feature vector from layer n to layer l at position (i, j) and to be the result of the fusion. For example, in Equation (1), is defined by a linear combination of , , , and , , when performing feature fusion of three layers as in Equation (1).
, and are the weights of the three layers in level l and satisfy Equation (2).
4.2. VoV-GSCSP Module
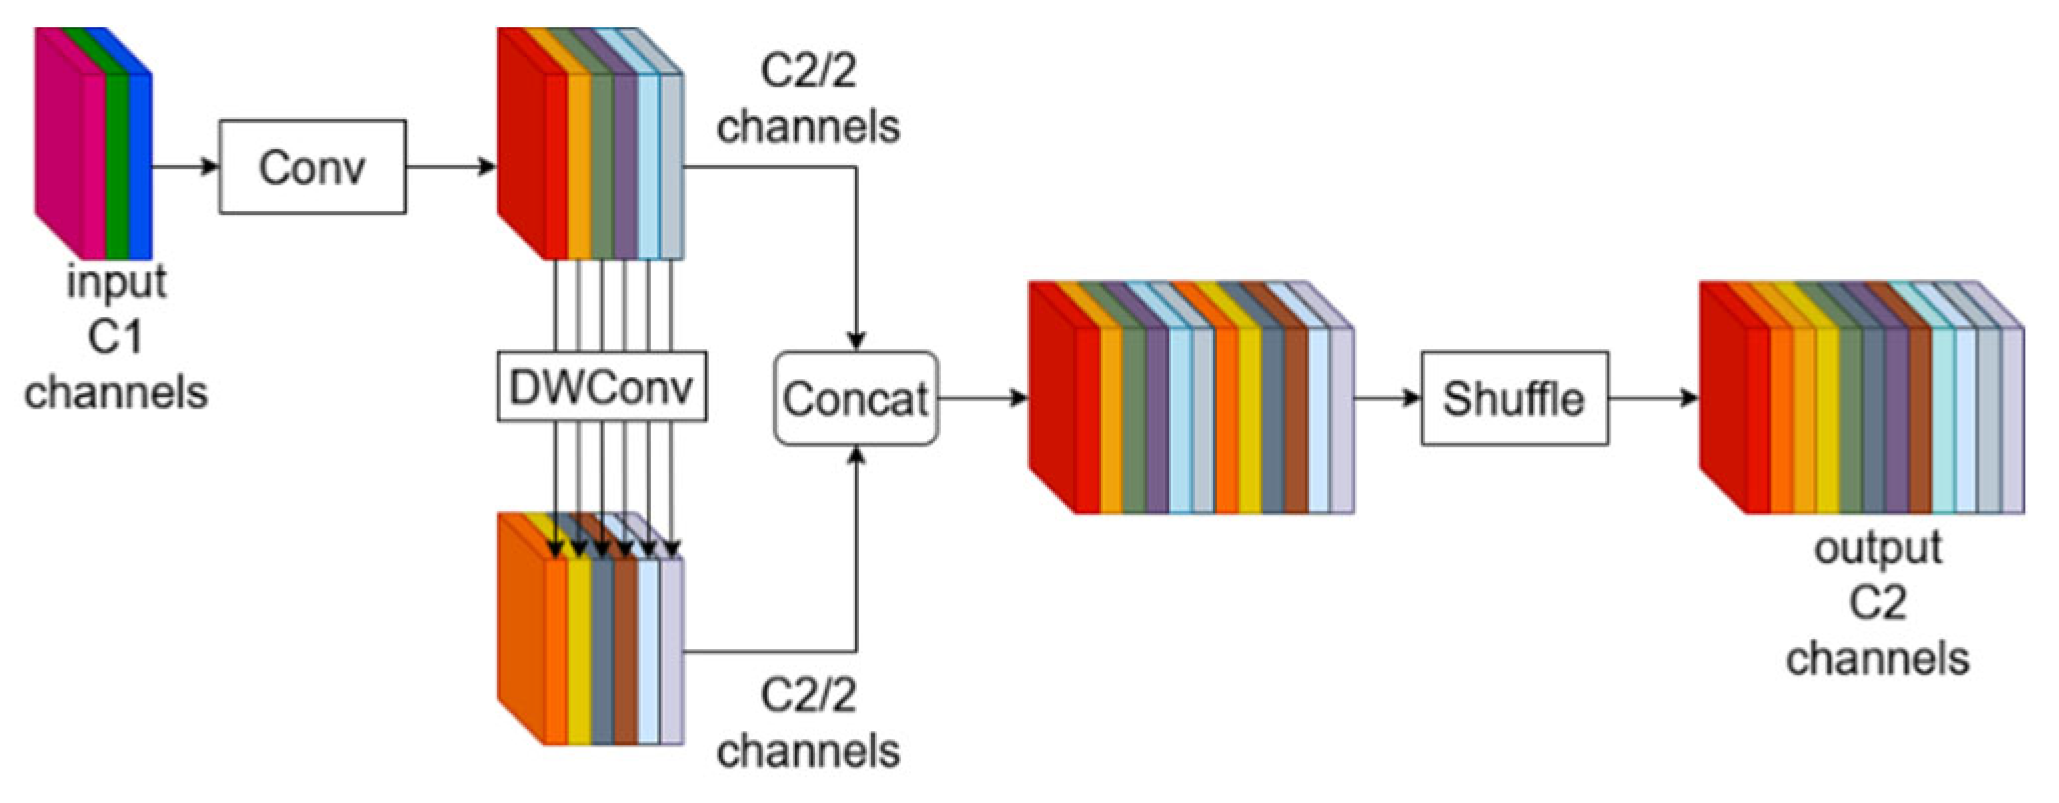
Given that the detection of leather defects is typically performed in real time, it is crucial to lighten the model. In this study, the original C2f modules were replaced by the VoV-GSCSP module, which was constructed using GSConv. Compared to Sconv (Standard Convolution), DSC (Depthwise Separable Convolution) significantly reduces the number of parameters and floating point operations. However, the separation of channel information in the input features during DSC computation can lead to information loss in deeper networks. Therefore, a new convolution module, GSConv, which incorporates both SConv and DSC, is introduced. The structure of GSConv is shown in Figure 6.
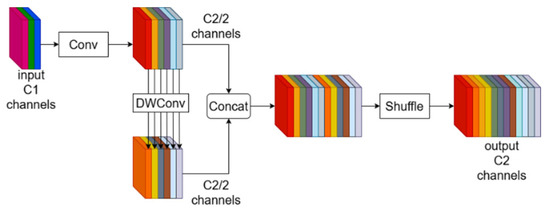
Figure 6.
Structure of GSConv.
GSConv integrates SC-processed information into DSC-processed information through shuffling, retaining the high performance of SC while maintaining the lightweight advantage of DSC. The structures of the GSBottleneck module and VoV-GSCSP, designed based on GSConv, are shown in Figure 7.
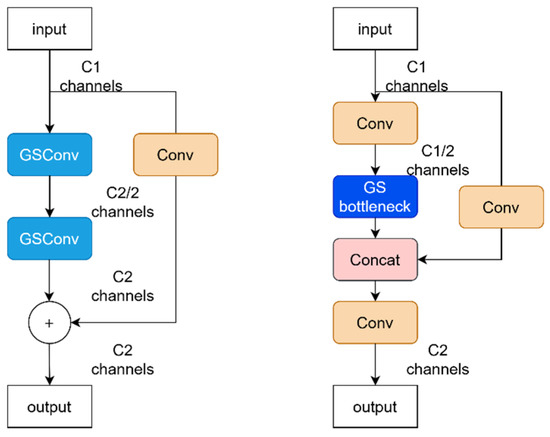
Figure 7.
GSBottleneck module and VoV-GSCSP architecture.
In the neck section, the VoV-GSCSP module replaces the Block module in the AFPN architecture. This results in the construction of an AFPN-VoV neck structure, which offers improved multi-scale detection performance while using fewer parameters. The progressive feature fusion strategy of AFPN adaptively aggregates detailed cues from features at various scales, enabling more precise feature representation. For small defects, whose characteristics are often subtle, features at different scales may encompass distinct detail information. Through progressive feature fusion, these details from various scales can be effectively integrated, thereby more accurately representing the features of small defects and enhancing detection accuracy. The robust feature extraction capability of the VoV-GSCSP module adeptly captures the features of small defects, providing enhanced feature representation for AFPN’s feature fusion. Consequently, the combination of these two components significantly strengthens the detection capability for small defects. This allows the model to achieve superior multi-scale detection performance with a more parameter-efficient approach.
4.3. EMA
In the development of attention mechanisms, both channel attention and spatial attention have been shown to be highly effective in producing more discriminative features. However, channel attention primarily focuses on the channel dimension and may overlook important spatial information. On the other hand, spatial attention requires more computational resources.
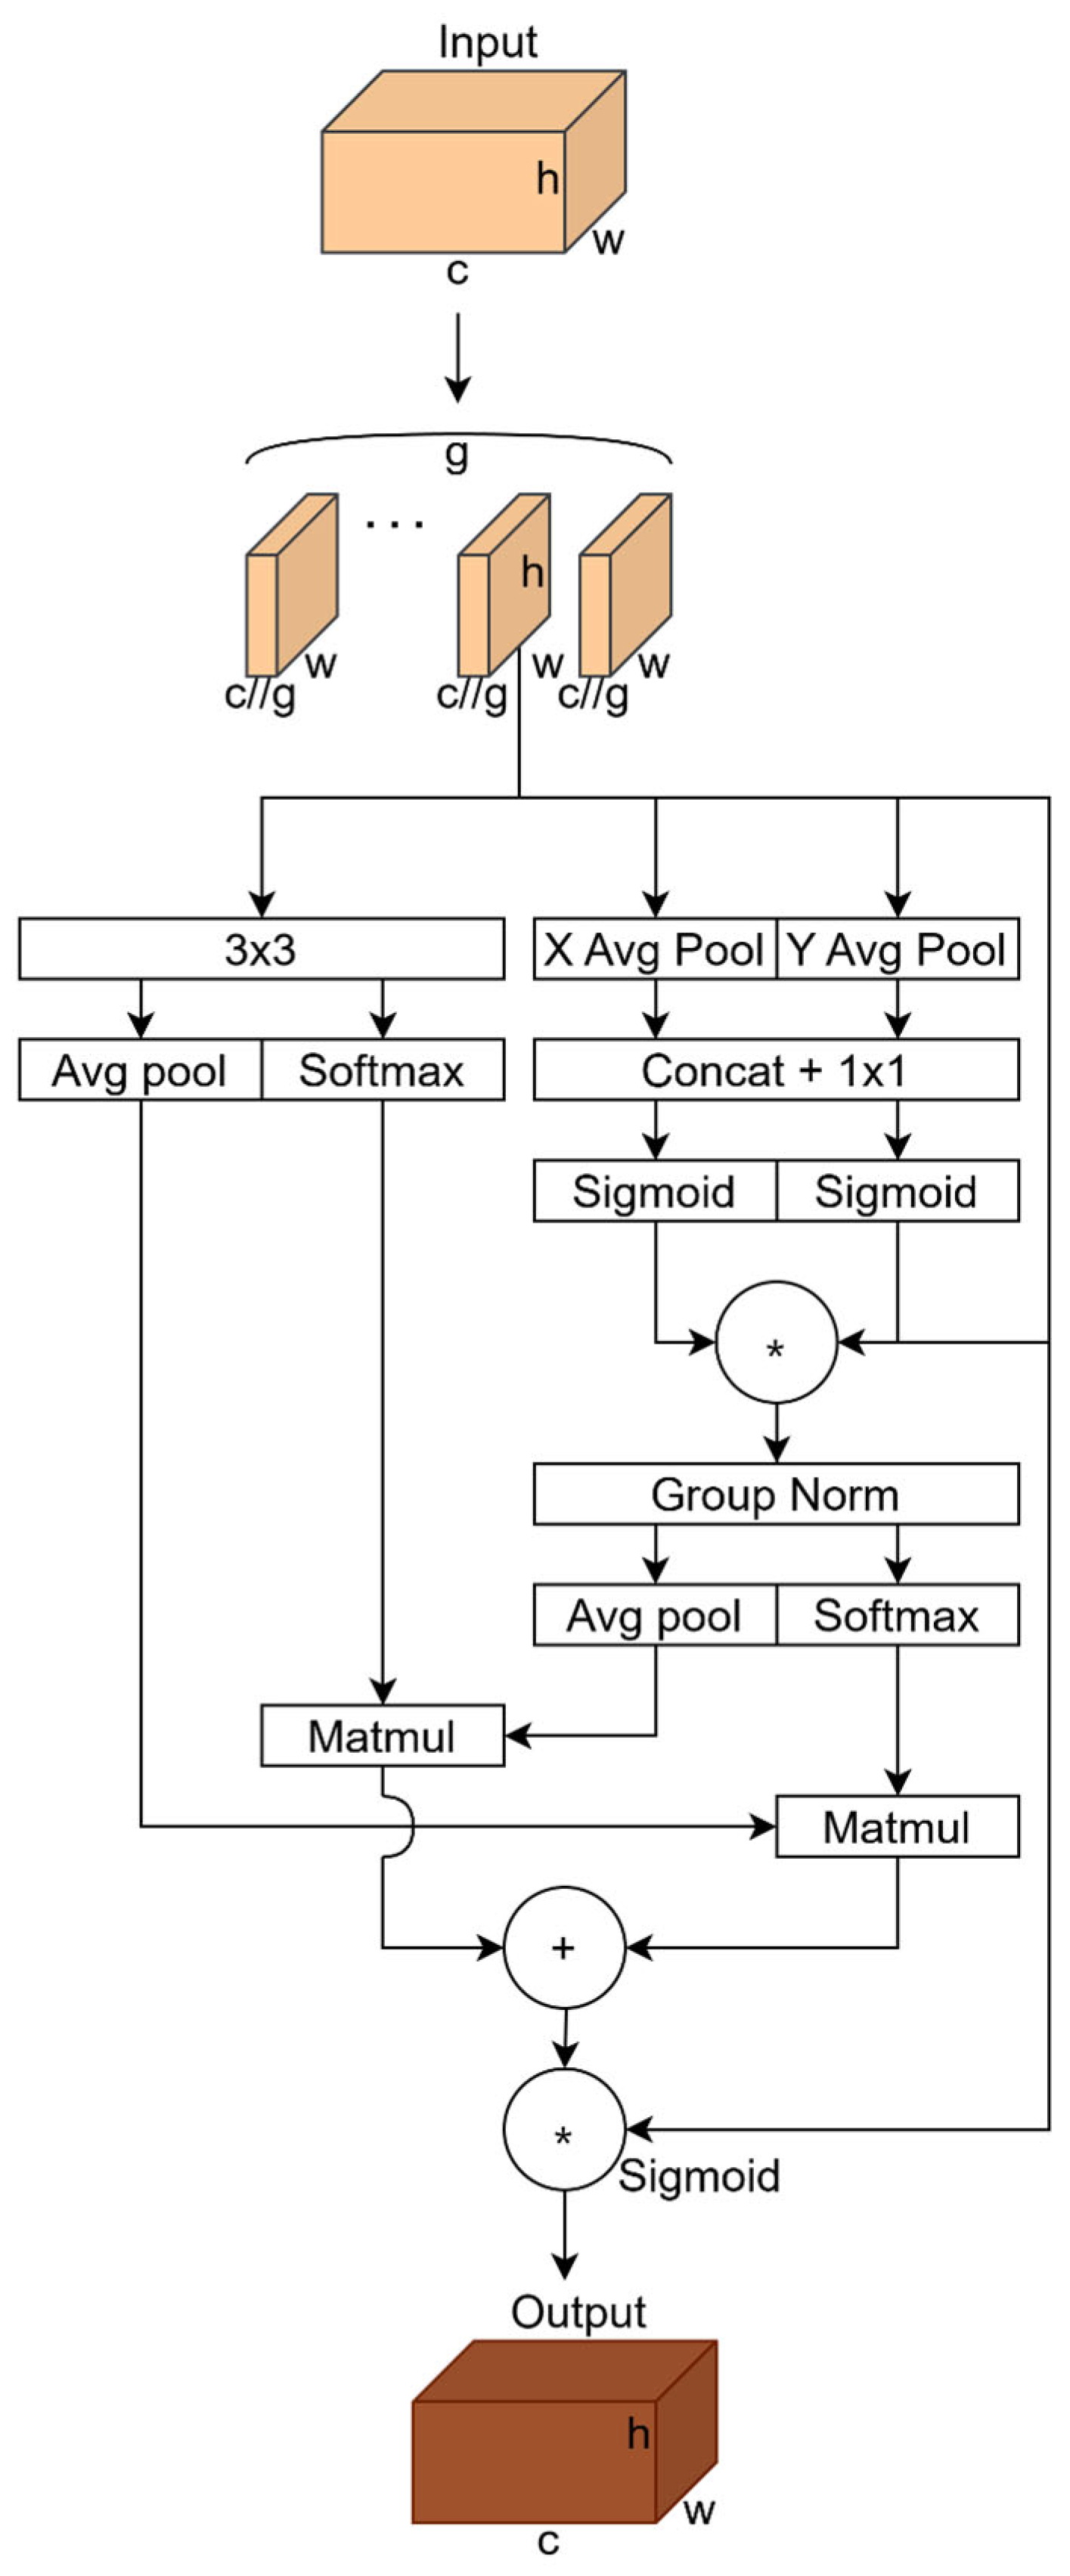
To address this, an Efficient Multi-scale Attention mechanism (EMA) was introduced in this study. To address the interference of background texture in defective samples, the attention mechanism can better focus on key regions in the image, thereby improving defect detection accuracy. The structure of the EMA is shown in Figure 8.
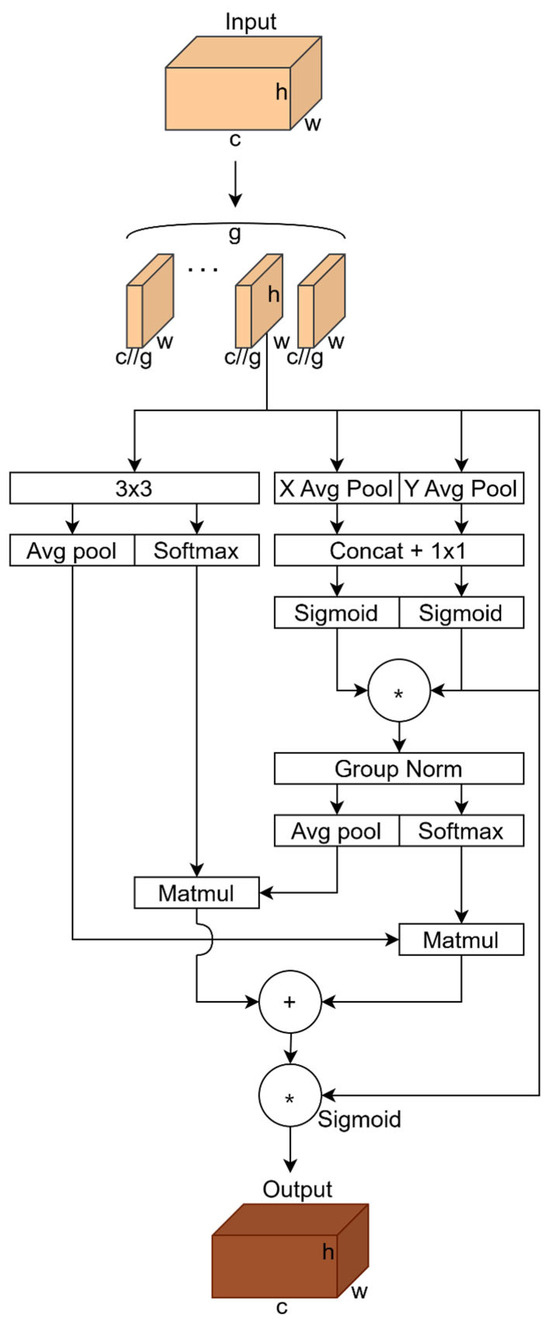
Figure 8.
Structure of EMA (* stands for Re-weight).
The EMA consists of three parallel paths: two 1 × 1 convolutional branches and one 3 × 3 convolutional branch. The 1 × 1 and 3 × 3 branches in the EMA module collaborate to enhance feature representation. The 1 × 1 branch encodes channel information across two spatial dimensions using two 1D global averaging pooling operations and then merges the features through 1 × 1 convolution to aggregate channel attention maps, enhancing cross-channel interactions among different subfeatures. Conversely, the 3 × 3 branch captures local cross-channel interactions using a 3 × 3 convolutional kernel, expands the feature space, and focuses on multi-scale feature representations to enhance detail perception. The cross-space learning approach further aggregates the outputs of the 1 × 1 and 3 × 3 branches, encodes global spatial information through 2D global average pooling, and fuses spatial information at different scales using matrix dot product operations. Finally, it generates spatial attention maps that capture pixel-level pairwise relationships and highlight the global context, thereby improving the model’s accuracy in detecting regions of interest.
Compared to SE, EMA not only captures channel information but also takes into account direction-related positional information, which aids the model in better localization and recognition of targets. Additionally, EMA is flexible and lightweight enough to be easily integrated into the core structure of mobile networks and can serve as a pre-trained model for various tasks, such as detection and segmentation, where it demonstrates performance improvements. In contrast to CBAM, EMA achieves performance enhancement while maintaining a low additional computational cost, with a design that considers computational efficiency. It employs global pooling and simple convolutional operations, enabling performance improvements without incurring excessive computational expenses.
Additionally, the C2f module within the Yolov8 Backbone is capable of processing and transforming the features of input data, generating outputs with enhanced representational power, thereby improving the network’s performance and representational capabilities. The C2f module extracts and transforms the features of input data through operations such as feature transformation, branch processing, and feature fusion. It first passes the input data through a convolutional layer, then segments the results according to a specified size, storing them in a list. Subsequently, these segments are further processed through a Bottleneck module, and finally concatenated along dimension 1. The concatenated results are then passed through another convolutional layer to obtain the final output. This design enables the C2f module to effectively extract features and enhance the model’s detection capabilities for objects of varying scales.
In summary, the EMA module enhances feature representation, while the C2f module provides robust feature fusion capabilities. The combination of these two modules can more effectively extract and utilize the interdependencies among features, thereby improving the accuracy of feature extraction. In leather defect detection, this synergy is particularly crucial, as there are subtle differences between leather defects and textures that require the model to have high-precision discrimination capabilities. The integration of EMA and C2f enhances the model’s ability to distinguish between leather defects and textures, improving the detection accuracy of the regions of interest through more refined attention mechanisms and feature fusion. Consequently, the combination of EMA and C2f not only improves model performance but also strengthens the model’s ability to differentiate between leather defects and textures, which is essential for enhancing the accuracy and efficiency of leather defect detection.
In this study, the EMA mechanism is introduced into the C2F module of the backbone, forming the C2F_EMA module. As shown in Figure 9, the structure of EMA is embedded within the C2F module. This study uses the C2F_EMA module to replace the original C2F module, enhancing the model’s feature extraction capability.
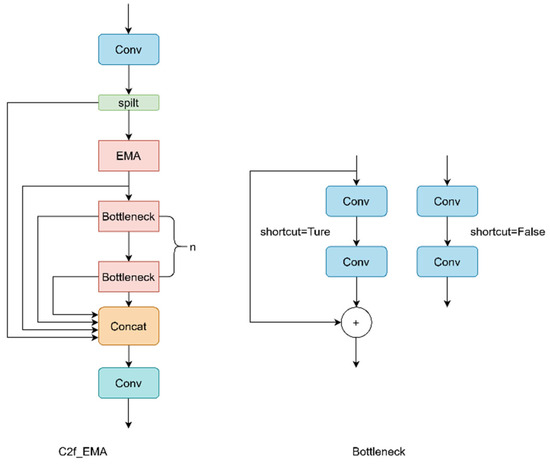
Figure 9.
Structure of C2F_EMA.
4.4. Head for Shared Parameters
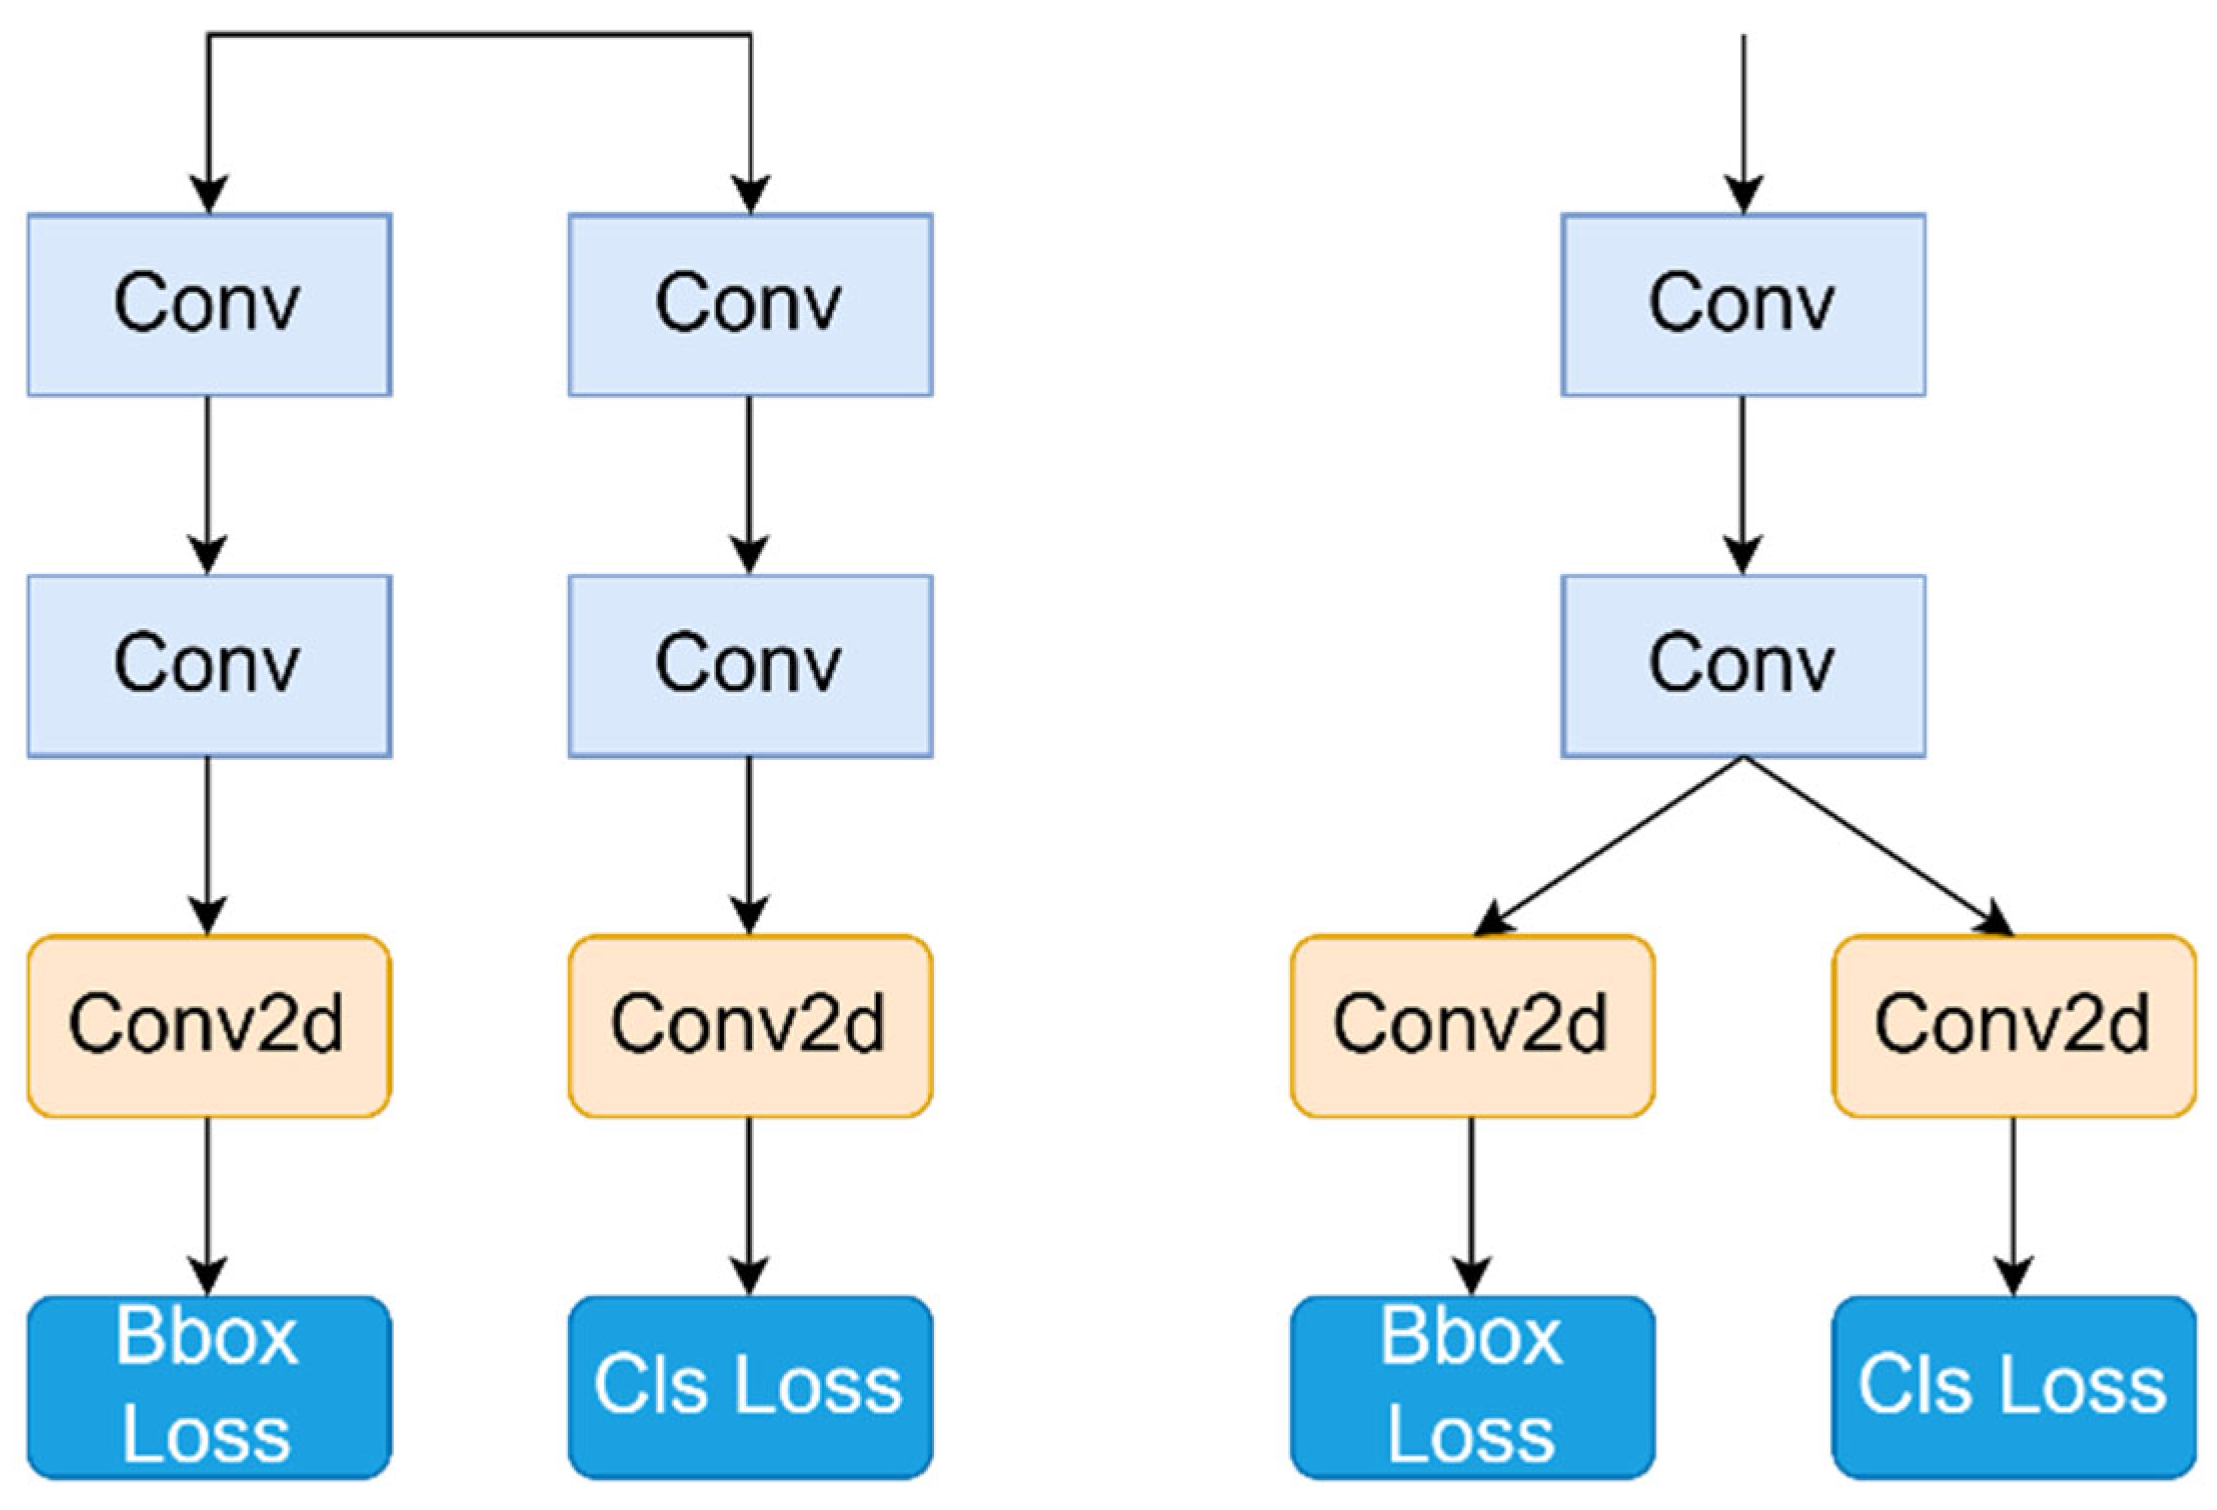
The number of parameters in the detection head of YOLOV8 constitutes one-third of the total model parameters. Structurally, the current popular decoupling design separates category classification from target detection functions. This decoupled head structure enhances feature extraction capabilities, especially beneficial when handling numerous detection categories. However, since this study only involves three detection categories, the concept of shared parameters is introduced to streamline improvements in the detection head. Initially, the original detection head is split into two branches.
Each branch starts with two 3 × 3 convolutional layers for feature extraction, followed by a Conv2d layer for each feature stream, and independently calculates category classification and bounding box regression losses. The lightweight detection head shares parameters from the first two convolutions of each branch, while the subsequent structure remains unchanged. Figure 10 illustrates the structure of the detection head before and after modification.
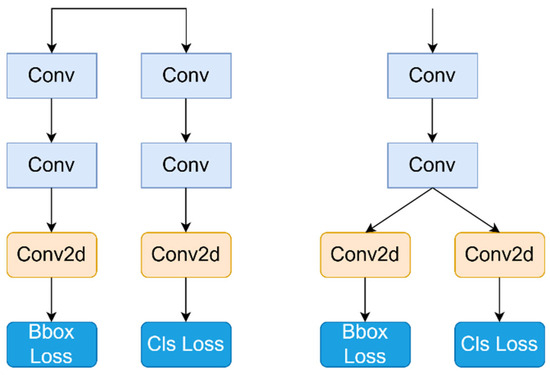
Figure 10.
On the left is the detection header before the modification, and on the right is the detection header for the modified shared parameter.
5. Experiments and Results
5.1. Experimental Configuration
To ensure a fair comparison of experimental results, all experiments in this study were conducted on the same computer. The specific configuration of the experimental environment is detailed in Table 2.
Table 2.
Experimental environment.
5.2. Assessment of Indicators
In defect detection tasks, models are typically evaluated using metrics such as P (precision), R (recall), mAP (mean average precision), Params (parameters), and GFLOP (gigafloating point operations per second). P measures the proportion of correctly predicted positive samples out of all predicted positive samples by the model. Higher precision indicates fewer false positives. R also known as True Positive Rate or sensitivity, measures the proportion of actual positive samples that are correctly identified by the model. A higher recall rate indicates fewer false negatives (missed positive samples). The formulas for P and R are given by Equations (3) and (4), where TP is the number of true positives, FP is the number of false positives, and FN is the number of false negatives.
Based on the values of P and R, a P-R curve can be plotted, and integrating this curve yields the detection accuracy for a single category in the dataset, denoted as AP (average precision). The AP values are averaged across all categories by summing the APs. The mAP is obtained by summing the APs of all categories. The formulas for calculating AP and mAP are provided in Equations (5) and (6):
5.3. Ablation Experiments
The YOLOV8n model serves as a benchmark to evaluate the effectiveness of each module’s improvement strategy. We integrated the improved modules into the YOLOV8 model and conducted ablation experiments, the results of which are presented in Table 3.
Table 3.
The ticked parts indicate that the corresponding modules have been added to the original model; the first row is the result of the original model, and the last row is the result of the final improved model. AFPN stands for Asymptomatic Feature Pyramid Network, VoV-GSCSP stands for modules containing Grouped Shuffle Convolution, EMA stands for Efficient Multi-scale Attention, and target refers to the shared parameter detection head.
As shown in the table, adding each of the four modules separately slightly improves the model’s mAP50. In particular, when the VoV-GSCSP module was used alone, the mAP50 and mAP95 metrics improved by up to 0.86% and 1.36% compared to the original model, respectively. This indicates that the VoV-GSCSP module can effectively enhance the model’s accuracy and detection performance. When EMA was incorporated individually, the model’s mAP50 increased by 1.18%, but the number of Parameters (Params) and Floating Point Operations (FLOPs) increased by 1.33% and 3.7%, respectively. This suggests that while EMA significantly improves the model’s detection capabilities, it also introduces complexity to the model. Replacing the PAFPN structure with AFPN in the model’s neck reduced parameters by 14.0%. Enhancing the shared parameter detection head decreased mAP95 by 0.41% compared to the original one while achieving the most significant reduction in GFLOPs by 19.75%. Incorporating both the VoV-GSCSP module and the EMA attention mechanism resulted in the model achieving its highest mAP95 of 0.747, an improvement of 1.77% over the original model. This synergy significantly enhances high-accuracy target detection. Our final model improved mAP50 by 1.39% and mAP95 by 0.14%, while reducing Params and FLOPs by 9.3% and 7.4%, respectively, compared to the original model. The improved model effectively reduced computational complexity while enhancing detection accuracy. Finally, in terms of detection speed FPS, the improved model improved 3.03% over the original model.
To assess the impact of model enhancements on the detection accuracy of different defect types, Table 4 presents the detection accuracy of the YOLOV8 model, YOLOV8 with each module added separately, and the final improved model in this study for each defect type. The table illustrates that each separately added module enhances the detection of most defects. Specifically, in the case of hole defects, the GSConv module demonstrated the most significant improvement, with an accuracy increase of 0.94% compared to the original model. This confirms the substantial beneficial effect of GSConv on the detection of small targets. For scratch defects and fold defects, which are characterized by multi-scale variable aspect ratios and difficulty in being distinguished from the natural texture of leather, the introduction of EMA resulted in detection accuracy improvements of 2.13% and 2.16%, respectively, compared to the original model. After incorporating AFPN, the detection accuracy for these two categories improved by 1.01% and 0.57%, respectively, compared to the original model. This indicates that the introduction of EMA and AFPN has a positive effect on the model’s multi-scale detection capabilities. Finally, for dirt defects, there was no significant improvement after the addition of the modules, possibly because dirt defects are relatively simple and easy to detect, and the original model already performs well in detecting them.
Table 4.
Data on individual defects.
5.4. Comparative Experiment
To evaluate the performance of the enhanced model, this study conducted comparison experiments with several other target detection models, including YOLOv5n, YOLOv6n, YOLOv7-tiny, YOLOv8s, SSD [23] and YOLOv8n. Table 5 shows that the improved YOLOV8-AGE model achieves the highest precision (P), recall (R), and mean average precision (mAP) on the leather dataset. The YOLOv8s model achieves the second highest mAP at 0.944, whereas the YOLOV8-AGE model has 75.47% fewer parameters and 73.59% fewer GFLOPs compared to it. This suggests that the YOLOV8-AGE model maintains a favorable balance of parameters and computational complexity while ensuring accurate volume detection. Compared to the YOLOv5n and SSD models, which have low computational resource requirements, the YOLOV8-AGE model achieves 18.72% and 1.72% higher detection accuracy, respectively.
Table 5.
Parameters of each model after training.
5.5. Other Discussions
- (1)
- In introducing EMA, this paper explores two approaches to incorporating EMA within the C2f module. The first approach is to place the EMA before the first bottleneck within the C2f module, referred to as Model A. The second approach is to place the EMA before the final convolution within the C2f module, referred to as Model B. The two methods of incorporating the EMA produced different results. Without adding other modules, the mAP50 of model A was 0.961 higher than that of model B, which was 0.956, while the parameter and GFLOPS of model A were 8.4M and 3.05, which were lower than those of model B, which were 9.3 and 3.09, respectively. These indicate that the EMA joining approach represented by model A is better than model B in terms of performance, computational complexity, etc. Therefore, this study adopts the EMA joining approach for model A, the model with the EMA incorporation method.
- (2)
- To validate the generalization capability of the model, we additionally collected 200 images of leather defects that were not included in the original leather defect dataset. On this small dataset, the original YOLOv8n defect detection achieved an mAP of 0.915. In this paper, the YOLOv8-AGE for leather defect detection achieved an mAP of 0.937, indicating that the algorithm possesses good detection capabilities and generalization performance.
- (3)
- In comparison with existing solutions, our enhanced model demonstrates several advantages. Relative to the vision transformer (ViT)-based leather defect detection method proposed by Smith et al., our approach offers a significantly reduced number of parameters and computational complexity while maintaining comparable accuracy. This makes our model more efficient and less resource-intensive. Furthermore, when contrasted with the robust leather defect detection method based on trainable guided attention proposed by Masood et al., our study presents a model with a lower parameter count and leverages the simplicity of deployment associated with the YOLO series, which is crucial for practical industrial implementation.
6. Conclusions and Future Work
A leather defect dataset was constructed comprising five common types: holes, scratches, dirt, rotten surfaces and folds. Since leather defect detection is often applied in edge devices within industrial environments, this study focused on both the detection accuracy and model size when improving the YOLOV8 algorithm. The introduction of the AFPN structure and EMA attention mechanism enhances the model’s feature sensitivity and multi-scale detection capabilities, thereby improving detection performance. The application of VoV-GSCSP and a lightweight detection head balances the increased model parameter size and computational complexity. The improved model has reduced model parameters and GFLOPs. On one hand, this reduces computational load and memory access, increases hardware cache utilization, and enhances opportunities for parallel computing, effectively improving the inference speed on typical industrial hardware. On the other hand, it has a multifaceted positive impact on model deployment optimization, including reducing hardware costs, increasing deployment flexibility, accelerating deployment speed, and optimizing energy consumption, thus better meeting various needs and enhancing overall efficiency in practical application scenarios. However, the improved YOLOV8-AGE model still has some deficiencies in detecting scratch and fold defects; the model’s ability to distinguish between scratch, fold, and the natural texture of leather is not strong enough, with detection accuracy for scratch and fold defects being lower than that for hole and dirt defects. In the future, we will continue to research how to enhance the model’s resistance to interference from the natural texture of leather.
Author Contributions
Conceptualization, Z.P. and C.Z.; methodology, W.W. and C.Z.; software, Z.P.; validation, Z.P.; formal analysis, Z.P.; investigation, Z.P.; resources, C.Z.; data curation, Z.P.; writing—original draft preparation, Z.P.; writing—review and editing, Z.P.; visualization, Z.P.; supervision, C.Z. and W.W.; project administration, C.Z. and W.W.; funding acquisition, C.Z. All authors have read and agreed to the published version of the manuscript.
Funding
This research was funded by the National Natural Science Foundation of China (grant number 61702384).
Institutional Review Board Statement
Not applicable.
Informed Consent Statement
Not applicable.
Data Availability Statement
The data used in this study can be obtained from the first author at maopzr@wust.edu.cn with a reasonable request.
Conflicts of Interest
The authors declare no conflicts of interest.
References
- Gan, Y.S.; Liong, S.T.; Zheng, D.; Xia, Y.; Wu, S.; Lin, M.; Huang, Y.C. Detection and localization of defects on natural leather surfaces. J. Ambient. Intell. Humaniz. Comput. 2023, 14, 1785–1799. [Google Scholar] [CrossRef]
- Aslam, M.; Khan, T.M.; Naqvi, S.S.; Holmes, G.; Naffa, R. On the Application of Automated Machine Vision for Leather Defect Inspection and Grading: A Survey. IEEE Access 2019, 7, 176065–176086. [Google Scholar] [CrossRef]
- Limas-Serafim, A.F. Natural images segmentation for patterns recognition using edges pyramids and its application to the leather defects. In Proceedings of the IECON ’93—19th Annual Conference of IEEE Industrial Electronics, Maui, HI, USA, 15–19 November 1993; Volume 1353, pp. 1357–1360. [Google Scholar]
- Lovergine, F.P.; Branca, A.; Attolico, G.; Distante, A. Leather inspection by oriented texture analysis with a morphological approach. In Proceedings of the International Conference on Image Processing, Dublin, Ireland, 26–29 October 1997; Volume 662, pp. 669–671. [Google Scholar]
- Branca, A.; Lovergine, F.P.; Attolico, G.; Distante, A. Defect detection on leather by oriented singularities. In Proceedings of the Computer Analysis of Images and Patterns, Berlin, Heidelberg, 10–12 September 1997; pp. 223–230. [Google Scholar]
- Sobral, J.L. Leather Inspection Based on Wavelets. In Proceedings of the Pattern Recognition and Image Analysis, Berlin/Heidelberg, Germany, 7–9 June 2005; pp. 682–688. [Google Scholar]
- Jawahar, M.; Babu, N.K.C.; Vani, K. Leather texture classification using wavelet feature extraction technique. In Proceedings of the 2014 IEEE International Conference on Computational Intelligence and Computing Research, Coimbatore, India, 18–20 December 2014; pp. 1–4. [Google Scholar]
- He, F.Q.; Wang, W.; Chen, Z.C. Automatic visual inspection for leather manufacture. Key Eng. Mater. 2006, 326, 469–472. [Google Scholar] [CrossRef]
- Haralick, R.M. Statistical and structural approaches to texture. Proc. IEEE 1979, 67, 786–804. [Google Scholar] [CrossRef]
- Smith, A.D.; Du, S.; Kurien, A. Vision Transformers for Anomaly Detection and Localisation in Leather Surface Defect Classification Based on Low-Resolution Images and a Small Dataset. Appl. Sci. 2023, 13, 8716. [Google Scholar] [CrossRef]
- Aslam, M.; Naqvi, S.S.; Khan, T.M.; Holmes, G.; Naffa, R. Trainable guided attention based robust leather defect detection. Eng. Appl. Artif. Intell. 2023, 124, 106438. [Google Scholar] [CrossRef]
- Deng, J.; Liu, J.; Wu, C.; Zhong, T.; Gu, G.; Ling, B.W.K. A Novel Framework for Classifying Leather Surface Defects Based on a Parameter Optimized Residual Network. IEEE Access 2020, 8, 192109–192118. [Google Scholar] [CrossRef]
- Chen, Z.; Zhu, Q.; Zhou, X.; Deng, J.; Song, W. Experimental Study on YOLO-Based Leather Surface Defect Detection. IEEE Access 2024, 12, 32830–32848. [Google Scholar] [CrossRef]
- Li, C.; Li, L.; Jiang, H.; Weng, K.; Geng, Y.; Li, L.; Ke, Z.; Li, Q.; Cheng, M.; Nie, W.; et al. YOLOv6: A single-stage object detection framework for industrial applications. arXiv 2022, arXiv:2209.02976. [Google Scholar]
- Jocher, G. YOLOv5 by Ultralytics. February 2020. [Online]. Available online: https://github.com/ultralytics/yolov5 (accessed on 15 March 2024.).
- Wang, C.Y.; Bochkovskiy, A.; Liao, H.Y.M. YOLOv7: Trainable Bag-of-Freebies Sets New State-of-the-Art for Real-Time Object Detectors. In Proceedings of the 2023 IEEE/CVF Conference on Computer Vision and Pattern Recognition (CVPR), Vancouver, BC, Canada, 17–24 June 2023; pp. 7464–7475. [Google Scholar]
- Jocher, G.; Chaurasia, A.; Qiu, J. YOLO by Ultralytics. February 2023. [Online]. Available online: https://github.com/ultralytics/ (accessed on 15 March 2024.).
- Ouyang, D.; He, S.; Zhang, G.; Luo, M.; Guo, H.; Zhan, J.; Huang, Z. Efficient Multi-Scale Attention Module with Cross-Spatial Learning. In Proceedings of the ICASSP 2023—2023 IEEE International Conference on Acoustics, Speech and Signal Processing (ICASSP), Rhodes Island, Greece, 4–10 June 2023; pp. 1–5. [Google Scholar]
- Yang, G.; Lei, J.; Zhu, Z.; Cheng, S.; Feng, Z.; Liang, R. AFPN: Asymptotic feature pyramid network for object detection. In Proceedings of the 2023 IEEE International Conference on Systems, Man, and Cybernetics (SMC), Maui, HI, USA, 1–4 October 2023; pp. 2184–2189. [Google Scholar]
- Li, H.; Li, J.; Wei, H.; Liu, Z.; Zhan, Z.; Ren, Q. Slim-neck by GSConv: A better design paradigm of detector architectures for autonomous vehicles. arXiv 2022, arXiv:2206.02424. [Google Scholar]
- Lin, T.-Y.; Dollár, P.; Girshick, R.; He, K.; Hariharan, B.; Belongie, S. Feature pyramid networks for object detection. In Proceedings of the IEEE Conference on Computer Vision and Pattern Recognition, Honolulu, HI, USA, 21–26 July 2017; pp. 2117–2125. [Google Scholar]
- Liu, S.; Qi, L.; Qin, H.; Shi, J.; Jia, J. Path aggregation network for instance segmentation. In Proceedings of the IEEE Conference on Computer Vision and Pattern Recognition, Salt Lake City, UT, USA, 18–23 June 2018; pp. 8759–8768. [Google Scholar]
- Liu, W.; Anguelov, D.; Erhan, D.; Szegedy, C.; Reed, S.; Fu, C.-Y.; Berg, A.C. Ssd: Single shot multibox detector. In Proceedings of the Computer Vision—ECCV 2016: 14th European Conference, Amsterdam, The Netherlands, 11–14 October 2016; Proceedings, Part I 14. pp. 21–37. [Google Scholar]


Disclaimer/Publisher’s Note: The statements, opinions and data contained in all publications are solely those of the individual author(s) and contributor(s) and not of MDPI and/or the editor(s). MDPI and/or the editor(s) disclaim responsibility for any injury to people or property resulting from any ideas, methods, instructions or products referred to in the content. |
© 2024 by the authors. Licensee MDPI, Basel, Switzerland. This article is an open access article distributed under the terms and conditions of the Creative Commons Attribution (CC BY) license (https://creativecommons.org/licenses/by/4.0/).