Article

A Tunable and Switchable Multi-Wavelength Erbium-Doped Fiber Laser Based on a Curvature Mach–Zehnder Interferometer Filter Using Thin-Core Fiber

by
Christian Perezcampos-Mayoral
1,*,
Jaime Gutiérrez-Gutiérrez
2,*,
José Luis Cano-Pérez
1,
Marciano Vargas-Treviño
2,
Lorenzo Tepech-Carrillo
2,
Erick Israel Guerra-Hernández
2,
Itandehui Belem Gallegos-Velasco
1,
Pedro Antonio Hernández-Cruz
1,
Eeduardo Pérez-Campos-Mayoral
1,
Victor Hugo Ojeda-Meixueiro
3,
Julián Moisés Estudillo-Ayala
4,
Juan Manuel Sierra-Hernandez
4 and
Roberto Rojas-Laguna
4
1
Facultad de Medicina y Cirugía, Universidad Autónoma “Benito Juárez” de Oaxaca (FMC-UABJO), Ex Hacienda de Aguilera S/N, Calz. San Felipe del Agua, Oaxaca de Juárez C.P. 68050, Mexico
2
Facultad de Sistemas Biológicos e Innovación Tecnológica, Universidad Autónoma “Benito Juárez” de Oaxaca (FASBIT-UABJO), Av. Universidad S/N, Ex-Hacienda 5 Señores, Oaxaca de Juárez C.P. 68120, Mexico
3
División de Estudios de Posgrado e Investigación, Tecnológico Nacional de México, Campus Oaxaca, Avenida Ing. Víctor Bravo Ahuja No. 125 Esquina Calzada Tecnológico, Oaxaca de Juárez C.P. 68030, Mexico
4
Departamento de Electrónica, División de Ingenierías, Universidad de Guanajuato, Carretera Salamanca-Valle de Santiago km 3.5 + 1.8, Comunidad de Palo Blanco, Salamanca C.P. 36885, Mexico
*
Authors to whom correspondence should be addressed.
Appl. Sci. 2024, 14(24), 11578; https://doi.org/10.3390/app142411578
Submission received: 8 November 2024 / Revised: 30 November 2024 / Accepted: 2 December 2024 / Published: 11 December 2024
(This article belongs to the Special Issue Recent Trends in Fiber Optic Sensor: Technology and Applications)

Abstract

:
We propose and demonstrate a tunable and switchable multi-wavelength fiber ring laser configuration based on a Mach–Zehnder interferometer (MZI) filter. The MZI was fabricated using a core-offset splicing technique, with a 2 cm piece of thin-core erbium-doped fiber (TCEDF), with a core diameter of 2.90 µm, coupled in the central region of the MZI between two segments of single-mode fiber (SMF). By applying curvature to the MZI filter, we generated lasing single-, double-, triple-, and quadruple-emission lines with a curvature range from 2.3452 m−1 to 6.0495 m−1. A single-emission lasing line can be tuned from 1556.63 nm to 1564.25 nm with a tuning span of 7.62 nm and an SMSR of 49.80 dB. The laser emission can be switched to quadruple- and triple-emission lasing signals, with SMSR values of 39.96 dB and 36.83 dB, respectively. The dual-narrow emission lasing signal can be tuned from 1564.56 nm to 1561.34 nm, with an SMSR of 40.46 dB. Another lasing dual-emission signal can be tuned from 1585.69 nm to 1576.89 nm, producing an 8.8 nm tuning range, and from 1572.53 nm to 1563.66 nm, producing an 8.87 nm range, with the best SMSR of 42.35 dB.

1. Introduction

Switchable and tunable multi-wavelength fiber lasers have generated significant interest for their potential in telecommunications [1,2]. They are typically constructed from erbium-doped fiber and configured in either ring- or linear-type optical cavities [3,4,5,6,7]. In recent years, methods have been reported that can generate a stable tunable multi-wavelength and tunable range laser emission [8,9,10,11,12,13,14,15,16,17], such as polarization controllers (PCs) [18] and wavelength-selective filters (WSFs), which balance the wavelength depending on their cavity losses [8]. WSFs can be fabricated with different structures, such as fiber Bragg grating (FBG) [9] or Mach–Zehnder interferometers (MZIs) [8,10,11], and with different compounded fiber filters [12,18]. The MZI filter is fabricated by using SMF [13,14], photonic crystal fiber (PCF) [8], and thin-core fiber [10,11]. In a laser cavity, filters are used, which, by increasing curvature [8,12], temperature [9], or strain [12,15], can make a laser tunable and switchable. By utilizing three PCs, Zou, H. et al. [16] reported achieving a switchable erbium-doped fiber laser with a dual-wavelength tuning range of 3.42 nm and a side mode suppression ratio (SMSR) above 64 dB. The maximum power fluctuation and wavelength shift were 0.50 dB and 0.01 nm, respectively. Zhou et al. [18] reported a wide tuning range of 153 nm; this proposal uses a filtering mechanism in conjunction with four PCs and lasing lines with high power (57.3 dB) across single-, dual-, triple-, quadruple-, and quintuple-wavelength lines, which were adjusted using different pumping power outputs and PCs. Zhao, X. et al. [12] reported that using fiber Bragg grating together with an MZI in a laser cavity produced an emission of laser lines that can be smoothly switched from single to quadruple wavelengths from 1527.68 nm to 1550.22 nm, with an optical signal/noise ratio (OSNR) greater than 50 dB, by applying up to 258 µε of voltage to the filter. Ahmad et al. [9] present a multi-wavelength 12- and 8-line emission laser, with an OSNR of 45 dB and 47 dB, respectively, which is generated by using a Fabry–Perot interferometer (FPI) and FBG dual cavity; the tunable 8-line emission laser is obtained by using temperature increments in a span of 1 nm. Thin-core fibers (TCFs) are very efficient because they have almost no loss, as shown in the work of He, W. et al. [11], where they used one TCF to create an MZI loop and a Sagnac interferometer (SI) working in conjunction with a single-emission line tuned at 40 nm, with a 32.68 dB SMSR and a dual and triple loop with an SMSR of over 34.51 dB. A modal analysis of MZIs based on SMF and thin-core fiber was developed by Yu-Xuan et al., and high sensitivity was found in the interferometers [19]. Interferometers based on thin-core fibers have been studied in relation to curvature [20], temperature [21], and refractometers [22], among many others, with advantages in terms of low cost, simple fabrication, and relatively high sensitivity. In this work, a multi-wavelength tunable and switchable erbium-doped fiber laser based on a thin-core erbium-doped fiber (TCEDF) filter is proposed and experimentally demonstrated. By incrementing the curvature in the filter, the laser can operate as tunable for single-, dual-narrow, and dual-wavelength emissions, and it can switch between triple- and quadruple-emission wavelengths. The analysis of the stability tests for the power and wavelength fluctuation determined that the lowest were 0.67 dB and 0.10 nm; the highest were 2.86 dB and 2.57 nm, respectively. The best SMSR was 49.80 dB for a single-emission line.

2. MZI Fabrication and Filter Principle

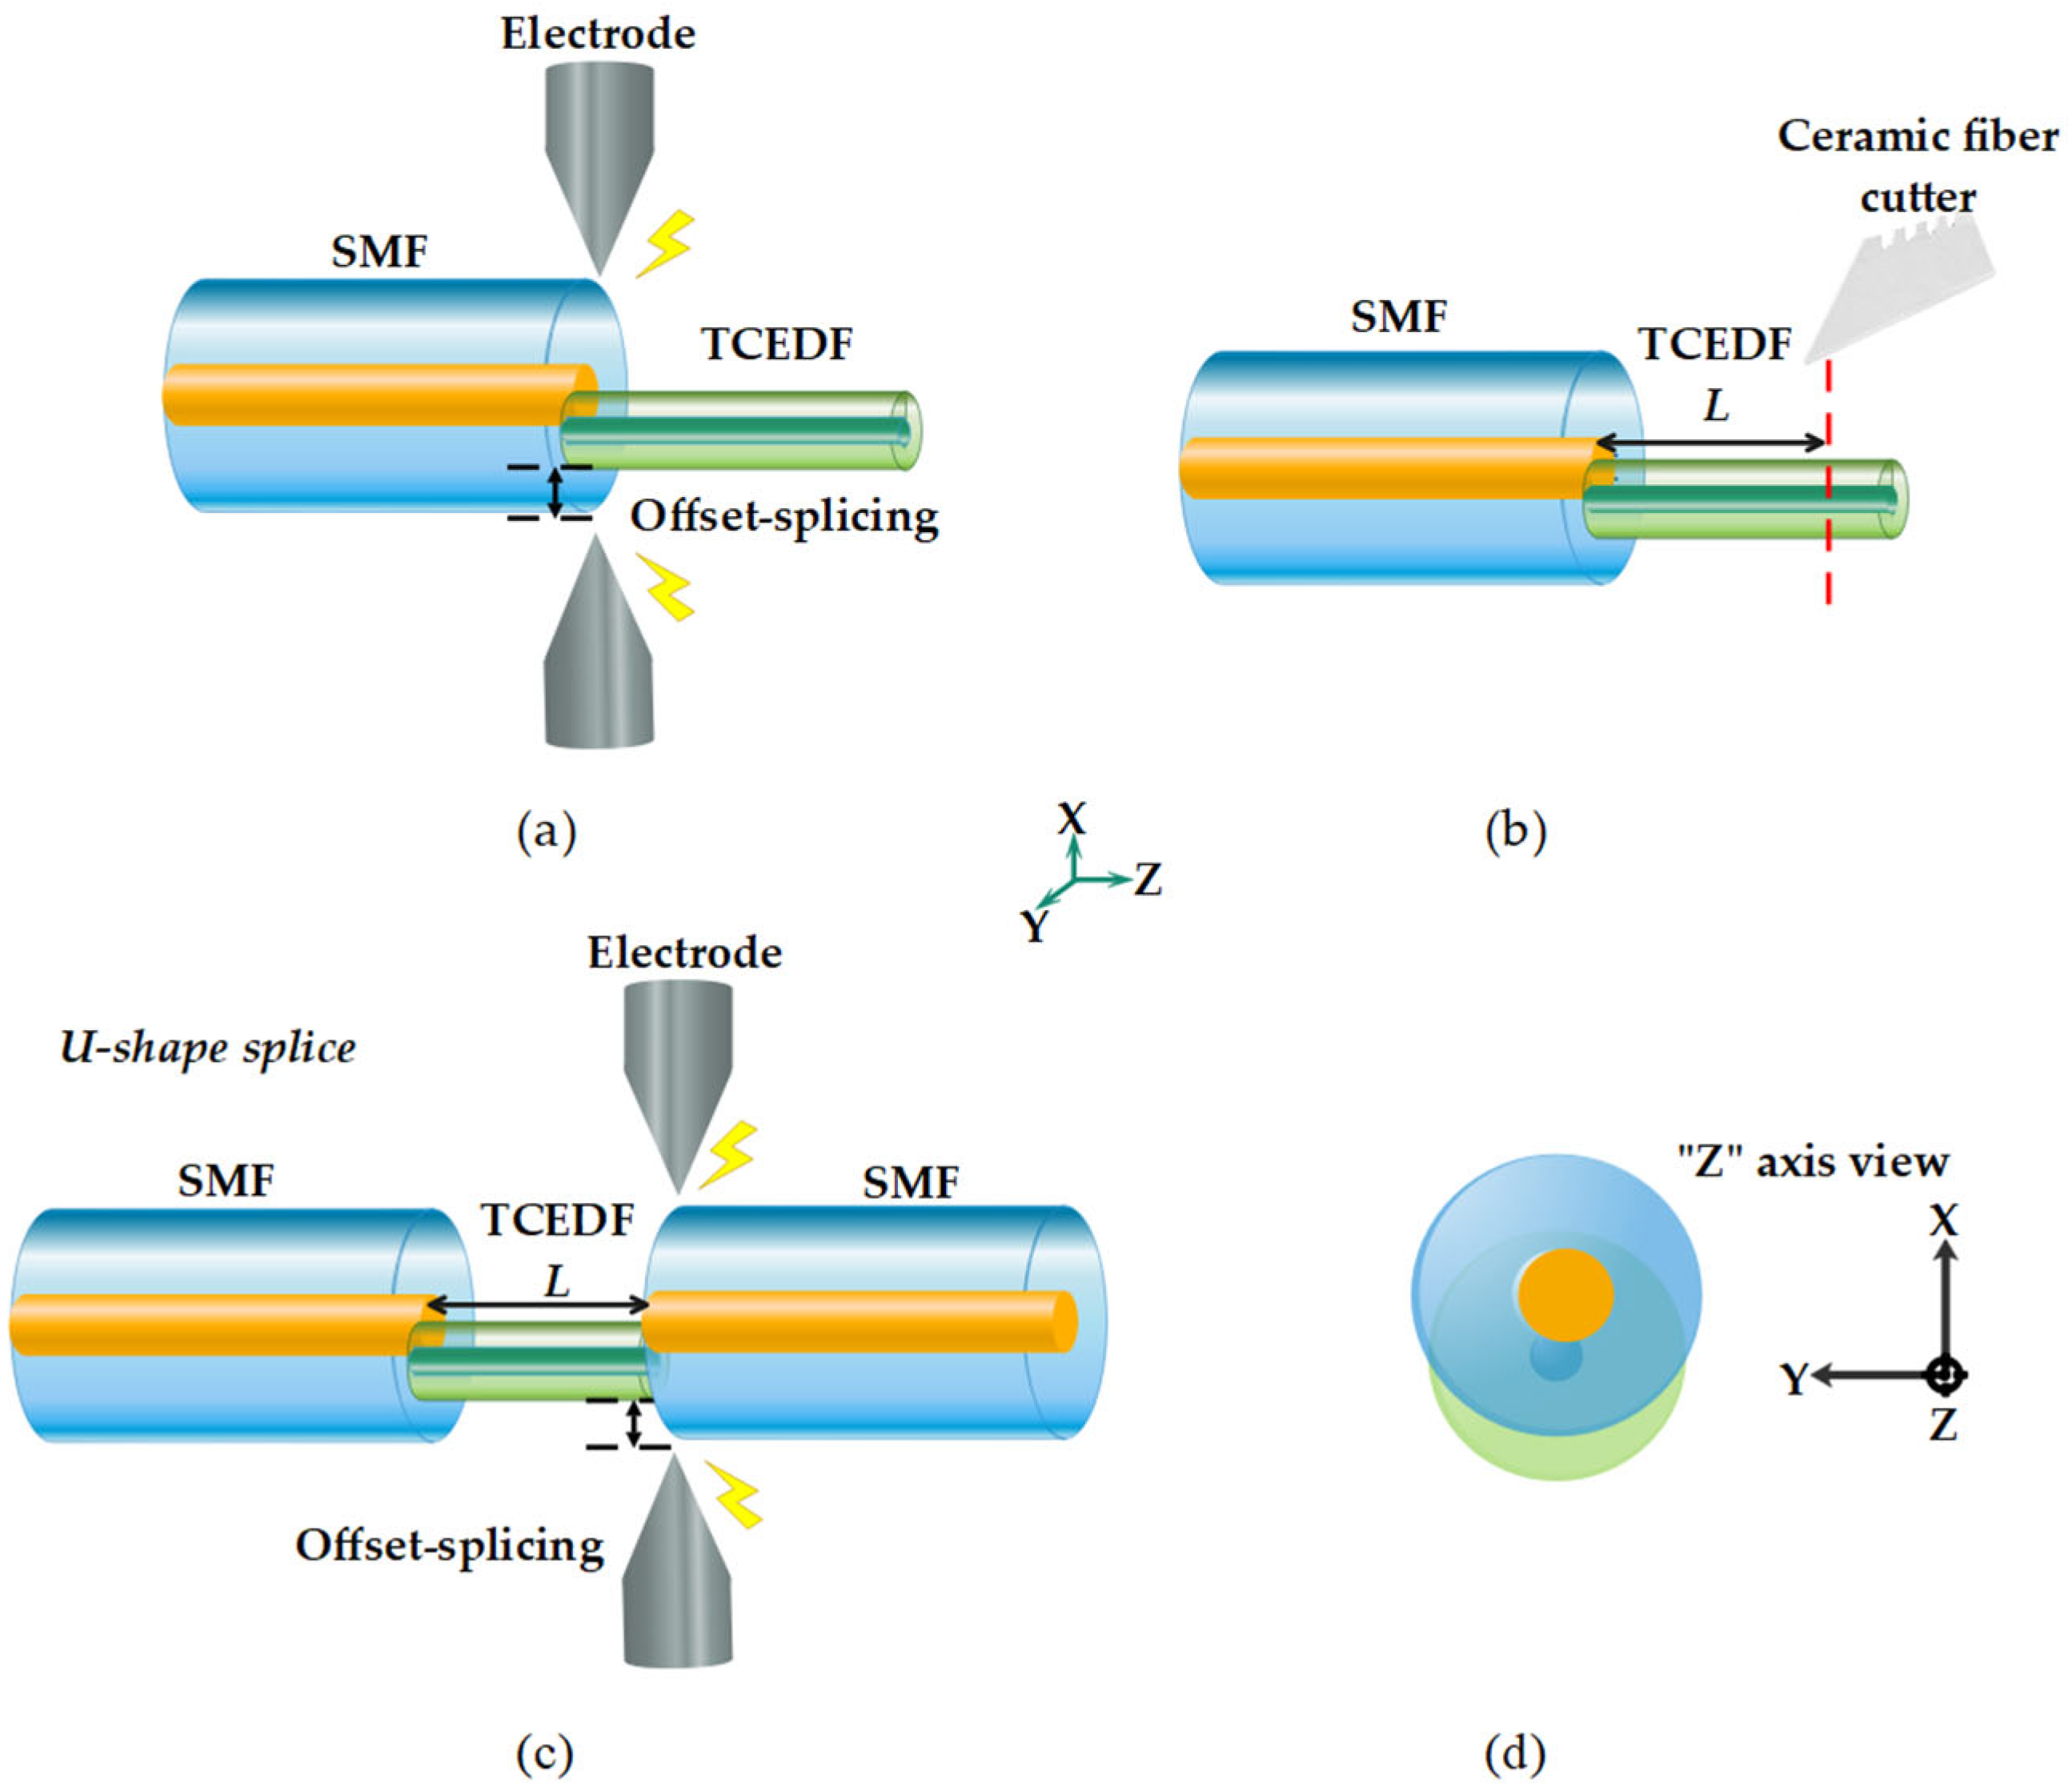
We fabricate an MZI by using a core-offset fiber array as the filtering mechanism. The MZI was constructed using a standard single-mode SMF28 fiber with a length of 2 m. We utilized a 2 cm piece of the TCEDF (RightWave EDF R37003X; Furikawa, OFS Fitel, Norcross, GA, USA), with a core diameter of 2.90 µm and cladding of 80 µm, which was spliced in half using a U-shape [17,23] core-offset splice. The U-shape was achieved by holding the SMF28 to a steel ruler with masking tape (Figure 1a), applying small marks on the fiber, ruler, and tape to prevent any unintentional movement and keeping it as stable as possible during splicing to avoid any twisting. We made the splice with a 6 cm piece of the TCEDF (shown in Figure 1b), which we manually cut to a length of 2 cm using a ceramic razor (CSW12-5 Thorlabs ceramic fiber scribe; Thorlabs, Newton, NJ, USA), enabling us to control the position of the MZI segments (Figure 2b). We performed the splicing using a Fitel S178 fusion splicer and modified the SMF program parameters to a pre-fusion time of 100 ms, a 1st first-arc duration time of 400 ms, a Z pressure distance of 4 µm, a first-arc power start of +45, an arc offset of +5 µm, a cleaning arc power offset of −20, and a cleaning time duration of 100 ms, always placing the TCEDF on the right holder side and the SMF on the left holder side, with the remaining fiber attached to the steel rule. We made the first splice (Figure 2a) by aligning the cores of the SMF (left holder) and the TCEDF (right holder) and then moving the left holder of the fusion splicer 4 µm upwards on the X-axis. Figure 2b illustrates how the SMF/TCEDF tip was cut to leave a measurement of 2 cm. In Figure 2c, we show how the second splice was made by aligning the TCEDF (left holder) and SMF (right holder) cores and then moved the motor on the X-axis 4 µm down, resulting in the U-shape sensor depicted in Figure 2d and viewed from the z-side. We tested the MZI by powering it with the ASE source, using the LDC operating at 135 mW and setting the temperature controller at 25 °C.
A U-shaped Mach–Zehnder interferometer was fabricated using a segment of thin-core erbium-doped fiber (TCEDF) with a length “L”. The operation principle of the fabricated MZI is based on the light input into the SMF. At the left junction of the core offset, the device acts as a splitter, with one part of the light coupled to the core, while the other part is coupled to the cladding of the TCEDF. At the right junction of the core offset, the core and the cladding modes are recombined into the SMF to generate interference. The output intensity of the interference can be expressed by [24,25]:
I = I c o r e + I c l a d + 2 I c o r e I c l a d cos
where I , I c o r e and I c l a d are the intensity of the output in the core mode and cladding modes, respectively, and is the phase difference between the core and cladding mode and is approximated as:
= 2 π n e f f L λ
where λ is the wavelength, L is the length of the TCEDF, and n e f f is the effective index difference between the core and the cladding modes of TCF. If equals ( 2 m + 1 ) in Equation (2), with m = 1 , 2 , 3 , , The dip of the interference spectrum can be expressed as:
λ m = 2 n e f f L 2 m + 1
where λ m is the monitoring wavelength.
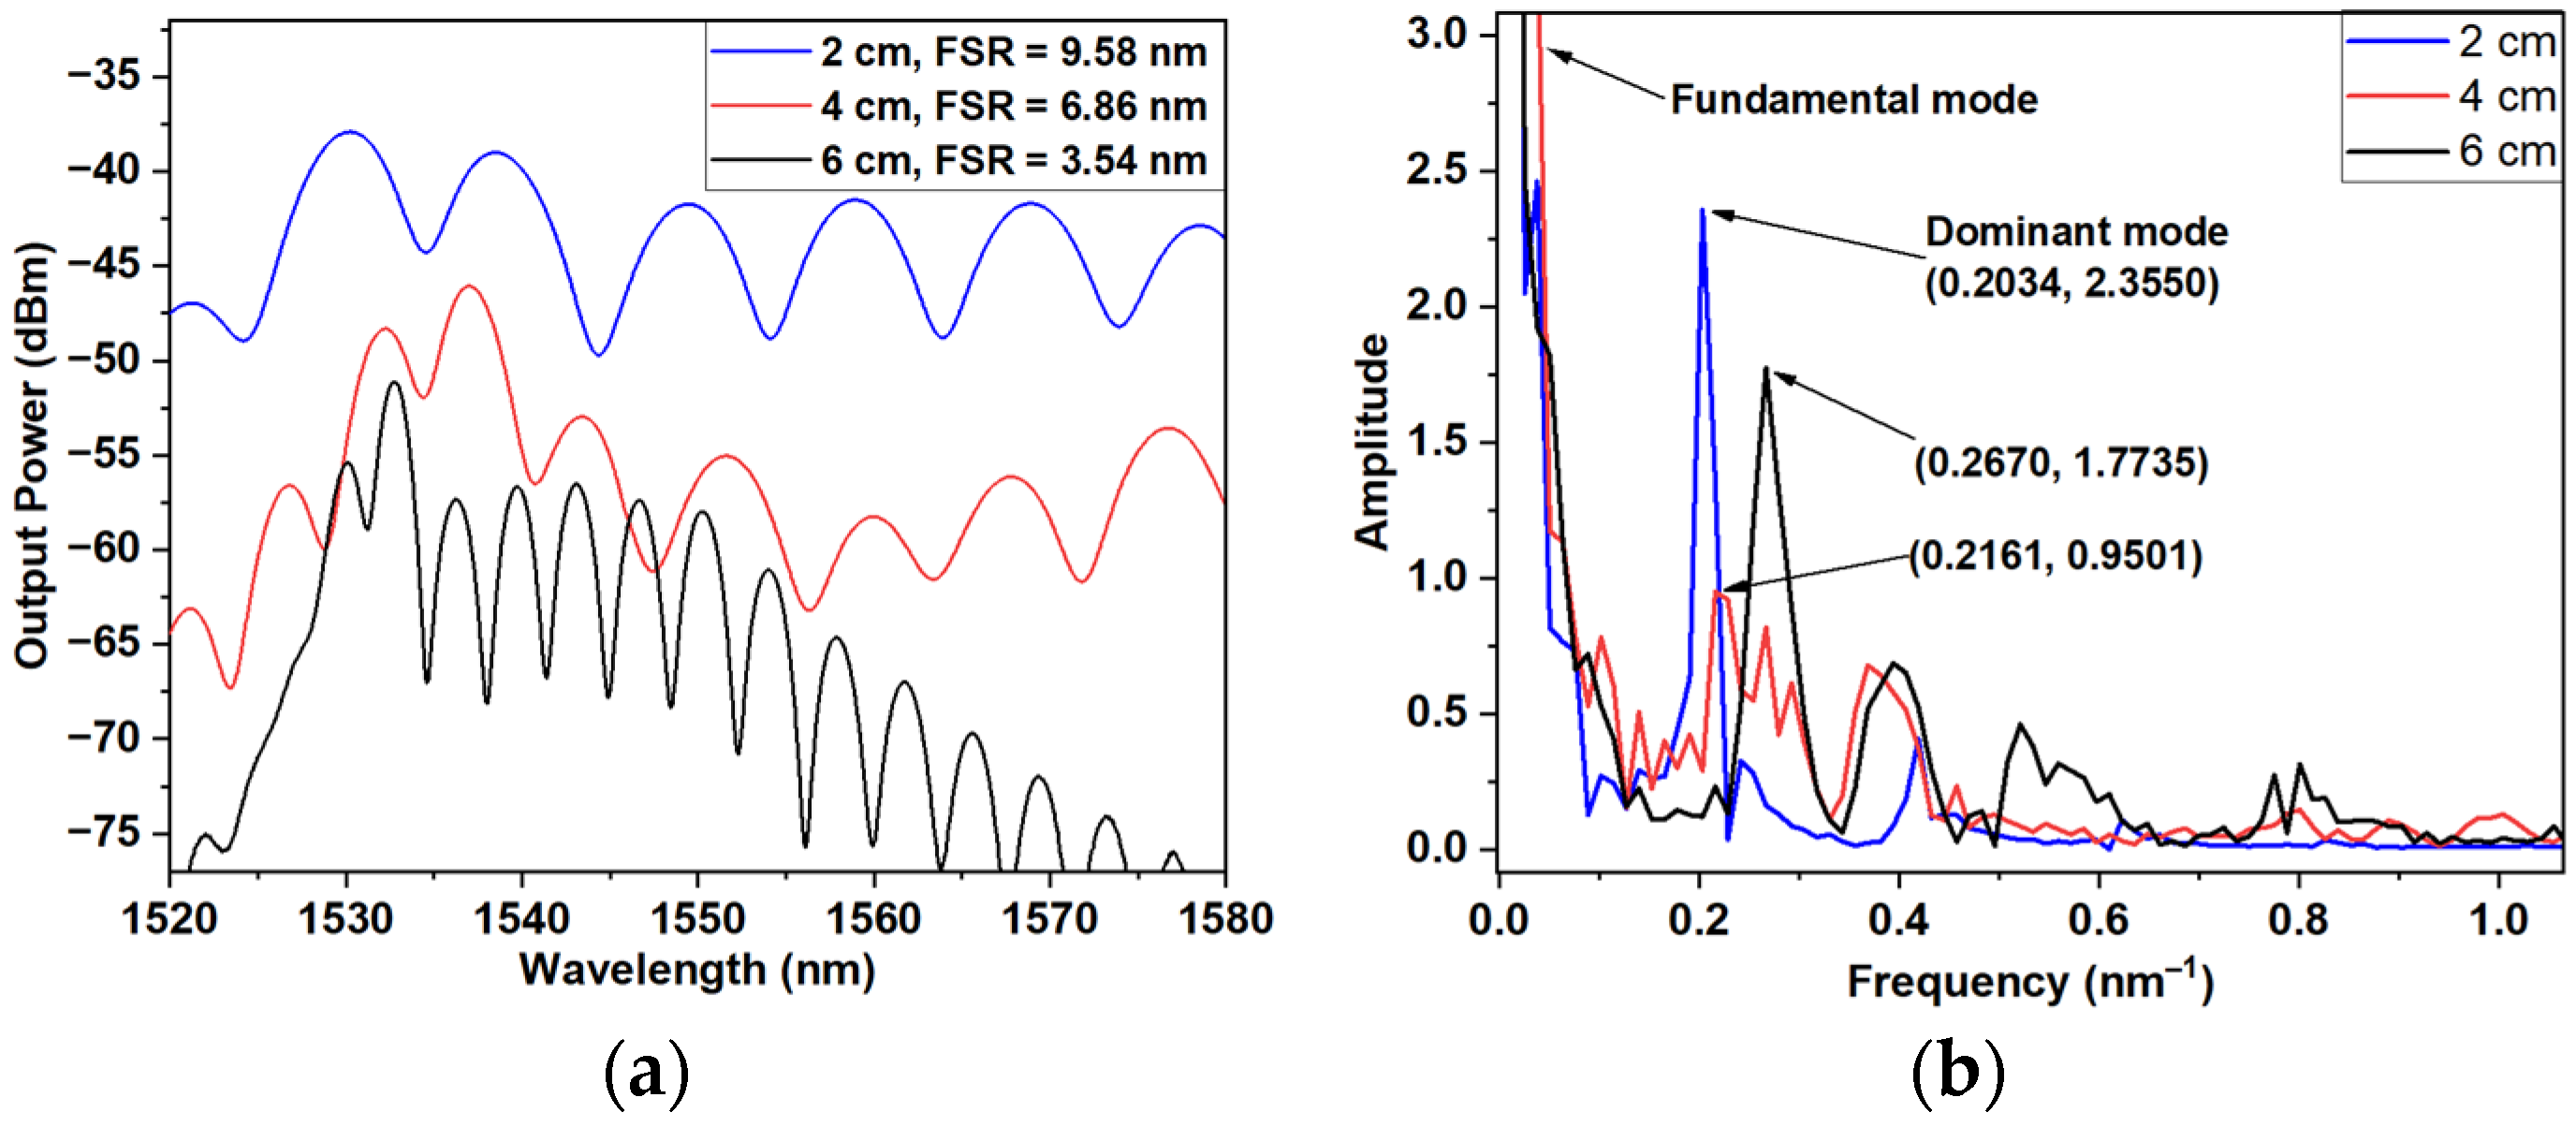
The interference spectrum of the MZI, which uses a length L of TCEDF at 2 cm, 4 cm, and 6 cm, is illustrated in Figure 3a. A spatial frequency spectrum of the interference pattern, generated through the Fast Fourier Transform (FFT) is presented in Figure 3b. In this figure, a single dominant high-order cladding mode is observed with a spatial frequency of 0.2034 nm−1, 0.2670 nm−1, and 0.2161 nm−1, respectively. The interference emission primarily arises from the fundamental core mode and the cladding mode. However, the interference spectrum output for the 2 cm MZI is dominated by a stronger cladding mode compared to the other MZIs, with an insertion loss of 4.2 dB. This MZI configuration consisting of SMF/TCEDF/SMF was selected as a filter due to its best output power and FSR. We use TCEDF for the advantages of a TCF for MZI fabrication and the spectrum it generates once realized, not for the gain material. TCF-based interferometers have been reported to be modal exciters; due to their smaller core size, the guiding light travels through the core and much of the cladding, resulting in a larger modal field diameter. As a result, higher-order modes can be excited, which creates modal interference. Due to the difference in core diameter and changes in the cutoff wavelength, some of these modes can easily be generated from the cladding [26].

3. Schematic Configuration and Experimental Setup

The following is a diagram of the experimental setup used for the multi-wavelength thin-core erbium-doped fiber laser (MTEFL), as presented in Figure 4a. The laser operates within a 9-meter-long cavity and utilizes a 980 nm pumping laser diode (Bookham LC94ZL74-20R; Bookham, Inc., San Jose, CA, USA) together with an LDC that provides a power output of 135 mW. In the setup, a 980/1550 Wavelength Division Multiplexer (WDM) is used, along with an Optical Isolator (ISO), a 1-meter-long erbium-doped fiber (EDF) (Thorlabs ER80-8/125; Thorlabs, Inc., Newton, NJ, USA), and an Optical Coupler (OC). Within the OC, 1% of the pumping power is directed toward the Optical Spectrum Analyzer (OSA; Yokogawa AQ6370D; resolution 0.02 nm; Yokogawa Electric Corporation, Musashino, Tokyo, Japan), while the remaining 99% is retained within the ring array to facilitate lasing. Additionally, a PC is incorporated into the setup. The MZI filter is positioned at the center of a 15-gauge steel wire that measures 350 mm in length and 1.44 mm in diameter. Small pieces of adhesive tape are used to secure the MZI to a metric rod, preventing any potential rotation that could affect the optimal functioning of the filter. Two stationary bases support the optical fiber (OF). One of the bases features a one-axis motorized translation stage (MT1-Z8), which utilizes a Z812B motor and a Kinesis KDC101 motor driver. The motor driver has a resolution of 0.1 mm per step, allowing for the adjustment of the curvature of the filter, as shown in Figure 4b.
The tuning and multi-line switching (multi-wavelength) are achieved by adjusting multiple wavelengths through the movements of the left motor. The lineal initial displacement is 14.70 mm to 224.70 mm, with an increment of 0.10 mm. When the curvature sensor is bent, the dip wavelength in the interference spectrum can be given by [27]:
λ m = 2 n e f f L 2 m + 1 + k L b 2 m + 1 × 1 R
where k = 0.1649 × 10 9   μ ε 1 is the strain refractive index coefficient, and b is the distance from the cladding to the core. At each linear increment, “x” is measured and estimated by the curvature expression [28]:
C = 1 R = 24 x / ( L 0 / 2 ) 3
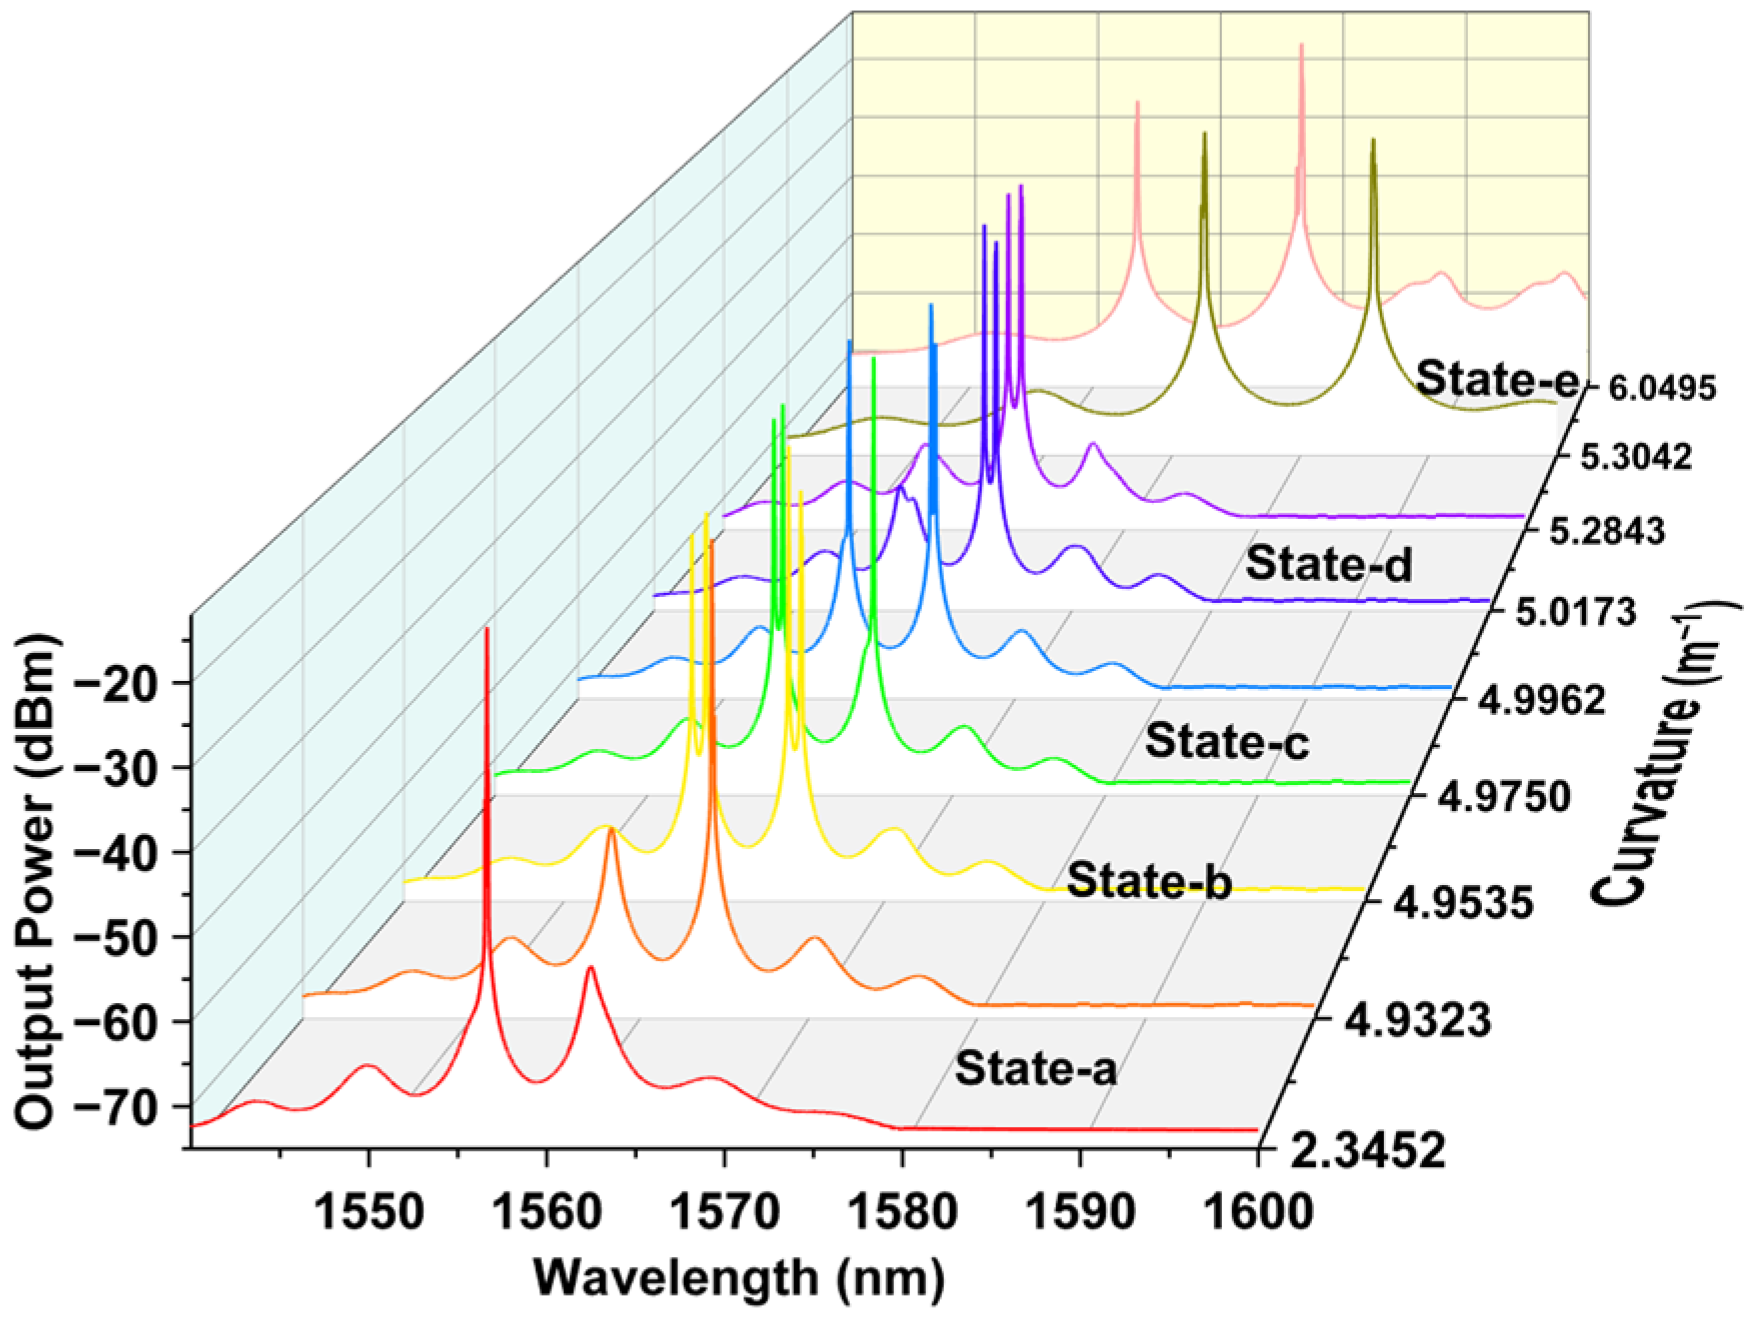
where “R” is the curvature radio, “x” is the movement distance of the moveable fiber end, and “L0 = 210 mm” is the distance between the edges of the two bases. The curvature range is from 2.3452 m−1 to 6.0495 m−1. The curvature radius is adjusted over the MZI, generating single-, double-, triple- and quadruple-line emission. We used 147 samples in a total sweep of the first and last emission lines of the MTEFL (Figure 5) at room temperature (25 °C). In state-a, we obtained a single tunable lasing line ranging from 1556.63 nm up to 1564.25 nm, with a wavelength-tunable range of 7.62 nm into a curvature range from 2.3452 m−1 to 4.9323 m−1. In state-b, the curvature radius is 4.9537 m−1, generating a signal with quadruple lines. In state-c, we obtained two different signals with triple lasing lines, with a curvature of 4.9750 m−1 and 4.9962 m−1. In state-d, we could tune the dual narrow lasing line signal from 1564.56 nm to 1561.34 nm, with a wavelength-tunable range of 3.22 nm into a curvature range from 5.0173 m−1 to 5.2843 m−1. Lastly, in state-e, we could tune dual lasing lines, with one ranging from 1585.69 nm to 1572.53 nm and the second line from 1576.89 nm to 1563.68 nm. The wavelength-tunable range is 8.8 nm and 8.87 nm, respectively, for a curvature range from 5.3042 m−1 to 6.0495 m−1.

4. Experimental Investigation of MTEFL Operation

This section analyzes the tuning and switching process of the multi-wavelength thin-core erbium-doped fiber laser (MTEFL) emission lines. The analysis aims to provide a comprehensive explanation of the continuous curvature applied to the MZI sensor and the subsequent changes observed in the laser emissions. In Figure 6a, we illustrate the initial tuning process of an MTEFL. This figure displays the first and last lasing lines obtained within a wavelength range of 1556.63 nm to 1564.25 nm from 89 tuning samples for state-a. The tuning process spanned a wavelength range of 7.62 nm, corresponding to a curvature range from 2.3452 m−1 to 4.9323 m−1. Figure 6b shows that the initial signal (λ1 = 1556.63 nm) had an SMSR of 40.04 dB, while the final lasing signal emission for a single line (λ89 = 1564.25 nm) had an SMSR of 36.04 dB. The linewidths of 3 dB were 0.02 nm for λ1 and 0.03 nm for λ89, with a wavelength interval of approximately 0.08 nm. The SMSR difference between the first (λ1) and the last (λ89) emission lines is 4 dB. To further understand this variation, we focus on a more significant single-line emission, as depicted in Figure 6c. For this single tuning emission at wavelength λ1, the SMSR was 40.04 dB, which increased to 49.80 dB at λ46, before dropping to 36.04 dB at λ89. The corresponding signal-to-noise ratios (SNRs) for these wavelengths were λSNR1 = 1562.46 nm, λSNR46 = 1566.69 nm, and λSNR89 = 1558.29 nm, with SNR values of 16.64 dB, 7.17 dB, and 18.74 dB, respectively. The laser SNR is defined as the ratio of the laser peak power to the adjacent ASE level monitored from the output laser [29]. The variation in SMSR during the tuning process is due to the increment in the curvature applied to the filter. This change in curvature may lead to insertion loss during tuning, which induces variations in propagation through both the core and cladding modes. As a result, these changes affect the gain and lead to variations in the gain spectrum [12]. The average peak output power obtained from 89 tuning samples was measured to be −14.76 dBm. We observed a maximum power fluctuation of 2.19 dB across the total emission tuning lines, which is below the threshold of 3.0 dB. The variation observed in the SMSR and SNR is not substantial enough to affect the peak output power. To assess the response of the MZI filter to curvature, we analyzed all 89 samples taken while tuning a single lasing emission line, as shown in Figure 6d. Our study encompasses a curvature range of 2.3452 m−1 to 4.9323 m−1, from which we derived a sensitivity of 2.67 nm/m−1, with an R2 value of 0.9982. The relationship between curvature and wavelength shift was established through the use of a polynomial fit adjustment, which yielded the equation y = 1555.7397 1.0064 x + 0.5571 x 2 . This equation accurately represents the aforementioned relationship.
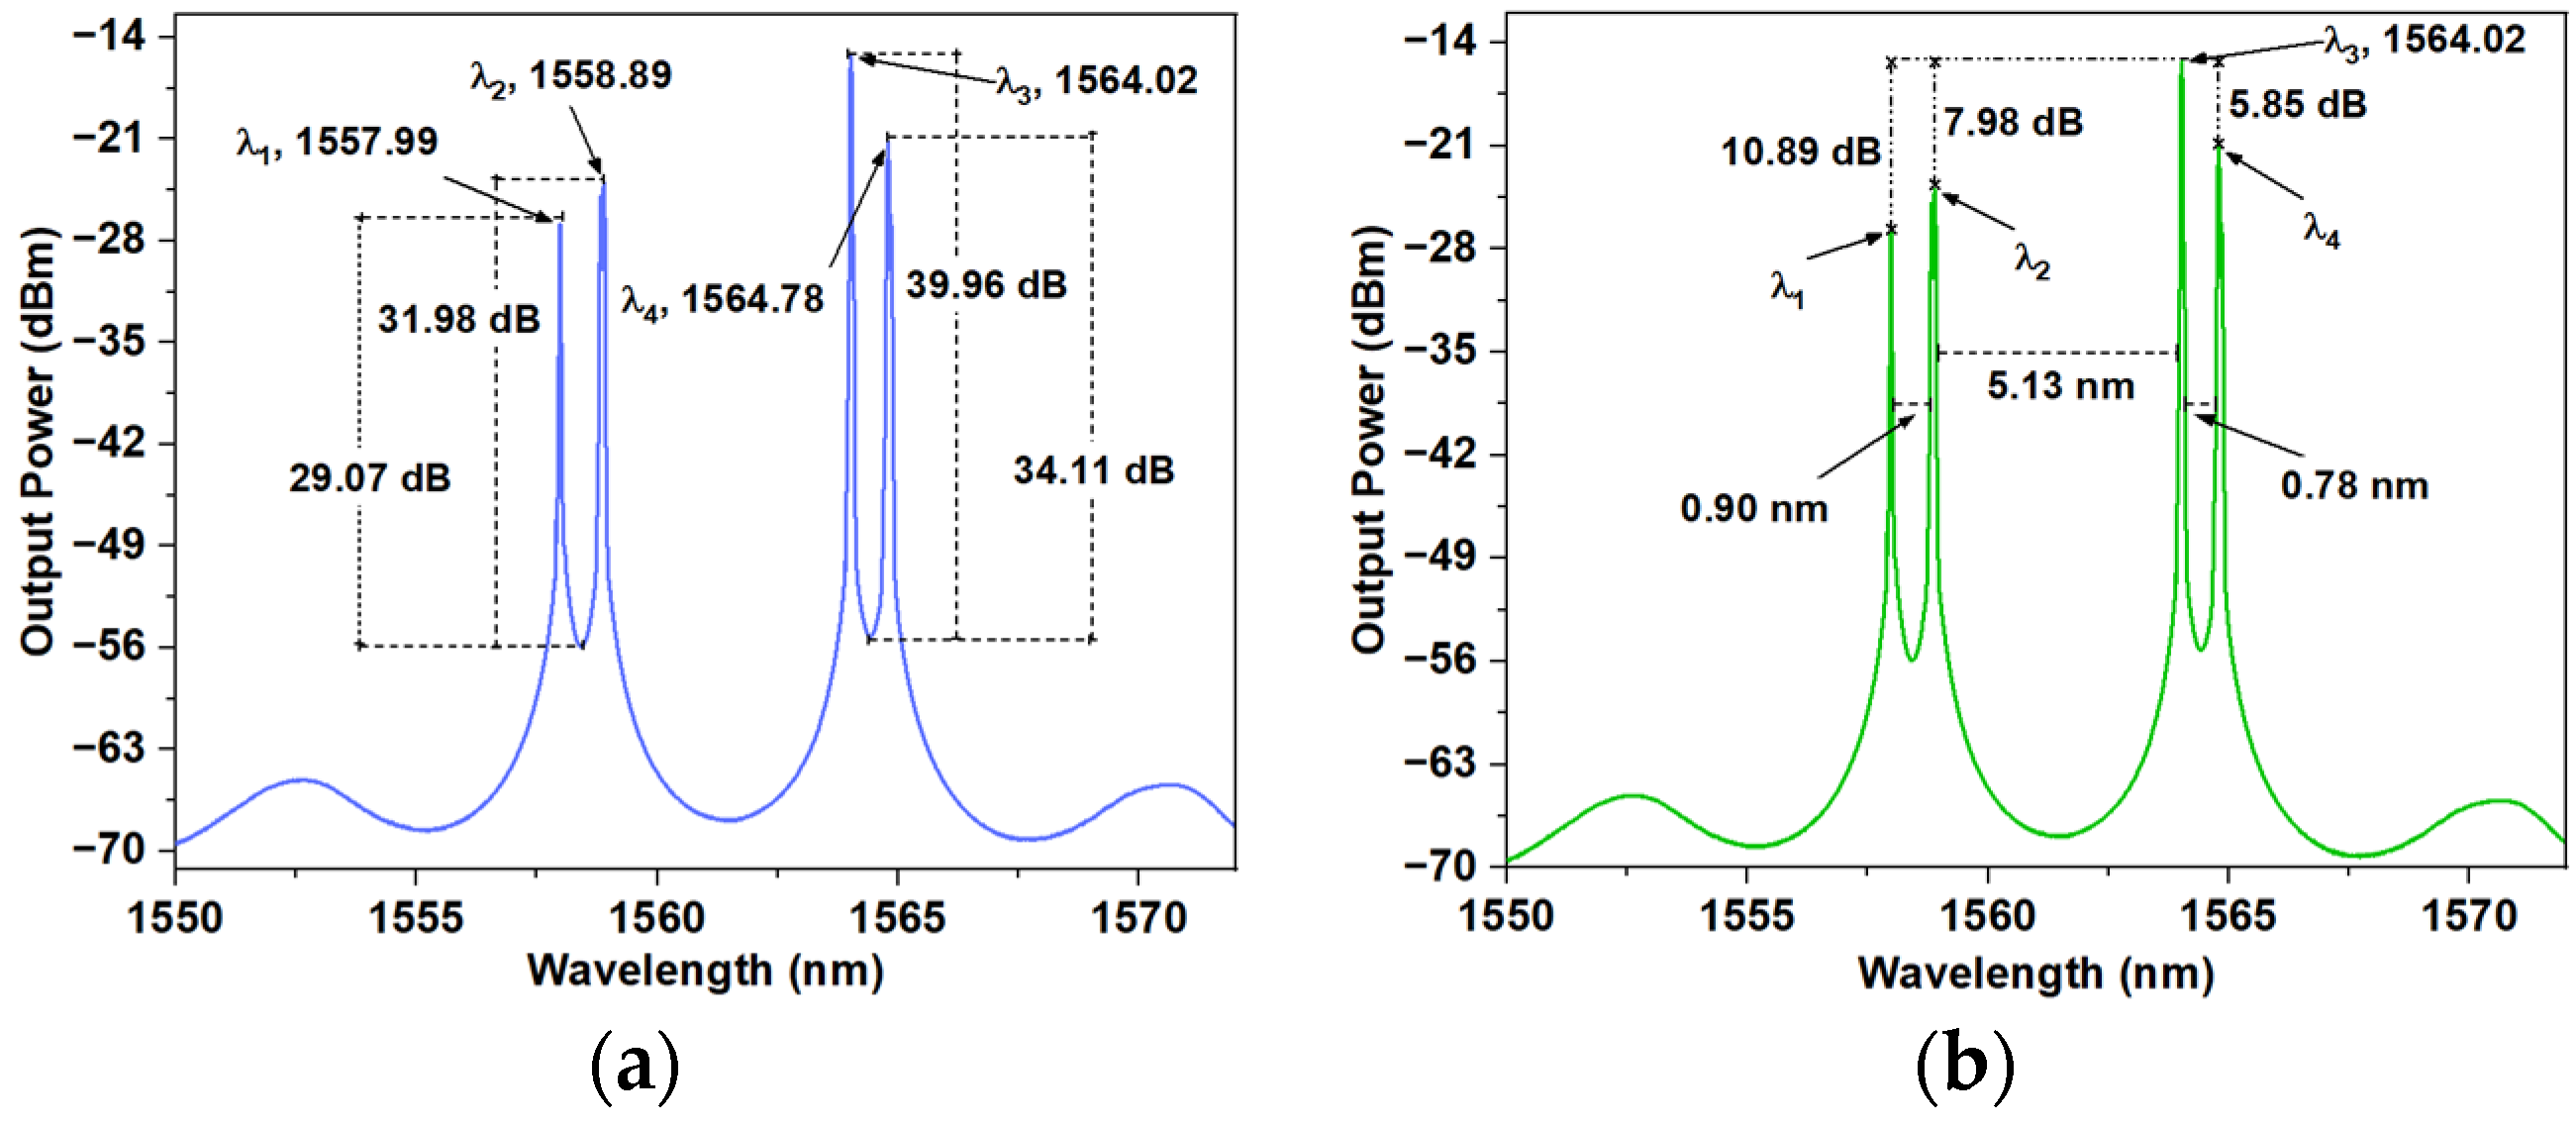
The curvature was incremented to 4.9537 m−1, leading to a wavelength switch that resulted in the division of a single lasing signal into quadruple-emission lines (state-b), as shown in Figure 7a. These lines were identified as λ1 = 1557.99 nm, λ2 = 1558.89 nm, λ3 = 1564.02 nm, and λ4 = 1564.78 nm. The spectral power distribution of these lines was measured, revealing SMSR values of 29.07 dB, 31.98 dB, 39.96 dB, and 34.11 dB for each emission line. Additionally, the 3 dB line widths were determined to be 0.03 nm, 0.05 nm, 0.04 nm, and 0.05 nm, respectively. The adjacent peaks were separated by distances of 0.90 nm, 5.13 nm, and 0.78 nm. Among these peaks, λ3 exhibited the highest power, with the power differences between each lasing emission line being less than 10.89 dB, as shown in Figure 7b.
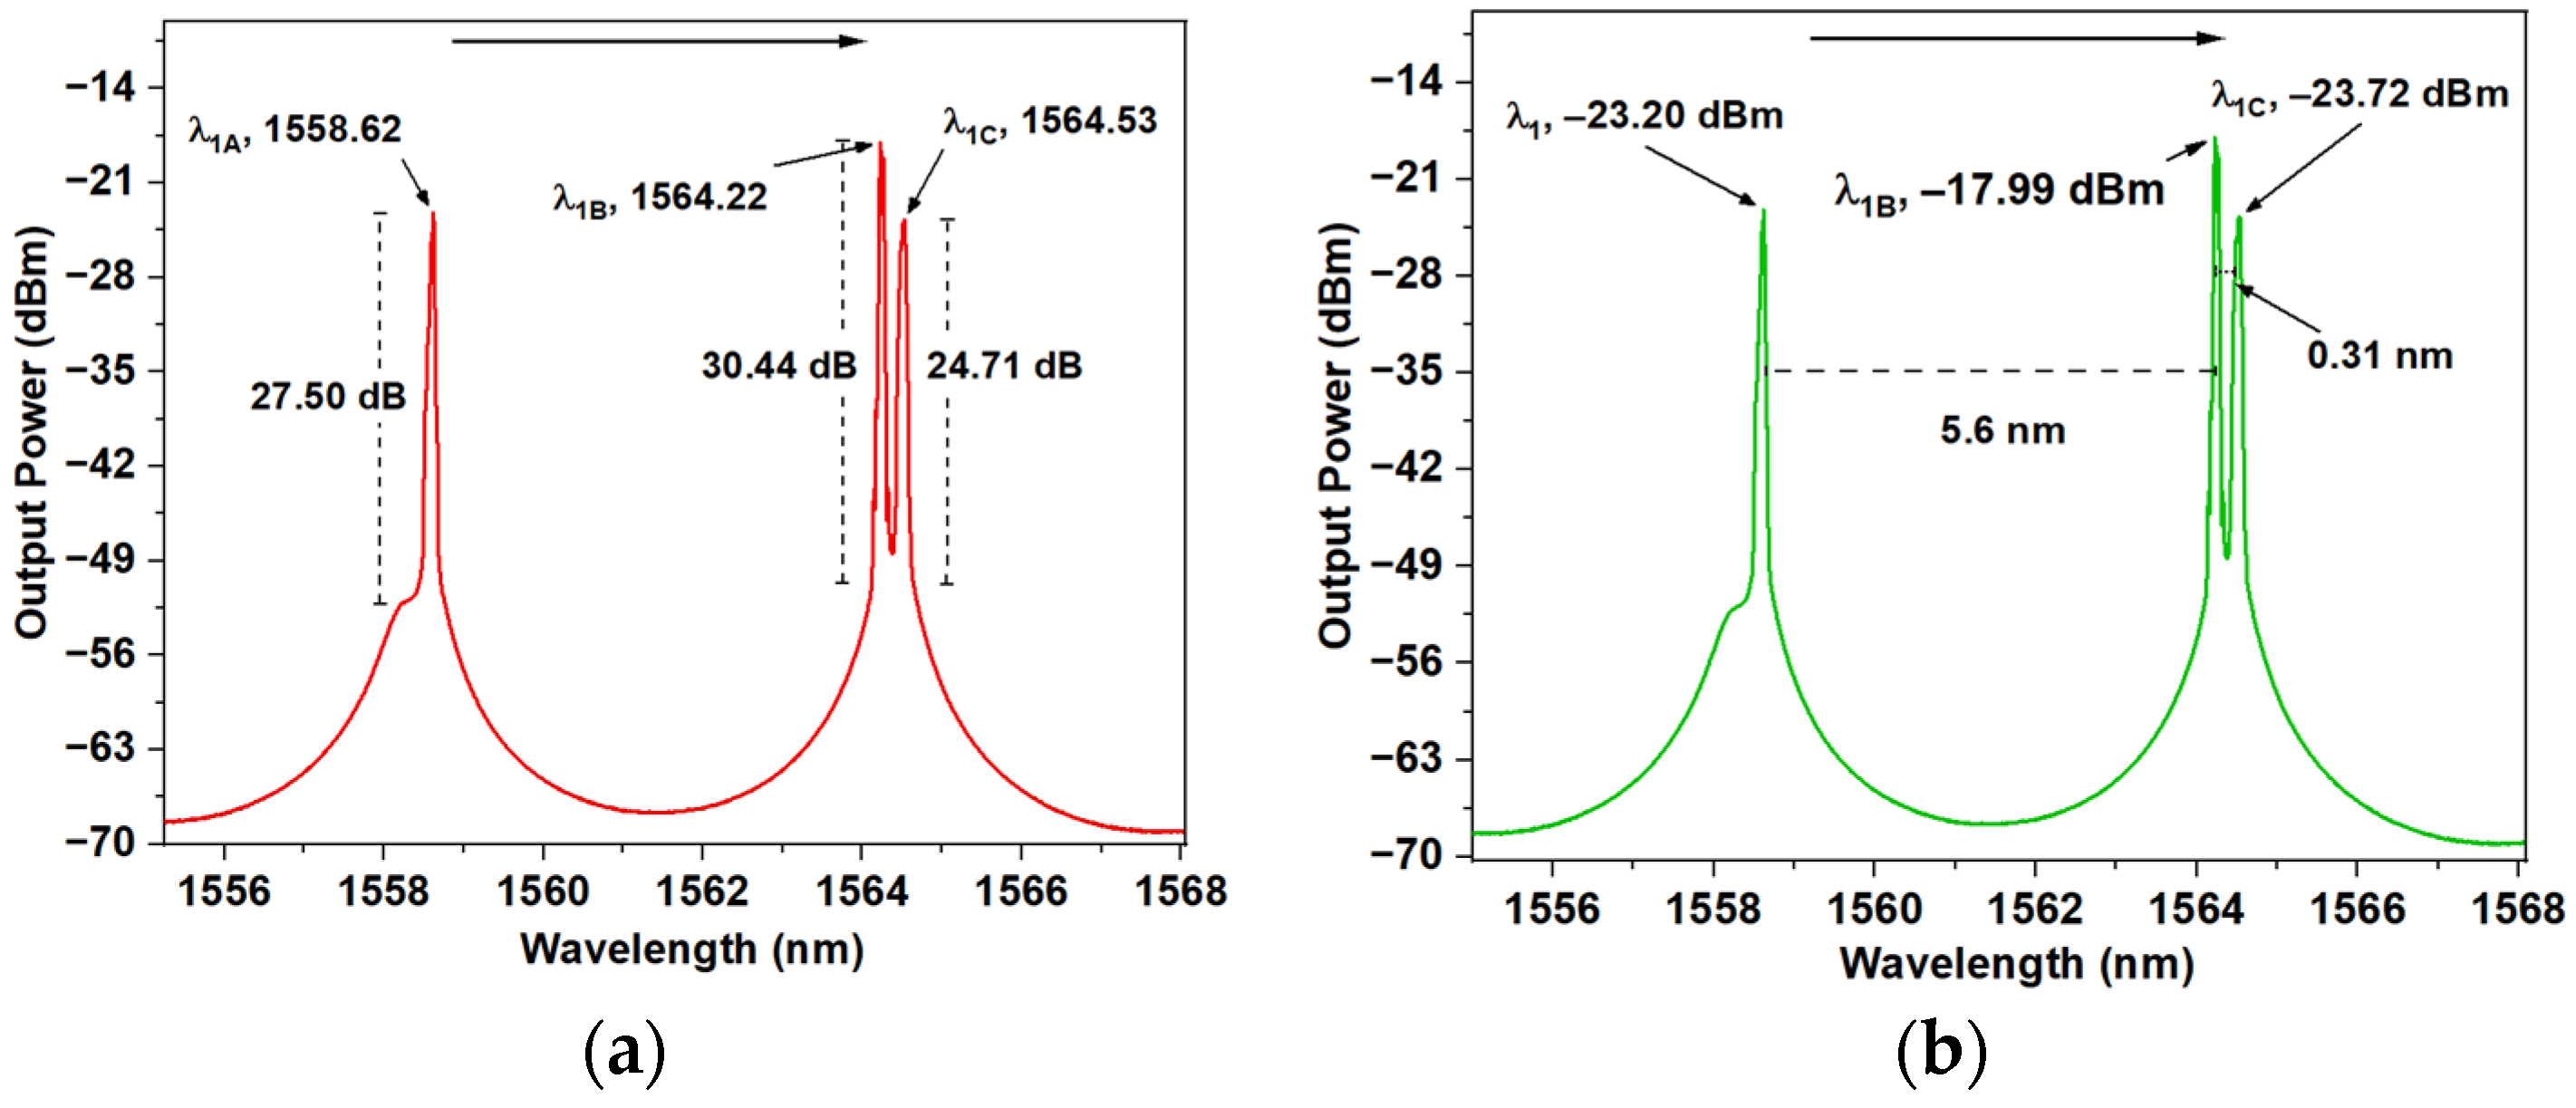
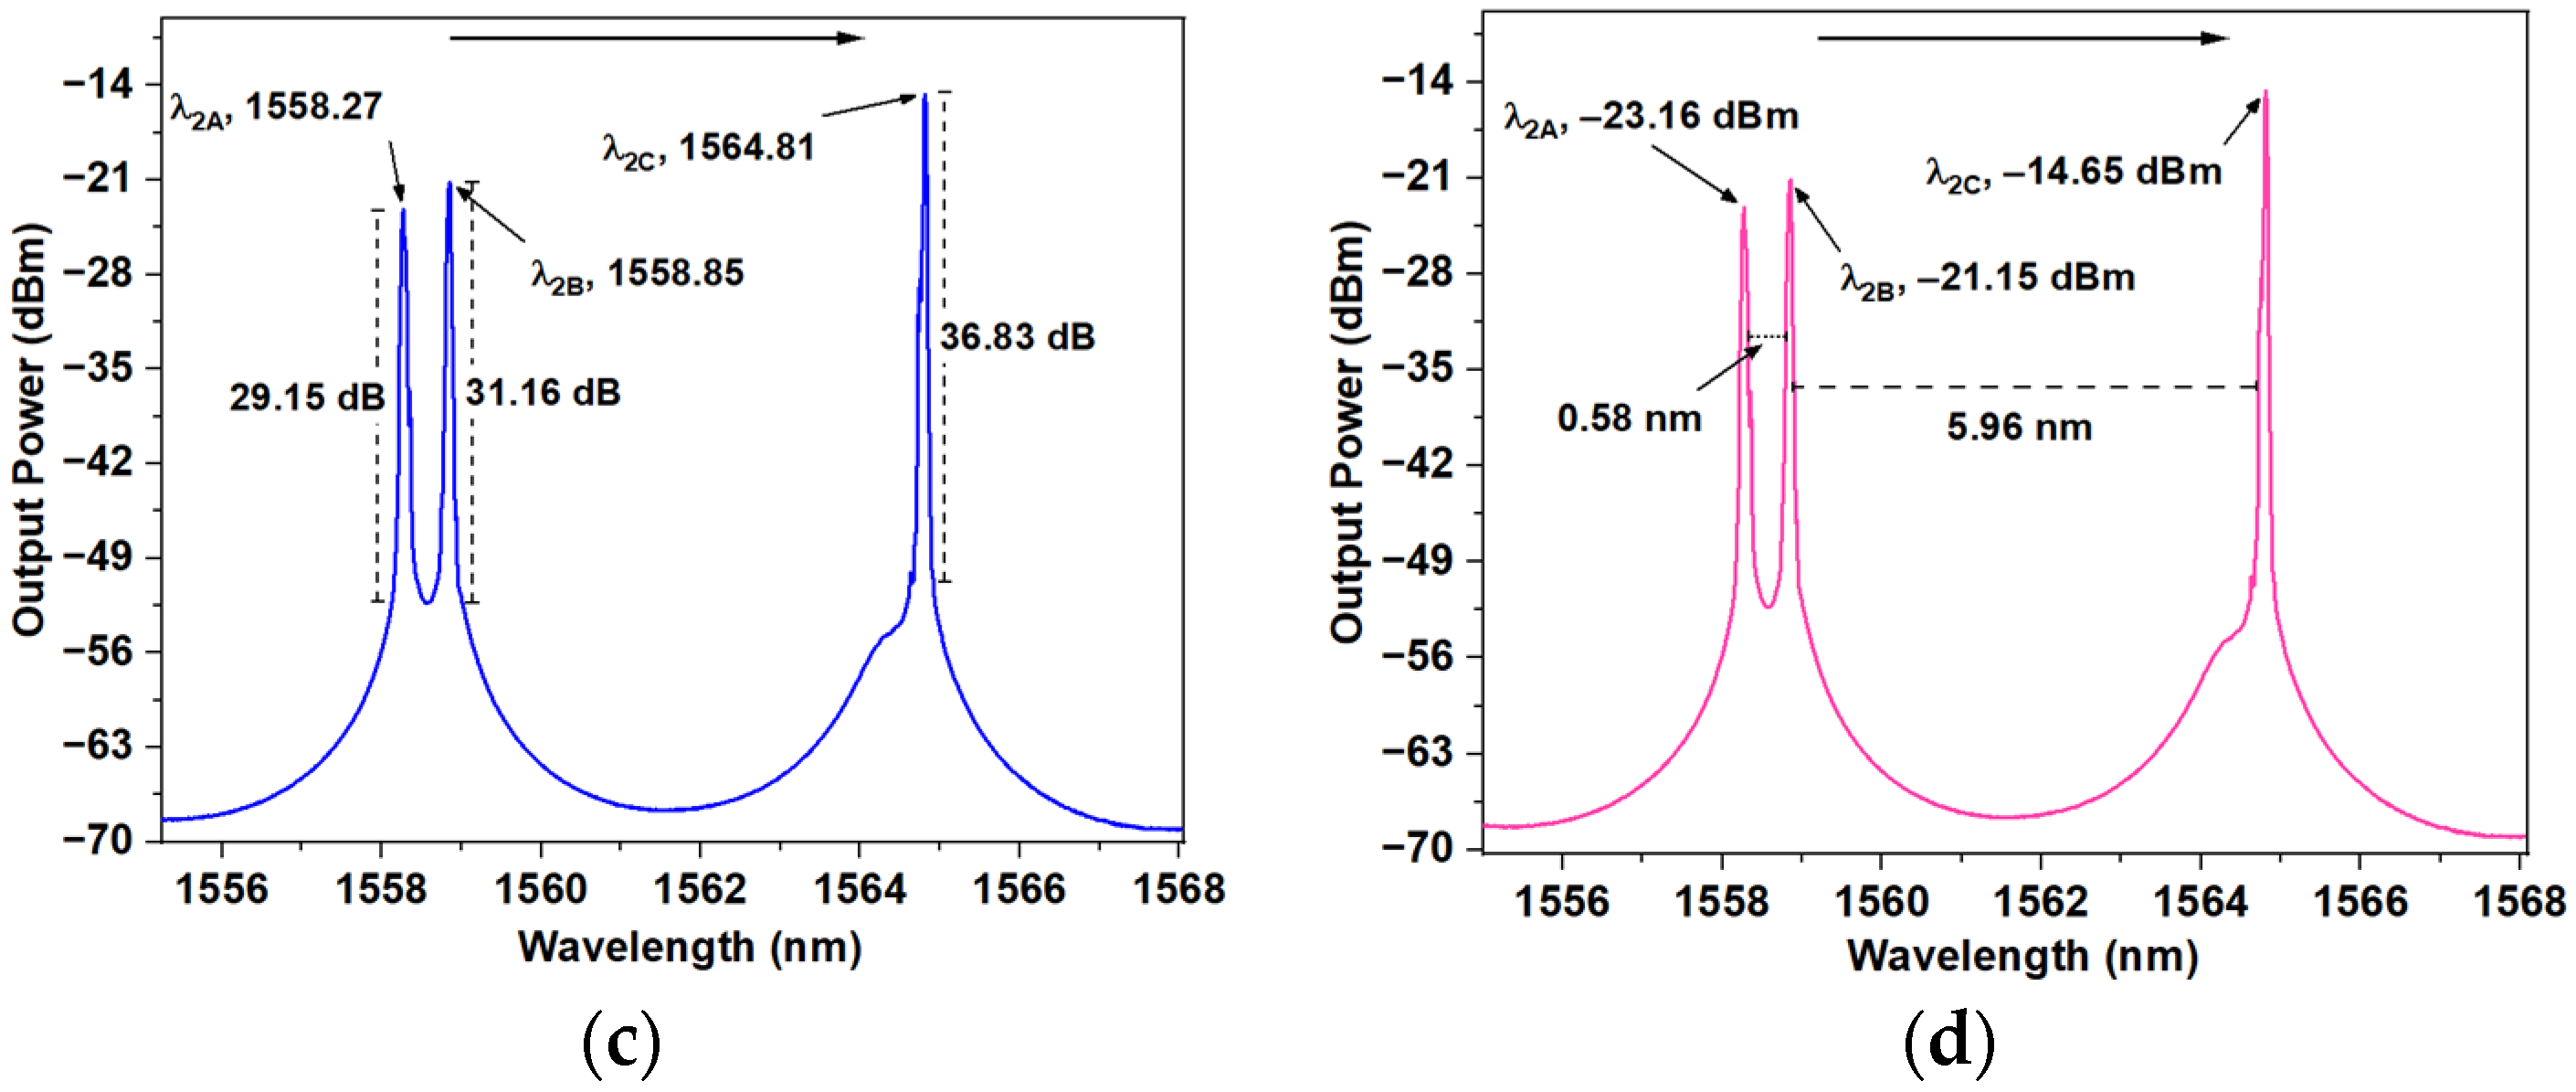
In state-c, the curvature was incremented to 4.9750 m−1, resulting in the generation of triple-emission lasing lines, as shown in Figure 8a. Specifically, these triple-emission lines produced maximum peaks at λ1A = 1558.62 nm, λ1B = 1564.22 nm, and λ1C = 1564.53 nm. The SMSR for these peaks was measured at 27.5 dB, 30.44 dB, and 24.71 dB, with 3 dB linewidths of 0.03 nm, 0.04 nm, and 0.02 nm, respectively. The adjacent peaks were separated by 5.60 nm and 0.31 nm. Among these wavelengths, λ1B exhibited the highest power, with the peak power difference between each lasing line being less than 5.73 dB, as depicted in Figure 8b. An MZI with a thin-core has the advantages mentioned above [10,11,20]. But, as EDF has a gain medium [30], the system has a fluctuation that can be seen when increasing the curvature (4.9537 m−1 to 4.9962 m−1) as in the b- and c-states. From this curvature range, the laser has a switch behavior, and we believe that the high-order modes generated in the cladding influence the emission spectrum of the filter, and, therefore, the wavelength lasing oscillations compete significantly with the overall homogeneity of the gain medium’s laser spectrum, as reported by L.A. Herrera-Piad et al. [31]; therefore, the spacing between the wavelengths observed in Figure 7 (0.90 nm, 0.78 nm) and Figure 8 (0.31 nm and 0.58 nm) is generated. When the curvature was increased to 4.9962 m−1, a second triple-emission lasing line was obtained, as illustrated in Figure 8c. This new triple-emission line produced maximum peaks at λ2A = 1558.27 nm, λ2B = 1558.85 nm, and λ2C = 1564.81 nm. The associated signal had SMSR values of 29.15 dB, 31.16 dB, and 36.83 dB, with 3 dB linewidths of 0.02 nm, 0.04 nm, and 0.02 nm, respectively. The adjacent peaks were separated by 0.58 nm and 5.96 nm. Among these lines, λ2C exhibited the highest power, and the peak power difference between each lasing line was less than 8.51 dB, as shown in Figure 8d.
In state-d, when the curvature is applied to the filter that goes from 5.0173 m−1 to 5.2843 m−1, a tunable narrow-emission dual-wavelength line is achieved, with a tuning range of 2.24 nm and a wavelength interval of approximately 0.16 nm (see Figure 9a). Throughout the tuning process, a total of 14 samples were analyzed, labeled as λ1, λ2, …, λ14. The initial λ1 (represented by the blue line) features a dual wavelength at λ1A = 1563.71 nm and λ1B = 1564.56 nm, with an SMSR of 39.12 dB and 3 dB linewidth of 36.59 dB, corresponding to 0.97 and 0.41 nm, respectively. The λ1A showed the highest power, with the peak power difference being less than 2.53 dB. The final dual-wavelength sample, λ14 (represented by the orange line), has wavelengths λ14A = 1561.34 nm and λ14B = 1562.27 nm, with an SMSR of 33.75 dB and a linewidth of 0.98 nm and 0.41 nm for each, respectively. The λ14B wavelength also exhibited the highest power, with the peak power difference being less than 1.45 dB. The adjacent peaks in both the initial and final samples are separated by approximately 0.89 nm. Figure 9b illustrates the most significant dual-narrow-emission lines throughout the tuning process, highlighting samples λ1, λ3, λ12, and λ14. We can see that λ12 showed the highest power, with the peak power difference of each lasing line being less than 2.63 dB. The total peak power difference across all lasing lines was less than 6.10 dB, with 5.09 dB for λAs and λBs, respectively. Furthermore, a linear relationship between the shifts in wavelength spectra and curvature was observed (see Figure 9c). The data show a linear response from 1564.56 nm to 1562.27 nm and from 1563.71 nm to 1561.40 nm, with sensitivities of −8.4008 nm/m−1 and −8.7734 nm/m−1, respectively, along with an R2 value of 0.9912 and 0.99126.
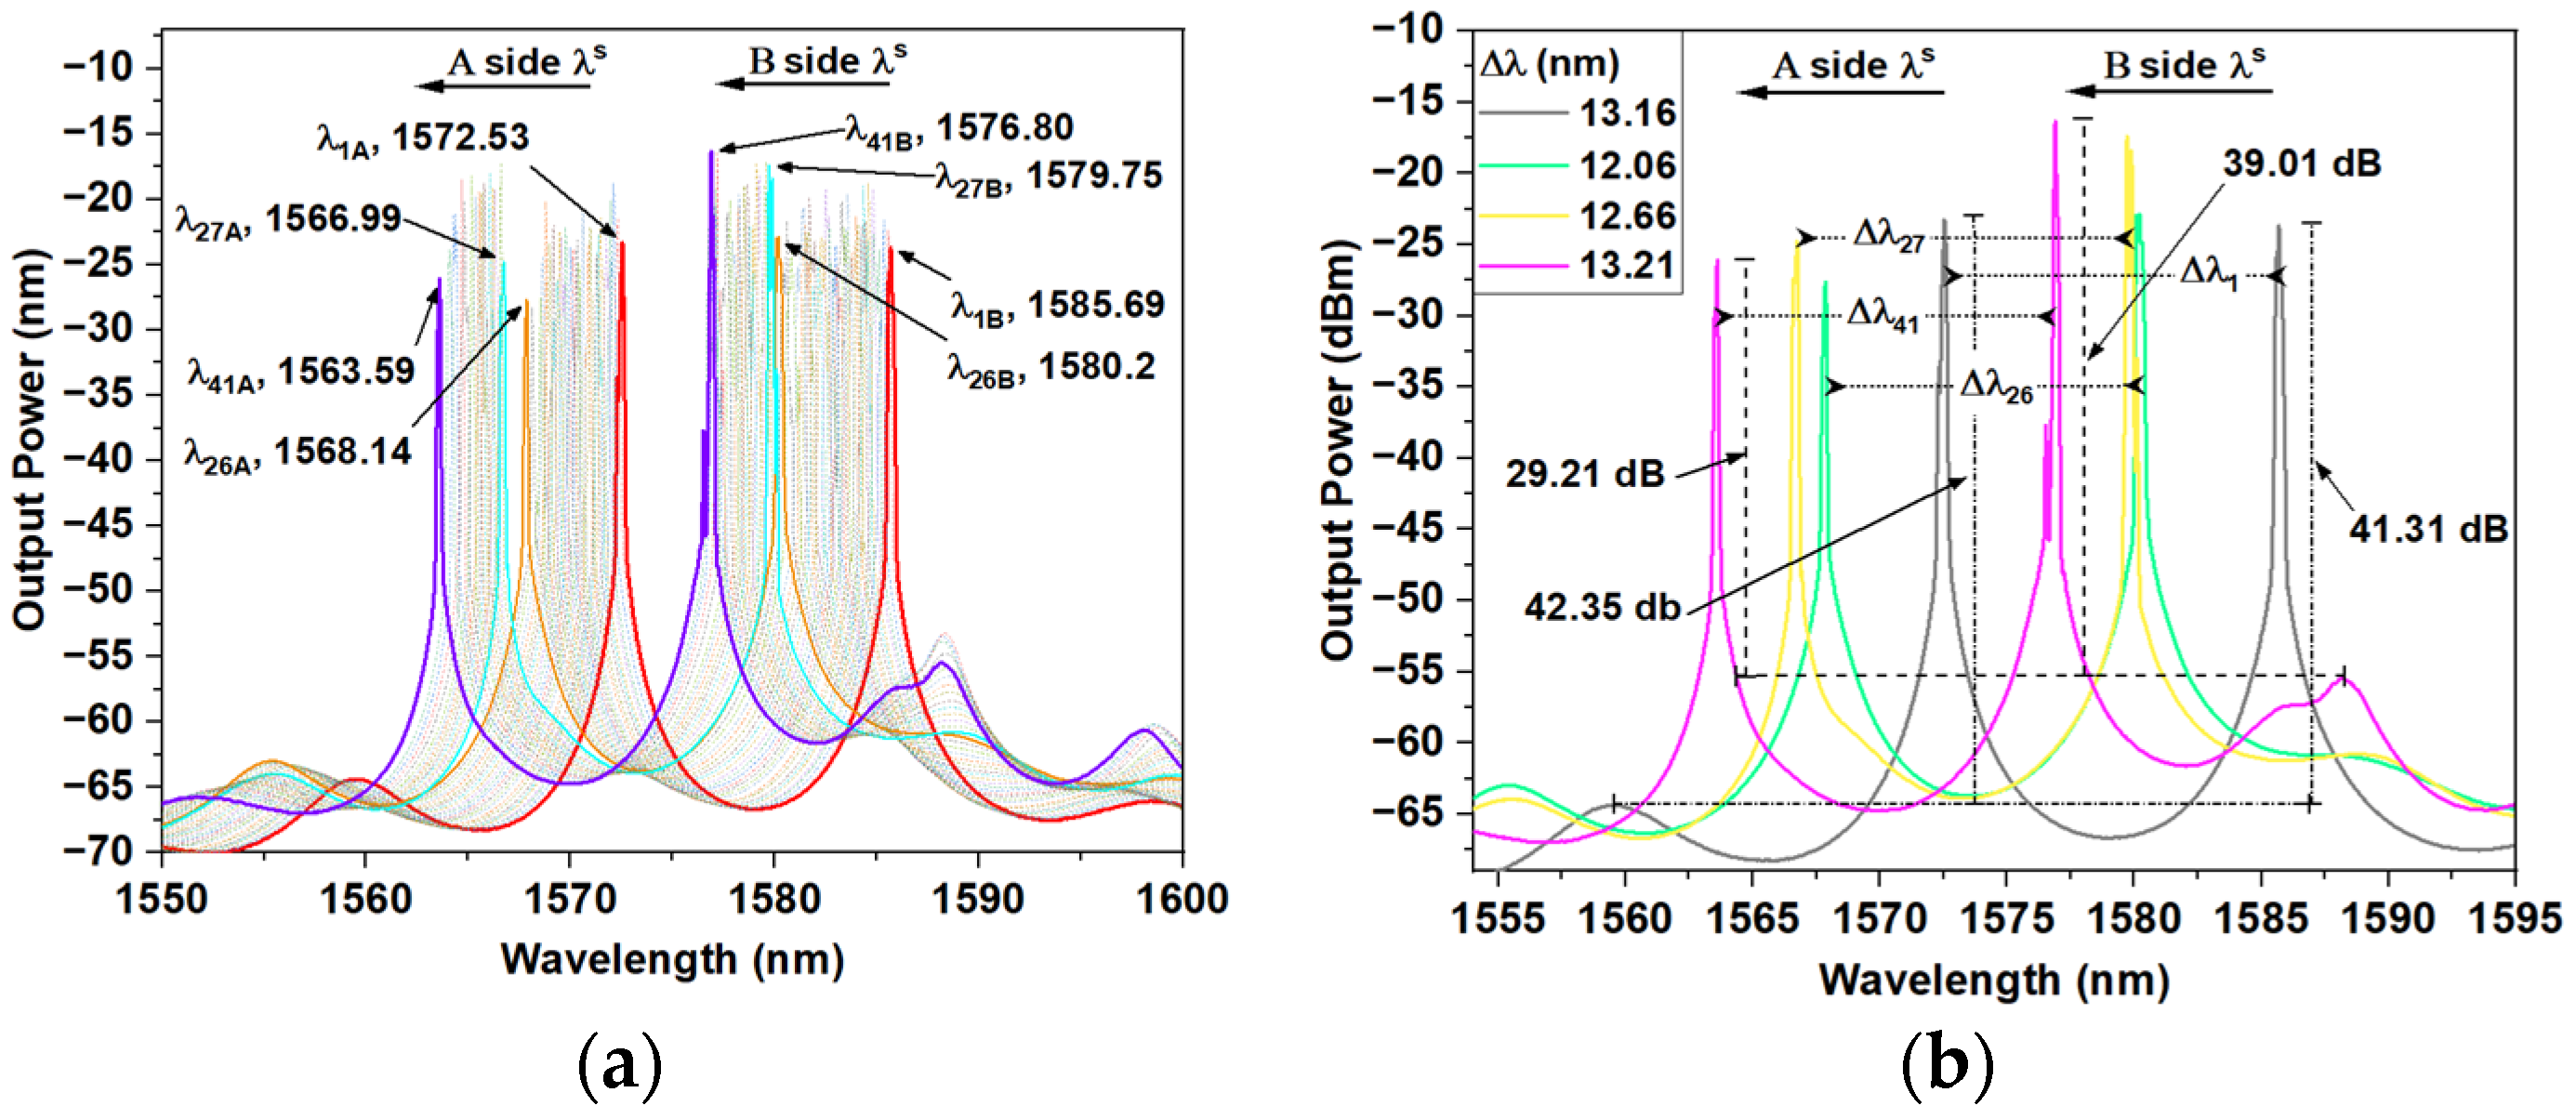
In state-e, a tunable dual-wavelength emission line was achieved by applying curvature to the MZI filter, resulting in a tuning range of 8.81 nm and a wavelength interval of approximately 0.22 nm, with curvature in a range from 5.3042 m−1 to 6.0495 m−1 (see Figure 10). The tuning process involved a total of 41 samples, labeled λ1, λ2, …, λ41. The initial λ1 (represented by the red line in Figure 10a) exhibited a dual wavelength at λ1A = 1572.53 nm and λ41B = 1585.69 nm, with respective SMSR values of 42.35 dB and 41.31 dB. The final dual-wavelength λ41 (depicted by the violet line in Figure 10a) was recorded at λ41A = 1563.68 nm and λ41B = 1576.88 nm, showing SMSR values of 29.21 dB and 42.35 dB, respectively. Figure 10b illustrates that the adjacent peaks for the initial and final wavelengths were separated by 13.16 nm and 13.21 nm. During the tuning process, it was observed that the wavelength interval between λ26 and λ27 was 1.08 nm for side A (λs) and 0.48 nm for side B (λs). The adjacent peaks for λ26 and λ27 were separated by 12.06 nm and 12.76 nm, respectively. Figure 3a shows an FSR of 9.58 nm resulting from the sensor interference pattern. This FSR is smaller than the distance between adjacent peaks. This discrepancy is due to the fact that the TCF core diameter is significantly smaller than the SMF. As a result, the ability to confine guided mode light is reduced, and the mode field diameter is considerably larger, leading to the excitation of higher-order modes and the formation of modal interference [32,33]. As the curvature increases and due to the misalignment of the core diameter and the change in the cutoff wavelength, some modes of the cladding are easily excited [34]. This condition leads to energy absorption and transitions between different modes due to fluctuations in the system. We believe that the differences in the emission spectrum of the filter modes create a variance in the wavelengths of the laser, thus creating a separation between the peaks and effectively expanding its operating range [35]. This analysis provides a thorough explanation of the continuous curvature applied to the MZI sensor and the resulting changes observed in the laser emission signals. Upon analyzing the wavelengths λ28 to λ41, it was found that the separation of adjacent peaks and their wavelength intervals fell within the initially measured tuning lines. Figure 10c illustrates the wavelength lines with higher and lower peak power emissions for the A and B sides λs, demonstrating a peak power variation of 10.41 dB for side A λs and 7.71 dB for side B λs. The variation in the wavelength interval between λ26 and λ27 and the peak power in the span tuning process can be attributed to the increment in curvature applied to the filter. This may have been induced by the change in insert loss during tuning, leading to variations in the core and cladding modes and ultimately affecting the gain spectrum variation [8]. Finally, a linear curvature response was observed, with a sensitivity of −12.2451 nm/m−1 and −11.777 nm/m−1 and R2 values of 0.9923 and 0.9744, respectively, as shown in Figure 10d.

5. MTEFL Experimental Results and Discussion

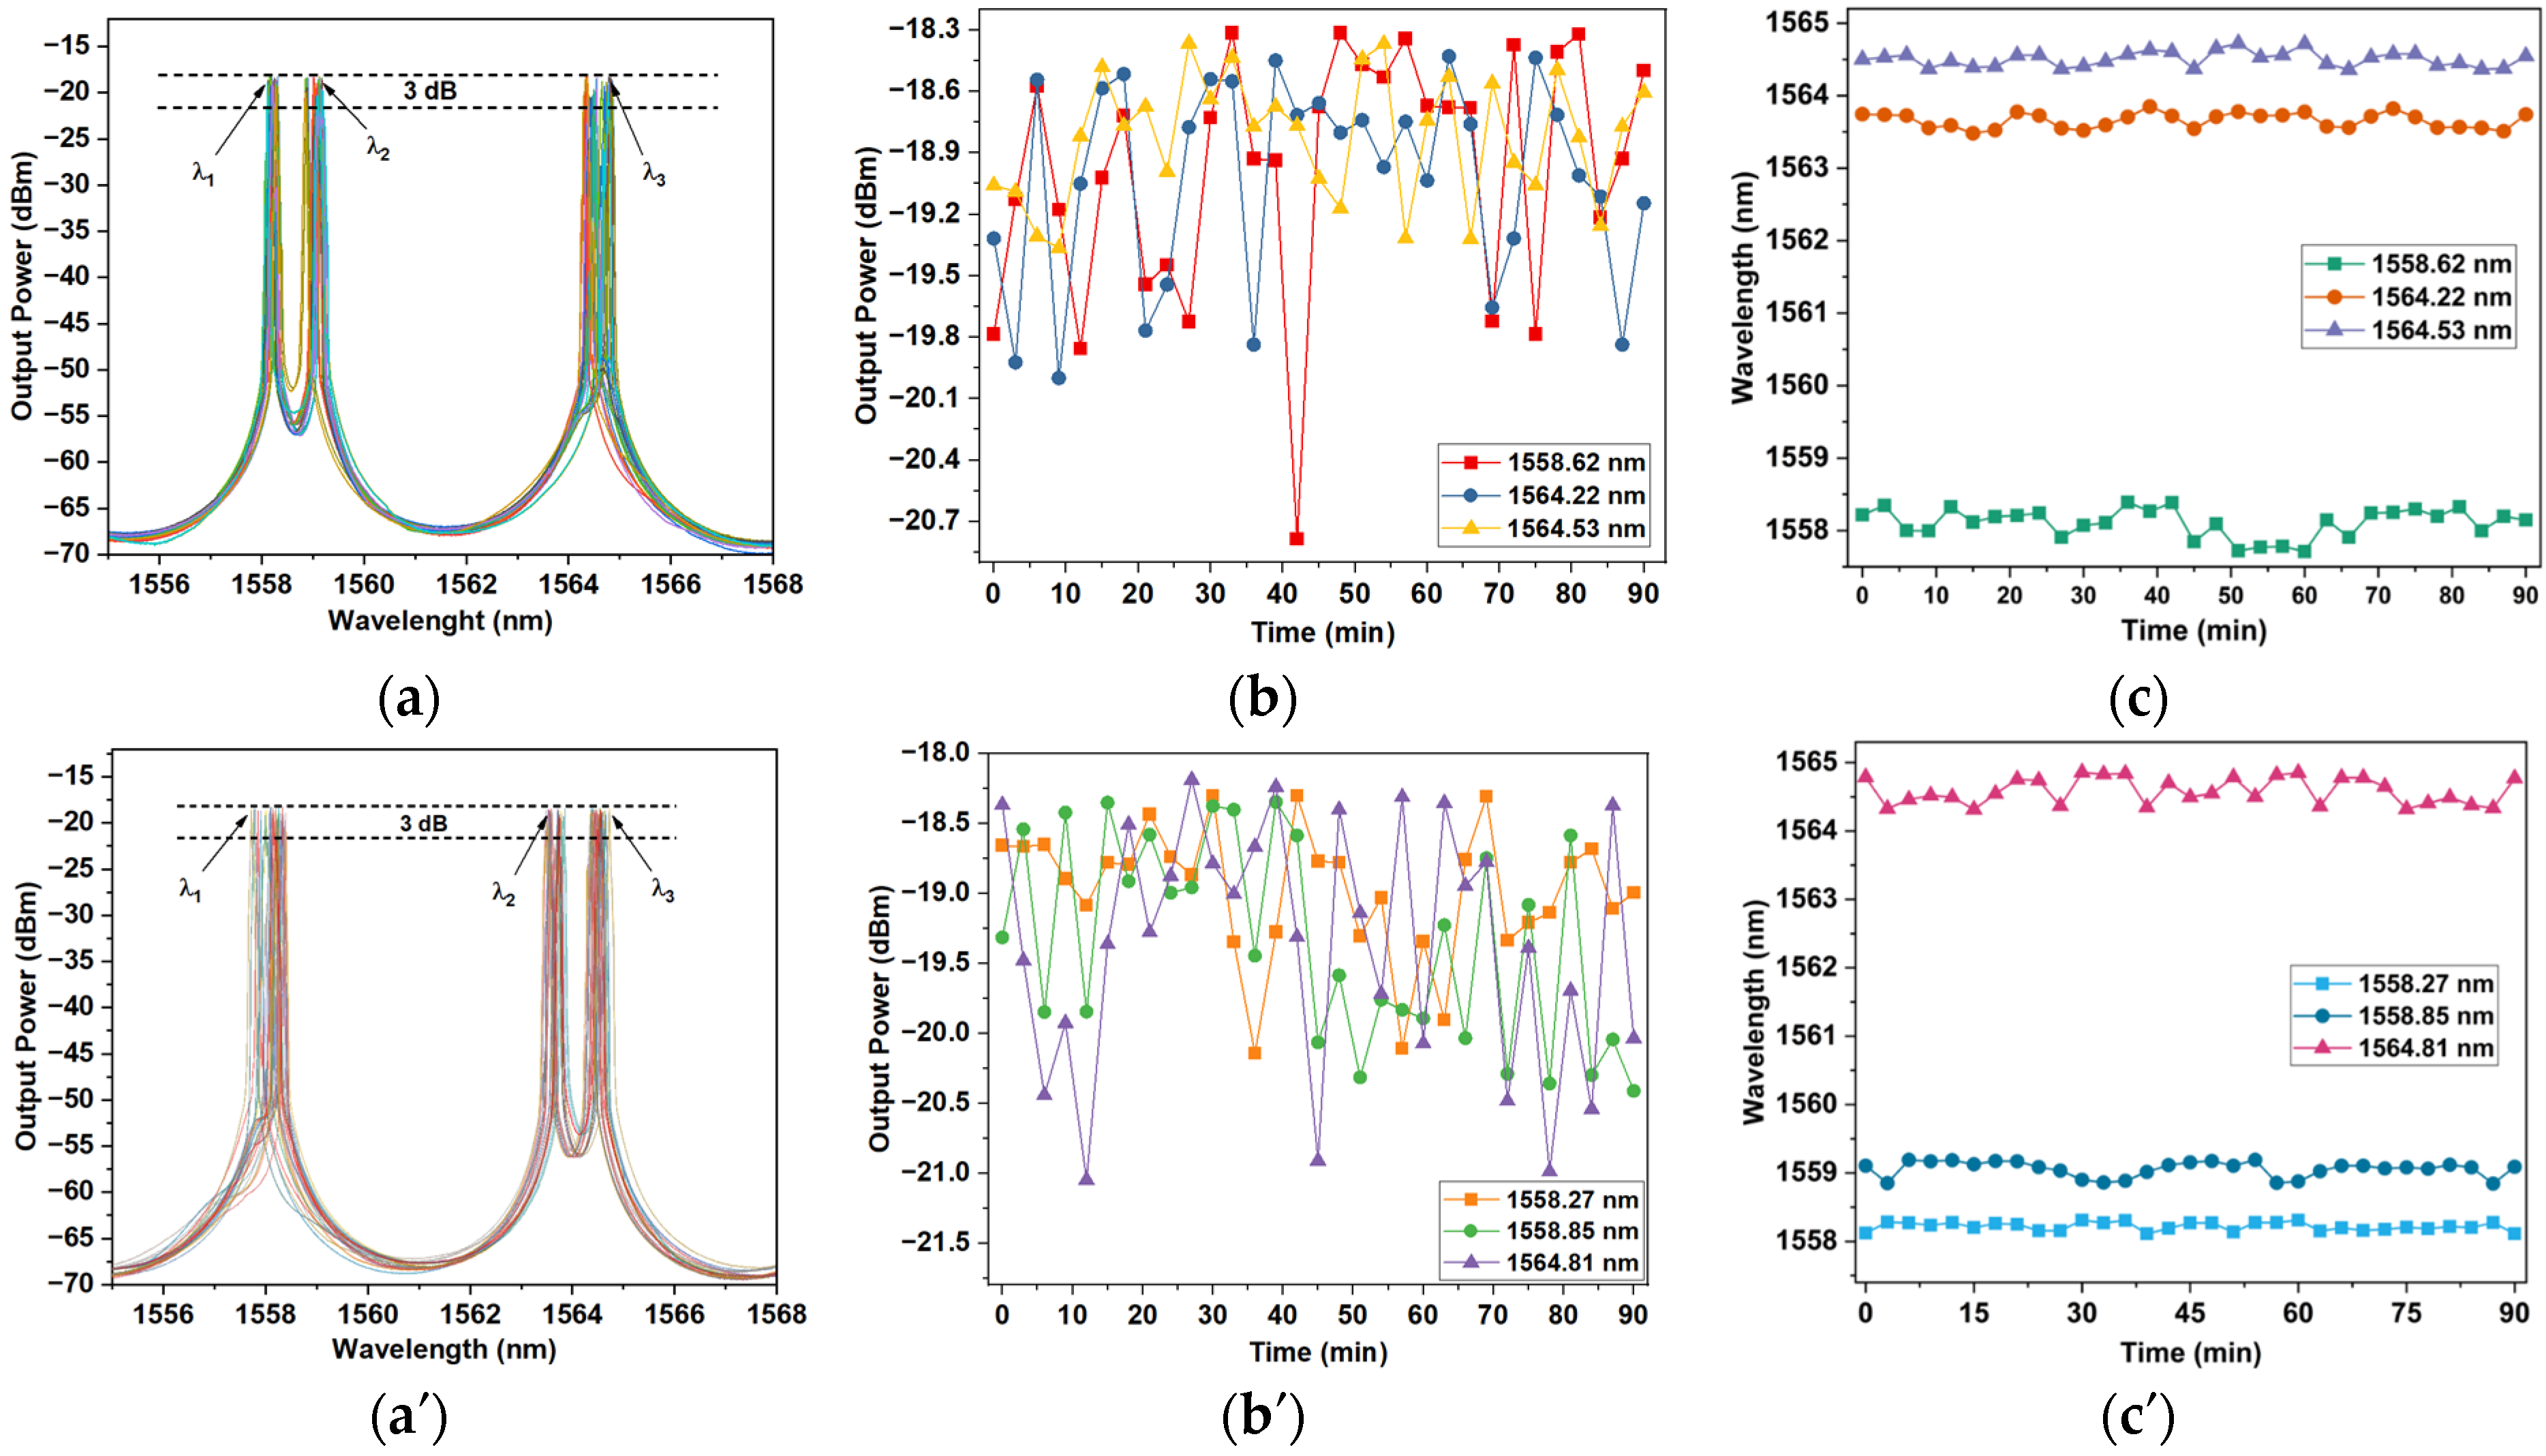
Stability tests were conducted to evaluate the performance of the MTEFL ring-type array at room temperature (25 °C). A total of 31 recordings were taken over 90 min to assess stability. The results of the stability test for the corresponding tuning and switchable emission lines are summarized for single, dual-narrow, and dual configurations in Table 1 and for quadruple and triple lines in Table 2. For the tunable emission lines (Figure 11, Figure 12 and Figure 13), stability analysis focuses on the initial and final lines. In Table 1, we observe that during the tuning process, the fluctuations in power and wavelength are as follows: for single lines, less than 0.87 dB and 0.26 nm; for dual-narrow lines, 1.11 dB and 0.2 nm; and for dual lines, 1.01 dB and 2.57 nm. In Table 2, the stability measurements for the switchable lines (Figure 14 and Figure 15) show power and wavelength fluctuations of less than 2.85 dB and 0.53 nm for quadruple lines and 2.86 dB and 0.68 nm for triple lines, respectively.
Table 3 presents a comparison of the reported performance of fiber lasers with other studies on tunable and multi-wavelength fiber lasers. Wei He et al. [11] reported single- and dual-line emissions using a thulium-doped ring-cavity fiber laser based on a Sagnac loop. This setup involved 1.6 m of TCF in an MZI filter, achieving a tunable range of 40 nm and 13 nm, with an SMSR of 32.68 dB and 33.5 dB, respectively. In another study, Ibarra-Escamilla, B. et al. [36] achieved a range of 12.6 nm for a single line, boasting an SMSR of 55.2 dB, and they reported five emission lines. The primary characteristics of our MTEFL include its switchable and tunable line emissions with an MZI filter, which was fabricated through a simple process using only 2 cm of TCEDF for the interferometer. We reported tunable ranges of 7.62 nm, 2.33 nm, and 8.8 nm, with SMSRs of 49.8 dB, 40.36 dB, and 42.35 dB for single-, dual-narrow, and dual-line emissions, respectively. Although our tunable range is smaller, our SMSRs are superior.

6. Conclusions

In this work, we presented a novel switchable and tunable multi-wavelength ring fiber laser that uses a structure comprising SMF/TCEDF/SMF as a WSF. The proposed ring cavity design features a filter, enabling tunable and switchable laser line emissions that go from single to quadruple wavelengths, achieved by adjusting the curvature on the MZI. Our findings indicate a tuning range of 7.62 nm with an SMSR of 49.80 dB for a single lasing line emission, complemented by a peak power and wavelength fluctuation of less than 0.87 dB and 0.26 nm, respectively. Furthermore, we successfully obtained quadruple lasing lines at specific wavelengths, 1557.99 nm, 1558.89 nm, 1564.02 nm, and 1564.78 nm, with SMSR values of 29.07 dB, 31.98 dB, 39.96 dB, and 34.11 dB, respectively. Additionally, for triple-emission lines at 1558.27 nm, 1558.85 nm, and 1564.81 nm, the SMSR values were 29.15 dB, 31.16 dB, and 26.83 dB, respectively. We also observed a dual-narrow wavelength lasing line at λ1B = 1564.56 nm and λ1A = 1563.71 nm, with a tuning range of 3.22 nm and SMSR values of 36.59 dB and 39.12 dB, respectively. Lastly, a dual wavelength with λ1A = 1572.53 nm and λ41B = 1585.69 nm and an SMSR of 36.59 dB and 39.12 dB was achieved. The intrinsic flexibility, versatility, and adaptability of these multi-wavelength lasers make them essential tools across multiple sectors, including telecommunications, sensors, materials science, medicine, and research. In particular, they are highly invaluable in studies due to their ability to provide a stable range of emissions across several tunable wavelengths. Our study demonstrates the consistent repeatability in tuning and switching among the multiple lines of the proposed laser using the WSF.

Author Contributions

Conceptualization, C.P.-M. and J.G.-G.; methodology, J.L.C.-P.; software, M.V.-T.; validation, R.R.-L. and J.M.E.-A.; formal analysis, J.M.S.-H.; investigation, L.T.-C.; resources, V.H.O.-M.; data curation, E.I.G.-H.; writing—original draft preparation, C.P.-M.; writing—review and editing, J.G.-G.; visualization, P.A.H.-C.; supervision, E.P.-C.-M.; project administration, I.B.G.-V. All authors have read and agreed to the published version of the manuscript.

Funding

This research received no external funding.

Institutional Review Board Statement

Not applicable.

Informed Consent Statement

Not applicable.

Data Availability Statement

The original contributions presented in this study are included in the article. Further inquiries can be directed to the corresponding authors.

Acknowledgments

Christian Perezcampos Mayoral is grateful for the support provided by the Consejo Nacional de Humanidades, Ciencias y Tecnologías (CONAHCYT) of México with grant No. 745773.

Conflicts of Interest

The authors declare no conflicts of interest.

References

  1. Ahmad, H.; Muhammad, F.D.; Pua, C.H.; Thambiratnam, K. Dual-Wavelength Fiber Lasers for the Optical Generation of Microwave and Terahertz Radiation. IEEE J. Sel. Top. Quantum Electron. 2014, 20, 166–173. [Google Scholar] [CrossRef]
  2. Sun, J.; Dai, Y.; Chen, X.; Zhang, Y.; Xie, S. Stable Dual-Wavelength DFB Fiber Laser With Separate Resonant Cavities and Its Application in Tunable Microwave Generation. IEEE Photonics Technol. Lett. 2006, 18, 2587–2589. [Google Scholar] [CrossRef]
  3. Zhao, Q.; Pei, L.; Zheng, J.; Tang, M.; Xie, Y.; Li, J.; Ning, T. Switchable multi-wavelength erbium-doped fiber laser with ajustable wavelength interval. J. Lightw. Technol. 2019, 37, 3784–3790. [Google Scholar] [CrossRef]
  4. Mohd Nasir, M.N.; Yusoff, Z.; Al-Mansoori, M.H.; Rashid, H.A.A.; Choudhury, P.K. Ring caviti multi-wavelength brillouin-erbium fiber laser utilizing a fiber Bragg filter. In Proceedings of the ICSE 2008, Johor Bahru, Malaysia, 25–27 November 2008. [Google Scholar] [CrossRef]
  5. Sierra-Hernandez, J.M.; Rojas-Laguna, R.; Vargas-Rodriguez, E.; Estudillo-Ayala, J.M.; Mata-Chavez, R.I.; Jauregui-Vazquez, D.; Hernandez-Garcia, J.C.; Andrade-Lucio, J.A.; Gutierrez-Gutierrez, J. A tunable multi-wavelength laser based on a Mach-Zehnder interferometer with photonic crystal fiber. Laser Phys. 2013, 23, 055105. [Google Scholar] [CrossRef]
  6. Xie, W.G.; Zhang, Y.N.; Wang, P.Z.; Wang, J.Z. Optical Fiber Sensors Based on Fiber Ring Laser Demodulation Technology. Sensors 2018, 18, 505. [Google Scholar] [CrossRef]
  7. Huang, B.; Sheng, X.; Tang, Z.; Lou, S. High SMSR and widely tunable multi-wavelength erbium doped fiber laser based on cascaded filters. Infrared Phys. Technol. 2022, 122, 104082. [Google Scholar] [CrossRef]
  8. Sierra-Hernandez, J.M.; Rojas-Laguna, R.; Vargas-Rodriguez, E.; Estudillo-Ayala, J.M.; Jauregui-Vazquez, D.; Guzmán-Chávez, A.D.; Zaca-Moran, P. A tunable multi-wavelength erbium doped fiber laser based on a Mach–Zehnder interferometer and photonic crystal fiber. Laser Phys. 2013, 23, 125103. [Google Scholar] [CrossRef]
  9. Ahmad, H.; Roslan, N.A.; Zaini, M.K.A.; Samion, M.Z. Tunable multiwavelength Erbium-doped fiber laser based on in-fiber Fabry-Perot interferometer fiber Bragg gratings in linear and ring cavity configurations. Optik 2022, 262, 169359. [Google Scholar] [CrossRef]
  10. Zhu, L.; He, W.; Zhang, Y.; Luo, F.; Dong, M. Tunable dual-wavelength ring fiber laser with stable output based on saturable absorber and thin core passive fiber. Opt. Fiber Technol. 2014, 20, 487–490. [Google Scholar] [CrossRef]
  11. He, W.; Zhu, L.; Dong, M.; Lou, F. Tuneable and stable multi-wavelength thulium-doped ring-cavity fibre laser based on Sagnac loop and Mach-Zehnder filter utilizinf thin-core fibre. Laser Phys. 2016, 26, 125102. [Google Scholar] [CrossRef]
  12. Zhao, X.; Dong, M.; Zhang, Y.; Luo, F.; Zhu, L. Switchable multi-wavelength and tunable wavelength spacing erbium-doped fiber laser based on a phase-shifted fiber Bragg grating combined with a Mach-Zehnder interferometer. Opt. Laser Technol. 2019, 112, 500–507. [Google Scholar] [CrossRef]
  13. Wei, H.; Zhu, L.; Dong, M. All-fiber Mach-Zehnder comb filter based on tapered fibers for wavelength swichable erbium-doped fiber lasers. Int. J. Optomechatron. 2020, 14, 18–28. [Google Scholar] [CrossRef]
  14. Merza, H.Q.; Al-Hayali, S.K.; Al-Janabi, A.H. All-fiber Mach–Zehnder interferometric comb filter based on macrobend single-mode optical fiber for selecting lasing performance in 1-micron region. Opt. Commun. 2021, 493, 127017. [Google Scholar] [CrossRef]
  15. Al-Janabi, A.; Merza, H.Q.; Al-Hayali, S.K.; Salman, A.M. Switchable mode-locked ytterbium-doped fiber laser based on macrobending loss tuning of figure-eight knot fiber structure. Opt. Eng. 2024, 63, 046104. [Google Scholar] [CrossRef]
  16. Zou, H.; Lou, S.; Yin, G.; Su, W. Switchable dual-wavelength PM-EDF ring laser based on a novel filter. IEEE Photonics Technol. Lett. 2013, 25, 1003–1006. [Google Scholar] [CrossRef]
  17. Gao, S.; Zhang, W.; Bai, Z.; Zhang, H.; Geng, P.; Lin, W.; Li, J. Ultrasensitive Refractive Index Sensor Based on Microfiber-Assisted U-Shape Cavity. IEEE Photonics Technol. Lett. 2013, 25, 1815–1818. [Google Scholar] [CrossRef]
  18. Zhou, Y.; Huang, M.; Wu, J.; Cheng, F.; Liu, J.; Ruan, D.; Chen, Y. Ultra-broadband tunable and switchable multi-wavelength mode-locking tm-doped all-fiber lase. Opt. Laser Technol. 2021, 143, 107364. [Google Scholar] [CrossRef]
  19. Xiao, Y.X.; Wang, J.; Hou, Y.F.; Zhang, L.H.; Wang, S.S. Mode analysis of in-line Mach-Zehnder interferometer with offset splicing. Opt. Fiber Technol. 2021, 6, 102473. [Google Scholar] [CrossRef]
  20. Shu, Y.; Li, L.; Gao, J.; Hu, C.; Deng, L.; Jiang, C.; Li, H. Simultaneous measurement three parameters of temperature, strain, and curvature by thin-core fiber based-Mach-Zehnder interferometer. Opt. Fiber Technol. 2023, 80, 103377. [Google Scholar] [CrossRef]
  21. Wang, Q.; Meng, H.; Fan, X.; Zhou, M.; Liu, F.; Liu, C.; Wei, Z.; Wang, F.; Tan, C. Optical fiber temperature sensor based on a Mach-Zehnder interferometer with single-mode-thin-core-single-mode fiber structure. Rev. Sci. Instrum. 2020, 91, 015006. [Google Scholar] [CrossRef]
  22. Rong, Q.; Qiao, X.; Wang, R.; Sun, H.; Hu, M.; Feng, Z. High-sensitive fiber-optic refractometer based on a core diameter-mismatch Mach-Zehnder interferometer. IEEE Sens. J. 2012, 12, 2501–2505. [Google Scholar] [CrossRef]
  23. Niu, P.; Jiang, J.; Wang, S.; Liu, K.; Ma, Z.; Zhang, Y.; Chen, W.; Liu, T. Optical fiber laser refractometer based on an open microcavity Mach-Zehnder interferometer with an ultra-low detection limit. Opt. Express 2020, 28, 30570–30585. [Google Scholar] [CrossRef] [PubMed]
  24. Qi, Y.; Ma, L.; Kang, Z.; Bin, Y.; Jian, S. Highly sensitive curvature sensor based on a multi-cladding fiber sandwiched dual no-core fibers structure. Appl. Opt. 2014, 53, 6382–6388. [Google Scholar] [CrossRef] [PubMed]
  25. Liu, J.; Wang, M.; Liang, X.; Dong, Y.; Xiao, H.; Jian, S. Erbium-doped fiber ring laser based on few-mode-single-mode-few-mode fiber structure for refractive index measurement. Opt. Laser Technol. 2017, 93, 74–78. [Google Scholar] [CrossRef]
  26. Miao, Y.; Ma, X.; Wu, J.; Song, B.; Zhang, H.; Liu, B.; Yao, J. Photonic crystal fiber modal interferometer based on thin-core-fiber mode exciter. Appl. Opt. 2015, 54, 9415–9418. [Google Scholar] [CrossRef]
  27. Gong, H.; Yang, X.; Ni, K.; Zhao, C.L.; Dong, X. An Optical Fiber Curvature Sensor Based on Two Peanut-Shape Structures Modal Interferometer. IEEE Photon. Technol. Lett. 2014, 26, 22–24. [Google Scholar] [CrossRef]
  28. Li, H.; Li, H.; Meng, F.; Lou, X.; Zhu, L.Q. All-fiber MZI sensor based on seven-core fiber and fiber ball symmetrical structure. Opt. Lasers Eng. 2018, 112, 1–6. [Google Scholar] [CrossRef]
  29. Teyo, T.C.; Shah, N.S.M.; Ahmad, H. A study of laser SNR in an erbium-doped fiber laser subject to external injection. Microw. Opt. Technol. Lett. 2002, 35, 40–42. [Google Scholar] [CrossRef]
  30. Kir’yanov, A.V.; Barmenkov, Y.O.; Sandoval-Romero, G.E.; Escalante-Zarate, L. Er3+ concentration effects in commercial Erbium doped silica fibers fabricated through the MCVD and DND technologies. IEEE J. Quantum Electron. 2013, 49, 511–521. [Google Scholar] [CrossRef]
  31. Herrera-Piad, L.A.; Jauregui-Vazquez, D.; Lopez-Dieguez, Y.; Estudillo-Ayala, J.M.; Hernandez-Garcia, J.C.; Sierra-Hernandez, J.M.; Bianchetti, M.; Rojas-Laguna, R. Highly stable multi-wavelength erbium-doped fiber linear laser based on modal interference. Laser Phys. 2018, 28, 035101. [Google Scholar] [CrossRef]
  32. Xia, T.H.; Zhang, A.P.; Gu, B.; Zhu, J.J. Fiber-optic refractive-index sensors based on transmissive and reflective thin-core fiber modal interferometers. Opt. Commun. 2010, 283, 2136–2139. [Google Scholar] [CrossRef]
  33. Liu, C.; Sun, D.; Yang, J.; Zhang, H.; Ran, L. Ultra-Sensitive Intensity Modulated Strain Sensor by Tapered Thin-Core Fiber Based Modal Interferometer. Photonics 2021, 8, 372. [Google Scholar] [CrossRef]
  34. Akita, S.; Sasaki, H.; Watanabe, K.; Seki, A. A humidity sensor based on a hetero-core optical fiber. Sens. Actuators B Chem. 2010, 147, 385–391. [Google Scholar] [CrossRef]
  35. Sun, X.; Du, H.; Dong, X.; Hu, Y. Simultaneous Curvature and Temperature Sensing Based on a Novel Mach-Zehnder Interferometer. Photonic Sens. 2019, 10, 171–180. [Google Scholar] [CrossRef]
  36. Ibarra-Escamilla, B.; Hernández-Arriaga, M.V.; Durán-Sánchez, M.; Santiago-Hernández, H.; Bello-Jiménez, M.; Pérez, E.R.; Rodríguez-Morales, L.A.; Kuzin, E.A. Abrupt-tapered fiber filter arrangement for a switchable multi-wavelength and tunable Tm-doped fiber laser. Opt. Express 2018, 26, 14894–14904. [Google Scholar] [CrossRef]
  37. Martinez-Ramirez, L.G.; Alvarado, E.C.S.; Gallegos-Arellano, E.; Fernandez-Jaramillo, A.A.; Estudillo-Ayala, J.M.; Jauregui-Vazquez, D.; Rojas-Laguna, R.; Sierra-Hernandez, J.M. Select-cutoff Mach-Zehnder interferometer based on waist-enlarged technique and its multi-wavelength fiber laser application. Infrared Phys. Technol. 2023, 128, 104508. [Google Scholar] [CrossRef]
  38. Tang, Z.; Lou, S. Stable and widely tunable single-/dual-wavelength erbium-doped fiber laser by cascading a twin-core photonic crystal fiber based filter with Mach-Zehnder interferometer. Opt. Laser Technol. 2019, 109, 249–255. [Google Scholar] [CrossRef]
Figure 1. Fiber clamping for SMF/TCEDF/SMF splices. (a) This demonstrates how to adhere the fiber to the metric rod with the masking tape and (b) illustrates how splicing is accomplished with the fusion splicer.
Applsci 14 11578 g001
Figure 2. Core-offset splice SMF/TCEDF/SMF design. (a) Illustrates the splicing between fibers, (b) shows the TCEDF cut, (c) U-shape of the MZI filter, (d) exhibits the z-side view of the MZI.
Applsci 14 11578 g002
Figure 3. (a) Interference spectra generated in the optical cavity of each MZI filter, (b) spatial frequency of the transmission spectrum generated by every filter.
Applsci 14 11578 g003
Figure 4. Diagram of the MTEFL ring array: (a) illustrates the configuration scheme, and (b) depicts the process for inducing curvature in the MZI filter to generate wavelength-switchable tunable emission lines.
Applsci 14 11578 g004
Figure 5. MTEFL emission tuning and switching cases generated for single (state-a), quadruple (state-b), triple (state-c), narrow-double (state-d), and double (state-e) lasing signals.
Applsci 14 11578 g005
Figure 6. (State-a) single-emission signal. (a) Tuning lines, (b) emission samples of curvature and SNR, (c) SMSR and SNR of the most significant peaks and their comparison, (d) the polynomial fit between the curvature data and its wavelength shift.
Applsci 14 11578 g006
Figure 7. Switch with quad-emission line. (a) SMSR on each peak, (b) power difference between the peaks and their separation.
Applsci 14 11578 g007
Figure 8. (State-c) double switch of triple-emission signals: (a) SMSR on the first switch, (b) separation and power of peaks, (c) SMSR of the second switch, (d) separation and the power of peaks.
Applsci 14 11578 g008aApplsci 14 11578 g008b
Figure 9. Narrow-dual-emission signals (state-d). (a) Tuning and the potential difference between peaks and their wavelength comparisons, (b) most significative peaks and power comparison, (c) sensitivity compared to the dispersion of curvature samples.
Applsci 14 11578 g009
Figure 10. Double-emission signal (state-e). (a) Tuning and most significant power peaks, (b) separation comparison, (c) peaks power comparison, (d) sensitivity generated with the curvature/wavelength samples.
Applsci 14 11578 g010aApplsci 14 11578 g010b
Figure 11. (a) Stability test of the single initial and final emission, (b) power variation, (c) wavelength variation.
Applsci 14 11578 g011
Figure 12. First and last emissions signals of the dual-narrow lasing lines. (a) Stability test, (b) power fluctuation, (c) wavelength stability.
Applsci 14 11578 g012
Figure 13. Stability tests of the dual lasing lines. (a) Stability test on the first emission, (b) power fluctuation, (c) wavelength stability, (a’) stability test on the last emission, (b’) power fluctuation, (c’) wavelength stability.
Applsci 14 11578 g013
Figure 14. (a) Stability tests of the quad-emission line, (b) power variation, (c) wavelength variation.
Applsci 14 11578 g014
Figure 15. Stability tests of the triple emissions. (a) On the first switch, (b) power variation, (c) wavelength variation, (a’) test on the second switch, (b’) power variation, (c’) wavelength variation.
Applsci 14 11578 g015
Table 1. Tunable laser emission lines, stability testing guidance and highlights.
StateFigureCurvature
(m−1)
Emission
Lines
Wavelength
(nm)
Max Wavelength Fluctuation
(nm)
Max Peak Power Fluctuation
(dB)
aFigure 112.5871Singleλ11556.400.100.87
λ891564.500.260.78
dFigure 120.2670Dual
narrow
λ1A1573.700.200.78
λ1B1564.500.101.11
λ14A1561.300.090.81
λ14B1562.200.080.78
eFigure 130.7453Dualλ1A1572.532.000.67
λ1B1585.692.260.68
λ41A1563.681.971.01
λ41B1576.882.570.78
Table 2. Switchable laser emission lines, stability testing guidance and highlights.
StateFigureEmission LinesWavelength
(nm)
Max Wavelength
Fluctuation (nm)
Max Peak Power
Fluctuation (dB)
bFigure 14Quadrupleλ11557.990.331.69
λ21558.890.532.68
λ31564.020.492.85
λ41564.780.412.34
cFigure 15Tripleλ2A1558.270.202.47
λ2B1558.850.351.00
λ2C1564.810.541.57
λ1A1558.620.681.84
λ1B1564.220.372.06
λ1C1563.530.362.86
Table 3. Comparison between similar works using a sensor in a laser cavity to generate switchable and tunable multi-wavelength emission lines.
Ref.Main
Characteristics
Emission LinesTuning
(nm)
SMSR
(dB)
[7]Cacade structure—Sagnac loop filter (SLF)/twin core photonic crystal fiber (TCPCF)123.0457
21940
[8]MZI
(SMF/PCF/SMF)
12430
23.43
3-28
[11]Sagnac loop and MZI filter—SMF/TCF/SMF14032.68
21333.5
3-34.51
[36]Double SMF tapers/thulium-doped fiber (TDF) from the ASE1-51
212.655.2
3-52
4-48
5-48
[37]MZI—SMF/with a segment of select cutoff fiber (SCF)/SMF14.8855.3
[38]SMF/TCPCF/SMF—MZI123.0445
233.8242
This workMZI—core-offset
SMF/TCEDF/SMF
17.6249.8
2-narrow2.3340.36
28.842.35
3-36.83
4-39.96
Disclaimer/Publisher’s Note: The statements, opinions and data contained in all publications are solely those of the individual author(s) and contributor(s) and not of MDPI and/or the editor(s). MDPI and/or the editor(s) disclaim responsibility for any injury to people or property resulting from any ideas, methods, instructions or products referred to in the content.