Article

Experimental Study on the Changes to the Microstructures and Dynamic Mechanical Properties of Layered Sandstone After High-Temperature Treatment

1
Key Laboratory of Road and Railway Engineering Safety of Ministry of Education, Shijiazhuang Tiedao University, Shijiazhuang 050043, China
2
School of Civil Engineering, Shijiazhuang Tiedao University, Shijiazhuang 050043, China
3
Hebei Province Metal Mine Safe and Efficient Mining Technology Innovation Center, Shijiazhuang 050043, China
*
Author to whom correspondence should be addressed.
Appl. Sci. 2024, 14(24), 11729; https://doi.org/10.3390/app142411729
Submission received: 18 November 2024 / Revised: 12 December 2024 / Accepted: 12 December 2024 / Published: 16 December 2024
(This article belongs to the Topic Exploitation and Underground Storage of Oil and Gas)

Abstract

:
In this study, changes in the basic physical properties, mineral composition, mass, and microstructure of layered sandstone were evaluated following heat treatment at 200–800 °C. Dynamic impact compression tests were performed using a split-Hopkinson pressure bar test system (SHPB), and digital image correlation (DIC) was used to monitor the dynamic failure processes of the involved specimens. Results indicate that high-temperature treatment reduces the mass, wave velocity and peak stress of layered sandstone; increases the porosity, pore length, and pore aperture. The rates of decrease in the wave velocity and peak stress considerably increase with increasing temperature above a threshold of 400 °C. This is because at temperatures above 400 °C, thermal cracks will form both between and within particles. As the number of cracks increases, they will propagate and connect with each other, forming a network of cracks. DIC results show that as the heat treatment temperature rises, the range of the strain-concentration areas, which are formed by sandstone failures, substantially expands. However, the increase in the heat treatment temperature only negligibly influences the propagation direction of primary sandstone cracks, which mainly propagate along the weak bedding planes.

1. Introduction

In China, source rock strata are rich in unconventional oil and gas resources. Considerable progress has been made in exploring and developing these resources through targeted theoretical and technological research, a process that is key to increasing reserves and production of these resources [1]. Unconventional oil and gas reservoirs are characterized by low porosity and permeability; therefore, the key to efficient exploitation of these reservoirs is to increase their permeability and improve their seepage conditions, thereby increasing the production per well. In recent years, researchers have proposed a variety of stimulation techniques and methods to improve seepage conditions and to create reservoir fracture networks, such as hydraulic fracturing [2], carbon dioxide fracturing [3], anhydrous liquid nitrogen fracturing [4], the use of acoustic vibration [5], high-temperature thermal stimulation for enhanced permeability [6], and in situ combustion fracturing [7]. Combustion fracturing involves mechanical reformation by shock waves and high-pressure blast products, along with explosion-induced sustained high-temperature thermal effects, which are present around the involved well. These features substantially impact the pore–crack microstructures in reservoirs, thus improving the seepage conditions within. Therefore, assessing the evolution of pore–crack structures in sandstone reservoirs under high-temperature thermal effects and dynamic impacts is essential. Such investigations are of great importance to feasibility studies on the use of combustion fracturing techniques for enhancing reservoir permeability.
Extensive research has been conducted on the static and dynamic fracture mechanical behaviors of homogeneous sandstone following high-temperature treatment, achieving notable results [8,9,10,11,12,13,14]. Ping et al. [15,16] conducted impact compression tests on sandstone specimens subjected to high-temperature cycling and found that the mass, density, and wave velocity of the specimens decreased with a quadratic function of the number of cycles, and the dynamic compressive strength and dynamic strain showed different trends before and after 400 °C. Li et al. [17] investigated the dynamic mechanical properties of heat-treated homogeneous coal-bearing sandstone, demonstrating that 500 °C was the transitional point for the dynamic properties of coal-bearing sandstone. When the temperature exceeded 500 °C, the dynamic elastic modulus and peak strength of the sandstone dropped sharply, while its dynamic peak strain increased significantly. Yin et al. [18,19] used a high-speed camera to examine the dynamic failure process of sandstone that had been heat-treated at high temperatures; they found that its dynamic compressive strength initially increased and then decreased as the temperature rose, peaking when the temperature reached 200 °C. The peak strain increased approximately linearly with increasing temperature. The dynamic elastic modulus showed an overall trend of decreasing nonlinearly; the primary failures of the sandstone were tensile failures. Notably, the higher the temperature, the greater the degree of fracturing and the smaller the fragmented rock mass.
The dynamic compressive strength and dynamic elastic modulus of heat-treated homogeneous sandstone show a nonlinear decrease with increasing temperature, and there is a sudden change point around 400–500 °C. However, natural sandstone reservoirs are usually discontinuous media with various structural planes (such as bedding planes, joint planes, etc.). These bedding planes are usually oriented and have a significant impact on the mechanical properties and failure process of sandstone [20], but there are currently few research reports. On this theoretical basis, layered sandstone separated by bedding panes was subjected to heat treatment at 200 °C, 400 °C, 600 °C, and 800 °C in this study, and its compositional and microstructural changes following high-temperature treatment were characterized using X-ray diffraction (XRD), thermogravimetric (TG) analysis, scanning electron microscopy (SEM), and computed tomography (CT) techniques. In addition, dynamic impact mechanical tests were conducted using a split-Hopkinson pressure bar (SHPB) test system. This was combined with digital image correlation (DIC) in order to: (a) monitor in real-time the dynamic fracturing processes of sandstone specimens heat-treated at different temperatures, (b) investigate the impacts of the heating temperatures on the dynamic mechanical parameters of the specimens, and (c) reveal the mechanism by which the bedding planes affect the dynamic crack propagation within at high temperatures.

2. Materials and Methods

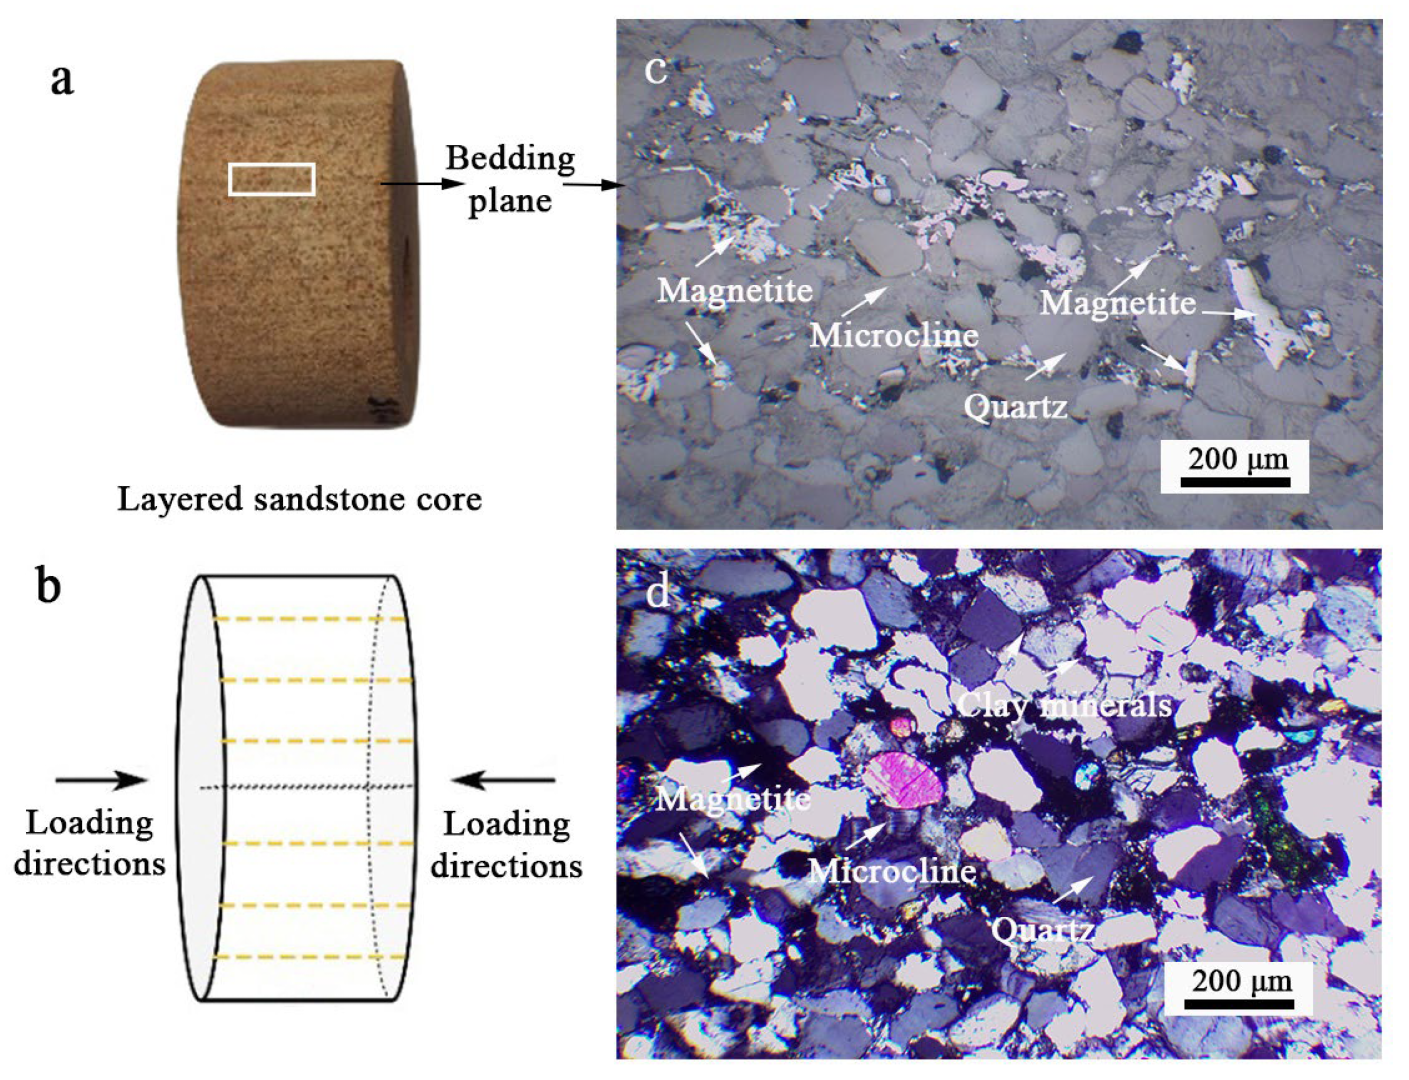
2.1. Preparation of Sandstone Specimens

In this study, layered sandstone from Sichuan province, China was selected for laboratory testing. The sandstone specimens were collected from a single light-yellow rock with good structural integrity. The sandstone core was drilled at an angle parallel to the bedding planes of the rock; it was then cut and polished into standard specimens with dimensions of Φ50 mm × 100 mm and Φ50 mm × 25 mm. The flatness of both ends after polishing was within ±0.02 mm, with an axial deviation of less than 0.25°. Figure 1a depicts a core specimen of the sandstone, and Figure 1b illustrates the relationship between the layered sandstone and impact loading directions. The layered sandstone specimens were ground and polished into thin slices; then, a polarized microscope was used for rock mineral identification. The results are shown in Figure 1c,d. The layered sandstone was found to primarily comprise quartz, microcline, small amounts of clay minerals, and magnetite. The bedding plane bands were formed by the oriented aggregation of magnetite grains embedded between quartz and feldspar grains. Mineral grains, with sizes of 0.05–0.25 mm, were arranged in an interlocking cementation structure, exhibiting a fine-grained composition.

2.2. Heat Treatment of the Specimens

The layered sandstone specimens were heat-treated in a muffle furnace. The heat treatment temperatures were set to 200 °C, 400 °C, 600 °C, and 800 °C, respectively, with a heating rate of 5 °C/min. To ensure complete heating of the core, the target temperature was maintained for 3 h after it had been attained, followed by natural cooling in the furnace. An electronic balance and the HS-YS4A rock acoustic parameter tester were used to measure the mass and wave velocity of the core.

2.3. Phase Identification and Microstructure Test

A SmartLab XRD (Rigaku, Tokyo, Japan) was used to detect the phase compositions of the specimens, with a 2θ test range of 5°–90° in 0.01° intervals. A STA449F3 TG thermal analyzer (Netzsch, Stuttgart, Germany) was used to measure the mass loss of the specimens, within a range of 25–850 °C using a heating rate of 20 °C/min in air. A Hitachi SU8010 field emission SEM (Hitachi, Tokyo, Japan) was used to observe microstructural characteristics following high-temperature treatment. A nanoVoxel-2740E X-ray high-precision CT scanner (Sanying, Tianjin, China) and Avizo 21 software were used for 3D pore structure analysis by scanning cylinders (10 mm diameter and 10 mm height) and reconstructing 2D tomography images into 3D.

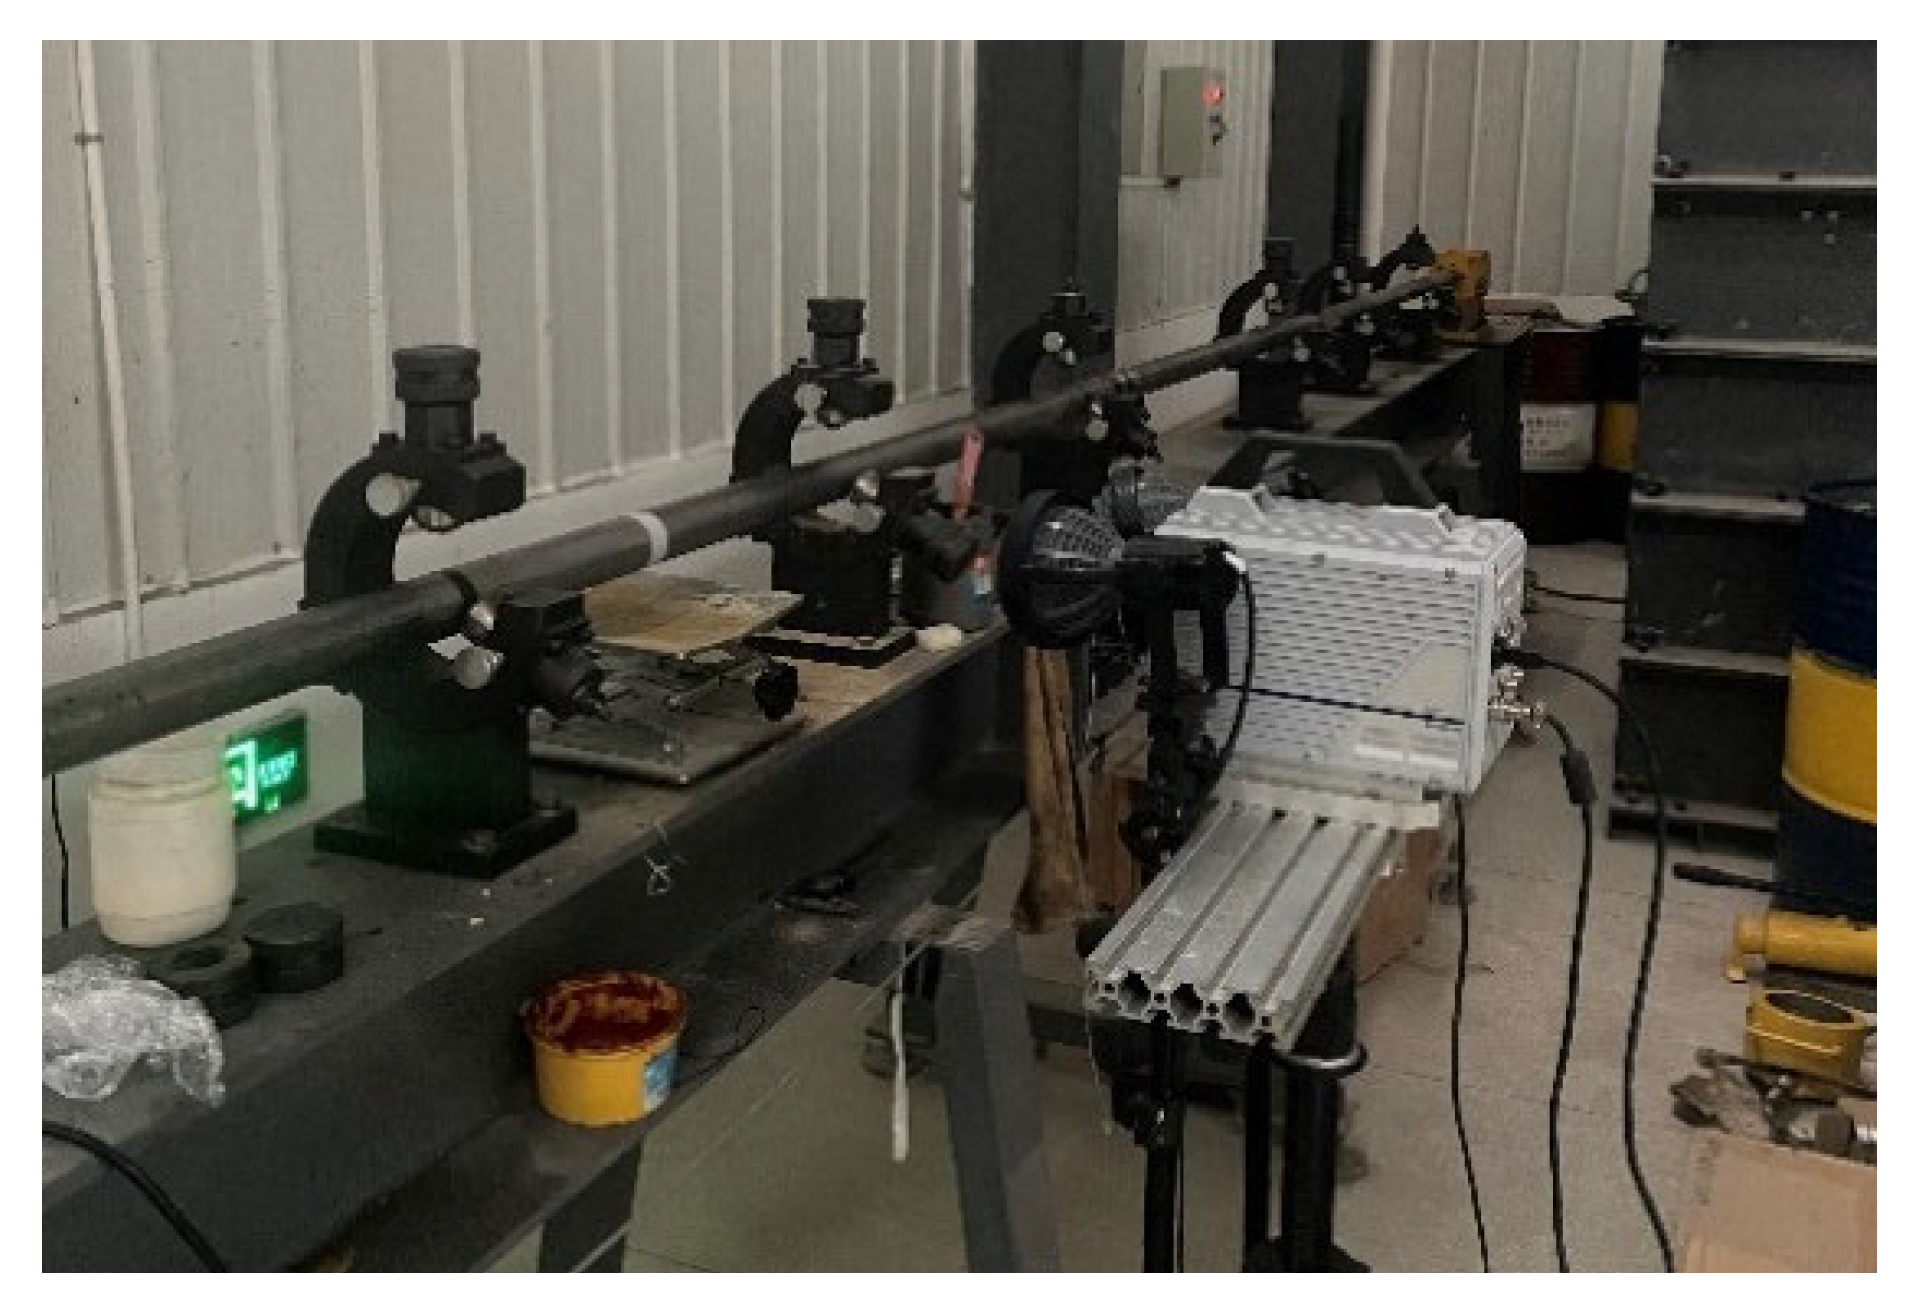
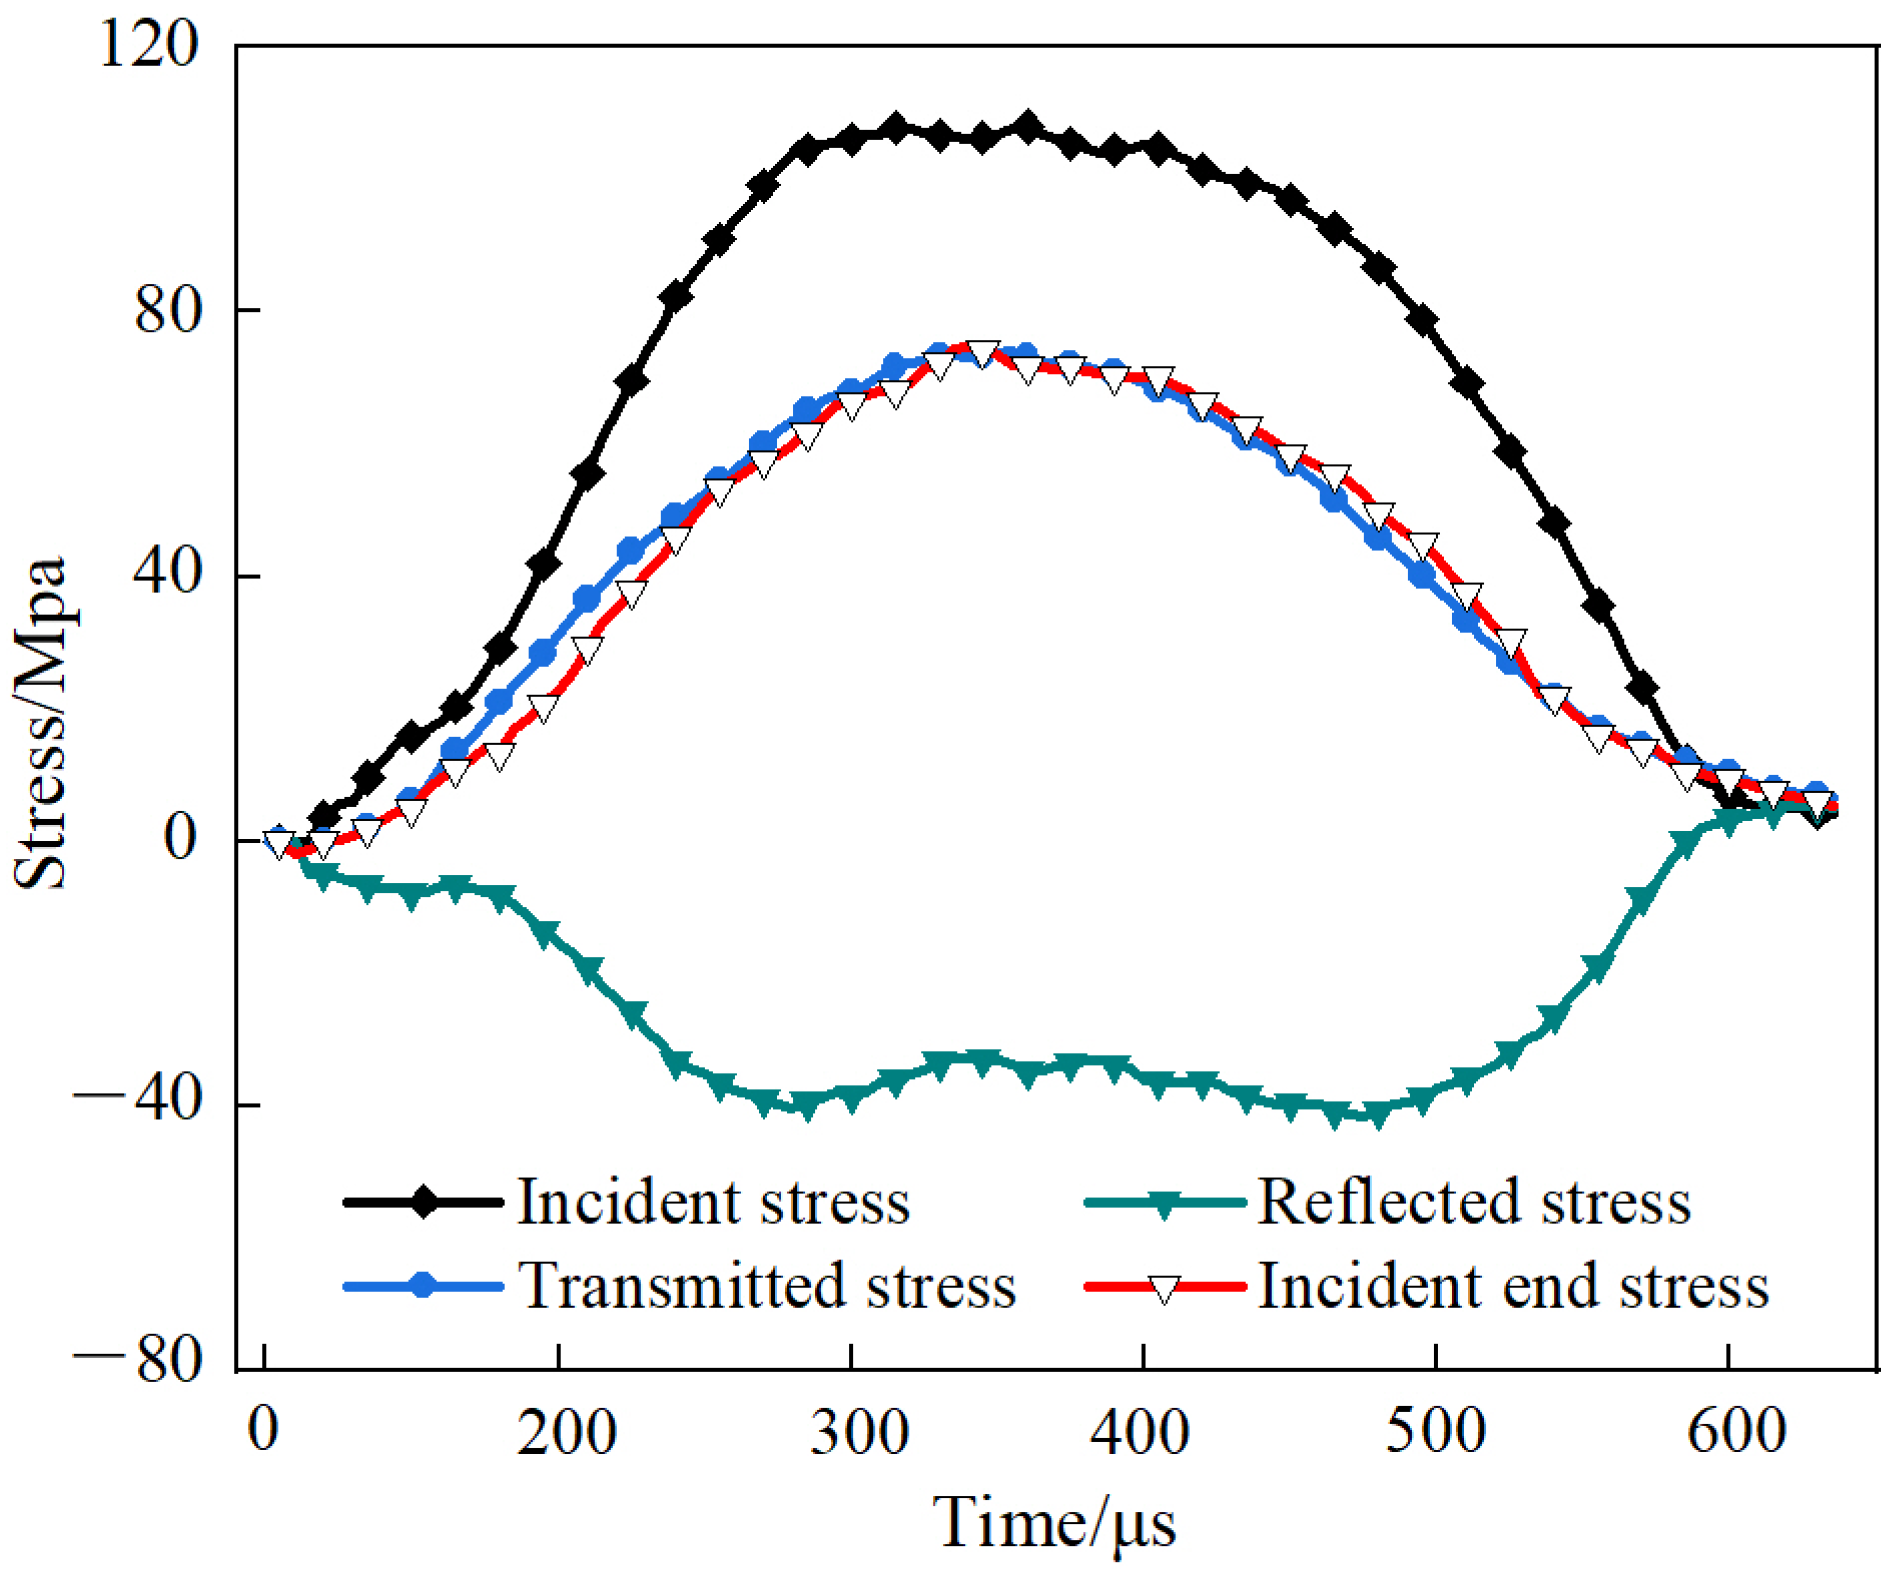
2.4. Quasi-Static Uniaxial Compression and SHPB Impact Test

The standard cylindrical specimens with a diameter of 50 mm and height of 100 mm were tested by the TAW-2000 rock mechanics test system to perform conventional uniaxial compression tests, using displacement control for loading with a loading rate of 0.01 mm/s.
The SHPB impact test was performed using the SHPB system (Figure 2) at the mechanics laboratory of Wuhan University. The striker, incident, and transmitted bars were manufactured from high-strength 40 Cr alloy steel with a material density of 7800 kg/m3. The pressure bar had a diameter of 50 mm, an elastic modulus of 210 GPa, a Poisson’s ratio of 0.3, and a longitudinal wave velocity of 5670 m/s. Both the incident and transmitted bars had a diameter of 50 mm and a length of 2500 mm. The striker bars had a diameter of 37 mm and a length of 400 mm. To ensure that the test specimen can be fractured but not crushed under impact loading, a trial impact was conducted on the test specimen before the experiment. Finally, an impact pressure of 0.1 MPa was selected for the experiment. The average strain rate ranged from 15.7 s−1 to 29.1 s−1. Before impact loading, Vaseline petroleum jelly was evenly applied to both ends of the specimen to reduce the friction between the specimen and pressure bar. Figure 3 shows the stress waveforms of the elastic pressure bars at both ends of the specimen under impact compression. The curve of the transmitted wave aligns closely with the curves of the incident wave + reflected wave, indicating that before the peak stress was reached and the specimen failed, the stresses at both ends were generally in equilibrium, and therefore, satisfied the stress equilibrium conditions defined in the one-dimensional stress wave theory. According to this theory, the mean axial stress σ(t), mean strain ε(t), and mean strain rate ε ˙ (t) of the specimen can be calculated using the strain pulse data and the following equations:
σ t = A e E e 2 A s ε i t + ε r t + ε t t
ε t = c e L s 0 t [ ε i t ε r t ε t t ]
ε ˙ t = c e L s [ ε i t ε r t ε t t ]
where Ae and As are the cross-sectional areas of the bar and granite specimen, respectively; Ee, ce, and Ls are the Young’s modulus of the elastic bar, velocity of the 1D elastic longitudinal wave, and length of the granite specimen, respectively; and subscripts i, r, and t correspond to the incident, transmitted, and reflected wave signals recorded by the strain acquisition system, respectively.

2.5. High-Speed Imaging and DIC Testing

Before the test, a layer of white primer was sprayed onto the specimen surface. After the primer dried, a black matte paint was sprayed in a random pattern onto the surface of the white primer to create black spots with appropriate density and random distribution. A FASTCAM SA5 high-speed camera from the Photron Corporation (Tokyo, Japan) was used to capture the specimen failure process at a frame rate of 50,000 fps and a resolution of 256 × 368 pixels. Photographs were captured in intervals of 20 μs. A light-emitting diode was used as a stable light source during the test. The DIC test system primarily comprised an image acquisition device, a light source, and a data postprocessing software. By tracking the motion of the black spots on the surface of the specimen, the system was able to analyze its surface strain. The VIC-2D 8 software was then used to calculate and analyze the full-field displacement and strain of the specimen with the acquired scattered spot images.

3. Results and Discussion

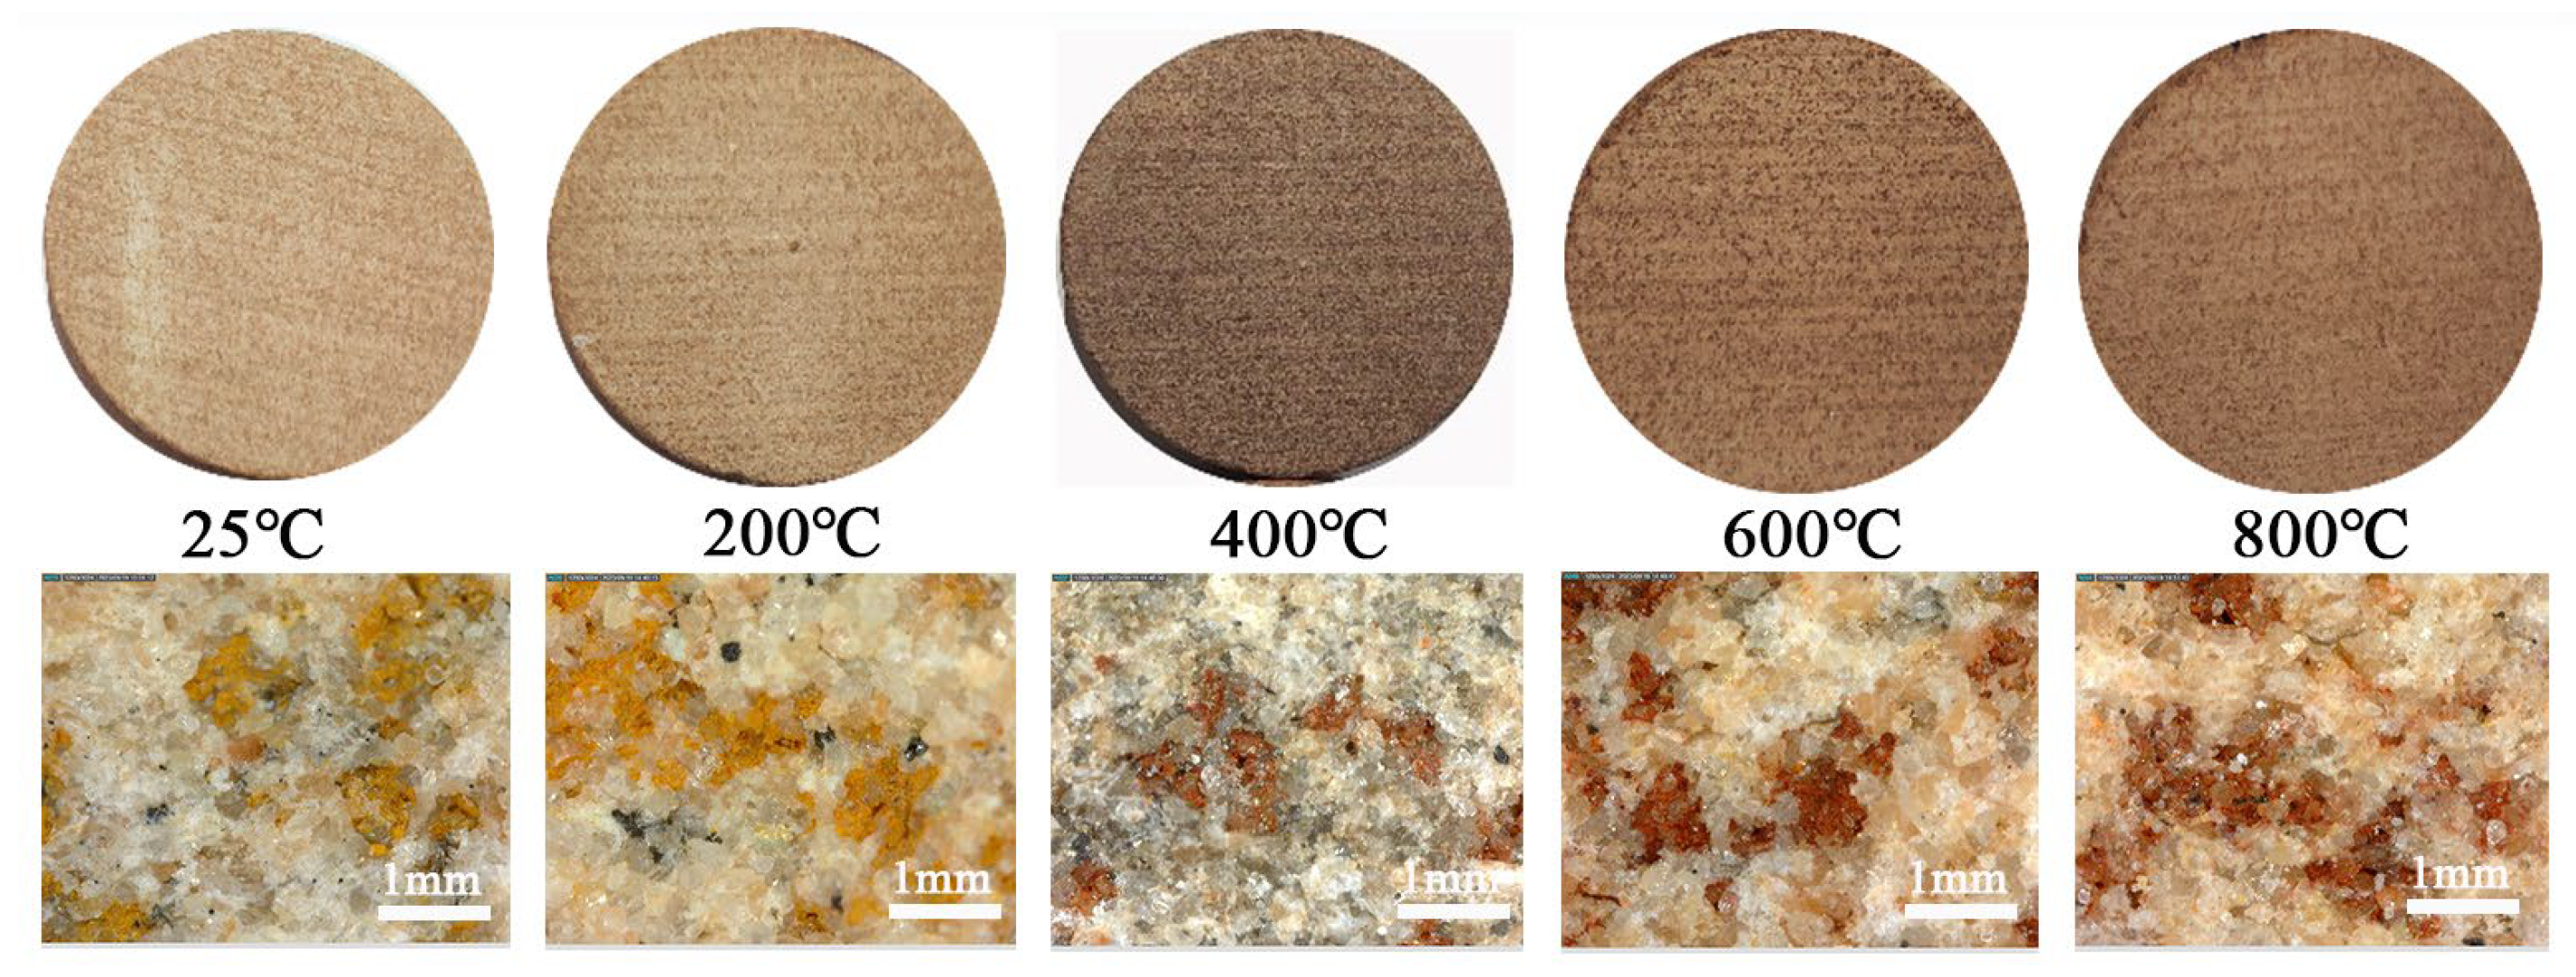
3.1. Changes in the Apparent Color After High-Temperature Treatment

Figure 4 depicts the sandstone specimens following treatment at different temperatures. At low temperatures, the change in surface color was insignificant. However, as the temperature rose, the specimen color changed significantly from light yellow to brown at 400 °C. After the temperature exceeded 400 °C, the specimen color changed from brown to reddish brown. Observation of the specimen magnified under a microscope revealed that these changes in color were mainly caused by changes in the clay minerals between quartz grains. Notably, Fe2+ in the clay minerals was believed to be oxidized to Fe3+ at high temperatures, thus changing the color of the sandstone core.

3.2. Changes in Mass and Wave Velocity After High-Temperature Treatment

Figure 5 illustrates the pattern of change in the mass loss rate and wave velocity reduction rate in the layered sandstone after high-temperature treatment. Mass loss rate is defined as the ratio of the reduction in rock mass upon heat treatment to the original rock mass. The wave velocity reduction rate is defined as the ratio of the reduction in the rock wave velocity upon heat treatment to the original wave velocity. As shown in Figure 5a, when the temperature is below 400 °C, the mass loss rate of sandstone is less than 1%; when the temperature is between 400 °C and 600 °C, the speed of mass loss increases obviously; when it ranges from 600 °C to 800 °C, the speed of mass loss decreases. As shown in Figure 5b, within 400 °C, the decrease in wave velocity is slow. When the temperature exceeds 400 °C, the decrease in wave velocity increases significantly. At 800 °C, the wave velocity reduction rate can reach up to 65.61%.

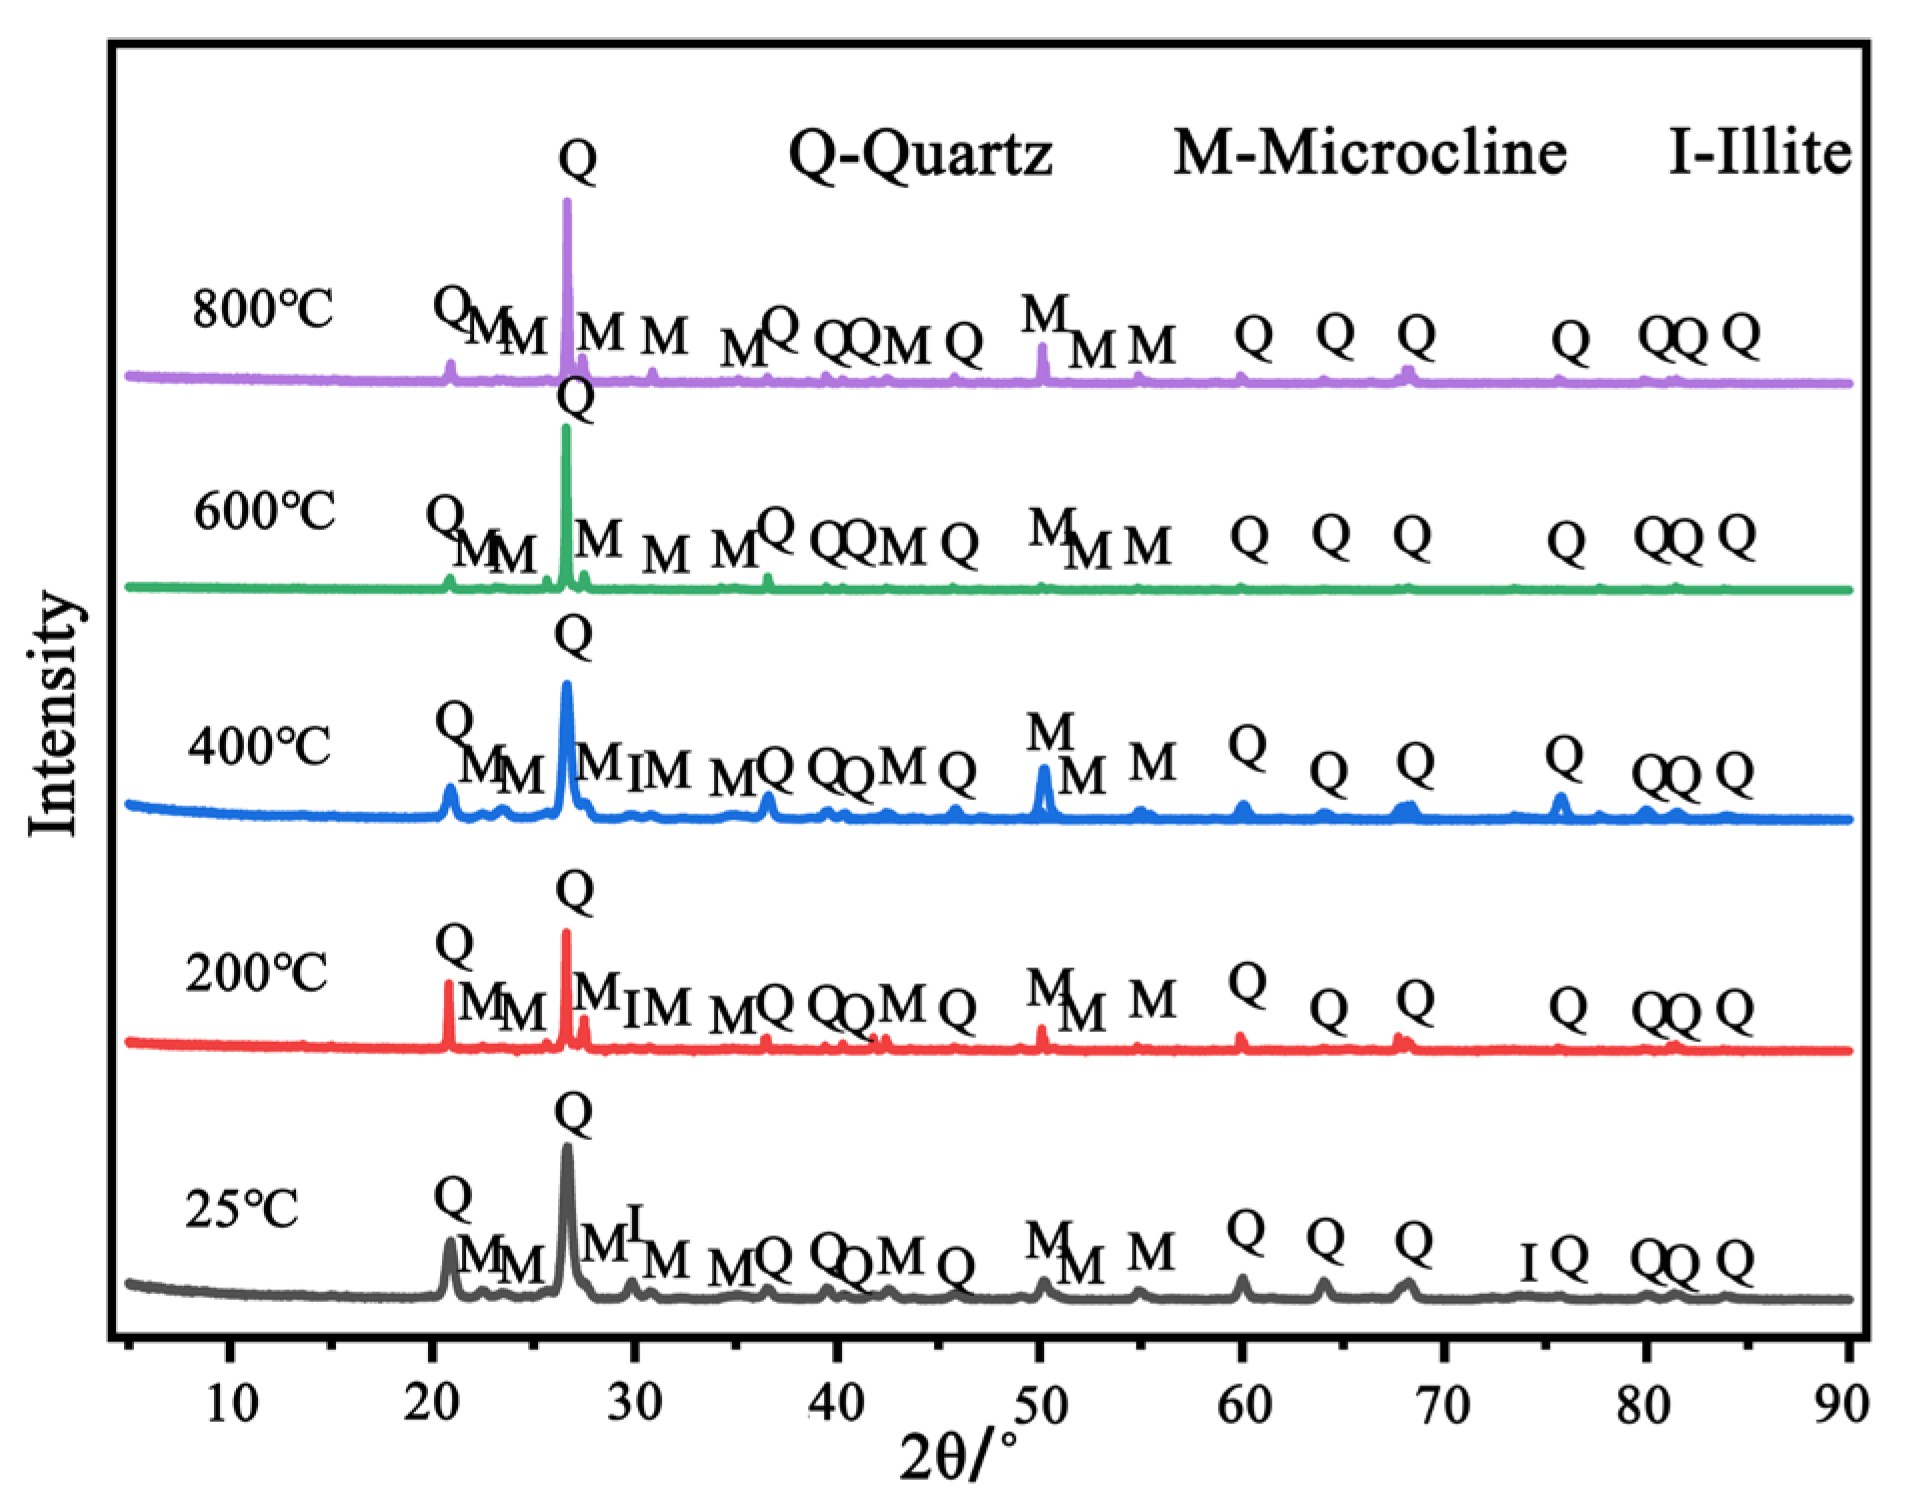
3.3. XRD Phase and TG Analyses of Layered Sandstone After High-Temperature Treatment

XRD phase analysis results of the layered sandstone after high-temperature treatment are shown in Figure 6. At room temperature, the crystal diffraction peaks of layered sandstone primarily correspond to quartz, microcline, and a small amount of illite. As the heat treatment temperature rises, except for a slight decrease in diffraction peak intensity of illite, the phase compositions of the specimens do not exhibit any significant patterns of change. The TG and derivative thermogravimetry (DTG) curves obtained from TG are shown in Figure 7. As depicted in this figure, the first noticeable weight loss peak appears in the DTG curve between 25 °C and 400 °C, indicating that the sandstone mass loss is mainly due to the gradual removal of adsorbed and interlayer water from clay minerals. Between 400 °C and 800 °C, the sandstone mass continues to decrease, and multiple small weight loss peaks appear in the DTG curve, with a peak shape that is broad and gradual in steepness. This result indicates that clay minerals continue to lose hydroxyl water, albeit at a rate significantly lower than that when the temperature is below 400 °C. This is because as the dehydration process continues, most of the water within the sandstone core evaporates, thus reducing the impact of dehydration on the specimen mass when the temperature rises above 400 °C. In addition, the fracturing of clay minerals weakens the cementing force between the sandstone grains, possibly causing fine sand grains to detach, thus reducing the sandstone mass.

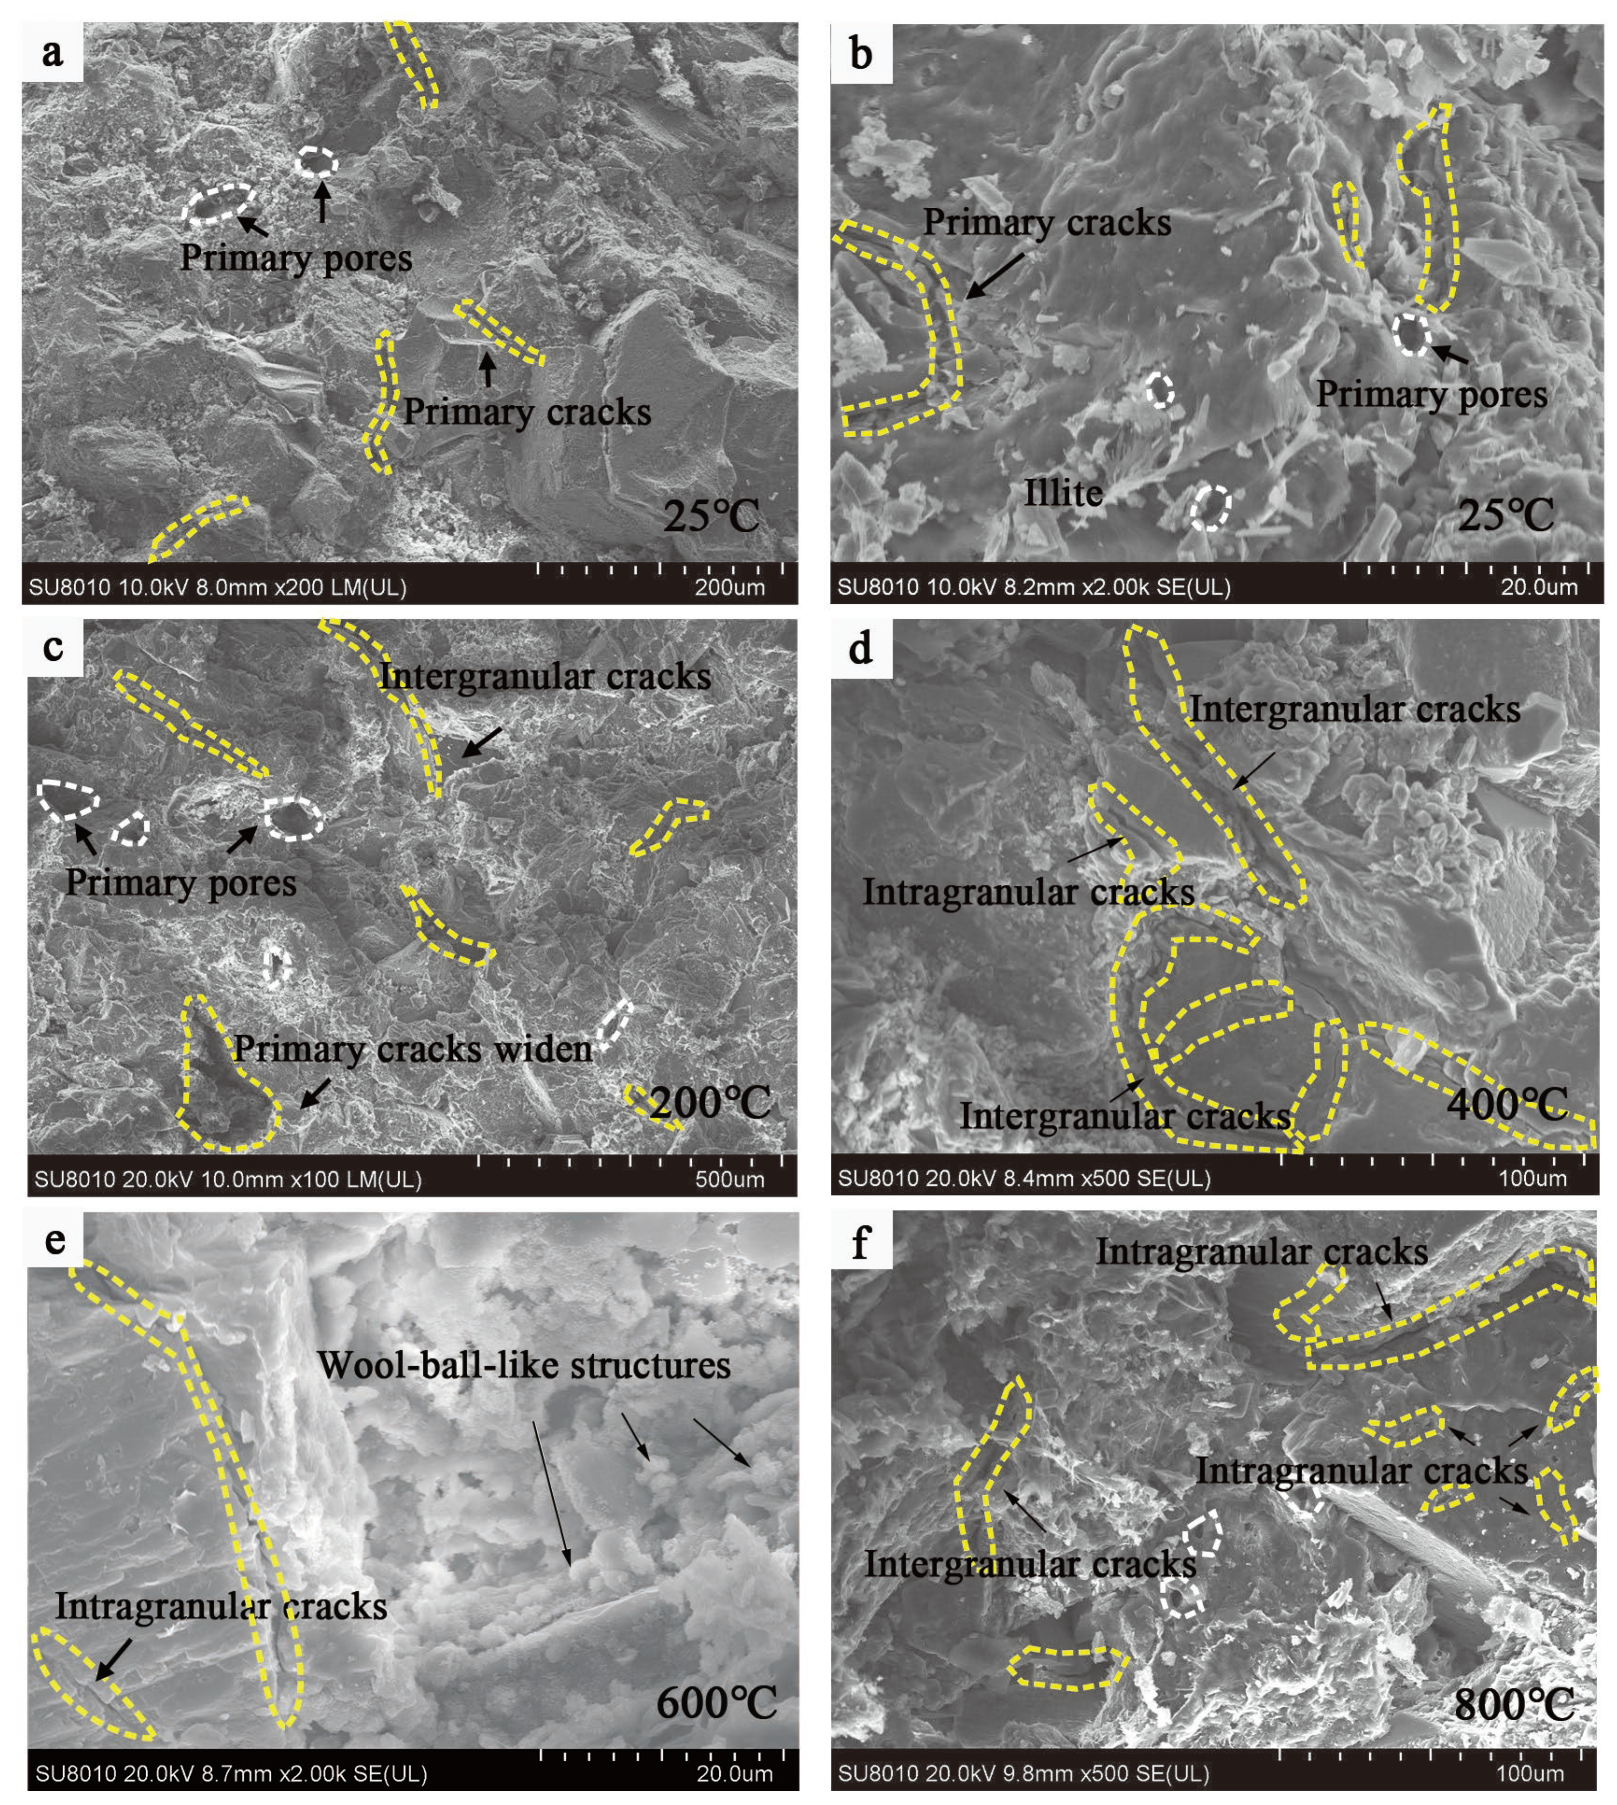
3.4. SEM Analysis of Layered Sandstone After High-Temperature Treatment

Figure 8 depicts the microstructural characteristics of sandstone after high-temperature treatment. As shown, the cementation between sandstone grains is strong at room temperature, and there is a small amount of lamellar illite present, with primary pores and cracks developing between the grains. After the specimen is heat-treated at 200 °C, a small number of primary cracks propagate owing to the dehydration and shrinkage of the minerals and the detachment of mineral grains, with a small number of hot cracks forming on grain boundaries. After the specimen is heat-treated at 400 °C, the differential stress caused by the thermal expansion of the grains causes primary cracks to widen, and hot cracks to form on grain boundaries and within grains. After the specimen is heat-treated at 600 °C, the primary pores and cracks develop and propagate further, with some clay minerals between primary cracks dehydrating and contracting into wool-ball-like structures that adhere to grain surfaces. After the specimen is heat-treated at 800 °C, the number of micropores and microcracks within the sandstone increase significantly, and some grains appear to melt.

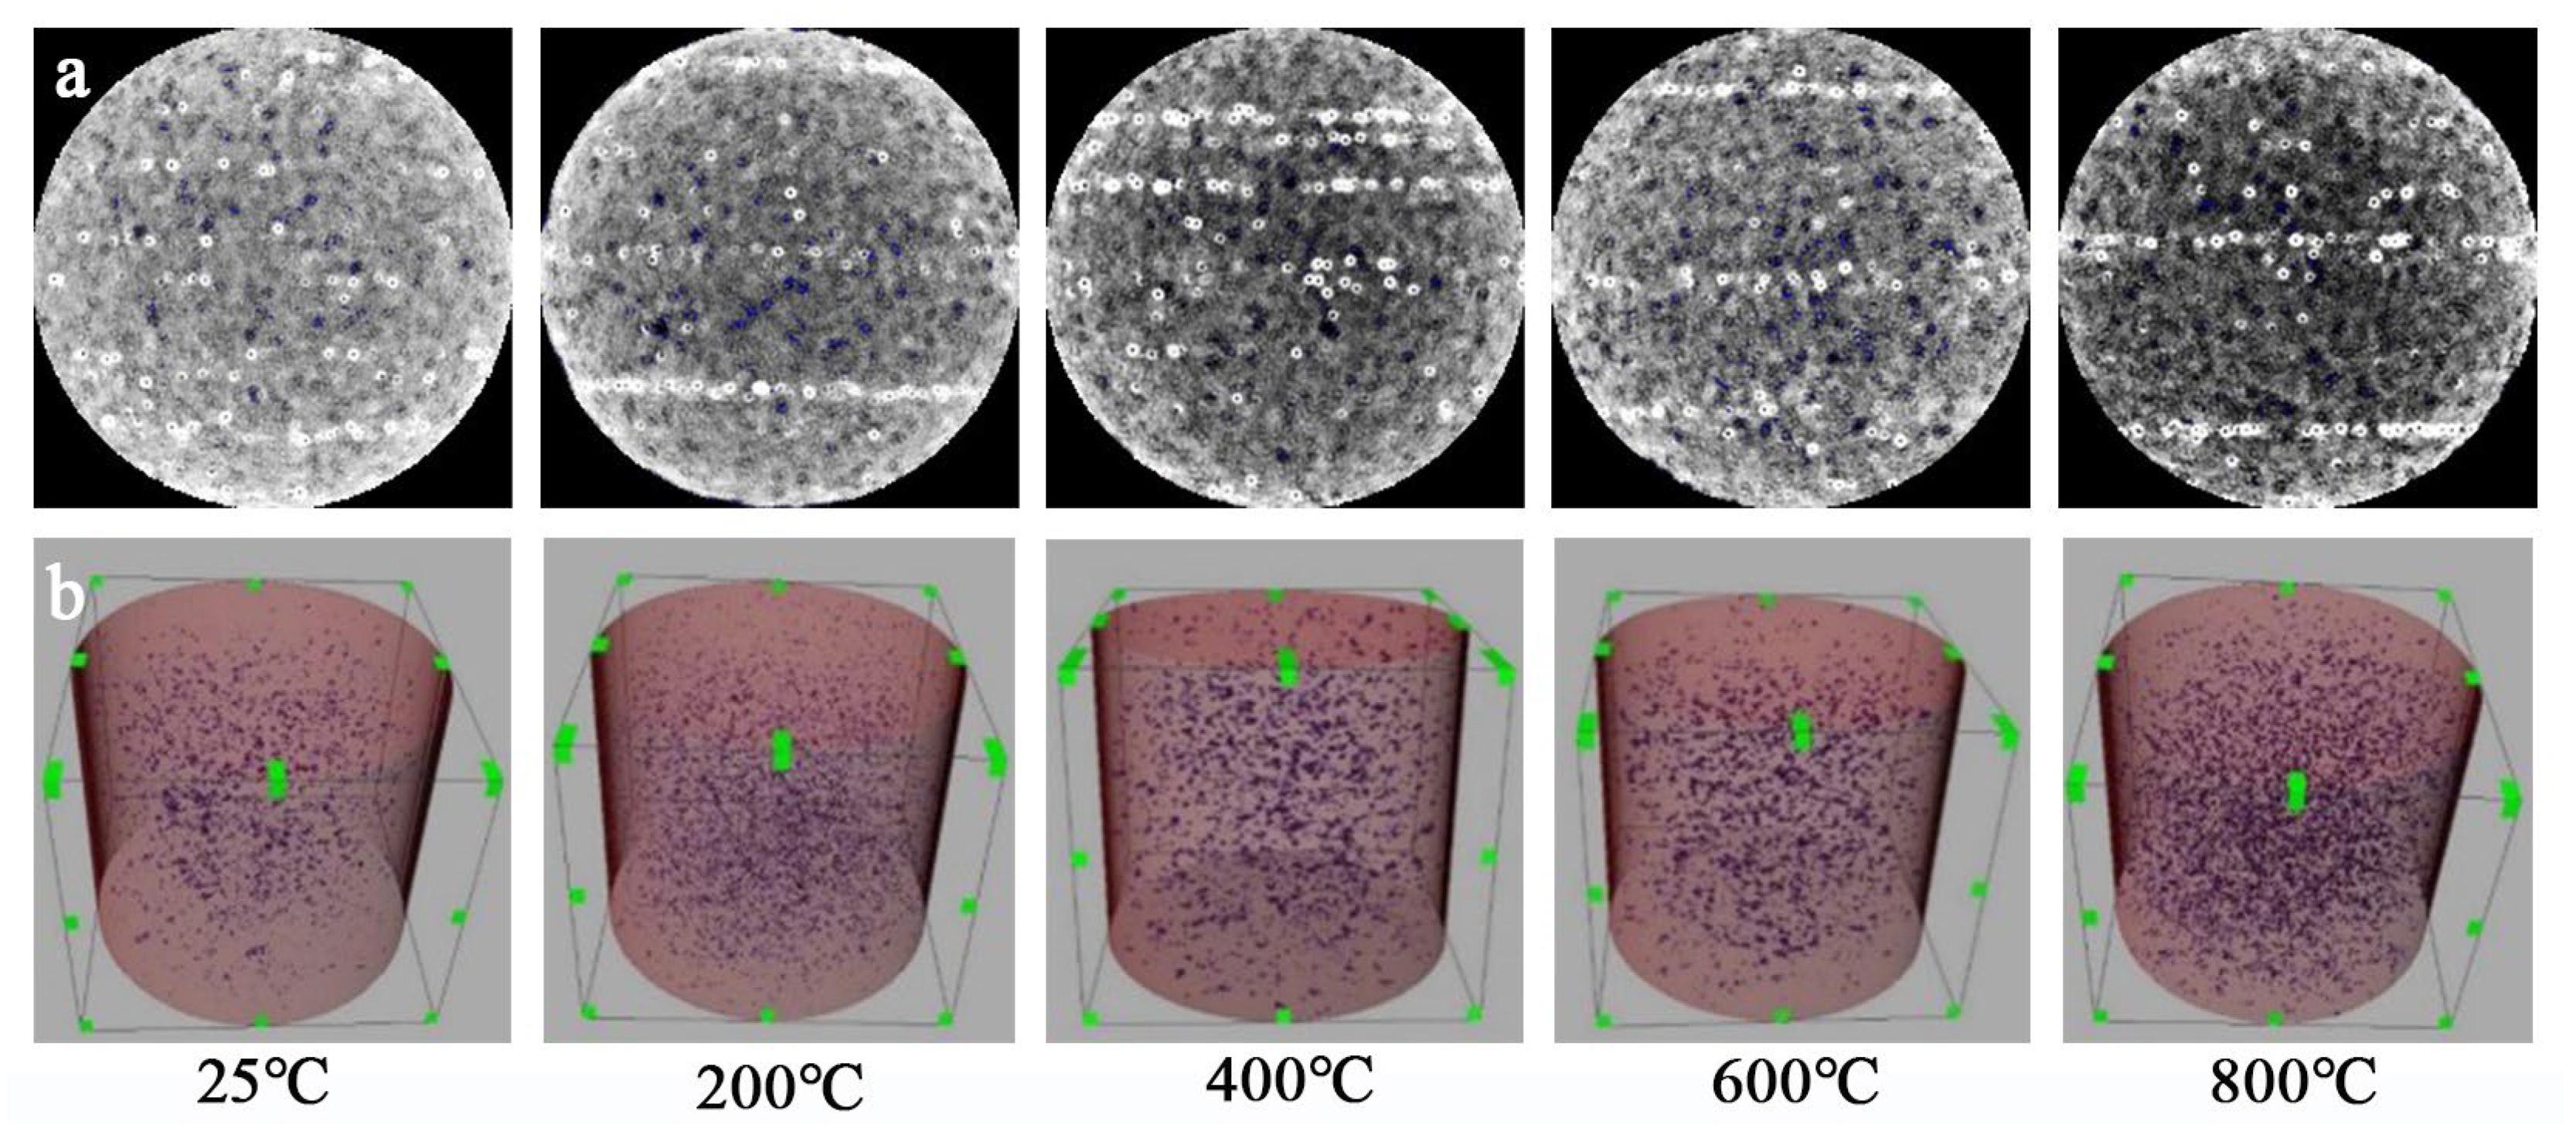
3.5. CT Scanning of Layered Sandstone After High-Temperature Treatment

CT was used to scan the sandstone core following treatment at different temperatures. The 2D images of sandstone core slices obtained via threshold segmentation are shown in Figure 9a, where the black areas represent pores, and the bright white bands represent horizontal bedding bands formed by the aggregation of magnetite grains. As shown in Figure 9a, the grayscale of the specimen slice at room temperature is low. As the temperature rises, the grayscale of the slice darkens significantly, indicating that the sandstone is dense and has less pores and cracks at room temperature. Following high-temperature treatment, the density of the pores in the slice increases significantly. The higher the temperature, the denser the pore distribution, and therefore, the darker the grayscale.
Figure 9b depicts the 3D reconstructions of the pore distribution in the sandstone core following heat treatment at different temperatures. Table 1 lists the porosity data obtained from further quantitative calculations. As indicated by Figure 9b and Table 1, fine-grain sandstone containing bedding planes is dense with a porosity of only 3.0% at room temperature. After the sandstone core is heated to high temperatures, the number of internal pores significantly increases, thus increasing the pore distribution density. After the sandstone core is heated to 800 °C, its porosity increases to 19.4%.
The pore length and aperture in the layered sandstone specimen, which was subjected to heat treatment at different temperatures, were calculated based on the 3D reconstructions. The minimum, maximum, and average values of pore length and aperture are listed in Table 2. As shown, the average values of pore length and aperture increase as the heating temperature increases. At 200 °C, the average values of pore length and aperture are similar to those at room temperature. At 400 °C, the average values of both pore length and aperture increase significantly, indicating a deterioration of internal failures in the sandstone core which results in larger pores. At 800 °C, the maximum value of pore length reached 729.42 μm, while the maximum aperture value reached 371.10 μm.
The volume of the pores within the layered sandstone following high-temperature treatment were calculated; then, pores were categorized by volume as follows: small (1 × 10⁵–1 × 106 μm3), medium (1 × 10⁶–5 × 106 μm3), and large (5 × 10⁶–1 × 107 μm3) pores. As shown in more detail in Table 3, at 200 °C, the numbers of small and medium pores in sandstone are similar to those at room temperature and do not undergo a significant increase compared to the numbers at 25 °C. At 400 °C, the numbers of small and medium pores grow significantly, indicating that primary cracks are widening and propagating while numerous new hot cracks are starting to form. At 600 °C, the numbers of small and medium pores grow slightly compared to the numbers at 400 °C but not to a significant degree. At 800 °C, the number of small pores grows slightly, while the numbers of medium and large pores grow significantly, indicating that the number of new pores is increasing at a lower rate, although numerous pores are becoming interconnected and forming medium to large pores.

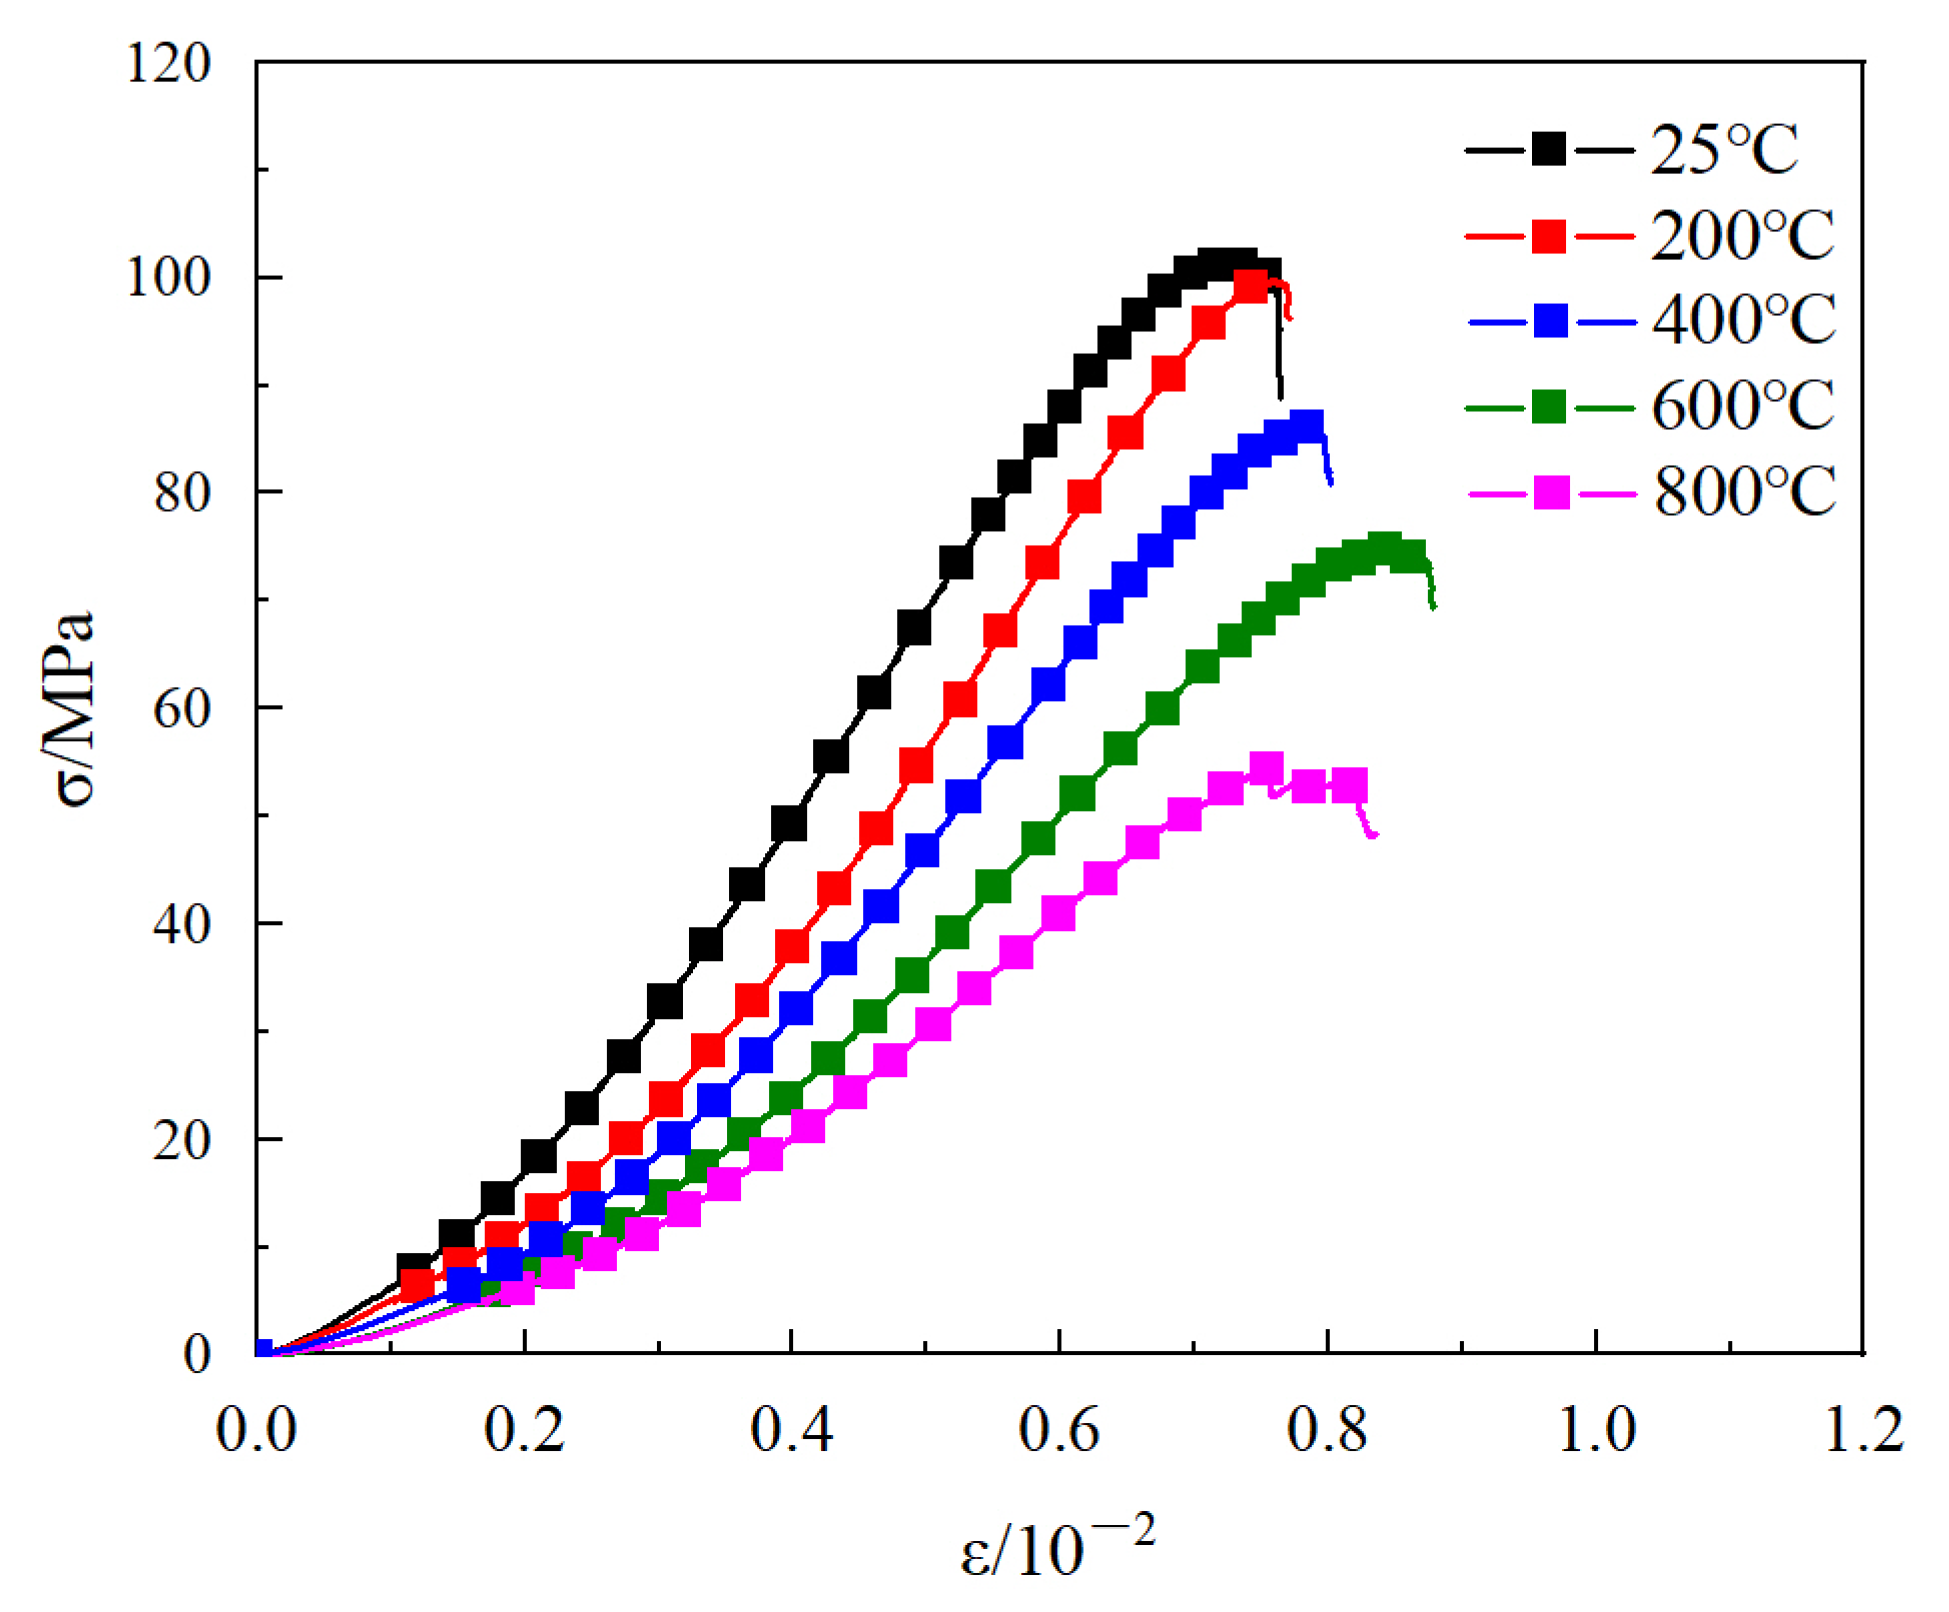
3.6. Static Compression Test of Layered Sandstone After High-Temperature Treatment

The stress–strain curve under uniaxial compression is shown in Figure 10, and the physical and mechanical parameters of the rock sample are listed in Table 4. The stress–strain curve of layered sandstones under static load can be divided into four stages: micro-fracture compaction stage, elastic deformation stage, plastic deformation stage, and failure stage. The stress–strain curves of the specimens after being subjected to different temperatures are basically consistent, and there is a negative correlation between the heating temperature and the peak strength of the specimens. Under the influence of high temperature, the micro-cracks within the rock mass continuously increase, leading to a more pronounced micro-crack compaction stage in the specimen. As the temperature rises, the strain of the specimen tends to increase, with brittleness gradually decreasing and ductility increasing.

3.7. Dynamic Mechanical Properties of Layered Sandstone After High-Temperature Treatment

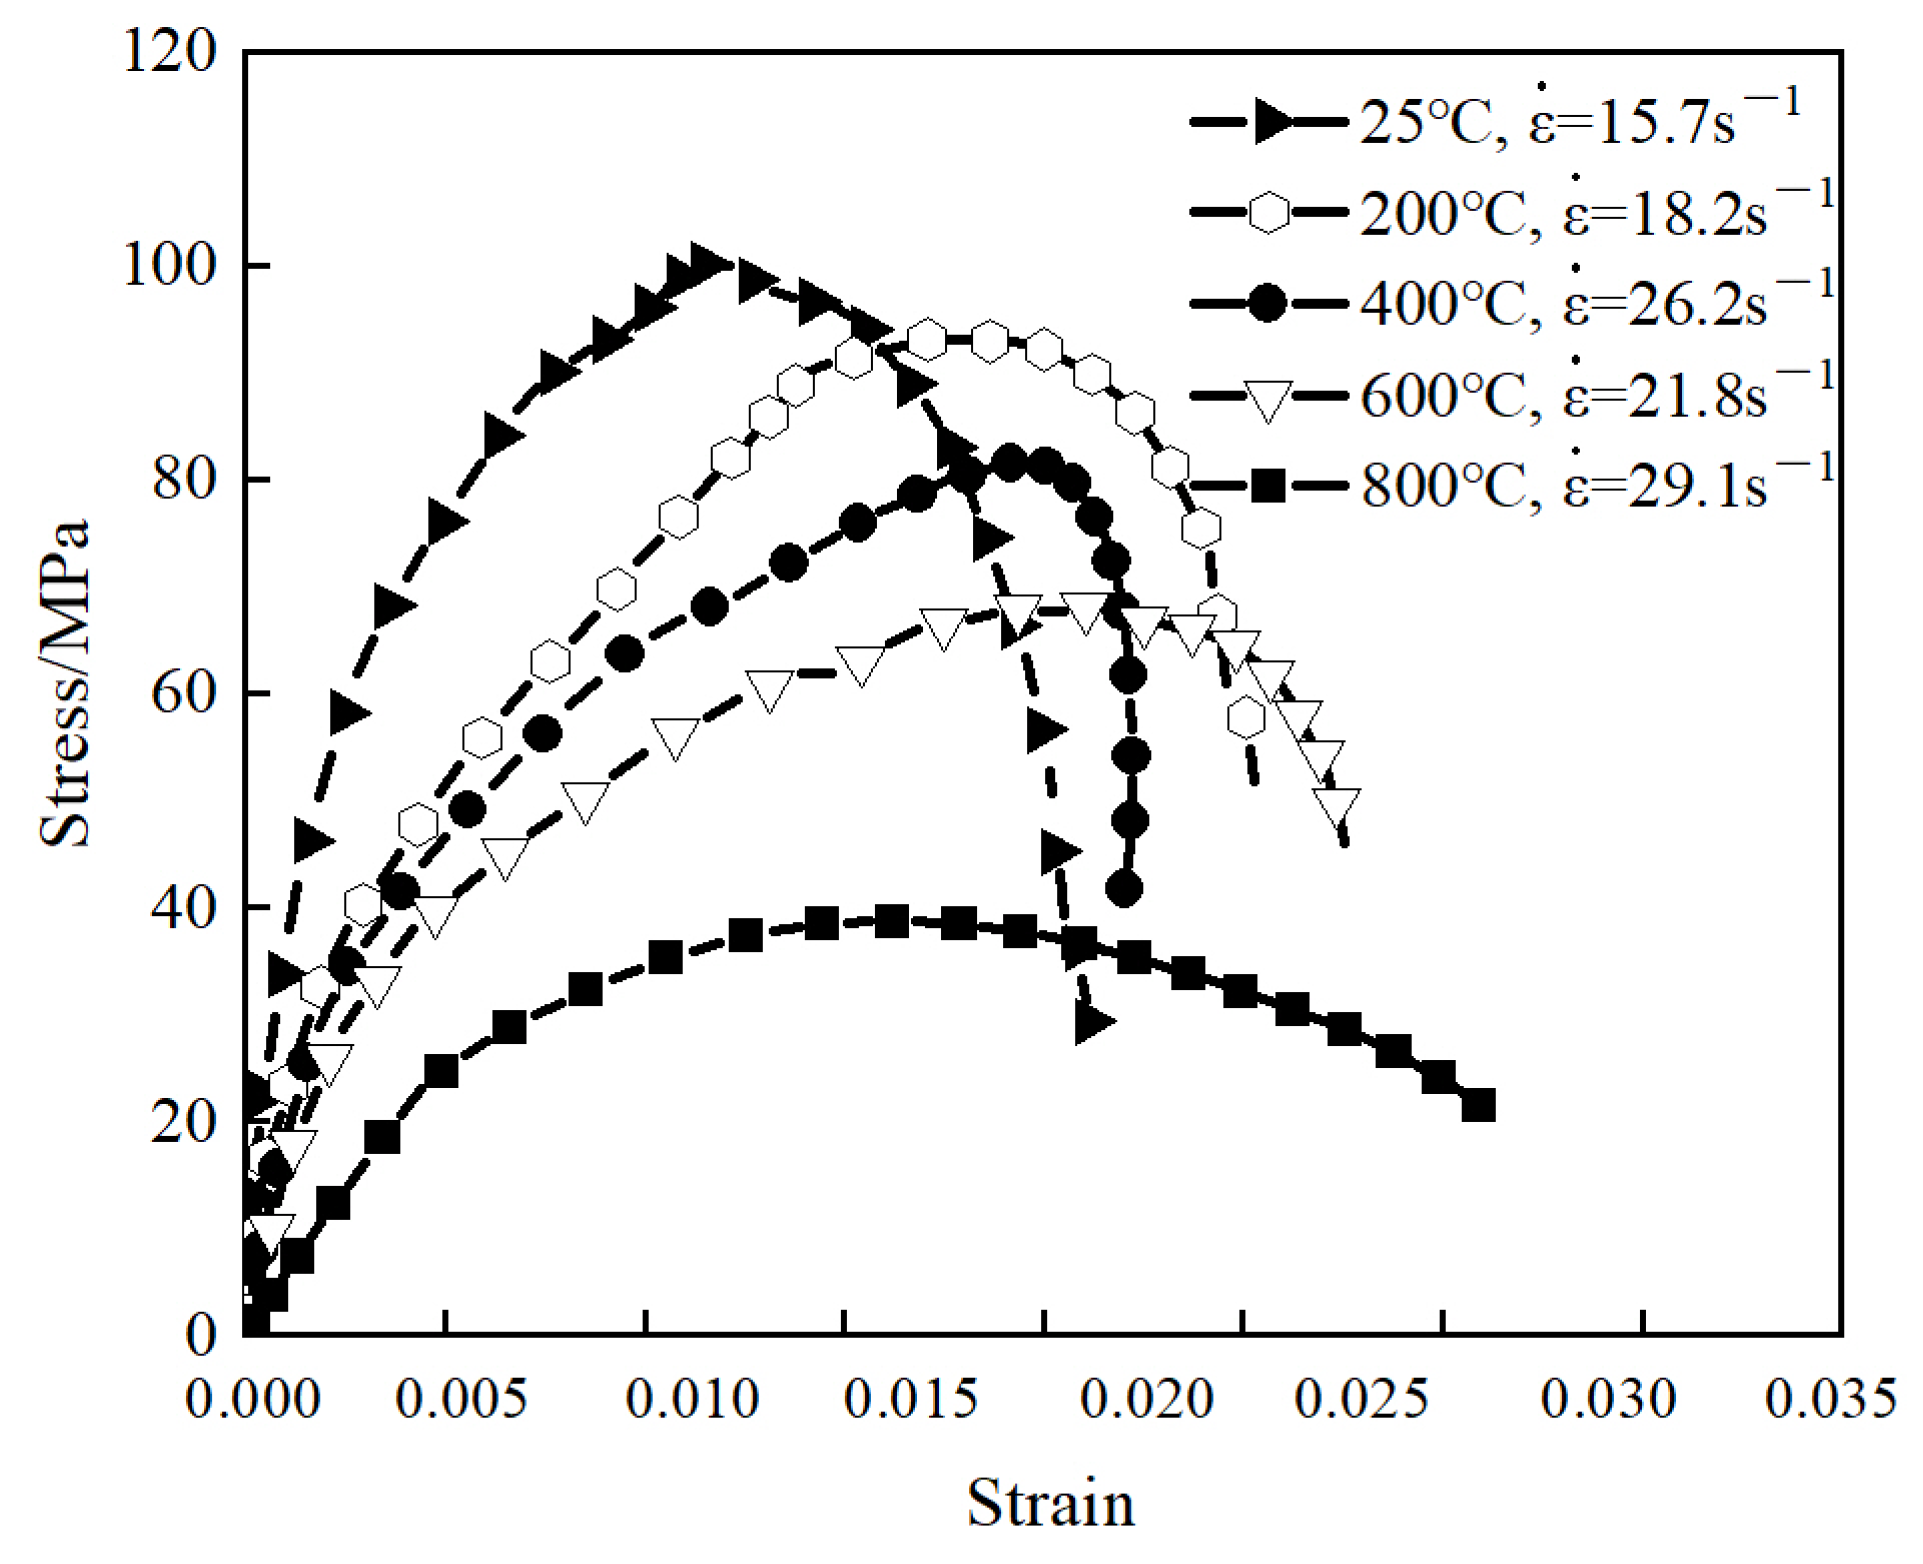
3.7.1. Evolutionary Patterns of the Dynamic Mechanical Properties

The dynamic stress–strain curves of layered sandstone after heat treatment at different temperatures, along with the calculated average strain rates, are depicted in Figure 11. Under identical impact pressure conditions, the average strain rate of the experiment generally increases as the heating temperature rises. However, an exception is observed at 600 °C, where the average strain rate is notably lower compared to those at 400 °C and 800 °C. We hypothesize that this discrepancy can primarily be attributed to variations in sample heterogeneity. In some of the rock samples heated to 600 °C, the density of bedding planes formed by magnetite particle aggregation is notably low. The decrease in the number of these bedding planes may be a crucial factor contributing to the reduction in the average strain rate observed at this temperature. As shown in this figure, the dynamic stress–strain curves of layered sandstone heat-treated at different temperatures follow a similar pattern, which is divided into four stages, namely compaction, linear elasticity, plasticity, and failure. Stage 1 is the initial compaction stage. Stage 1 is not noticeable when the temperature is between 25 °C and 600 °C but is visibly extensive when the temperature reaches 800 °C, indicating that the volumes of pores and cracks in sandstone grow significantly at this temperature. Stage 2 is the elastic deformation stage, where the stress–strain curves remain generally stable, while strain energy continues to accumulate. The slope in the linear elasticity stage decreases with rising temperature, indicating a gradual reduction in the ability of layered sandstone to resist impact loads and accumulate elastic strain energy. Stage 3 is the plasticity stage. As the temperature rises, the stress in the specimen increases at a slower rate, while the strain increases sharply. The slope of each dynamic stress–strain curve decreases until peak stress is reached, where the slope is zero. Stage 4 is the failure stage, where the residual elastic strain energy is released, resulting in a negative slope in the stress–strain curve. The variation in the peak stress and elastic modulus of layered sandstone following heat treatment at different temperatures is depicted in Figure 12. Evidently, as the temperature rises, the peak stress in the specimen drops at an increasing rate. When the temperature is above the threshold of 400 °C, the peak stress drops at a significantly faster rate.

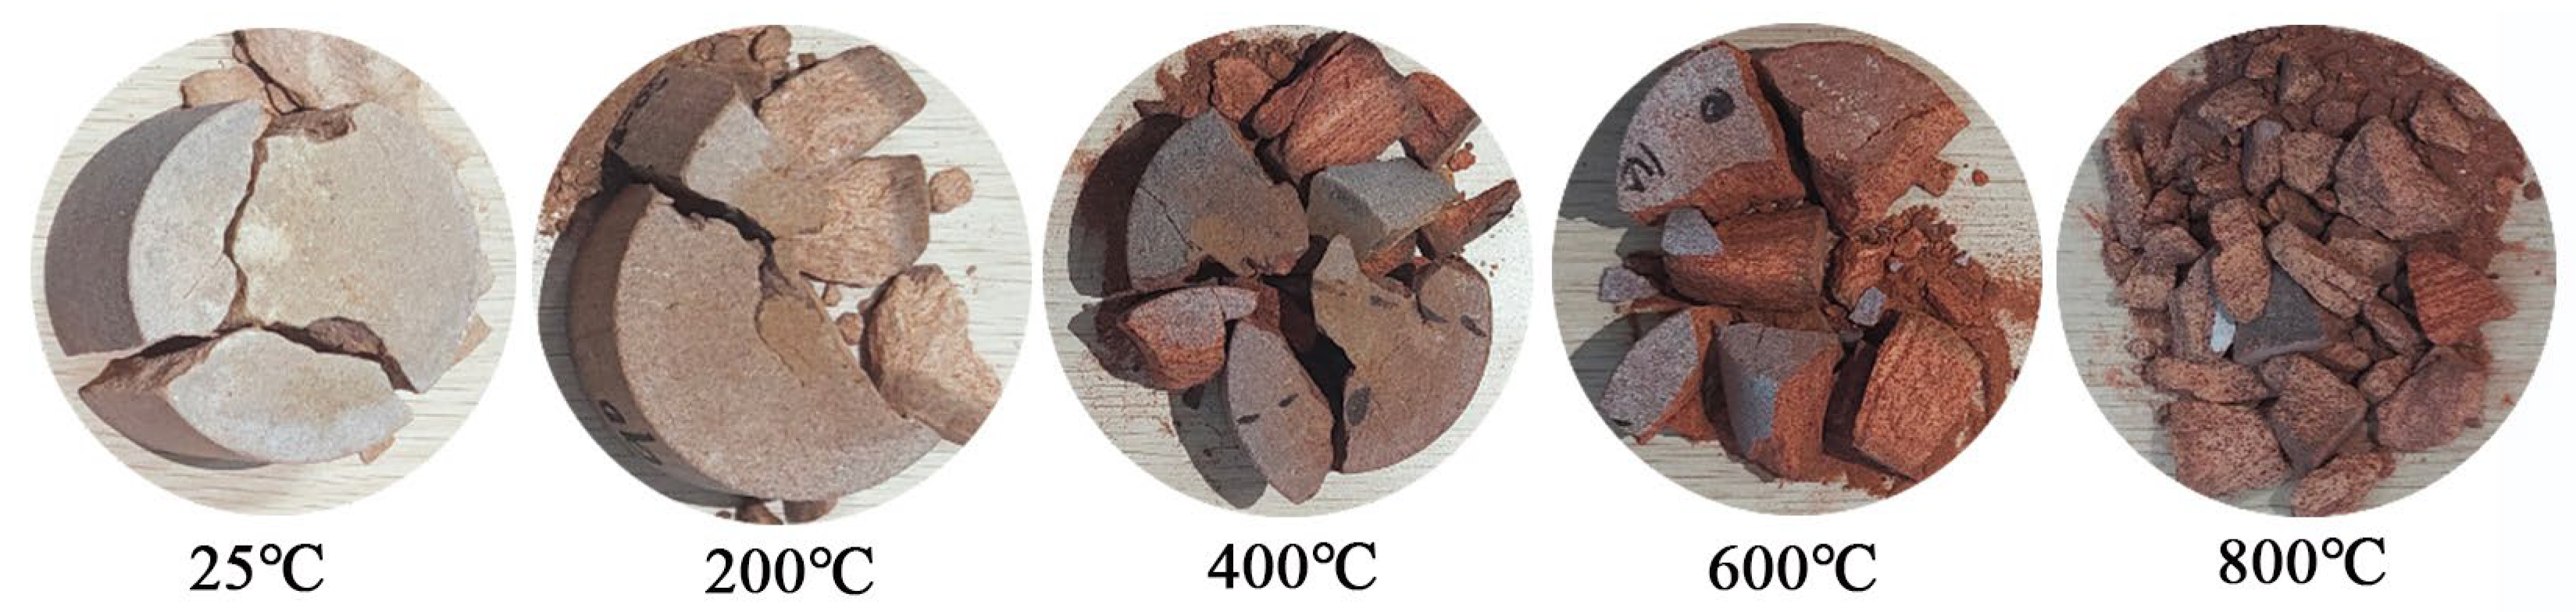
3.7.2. Specimen Fracture Characteristics

The fracture characteristics of layered sandstone under dynamic impact following high-temperature treatment are depicted in Figure 13. As shown in this figure, at room temperature, the degree of fracturing is low. However, as the heating temperature rises, the number of layered sandstone fragments increases significantly, while the fragment size decreases. When the temperature reaches 800 °C, numerous uniform fine powdery grains appear among the sandstone fragments.

3.8. DIC Analysis of the Dynamic Impact of Layered Sandstone After High-Temperature Treatment

Figure 14 depicts the development process of primary cracks along with the strain field evolution nephograms of layered sandstone during impact loading following heat treatment at different temperatures. As shown in this figure, no distinct strain concentration areas exist prior to the failure of the layered sandstone. These represent the locations where failure is initiated. At low temperatures (T ≤ 400 °C), high-strain areas are mainly concentrated on each side of the involved specimen, gradually expanding toward the center. As the temperature rises, the ductility of layered sandstone increases, and the contact area between the two sides of the sample and the loading bars increases, reducing the stress concentration at the ends. In addition, as the heat-treatment temperature rises, cracks in the sandstone become more developed. In particular, cracks around the bedding bands are likely to propagate and interconnect with one another, causing high-strain areas to form easily within the internal region of the sandstone at high temperatures.
Temperature has a significant impact on the propagation and interconnection speeds of cracks in sandstone. As the temperature rises, the number of cracks that form during the failure of layered sandstone increases greatly, and the range of the pre-failure strain concentration areas expands significantly. This is because at lower temperatures, as clay minerals gradually dehydrate, the cementation between sandstone grains becomes weaker. Hot cracks form on grain boundaries and propagate along these boundaries where the strain is more concentrated. When the temperature increases above 400 °C, hot cracks start to form within grains due to the anisotropic thermal expansion of mineral grains. This increases the number of internal pores and cracks within sandstone, as well as their lengths and widths, by a significant degree. These cracks along grain boundaries interconnect with intragranular cracks, thus expanding the range of the strain concentration area and significantly reducing the specimen failure time.
Cracks formed during the impact failure in layered sandstone mainly propagate along the weak bedding planes. Increasing the heat-treatment temperature only negligibly influences the propagation direction of primary cracks due to the presence of a large amount of magnetite grains embedded between quartz and feldspar mineral grains along the bedding bands. Pores in these areas are more developed than those in clay cementation matrix areas, making it easier for cracks to interconnect with one another. Thus, cracks in horizontally layered sandstone are mainly controlled by weak bedding planes. During high-temperature treatment, the differences in thermal expansion between various minerals become pronounced. For example, the thermal expansion coefficients of quartz and feldspar minerals exhibit an order of magnitude of 10−6/K, while the coefficient of magnetite minerals exhibits a substantially higher order of magnitude of 10−5/K. Therefore, in bedding bands, differences in thermal expansion between different mineral grains are more pronounced, resulting in higher expansion stress and denser hot cracks within these bands. As a result, after high-temperature treatment, primary cracks in layered sandstone are more likely to propagate along the weak layer surfaces.

4. Conclusions

(1)
Once the temperature exceeds 400 °C, the mass loss rate and longitudinal wave velocity attenuation rate in layered sandstone increase significantly. Mass loss in sandstone is closely associated with the gradual dehydration of clay minerals such as illite. At lower temperatures, the main processes include the propagation of primary pores and cracks, along with intergranular cracking. At temperatures above 400 °C, the number of new intragranular hot cracks increases, with failures in the specimen being caused primarily by the interconnection of cracks.
(2)
As the temperature rises, the dynamic peak stress and dynamic elastic modulus of layered sandstone drops gradually. When the temperature rises above the threshold of 400 °C, the peak stress drops at a significantly faster rate.
(3)
The DIC results show that as the temperature rises, the number of cracks that form owing to the failure of layered sandstone increases significantly, and the range of the pre-failure strain concentration area expands significantly. Cracks in layered sandstone mainly propagate along the weak bedding planes. Increasing the heat-treatment temperature negligibly influences the direction of primary cracks.

Author Contributions

S.G. and Y.W. conceived and designed the experiments; Y.W. and X.Y. performed the experiments; Y.W. analyzed the data; S.G. contributed funding support; S.G. and Y.W. wrote the paper. All authors have read and agreed to the published version of the manuscript.

Funding

The authors were supported by the Natural Science Foundation of Hebei Province, China (Grant No. D2023210005) and the Independent Project of the School of Civil Engineering, Shijiazhuang Tiedao University in 2022 (Grant No. TMXN2202).

Institutional Review Board Statement

Not applicable.

Informed Consent Statement

Not applicable.

Data Availability Statement

Data is contained within the article.

Conflicts of Interest

The authors declare no conflicts of interest.

References

  1. Zou, C.N.; Yang, Z.; Dong, D.Z.; Zhao, Q.; Chen, Z.H.; Feng, Y.L.; Li, J.R.; Wang, X.N. Formation, distribution and prospect of unconventional hydrocarbons in source rock strata in China. Earth Sci. 2022, 47, 1517–1533. [Google Scholar]
  2. Wang, L.H.; Dong, Y.H.; Yang, C.; Li, S.D.; Li, X. Environmental impacts of shale gas hydraulic fracturing development: A critical review. J. Eng. Geol. 2024, 32, 1447–1458. [Google Scholar]
  3. Cong, R.C.; Wang, H.Z.; Li, G.S.; Yang, R.Y.; Wang, B.; Liu, M.S.; Zhao, C.M.; Xia, Z.H. Feasibility on exploitation of coalbed methane by SC-CO2 shock fracturing. J. China Coal Soc. 2023, 48, 3162–3171. [Google Scholar]
  4. Zhang, C.H.; Wang, L.G.; Zhao, Q.S.; Li, W.L. Permeability evolution model and numerical analysis of coupled coal deformation, failure and liquid nitrogen cooling. J. Hebei Univ. Sci. Technol. 2015, 36, 90–99. [Google Scholar]
  5. Jiang, Y.D.; Xian, X.F.; Yi, J.; Liu, Z.F.; Guo, C.Y. Experimental and mechanical on the features of ultrasonic vibration stimulating the desorption of methane in coal. J. China Coal Soc. 2008, 6, 675–680. [Google Scholar]
  6. Yang, D.S.; Kang, Y.L.; Wu, J.; You, L.J.; Song, X.; Zhang, B.; Li, X.L. Experimental study on mechanism of high-temperature thermal stimulation in organic-rich shale. J. Xi’an Shiyou Univ. (Nat. Sci. Ed.) 2022, 37, 55–60. [Google Scholar]
  7. Yu, X.; Wang, Y.; Zhai, C.; Liu, T.; Xu, J.Z.; Sun, Y. Evolutionary characteristics of shale micro-nano pore structures under high temperature-dynamic impact. China Saf. Sci. J. 2023, 33, 137–146. [Google Scholar]
  8. Shang, X.J.; Zhang, Z.Z.; Xu, X.L.; Liu, T.T.; Xing, Y. Mineral Composition, Pore Structure, and Mechanical Characteristics of Pyroxene Granite Exposed to Heat Treatments. Minerals 2019, 9, 553. [Google Scholar] [CrossRef]
  9. Zhu, Z.N.; Tian, H.; Jiang, G.S.; Cheng, W. Effects of High Temperature on the Mechanical Properties of Chinese Marble. Rock Mech. Rock Eng. 2018, 51, 1937–1942. [Google Scholar] [CrossRef]
  10. Zhao, Y.S.; Wan, Z.J.; Feng, Z.J.; Xu, Z.H.; Liang, W.G. Evolution of mechanical properties of granite at high temperature and high pressure. Geomech. Geophys. Geo-Energy Geo-Resour. 2017, 3, 199–210. [Google Scholar] [CrossRef]
  11. Ma, X.; Wang, G.L.; Hu, D.W.; Liu, Y.G.; Zhou, H.; Liu, F. Mechanical properties of granite under real-time high temperature and three-dimensional stress. Int. J. Rock Mech. Min. Sci. 2020, 136, 104521. [Google Scholar] [CrossRef]
  12. Xu, H.C.; Yu, A.B.; Zhao, Y.Q.; Wang, B.X.; Wei, L.C. Experimental studies on split mechanical properties and fracture evolution behavior of bedding sandstone after high-temperature treatment. Rock Soil Mech. 2021, 42, 3069–3078. [Google Scholar]
  13. Zhang, Y.; Li, G.; Wang, X.Y.; Chen, Z.; Li, Z.; Wang, R. Microfabric characteristics of tight sandstone of Xujiahe formation in western Sichuan after high temperature and the effect on mechanical properties. J. Rock Mech. Eng. 2021, 40, 2249–2259. [Google Scholar]
  14. Li, Y.; Cheng, Y.H.; Zhai, Y.; Wei, S.Y.; Yang, Y.B.; Zhao, R.F.; Liang, W.B. Study on microstructure evolution and dynamic mechanical properties of granite after high temperature. Rock Soil Mech. 2022, 43, 3316–3326. [Google Scholar]
  15. Ping, Q.; Zhang, C.L.; Sun, H.J. Experimental study on dynamic characteristics of sandstone after different high temperature cyclings. J. Min. Saf. Eng. 2021, 38, 1016–1024. [Google Scholar]
  16. Ping, Q.; Hou, J.M.; Hu, W.; Qian, M.; Sun, D. Experimental study on dynamic mechanical properties of sandstone with hole under high temperature cycling action. Met. Mine 2024, 10, 76–84. [Google Scholar]
  17. Li, M.; Mao, X.B.; Cao, L.L.; Pu, H.; Mao, R.R.; Lu, A.H. Effects of Thermal Treatment on the Dynamic Mechanical Properties of Coal Measures Sandstone. Rock Mech. Rock Eng. 2016, 49, 3525–3539. [Google Scholar] [CrossRef]
  18. Yin, T.B.; Wang, P.; Li, X.B.; Shu, R.H.; Ye, Z.Y. Effects of thermal treatment on physical and mechanical characteristics of coal rock. J. Cent. South Univ. 2016, 9, 2336–2345. [Google Scholar] [CrossRef]
  19. Yin, S.B.; Li, X.B.; Wang, B.; Yin, Z.Q.; Jin, J.F. Mechanical properties of sandstones after high temperature under dynamic loading. Chin. J. Geotech. Eng. 2011, 33, 777–784. [Google Scholar]
  20. Zhao, Y.X.; Zhao, G.F.; Jiang, Y.D.; Elsworth, D.; Huang, Y.Q. Effects of bedding on the dynamic indirect tensile strength of coal: Laboratory experiments and numerical simulation. Int. J. Coal Geol. 2014, 132, 81–93. [Google Scholar] [CrossRef]
Figure 1. Layered sandstone core specimen and optical microscopy images of the specimen core. (a) Image of the layered sandstone core; (b) relationship between the bedding plane and loading directions; (c) reflected light image of layered sandstone under the microscope; and (d) transmitted light image of layered sandstone under the orthogonal polarization system.
Applsci 14 11729 g001
Figure 2. SHPB impact test system setup.
Applsci 14 11729 g002
Figure 3. Stress equilibrium diagram.
Applsci 14 11729 g003
Figure 4. Changes in color of layered sandstone after high-temperature treatment.
Applsci 14 11729 g004
Figure 5. Mass loss rate (a) and longitudinal wave velocity reduction rate (b) in layered sandstone under different temperature conditions.
Applsci 14 11729 g005
Figure 6. XRD analysis of layered sandstone after high-temperature treatment.
Applsci 14 11729 g006
Figure 7. TG and DTG curves of layered sandstone.
Applsci 14 11729 g007
Figure 8. Microstructural characteristics of layered sandstone heat-treated at different temperatures. (a,b) Rock sample at room temperature; (c) Rock sample heated at 200 °C; (d) Rock sample heated at 400 °C; (e) Rock sample heated at 600 °C; (f) Rock sample heated at 800 °C.
Applsci 14 11729 g008
Figure 9. CT images of layered sandstone. (a) Two-dimensional images of sandstone core slices obtained via threshold segmentation. (b) Three-dimensional reconstructions of the pore distribution in layered sandstone core.
Applsci 14 11729 g009
Figure 10. Static stress–strain curves of layered sandstone.
Applsci 14 11729 g010
Figure 11. Dynamic stress–strain curves of layered sandstone.
Applsci 14 11729 g011
Figure 12. Variation of the dynamic compressive strength (a) and dynamic elastic modulus of layered sandstone (b).
Applsci 14 11729 g012
Figure 13. Impact fracture characteristics of bedding sandstone after high-temperature treatment.
Applsci 14 11729 g013
Figure 14. Images of the sandstone failure process and strain field evolution nephograms after layered sandstone is heat-treated at different temperatures. (a) Rock sample at room temperature; (b) Rock sample heated at 200 °C; (c) Rock sample heated at 400 °C; (d) Rock sample heated at 600 °C; (e) Rock sample heated at 800 °C.
Applsci 14 11729 g014
Table 1. Porosities of layered sandstone heat-treated at different temperatures.
Temperature/°CPorosity/%
253.0
2003.9
4007.5
6008.2
80019.4
Table 2. Changes in the pore length and aperture in layered sandstone after high-temperature treatment.
Serial NumberTemperature/°C Length/μm Aperture/μm
Minimum ValueMaximum ValueAverage ValueMinimum ValueMaximum ValueAverage Value
C-0-12512.21446.7363.223.56238.5239.24
C-0-620014.18494.8868.185.51290.4840.99
C-0-1440028.36415.0582.975.68237.2348.69
C-0-1660022.68710.7388.594.25334.6648.98
C-0-2280023.11729.4298.826.10371.1056.46
Table 3. Changes in the number of pores with different volume sizes in layered sandstone after high-temperature treatment.
Temperature/°CSmall PoresMedium PoresLarge PoresTotal Number
2514,054314,057
20016,778616,784
40023,4981923,517
60025,8732225,895
80026,180268726,455
Table 4. The physical and static mechanical parameters of rock samples.
No.T/°CHeight
/mm
Diameter
/mm
Density
/g·cm−3
Peak Stress
/Mpa
Elastic Modulus
/Gpa
C-0-1-125100.2450.022.10102.015.2
C-0-1-2200100.0450.122.10100.010.8
C-0-1-3400100.5050.082.0986.610.2
C-0-1-4600100.2650.072.0675.39.03
C-0-1-5800100.0450.222.0654.85.39
Disclaimer/Publisher’s Note: The statements, opinions and data contained in all publications are solely those of the individual author(s) and contributor(s) and not of MDPI and/or the editor(s). MDPI and/or the editor(s) disclaim responsibility for any injury to people or property resulting from any ideas, methods, instructions or products referred to in the content.

