Article

Degradation Assessment of In-Service Transformer Oil Based on Electrical and Chemical Properties

1
Department of Electrical Engineering, Faculty of Engineering & Technology, Gomal University, Dera Ismail Khan 29050, Pakistan
2
High Voltage at HV & SC Testing Lab, Rawat 44000, Pakistan
3
Department of Electrical Power and Machines Engineering, Faculty of Engineering, Helwan University, Helwan, Cairo 11792, Egypt
4
Advanced High Voltage Engineering Research Centre, Cardiff University, Cardiff CF10 3AT, UK
*
Author to whom correspondence should be addressed.
Appl. Sci. 2024, 14(24), 11767; https://doi.org/10.3390/app142411767
Submission received: 15 November 2024 / Revised: 6 December 2024 / Accepted: 14 December 2024 / Published: 17 December 2024
(This article belongs to the Special Issue Novel Advances in High Voltage Insulation)

Abstract

:
In order to ensure the long-term reliability and safety of power transformers, it is important to continuously monitor the characteristics of insulating oil, which not only helps in understanding its behavior over time but also ensures the safety of the equipment. The current study analyzes in-service insulating oil with the aim of relating deterioration and changes in the oil with service aging. Insulating oil samples were collected from three power transformers, with a voltage level of 220 kV and 132 kV, installed at a 220 kV substation. Electrical and chemical characteristics were obtained, and the impact of service aging and the relationships among load variation, oil, and winding temperatures with the characteristics were evaluated. Variations in the dielectric dissipation factor and breakdown voltage with service aging were recorded for all transformers, while the moisture content increased with each service year. Among the concentrations of gases present in the insulating oil, carbon monoxide, oxygen, and nitrogen concentrations increased after each service year. The impact of load variation on the breakdown voltage of the 132 kV transformer oil was more prominent than for the 220 kV transformers. The analysis of gas ratios and moisture content identified the degradation of cellulose insulation in all transformers, which was due to the presence of electrical faults.

1. Introduction

Power transformers are critical components in electrical transmission and distribution networks, ensuring efficient and stable energy delivery. Transformer oil, commonly a mineral-based insulating fluid and natural ester, serves multiple functions, including cooling, insulation, and arc suppression. However, transformer oil is subject to aging, a complex process influenced by thermal, electrical, and chemical stresses inherent to prolonged operation. This aging process degrades the oil’s insulating properties and accelerates the breakdown of cellulose-based insulation, eventually compromising transformer reliability and potentially leading to costly failures [1,2]. Thus, the study of transformer oil aging is crucial for understanding the mechanisms that affect transformer health over time.
Transformer oil degradation is driven by thermal, electrical, and chemical stressors, each contributing to molecular breakdown and structural alteration in both the oil and cellulose insulation materials. Thermal stresses arise from high operating temperatures that accelerate oxidation processes, resulting in acid formation and an increase in the oil’s viscosity, which ultimately diminishes its insulating capacity [3,4,5]. Electrical stressors, particularly partial discharge (PD) and arcing, generate localized high temperatures that promote the breakdown of oil molecules and produce fault gases, such as hydrogen (H2), methane (CH4), acetylene (C2H2), and ethylene (C2H4). These gases dissolve within the oil, and their concentrations are analyzed to assess fault severity and type [6,7,8]. The concentration of hydrogen and hydrocarbon gases, such as methane, ethane, ethylene, and acetylene, are markers of electrical faults, including PD, arcing, and overheating in oil [8,9].
Breakdown of oil due to chemical reactions within the oil is further accelerated by contaminants, including moisture, oxygen, and metal particles, which catalyze oxidation processes. The presence of moisture is particularly detrimental as it not only accelerates the oil’s degradation but also promotes cellulose decomposition in paper insulation, leading to a release of carbon monoxide (CO) and carbon dioxide (CO2) [10]. Also, the presence of carbon monoxide and carbon dioxide is associated with the degradation of cellulose insulation due to thermal and oxidative stresses [11,12]. Studies by Kachler and Hohlein (2005) have demonstrated that increases in CO and CO2 levels correspond with accelerated cellulose aging, particularly at elevated temperatures [13]. However, the studies conducted by Baruah et al. (2020) and Ivanka and Frotscher (2010) emphasize that carbon monoxide and carbon dioxide ratios serve as reliable indicators of thermal faults in the solid insulation materials of transformers [7,14]. Furthermore, oxygen dissolved in the oil participates in oxidation reactions, forming acidic byproducts that degrade both the oil and cellulose insulation in a self-perpetuating cycle [15].
The aging of transformer oil exhibits both electrical and chemical alterations that can signal the onset of insulation failure. Electrically, aging reduces the breakdown voltage of the oil as impurities and dissolved gases weaken its dielectric strength [16]. Meanwhile, dielectric strength is a key metric for transformer health, as a reduction in this property can lead to dielectric breakdown under normal operating voltages. Thermally stressed oil also shows an increase in dielectric dissipation factor (DDF), also known as dielectric loss, a parameter that reflects energy dissipation and provides insight into the extent of thermal degradation [17].
Meanwhile, moisture and oxygen play critical roles in exacerbating both electrical and chemical degradation. Sifeddine et al. (2019) showed that the insulating properties of transformer oil strengthen with the decrease in moisture content [18]. Furthermore, the authors in [19,20] have shown that the aging rate of paper insulation increases with a high level of moisture content. These studies have shown the detrimental effect of moisture content on both oil and paper insulation, as moisture not only accelerates hydrolysis but also diminishes the oil’s dielectric strength, making transformers more susceptible to electrical failures. Consequently, controlling oxygen and moisture ingress is essential for extending transformer life.
While different stressors contribute to the degradation of the oil in general, the degradation behavior of the two widely used types of transformer oils, i.e., mineral oil and natural esters, differ significantly. Natural esters have a higher ability to absorb moisture as compared to mineral oil, hence affecting the moisture dynamics inside the transformer [21]. However, natural esters have better aging resistance and thermal conductivity than mineral oil [22,23]. Nonetheless, due to the presence of more carbon–carbon double bonds in natural esters, they are more vulnerable to oxidation as compared to oxidation [24]. In terms of their electrical characteristics, natural esters as compared to mineral oils maintain higher breakdown voltage [7,25]. Mineral oil has been the preferred option for transformer oil in spite of the fact that natural esters provide several advantages This preference is primarily due to the lower cost, better thermal performance, and long-term reliability across various operating conditions of mineral oil [21,26].
For in-service transformer oils, irrespective of the type, as degradation is multifactorial, it is necessary to continuously monitor them to assess both the electrical and chemical integrity of the oil and insulation materials over time, which requires diagnostic tools capable of identifying degradation trends early, before severe faults develop. Dissolved gas analysis (DGA) is the most prevalent diagnostic method, providing insights into the types and concentrations of fault gases generated during oil aging [27]. By analyzing the ratios of gases, such as hydrogen to methane or acetylene to ethylene, DGA allows for the categorization of fault types. The Dornenburg and Rogers ratio methods are established approaches within DGA, used to differentiate between PD, arcing, and overheating faults [12,28,29]. These methods, however, have limitations, particularly when gas levels are below diagnostic thresholds or when multiple fault types occur simultaneously.
While significant research has been conducted on transformer oil aging, a comprehensive study that correlates both electrical and chemical characteristics over extended service periods remains limited [30,31,32]. Much of the existing literature focuses either on DGA interpretation or on isolated chemical and electrical properties, often without longitudinal analysis [33,34,35]. Additionally, studies rarely account for the combined effects of moisture, dissolved gases, electrical properties, and thermal stress in real-world operational conditions. Therefore, this study aims to provide a systematic analysis of both electrical and chemical indicators of aging in oil samples collected from in-service transformers over a period of service.
This research analyzes the dielectric dissipation factor (DDF) at 90 °C, breakdown voltage, moisture content, and dissolved gas concentrations to offer insights into the degradation process in operational transformers installed in a 220 kV substation in Pakistan. By examining these parameters in tandem, this study seeks to identify early aging markers and contribute to the development of refined diagnostic methods, enabling more effective condition monitoring and predictive maintenance strategies.
The paper is organized as follows. Section 2 outlines the characteristics of transformers under consideration and test methods adapted for oil degradation analysis. Section 3 discusses the results of the measurement, while the discussion is carried out in Section 4. The Discussion section includes the correlation of the electrical and chemical characteristics and discusses the impact of different variables on the electrical and chemical characteristics of oil, followed by a discussion of the DGA results. The concluding remarks are given in Section 5.

2. Analysis Method

Table 1 lists the specifications of the in-service transformers considered in the current study. A total of three transformers, namely T1, T2, and T3, were considered, which were installed at a 220 kV substation in Dera Ismail Khan, Pakistan, while oil samples were collected for these transformers during the service years 2020–21, 2021–22, 2022–23, and 2023–24. All three transformers were commissioned in the same year, i.e., 2019. Transformers T1 and T2 had a voltage ratio of 220/132 kV, whereas T3 had a voltage ratio of 132/11.5 kV.
The test methods used in the current study for the collected oil samples are tabulated in Table 2. The methods are categorized as electrical and chemical, and they conform to the International Electrotechnical Commission (IEC) and the American Society for Testing and Materials (ASTM). The table also describes the test conditions and acceptance values of the characteristics.
In a transformer, electrical stress, turn-to-turn and section-to-section short circuits, thermal stress, operating temperature, and the presence of foreign objects are associated with the degradation of insulating oil. These conditions lead to the weakening of dielectric strength; as such, DDF and breakdown voltage can be used as an index to directly evaluate the electrical characteristics of insulating oil.
The moisture content of the oil is also generally recognized as an effective diagnostic index that can be used to identify the status of degradation of insulating oil, as the presence of moisture significantly affects the breakdown strength of the oil. With the decline in the dielectric strength of insulating oil and cellulose materials, combustible gases are generated inside the transformer. The identity of the gases being generated can be very useful information in any preventive maintenance program. The sum of all combustible gases with a rise in individual or ratio gas-generated rates indicates a transformer fault and can also indicate the fault level. As such, DGA is used in evaluating the heath of transformers and is considered the most advanced and technically acknowledged method.

3. Results

In the current study, electrical and chemical characteristics were used for the analysis of aging of in-service transformer oil samples. The analysis was carried out with reference to the year of service.

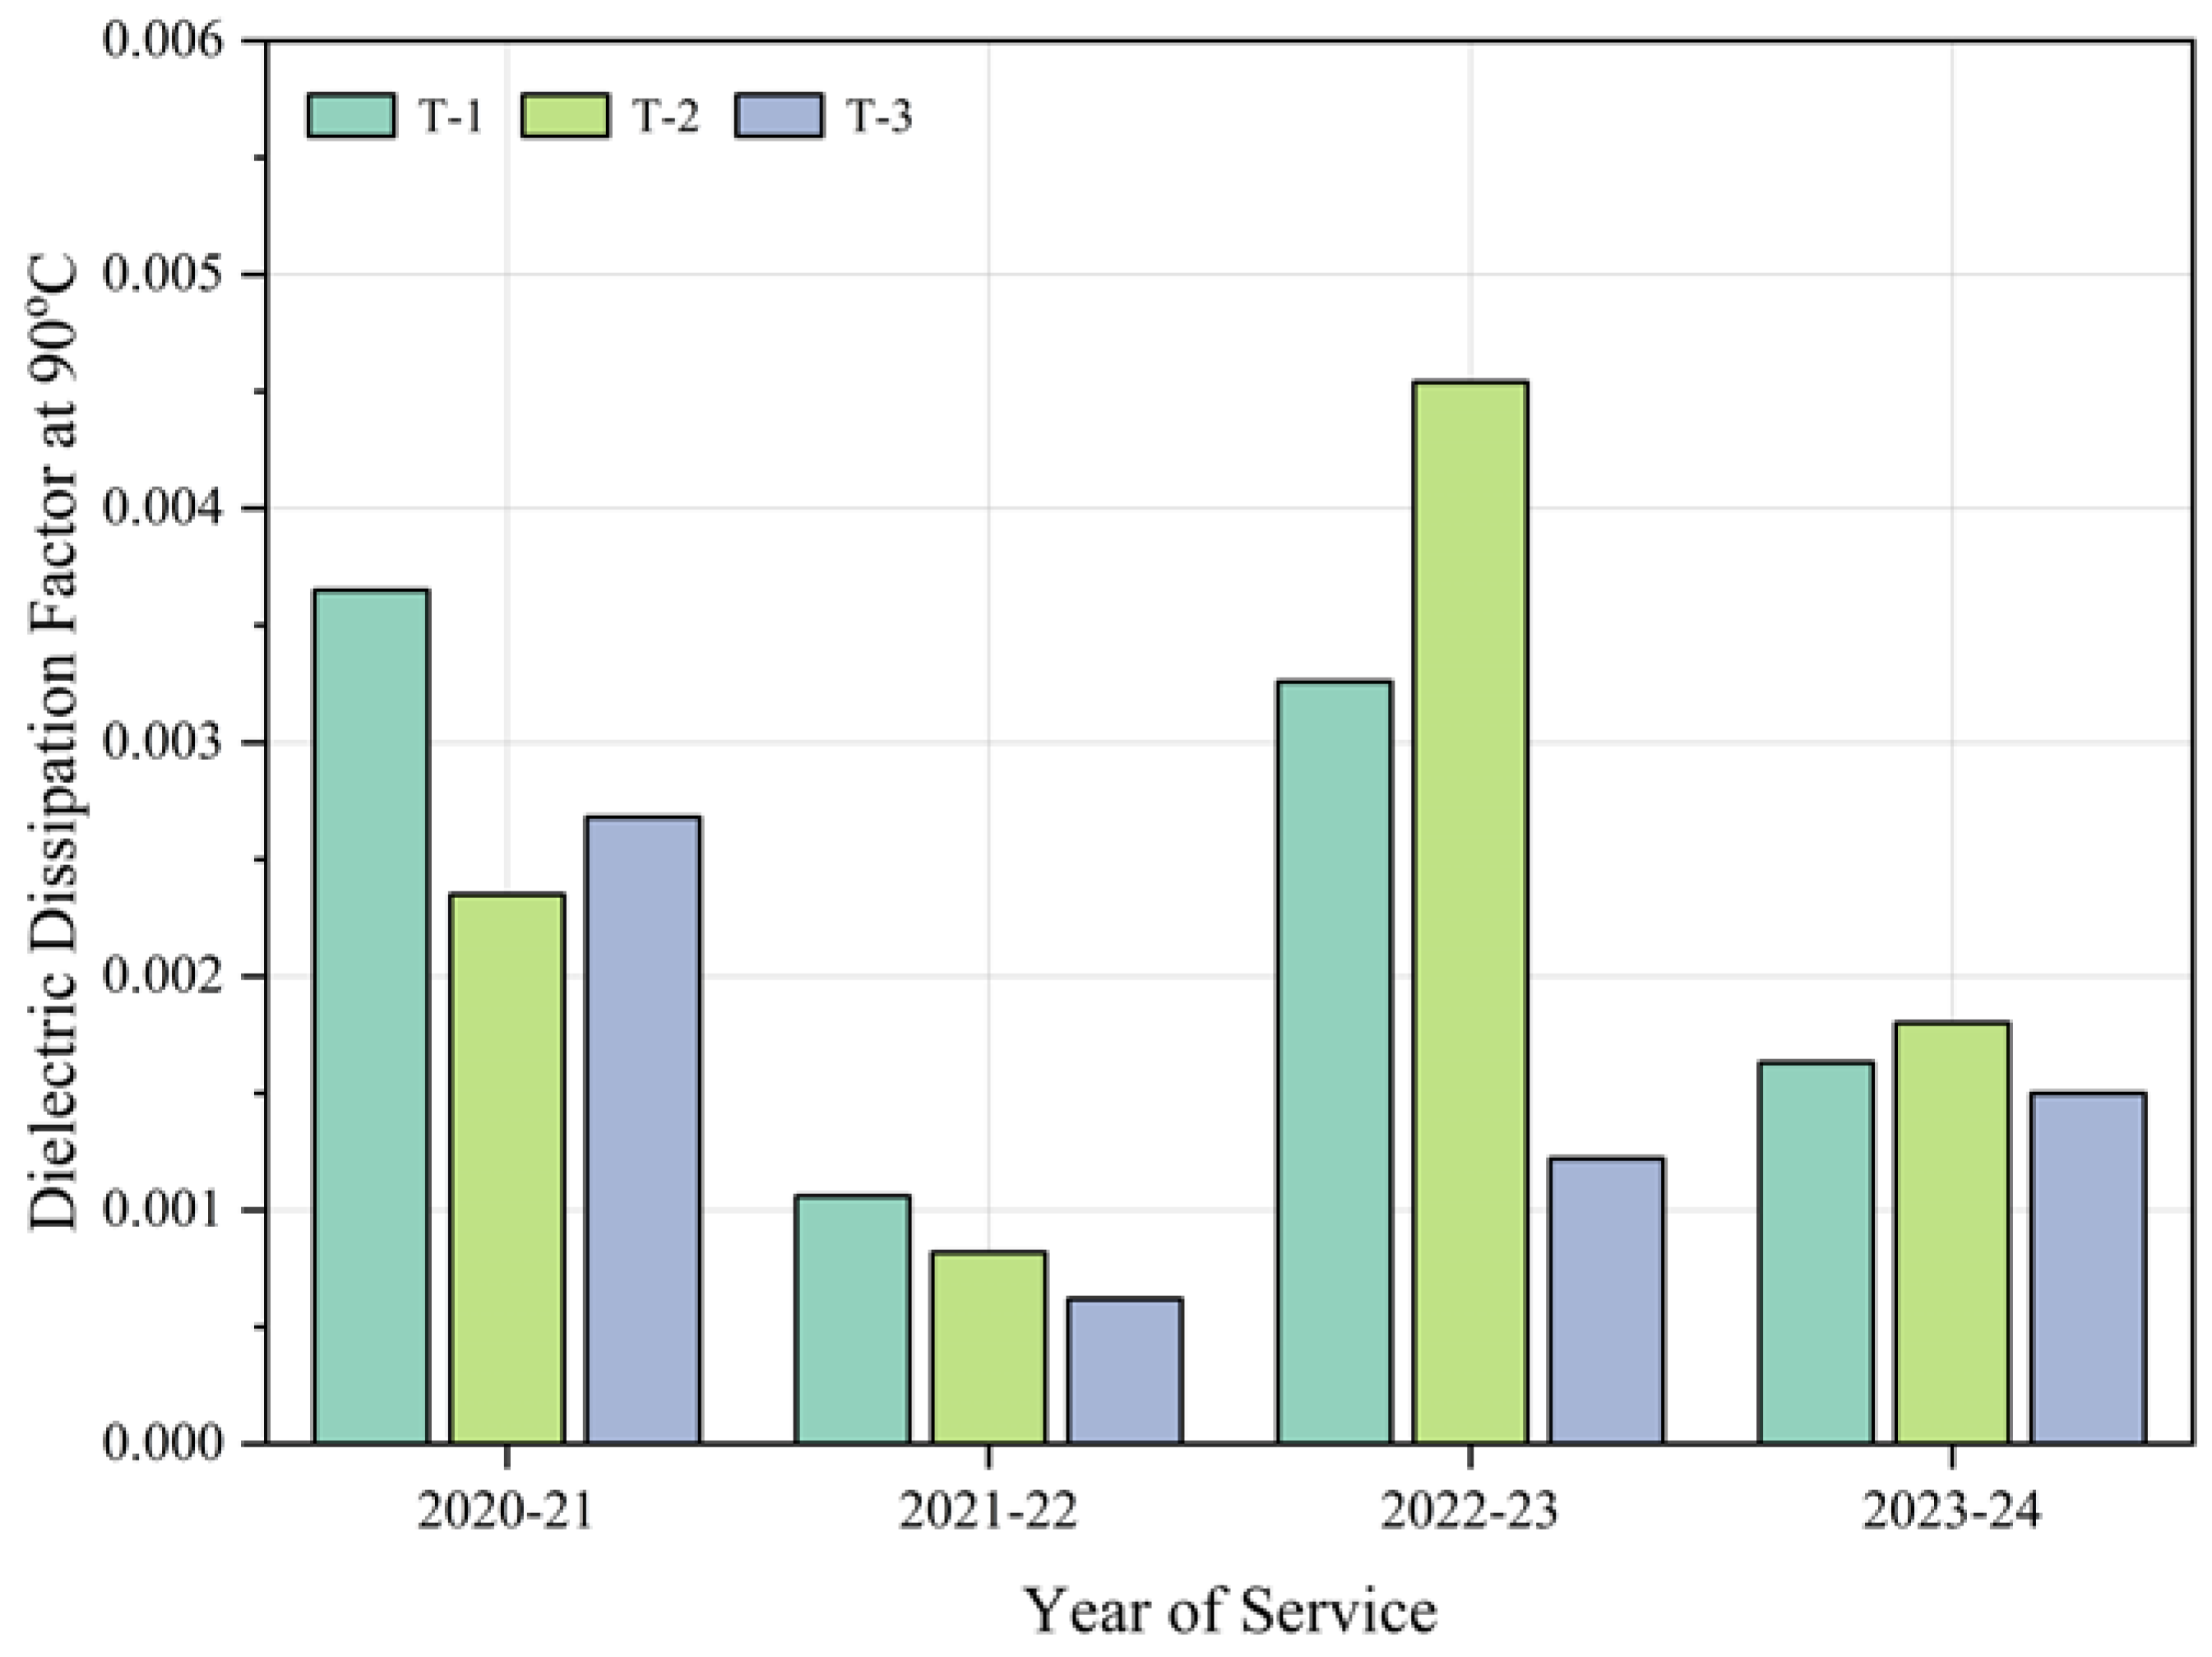
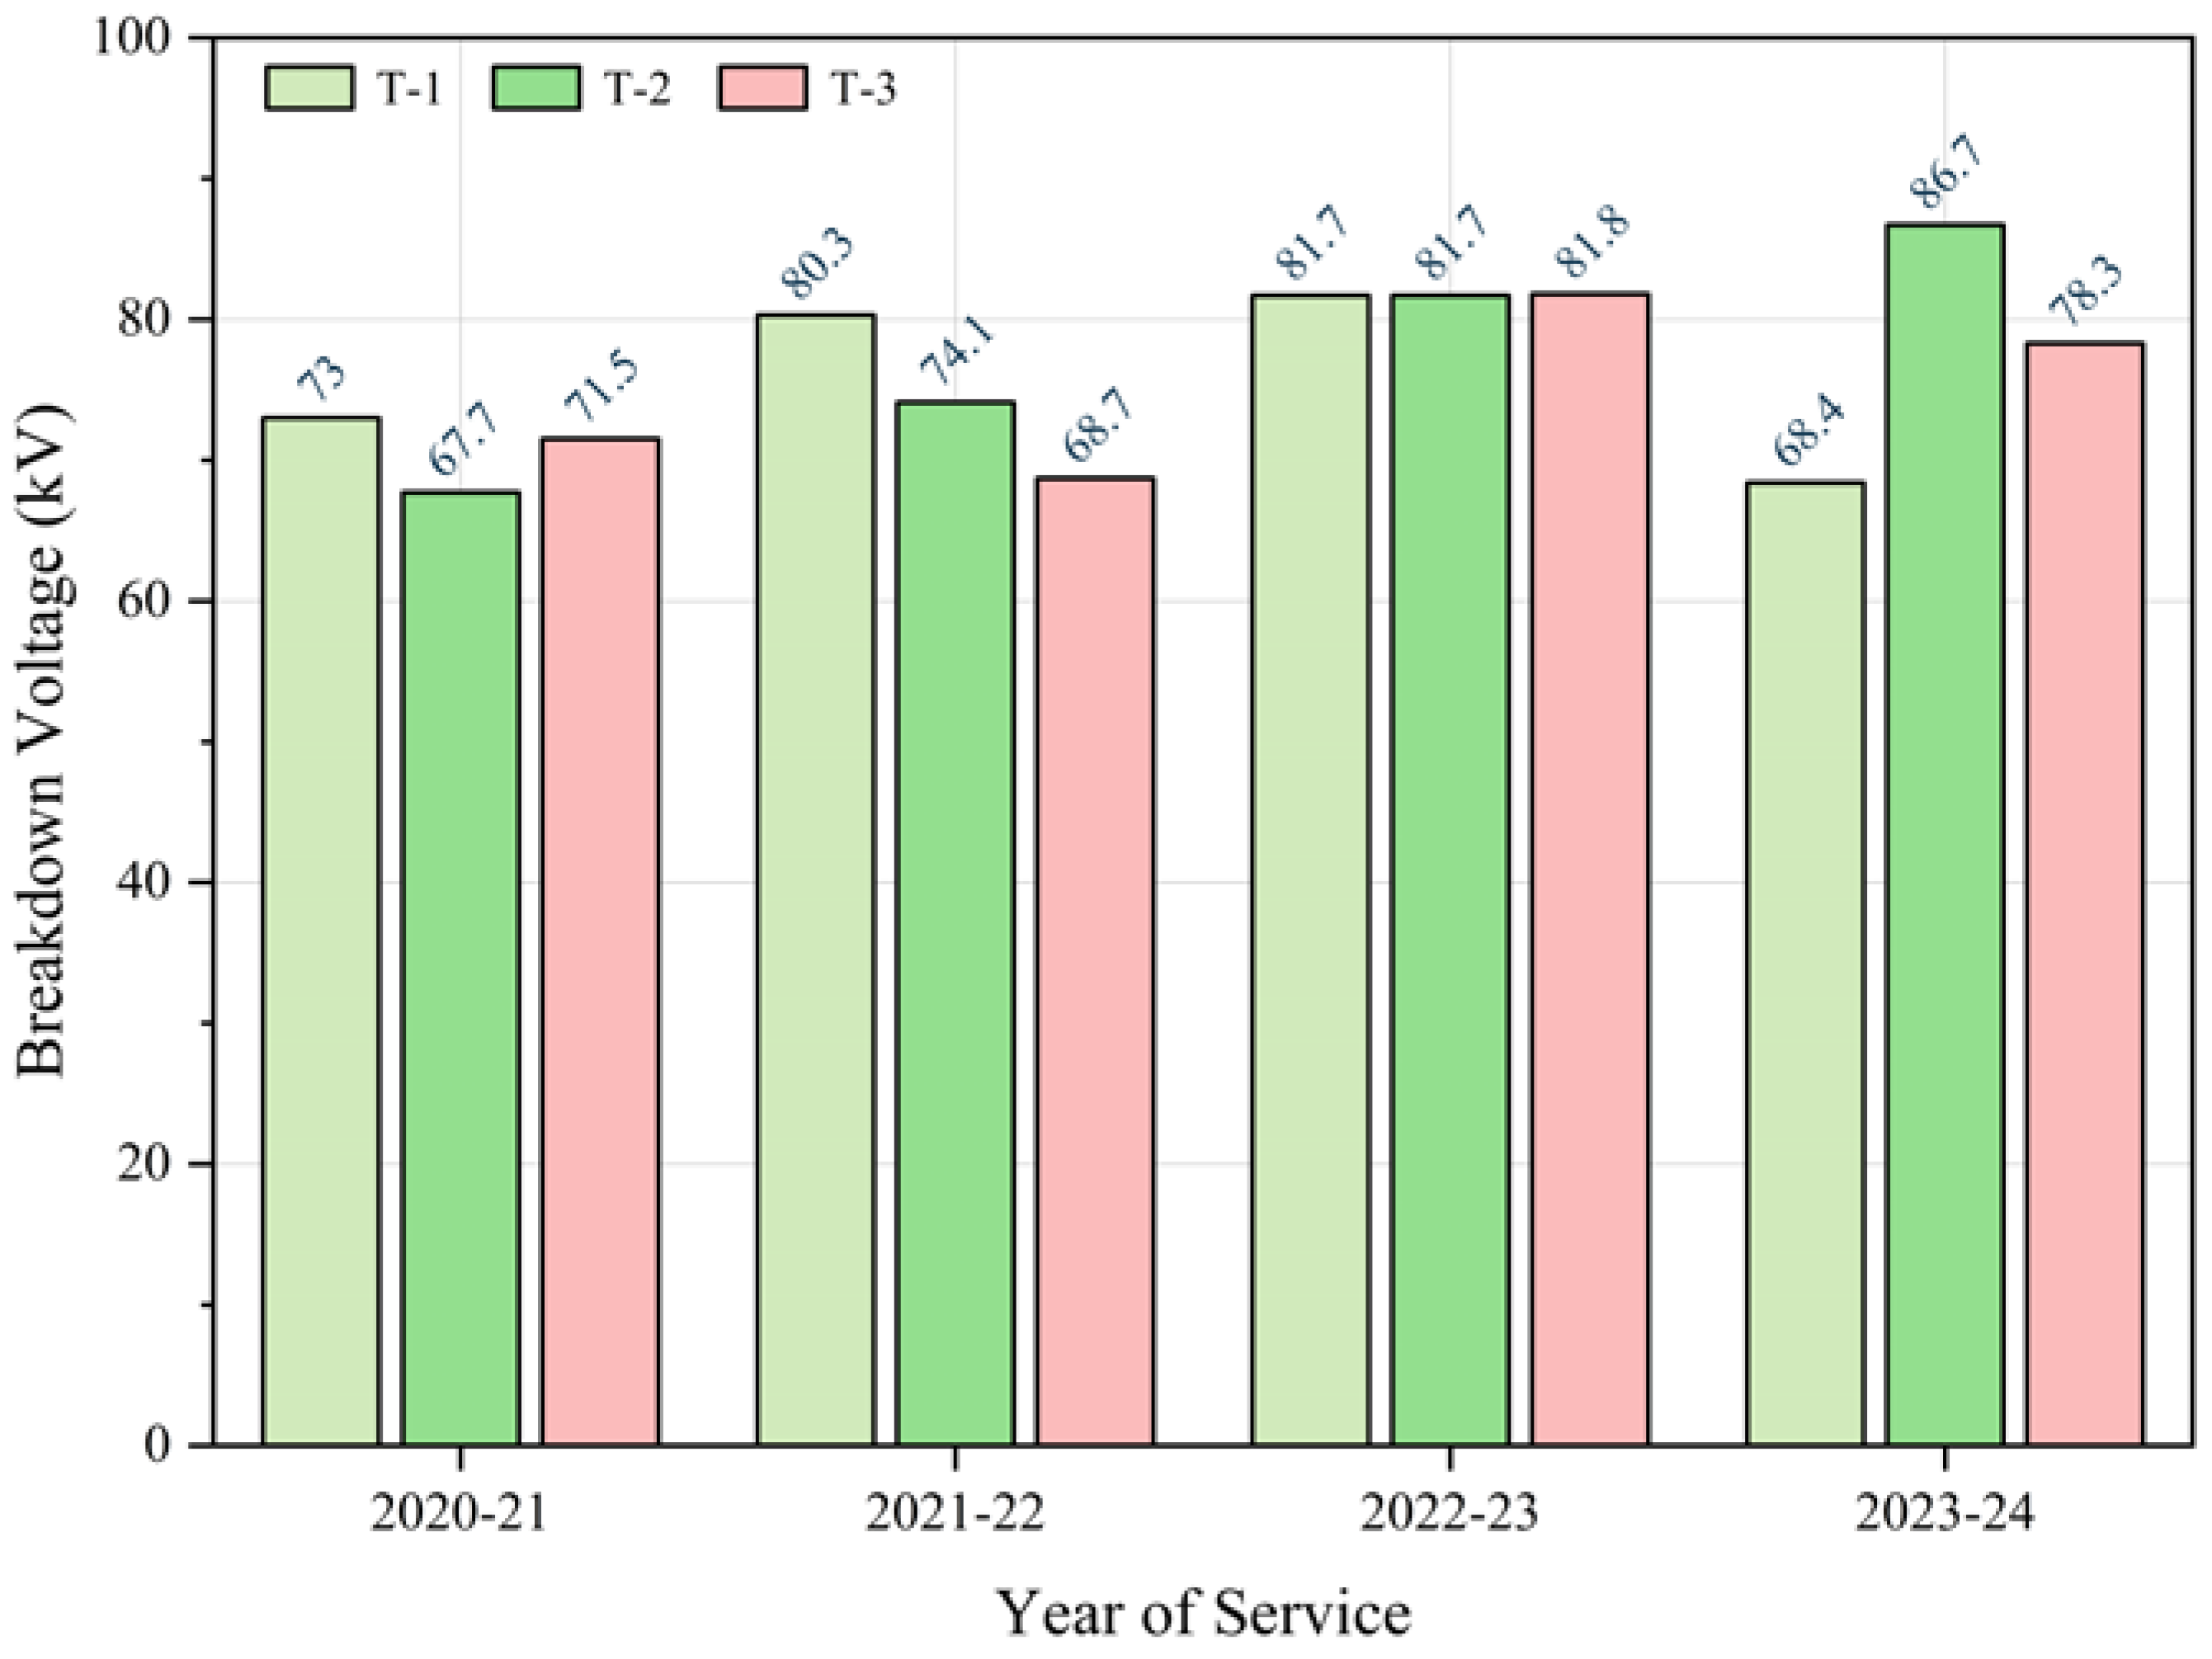
3.1. Electrical Characteristics

Figure 1 shows the variation in DDF with each service year for all three transformers. It was observed that the DDF values decreased after the second service year for all transformers. After the third year, the DDF values increased and then decreased after the fourth year, except for in the T3 transformer, where a slight increase was noticed. Although the values of DDF were below the acceptance values, variation in DDF was observed with each service year.
The breakdown voltage values of the three transformers are plotted in Figure 2. The breakdown voltage of T1 and T2 increased after the second and third service years. A decrease after the second and increase after the third service years in the breakdown voltages was noticed for T3. The fourth-year measurement results showed a decreasing trend for T1 and T3, while an increase in the breakdown voltage value was observed for T2.

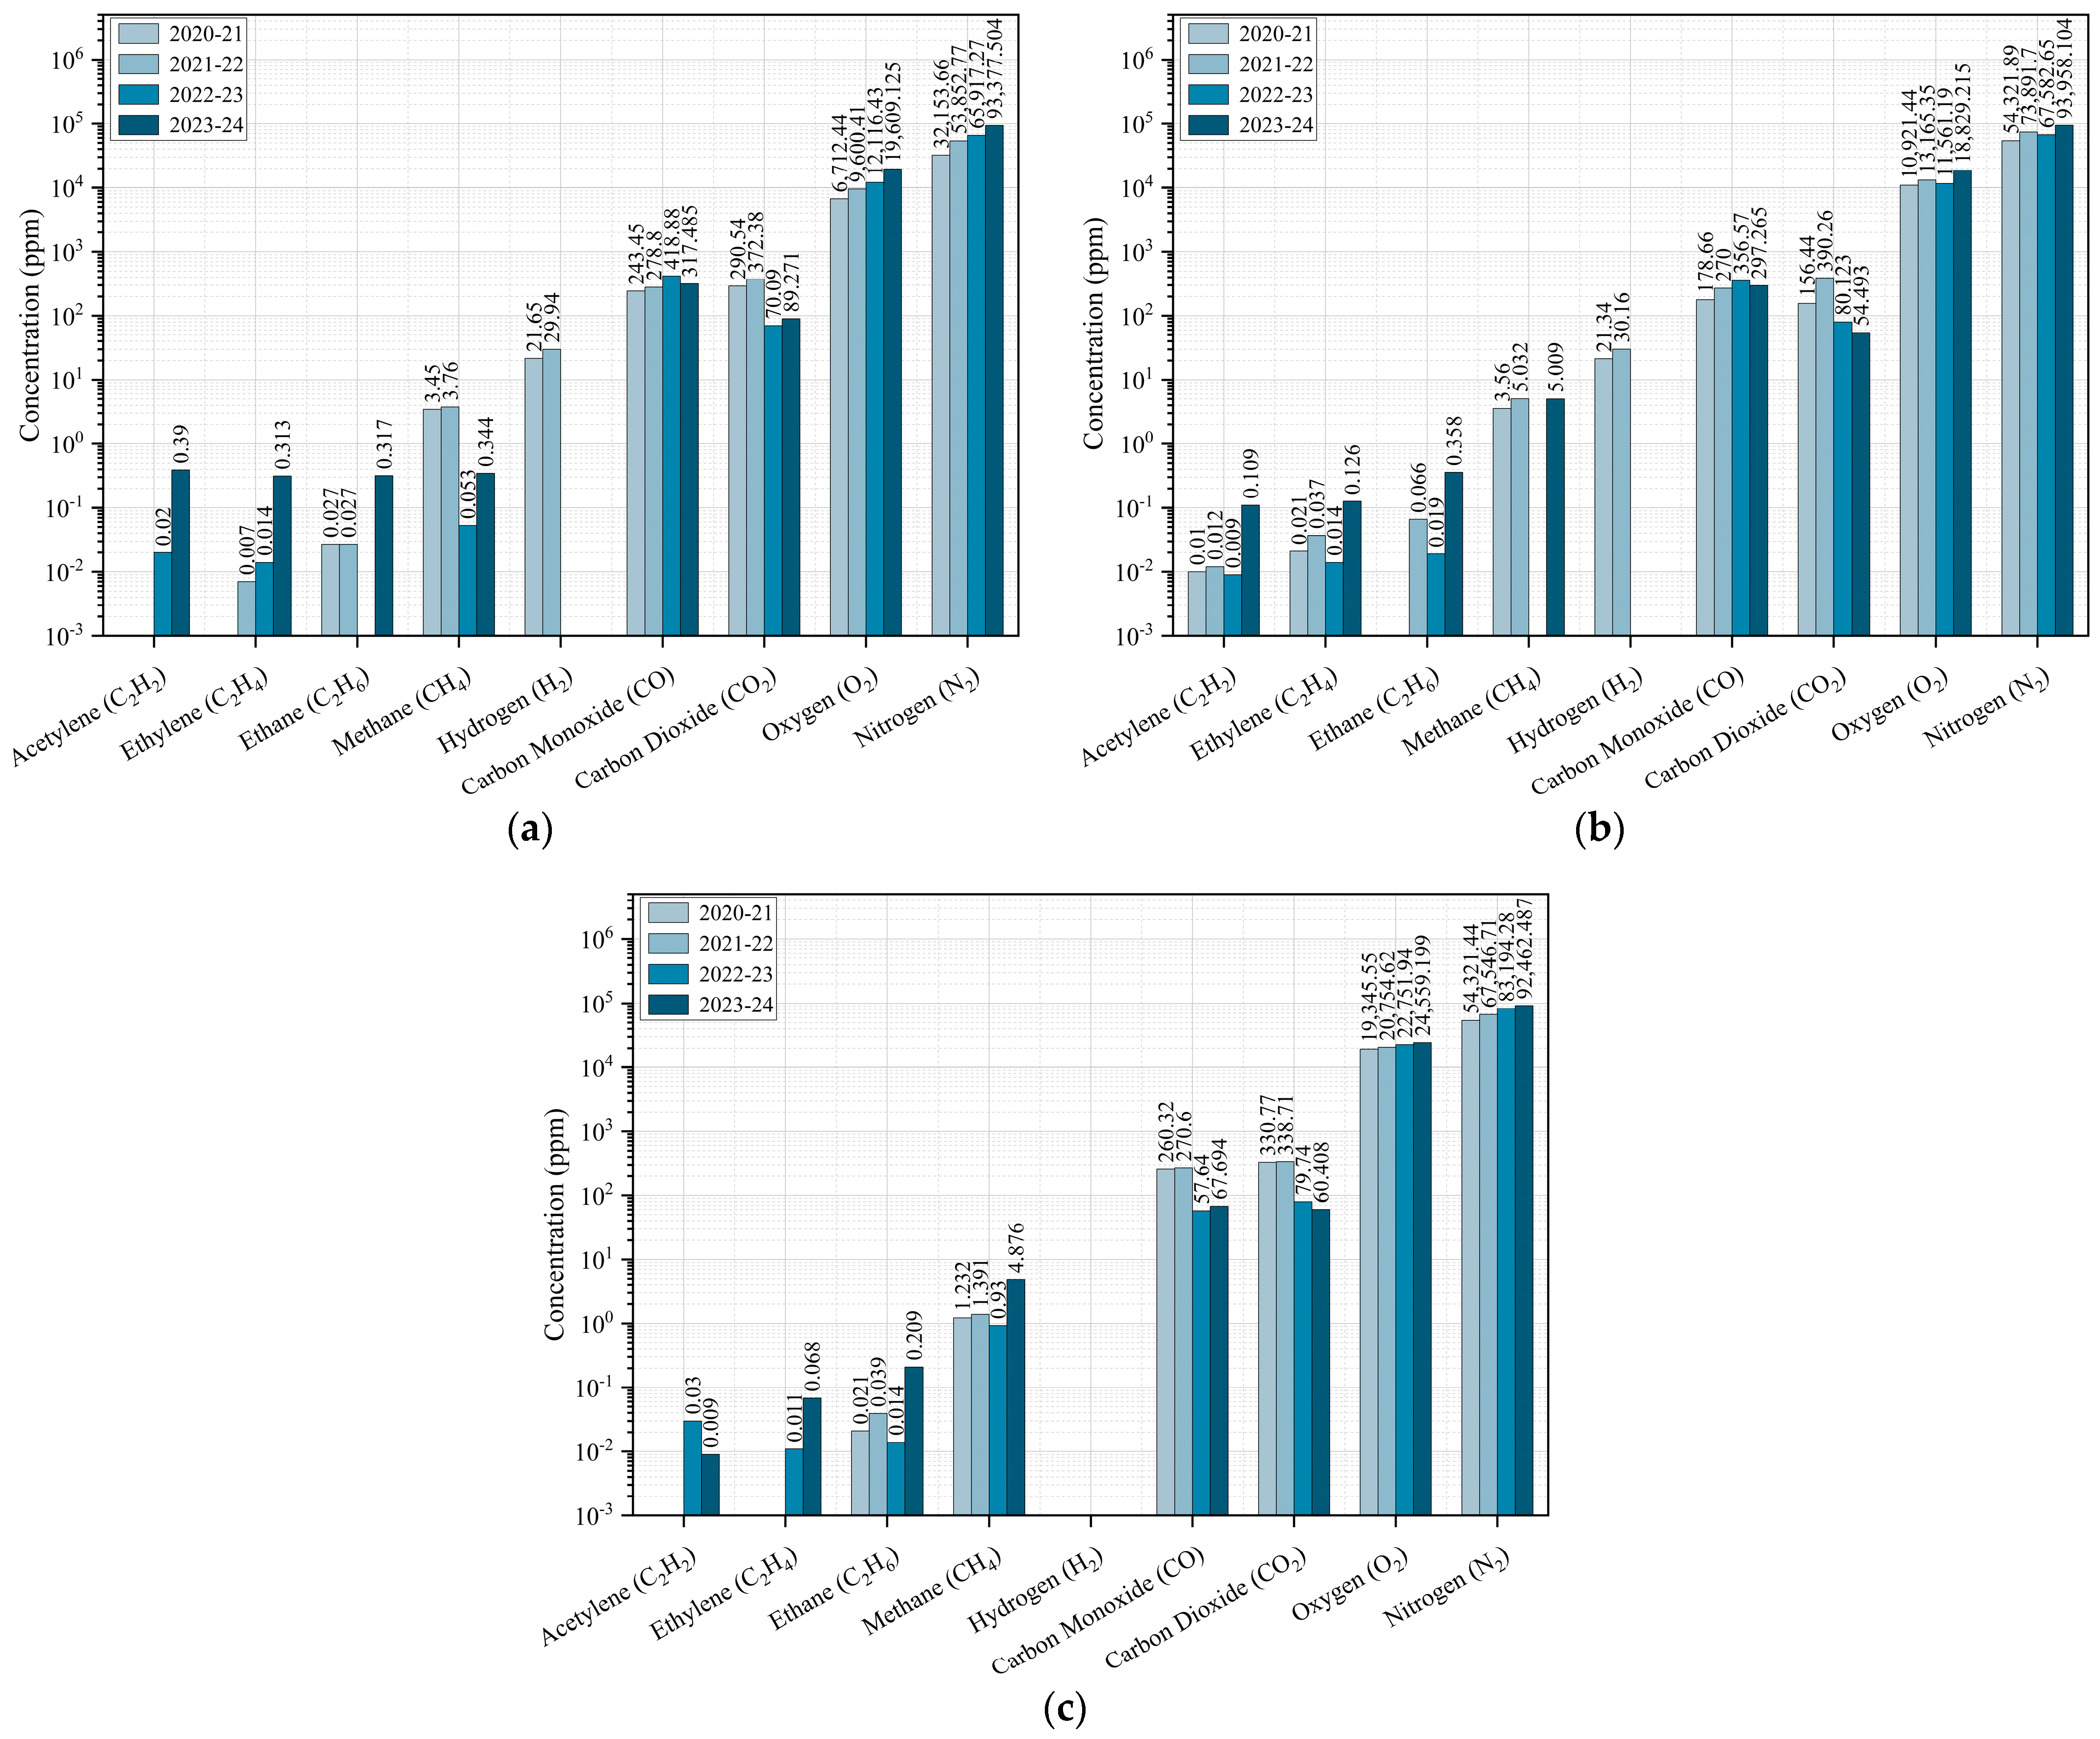
3.2. Chemical Characteristics

The impact of aging on the moisture content of transformers T1, T2, and T3 is plotted in Figure 3. For transformer T1, an increasing trend in the moisture content was observed throughout the service years. However, for transformers T2 and T3, except for a decreasing trend in the moisture content values during the second service year, an increasing behavior was noticed with each service year that passed.
The DGA analysis specified nine (9) key gases for the analysis of the oil samples. The gases included acetylene (C2H2), ethylene (C2H4), ethane (C2H6), methane (CH4), hydrogen (H2), carbon monoxide (CO), carbon dioxide (CO2), oxygen (O2), and nitrogen (N2). Acetylene, ethylene, ethane, methane, and hydrogen are considered to be produced due to the decomposition of oil, whereas carbon monoxide, carbon dioxide, and oxygen are generated due to cellulose insulation degradation. The concentration of the gases for each transformer is plotted for the service years in Figure 4. For all transformers under study, similar behavior for acetylene, ethylene, ethane, oxygen, and nitrogen was observed, where the values of the gas concentration increased in the oil samples with each service year. However, the values of methane increased for T1, T2, and T3 after the first two years of service, but then decreased after the third service year for T1 and T3. However, for T2, the DGA analysis of the oil samples taken after the third service year showed no traces of methane. Nonetheless, a significant increase in methane concentration was noticed after the fourth service year.
For transformers T1 and T2, the carbon monoxide concentration increased after the first three years of service, which then decreased after the fourth year. However, for transformer T3, an increase in the concentration of carbon monoxide after the first and second service years was recorded, which then decreased after the third service year. However, after the fourth service year, the concentration of carbon monoxide increased again. In the case of carbon dioxide, its concentration increased for the first two service years for all transformers. However, the DGA results obtained after the third and fourth years showed a decrease in its concentration for transformers T2 and T3. For T1, the carbon dioxide concentration decreased in the third service year and then increased after the fourth year.
The concentrations of oxygen and nitrogen increased during the service years for all transformers. The hydrogen gas concentration showed a distinct behavior from the rest of the gases. It was observed that the concentration of hydrogen increased in the first two service years for transformers T1 and T2, whereas for the subsequent years, no traces were found of it. For transformer T3, no traces of hydrogen were noticed throughout the service years.
It is important to mention here that the values of the moisture content and gas concentration were well below the acceptance values, as was the case for the DDF and breakdown voltage.

4. Discussion

4.1. Relationship Between Different Characteristics

In the previous section, the impact of aging time (in terms of service years) on the electrical and chemical characteristics was obtained. However, it is imperative to study the relationships between the DDF, breakdown voltage, and moisture content, since the DDF and breakdown voltage vary with the charging mode of the insulation oil, whereas the moisture content in the insulation is considered to influence the electrical characteristics [21,36].

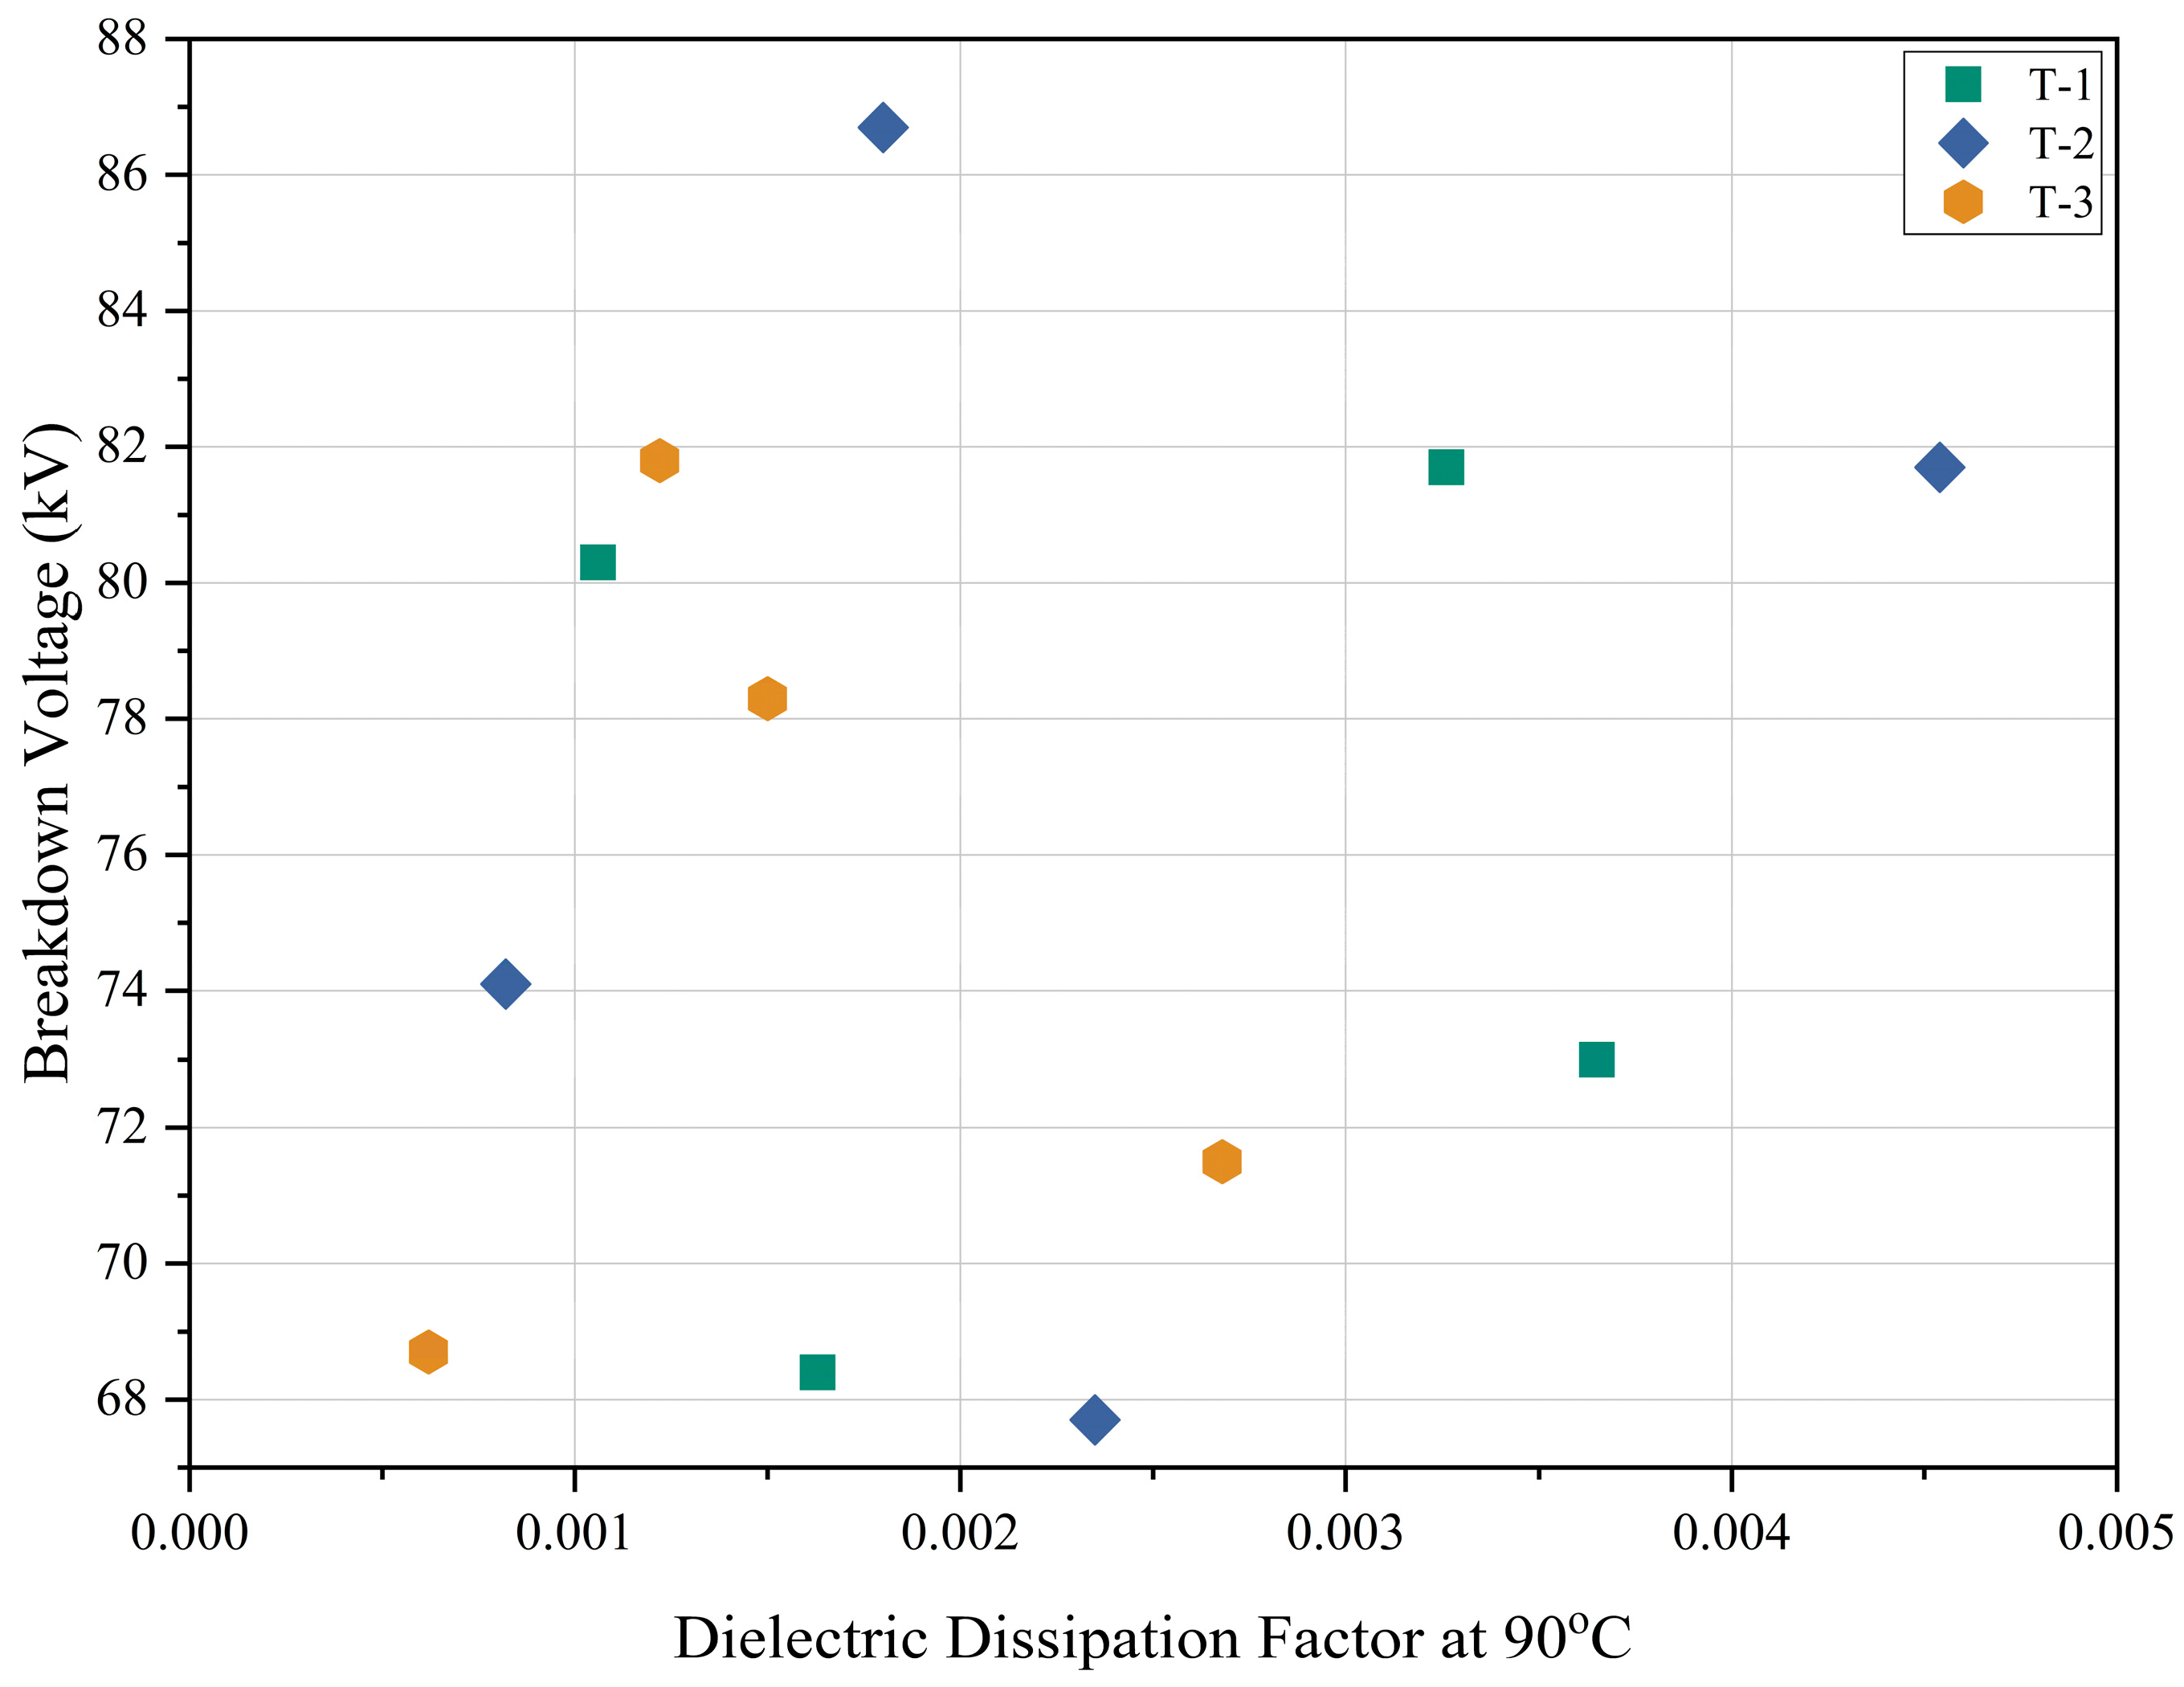
4.1.1. Dielectric Dissipation Factor and Breakdown Voltage Relationship

The electrical characteristics, namely breakdown voltage and DDF, both have tendencies to vary according to the presence of foreign objects and charged particles in the insulating oil; hence, the two electrical characteristics are plotted in Figure 5 to understand the relationship. The high values of breakdown voltage relate to the higher resistivity of the oil insulation, which is reflected as low values in the DDF. However, from the DDF and breakdown voltage results, a weak correlation was found between them. As transformers age, the concentration of by-products and foreign particles increases. These by-products include acids, sludge, and polar compounds, while foreign objects contain particles and moisture [37,38]. The high levels of these substances significantly affect the breakdown voltage and DDF. In the current study, the transformers being examined exhibited breakdown voltage and DDF values below the acceptable range. Consequently, there was minimal impact of aging on the transformer oils, resulting in a weak correlation between breakdown voltage and DDF, which led to an ineffective control trend.

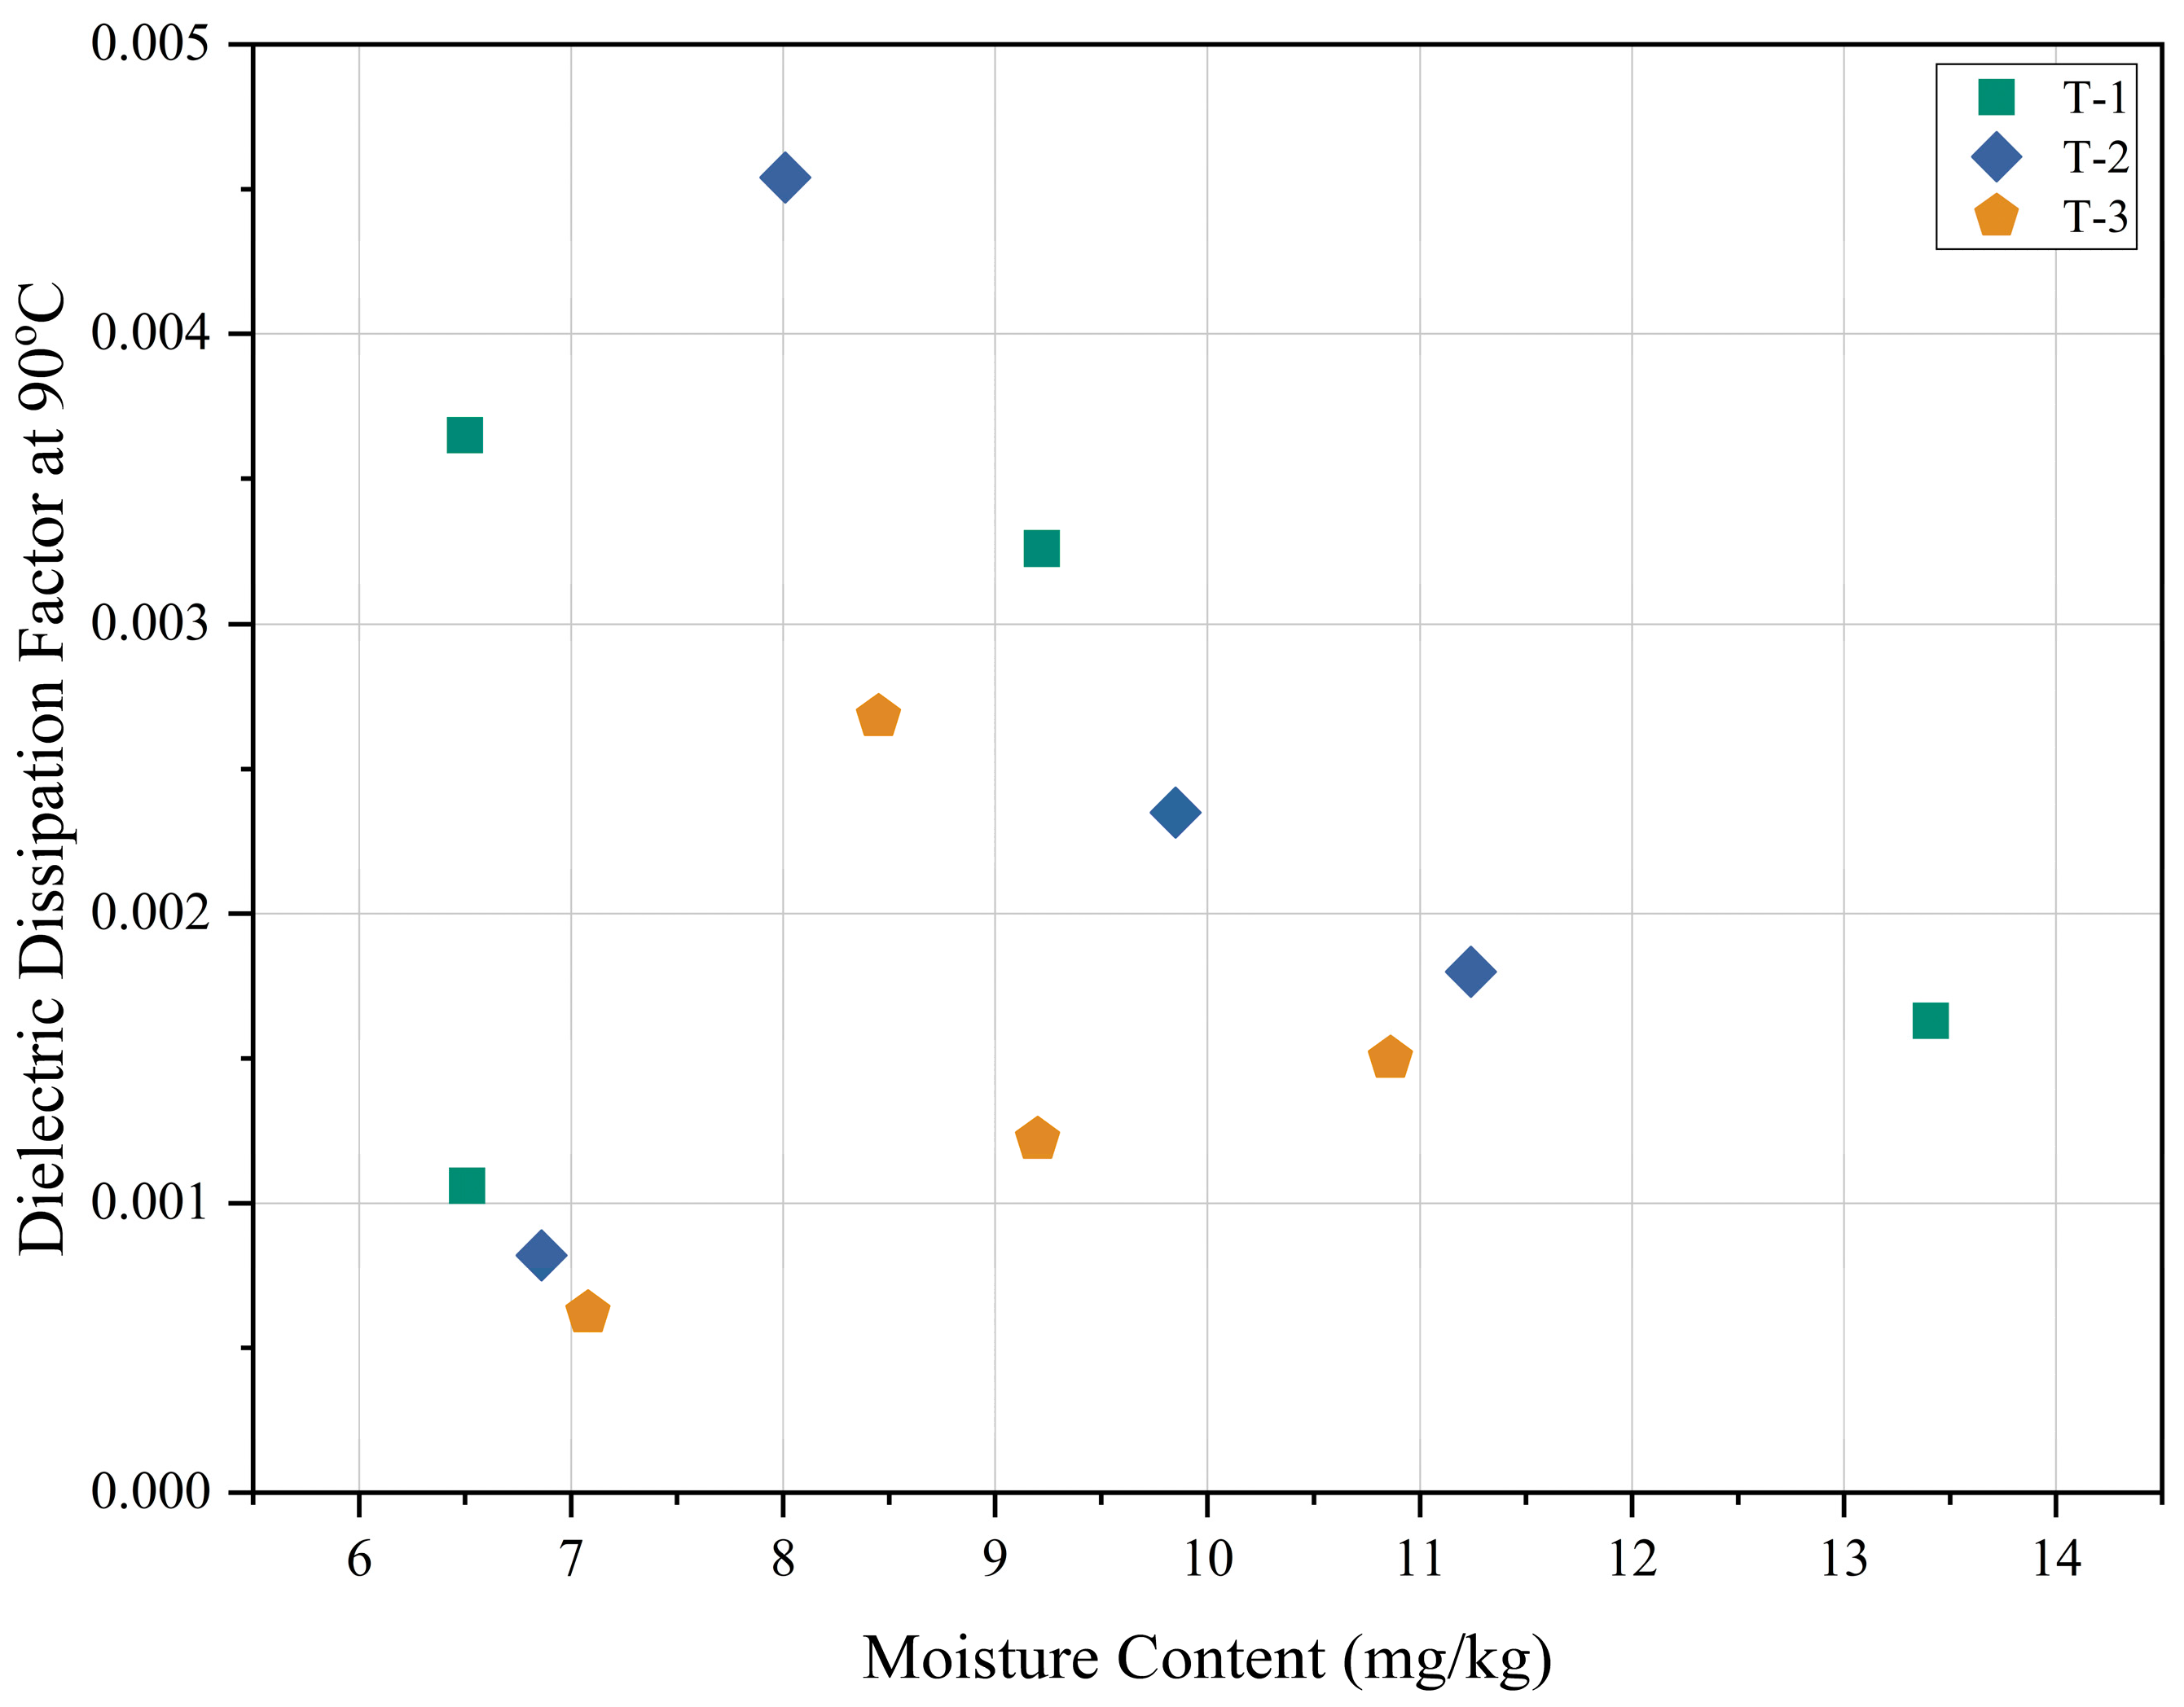
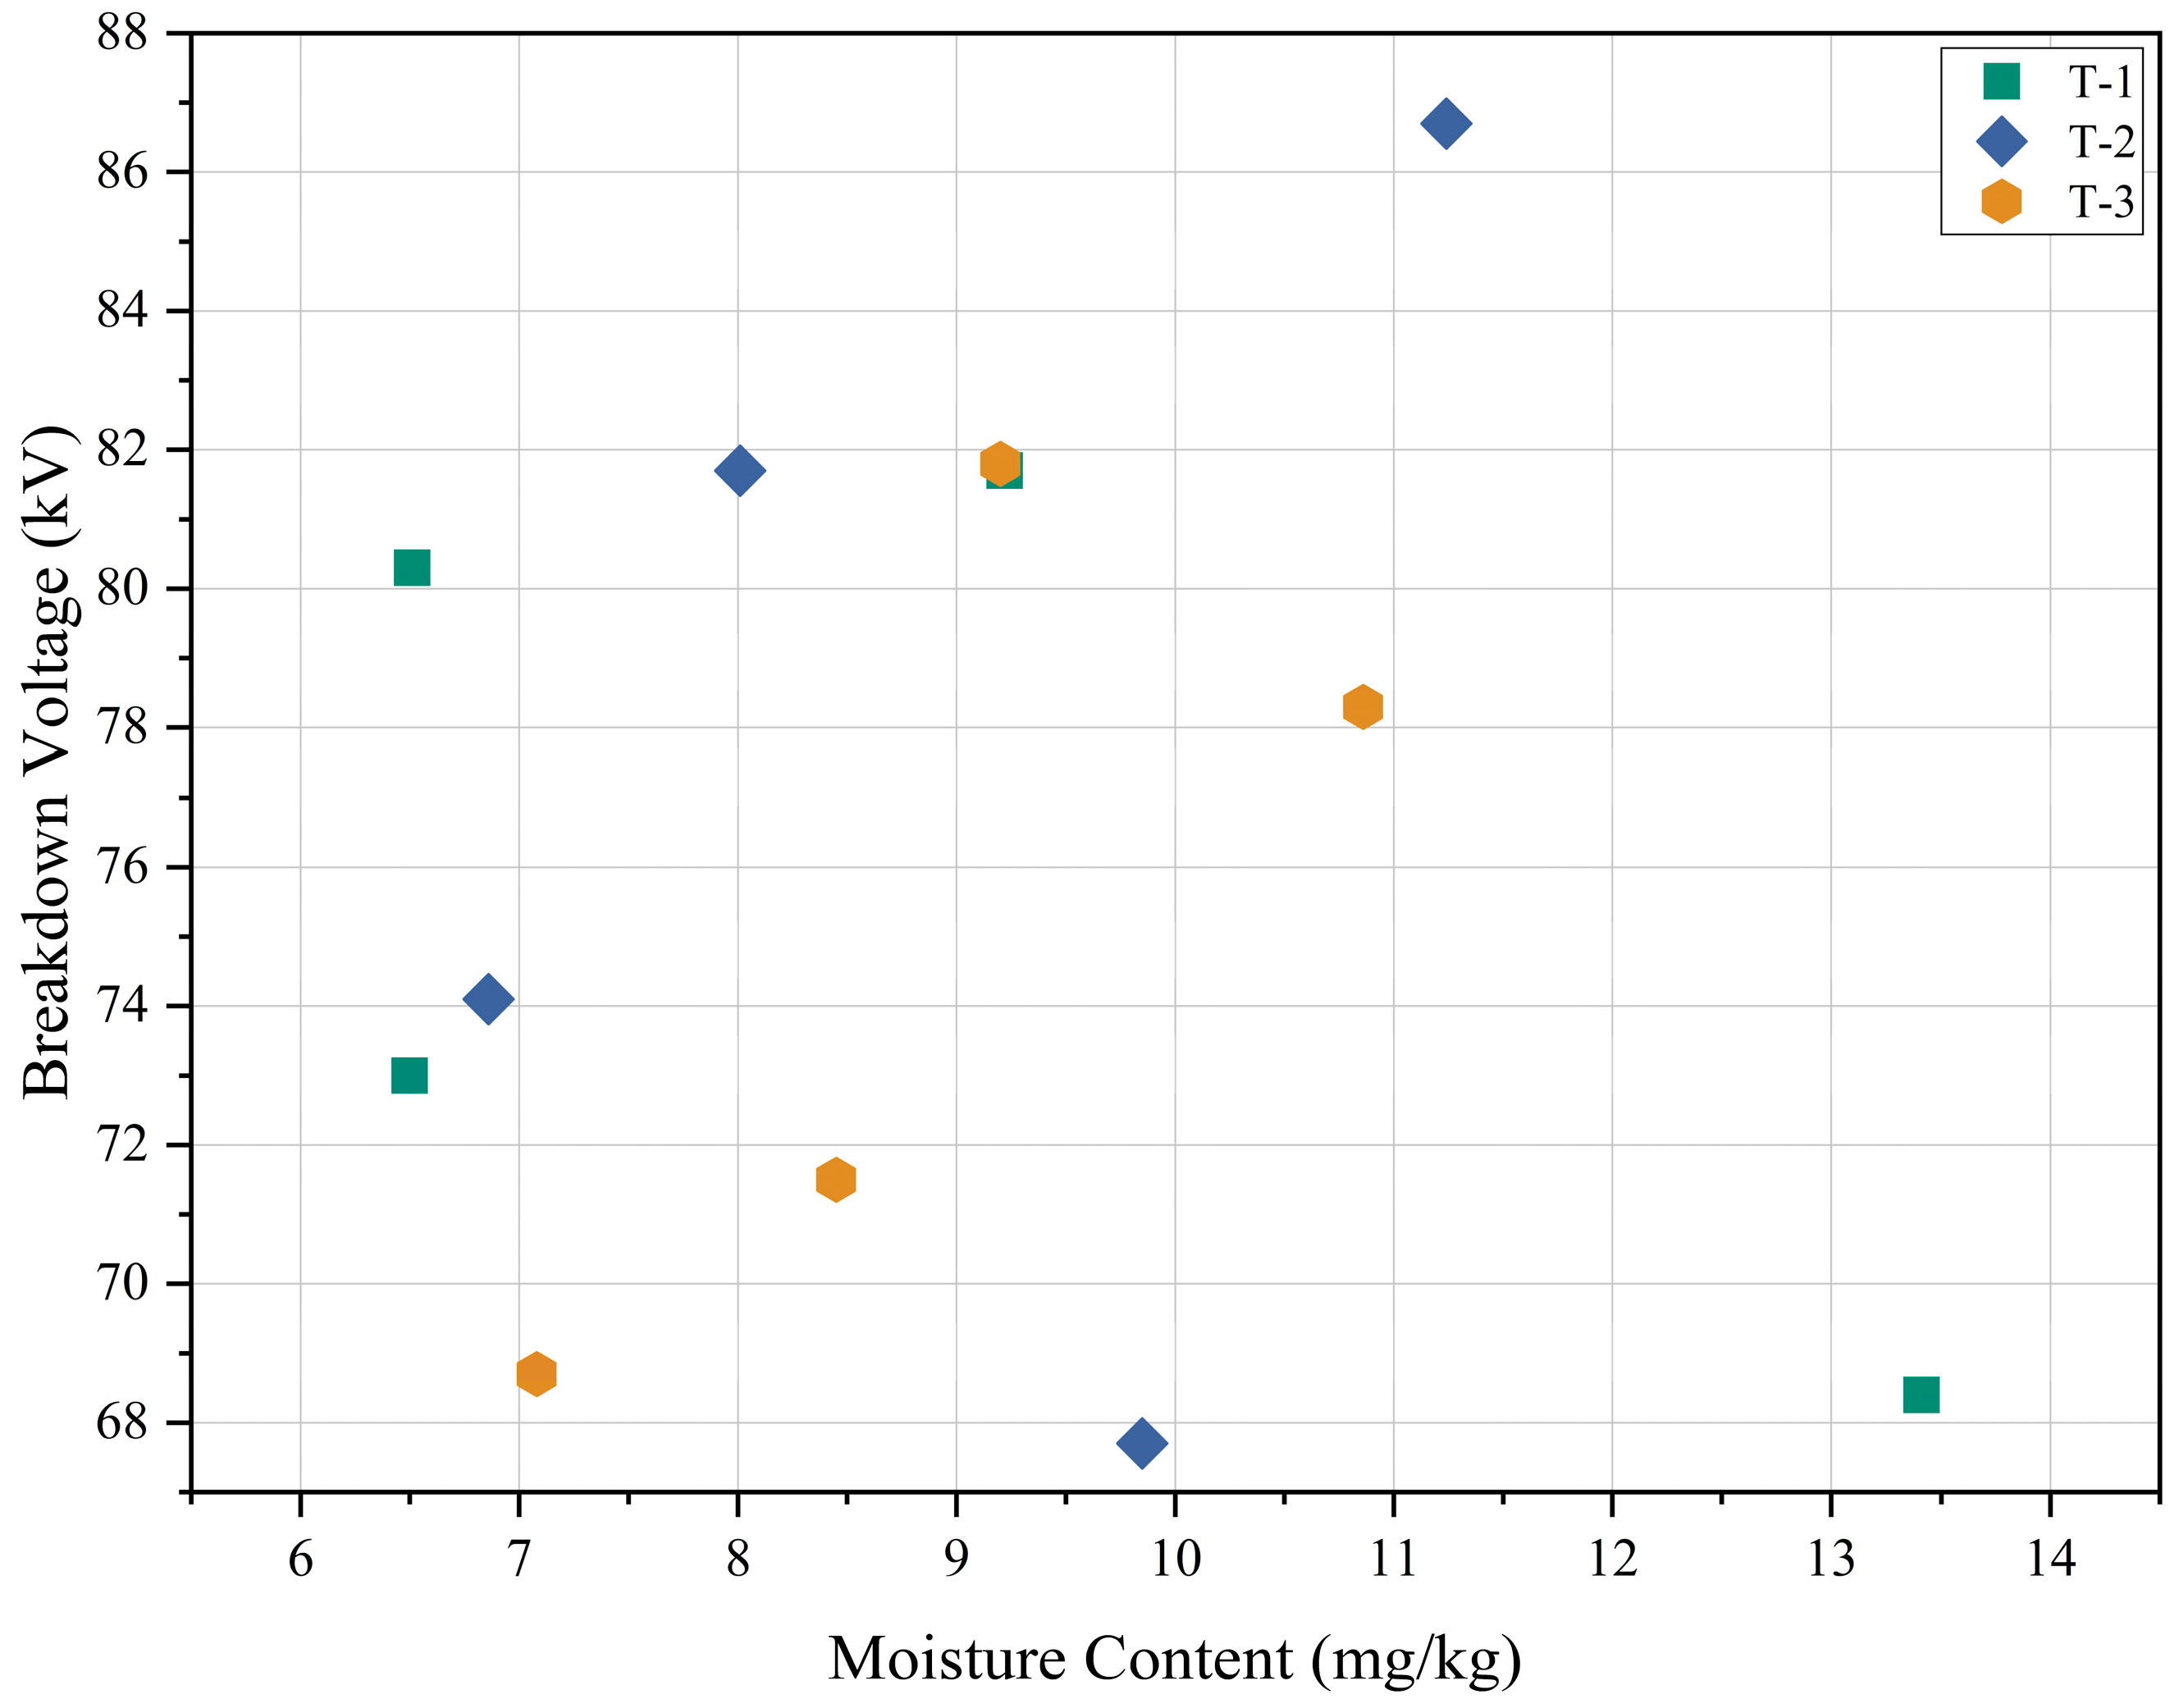
4.1.2. Impact of Moisture Contents

Figure 6 represents the relationships between the moisture content and DDF. Since the precipitation of moisture is considered to deteriorate the dielectric characteristics, moisture content can be used as an index to evaluate electrical characteristics. In Figure 6, however, no clear correlation was found between moisture content and DDF for T1 and T2. However, the correlation results for T3 showed that with the increase in the moisture content, the dielectric dissipation factor also increased.
The impact of moisture content on the breakdown voltage of the three transformers was also analyzed, Figure 7. As with the DDF, no clear correlation was found between the moisture content and breakdown voltage for all transformers. These results are believed to be due to the fact that the moisture content values were well below the threshold values and, hence, the moisture content had little influence on the electrical characteristics.

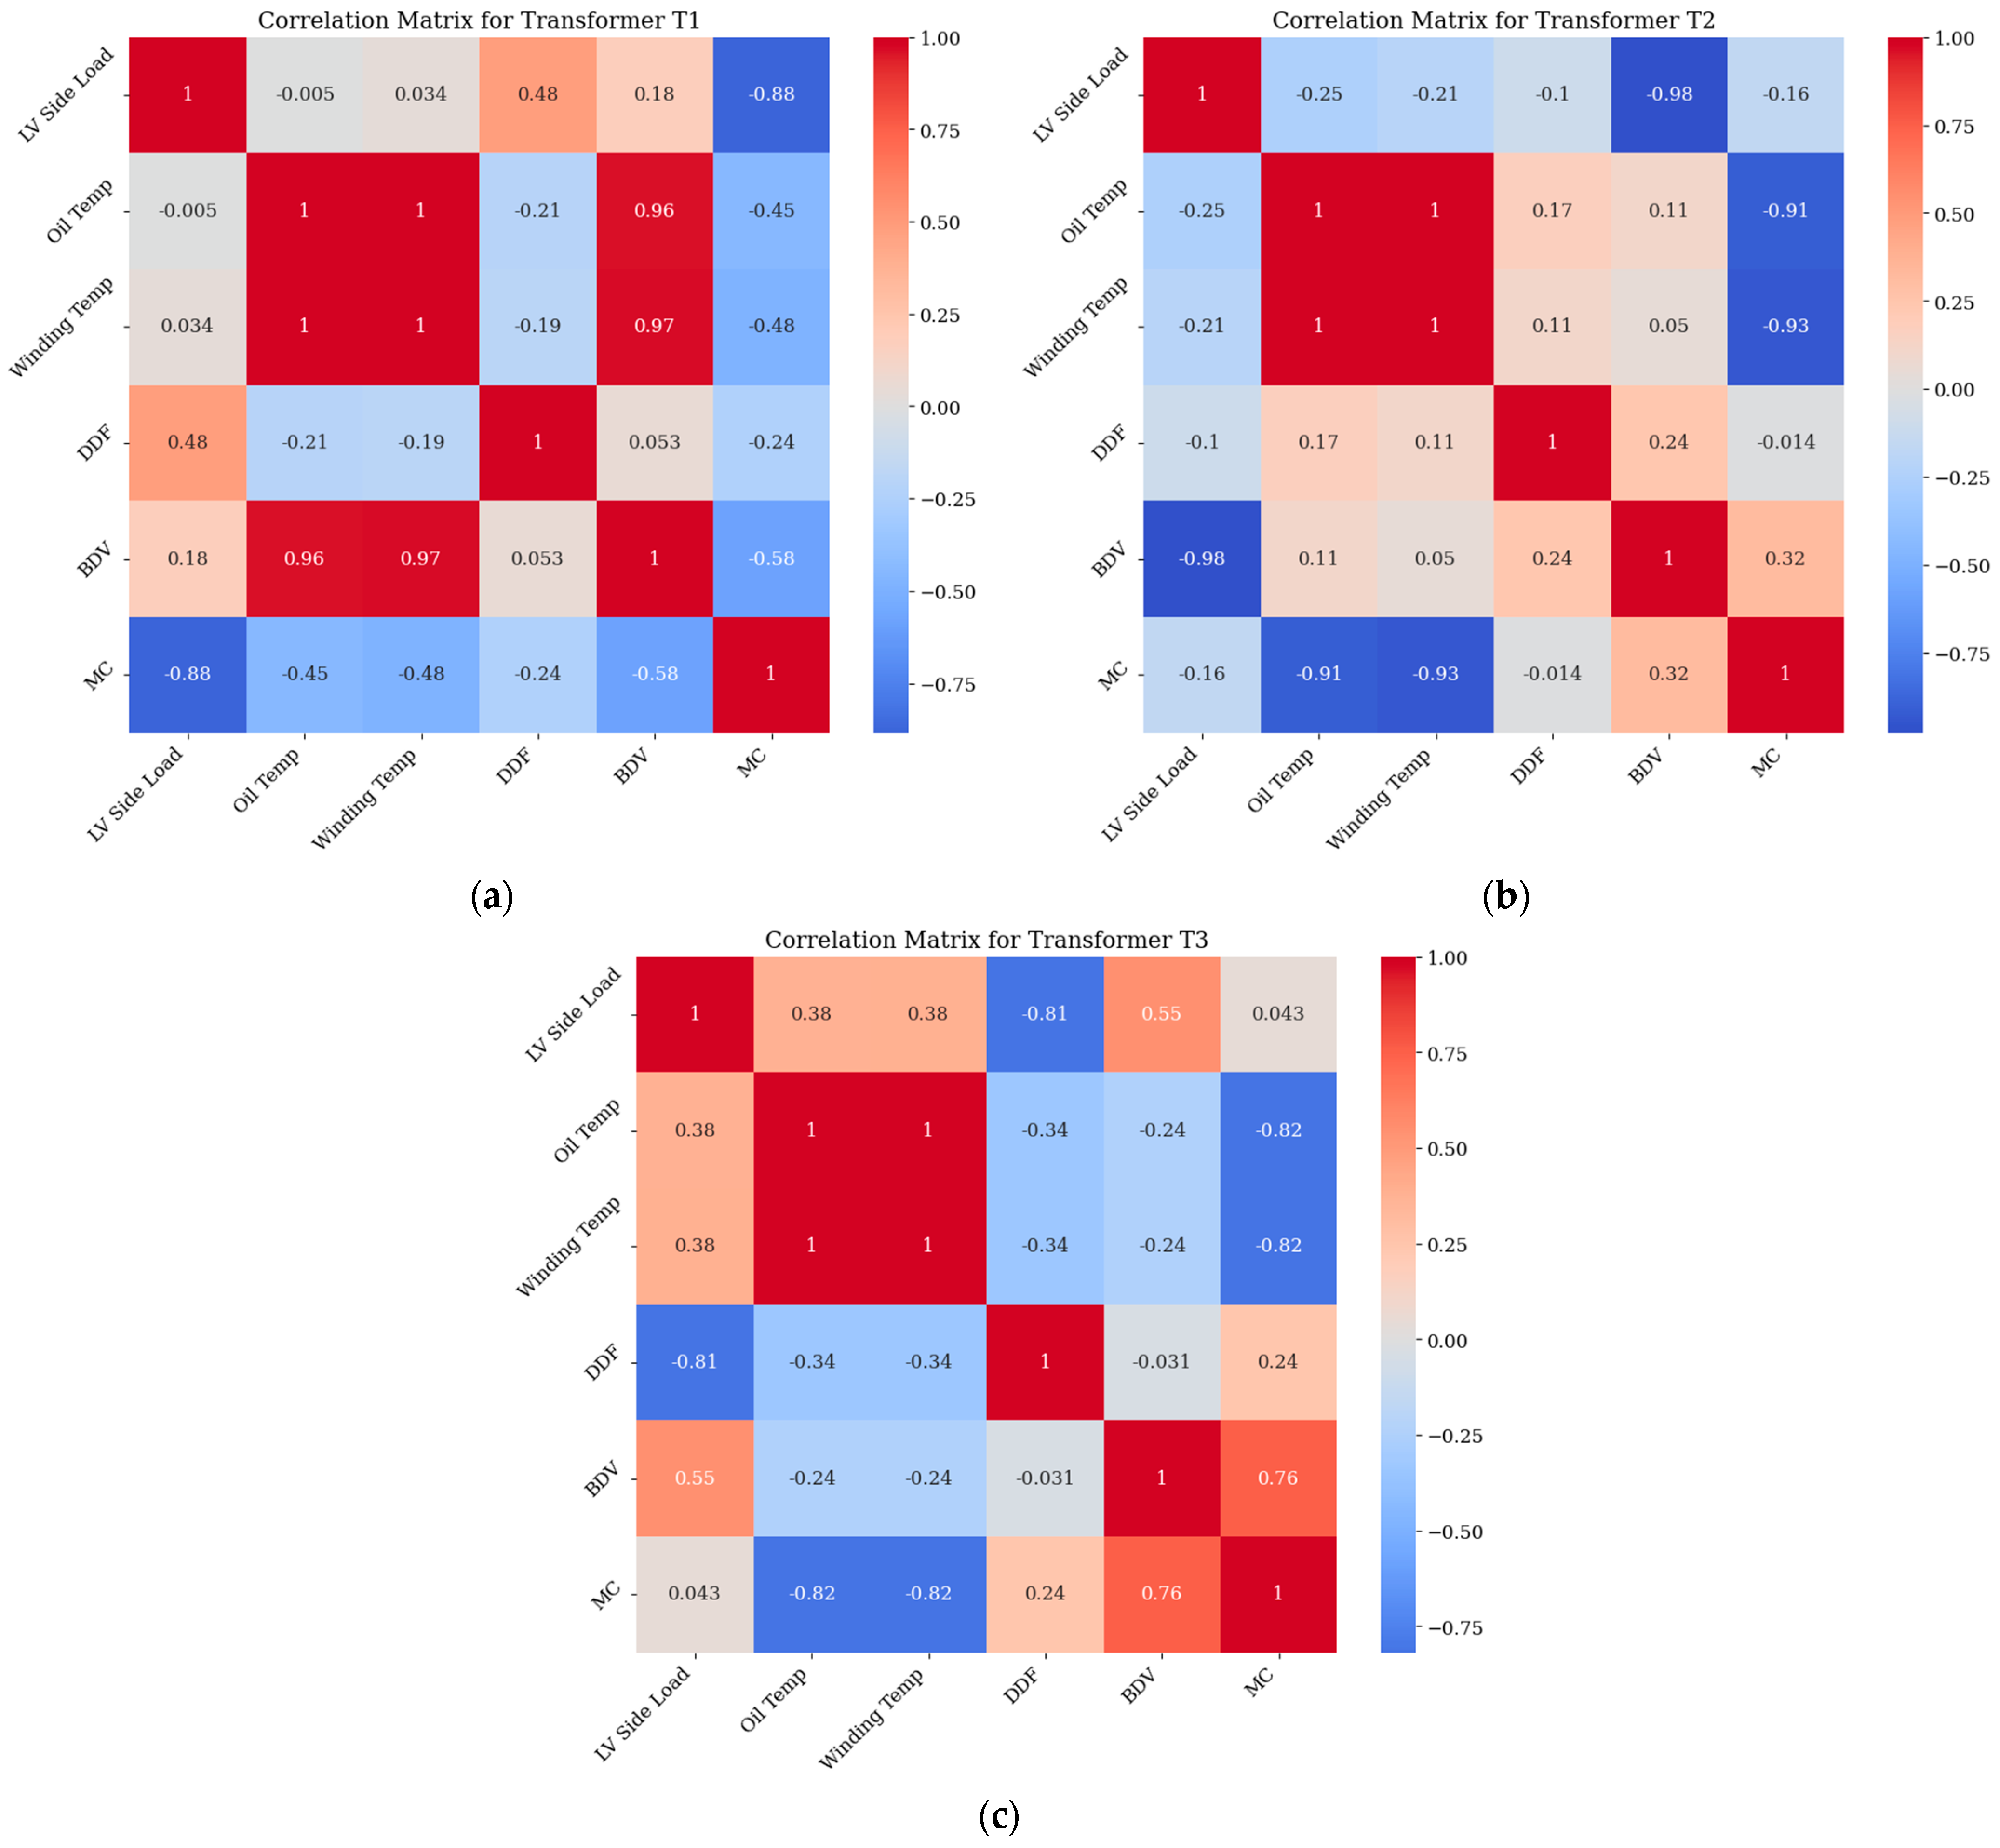
4.1.3. Impact of Load Variation, Oil Temperature, and Winding Temperature

To enhance the understanding of the variation in DDF, breakdown voltage, and moisture content with service years, other variables of the transformers, i.e., LV side load and oil and winding temperatures were taken into account, as the operating temperature influences the transformer insulation. The results of the electrical and chemical characteristics along with the recorded values of LV side currents and oil and winding temperatures are summarized in Table 3 for each transformer.
The correlation matrices were generated considering the LV side load, oil temperature, winding temperature, DDF, breakdown voltage, and moisture content for each transformer (Figure 8). It was observed that for transformers T1 and T2, the correlation of LV side load with oil temperature and winding temperature was either weak or negatively moderate. This was because T1 and T2 are connected to the transmission side of the network, i.e., at 220 kV; hence, the load variation had little effect on the oil and winding temperatures. Similar behavior was also observed for the values of the correlation coefficients of LV side load, DDF, and moisture content.
For transformer T3, a positive moderate correlation was established for LV side load, oil temperature, and winding temperature. This impact of the load variation on the temperatures was due to the fact that transformer T3 is connected to the distribution section of the network, where the impact of the load variation is high.
From the correlation matrix, a prominent impact of oil and winding temperatures on the moisture content of T1, T2, and T3 was observed. With the increase in temperature, the moisture content decreased. This correlation of the oil and winding temperatures and moisture is because the moisture in transformers exists in both the oil and the cellulose insulation, with the latter holding the majority due to its hygroscopic nature. As the temperature of the oil and windings increases, moisture migrates from the cellulose insulation to the oil as a result of the shifting equilibrium [39,40]. However, due to the elevated temperatures, combined with moisture removal systems, oil circulation, and degassing processes, the moisture content is effectively removed. For T1 and T2, the oil and winding temperatures had a weak correlation with the DDF, whereas a strong positive correlation between the breakdown voltage and oil and winding temperatures was noticed for T1, showing that the breakdown voltage increased as both temperatures increased. This behavior was possible considering that the moisture and any foreign objects at these temperatures are dissolved in oil, whose impact is limited by the increase in the temperatures. The increase in oil and winding temperatures decreased the breakdown voltage of T3, while the impact of the moisture content was also noticed.

4.2. Assessment of the DGA Results

Transformer oil aging is a complex process accelerated by several operational stressors, particularly thermal and electrical faults. The degradation of oil over time is further influenced by contaminants, such as metallic particles, moisture, and cellulose fibers from insulation breakdown. These factors contribute to the chemical decomposition of both transformer oil- and cellulose-based insulation, generating various low-molecular-weight gases that dissolve within the oil. DGA enables the identification of specific fault types by quantifying these gases and interpreting their ratios.
In this study, the concentration of dissolved gases across three transformers was observed to remain below critical diagnostic thresholds during successive service years, which precluded the application of conventional DGA fault identification techniques, such as the Dornenburg ratio and Roger ratio methods [6]. Instead, our analysis was directed towards understanding the implications of trace gas concentrations on the degradation patterns of transformer insulation materials according to Table 4 [41].
As observed from the results of DGA, the initial presence of gases, such as methane, acetylene, ethylene, ethane, and hydrogen, during the first two years of service for transformers T1 and T2, is indicative of the initial stages of insulation oil decomposition, likely resulting from fault activities. Notably, an increasing trend in hydrogen concentration was observed over these initial years, suggesting active degradation. In subsequent service years, the near absence of these gases indicates a significant reduction in the decomposition rate, which aligns with a decrease in LV side currents, oil temperature, and winding temperature, as mentioned in Table 3. This stabilization implies mitigation of the fault activity.

4.2.1. CO2/CO Ratio

The presence of carbon monoxide, carbon dioxide, methane, and moisture content across all transformers signifies cellulose insulation degradation. It was observed that the degradation rate was most pronounced in T1 and T2, as shown by consistently elevated carbon monoxide and moisture levels with each service year, in contrast to the T3 profile, where carbon monoxide levels decreased while moisture content continued to rise. According to the IEC 60599 standard, a carbon dioxide to carbon monoxide ratio of less than 3 is associated with cellulose insulation due to electric faults [14,28]. The ratio was evaluated for each transformer for every service year (Table 5) and was found to be well below 3, hence, representing the degradation of cellulose insulation.

4.2.2. O2/N2 Ratio

The oxygen to nitrogen (O2/N2) ratio, which was close to 0.5, is used to represent air composition in the oil. With the oxidation of oil and/or degradation of cellulose insulation, the ratio may decrease in the case of an in-service transformer [42]. In the current study, it was observed that the ingression of these gases with air in the transformers was high. The oxygen to nitrogen ratio, which remained below 0.5 across all samples, showed an overall progressive decrease over the time (Table 5). As mentioned earlier, the observed declining trend in the ratio is attributed to the ongoing consumption of oxygen and correlates with the aging of cellulose insulation, a critical factor in transformer longevity.
The DDF, breakdown voltage, and DGA results indicated that no significant degradation of the insulating oil occurred during the service years; however, the moisture content and DGA analysis revealed the deterioration of the cellulose insulation with each service year.

5. Conclusions

Insulating oil samples from three in-service power transformers were collected annually for 4 years, and the impact of different variables on the degradation of the oil were studied. The electrical and chemical characteristics of the oil were analyzed and, based on the results, the characteristics that indicated deterioration tendencies with each service year were explained, and characteristics that can be used as indicators of insulating oil degradation were found. A summary of the study’s findings is provided as follows:
  • All three transformer oil samples showed good electrical characteristics after each service year. However, the DDF and breakdown voltage showed variation with service age for all three transformers.
  • Moisture content showed an increasing trend with each service year for all transformers. The DGA results revealed that the concentrations of carbon monoxide, oxygen, and nitrogen increased after each service year.
  • The LV side load variation in the transformer connected to the distribution side of the network decreased the breakdown voltage of the insulation oil, whereas the oil and winding temperatures increased. However, for the two power transformers connected to the transmission network, the breakdown voltage of the insulating oil increased with the increase in oil and winding temperatures.
  • The degradation of cellulose insulation in the transformers was revealed by the concentrations of carbon monoxide, carbon dioxide, methane, oxygen, and moisture content. The carbon dioxide to carbon monoxide and oxygen to nitrogen ratios identified the presence of electrical faults in the transformers, leading to cellulose insulation degradation.
For the current study, all of the samples had characteristic values that met the acceptance values on the whole, and none of them were significantly degraded with increasing age. Owing to the fact that the in-service transformers considered in the current study were in the early years of commissioning, the findings of this study have significant implications for the operational plans, condition-based monitoring, predictive maintenance, and lifecycle management of transformers. As transformers age, the degradation rate of their insulation tends to increase, particularly in the later stages of their service life. Henceforth, the key indicators of degradation identified in this study, such as dissolved gas analysis (DGA), breakdown voltage, moisture content, specific dissolved gases, and gas ratios, can help mitigate operational risks and provide a foundation for early fault detection.
Furthermore, the differences observed between the power and distribution transformers underscore the impact of load and thermal conditions on the health of oil and insulation. This understanding allows for the development of tailored operational guidelines that can enhance the performance and reliability of the transformers. In the future, more controlled experimental studies will be conducted by accelerating the aging of oil samples and studying the impact of single variables on the characteristics of the oil.

Author Contributions

Conceptualization, E.M. and B.A.; methodology, E.M., B.A. and M.I.A.; validation, E.M., R.S.A.A. and R.U.; formal analysis, E.M., B.A. and M.I.A.; investigation, E.M.; resources, B.A. and M.I.A.; writing—original draft preparation, E.M., B.A. and M.I.A.; writing—review and editing, E.M., R.S.A.A. and R.U.; visualization, E.M. and R.U.; supervision, E.M. All authors have read and agreed to the published version of the manuscript.

Funding

This research received no external funding.

Institutional Review Board Statement

Not applicable.

Informed Consent Statement

Not applicable.

Data Availability Statement

The data supporting the outcomes of this study are available on request from the corresponding author.

Conflicts of Interest

The authors declare no conflicts of interest.

References

  1. Muangpratoom, P.; Suriyasakulpong, C.; Maneerot, S.; Vittayakorn, W.; Pattanadech, N. Experimental Study of the Electrical and Physiochemical Properties of Different Types of Crude Palm Oils as Dielectric Insulating Fluids in Transformers. Sustainability 2023, 15, 14269. [Google Scholar] [CrossRef]
  2. Rao, U.M.; Pulluri, H.; Kumar, N.G. Performance Analysis of Transformer Oil/Paper Insulation with Ester and Mixed Dielectric Fluids. IEEE Trans. Dielectr. Electr. Insul. 2018, 25, 1853–1862. [Google Scholar] [CrossRef]
  3. Abdi, S.; Haddad, A.M.; Harid, N.; Boubakeur, A. Modelling the Effect of Thermal Aging on Transformer Oil Electrical Characteristics Using a Regression Approach. Energies 2022, 16, 381. [Google Scholar] [CrossRef]
  4. Guerbas, F.; Adjaout, L.; Abada, A.; Rahal, D. Thermal Aging Effect on the Properties of New and Reclaimed Transformer Oil. In Proceedings of the 2016 IEEE International Conference on High Voltage Engineering and Application (ICHVE), Chengdu, China, 19–22 September 2016; IEEE: Chengdu, China, 2016; pp. 1–4. [Google Scholar]
  5. Kaur, N.; Chudasama, B. Effect of Thermal Aging on Stability of Transformer Oil Based Temperature Sensitive Magnetic Fluids. J. Magn. Magn. Mater. 2018, 451, 647–653. [Google Scholar] [CrossRef]
  6. Wajid, A.; Rehman, A.U.; Iqbal, S.; Pushkarna, M.; Hussain, S.M.; Kotb, H.; Alharbi, M.; Zaitsev, I. Comparative Performance Study of Dissolved Gas Analysis (DGA) Methods for Identification of Faults in Power Transformer. Int. J. Energy Res. 2023, 2023, 9960743. [Google Scholar] [CrossRef]
  7. Baruah, N.; Dey, S.S.; Nayak, S.K. Evaluation of Dissolved Gas Analysis and Long-Term Performance of Non-Edible Natural Ester. IEEE Trans. Dielectr. Electr. Insul. 2020, 27, 1561–1569. [Google Scholar] [CrossRef]
  8. Siva Sai, R.; Rafi, J.; Farook, S.; Kumar, N.; Parthasarathy, M.; Ashok Bakkiyaraj, R. Degradation Studies of Electrical, Physical and Chemical Properties of Aged Transformer Oil. J. Phys. Conf. Ser. 2020, 1706, 012056. [Google Scholar] [CrossRef]
  9. Ojha, S.K.; Purkait, P.; Chakravorti, S. Evaluating the Effects of Lower Molecular Weight Acids in Oil-Paper Insulated Transformer. In Proceedings of the 2017 3rd International Conference on Condition Assessment Techniques in Electrical Systems (CATCON), Rupnagar, India, 16–18 November 2017; IEEE: Rupnagar, India, 2017; pp. 138–143. [Google Scholar]
  10. Guo, C.; Zhang, Q.; Zhang, R.; He, X.; Wu, Z.; Wen, T. Investigation on Gas Generation Characteristics in Transformer Oil under Vibration. IET Gener. Transm. Distrib. 2022, 16, 5026–5040. [Google Scholar] [CrossRef]
  11. Golarz, J. Understanding Dissolved Gas Analysis (DGA) Techniques and Interpretations. In Proceedings of the 2016 IEEE/PES Transmission and Distribution Conference and Exposition (T&D), Dallas, TX, USA, 3–5 May 2016; IEEE: Dallas, TX, USA, 2016; pp. 1–5. [Google Scholar]
  12. Sun, H.-C.; Huang, Y.-C.; Huang, C.-M. A Review of Dissolved Gas Analysis in Power Transformers. Energy Procedia 2012, 14, 1220–1225. [Google Scholar] [CrossRef]
  13. Kachler, A.J.; Hohlein, I. Aging of Cellulose at Transformer Service Temperatures. Part 1: Influence of Type of Oil and Air on the Degree of Polymerization of Pressboard, Dissolved Gases, and Furanic Compounds in Oil. IEEE Electr. Insul. Mag. 2005, 21, 15–21. [Google Scholar] [CrossRef]
  14. Hohlein-Atanasova, I.; Frotscher, R. Carbon Oxides in the Interpretation of Dissolved Gas Analysis in Transformers and Tap Changers. IEEE Electr. Insul. Mag. 2010, 26, 22–26. [Google Scholar] [CrossRef]
  15. Mihajlovic, D.; Ivancevic, V.; Vasovic, V.; Lukic, J. Cellulose Degradation and Transformer Fault Detection by the Application of Integrated Analyses of Gases and Low Molecular Weight Alcohols Dissolved in Mineral Oil. Energies 2022, 15, 5669. [Google Scholar] [CrossRef]
  16. Li, Y.; Wu, G.; Li, W.; Cui, Y.; Gao, B. Influence of Moisture and Oxygen on Aging of Oil-Paper Insulation. In Proceedings of the 2013 Annual Report Conference on Electrical Insulation and Dielectric Phenomena, Chenzhen, China, 20–23 October 2013; IEEE: Chenzhen, China, 2013; pp. 120–123. [Google Scholar]
  17. Liang, Z.; Fang, Y.; Cheng, H.; Sun, Y.; Li, B.; Li, K.; Zhao, W.; Sun, Z.; Zhang, Y. Innovative Transformer Life Assessment Considering Moisture and Oil Circulation. Energies 2024, 17, 429. [Google Scholar] [CrossRef]
  18. Abdi, S.; Safiddine, L.; Boubakeur, A.; Haddad, A. The Effect of Water Content on the Electrical Properties of Transformer Oil. In Proceedings of the 21st International Symposium on High Voltage Engineering, Budapest, Hungary, 26–30 August 2019; Springer: Cham, Switzerland, 2020; pp. 518–527. [Google Scholar]
  19. Garcia, B.; Garcia, T.; Primo, V.; Burgos, J.C.; Urquiza, D. Studying the Loss of Life of Natural-Ester-Filled Transformer Insulation: Impact of Moisture on the Aging Rate of Paper. IEEE Electr. Insul. Mag. 2017, 33, 15–23. [Google Scholar] [CrossRef]
  20. Lundgaard, L.E.; Hansen, W.; Linhjell, D.; Painter, T.J. Aging of Oil-Impregnated Paper in Power Transformers. IEEE Trans. Power Deliv. 2004, 19, 230–239. [Google Scholar] [CrossRef]
  21. Villarroel, R.; García de Burgos, B.; García, D.F. Moisture Dynamics in Natural-Ester Filled Transformers. Int. J. Electr. Power Energy Syst. 2021, 124, 106172. [Google Scholar] [CrossRef]
  22. Melka, B.; Stebel, M.; Bodys, J.; Kubiczek, K.; Lasek, P.; Rodriguez, G.R.; Garelli, L.; Haida, M.; Palacz, M.; Nowak, A.J.; et al. Effective Cooling of a Distribution Transformer Using Biodegradable Oils at Different Climate Conditions. IEEE Trans. Dielectr. Electr. Insul. 2023, 30, 1557–1565. [Google Scholar] [CrossRef]
  23. Ye, W.; Hao, J.; Gao, C.; Zhang, J.; Yang, L.; Liao, R. Natural Ester Replacement Effect on Thermal Degradation of Cellulose Insulation From Macroscopic Behavior to Atomic-Scale Mechanism. IEEE Trans. Dielectr. Electr. Insul. 2023, 30, 1582–1589. [Google Scholar] [CrossRef]
  24. Jacob, J.; Preetha, P.; Thiruthi Krishnan, S. Review on Natural Ester and Nanofluids as an Environmental Friendly Alternative to Transformer Mineral Oil. IET Nanodielectr. 2020, 3, 33–43. [Google Scholar] [CrossRef]
  25. Meira, M.; Ruschetti, C.; Álvarez, R.; Catalano, L.; Verucchi, C. Dissolved Gas Analysis Differences between Natural Esters and Mineral Oils Used in Power Transformers: A Review. IET Gener. Transm. Distrib. 2019, 13, 5441–5448. [Google Scholar] [CrossRef]
  26. Maharana, M.; Baruah, N.; Nayak, S.K.; Wu, K. Insulation Monitoring of Oxidative Aged Nonedible Ester Based Dielectric Fluid by Suitable Dissolved Gas Analysis. In Proceedings of the 2019 IEEE Conference on Electrical Insulation and Dielectric Phenomena (CEIDP), Richland, WA, USA, 20–23 October 2019; IEEE: Richland, WA, USA, 2019; pp. 649–652. [Google Scholar]
  27. Lelekakis, N.; Martin, D.; Guo, W.; Wijaya, J. Comparison of Dissolved Gas-in-Oil Analysis Methods Using a Dissolved Gas-in-Oil Standard. IEEE Electr. Insul. Mag. 2011, 27, 29–35. [Google Scholar] [CrossRef]
  28. Syafruddin, H.; Nugroho, H.P. Dissolved Gas Analysis (DGA) for Diagnosis of Fault in Oil-Immersed Power Transformers : A Case Study. In Proceedings of the 2020 4rd International Conference on Electrical, Telecommunication and Computer Engineering (ELTICOM), Medan, Indonesia, 3–4 September 2020; IEEE: Medan, Indonesia, 2020; pp. 57–62. [Google Scholar]
  29. Godina, R.; Rodrigues, E.; Matias, J.; Catalão, J. Effect of Loads and Other Key Factors on Oil-Transformer Ageing: Sustainability Benefits and Challenges. Energies 2015, 8, 12147–12186. [Google Scholar] [CrossRef]
  30. Badawi, M.; Ibrahim, S.A.; Mansour, D.-E.A.; Ward, S.A.; El-Faraskoury, A.A.; Ghali, M.; Mahmoud, K.; Lehtonen, M.; Darwish, M.M.F. On Highlighting the Merits of Gas-to-Liquid Transformer Oil Under Accelerated Thermal Aging and Faults: Electrical and Physio- Chemical Properties. IEEE Access 2024, 12, 93372–93388. [Google Scholar] [CrossRef]
  31. Ashkezari, A.D.; Hui, M.; Ekanayake, C.; Saha, T.K. Multivariate Analysis for Correlations among Different Transformer Oil Parameters to Determine Transformer Health Index. In Proceedings of the 2012 IEEE Power and Energy Society General Meeting, San Diego, CA, USA, 22–26 July 2012; IEEE: San Diego, CA, USA, 2012; pp. 1–7. [Google Scholar]
  32. Shutenko, O.; Ponomarenko, S. Analysis of Ageing Characteristics of Transformer Oils under Long-Term Operation Conditions. Iran. J. Sci. Technol. Trans. Electr. Eng. 2022, 46, 481–501. [Google Scholar] [CrossRef]
  33. Wolmarans, C.; Cox, R. Online Transformer DGA Monitoring Case Studies in Condition Assessment. In Proceedings of the 2024 IEEE Electrical Insulation Conference (EIC), Minneapolis, MN, USA, 2–5 June 2024; IEEE: Minneapolis, MN, USA, 2024; pp. 351–355. [Google Scholar]
  34. Sarathkumar, D.; Raj, R.A.; Murugesan, S.; Baptist Andrews, L.J.; Alagappan, A.; Sivadasan, J. Unlocking Power Transformer Reliability: DGA in Mineral Oil and Natural Esters. In Proceedings of the 2024 IEEE International Students’ Conference on Electrical, Electronics and Computer Science (SCEECS), Bhopal, India, 24–25 February 2024; IEEE: Bhopal, India, 2024; pp. 1–5. [Google Scholar]
  35. Patil, A.J.; Naresh, R.; Jarial, R.K.; Malik, H. Novel Four-Gas Fault Interpretation Graphical Technique for Mineral Oil Transformer. IEEE Trans. Dielectr. Electr. Insul. 2024, 31, 2721–2730. [Google Scholar] [CrossRef]
  36. Kohtoh, M.; Kaneko, S.; Okabe, S.; Amimoto, T. Aging Effect on Electrical Characteristics of Insulating Oil in Field Transformer. IEEE Trans. Dielectr. Electr. Insul. 2009, 16, 1698–1706. [Google Scholar] [CrossRef]
  37. Luo, Y.; Zhou, X.; Zhu, L.; Bai, J.; Tian, T.; Liu, B.; Zhang, H. Transformer Oil Electrical–Thermal Characteristics Analysis and Evaluation. AIP Adv. 2024, 14, 075103. [Google Scholar] [CrossRef]
  38. Abdi, S.; Harid, N.; Safiddine, L.; Boubakeur, A.; Haddad, A. The Correlation of Transformer Oil Electrical Properties with Water Content Using a Regression Approach. Energies 2021, 14, 2089. [Google Scholar] [CrossRef]
  39. Du, Y.; Zahn, M.; Lesieutre, B.C.; Mamishev, A.V.; Lindgren, S.R. Moisture Equilibrium in Transformer Paper-Oil Systems. IEEE Electr. Insul. Mag. 1999, 15, 11–20. [Google Scholar] [CrossRef]
  40. Buerschaper, B.; Kleboth-Lugova, O.; Leibfried, T. The Electrical Strength of Transformer Oil in a Transformerboard-Oil System during Moisture Non-Equilibrium. In Proceedings of the 2003 Annual Report Conference on Electrical Insulation and Dielectric Phenomena, Albuquerque, NM, USA, 19–22 October 2003; IEEE: Albuquerque, NM, USA, 2004; pp. 269–272. [Google Scholar]
  41. Gouda, O.E.; El-Hoshy, S.H.; E.L.-Tamaly, H.H. Proposed Three Ratios Technique for the Interpretation of Mineral Oil Transformers Based Dissolved Gas Analysis. IET Gener. Transm. Distrib. 2018, 12, 2650–2661. [Google Scholar] [CrossRef]
  42. Singh, R. Dissolved Gas Analysis Is an Art of Testing and Analysis Method for the Incipient Faults in Power Equipment—Like Transformers and OLTCs. Power Res.-J. CPRI 2023, 18, 113–120. [Google Scholar] [CrossRef]
Figure 1. Dielectric dissipation factor at 90 °C vs. service years for each transformer.
Applsci 14 11767 g001
Figure 2. Breakdown voltage vs. service years for each transformer.
Applsci 14 11767 g002
Figure 3. Moisture content vs. service years for each transformer.
Applsci 14 11767 g003
Figure 4. Concentration of nine gases measured after each service year plotted for transformers (a) T1, (b) T2, and (c) T3.
Applsci 14 11767 g004
Figure 5. The relationship between breakdown voltage and dielectric dissipation factor at 90 °C.
Applsci 14 11767 g005
Figure 6. Correlations between moisture content and dielectric dissipation factor at 90 °C for each transformer.
Applsci 14 11767 g006
Figure 7. Moisture content and breakdown voltage correlations for each transformer.
Applsci 14 11767 g007
Figure 8. Correlation matrix for transformers (a) T1, (b) T2, and (c) T3. The terms LV Side Load, Oil Temp, Winding Temp, DDF, BDV, and MC refer to the low-voltage side load (A), oil temperature (°C), winding Temperature (°C), dielectric dissipation factor at 90 °C, breakdown voltage, and moisture content, respectively.
Applsci 14 11767 g008
Table 1. Characteristics of the under-consideration transformers.
TransformerCharacteristics
Make Rated Power (MVA)Rated Primary Voltage (kV)Rated Secondary Voltage (kV)Taps
T1Shandong Dachi China25022013227
T2Shandong Dachi China25022013227
T3PEL13/1013211.523
Table 2. Test methods used in the current study according to defined standards with accepted values and test conditions.
Test MethodsTest StandardAcceptance ValuesTest Conditions
Electrical characteristicsDielectric dissipation factor at 90 °CIEC-60422:13<0.1025.0 ± 05 °C
&
50% ± 15%
Breakdown voltage (kV)IEC-60422:13>60
Chemical characteristicsMoisture Content (mg/kg)IEC-60422:13<15
DGAIEC-60599:15 and ASTM D-3612----
Table 3. Different recorded variables of in-service transformers for each service year and oil test result.
TransformersService YearsParameters
LV Side Load (A)Oil Temp. (°C)Winding Temp. (°C)DDF 1 at 90 °CBDV 2 (kV)MC 3 (mg/kg)DGA
C2H2C2H4C2H6CH4H2COCO2O2N2
T12020–21348.6535.7837.690.00365736.5000.0273.4521.65243.45290.546712.4432,153.66
2021–22245.0044.4346.010.0010680.36.5100.0070.0273.7629.94278.8372.389600.4153,852.77
2022–23185.6543.7645.280.0032681.79.220.020.01400.0530418.8870.0912,116.4365,917.27
2023–24112.8734.8736.310.0016368.413.410.390.3130.3170.3440317.48589.27119,609.12593,377.5
T22020–21348.6535.7837.690.0023567.79.850.010.02103.5621.34178.66156.4410,921.4454,321.89
2021–22245.0044.4346.010.0008274.16.860.0120.0370.0665.03230.16270390.2613,165.3573,891.7
2022–23202.9744.0144.860.0045481.78.010.0090.0140.01900356.5780.12311,561.1967,582.65
2023–24152.7036.6838.180.001886.711.240.1090.1260.3585.0090297.26554.49318,829.21593,958.1
T32020–2164.1436.1938.180.0026871.58.45000.0211.2320260.32330.7719,345.5554,321.44
2021–2287.6540.1342.520.0006268.77.08000.0391.3910270.6338.7120,754.6267,546.71
2022–2399.4439.9442.320.0012281.89.20.030.0110.0140.93057.6479.7422,751.9483,194.28
2023–2482.0029.0230.390.001578.310.860.0090.0680.2094.876067.69460.40824,559.19992,462.49
1 Dielectric dissipation factor, 2 breakdown voltage, 3 moisture content.
Table 4. Fault types associated with different gases [41].
Fault GasIndication
Cellulose AgingMineral Oil DecompositionLeaks in Oil Expansion SystemsThermal Fault—CelluloseThermal Fault—Oil (150–300 °C)Thermal Fault—Oil (300–700 °C)Thermal Fault—Oil > 700 °CPD 1Arcing
COY 2--------Y--------------------
CO2Y----YY--------------------
CH4----Y----YYYYYY
C2H2----Y------------T 3YTY
C2H4----Y--------TYY----Y
C2H6----Y--------YY------------
O2--------YY--------------------
H2YY----YYYYYY
H2O--------Y------------------------
1 Partial discharge, 2 yes, 3 traces.
Table 5. Gas ratios of in-service transformers for each service year.
Gas RatiosTransformer and Service Years
T1T2T3
2020–212021–222022–232023–242020–212021–222022–232023–242020–212021–222022–232023–24
CO2/CO1.1931.3360.1670.2810.8761.4450.2250.1831.2711.2521.3830.892
O2/N20.2090.1780.1840.2100.2010.1780.1710.2000.3560.3070.2730.266
Disclaimer/Publisher’s Note: The statements, opinions and data contained in all publications are solely those of the individual author(s) and contributor(s) and not of MDPI and/or the editor(s). MDPI and/or the editor(s) disclaim responsibility for any injury to people or property resulting from any ideas, methods, instructions or products referred to in the content.

