Article

Prediction of Lower Leg Swelling in Driving Posture

1
Graduate School of Science and Technology, Keio University, Yokohama 223-8522, Japan
2
Department of Mechanical Engineering, Keio University, Yokohama 223-8522, Japan
3
Department of Design Engineering, Shibaura Institute of Technology, Toyosu 135-8548, Japan
*
Author to whom correspondence should be addressed.
Appl. Sci. 2024, 14(24), 11788; https://doi.org/10.3390/app142411788
Submission received: 13 October 2024 / Revised: 6 December 2024 / Accepted: 15 December 2024 / Published: 17 December 2024
(This article belongs to the Special Issue Seating Comfort and Biomechanical Application)

Abstract

:
This study focused on lower leg swelling as a typical physical load in prolonged sitting postures such as driving. We obtained prediction equations for lower leg swelling (ratio of the inverse of the measured impedance to the initial impedance and lower leg swelling assessment value, BI [%]) from thigh pressure distribution, participants’ physical characteristics, and sitting time. A total of 22 participants (11 males and 11 females) were recruited. The impedance in the lower leg and thigh pressure distribution were measured over 90 min in a sitting posture at three tilt angles (8°, 0°, and −8° from the horizontal plane). Multiple regression analysis was performed to construct prediction equations for lower leg swelling in the males, the females, and all the participants. Bioelectrical impedance was selected as the dependent variable, with height, body fat percentage, thigh pressure distribution, and sitting time as the independent variables. The validity of all constructed prediction equations for the males, the females, and all the participants was confirmed by an adjusted R2. These findings can be used to develop a device to prevent lower leg swelling (the main problem resulting from a prolonged sitting posture) and can be applied to automobile seats, aircraft seats, and office chairs.

1. Introduction

1.1. Passenger Physical Fatigue

The development of automobile seats is important for a reduction in passengers’ physical fatigue [1]. In the previous studies, the effectiveness of physical fatigue reduction of car seats was evaluated by measuring the muscle electrical potentials and lower leg swelling of passengers seated for a short period of approximately 10 min [2,3,4]. The average operating time exceeds 1 h [5,6,7]; therefore, measurements over a longer period are necessary. However, fatigue evaluations for many design parameters in automobile seat development are difficult to conduct over a long period. Therefore, if a prediction equation for physical fatigue can be constructed from data such as height, weight, and body pressure distribution while seated, this could improve the development of automobile seats and enhance the fatigue reduction effect. The following is an overview of the physical fatigue of passengers.
Passenger physical fatigue can be categorized into the following two types: musculoskeletal load and contact load [8]. Musculoskeletal load refers to the physical strain on muscles and joints caused by driving posture. Prolonged exposure to such loads leads to muscle fatigue, which results in body pain and discomfort [9,10]. Muscle fatigue cannot be measured directly and is often estimated from the reduction in amplitude of the muscle electrical potential and the amount of muscle activity [11,12]. Contact load refers to the pressure exerted on soft tissues and blood vessels by the body surface in contact with the seat surface. This load mainly affects the thighs. Prolonged exposure to such pressure leads to lower leg swelling, which causes leg lethargy and discomfort [13,14]. Since lower leg swelling can be measured directly by the circumference, volume, or bioimpedance in the lower leg [15,16,17], this study focused on lower leg swelling as the passengers’ physical fatigue.
In recent years, the fatigue evaluation based on the musculoskeletal load has transitioned from the visual and palpatory assessments conducted by specialists such as ergonomists and physical therapists to the simulation using virtual musculoskeletal models (digital twins). These models utilize the participants’ geometric data (e.g., joint positions and angles) to calculate the musculoskeletal loads. Digital twin-based fatigue evaluation methods have been applied to assess the musculoskeletal loads during seated work [18,19], standing work [20,21], and athletic activities [22,23]. However, this approach has not yet been extended to the fatigue evaluation caused by contact loads during seated work, which is the focus of this study. Developing a predictive equation for lower leg swelling (one of the objectives of this research) would allow for the assessment of swelling based on contact loads, such as thigh and buttock pressures, calculated through a digital twin.

1.2. Lower Leg Swelling

Factors contributing to lower leg swelling include thigh pressure [24], time [15], height [25], and body fat percentage [26]. Thigh pressure, time, and body fat percentage show a positive correlation with the progression of lower leg swelling. In contrast, height shows a negative correlation with lower leg swelling. Methods for measuring lower leg swelling include the water displacement method [14], circumference measurement [27], near-infrared spectroscopy [28], and bioelectrical impedance [26] (hereafter referred to as BIA). Among these, BIA is widely used because of its high accuracy, low physical burden on the subject (non-invasive), and ability to measure without changing the subject’s posture. This study required high-accuracy continuous measurements of lower leg swelling without changing the sitting posture of subjects during prolonged sitting. Thus, in this study, BIA was used to measure lower leg swelling, and the progression of lower leg swelling was evaluated based on the decrease in impedance.

1.3. Purpose of the Study and Structure of This Paper

The purpose of this study was to construct a prediction equation for the lower leg swelling and typical physical fatigue of passengers, using time, thigh pressure, height, and body fat percentage as variables. First, lower leg swelling and thigh pressure distribution were measured for participants seated in an automotive seat. The seat allowed for adjustable thigh pressure distribution. Lower leg swelling was measured using BIA. Multiple regression analysis was conducted using the measured lower leg impedance and thigh pressure distribution. Participants’ physical characteristics, such as height and body fat percentage, were also included as variables. This analysis was used to derive a prediction equation for lower leg swelling.
The remainder of this paper is organized as follows. Section 2 describes the methods for measuring leg swelling and thigh pressure distribution. Section 3 discusses the experiments conducted to measure lower leg swelling and thigh pressure distribution. It also covers the construction of a prediction equation for lower leg swelling based on these measurements. Conclusions and future perspectives are presented in Section 4.

2. Methods

2.1. Automobile Seat

In this experiment, an automobile seat was used to adjust the pressure distribution on the thigh (Figure 1). This automobile seat is a custom-made product consisting of the cushion and back frames from the SUBARU Leborg and Impreza models, respectively. This seat can change the thigh pressure distribution using a tilt mechanism. The tilt mechanism adjusts the inclination angle of the seat tip (referred to as the tilt angle in this study). The tilt angle ranged from 2° to 18° [with no mid-folding angle as the tilt reference (0°)], and the following three levels were set in the experiment: lower (−8°), normal (0°), and upper (8°) tilt. During the experiment, the impedance in the lower leg and thigh pressure distributions were measured in participants following a prolonged sitting duration. The following sections describe the measurement methods in detail.

2.2. Measurement of Lower Leg Swelling

BIA was used to measure lower leg swelling in a simple and non-invasive manner. In this experiment, a multifrequency body composition analyzer (Toray Medical, Inc., Tokyo, Japan, MLT-550N, sampling frequency 1/60 Hz) and single-use cardiac electrodes (Toray Medical, Inc., ER-240P) were used. The electrodes were attached to the left lower leg (for details, refer to section, Measurement of Lower Leg Swelling and Thigh Pressure Distribution). BIA monitors impedance by applying a high-frequency current [29]. Swelling increases extracellular water content, which affects impedance. Since water conducts electric currents more easily than fat, a decline in impedance is interpreted as swelling. In this experiment,   R t represented the measured impedance, while R l   represented the initial impedance. To assess lower leg swelling, BI [%] (bioelectrical impedance index) was calculated based on the change in impedance as follows [30]:
B I   [ % ] = 1 / R t 1 / R l × 100 = R l R t × 100

2.3. Measurement of Thigh Pressure Distribution

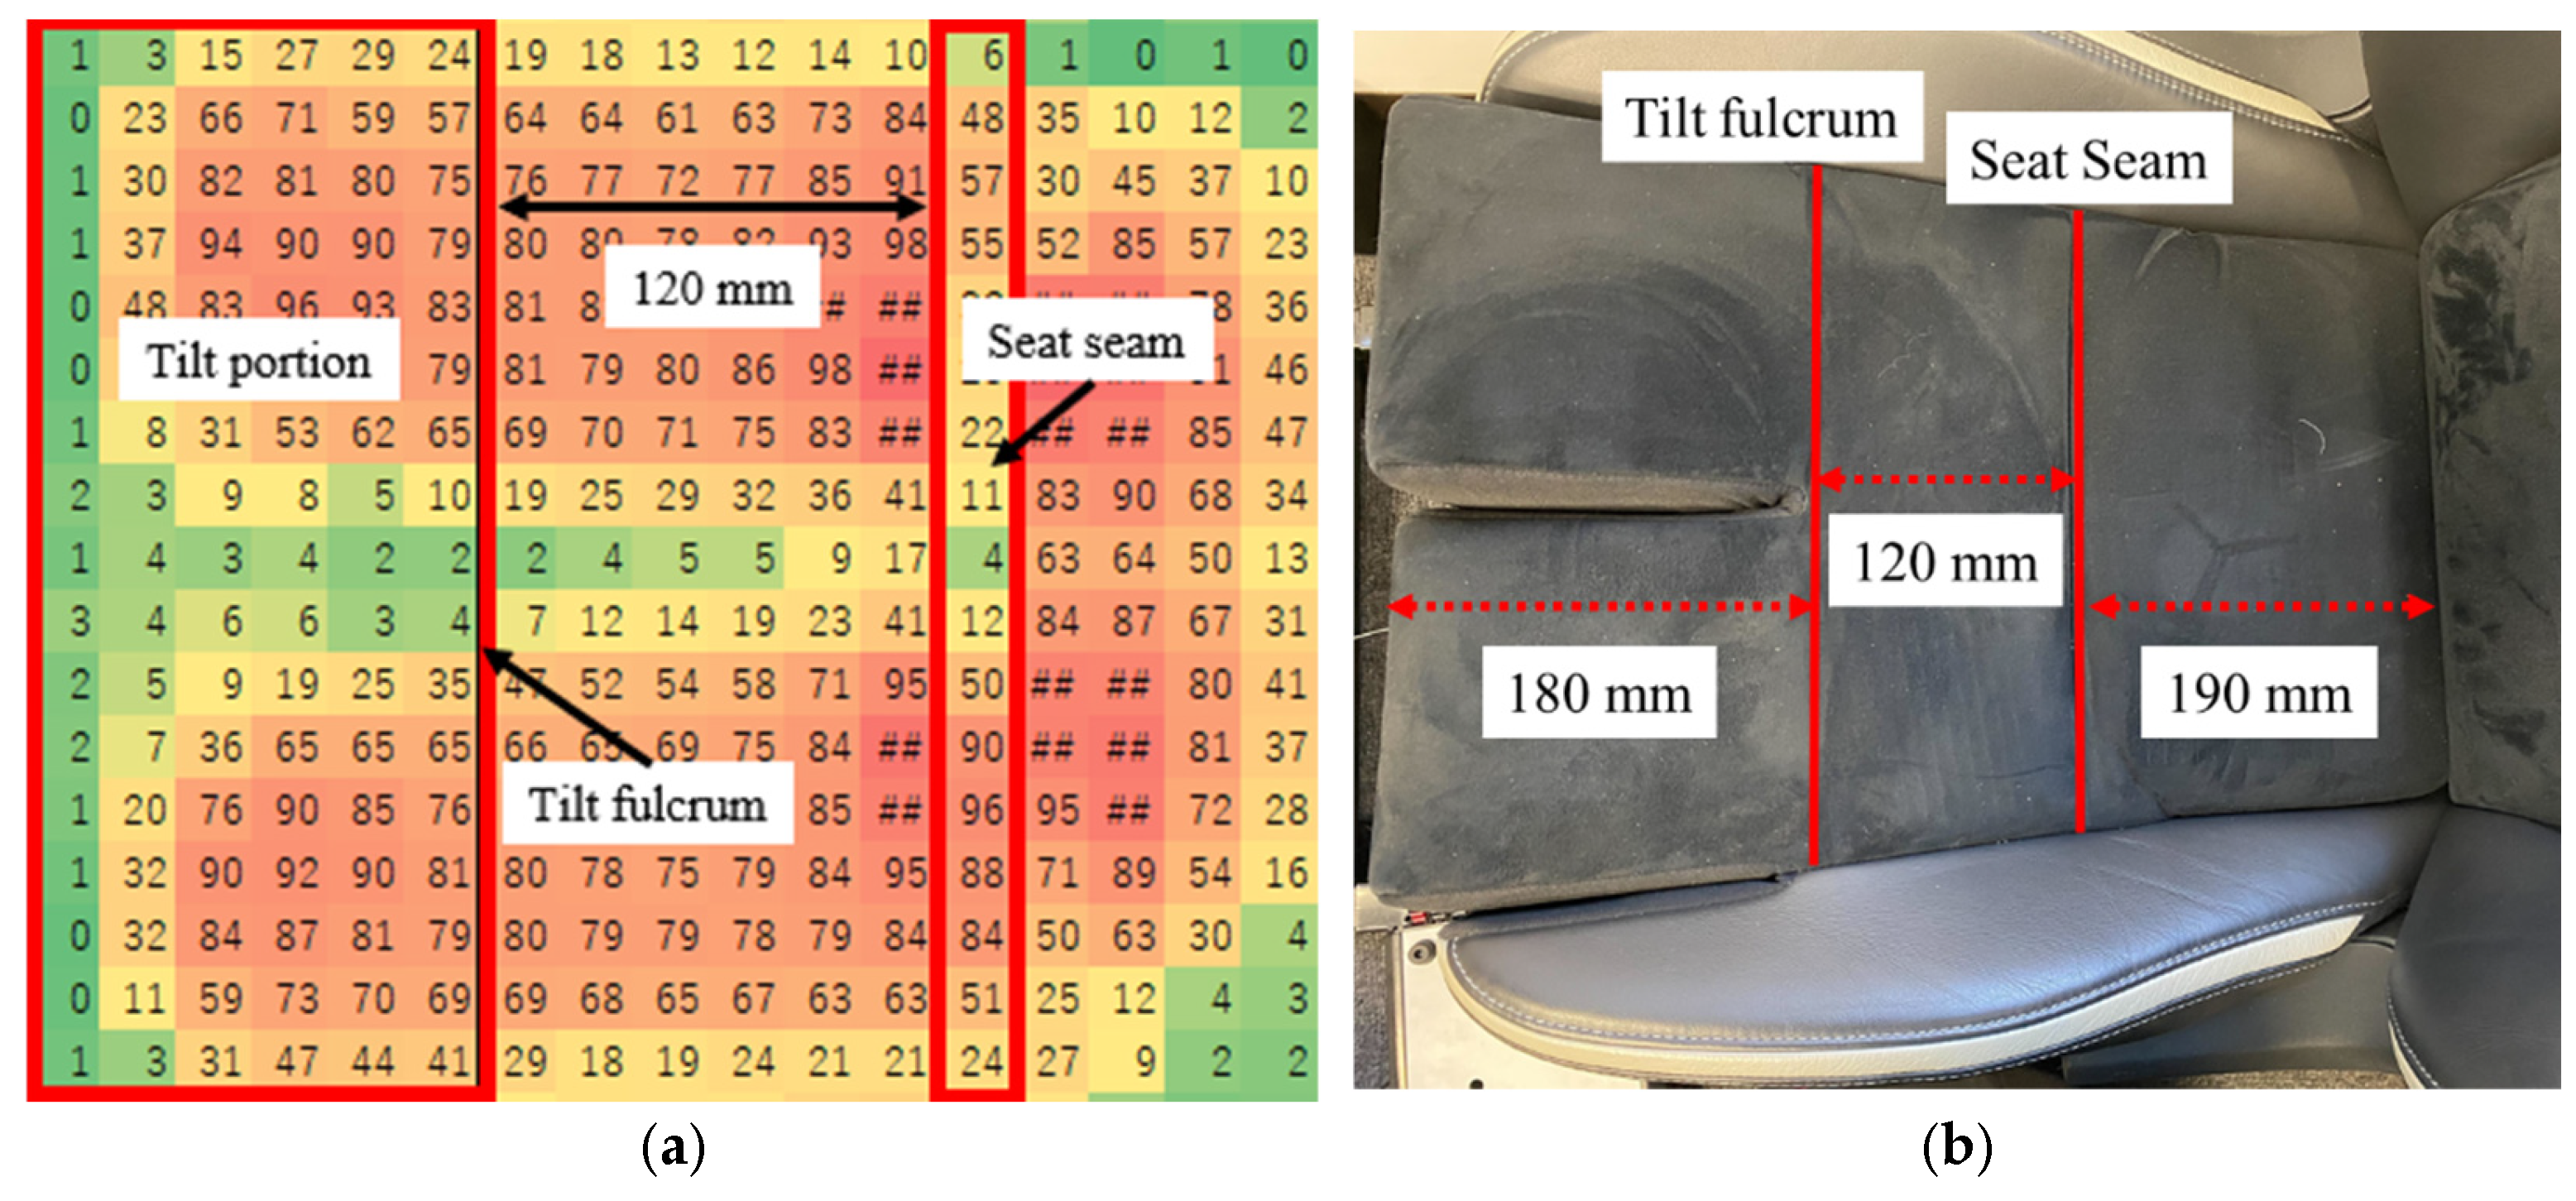
A pressure sensor sheet (SR Soft Vision, half-size version, Sumitomo Riko, Nagoya, Japan) was used to monitor the pressure distribution. The contact pressure and area information obtained from the pressure sensor sheet and the measured data were displayed in real time. The sheet had 800 measurement points within an area of 900 mm × 500 mm, and each sensor could detect pressures ranging from 0 to 110 mmHg at a sample frequency of 6 Hz. The sheet acquired the pressure data at each measurement point and was sectioned into 28 mm × 20 mm rectangles. The sheet was installed with its sensors covering the entire automobile seat surface. The installation position was corrected based on the groove position on the seat surface of the automobile seat, although there was some displacement due to the participant’s sitting posture. The seat was installed with its sensors covering the entire automobile seat surface. The installation position was corrected based on the groove position on the seat surface of the automobile seat, although there was some error due to the participant’s sitting posture. The pressure distribution is shown in Figure 2a. In this experiment, the tilt fulcrum was set at 120 mm from the seat seam. The forward pressure on the tilted fulcrum was defined as the tilt portion. The seat seams were estimated using a small area of the body pressure distribution. The tilt fulcrum position on the automobile seat is shown in Figure 2b. The seam positions are also illustrated in the same figure. The tilt area could differ among participants. This variation was caused by differences in sitting posture and the movement of the pressure distribution sheet. Therefore, the tilt angle was determined based on the participants with the smallest tilt angle in the experiment. The average pressure in the tilted portion was determined to be   P t .

2.4. Measurement of Lower Leg Swelling and Thigh Pressure Distribution

Three tilt angles (upper, normal, and lower) were used in the experiment. Measurements were conducted on different days for 90 min at each tilt angle. The experimental conditions and procedures were as follows.
Participants: A total of 22 healthy adults were included [11 males and 11 females aged 20–23 years; mean height 1655 (SD ± 10) mm; mean weight 54.1 (SD ± 8.6) kg]. The physical characteristics of the participants are listed in Table 1.
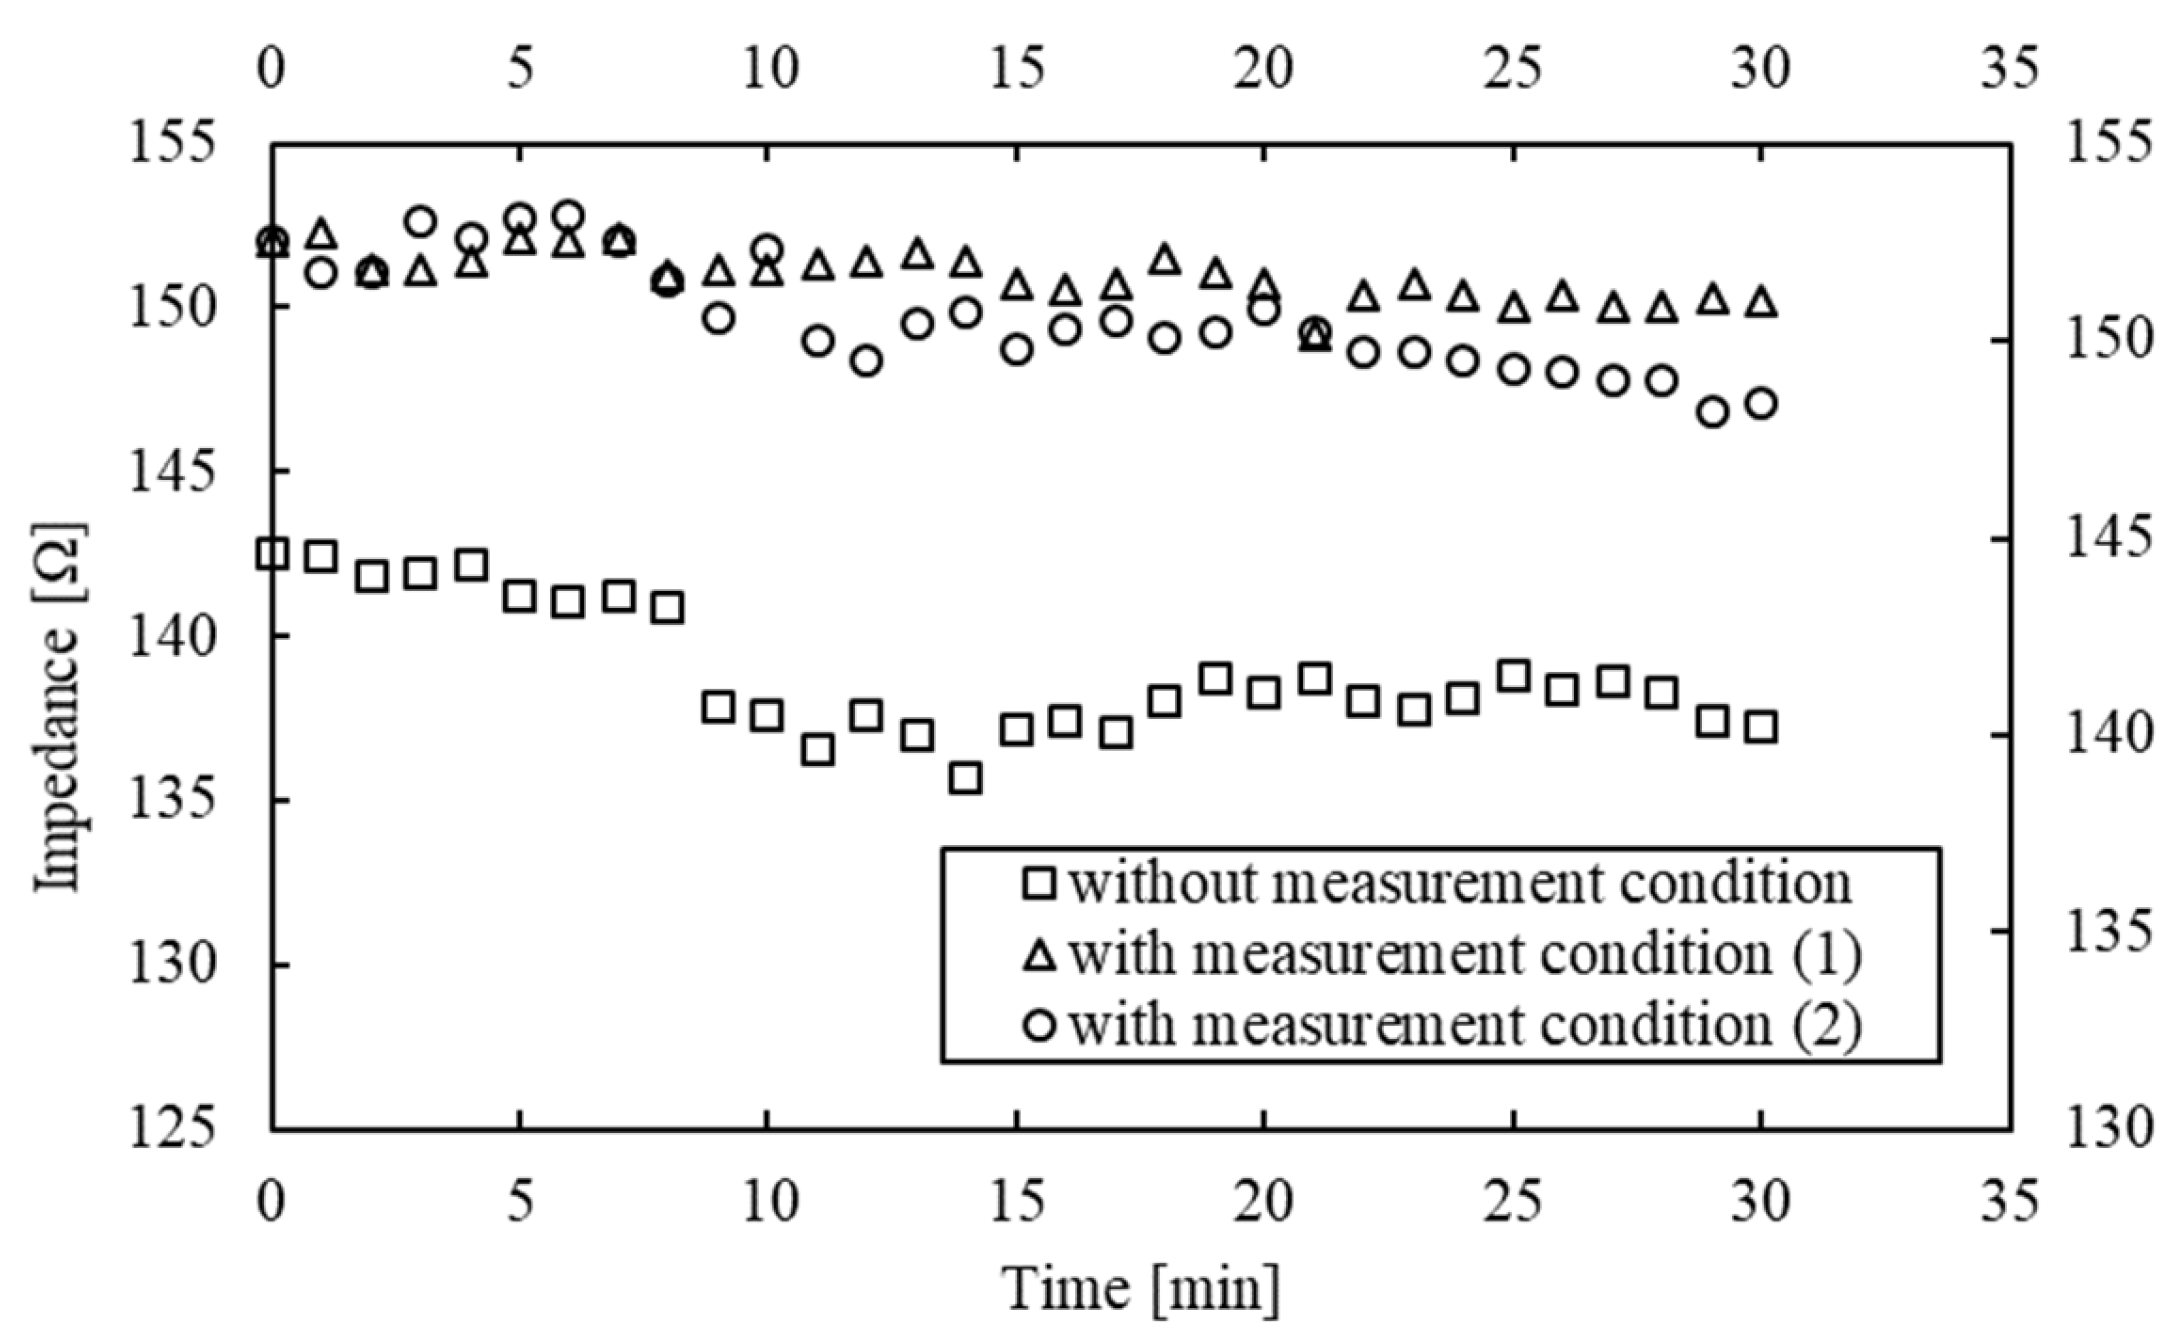
Measurement conditions: To minimize differences in physiological status across the three conditions, the participants were given specific instructions. They were asked to adhere to the following: (i) Sleep at least 6 h the night before the measurement; (ii) refrain from eating for at least 3 h prior to the measurement; and (iii) maintain consistent sleeping and eating times within 24 h before the measurement [31]. To confirm the validity of these conditions, the lower leg impedance was measured in one male participant (height, 1810 mm; weight, 63 kg) with and without measurement conditions (e.g., participant’s physical condition, fatigue state, meal, and measurement time). Under unified measurement conditions, the lower leg impedance remained consistent over 30 min, confirming the reproducibility of the results. In contrast, under non-unified conditions, both the initial impedance and the rate of change deviated significantly. These differences are illustrated in Figure 3.
Experimental environment: An automobile seat, steering wheel, and footrest were set up to reproduce an in-vehicle environment. Furthermore, to eliminate differences in tightness owing to the participants’ clothes, the participants wore base layers that were appropriate for their physique and were barefoot. All the participants completed the experiment in the same room. The temperature during the experiment ranged from 22 °C to 25 °C, and the humidity was controlled at 60% to 70%. An illustration of the experiment is shown in Figure 4.
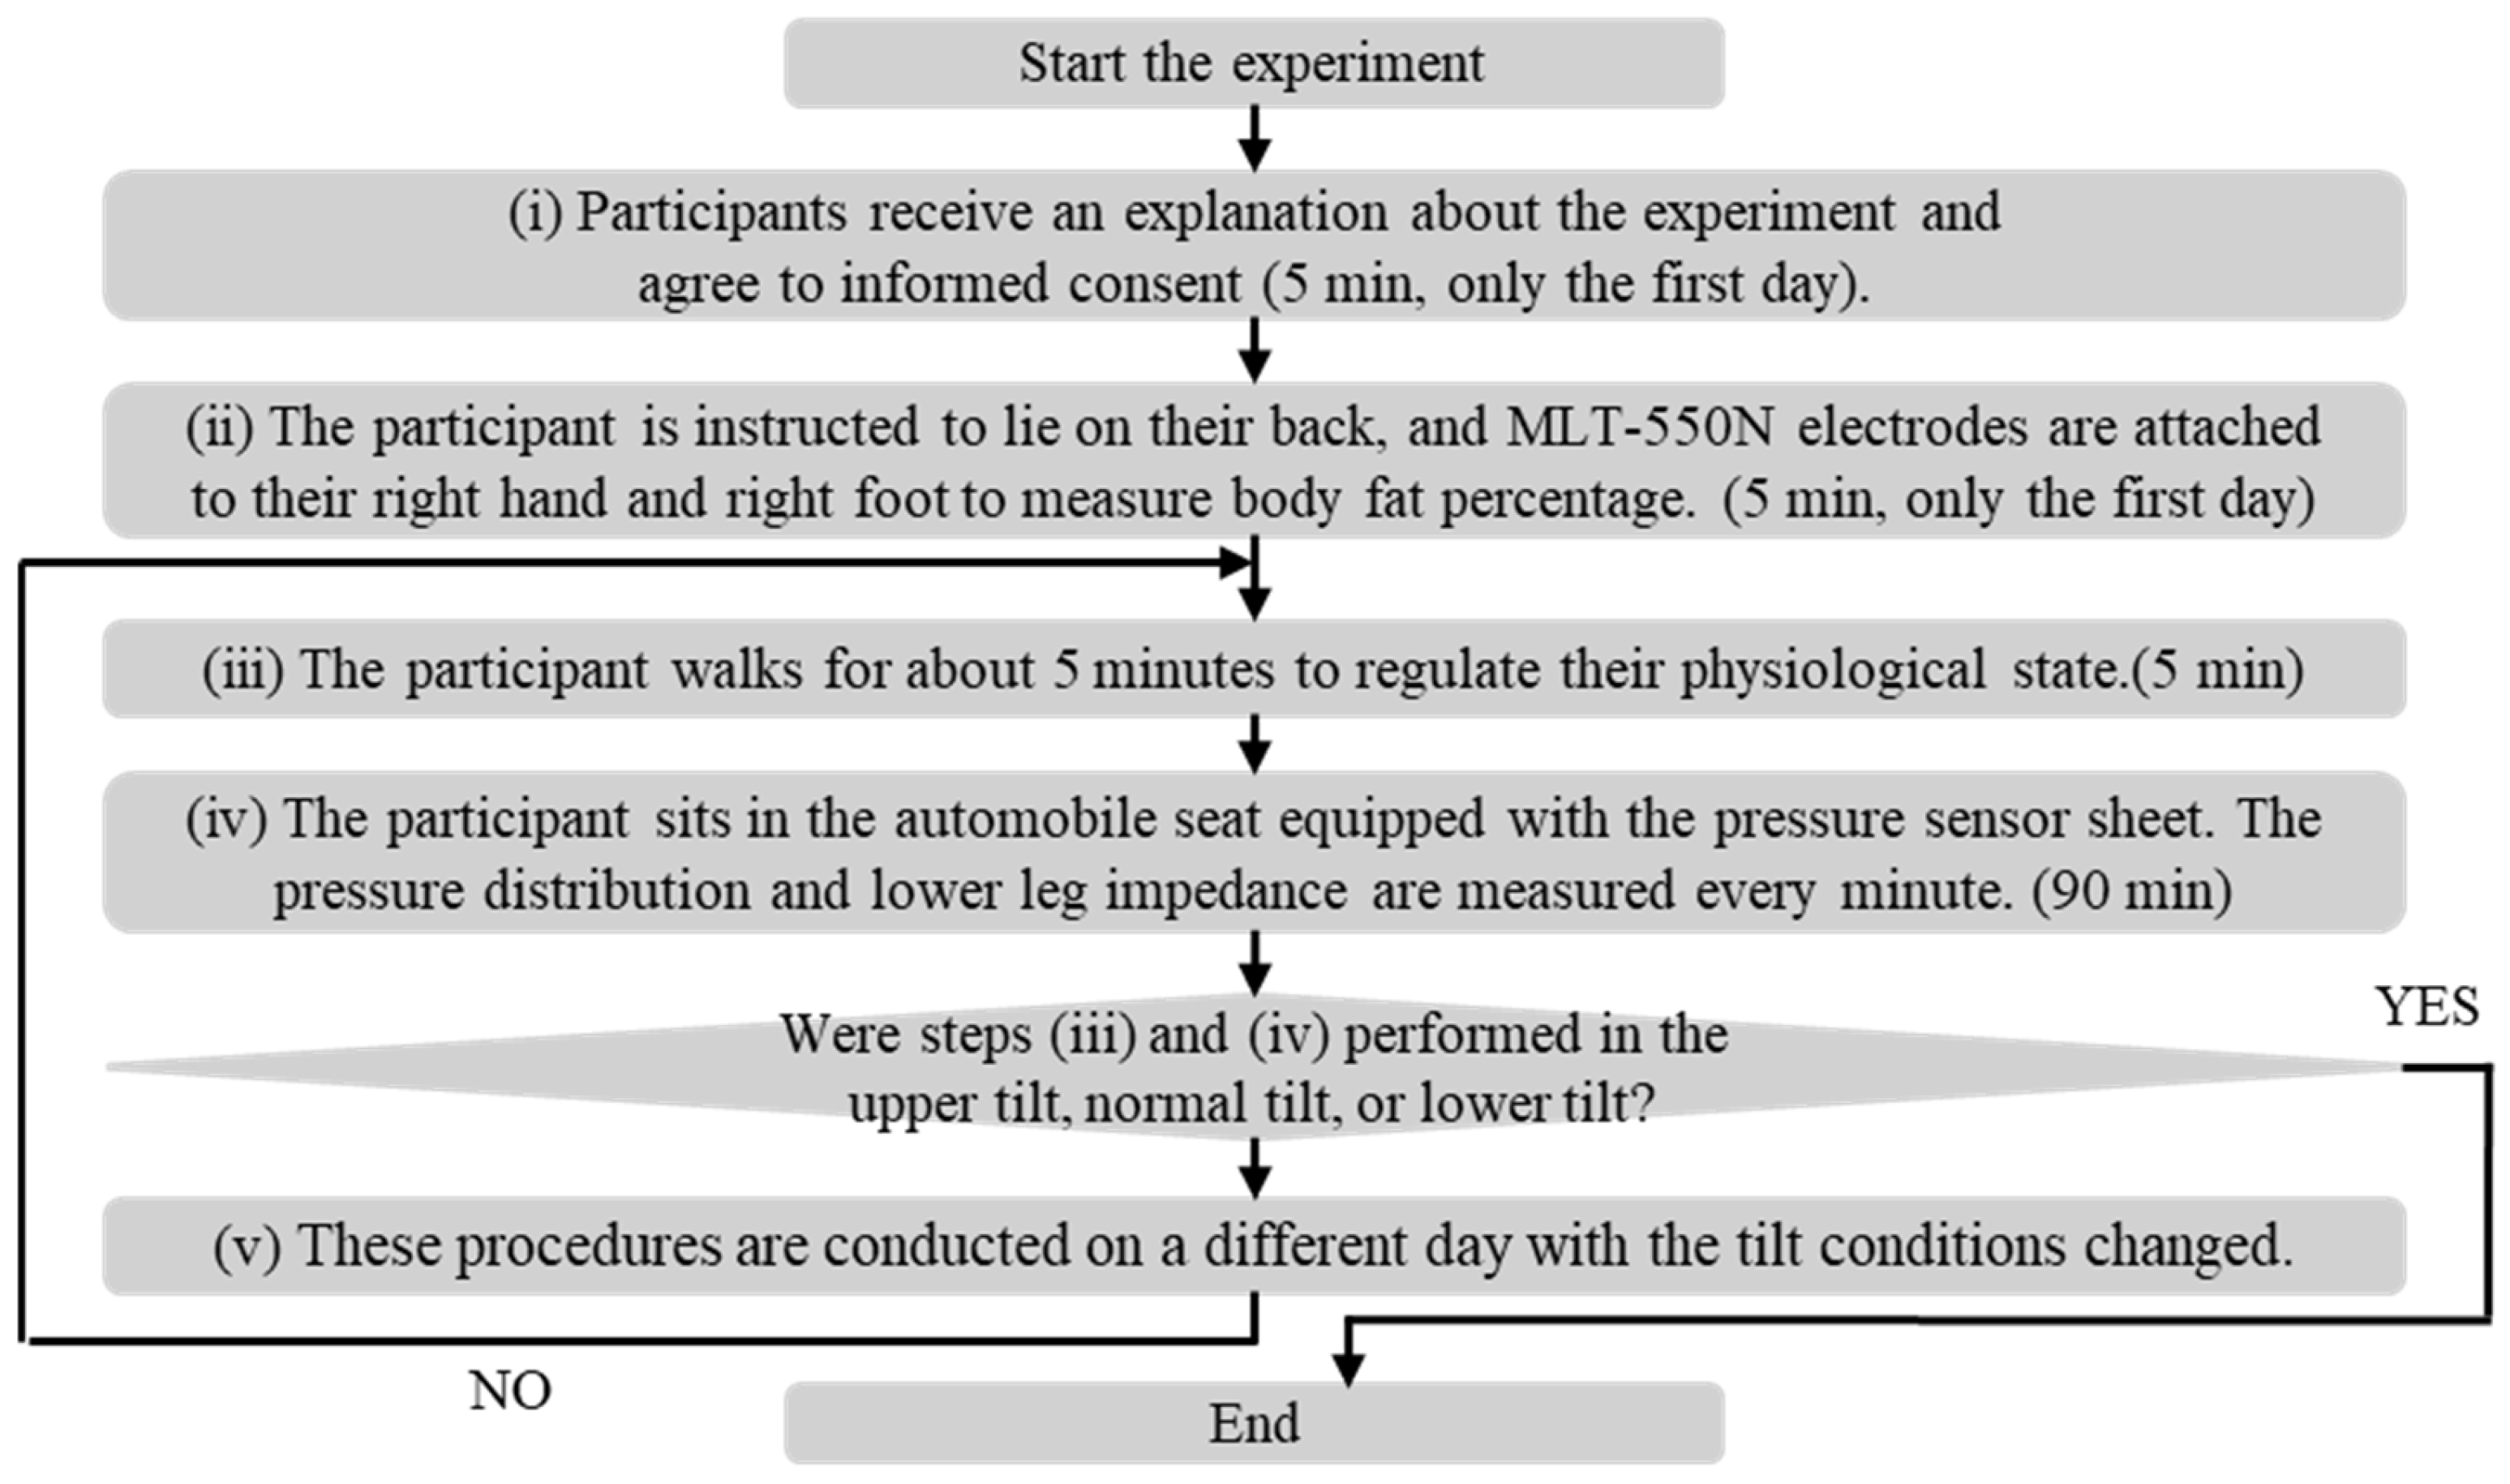
Procedure: To avoid the influence of the participant’s previous posture, each participant first walked for approximately 5 min as a pre-measurement exercise to maintain a constant physiological state. Electrodes from the MLT-550N were placed 150 mm above and below the largest circumference of the participant’s left lower leg, as shown in Figure 4 [32]. The participant then sat in the automobile seat equipped with a pressure distribution sensor sheet. Leg impedance was measured every minute, while thigh pressure distribution was recorded every 10 min. Figure 5 details the layout of the measurement equipment and actual experimental images, as well as the experimental protocol. To reduce noise in the impedance measurement, we prohibited postural changes such as sitting up and pedaling during the experiment and took measurements in a static sitting posture.

3. Result and Discussion

3.1. Relationship Between BI and Thigh Pressure Distribution

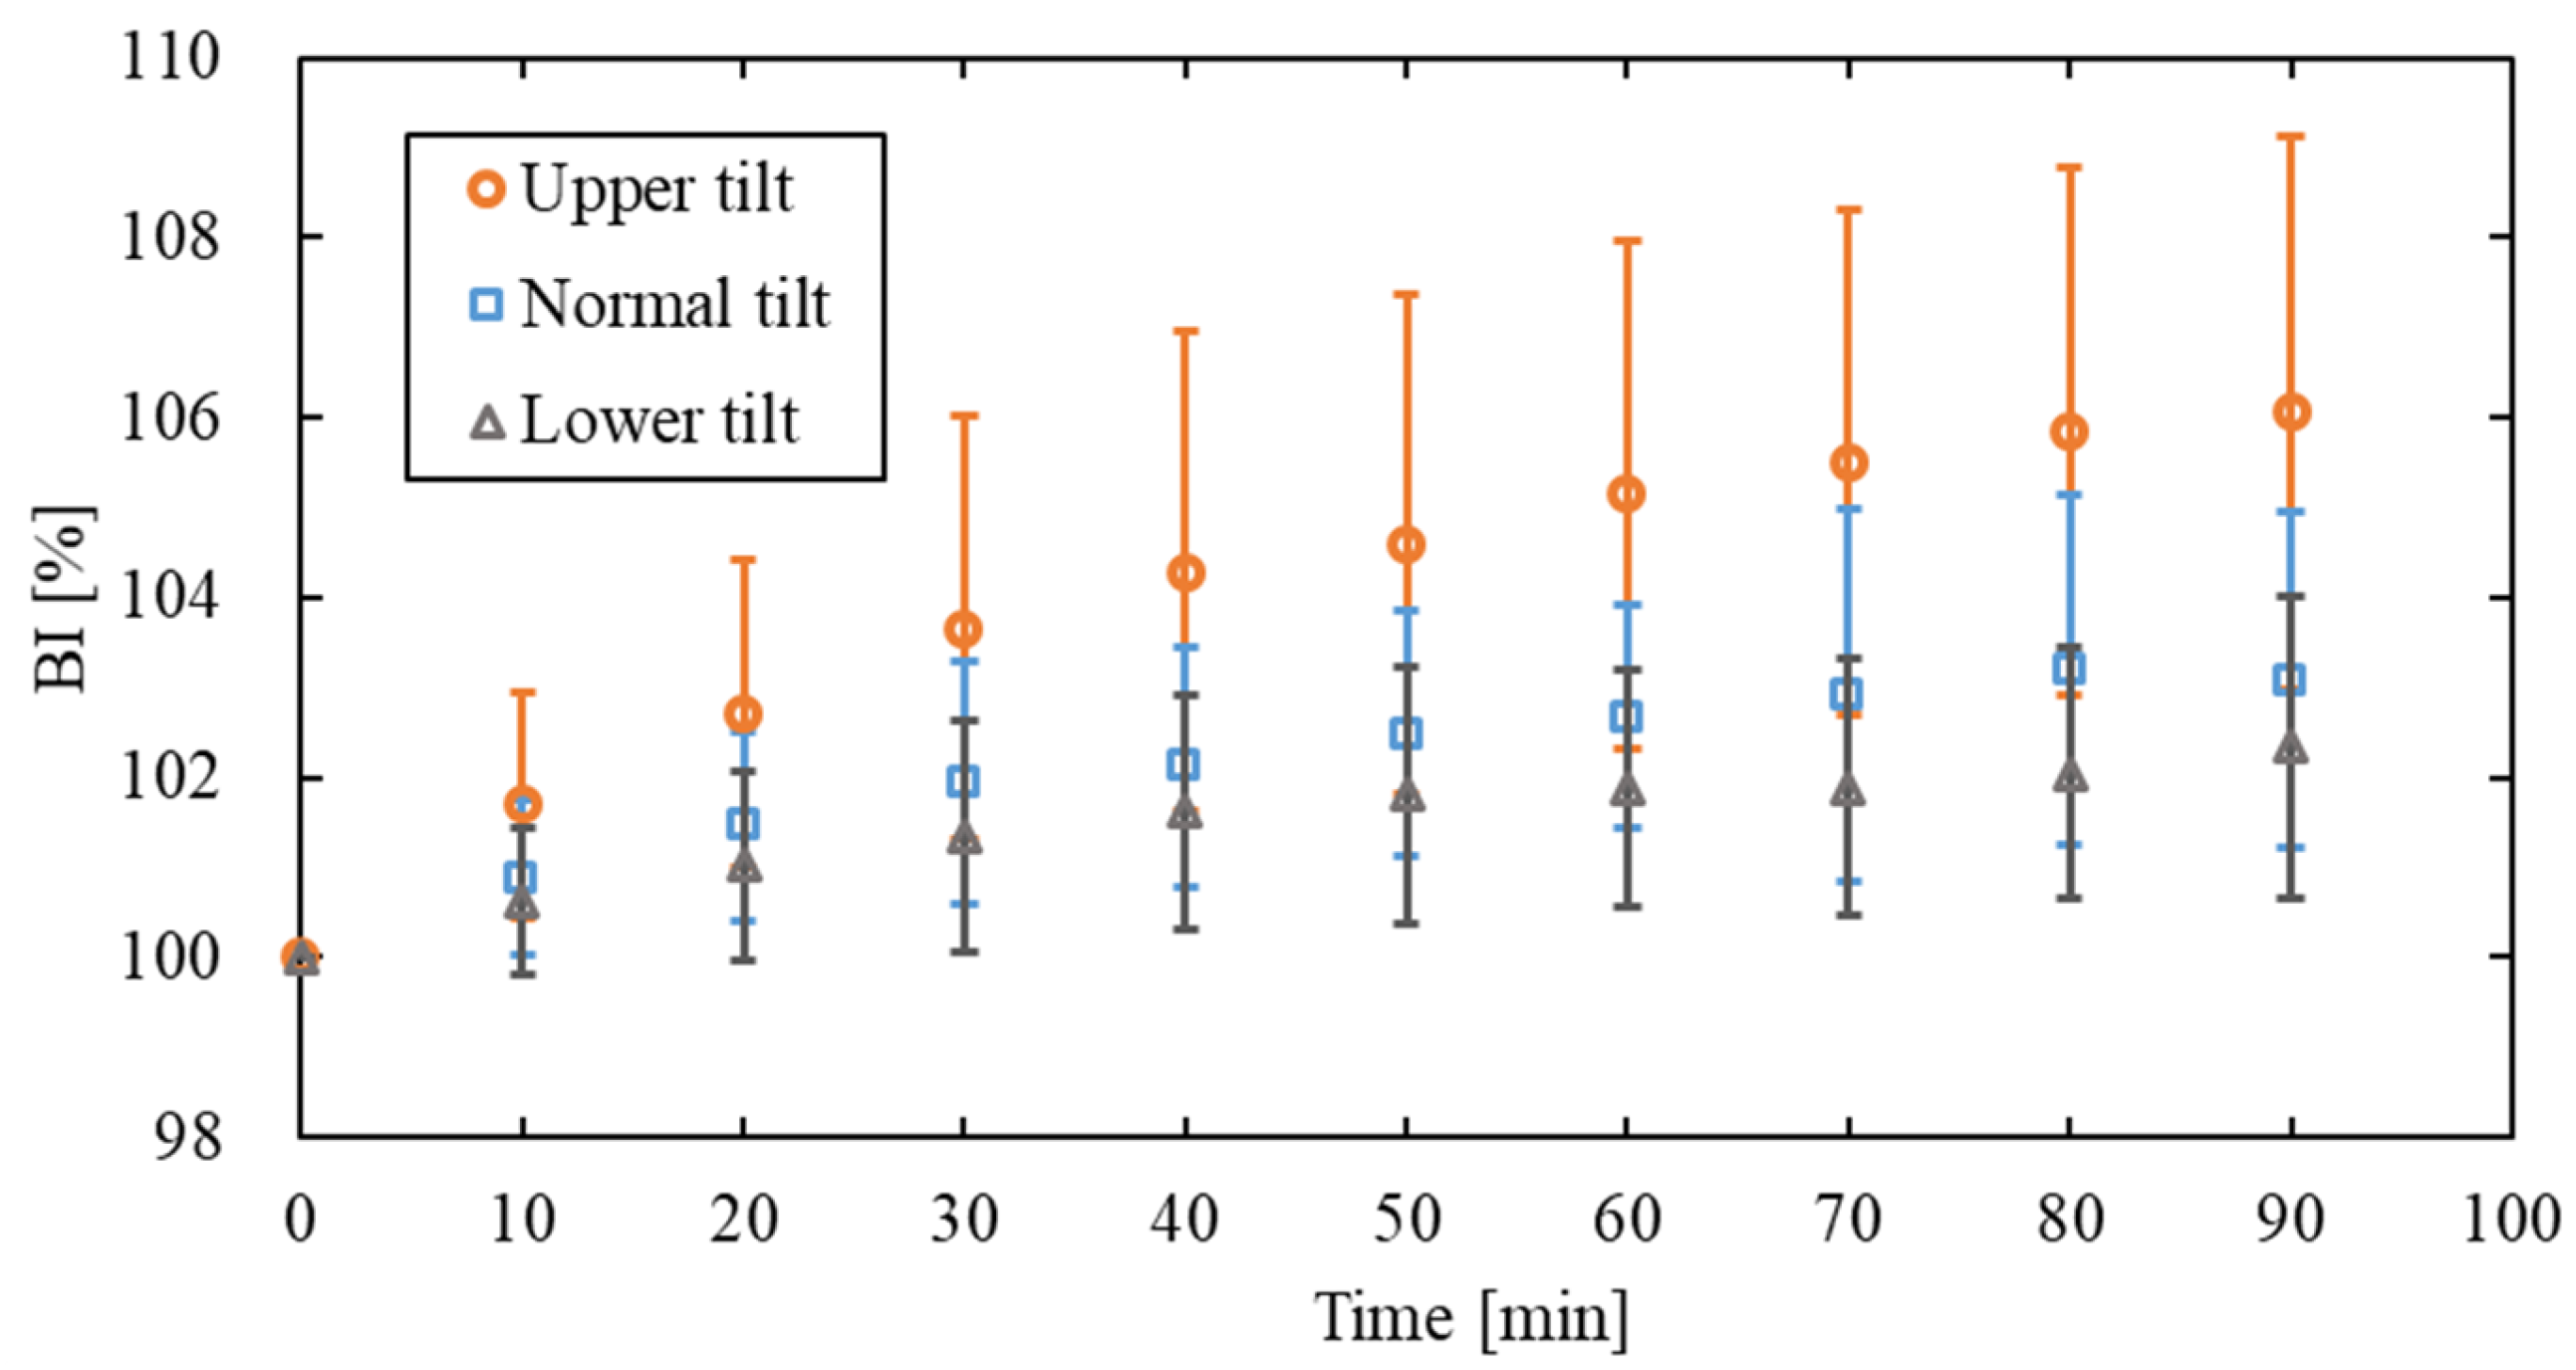
Figure 6 shows the changes in the average BI of all the participants at the three tilt angles (upper, normal, and lower); BI increases with time at all tilt angles and increases as the tilt angle is increased.
The participants with the smallest tilt portion had four sensor areas further from the tilt fulcrum. Therefore, in this experiment, four sensor areas were selected as the tilted portions, and the average pressure in these areas was P t . The relationship between P t and the tilt angle is shown in Figure 7. The correlation coefficient between P t and the tilt angle was 0.727, indicating a stronger correlation. Figure 8 shows a scatterplot of the relationship between P t and BI after 90 min for all the participants; a weak positive correlation ( r = 0.481 ) was noted between P t and BI after 90 min for all the participants.
Dots (i)–(iv) in Figure 8 likely resulted from differences in the physiological states among the three experiments. Body impedance is influenced by factors such as the participant’s physical condition, fatigue state, meals, measurement time, and posture immediately before measurement [33]. Dots (i)–(iv) were excluded because their initial impedance differed from the other two experiments, indicating insufficient control at the start of the experiment. Observation (iv) was measured during menstruation. Deurenberg et al. (1998) reported that impedance increased approximately 1 week before menstruation, peaked during menstruation, and decreased within a week [33]. Observations (v)–(vi) were derived from one participant (N13). Her data showed a higher BI at 90 min compared to other participants. Participant N13 regularly engaged in sports involving heavy loads on the lower leg. Such activity is known to increase the risk of developing medial tibial stress syndrome (MTSS). MTSS, in turn, is associated with the progression of lower leg swelling [34,35,36]. Therefore, it is likely that N13’s higher BI was influenced by her physical condition. Accordingly, in the following discussion, observations (i)–(vi) were excluded. The correlation coefficient between BI and P t at 90 min after eliminating observations (i)–(vi) was 0.525.

3.2. Construction of Prediction Equations for Lower Leg Swelling Relationship Between BI and Thigh Pressure Distribution

Previous studies have revealed the correlations of lower leg impedance with time, height, body fat percentage, and thigh pressure [15,24]. Therefore, the BI after t min was selected as the dependent variable, while sitting time ( t ), pressure in the tilt portion ( P t ) ,   participants’ height ( h ) , and body fat percentage ( f ) were used as the independent variables. The results of the multiple regression analysis (forward–backward stepwise selection method) for the males, the females, and all the participants are listed in Table 2. All variables were chosen as valid variables. The adjusted R 2   values for the prediction equations for the males, the females, and all the participants were 0.561, 0.512, and 0.551, respectively.
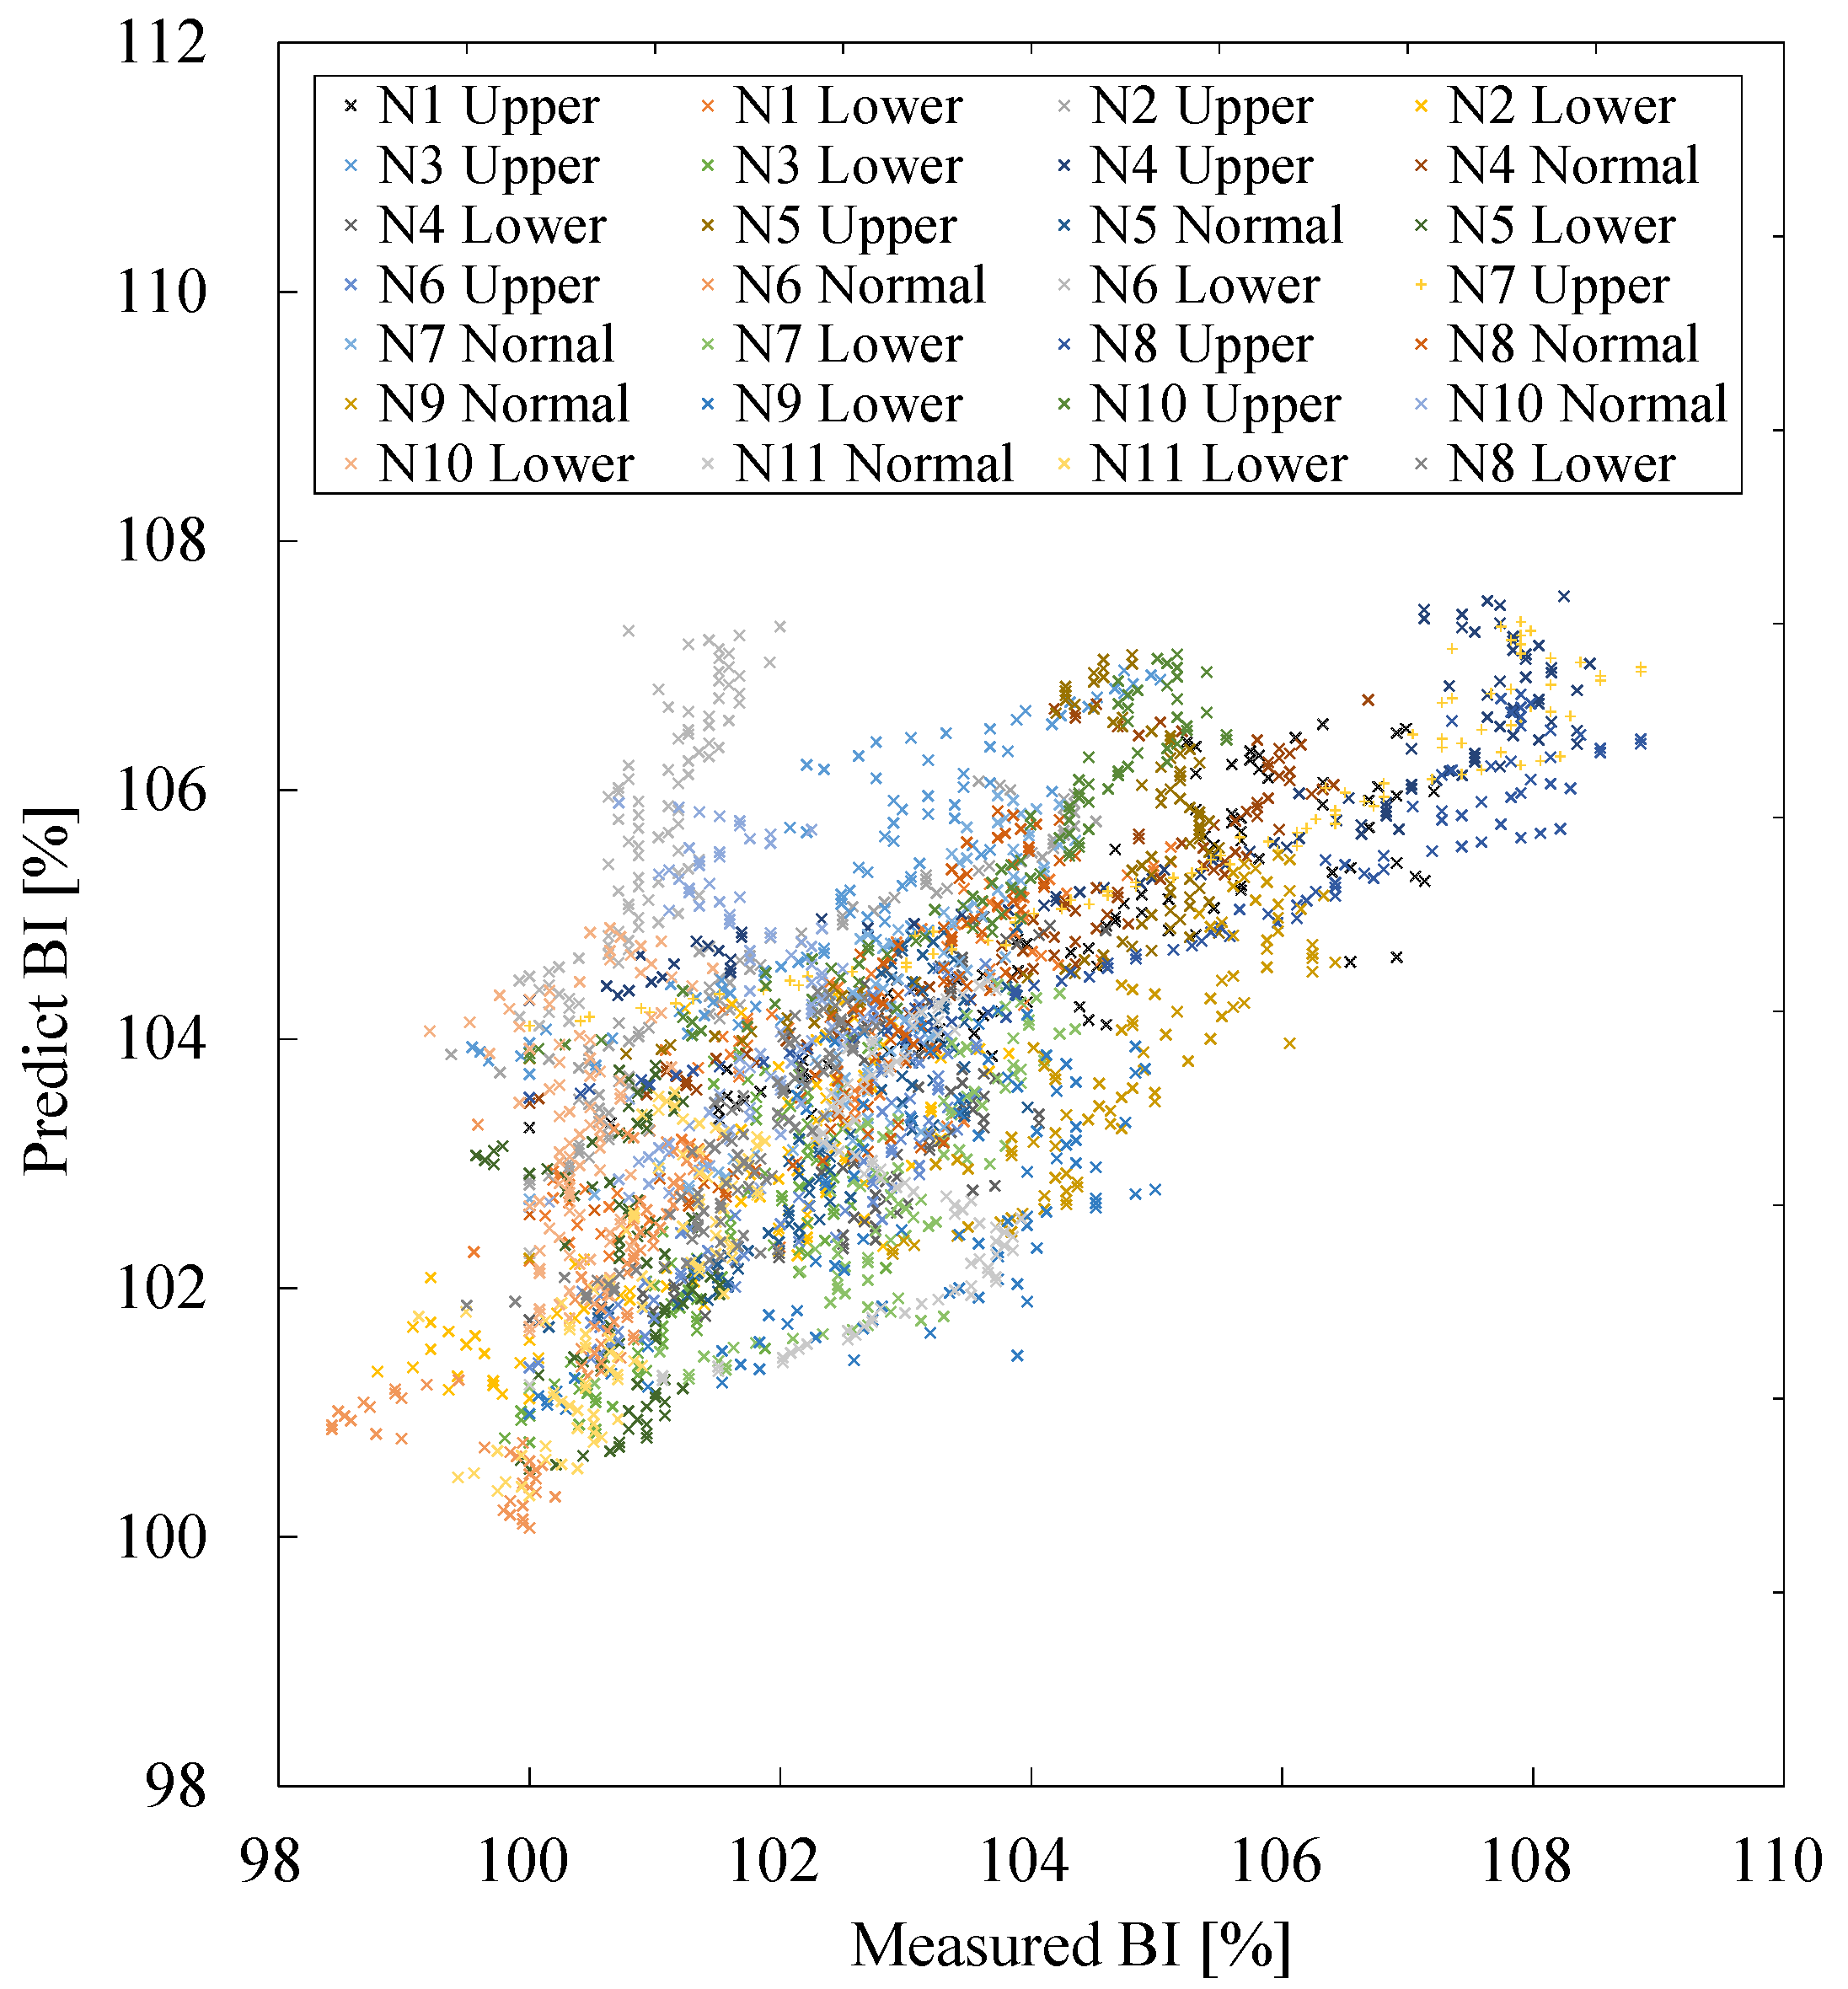
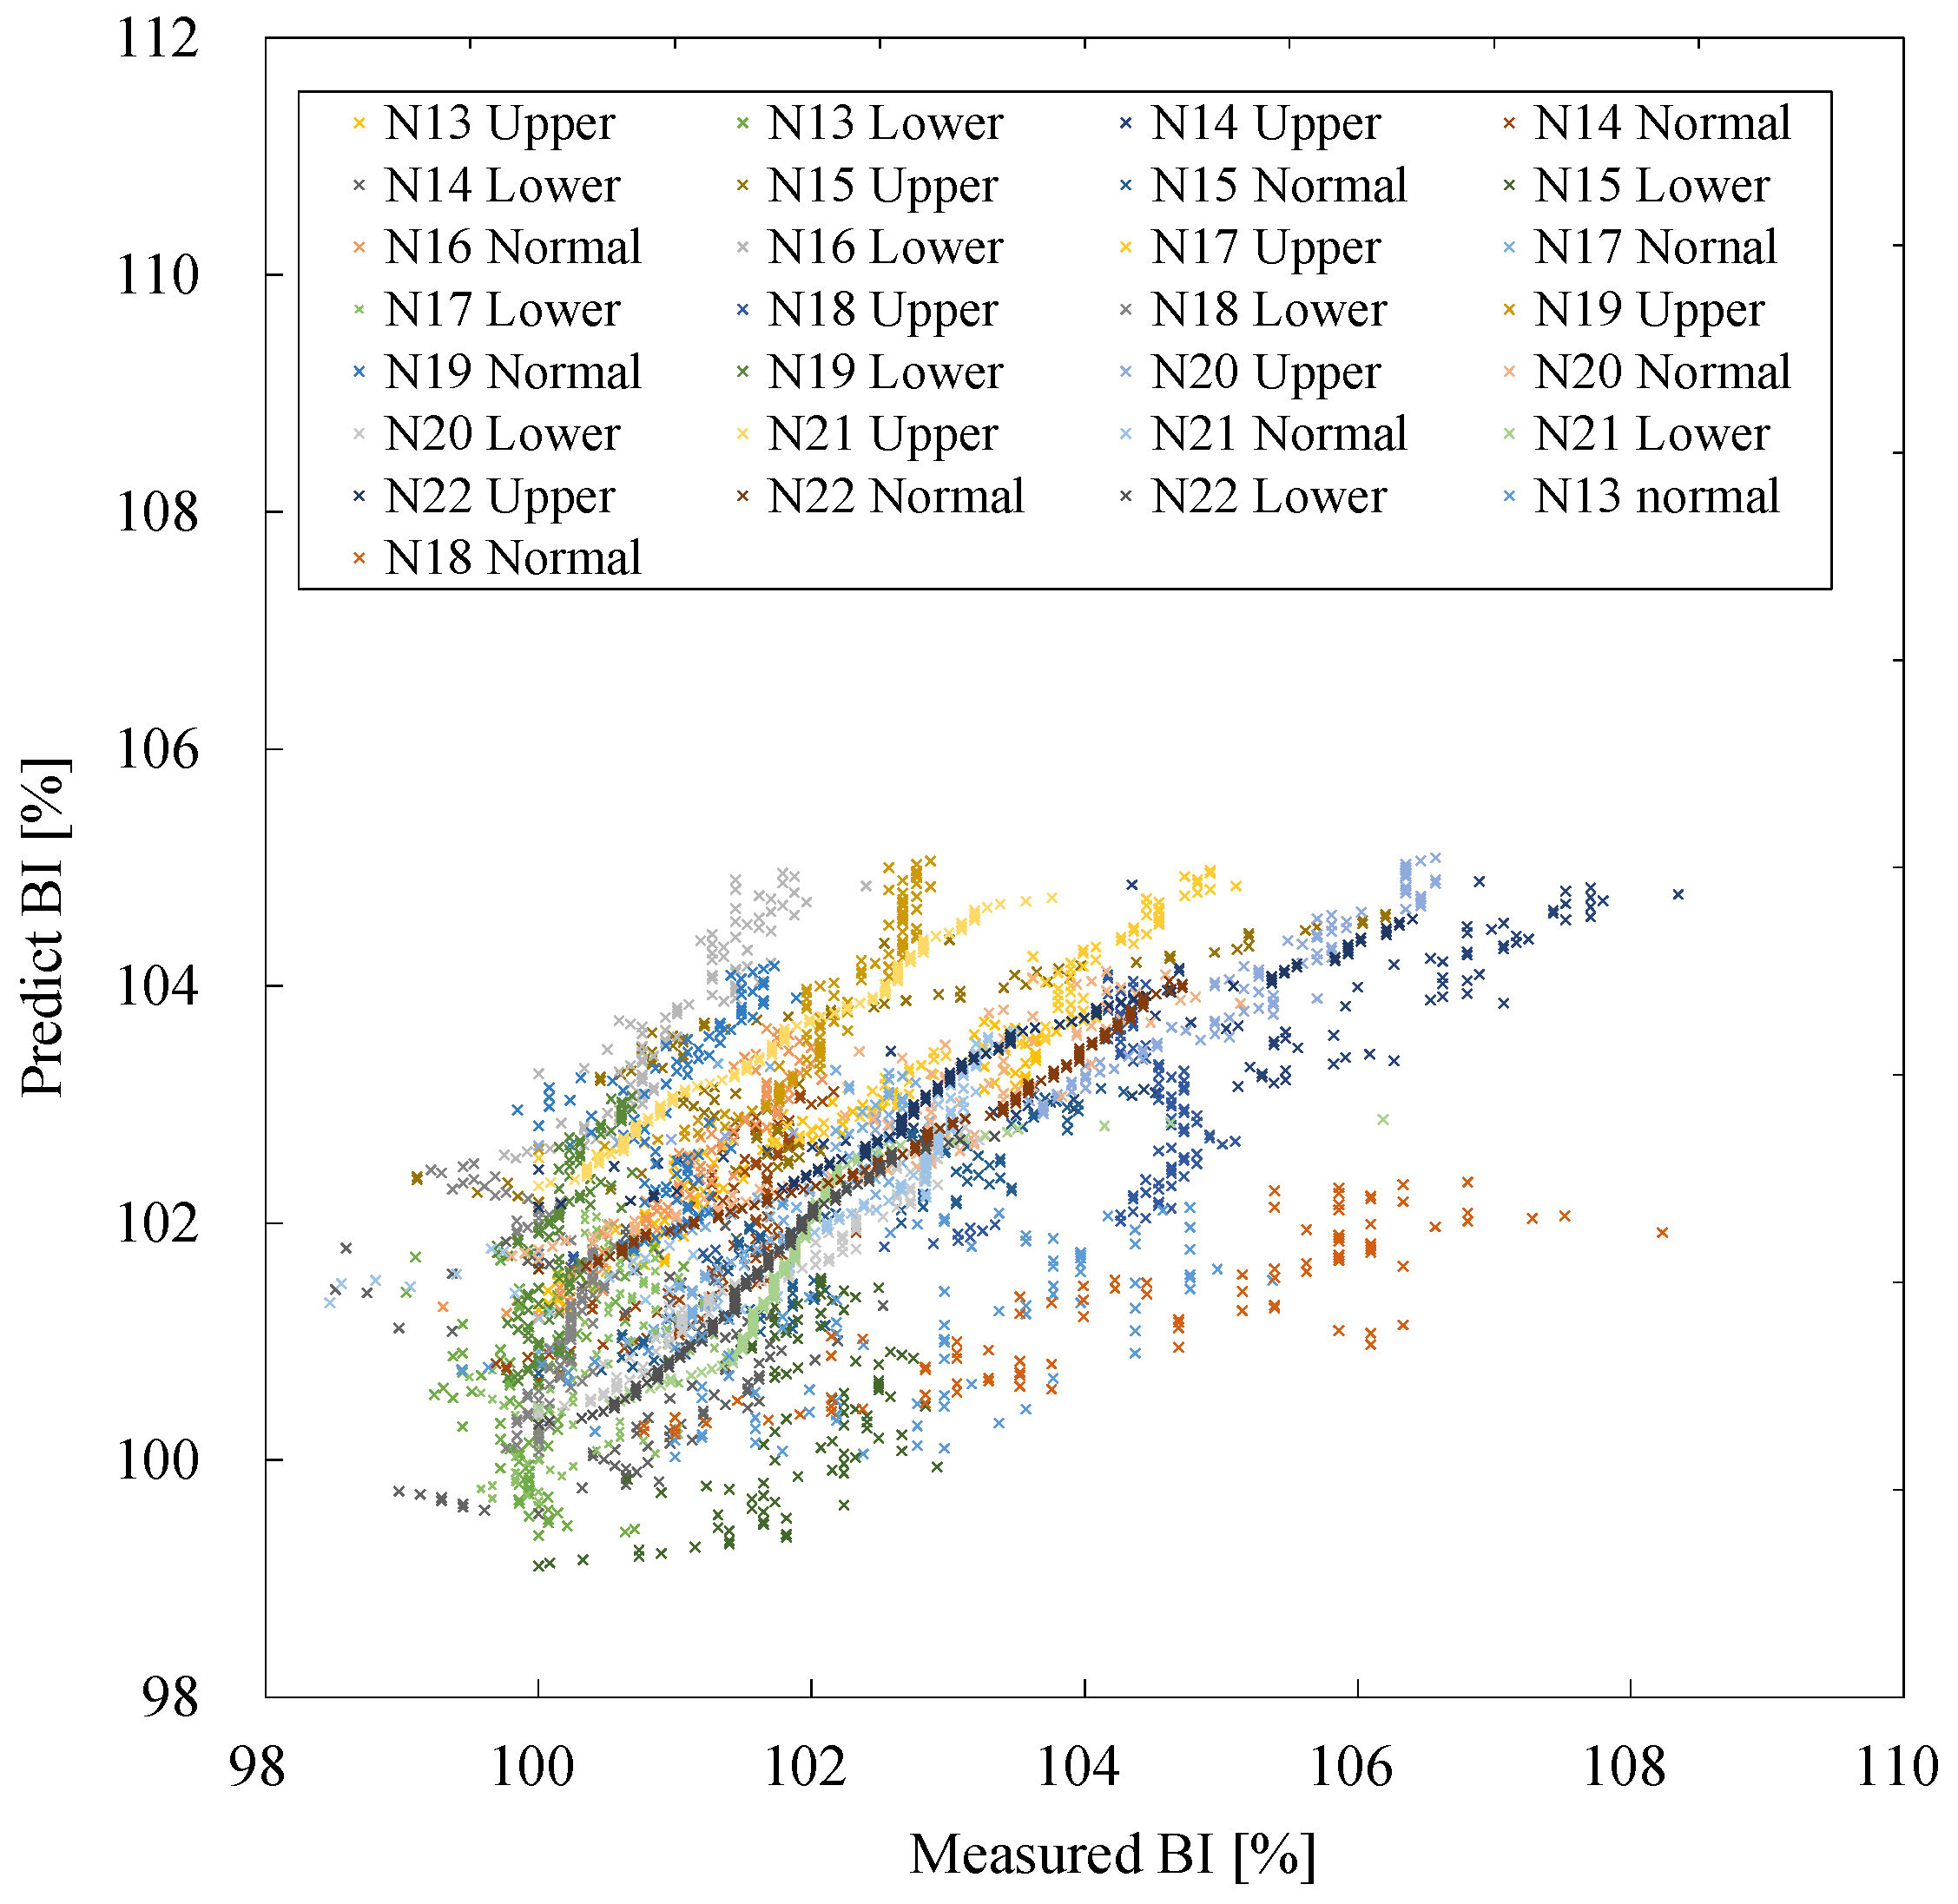
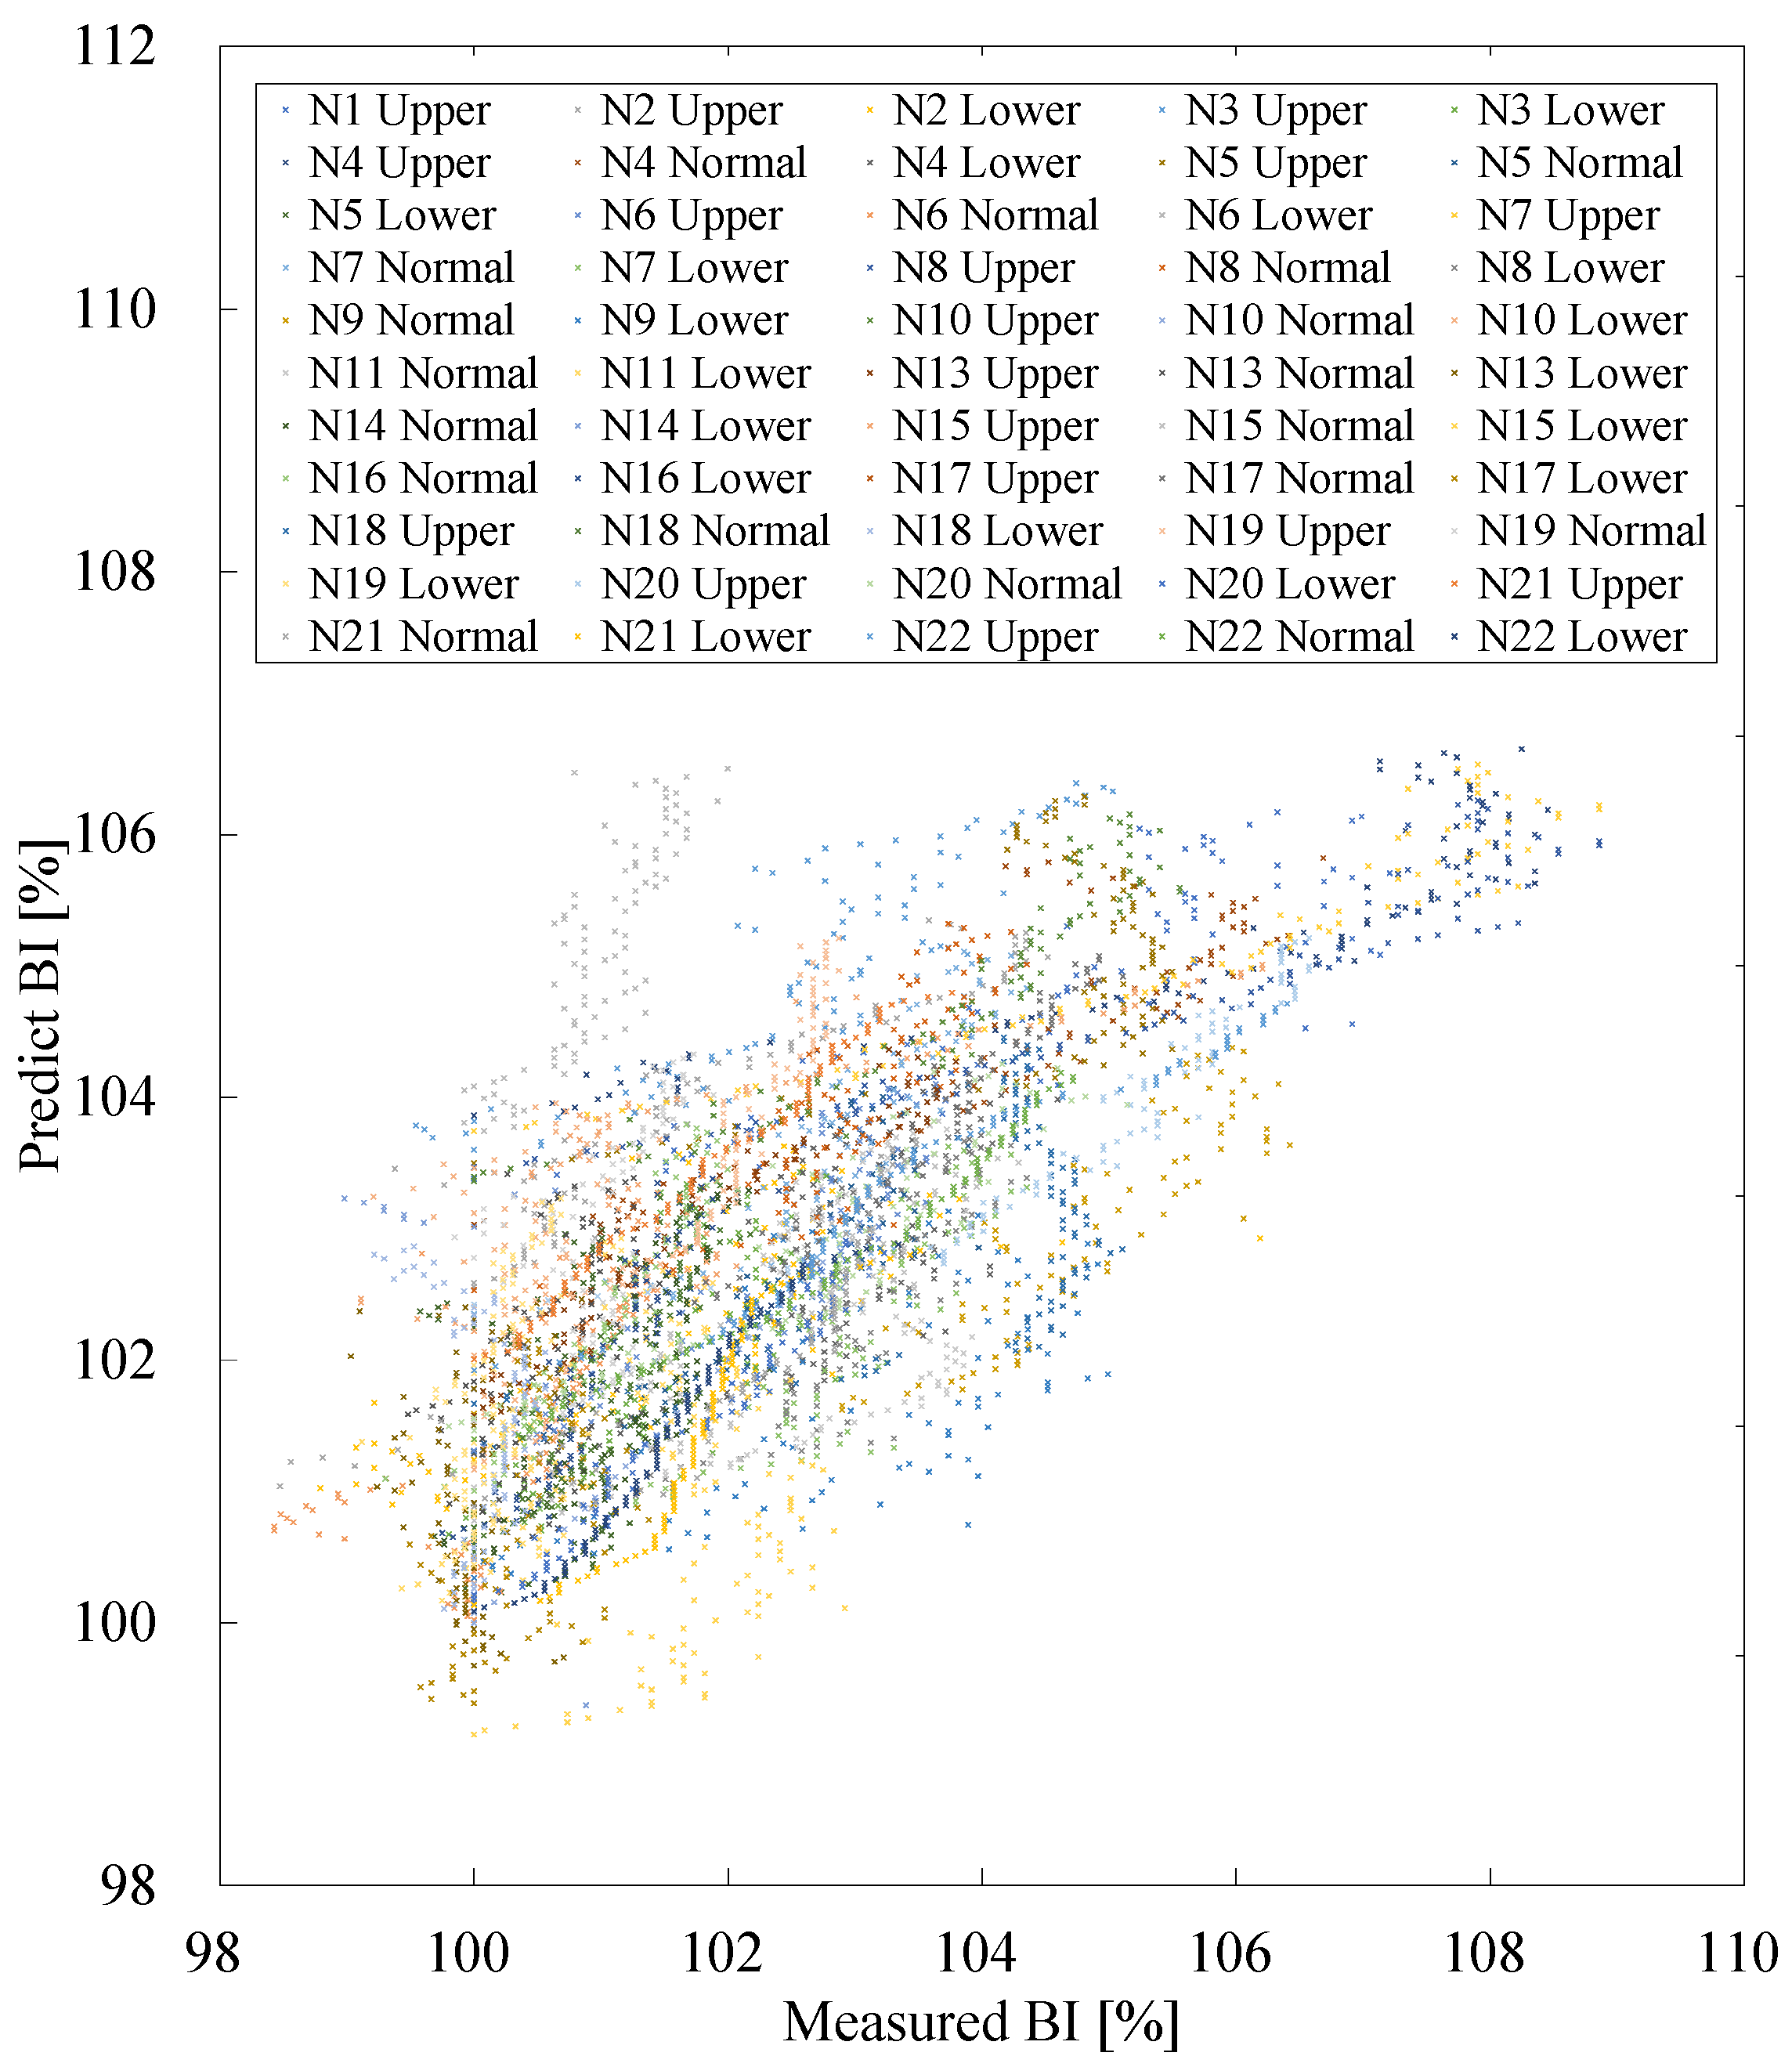
The predicted BI was obtained by assigning each value to the multiple regression equations in Table 2. For the males, the females, and all the participants, the relationships between the measured and predicted BI values are indicated as scatterplots in Figure 9, Figure 10 and Figure 11. The dotted lines in these figures are straight lines that are equal to the measured and predicted BI values.
Table 2 shows similar tendencies for each variable among the males, the females, and all the participants. Therefore, lower leg swelling could be predicted by sitting time   t , pressure in the tilt portion P t , participants’ height h , and body fat percentage f , regardless of sex. A detailed discussion of each variable is presented below. First, the greatest influence with a positive effect (standardized regression coefficient) on BI was the pressure in the tilt portion P t . This result is consistent with those presented in Figure 6 and the findings of a study by Fujita et al. [24]. The second highest influence with a positive effect on BI was sitting time t . Chester et al. clarified that lower leg swelling progresses with time in a prolonged sitting posture [15]. However, the participants’ height h had a negative effect on BI. This might be because thigh length is correlated with height. Since the same automobile seat was assigned to all the participants in this experiment, those with shorter thighs tended to have more compression on the popliteal vein. Kitamura et al. measured skin blood flow in the lower legs in a sitting posture and found that skin blood flow was higher when pressure on the popliteal vein running through the posterior knee was small [37]. Skin blood flow in the lower legs negatively affects lower leg swelling [37]. In this experiment, lower leg swelling progressed more in shorter participants with stronger pressure on the posterior knee. Therefore, a negative correlation between height and BI was noted. The standardized partial regression coefficients for body fat percentage f were quite small for both the male and female participants. In this experiment, fat percentage had little effect on BI. Generally, women tend to have a higher fat percentage and lower blood flow in their bodies than men. Therefore, women are more likely than men to have lower leg swelling. Figure 9 and Figure 10 indicate that the male participants have more data in the area above the straight line, while female participants have more data below the linear line. Conversely, the measured BI values were lower and higher than the predicted BI values in the men and women, respectively. The female hormones estrogen and progesterone are factors related to the greater progression of lower leg swelling noted in women compared to men. Estrogen and progesterone increase extracellular fluid and contribute to the progression of lower leg swelling [38,39]. Because female hormones are secreted to a greater extent during the perimenstrual period, lower leg swelling in women may also be influenced by the menstrual cycle. Notably, menstrual cycles were not controlled for in the female participants in this study. Several data points below the straight line for the female participants may have indicated a higher BI than predicted, which may have been influenced by female hormones.

4. Conclusions

This study focused on lower leg swelling as a typical physical load in prolonged sitting postures such as driving. The study aimed to obtain prediction equations for lower leg swelling from thigh pressure distribution, participants’ physical characteristics, and sitting time. Lower leg impedance and thigh pressure distribution were measured in participants sitting on an automobile seat for a long time. Multiple regression analysis was performed to construct prediction equations for lower leg swelling in the males, the females, and all the participants. The adjusted R 2   for the prediction equations for the males, the females, and all the participants were 0.561, 0.512, and 0.551, respectively. Furthermore, the standardized partial regression coefficients for each variable were similar for the three groups. In all the groups, the most positive effect on the progression of lower leg swelling was the thigh pressure distribution. This may be because the greater the thigh pressure, the more the popliteal vein is compressed and the blood flow to the lower limb decreases. Conversely, height had a negative effect. This might be because thigh length is correlated with height. Since the same automobile seat was assigned to all the participants in this experiment, those with shorter thighs tended to have more compression on the popliteal vein. These suggest that the obtained prediction equations may be applicable regardless of sex.
The limitations of this study were as follows: First, age was not included as a factor for the lower leg swelling. In general, lymphatic function declines with age, which may influence the progression of leg swelling. However, the participants in this study had a small age variation, ranging from 20 to 23 years old, and this effect may not have been fully included in the study. Second, body fat percentage was used as an explanatory variable in the prediction equation, but the adjusted partial regression coefficient for body fat percentage was small. Therefore, it is possible that the variation in body fat percentage was not adequately reflected in the results. Third, the female participants’ menstrual schedules were not considered. The lower leg swelling may have been overestimated due to changes in estrogen secretion caused by the menstrual schedule. Finally, driving behavior (e.g., operating the axel and brake, sitting up, etc.) may differ depending on driving conditions (e.g., city driving, highway driving, suburban driving, etc.) and type of vehicle (manual or automatic transmission). However, the experiments in this study were conducted in a static sitting posture and did not account for changes in these behaviors. These points require further investigation in future studies.
Future studies aiming to improve prediction accuracy should consider modifying the variables (e.g., image analysis of thigh pressure distribution to calculate features, physiological factors affecting lower leg swelling), conducting measurements of seated postures in actual driving conditions (e.g., movements and vibrations during driving) and different chairs (e.g., on office chairs), adjusting the measurement schedule based on the menstrual cycle for females, and including more participants and stratifying them based on age and physique.
A further potential application is the development of highly accurate fatigue estimation systems using digital technology. In recent years, studies on fatigue estimation using Digital Twin technology have gained attention. Several reports have explored fatigue estimation through digital models of the human body, such as during sitting work in offices or standing work in factories [40,41]. However, these studies primarily focus on fatigue caused by musculoskeletal loads. By incorporating lower leg swelling due to contact load, as identified in this study, it becomes possible to achieve more accurate fatigue estimation. Such highly accurate fatigue estimation technology is also important in the human–machine collaboration that Industry 5.0, which has been attracting attention in recent years, is aiming for, and we hope that this study will help in this regard [42,43].

Author Contributions

Conceptualization, T.K. and A.H.; methodology, F.K. and T.K.; validation, F.K.; investigation, F.K.; resources, T.K.; writing—original draft preparation, F.K.; writing—review and editing, T.K. and A.H.; supervision, T.K.; project administration, T.K.; funding acquisition, T.K. All authors have read and agreed to the published version of the manuscript.

Funding

This study was funded by Sumitomo Riko Co., Ltd. (Y01PA22073).

Institutional Review Board Statement

The study was conducted in accordance with the declaration of Helsinki and approved by the ethics committee of Keio University. Approval no. 2022-135 (approval date; 19 December 2022).

Informed Consent Statement

Informed consent was obtained from all subjects involved in the study.

Data Availability Statement

The data presented in this study are partially available on request from the corresponding author. The data are not publicly available due to consent with participants.

Acknowledgments

This study was supported by financial support and equipment loans from Sumitomo Riko Company Limited and equipment loans from NHK Spring Company Limited.

Conflicts of Interest

The funders had no role in the design of the study; in the collection, analyses, or interpretation of data; in the writing of the manuscript; in the decision to publish the results.

References

  1. Halin, A.; Verly, J.G.; Van Droogenbroeck, M. Survey and synthesis of state of the art in driver monitoring. Sensors 2021, 21, 5558. [Google Scholar] [CrossRef] [PubMed]
  2. Choi, S.; Kim, H.; Kim, H.; Yang, W. A development of the self shape adjustment cushion mechanism for improving sitting comfort. Sensors 2021, 21, 7959. [Google Scholar] [CrossRef] [PubMed]
  3. De Looze, M.P.; Kuijt-Evers, L.F.; van Dieën, J. Sitting comfort and discomfort and the relationships with objective measures. Ergonomics 2003, 46, 985–997. [Google Scholar] [CrossRef] [PubMed]
  4. Kolich, M. Predicting automobile seat comfort using a neural network. Int. J. Ind. Ergon. 2004, 33, 285–293. [Google Scholar] [CrossRef]
  5. Orsini, F.; Giusti, G.; Zarantonello, L.; Costa, R.; Montagnese, S.; Rossi, R. Driving fatigue increases after the spring transition to daylight saving time in young male drivers: A pilot study. Transp. Res. Part F Traffic Psychol. Behav. 2023, 99, 83–97. [Google Scholar] [CrossRef]
  6. Schmidt, D.A.; Baran, E.; Thompson, A.D.; Mishra, P.; Koehler, M.J.; Shin, T.S. Technological pedagogical content knowledge (TPACK): The development and validation of an assessment instrument for preservice teachers. J. Res. Technol. Educ. 2009, 42, 123–149. [Google Scholar] [CrossRef]
  7. Hirao, A.; Matsuoka, Y.; Yamazaki, N. Biomechanical determinants of sitting posture. In Proceedings of the Second International Comfort Congress, Delft, The Netherlands, 29–30 August 2019; pp. 1–8. [Google Scholar]
  8. Al-Dirini, R.M.; Reed, M.P.; Thewlis, D. Deformation of the gluteal soft tissues during sitting. Clin. Biomech. 2015, 30, 662–668. [Google Scholar] [CrossRef]
  9. El Falou, W.; Duchêne, J.; Grabisch, M.; Hewson, D.; Langeron, Y.; Lino, F. Evaluation of driver discomfort during long-duration car driving. Appl. Ergon. 2003, 34, 249–255. [Google Scholar] [CrossRef]
  10. Behrens, M.; Mau-Moeller, A.; Bruhn, S. Effect of exercise-induced muscle damage on neuromuscular function of the quadriceps muscle. Int. J. Sports Med. 2012, 33, 600–606. [Google Scholar] [CrossRef]
  11. Stock, M.S.; Beck, T.W.; Defreitas, J.M. Effects of fatigue on motor unit firing rate versus recruitment threshold relationships. Muscle Nerve 2012, 45, 100–109. [Google Scholar] [CrossRef]
  12. Davidson, K.L.; Hubley-Kozey, C.L. Trunk muscle responses to demands of an exercise progression to improve dynamic spinal stability. Arch. Phys. Med. Rehabil. 2005, 86, 216–223. [Google Scholar] [CrossRef] [PubMed]
  13. Levick, J.R.; Michel, C.C. Microvascular fluid exchange and the revised starling principle. Cardiovasc. Res. 2010, 87, 198–210. [Google Scholar] [CrossRef] [PubMed]
  14. Chester, M.R.; Rys, M.J.; Konz, S.A. Leg swelling, comfort and fatigue when sitting, standing, and sit/standing. Int. J. Ind. Ergon. 2002, 29, 289–296. [Google Scholar] [CrossRef]
  15. Hayes, S.; Cornish, B.; Newman, B. Comparison of methods to diagnose lymphoedema among breast cancer survivors: 6-month follow-up. Breast Cancer Res. Treat. 2005, 89, 221–226. [Google Scholar] [CrossRef]
  16. Lukaski, H.C. Methods for the assessment of human body composition: Traditional and new. Am. J. Clin. Nutr. 1987, 46, 537–556. [Google Scholar] [CrossRef]
  17. Fujita, D.; Mori, A.; Cleminson, T.; Kada, M.; Fukuda, J.; Kobara, K.; Osaka, H.; Watanabe, S. Using seating techniques as a preventative measure against lower limb edema -The effect of combining tilt angle and reclining mechanisms on wheelchairs. J. Phys. Ther. Sci. 2010, 22, 437–441. [Google Scholar] [CrossRef]
  18. Battini, D.; Berti, N.; Finco, S.; Guidolin, M.; Reggiani, M.; Tagliapietra, L. WEM-Platform: A Real-Time Platform for Full-Body Ergonomic Assessment and Feedback in Manufacturing and Logistics Systems. Comput. Ind. Eng. 2022, 164, 107881. [Google Scholar] [CrossRef]
  19. Jimenez, J.F.; Maire, J.L. ErgoTwin: A Digital Twin Model for Monitoring the Postural Risks on Industrial Workers. In Service Oriented, Holonic and Multi-Agent Manufacturing Systems for Industry of the Future. SOHOMA 2023; Borangiu, T., Trentesaux, D., Leitão, P., Berrah, L., Jimenez, J.F., Eds.; Studies in Computational Intelligence; Springer: Cham, Switzerland, 2024; Volume 1136, pp. 345–360. [Google Scholar] [CrossRef]
  20. Quan, Q.; Gao, Y.; Bai, Y.; Jin, Z. Multi-modal Fusion in Ergonomic Health: Bridging Visual and Pressure for Sitting Posture Detection. CCF Trans. Pervasive Comp. Interact. 2024. [Google Scholar] [CrossRef]
  21. Kapoor, R.; Jaiswal, A.; Makedon, F. Light-Weight Seated Posture Guidance System with Machine Learning and Computer Vision. In Proceedings of the 15th International Conference on Pervasive Technologies Related to Assistive Environments (PETRA ‘22), Corfu, Greece, 29 June–1 July 2022; Association for Computing Machinery: New York, NY, USA, 2022; pp. 595–600. [Google Scholar] [CrossRef]
  22. Lloyd, D.G.; Saxby, D.J.; Pizzolato, C.; Worsey, M.; Diamond, L.E.; Palipana, D.; Bourne, M.; de Sousa, A.C.; Mannan, M.M.N.; Nasseri, A.; et al. Maintaining Soldier Musculoskeletal Health Using Personalised Digital Humans, Wearables and/or Computer Vision. J. Sci. Med. Sport 2023, 26 (Suppl. S1), S30–S39. [Google Scholar] [CrossRef]
  23. Benjaminse, A.; Nijmeijer, E.M.; Gokeler, A.; Di Paolo, S. Application of Machine Learning Methods to Investigate Joint Load in Agility on the Football Field: Creating the Model, Part I. Sensors 2024, 24, 3652. [Google Scholar] [CrossRef]
  24. Deurenberg, P. International consensus conference on impedance in body composition. Age Nutr. 1994, 5, 142–145. [Google Scholar]
  25. Deurenberg, P.; Deurenberg-Yap, M.; Schouten, F.J. Validity of total and segmental impedance measurements for prediction of body composition across ethnic population groups. Eur. J. Clin. Nutr. 2002, 56, 214–220. [Google Scholar] [CrossRef] [PubMed]
  26. Lukaski, H.C.; Johnson, P.E.; Bolonchuk, W.W.; Lykken, G.I. Assessment of fat-free mass using bioelectrical impedance measurements of the human body. Am. J. Clin. Nutr. 1985, 41, 810–817. [Google Scholar] [CrossRef]
  27. Nishimura, M.; Kato, T.; Onodera, S. Evaluation Methods for the Measurement of Lower Leg Edema in Healthy Young Adults. Yonago Acta Med. 2020, 63, 294–300. [Google Scholar] [CrossRef] [PubMed]
  28. Hachiya, T.; Blaber, A.P.; Saito, M. Near-infrared spectroscopy provides an index of blood flow and vasoconstriction in calf skeletal muscle during lower body negative pressure. Acta Physiol. 2008, 193, 117–127. [Google Scholar] [CrossRef]
  29. Yamaguchi, H.; Yoshida, H.; Kamijo, M.; Fujimaki, G.; Naruse, T. Effect of footrest angle on decrement of leg swelling while sitting. Int. J. Affect. Eng. 2014, 13, 197–203. [Google Scholar] [CrossRef]
  30. Kato, Z.; Okubo, T. Syogakusya no Tame no Seitai Kinou no Hakarikata 2.0 [How to Measure Biological Functions for Beginning Students 2.0]; Nihon Syuppan Service: Tokyo, Japan, 2006. (In Japanese) [Google Scholar]
  31. Seo, A.; Kondo, Y.; Yoshinaca, F. A portable apparatus for monitoring leg swelling by bioelectrical impedance measurement. J. Occup. Health 1997, 39, 150–151. [Google Scholar] [CrossRef]
  32. Deurenberg, P.; Weststrate, J.A.; Paymans, I.; van der Kooy, K. Factors affecting bioelectrical impedance measurements in humans. Eur. J. Clin. Nutr. 1988, 42, 1017–1022. [Google Scholar]
  33. Clanton, T.O.; Solcher, B.W. Chronic leg pain in the athlete. Clin. Sports Med. 1994, 13, 743–759. [Google Scholar] [CrossRef]
  34. Miyoshi, S.; Hiroshige, Y.; Kamikubo, T.; Yamaguchi, E.; Yoshioka, T.; Shirakawa, T. Relationships between medial tibial stress syndrome and physical functions in long-distance runners. Rigakuryoho Kagaku 2020, 35, 355–359. [Google Scholar] [CrossRef]
  35. Newman, P.; Adams, R.; Waddington, G. Two simple clinical tests for predicting onset of medial tibial stress syndrome: Shin palpation test and shin oedema test. Br. J. Sports Med. 2012, 46, 861–864. [Google Scholar] [CrossRef] [PubMed]
  36. Kitamura, T.; Kato, T.; Sato, K.; Matsuoka, Y. Optimization of public seat functions to assure a comfortable sitting posture in diverse conditions. Glob. J. Res. Eng. 2013, 13, 9–17. [Google Scholar]
  37. Hitos, K.; Cannon, M.; Cannon, S.; Garth, S.; Fletcher, J.P. Effect of leg exercises on popliteal venous blood flow during prolonged immobility of seated subjects: Implications for prevention of travel-related deep vein thrombosis. J. Thromb. Haemost. 2007, 5, 1890–1895. [Google Scholar] [CrossRef]
  38. Stachenfeld, N.S.; Taylor, H.S. Effects of estrogen and progesterone administration on extracellular fluid. J. Appl. Physiol. 2004, 96, 1011–1018. [Google Scholar] [CrossRef]
  39. Stachenfeld, N.S.; Taylor, H.S. Progesterone increases plasma volume independent of estradiol. J. Appl. Physiol. 2005, 98, 1991–1997. [Google Scholar] [CrossRef]
  40. Murcia, N.; Mohafid, A.; Cardin, O. Non-intrusive musculoskeletal disorders risk assessment towards an integration in human operators’ digital twins. IFAC-PapersOnLine 2023, 56, 5667–5672. [Google Scholar] [CrossRef]
  41. Hirao, A.; Uchida, H.; Kato, T. Analysis of musculoskeletal loads during prolonged sitting in the desk work. In Advances in Digital Human Modeling. DHM 2023; Scataglini, S., Harih, G., Saeys, W., Truijen, S., Eds.; Lecture Notes in Networks and Systems; Springer: Cham, Switzerland, 2023; Volume 744. [Google Scholar] [CrossRef]
  42. Pizoń, J.; Gola, A. Human–Machine Relationship—Perspective and Future Roadmap for Industry 5.0 Solutions. Machines 2023, 11, 203. [Google Scholar] [CrossRef]
  43. Paul, G.; Wang, X.; Yang, J. An Introduction to the Special Issue on Digital Human Modeling (DHM) in Ergonomics 4.0. IISE Trans. Occup. Ergon. Hum. Factors 2021, 9, 107–110. [Google Scholar] [CrossRef]
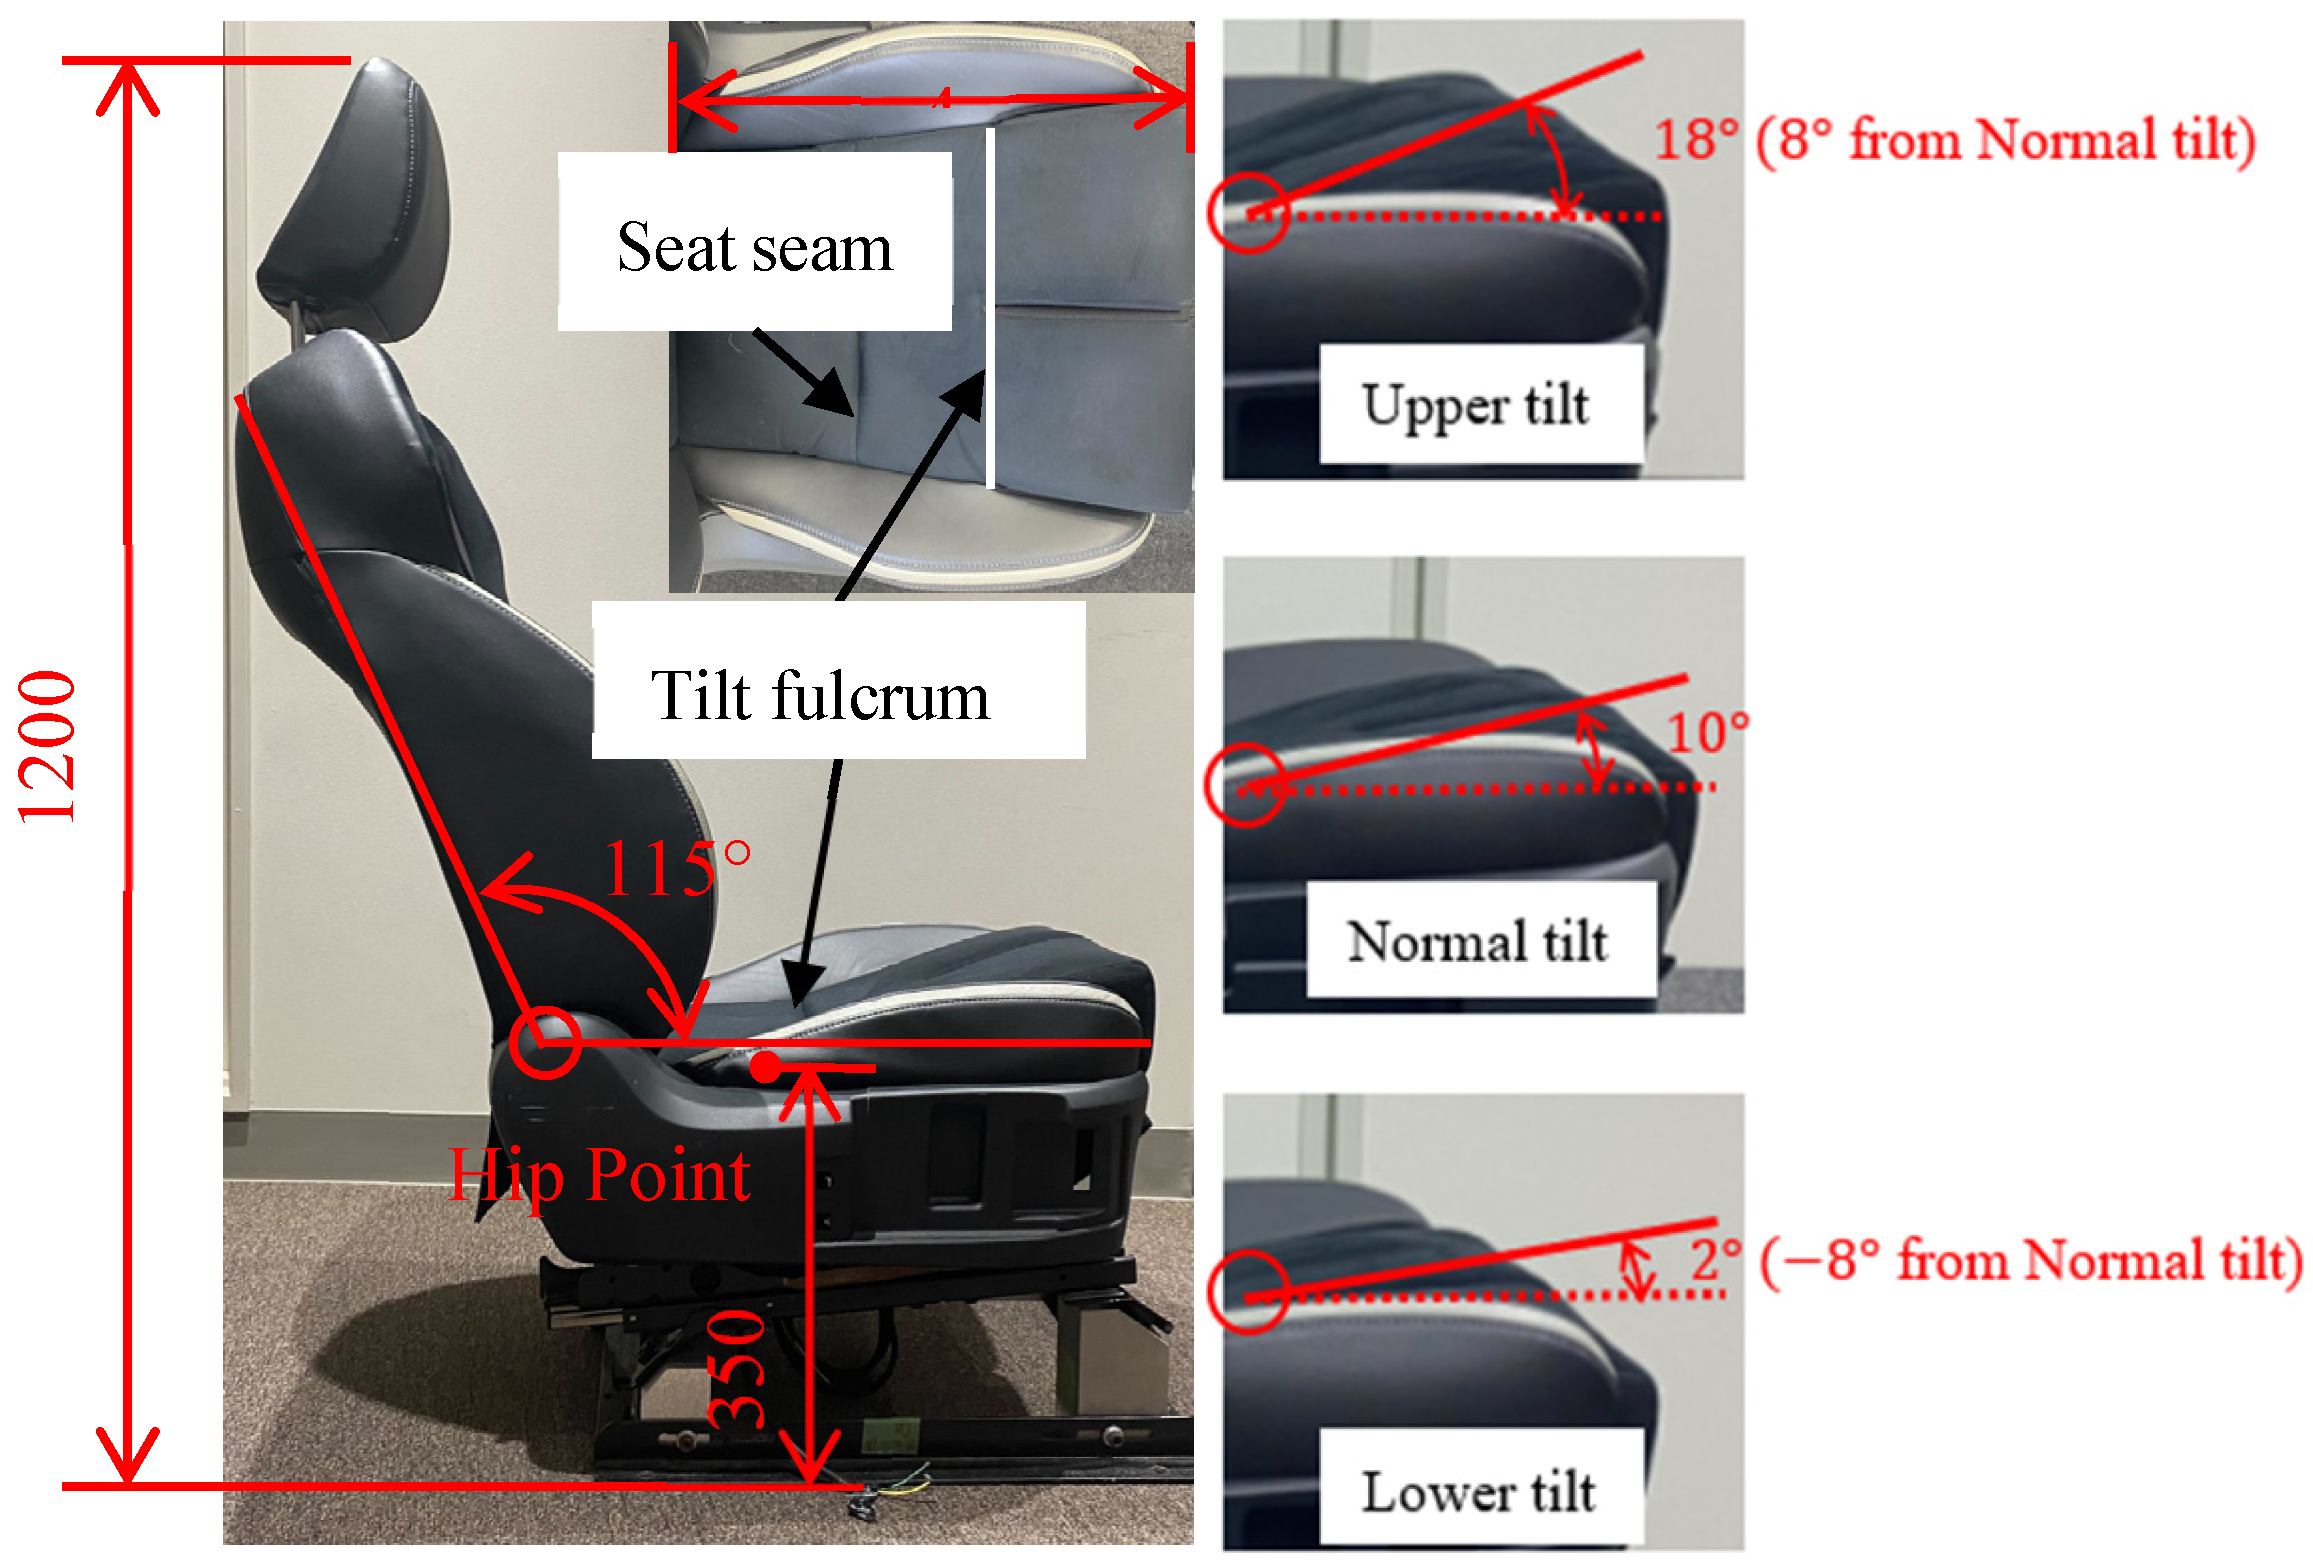
Figure 1. Automobile seat.
Applsci 14 11788 g001
Figure 2. Method of identifying thigh pressure distribution by the tilt mechanism; (a) example of the measured body pressure distribution, (b) relative position of the seat seam and tilt fulcrum.
Applsci 14 11788 g002
Figure 3. Experiments on measurement reproducibility. ((1) and (2) indicate two experiments conducted under identical physiological conditions.)
Applsci 14 11788 g003
Figure 4. Placement of measurement equipment and actual image of the experiment.
Applsci 14 11788 g004
Figure 5. The experimental protocol.
Applsci 14 11788 g005
Figure 6. BI changes over time.
Applsci 14 11788 g006
Figure 7. Relationship between BI and tilt angle.
Applsci 14 11788 g007
Figure 8. Relationship between BI at 90 min and P t for all participants.
Applsci 14 11788 g008
Figure 9. Relationship between measured and predicted BI for male participants.
Applsci 14 11788 g009
Figure 10. Relationship between measured and predicted BI for female participants.
Applsci 14 11788 g010
Figure 11. Relationship between measured and predicted BI for all participants.
Applsci 14 11788 g011
Table 1. Physical characteristics of the participants.
Participant
Number
1 2 3 4 5 6 7 8 9 10 11
SexMale
Height [mm]18201770176017201730183017201730170016901770
Weight [kg]6363636558586169556262
BMI [kg/m2]18.920.120.322.019.417.320.822.819.021.719.8
Body fat [%]18.414.221.616.718.811.519.929.013.320.917.0
Participant
Number
1213141516171819202122
SexFemale
Height [mm]16001670156016101540152016001550154015201530
Weight [kg]5352455045455043444940
BMI [kg/m2]20.718.618.519.319.019.519.517.918.621.217.1
Body fat [%]27.612.720.216.815.312.917.118.817.617.911.6
Table 2. Results of multiple regression analysis.
DataIndependent VariablesNon-Standardized CoefficientStandardized
Coefficient
Variance Inflation Factor
Male Time   ( t ) 0.0360.4681.000
Tilt   pressure   ( p t ) 0.0020.5521.130
Height   ( h ) −8.373−0.1841.203
Fat   percentage   ( f )−0.027−0.0641.320
Constant111.415
Female Time   ( t ) 0.0270.4391.000
Tilt   pressure   ( p t ) 0.0020.5271.002
Height   ( h ) −7.202−0.2041.016
Fat   percentage   ( f )0.0100.0171.018
Constant107.867
All Time   ( t ) 0.0310.4391.000
Tilt   pressure   ( p t ) 0.0020.6591.421
Height   ( h ) −3.405−0.1841.264
Fat   percentage   ( f )0.0010.0021.150
Constant101.950
Disclaimer/Publisher’s Note: The statements, opinions and data contained in all publications are solely those of the individual author(s) and contributor(s) and not of MDPI and/or the editor(s). MDPI and/or the editor(s) disclaim responsibility for any injury to people or property resulting from any ideas, methods, instructions or products referred to in the content.