The Potential of Artificial Intelligence in Predicting Post-Stroke Rehabilitation Outcomes: Statistical Analysis Considering Rivermead Motor Assessment and Activities of Daily Living Indicators and Selected Demographic Variables
Abstract
1. Introduction
2. Related Works
3. Materials and Methods
3.1. Description of the Studied Patients
3.1.1. The Gender
- Physiological Differences;
- Injury Predisposition;
- Pain Response;
- Psychosocial Aspects;
- Hormones and Aging;
- Rehabilitation Goals;
- Health Needs.
3.1.2. The Age
- Physiological Processes;
- Comorbidities;
- Psychosocial Aspects;
- Recovery Rate;
- Diverse Therapeutic Goals;
- Acceptance of Aging.
3.1.3. Other Demographic Data
3.1.4. Depression Level as an Important Factor
- 0–4 points: no or minimal depression;
- 5–9 points: moderate depression;
- 10–15 points: severe depression.
3.2. RMA Indicator
- RMA1—Global Functions: This section assesses basic motor skills such as sitting, standing up, walking, and running short distances. It provides a fundamental measure of the patient’s motor abilities and balance, offering insight into their mobility level.
- RMA2—Lower Limb and Trunk: Focuses on the patient’s ability to control lower limbs and trunk stability, including specific tasks like standing on one leg or lifting a leg.
- RMA3—Upper Limb: Evaluates upper limb functions, including manipulations and precise hand movements, important for everyday tasks such as lifting an arm or holding objects.
3.3. ADL Indicator
- Bathing: Measures the patient’s ability to perform hygiene activities independently.
- Dressing: Assesses the patient’s motor skills and independence in choosing and wearing clothes.
- Eating: Evaluates the ability to manipulate objects and eat independently.
- Mobility: Tests the patient’s ability to move, essential for independent functioning.
- Bodily Functions Control: Concerns the patient’s ability to control physiological functions.
- Using the Toilet: Assesses the patient’s independence in using the toilet and maintaining personal hygiene.
4. Prediction of Progress in Rehabilitation—Predictive Model
4.1. Methodology
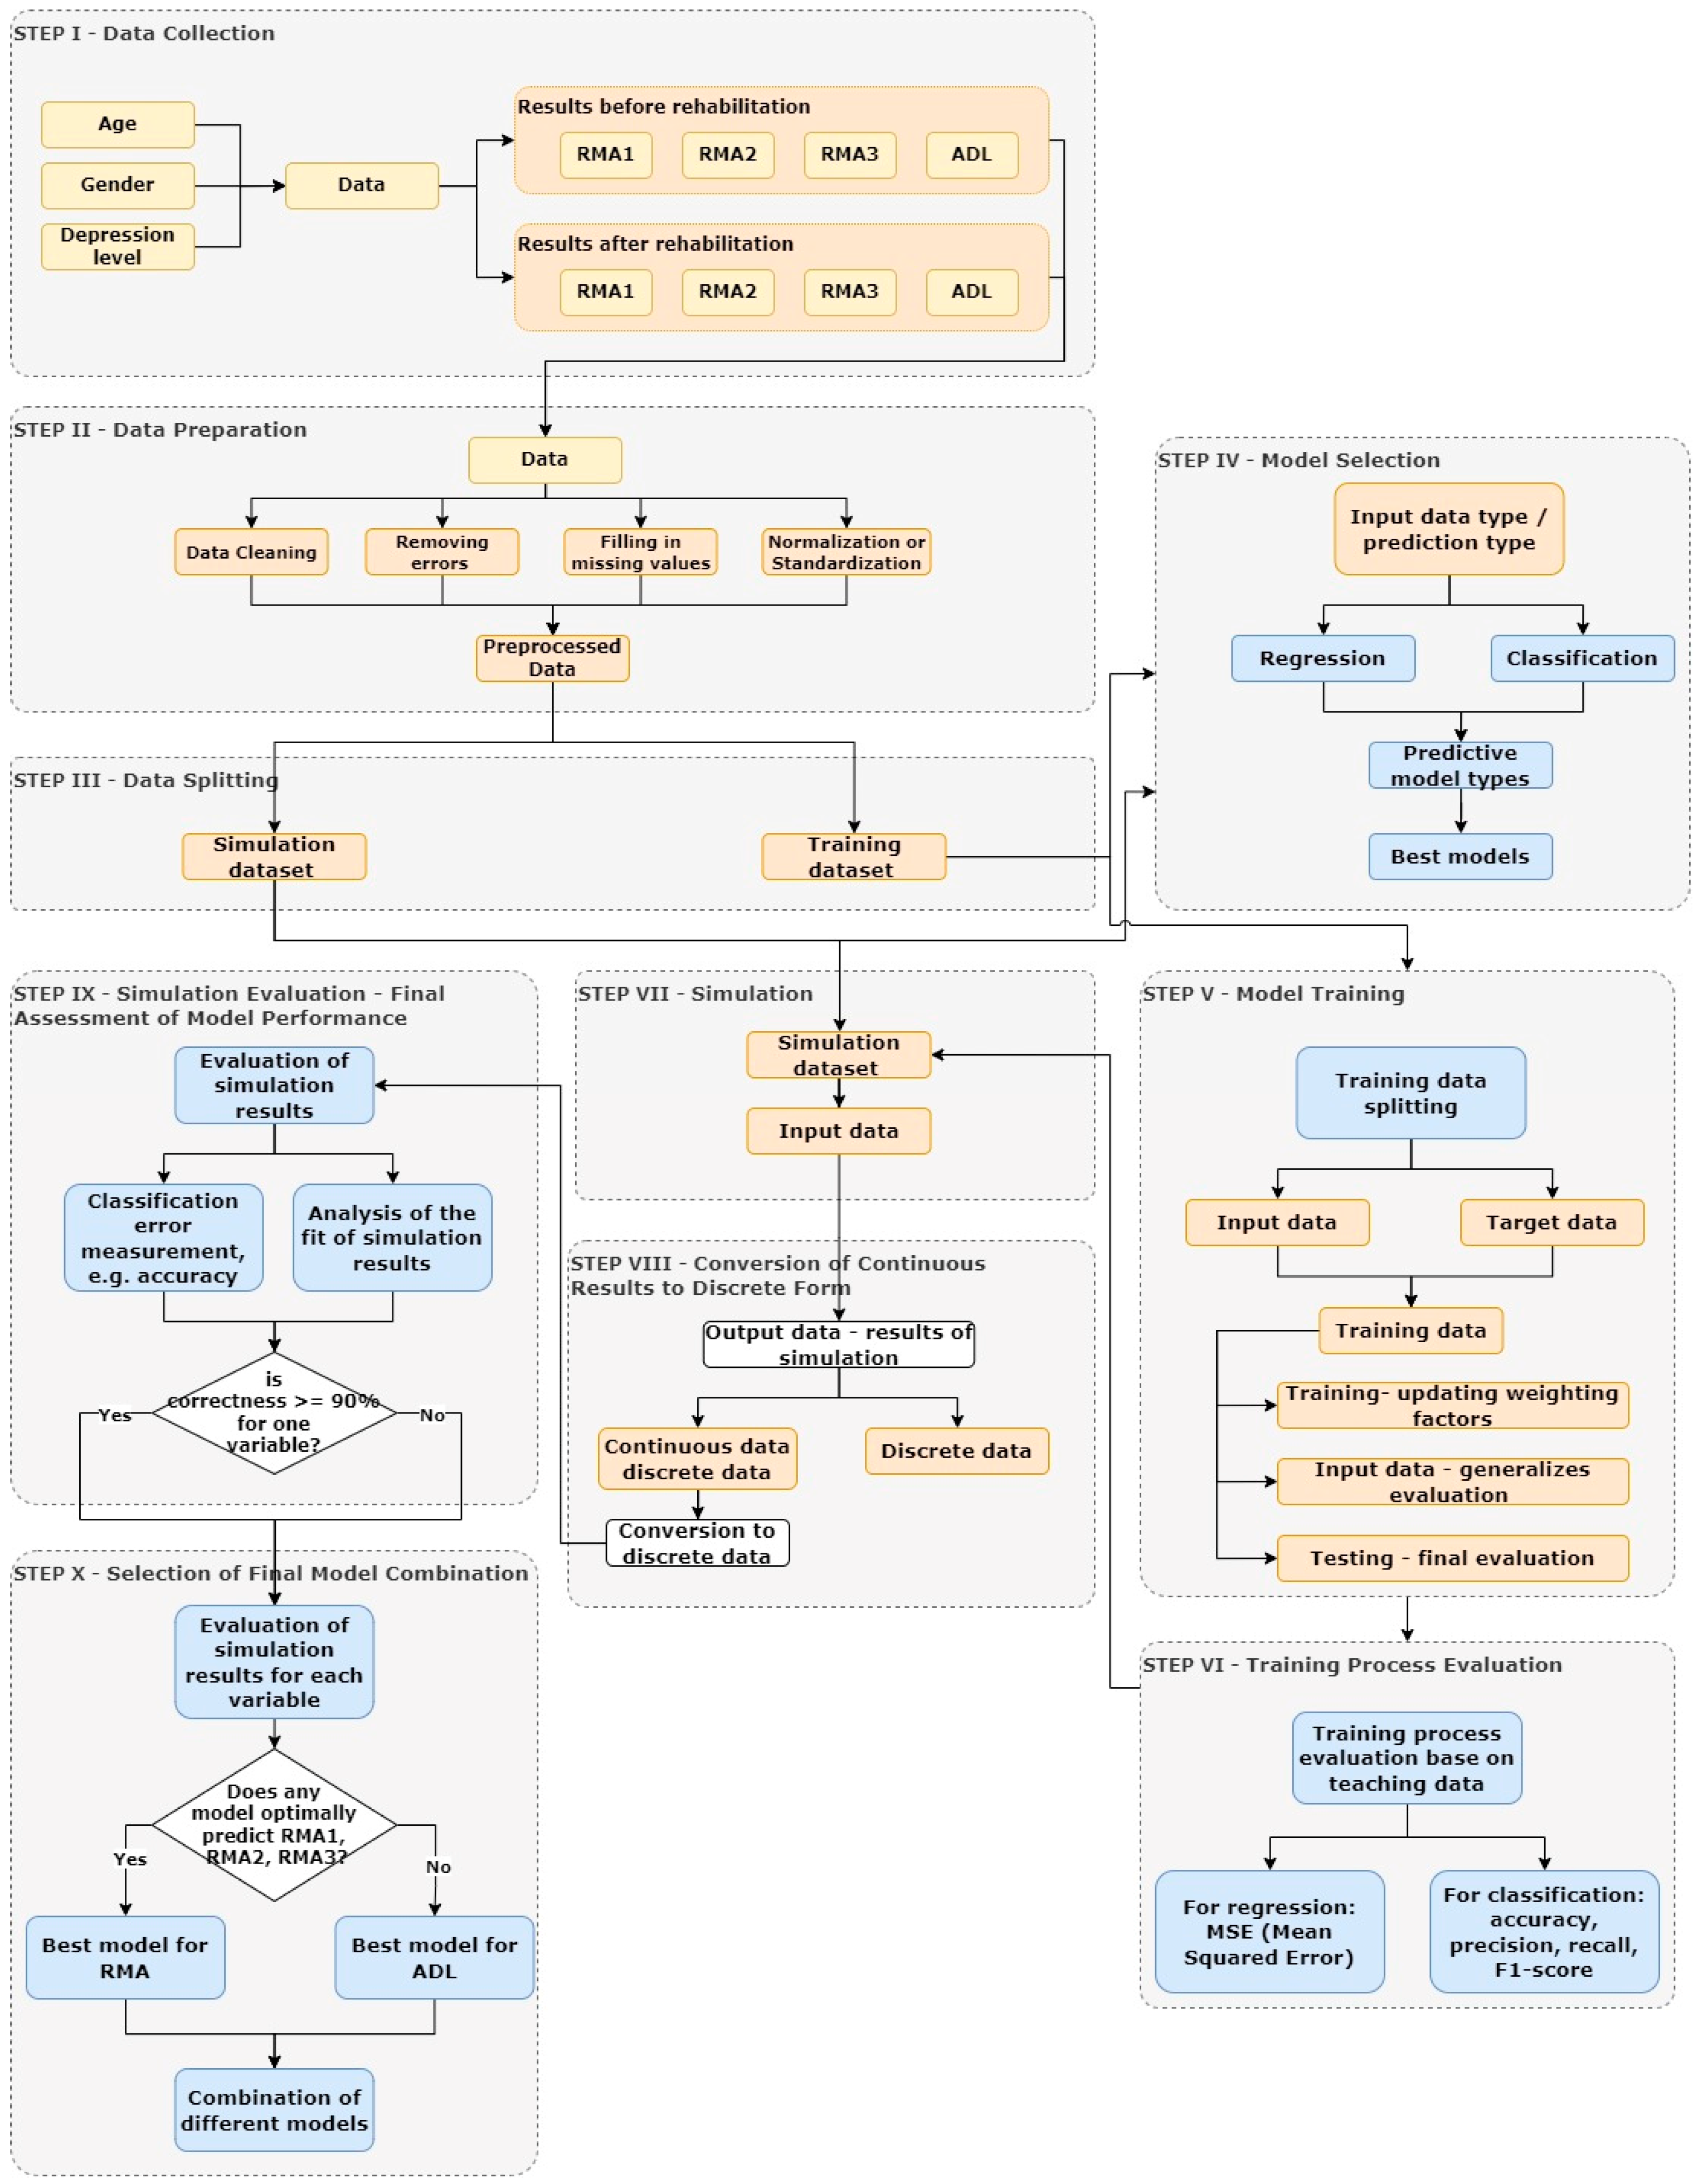
- Data Collection:
- 2.
- Data Preparation:
- Data cleaning, which includes removing errors and filling in missing values. The dataset before cleaning is and after .
- Normalization or standardization of data to ensure consistency and facilitate model training.where μ and σ i means the value and deviation of the standard deviation x and .
- Feature engineering, which involves creating new variables from existing data.
- 3.
- Data Splitting
- 4.
- Model Selection:
- For classification: the predicted output values take on discrete values.
- For regression: the predicted values are continuous and may later be transformed into discrete values during the stage of transforming simulation results.
- 5.
- Model Training:
- Training:Data are passed through the network, and weights are updated according to a learning algorithm (such as feedforward backpropagation). The aim is to adjust the model to best represent the relationships in the training data.The training set is divided into an input dataset and an output dataset .During training, the cost function is minimizedwhere means the chosen error metric (e.g., MSE for regression), represents the actual values, are the values predicted by the model, and N is the number of samples.During training, the model parameters θ are updated according to an optimization algorithm, such as the simple gradient descent methodwhere α represents the learning rate.Goal: Minimize errors in training data.
- Validation:Based on the validation results, model parameters may be adjusted, or training may be stopped to avoid overfitting.Goal: Assess the model’s ability to generalize to new data.
- Testing:The test data are separate from the training and validation data, allowing for an unbiased evaluation of the model’s effectiveness.The model is evaluated on validation and test sets to monitor generalization. The final value of the error function on the test set is given by , which allows for assessing the model’s effectiveness on unseen data.Goal: Provide an objective measure of the model’s quality on data not seen during training.
- 6.
- Training Process Evaluation:
- For regression: MSE (Mean Squared Error), RMSE (Root Mean Squared Error), MAE (Mean Absolute Error). The expression for MSE, RMSE, and MAE is given as [24]
- For classification: accuracy, precision, recall, F1-score, and ROC AUC.
- The final evaluation of the learning process is based on the fit between the output data and target data, measured using the fit coefficient and R-value.
- 7.
- Simulation:
- 8.
- Conversion of Continuous Results to Discrete Form
- Rounding: Rounding the continuous values to the nearest integer
- Assigning to Intervals: The values in are assigned to intervals corresponding to integer values using the function P, where returns discrete intervals.
- 9.
- Simulation Evaluation—Final Assessment of Model Performance
- Calculation of Percentage of Correct Classifications: This involves determining the percentage of correctly and incorrectly classified simulation results by counting those that matched the actual values and those that did not. This final evaluation verifies the quality of the model’s prediction of rehabilitation progress.
- Analysis of Metrics: Metrics such as F1-score, precision-recall, and confusion matrix allow for a comprehensive evaluation of the model’s effectiveness.
- 10.
- Selection of Final Model Combination
- One model MA may perform well in predicting RMA1, RMA2, and RMA3 but not ADL.
- Another model MB may predict ADL better but struggle with other variables.
- Model A for predicting RMA1, RMA2, and RMA3.
- Model B for predicting ADL.
4.2. Training and Simulation Set
4.3. Parameters of the Tested Models
- Training Function (trainlm): The Levenberg–Marquardt algorithm (trainlm) is used to adjust weights during training. It optimizes by minimizing error through weight modification and is known for its fast convergence, especially in regression.
- Adaptive Learning Function (adaptwb): This function handles adaptive weight modification during training. It allows adjustment of learning rates over time, accelerating convergence and enhancing adaptability.
- Performance Function (MSE): The Mean Squared Error (MSE) is used to assess performance by measuring the average squared differences between actual and predicted values. Minimizing MSE means better model representation of real data.
- tansig (Hyperbolic Tangent): A nonlinear transfer function often used in hidden layers of neural networks. It transforms input values within a range of −1 to 1.
- purelin (Linear): A linear transfer function that outputs the input value directly. Commonly used in output layers for regression problems where a linear relationship is expected.
- TrainRatio (Training Data Ratio): Specifies the percentage of data used for training the model. It constitutes 70% of the training data. These data are used to update the model’s weights and learn from examples.
- ValRatio (Validation Data Ratio): Indicates the percentage of data used for model validation. Validation data accounts for 15% of the training data and is used during training to assess performance and improve model generalization.
- TestRatio (Testing Data Ratio): Specifies the percentage of data used for model testing. These data, also constituting 15% of the training data, are used to objectively evaluate the model on unseen data.
5. Results
5.1. Test Results Before and After Rehabilitation
5.1.1. Statistical Analysis of Results
- RMA1 Indicator—p-value: 0.469968;
- RMA2 Indicator—p-value: 0.275796;
- RMA3 Indicator—p-value: 0.492730.
5.1.2. Correlation Between Variables and Rehabilitation Outcomes
5.1.3. The Influence of the Level of Depression on the Effects of Rehabilitation
- <0.29—weak correlation;
- 0.30–0.59—moderate correlation;
- 0.60–0.79—moderate to strong correlation;
- 0.80–0.99—very strong correlation;
- 1—perfect correlation.
5.1.4. The Influence of Age on the Effects of Rehabilitation
5.1.5. The Role of Gender in Rehabilitation
5.2. Results from Testing Predictive Models
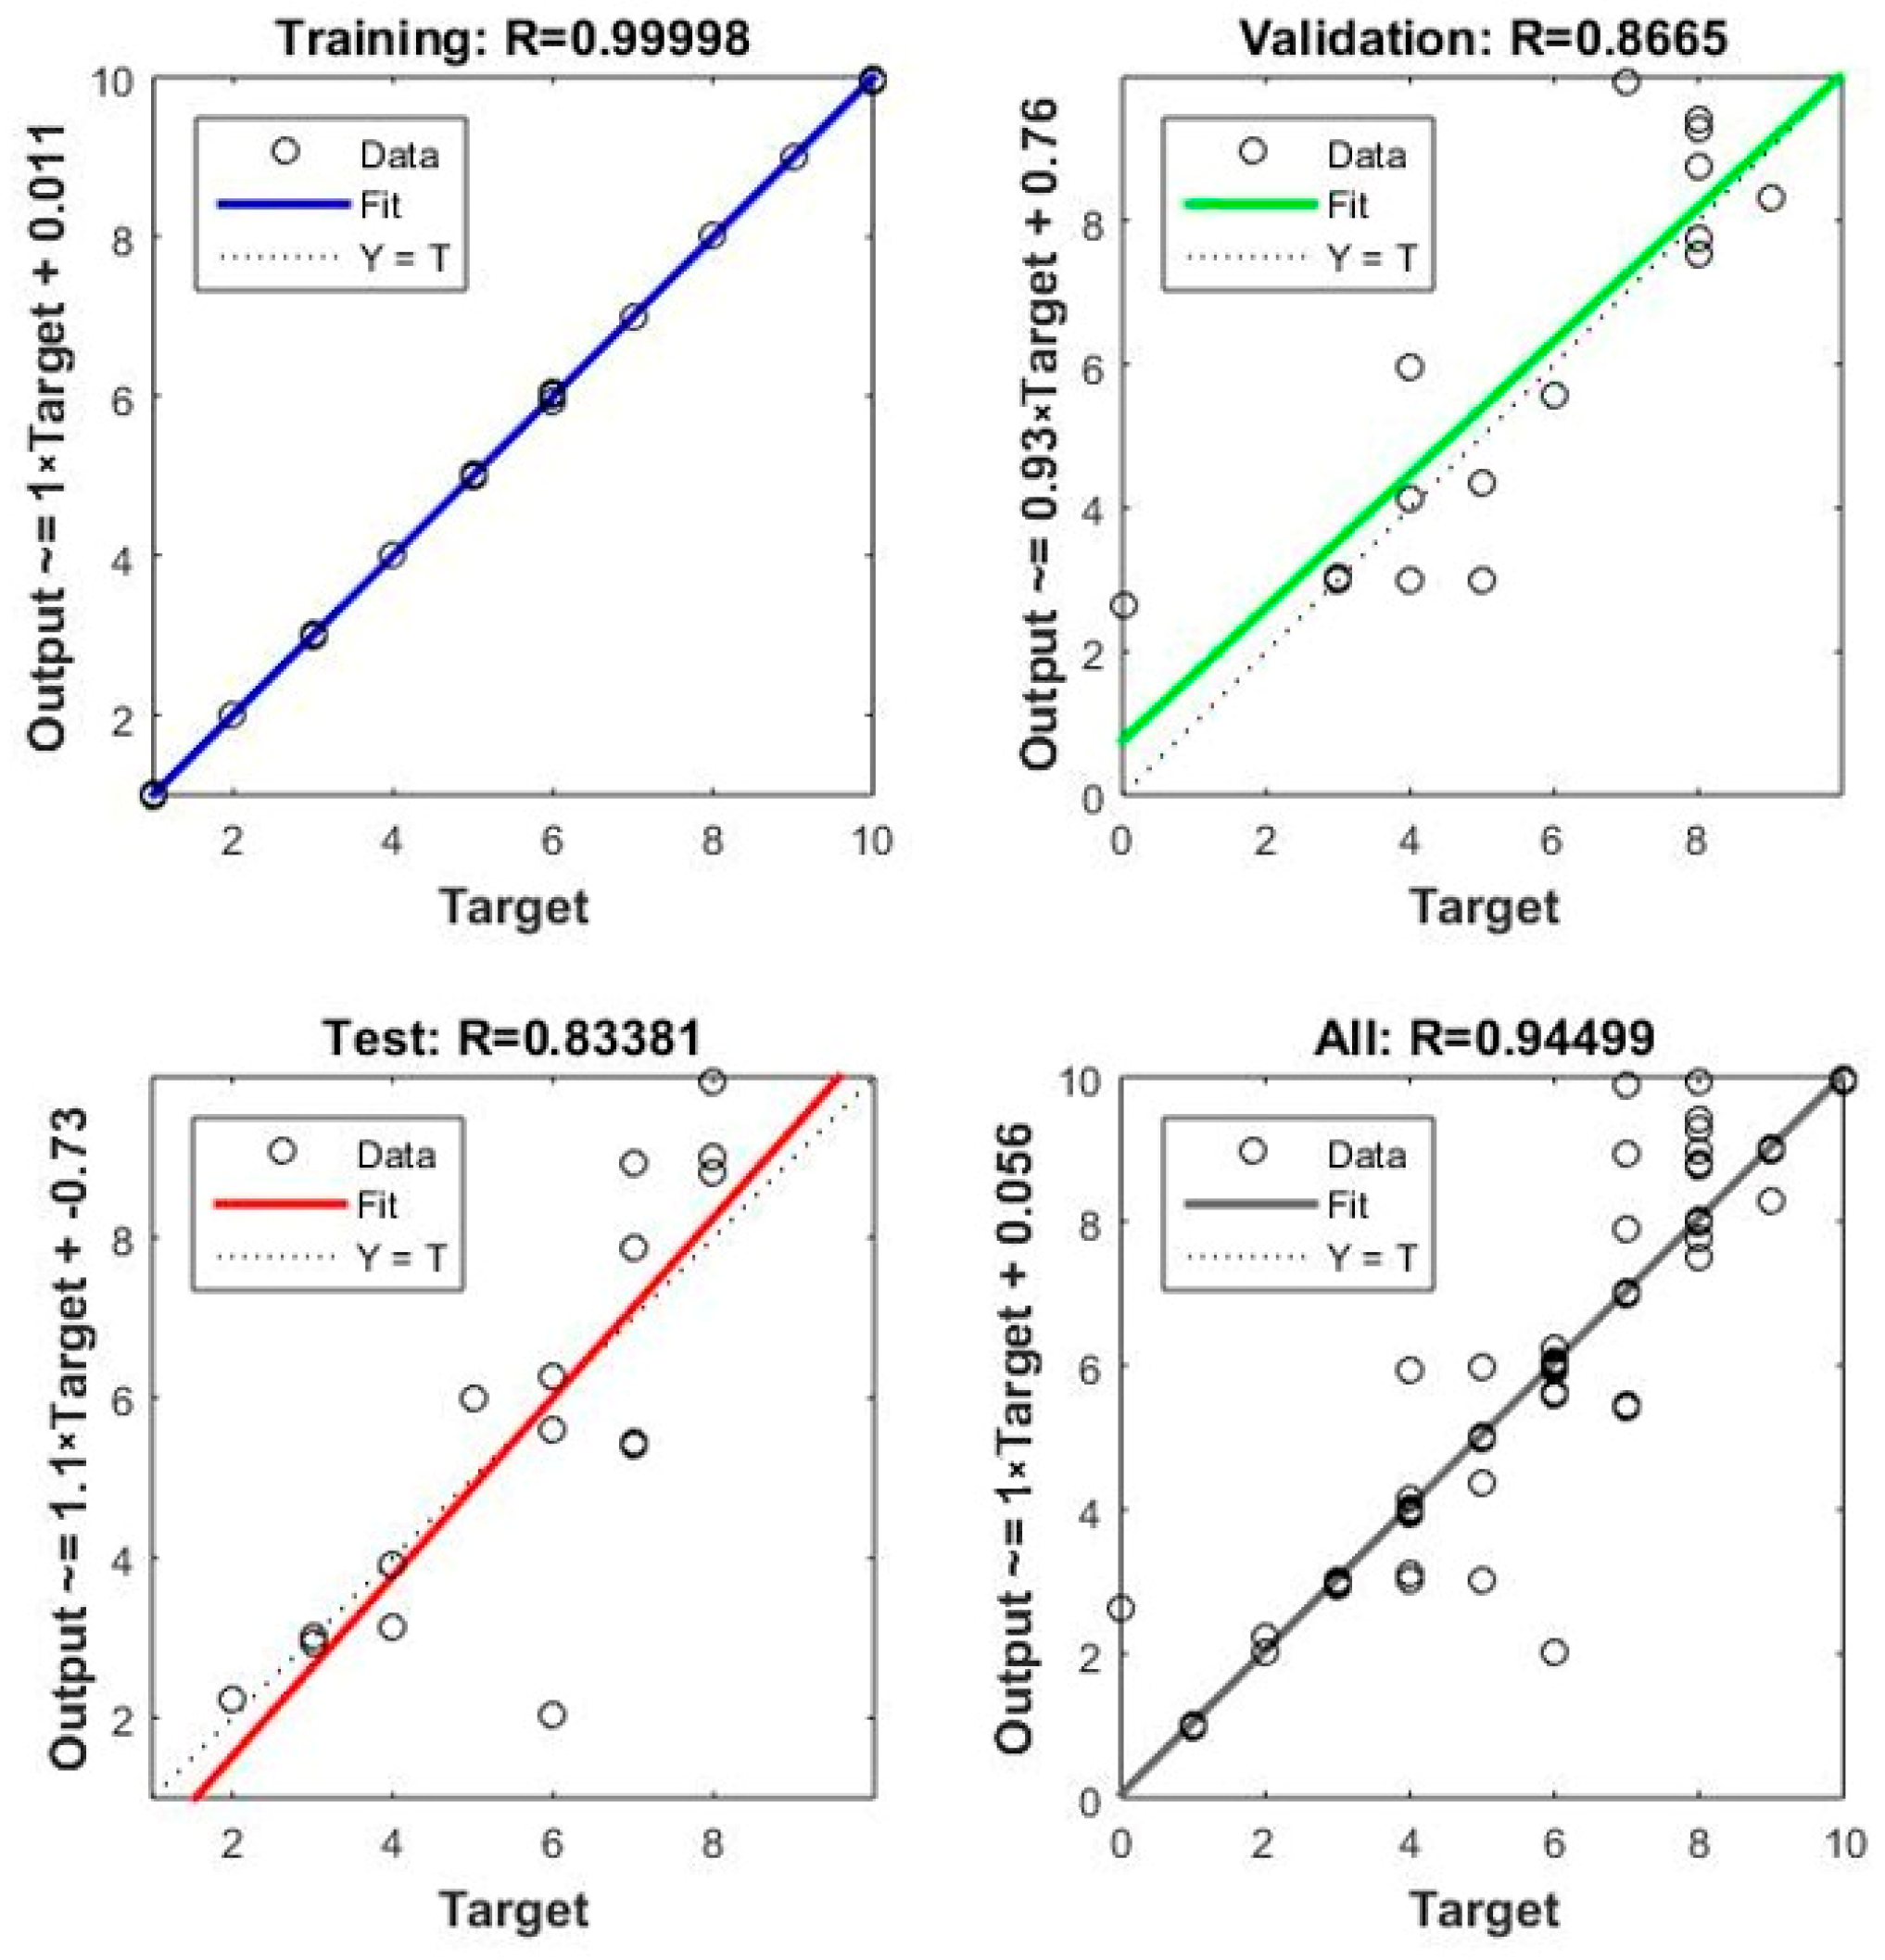
- Net1:
- ○
- During training, a very high fit score of R = 0.99998 was obtained, indicating excellent adaptation of the model to the training data.
- ○
- During validation, the result was R = 0.8665, meaning the model performed slightly worse on unseen data but still maintained a high level of fit.
- ○
- A result of R = 83,381 for the test set suggests potential overfitting to the training data, possibly leading to poorer generalization to new data.
- Net2:
- ○
- The training result was 0.50367, indicating a moderate fit of the model to the training data.
- ○
- During validation, the result was R = 0.77451, meaning the model performed better than Net1 on new data, but there are still areas for improvement.
- ○
- A result of R = 0.50028 for the test set suggests that the model struggles on new data, indicating a generalization problem.
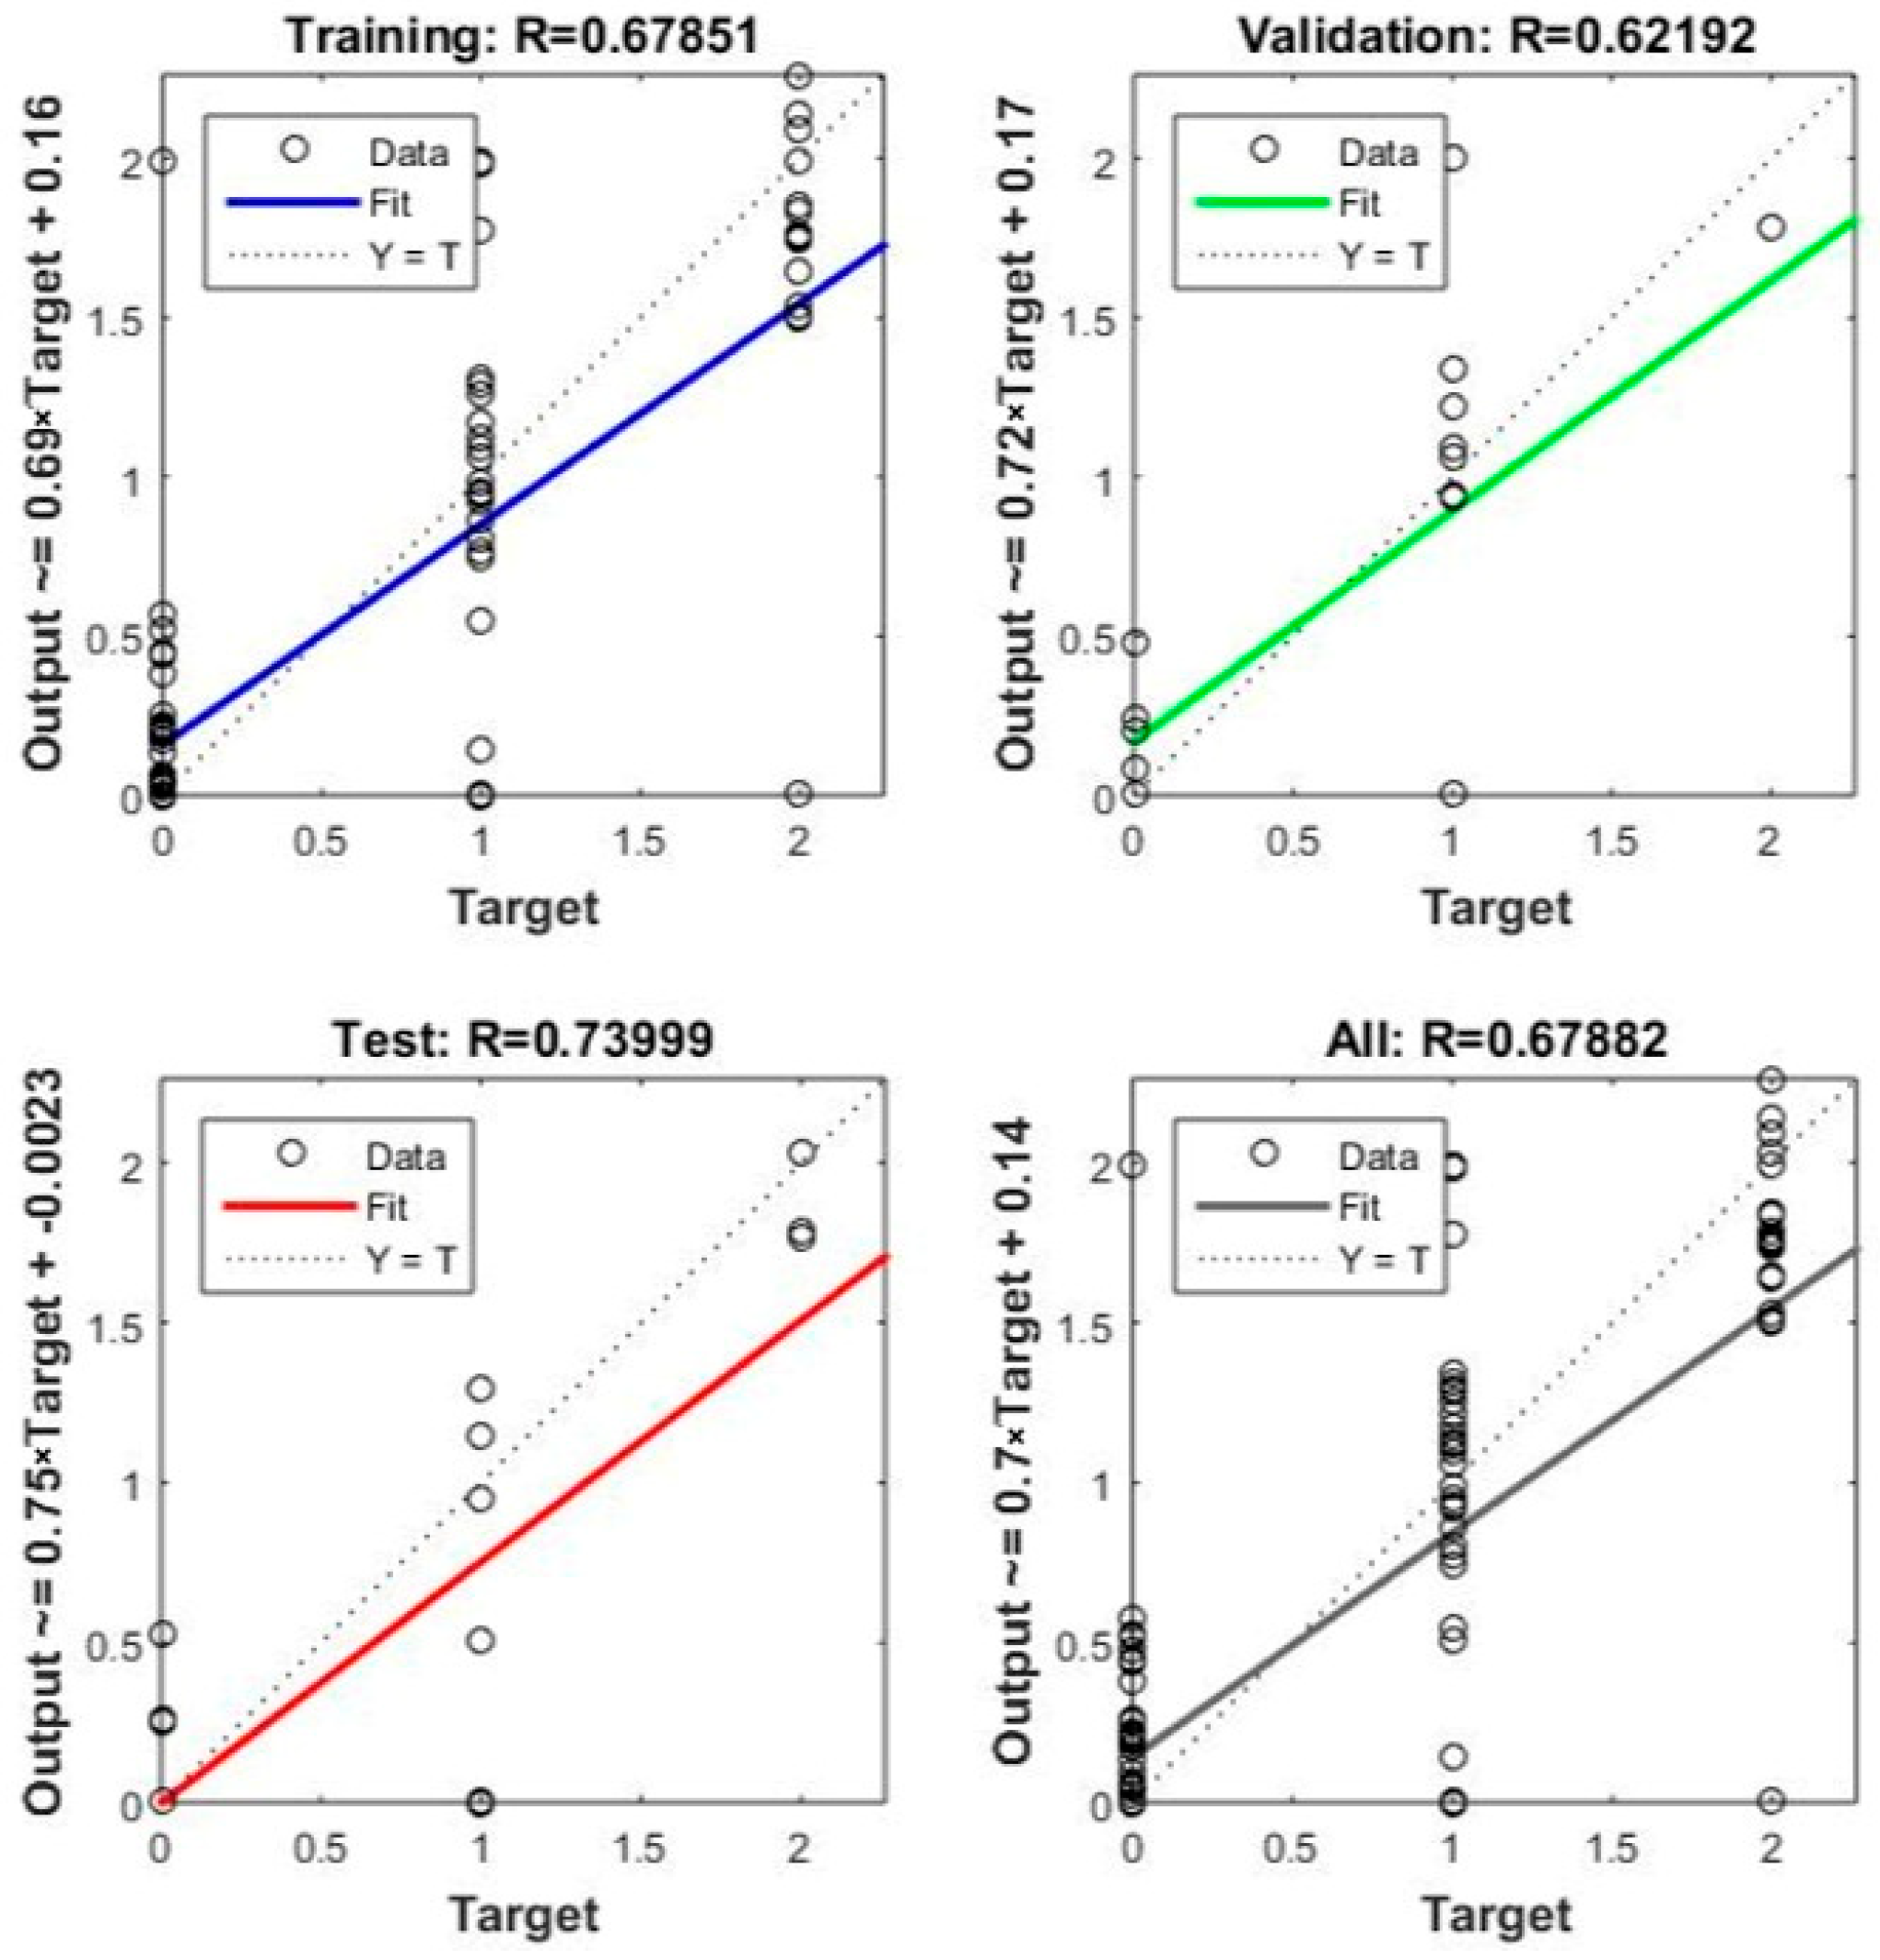
- Net3:
- ○
- The model achieved a training result of 0.67851, suggesting moderate fit.
- ○
- Validation result was 0.62192, indicating similar model performance on validation data as on training data.
- ○
- A test set result of R = 0.73999 is fairly good, suggesting the model has the ability to generalize to new data.
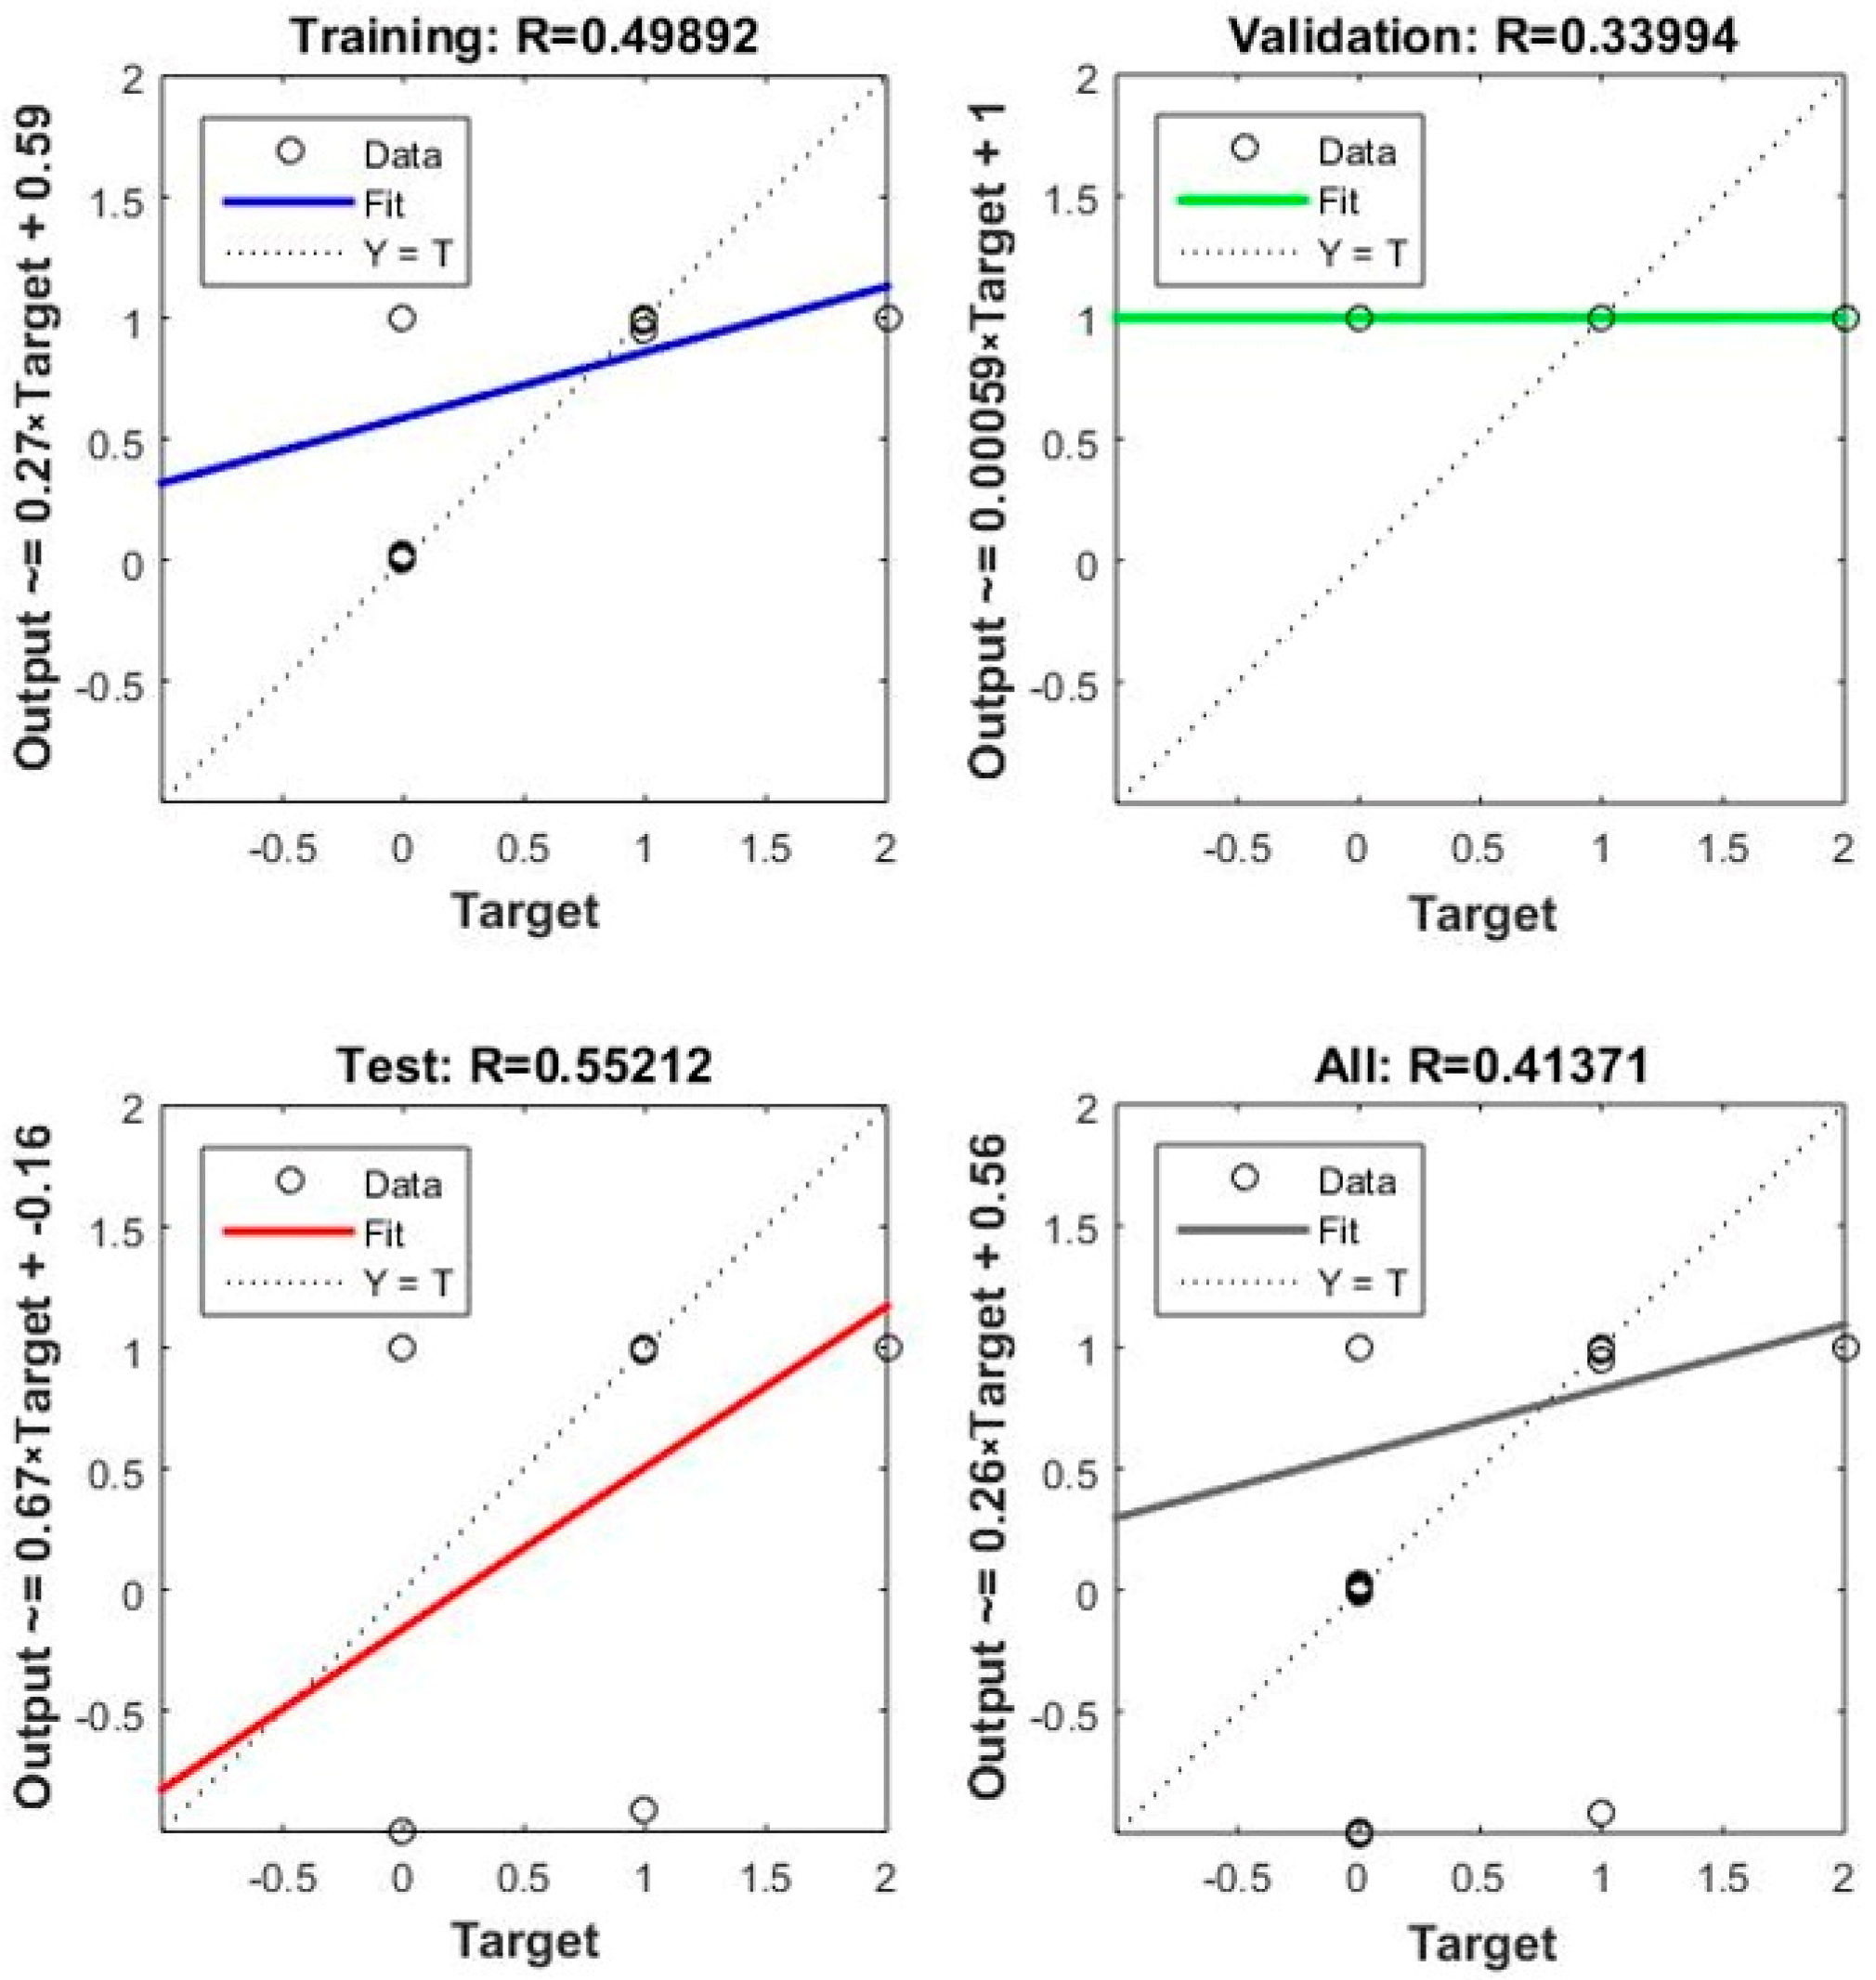
- Net4:
- ○
- The model achieved a training result of 0.49892, indicating moderate fit.
- ○
- The validation result was 0.33994, suggesting that the model does not perform well on new data, possibly due to overfitting on training data.
- ○
- A test set result of R = 0.55212 suggests moderate model generalization capability.
- Net5:
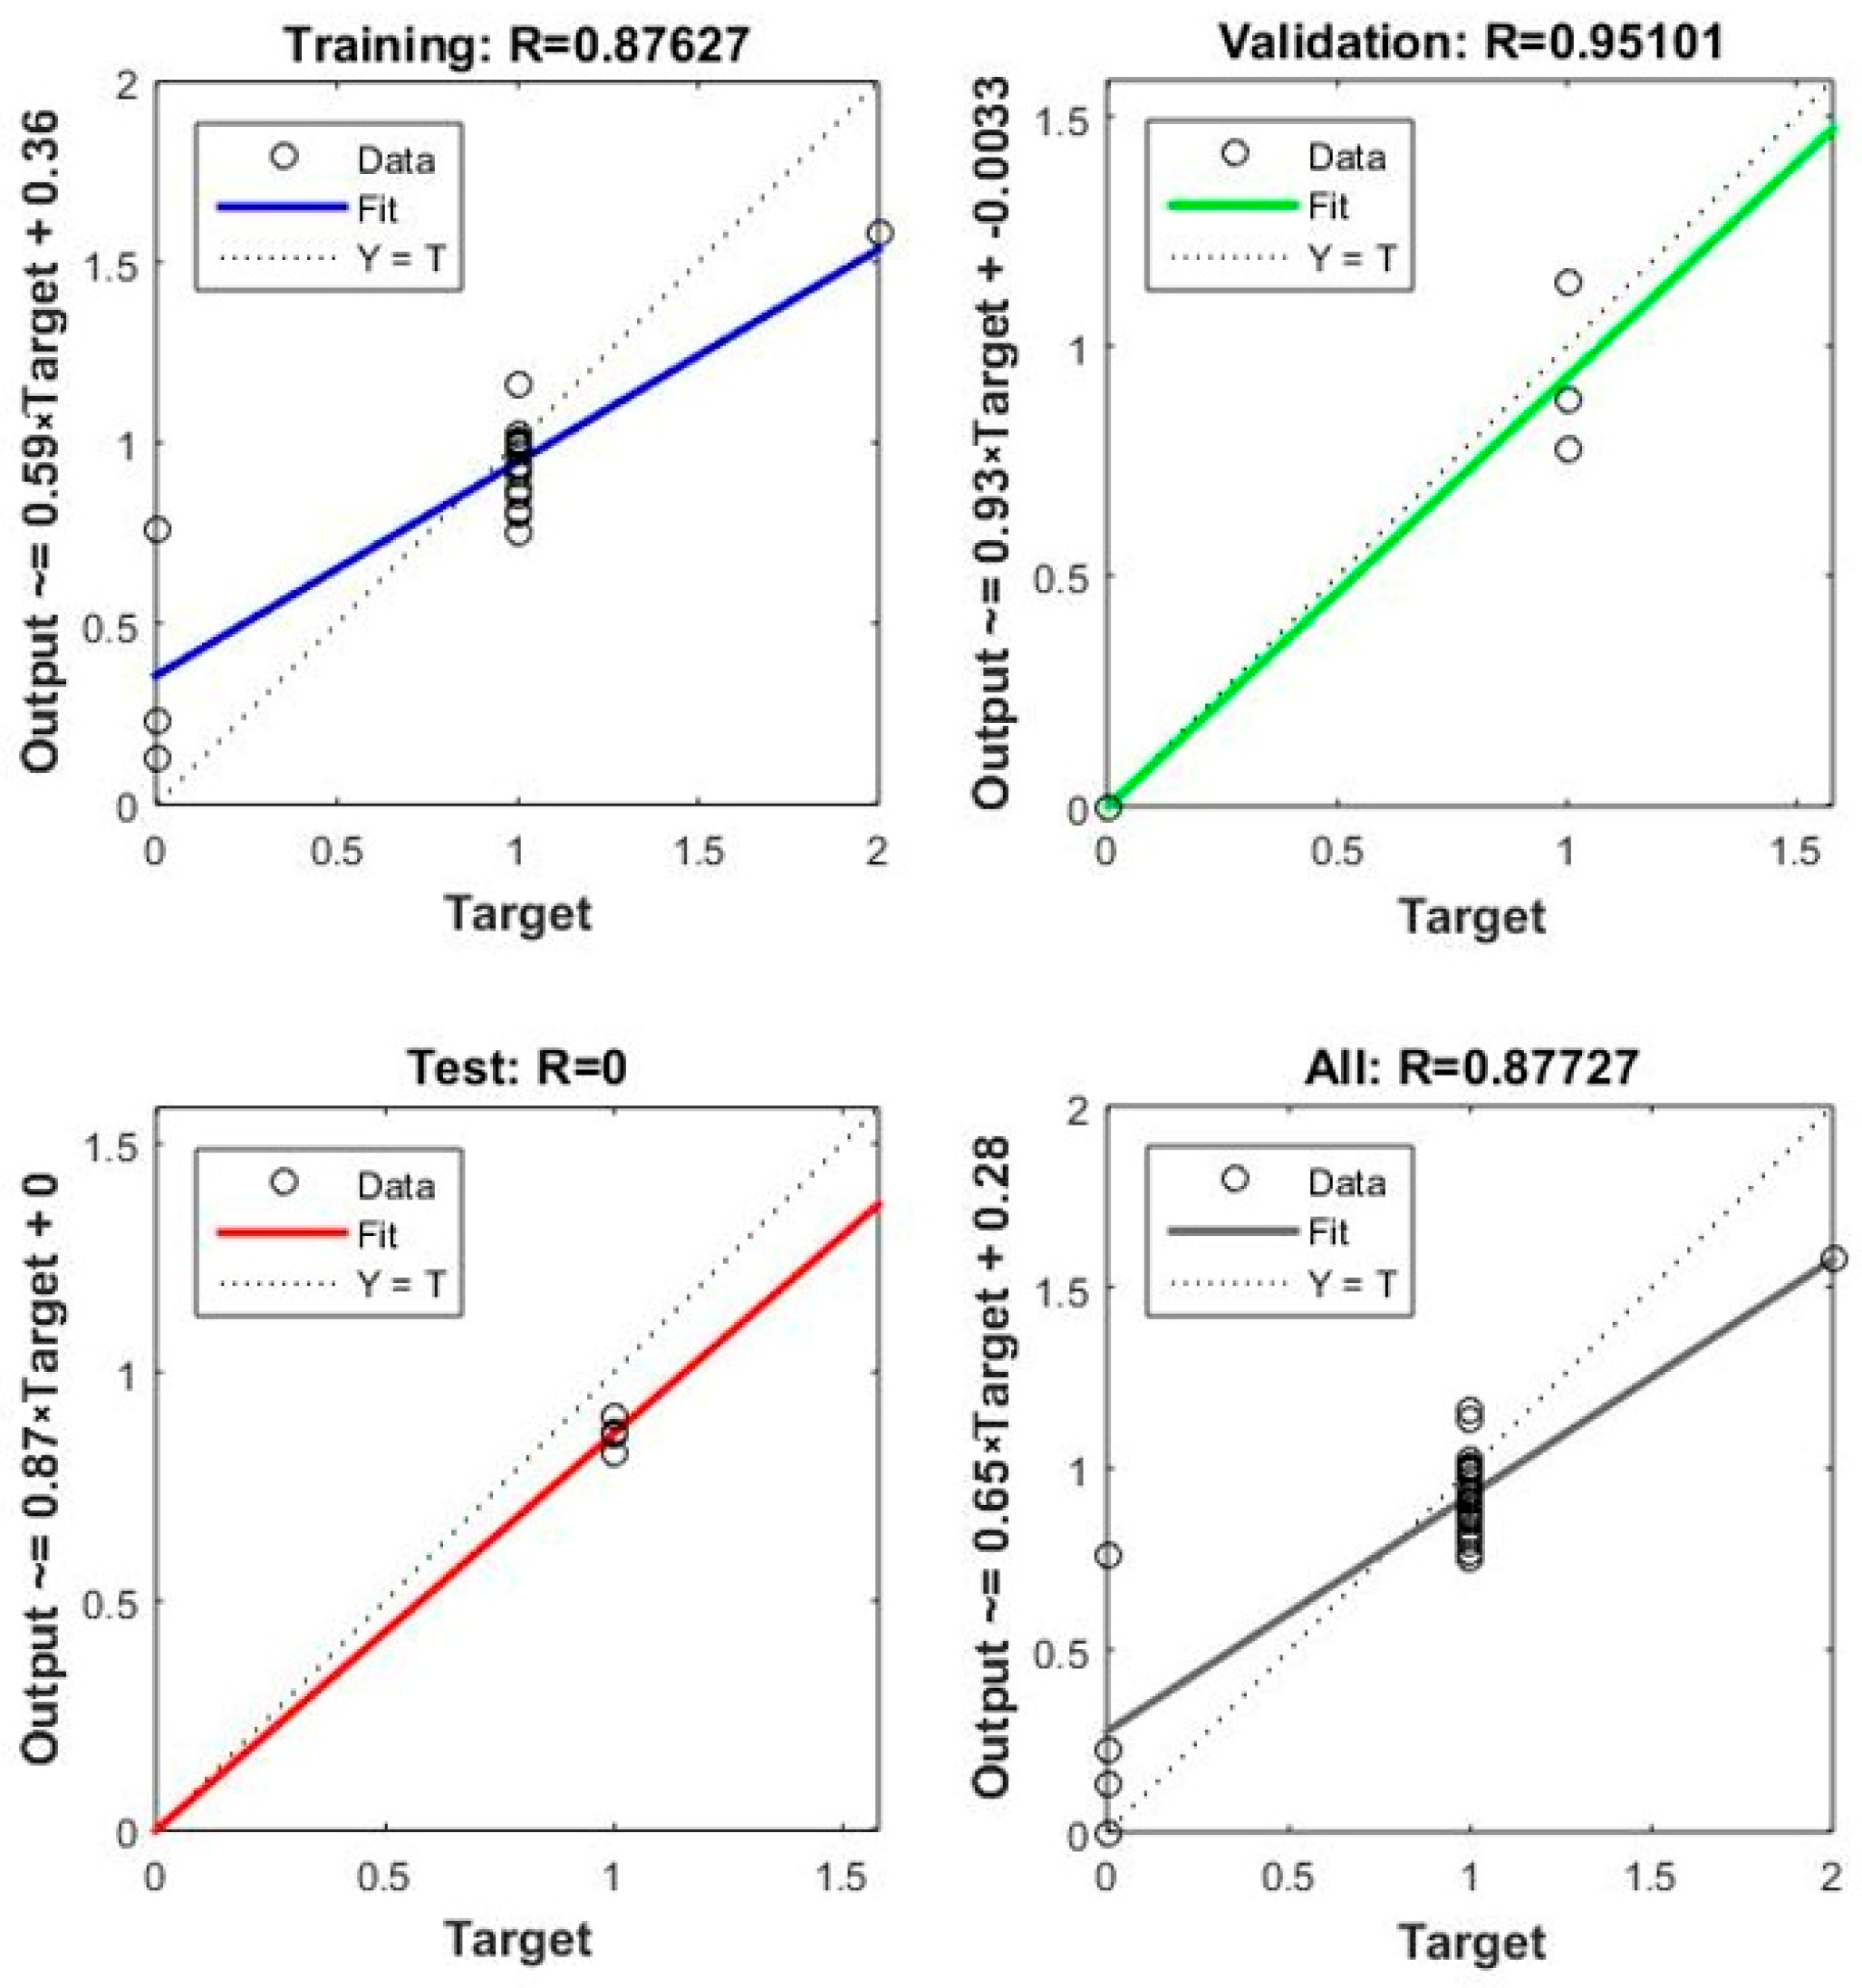
- ○
- The model achieved a very high training result of 0.87627, indicating a strong fit to the training data.
- ○
- The validation result was 0.95191, suggesting the model performs well on new data.
- ○
- However, a test set result of R = 0.0 is concerning and may indicate a problem with the model or the test data.
6. Choosing the Optimal Model
6.1. Analysis of Simulation Results
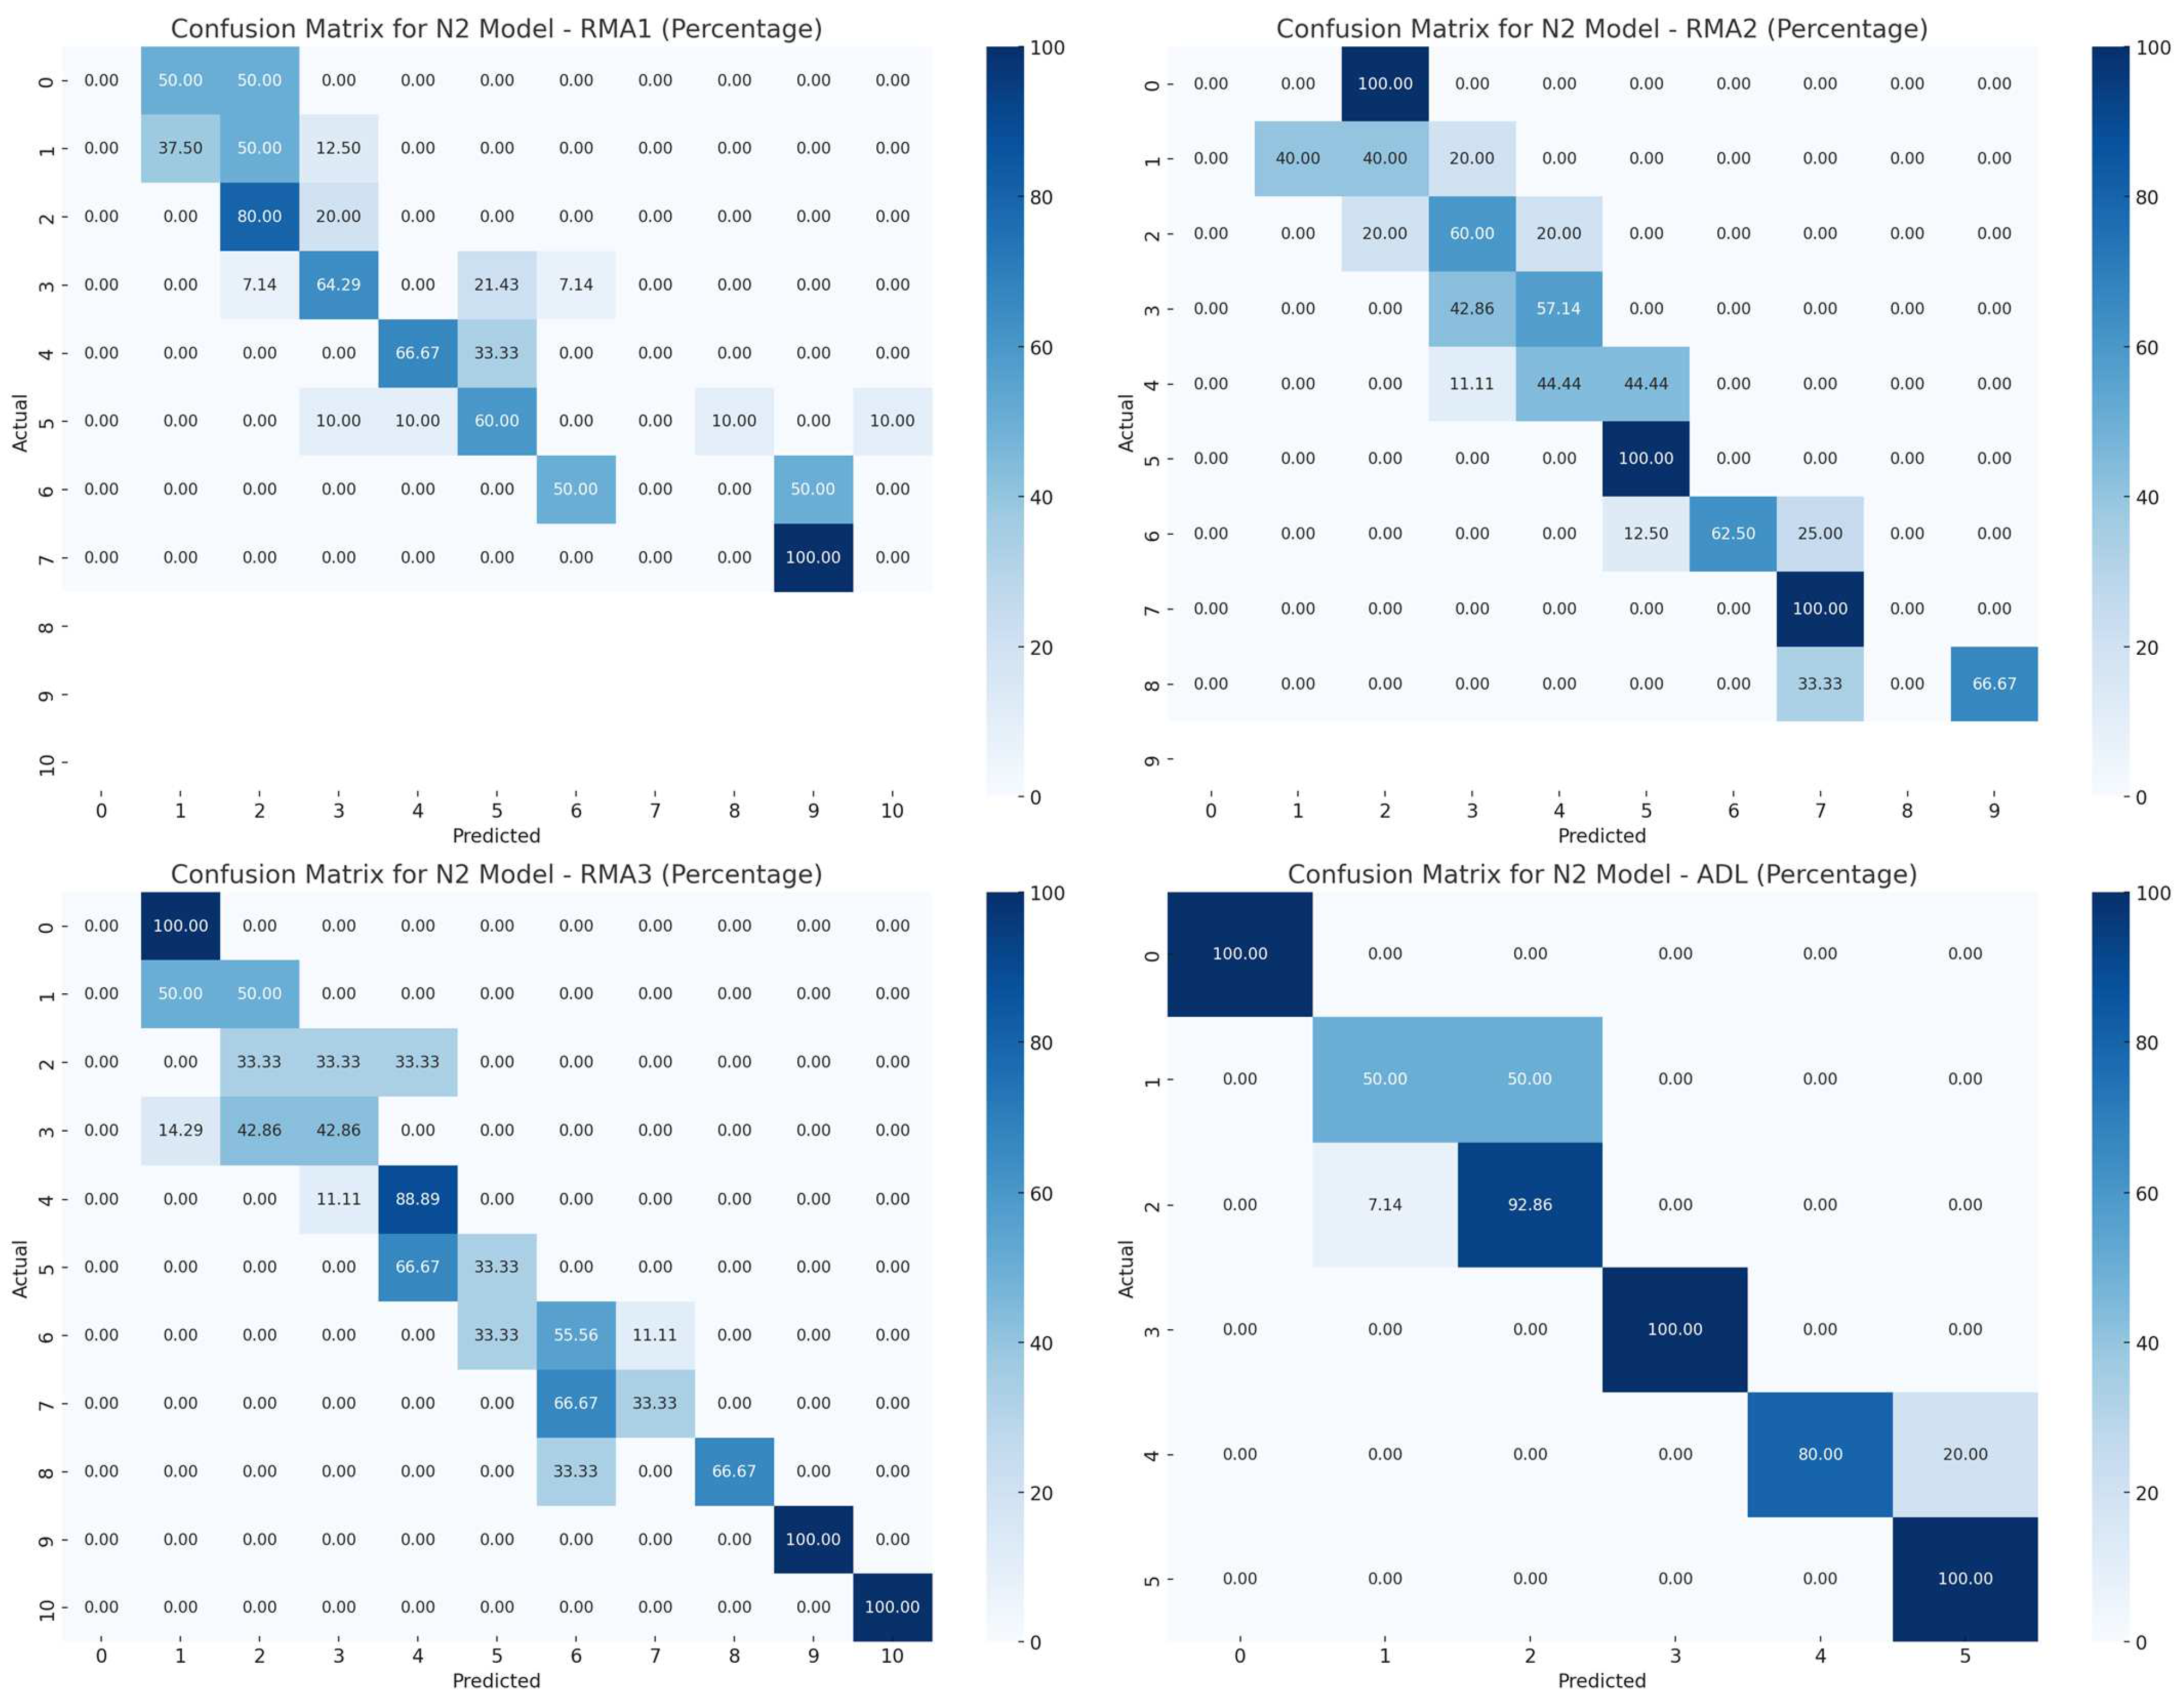
6.1.1. Net2
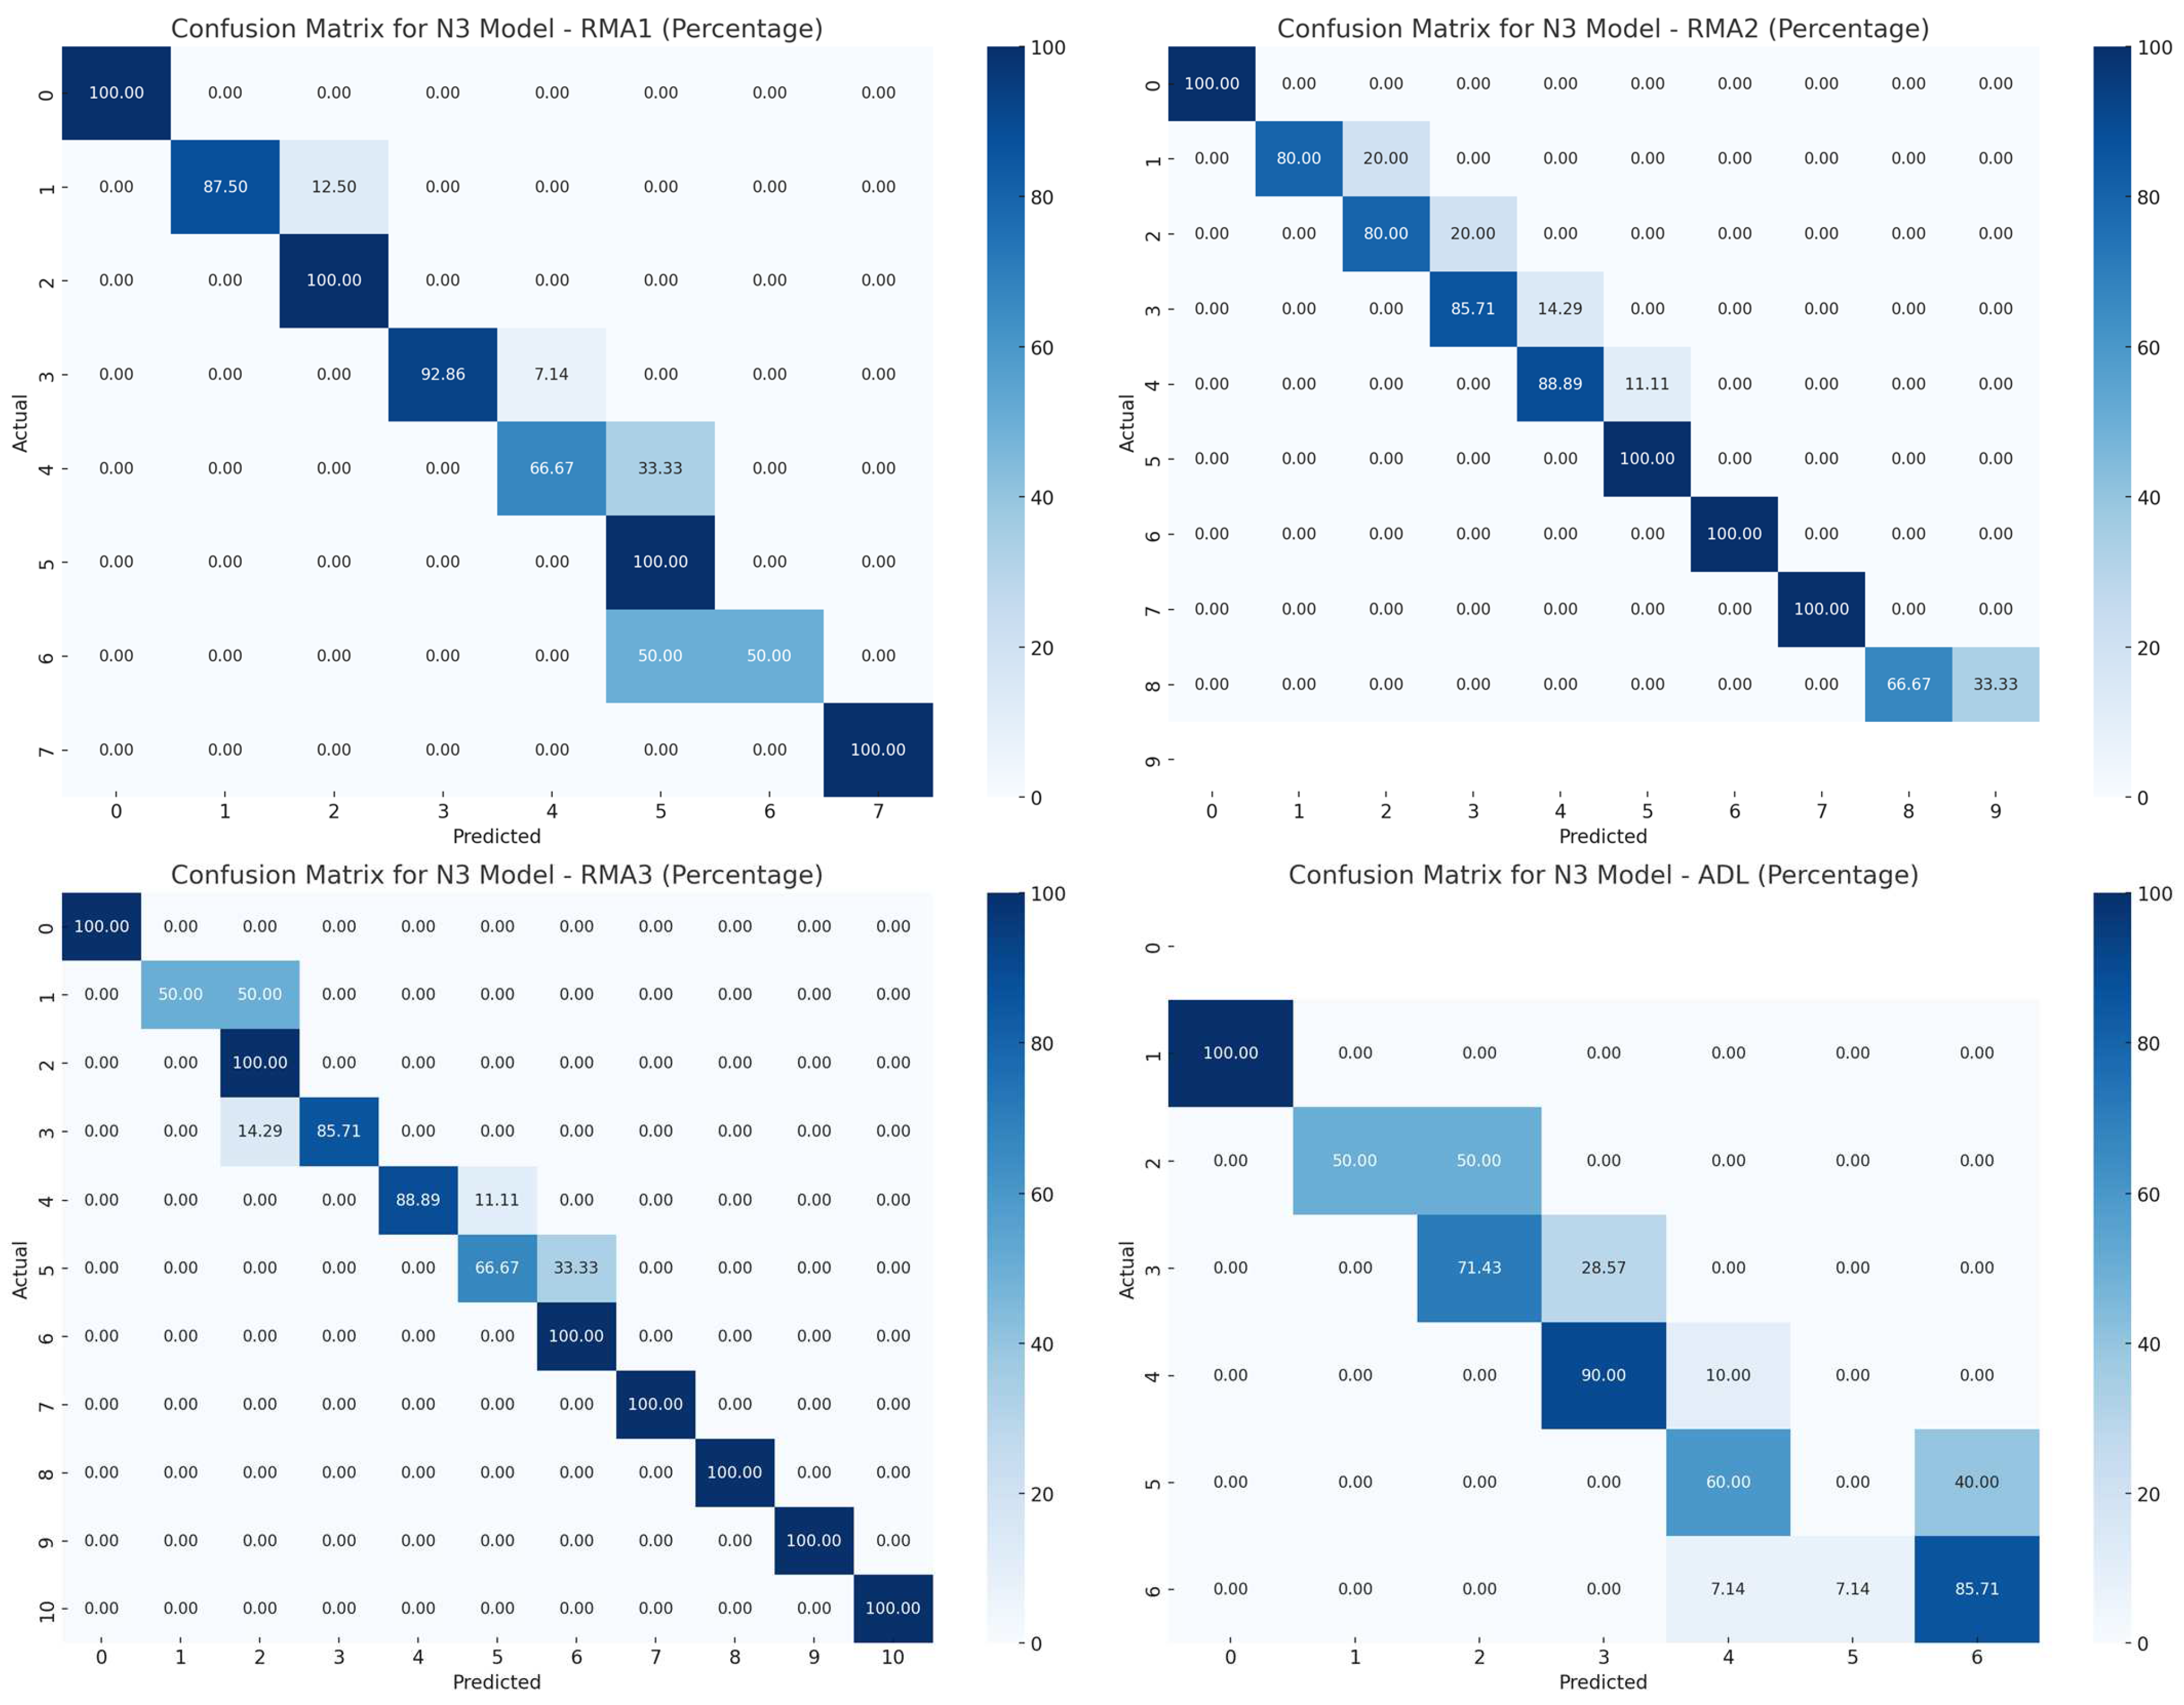
6.1.2. Net3
6.2. Summary of Simulation Results
7. Discussion
7.1. The Need for Dataset Expansion
7.2. Development and Optimization of Hybrid Models
7.3. Benefits and Limitations of AI Application in Rehabilitation
7.4. Benefits
- Personalization of Therapy: The implementation of AI can enable the customization of the rehabilitation process according to the individual needs of each patient. Based on a wide range of data, the intensity and type of exercises could be tailored to the patient’s specific characteristics and capabilities, which would enhance the effectiveness of the therapy.
- Monitoring Progress: The ability to automatically monitor patient progress would facilitate dynamic adjustment of the therapy plan. This would allow for quick responses to changes in the patient’s condition, resulting in more effective management of the rehabilitation process.
- Greater efficiency: Based on the patient’s data—such as age, gender, depression level, and assessed ability for independent functioning and mobility (parameters RMA and ADL) before rehabilitation—the therapist can utilize the developed model. Depending on the input data and recommended rehabilitation program, the model will determine if the chosen program will yield the expected benefits. If not, the model (in an extended version) will suggest a new rehabilitation program that offers a higher chance of recovery. The developed model can also be used by doctors to select the appropriate rehabilitation program after evaluating the patient’s motor skills. This approach will help reduce costs associated with ineffective rehabilitation treatments and prevent unnecessary extension of the rehabilitation process.
7.5. Limitations
- Data Quality: AI models require large amounts of high-quality data that must be representative of the target patient population. Lack of access to appropriate data or insufficient data quality can lead to incorrect predictions. Human error, such as patients’ reluctance to provide honest answers, points to the need for the implementation of appropriate methods and techniques for acquiring such data.
- Interpretation of Results: The results generated by AI models can be difficult for medical staff to understand, especially if they are not adequately explained. Therefore, it is crucial to develop tools and applications that are intuitive to use and easy to interpret, which will increase their acceptance and effectiveness in clinical practice. In addition to improving algorithms, it will also be necessary to properly train medical staff. An important aspect is ensuring algorithm transparency so that medical personnel can trust the decisions made by AI-based systems.
8. Conclusions
8.1. Summary of Main Findings
8.2. Practical Implications
Author Contributions
Funding
Institutional Review Board Statement
Informed Consent Statement
Data Availability Statement
Acknowledgments
Conflicts of Interest
References
- WHO. WHO Reveals Leading Causes of Death and Disability Worldwide: 2000–2019. Available online: https://www.who.int/news/item/09-12-2020-who-reveals-leading-causes-of-death-and-disability-worldwide-2000-2019 (accessed on 11 October 2024).
- Keslake, J.; Geary, M.; Kennedy, C.R.; Kirkham, F.J.; Whitney, A.; Goodwin, F.C.; Murugan, V.; Thomas, N.H. P238 A Comparison of Modified Rankin Scale with Rivermead Motor Assessment for Outcome in Paediatric Stroke. Eur. J. Paediatr. Neurol. 2009, 13, S95. [Google Scholar] [CrossRef]
- Adams, S.A. A Study to Test the Scalability of the Rivermead Motor Assessment with Acute Stroke Patients. Physiotherapy 1993, 79, 506. [Google Scholar] [CrossRef]
- Suppiej, A.; Tessari, L.; Fasolo, A.; Casarotto, M.; Borghini, C.; Gregori, D.; Mercuriali, E. The Development of Checklists and Reference Charts for Activities of Daily Living of Normal Developing Children. Eur. J. Paediatr. Neurol. 2024, 53, 88–94. [Google Scholar] [CrossRef] [PubMed]
- Sun, W.; Yang, Y.; Ding, L.; Wang, L. Association between Cognitive Function and Depressive Symptoms in Chinese Older Adults: The Mediating Role of Activities of Daily Living. Geriatr. Nurs. 2024, 60, 258–264. [Google Scholar] [CrossRef]
- Ikeda, T.; Cooray, U.; Matsugaki, R.; Suzuki, Y.; Takagi, M.; Muramatsu, K.; Fushimi, K.; Murakami, M.; Osaka, K.; Matsuda, S. Associations of Hypothetical Early Intensive in-Hospital Rehabilitation with Activities of Daily Living after Hip Fracture Surgery in Patients with and without Dementia: Emulating a Randomized Controlled Trial Using Medical Claims Data. J. Clin. Epidemiol. 2024, 176, 111550. [Google Scholar] [CrossRef]
- Yoshimura, Y.; Shimazu, S.; Shiraishi, A.; Wakabayashi, H.; Nagano, F.; Matsumoto, A.; Kido, Y.; Bise, T.; Kuzuhara, A.; Hamada, T.; et al. Triad of Rehabilitation, Nutrition Support, and Oral Management Improves Activities of Daily Living and Muscle Health in Hospitalized Patients after Stroke. Clin. Nutr. ESPEN 2024, 63, 837–844. [Google Scholar] [CrossRef]
- Ishida, S.; Harashima, H.; Miyano, S.; Kawama, K. Effect of Rehabilitation Motivation on Improving Activities of Daily Living in Subacute Stroke Patients. J. Stroke Cerebrovasc. Dis. 2023, 32, 107385. [Google Scholar] [CrossRef]
- Nisar, H.; Annamraju, S.; Deka, S.A.; Horowitz, A.; Stipanović, D.M. Robotic Mirror Therapy for Stroke Rehabilitation through Virtual Activities of Daily Living. Comput. Struct. Biotechnol. J. 2024, 24, 126–135. [Google Scholar] [CrossRef]
- García-Rudolph, A.; Wright, M.A.; Murillo, N.; Opisso, E.; Medina, J. Tele-Rehabilitation on Independence in Activities of Daily Living after Stroke: A Matched Case-Control Study. J. Stroke Cerebrovasc. Dis. 2023, 32, 107267. [Google Scholar] [CrossRef]
- Thielman, G.T.; Dean, C.M.; Gentile, A.M. Rehabilitation of Reaching after Stroke: Task-Related Training versus Progressive Resistive Exercise. Arch. Phys. Med. Rehabil. 2004, 85, 1613–1618. [Google Scholar] [CrossRef]
- Yanartaş, G.; Karakoyun, A. Isokinetic Analysis of Trunk Muscles in Stroke Patients and Its Association with Functional Parameters. J. Stroke Cerebrovasc. Dis. 2020, 29, 105329. [Google Scholar] [CrossRef] [PubMed]
- Gor-García-Fogeda, M.D.; Molina-Rueda, F.; Cuesta-Gómez, A.; Carratalá-Tejada, M.; Alguacil-Diego, I.M.; Miangolarra-Page, J.C. Scales to Assess Gross Motor Function in Stroke Patients: A Systematic Review. Arch. Phys. Med. Rehabil. 2014, 95, 1174–1183. [Google Scholar] [CrossRef] [PubMed]
- Zhu, G.C.; Chen, K.M.; Belcastro, F. Comparing the Effects of Different Acupoint-Stimulating Therapies in Mitigating Post-Stroke Spasticity and Motor Dysfunction in Older Stroke Survivors: A Network Meta-Analysis of Randomized Trials. Maturitas 2024, 187, 108040. [Google Scholar] [CrossRef] [PubMed]
- Roorda, L.D.; Green, J.R.; Houwink, A.; Bagley, P.J.; Smith, J.; Molenaar, I.W.; Geurts, A.C. The Rivermead Mobility Index Allows Valid Comparisons Between Subgroups of Patients Undergoing Rehabilitation after Stroke Who Differ with Respect to Age, Sex, or Side of Lesion. Arch. Phys. Med. Rehabil. 2012, 93, 1086–1090. [Google Scholar] [CrossRef]
- Rahman, F.B.A.; Jones, A.Y.M.; Pang, M.Y.C. Oxygen Consumption and Peak Heart Rate in Stroke Patients during the Completion of the Modified Rivermead Mobility Index (MRMI). Hong Kong Physiother. J. 2012, 30, 76–82. [Google Scholar] [CrossRef]
- Roorda, L.D.; Green, J.R.; Houwink, A.; Bagley, P.J.; Smith, J.; Molenaar, I.W.; Geurts, A.C. Item Hierarchy—Based Analysis of the Rivermead Mobility Index Resulted in Improved Interpretation and Enabled Faster Scoring in Patients Undergoing Rehabilitation after Stroke. Arch. Phys. Med. Rehabil. 2012, 93, 1091–1096. [Google Scholar] [CrossRef][Green Version]
- Johnson, L.; Selfe, J. Measurement of Mobility Following Stroke: A Comparison of the Modified Rivermead Mobility Index and the Motor Assessment Scale. Physiotherapy 2004, 90, 132–138. [Google Scholar] [CrossRef]
- Yang, F.; Guo, X. Research on Rehabilitation Effect Prediction for Patients with SCI Based on Machine Learning. World Neurosurg. 2022, 158, e662–e674. [Google Scholar] [CrossRef]
- Salvalaggio, S.; Gianola, S.; Andò, M.; Cacciante, L.; Castellini, G.; Lando, A.; Ossola, G.; Pregnolato, G.; Rutkowski, S.; Vedovato, A.; et al. Predictive Factors and Dose–Response Effect of Rehabilitation for Upper Limb Induced Recovery after Stroke: Systematic Review with Proportional Meta-Analyses. Physiotherapy 2024, 125, 101417. [Google Scholar] [CrossRef]
- Bo, W.; Cavuoto, L.; Langan, J.; Subryan, H.; Bhattacharjya, S.; Huang, M.C.; Xu, W. A Progressive Prediction Model towards Home-Based Stroke Rehabilitation Programs. Smart Health 2022, 23, 100239. [Google Scholar] [CrossRef]
- Gutiérrez-Panchana, T.; Maldonado-Diaz, M.; Vargas, P. Early Prediction of Functional Mobility Severity after Stroke: Two Key Milestones. J. Neurol. Sci. 2024, 466, 123278. [Google Scholar] [CrossRef]
- Gath, C.F.; Gianella, M.G.; Bonamico, L.; Olmos, L.; Russo, M.J. Prediction of Balance after Inpatient Rehabilitation in Stroke Subjects with Severe Balance Alterations at the Admission. J. Stroke Cerebrovasc. Dis. 2021, 30, 105627. [Google Scholar] [CrossRef] [PubMed]
- Demuth, H.; Mark, B. Neural Network Toolbox for Use with MATLAB—User Guide. MathWorks, 2023. Available online: https://nl.mathworks.com/help/releases/R2023a/matlab/index.html?s_tid=hc_panel (accessed on 10 October 2024).
- Afek, N.; Korelacji, W. R-Pearsona—Interpretacja. Available online: https://predictivesolutions.pl/wspolczynnik-korelacji-r-pearsona (accessed on 2 October 2024).
- Kuźnar, M.; Lorenc, A. A Method of Predicting Wear and Damage of Pantograph Sliding Strips Based on Artificial Neural Networks. Materials 2022, 15, 98. [Google Scholar] [CrossRef] [PubMed]
- Lorenc, A.; Kuźnar, M. An Intelligent System to Predict Risk and Costs of Cargo Thefts in Road Transport. Int. J. Eng. Technol. Innov. 2018, 8, 284–293. [Google Scholar]
- Lorenc, A.; Kuźnar, M. The Most Common Type of Disruption in the Supply Chain—Evaluation Based on the Method Using Artificial Neural Networks. Int. J. Shipp. Transp. Logist. 2021, 13, 1–24. [Google Scholar] [CrossRef]




| No. | Age | Gender (1-Woman; 2-Men) | Depression (0–15) | RMA 1 * (0–13) | RMA 2 * (0–10) | RMA 3 * (0–15) | ADL * (0–6) |
|---|---|---|---|---|---|---|---|
| 1 | 66 | 1 | 8 | 5 | 5 | 1 | 2 |
| 2 | 71 | 1 | 7 | 6 | 4 | 3 | 3 |
| 3 | 68 | 2 | 8 | 5 | 6 | 2 | 3 |
| 4 | 74 | 1 | 9 | 3 | 4 | 2 | 2 |
| 5 | 54 | 2 | 3 | 7 | 6 | 2 | 3 |
| 6 | 78 | 2 | 6 | 4 | 3 | 0 | 2 |
| 7 | 66 | 1 | 8 | 3 | 3 | 1 | 2 |
| 8 | 67 | 1 | 4 | 9 | 10 | 8 | 4 |
| 9 | 59 | 1 | 5 | 6 | 5 | 3 | 3 |
| 10 | 63 | 1 | 6 | 4 | 4 | 6 | 3 |
| Network Name | Data Structure (Target Structure) | Number of Layers | Neurons in Layers and Transfer Functions |
|---|---|---|---|
| Net1 | 1 | 3 | Layer 1: 7 (tansig), Layer 2: 4 (tansig), Layer 3: 4 (tansig) |
| Net2 | 2 | 4 | Layer 1: 7 (tansig), Layer 2: 7 (tansig), Layer 3: 7 (tansig), Layer 4: 4 (purelin) |
| Net3 | 2 | 3 | Layer 1: 7 (tansig), Layer 2: 4 (tansig), Layer 3: 4 (tansig) |
| Net4 | 3 | 3 | Layer 1: 7 (tansig), Layer 2: 7 (tansig), Layer 3: 3 (tansig) |
| Net5 | 4 | 4 | Layer 1: 7 (tansig), Layer 2: 7 (tansig), Layer 3: 7 (tansig), Layer 4: 1 (purelin) |
| RMA 1 Difference | RMA2 Difference | RMA3 Difference | ||||
|---|---|---|---|---|---|---|
| Female | Male | Female | Male | Female | Male | |
| Mean | 0.964286 | 0.888889 | 0.857143 | 0.611111 | 0.50000 | 1 |
| Variance | 0.850529 | 0.810458 | 0.645503 | 0.486928 | 0.481481 | 0.470588 |
| Observations | 28 | 18 | 28 | 18 | 28 | 18 |
| Degrees of freedom (df) | 27 | 17 | 27 | 17 | 27 | 17 |
| F-statistic (F) | 1.049443 | 1.325663 | 1.023148 | |||
| P(F ≤ f) one-sided | 0.469968 | 0.275796 | 0.492730 | |||
| One-sided F-test | 2.166593 | 2.166593 | 2.166593 | |||
| ADL Difference | ||
|---|---|---|
| Female | Male | |
| Mean | 0.964286 | 0.833333 |
| Variance | 0.257937 | 0.147059 |
| Observations | 28 | 18 |
| Degrees of freedom (df) | 27 | 17 |
| F-statistic (F) | 1.753968 | |
| P(F ≤ f) one-sided | 0.114754 | |
| One-sided F-test | 2.166593 | |
| RMA1 Difference | RMA2 Difference | RMA3 Difference | ADL Difference | Depression | Age | |
|---|---|---|---|---|---|---|
| RMA1 Difference | 1 | |||||
| RMA2 Difference | 0.555 | 1 | ||||
| RMA3 Difference | 0.104 | −0.214 | 1 | |||
| ADL Difference | −0.120 | −0.373 | 0.184 | 1 | ||
| Depression | −0.003 | 0.007 | −0.212 | 0.165 | 1 | |
| Age | −0.342 | −0.061 | −0.167 | −0.028 | 0.287 | 1 |
| Gender | −0.041 | −0.159 | 0.340 | −0.140 | −0.087 | 0.079 |
| RMA1 | RMA2 | RMA3 | ADL | |
|---|---|---|---|---|
| Correct result | 44.4 | 44.4 | 38.9 | 94.4 |
| Incorrect result | 55.6 | 55.6 | 61.1 | 5.6 |
| All cases | 100 | 100 | 100 | 100 |
| RMA1 | RMA2 | RMA3 | ADL | |
|---|---|---|---|---|
| Correct result | 83.3 | 83.3 | 94.4 | 44.4 |
| Incorrect result | 16.7 | 16.7 | 5.6 | 55.6 |
| All cases | 100 | 100 | 100 | 100 |
| Model | Feature | Accuracy | Precision | Recall | F1-Score | Cohen’s Kappa |
|---|---|---|---|---|---|---|
| N1 | RMA1 | 67.4% | 71.1% | 73.1% | 64.4% | 67.4% |
| N1 | RMA2 | 58.7% | 55.9% | 62.8% | 54.4% | 58.7% |
| N1 | RMA3 | 58.7% | 57.5% | 65.9% | 57.3% | 58.7% |
| N1 | ADL | 71.7% | 57.9% | 45.0% | 45.0% | 71.7% |
| N2 | RMA1 | 54.3% | 33.3% | 32.6% | 31.7% | 54.3% |
| N2 | RMA2 | 50.0% | 40.1% | 41.0% | 36.8% | 50.0% |
| N2 | RMA3 | 54.3% | 56.3% | 54.9% | 54.0% | 54.3% |
| N2 | ADL | 93.5% | 89.4% | 87.1% | 88.0% | 93.5% |
| N3 | RMA1 | 91.3% | 91.7% | 87.1% | 88.1% | 91.3% |
| N3 | RMA2 | 89.1% | 84.0% | 80.1% | 81.6% | 89.1% |
| N3 | RMA3 | 91.3% | 92.4% | 90.1% | 90.0% | 91.3% |
| N3 | ADL | 39.1% | 20.8% | 24.9% | 20.6% | 39.1% |
| N4 | RMA1 | 0.0% | 0.0% | 0.0% | 0.0% | 0.0% |
| N4 | RMA2 | 0.0% | 0.0% | 0.0% | 0.0% | 0.0% |
| N4 | RMA3 | 4.3% | 0.4% | 9.1% | 0.8% | 4.3% |
| N4 | ADL | 87.0% | 66.2% | 76.0% | 69.6% | 87.0% |
| N5 | RMA1 | 39.1% | 36.8% | 31.4% | 31.1% | 39.1% |
| N5 | RMA2 | 60.9% | 57.1% | 66.3% | 57.9% | 60.9% |
| N5 | RMA3 | 39.1% | 32.0% | 33.9% | 31.7% | 39.1% |
| N5 | ADL | 0.0% | 0.0% | 0.0% | 0.0% | 0.0% |
Disclaimer/Publisher’s Note: The statements, opinions and data contained in all publications are solely those of the individual author(s) and contributor(s) and not of MDPI and/or the editor(s). MDPI and/or the editor(s) disclaim responsibility for any injury to people or property resulting from any ideas, methods, instructions or products referred to in the content. |
© 2024 by the authors. Licensee MDPI, Basel, Switzerland. This article is an open access article distributed under the terms and conditions of the Creative Commons Attribution (CC BY) license (https://creativecommons.org/licenses/by/4.0/).
Share and Cite
Kuźnar, M.; Lorenc, A. The Potential of Artificial Intelligence in Predicting Post-Stroke Rehabilitation Outcomes: Statistical Analysis Considering Rivermead Motor Assessment and Activities of Daily Living Indicators and Selected Demographic Variables. Appl. Sci. 2024, 14, 11806. https://doi.org/10.3390/app142411806
Kuźnar M, Lorenc A. The Potential of Artificial Intelligence in Predicting Post-Stroke Rehabilitation Outcomes: Statistical Analysis Considering Rivermead Motor Assessment and Activities of Daily Living Indicators and Selected Demographic Variables. Applied Sciences. 2024; 14(24):11806. https://doi.org/10.3390/app142411806
Chicago/Turabian StyleKuźnar, Małgorzata, and Augustyn Lorenc. 2024. "The Potential of Artificial Intelligence in Predicting Post-Stroke Rehabilitation Outcomes: Statistical Analysis Considering Rivermead Motor Assessment and Activities of Daily Living Indicators and Selected Demographic Variables" Applied Sciences 14, no. 24: 11806. https://doi.org/10.3390/app142411806
APA StyleKuźnar, M., & Lorenc, A. (2024). The Potential of Artificial Intelligence in Predicting Post-Stroke Rehabilitation Outcomes: Statistical Analysis Considering Rivermead Motor Assessment and Activities of Daily Living Indicators and Selected Demographic Variables. Applied Sciences, 14(24), 11806. https://doi.org/10.3390/app142411806


