Article

Advancing Smart Zero-Carbon Cities: High-Resolution Wind Energy Forecasting to 36 Hours Ahead

by
Haytham Elmousalami
1,2,*,
Aljawharah A. Alnaser
3,* and
Felix Kin Peng Hui
1
1
Department of Infrastructure Engineering, Faculty of Engineering and Information Technology, The University of Melbourne, Melbourne, VIC 3010, Australia
2
General Petroleum Company (GPC), Cairo 743, Egypt
3
Department of Architecture and Building Science, Collage of Architecture and Planning, King Saud University, Riyadh 11574, Saudi Arabia
*
Authors to whom correspondence should be addressed.
Appl. Sci. 2024, 14(24), 11918; https://doi.org/10.3390/app142411918
Submission received: 13 November 2024 / Revised: 14 December 2024 / Accepted: 16 December 2024 / Published: 19 December 2024

Abstract

:
Accurate wind speed and power forecasting are key to optimizing renewable wind station management, which is essential for smart and zero-energy cities. This paper presents a novel integrated wind speed–power forecasting system (WSPFS) that operates across various time horizons, demonstrated through a case study in a high-wind area within the Middle East. The WSPFS leverages 12 AI algorithms both individual and ensemble models to forecast wind speed (WSF) and wind power (WPF) at intervals of 10 min to 36 h. A multi-horizon prediction approach is proposed, using WSF model outputs as inputs for WPF modeling. Predictive accuracy was evaluated using mean absolute percentage error (MAPE) and mean square error (MSE). Additionally, WSPFS advances the smart wind energy deep decarbonization (SWEDD) framework by calculating the carbon city index (CCI) to define the carbon-city transformation curve (CCTC). Findings from this study have broad implications, from enabling zero-energy urban projects and mega-developments like NEOM and the Suez Canal to advancing global energy trading and supply management.

1. Introduction

1.1. Smart and Zero-Energy Cities

Historically, in the 1840s, the Cholera epidemics spurred sanitary reforms in cities, leading to major changes in water supply and sewage systems to combat waterborne diseases [1]. This period marked the beginning of public health-driven urban planning. Moving into the 2000s, the focus shifted towards creating smart and low-carbon cities, emphasizing sustainable development, energy efficiency, and reduced carbon footprints. In 2015, the Paris Agreement set a limit on the rise in world average temperature to 1.5 °C [2]. In 2018, the Intergovernmental Panel on Climate Change established a target of attaining net zero CO2 eq emissions by 2050 [3,4].
Systems of energy supply, industry, land and ecosystems, and urban infrastructure will need to undergo significant changes to achieve net zero CO2 eq emissions. Urban areas are essential to the mitigation of climate change. The world’s total greenhouse gas (GHG) emissions are attributed to urban areas. About 75% of CO2 eq emissions from fossil fuels come from existing metropolitan areas [5]. Moreover, growth patterns in urban infrastructure and population are expected to contribute to future increases in urban GHG emissions. Roughly 4.2 billion people, or 55% of the world’s population, resided in cities in 2015. By 2050, there will be an additional 2.5 billion people living in cities, bringing the population’s proportion in urban areas to 68% [6].
Smart cities can adapt constantly to changing conditions and optimize parameters to meet different demands. By integrating the Internet of Things (IoTs), Big Data, and artificial intelligence in city-scale resource management, cities can become sustainable through modeling, monitoring, and managing the city’s infrastructure and resources. On the other hand, a net zero-carbon city is dedicated to achieving some other decarbonization objective, such as reducing GHG emissions by at least 80% [7,8,9]. Moreover, a low-carbon city does not mean a net zero city. Cities must make major structural adjustments to reach net zero such as a decarbonization objective or a reduction target of 80% or more in GHG emissions by a specified year (2050) from baseline. A zero-carbon city uses renewable energy sources to minimize its carbon footprint, ideally 0 or negative; it reduces all forms of carbon emissions through efficient urban design, technology use, and lifestyle changes [10,11,12]. Table 1 summarizes the fundamental concepts of smart and carbon cities.
A city’s deep decarbonization strategy focuses on reducing greenhouse gas emissions to near-zero levels through the implementation of clean energy solutions, sustainable infrastructure, and policy-driven climate actions [11,12]. This strategy incorporates advanced approaches including green energy conversion, carbon valorization, vehicle electrification, and efficient heating, which achieve beyond conventional methods that cities have adopted for low-carbon development to reduce GHG emissions by 80% or even 100% by 2050 [25,26,27].
A core requirement for deep decarbonization is the transformation of energy systems, starting with the creation of a net-zero-carbon electricity grid. This grid will form the foundation of supply-side strategies to deliver carbon-free energy and materials to buildings, transportation, and light industries, which can easily transition to electric power. In addition, vital urban functions such as cooking, heating, and transportation must shift from fossil fuel dependency to electric power, which will necessitate a near doubling of electricity generation [9,10,11]. Carbon valorization is another crucial aspect of this transformation, which uses captured CO2 as a feedstock to produce industrial goods such as plastics, fertilizers, and alcohol. City electricity decarbonization strategies show that transitioning urban energy systems will require new green technologies and large-scale investment in renewable energy and electrical infrastructure to achieve sustainable, net-zero cities [16,17,18].

1.2. Wind Energy Forecasting

Wind energy shares a key role in preventing global climate change and supporting the United Nations’ Sustainable Development Goals (SDGs). In 2024, global wind power capacity increased by 59.70 GW, bringing the total capacity to 1017.20 GW [1,2]. The inherent variability of wind makes it an unpredictable energy source [30]. As a result, wind energy has not reached its full potential and cannot consistently deliver power at specific times. Wind power stations, however, can collect Big Data on various meteorological factors such as temperature, humidity, air pressure, wind direction, wind speed, and turbine performance [31]. Numerous devices, sensors, drones, space satellites, and anemometers continuously measure wind and meteorological data. These data can be transformed into valuable insights to enhance wind station management [32,33].
The wind power potential (W/m2) atlas displayed in Figure 1 provides a visual representation of the wind energy potential with an infrastructure of electricity from 66 kilovolts (kV) to more than 500 kV grids across the globe [34]. The color scale indicates the wind speed and power density at different locations, with darker shades of red representing areas with higher wind speeds and potential for significant wind power generation. The map highlights several regions with favorable wind conditions, which are ideal for installing wind turbines. On the other hand, this map highlights the importance and promising potential of wind energy globally.
As shown in Figure 2, wind speed and wind power predictions are further grouped according to their time horizons [35,36]. Weekly forecasts assist in planning maintenance operations at wind farms. Daily forecasts benefit electricity market participants, and intra-day predictions are crucial for short-term markets and maintaining a real-time balance between supply and demand [37,38].

1.3. Research Gap

As illustrated in Table 2, reference [38] demonstrated a robust approach to both, wind speed and power forecasting, using models without a comparative analysis of AI models and considering varying time horizons. Similarly, reference [39] focused on short-term combined forecasting for wind power, without extending to computational time and cost evaluations or diverse time horizons. In reference [31], the study on offshore wind turbine power prediction models is limited solely to power prediction without addressing wind speed prediction or the broader range of AI model comparisons. Reference [40] explored enhanced wind speed prediction techniques and has dropped the integration of these predictions with power outputs or examined computational implications. Reference [41] covered ensemble learning methods for wind turbine power forecasting and missed out on the AI model comparisons and long-term forecasting horizons. Reference [42] provided a data augmentation approach to wind power forecasting, offering insights into model performance improvements without expanding on the computational aspects or different time frames.

1.4. Research Objectives

The primary objective of this paper is to present a novel integrated wind speed–power forecasting system (WSPFS) designed to enhance renewable energy forecasting for smart and zero-energy cities. Unlike previous studies, which often focus on isolated aspects of either wind speed or power prediction as illustrated in Table 1, this study introduces a multi-horizon forecasting approach that seamlessly integrates wind speed forecasting (WSF) outputs as inputs for wind power forecasting (WPF). This comprehensive system evaluates the performance of 12 AI algorithms, including individual and ensemble models, across diverse forecasting horizons ranging from 10 min to 36 h. The system also incorporates metrics to benchmark predictive accuracy, addressing short- and long-term forecasting needs.
This research work does more than compare existing forecasting methods; it contributes to the state of the art by addressing gaps in the literature, particularly the underutilization of tree-based models such as scalable boosting machines and random forests. By leveraging these models and incorporating computational time and cost evaluations, the study validates the effectiveness of these methods and demonstrates their scalability and efficiency for real-world applications. Moreover, the integration of the carbon city index (CCI) and the carbon-city transformation curve (CCTC) within the smart wind energy deep decarbonization (SWEDD) framework sets this research apart, providing a pathway for cities like NEOM and the Suez Canal to transition toward zero-energy operations. These contributions underline the dual focus of this work on advancing forecasting methodologies and supporting global sustainability initiatives.

1.5. Research Contribution

Accurate wind data prediction is essential for various applications [39,43]. A reliable multi-time horizon forecast of wind speed and power can help schedule energy delivery to the grid in advance, reducing operating costs. The research aims to provide a comprehensive evaluation of these algorithms’ accuracy and computational efficiency for decision-makers and policymakers to manage the city electricity supply. The novelty of this paper lies in developing an integrated multi-time horizons forecasting system for WSF and WPF, optimizing both prediction accuracy and computational cost. By assessing the strengths and weaknesses of these models, the study seeks to identify the most effective algorithms for forecasting wind energy. The results will offer valuable insights for simulating, analyzing, and managing wind energy scenarios based on informed decision-making.

2. Artificial Intelligence for Wind Speed–Power Forecasting

Artificial intelligence has significantly enhanced the accuracy of wind speed predictions using large datasets from wind stations. One notable approach is the Convolutional Support Vector Machine (CSVM), which combines Support Vector Machines (SVMs) with Convolutional Neural Networks (CNNs) [44,45]. This CSVM model has demonstrated the effectiveness of wind speed prediction by integrating these advanced analytical techniques. Additionally, deep learning techniques such as Recurrent Neural Networks (RNNs) have been successfully utilized. Combining wavelet transforms with updated Long Short-Term Memory (LSTM) networks has further enhanced the accuracy of prediction, showcasing the potential of integrating advanced signal processing with deep learning methodologies [46,47]. Moreover, developing a unified framework that merges CNNs with LSTMs has facilitated the joint learning of temporal and spatial correlations in wind speed forecasting, thereby improving overall model performance [48].
Recent advancements in wind speed and power prediction models have increasingly focused on leveraging transformer architectures due to their superior ability to handle sequential data and capture long-term dependencies. Nascimento et al. proposed a transformer-based deep neural network with wavelet transform, demonstrating significant improvements in forecasting wind speed and energy, when compared to traditional models such as LSTM [49]. Similarly, Bentsen et al. explored spatiotemporal wind speed forecasting using graph networks in conjunction with novel transformer architectures, which allowed for more accurate multi-step predictions over varying future intervals [50]. In another study, Bommidi et al. introduced a hybrid wind speed forecasting model that combines ICEEMDAN and transformer networks with a novel loss function, effectively addressing the challenges posed by seasonal and stochastic wind variations [51]. Further extending these concepts, Wang et al. developed a model that integrates both high- and low-frequency components using Transformer and BiGRU-Attention mechanisms, achieving robust power prediction performance across different time scales [52]. These studies collectively highlight the growing efficacy of transformer-based models in enhancing the accuracy and reliability of wind speed and power forecasting.
Recent literature has increasingly focused on developing novel deep-learning approaches for time series forecasting in the context of wind speed and power prediction. Wang et al. proposed a novel wind power forecasting system that integrates time series refining with a nonlinear multi-objective optimized deep learning framework and linear error correction, demonstrating significant improvements in predictive accuracy for monthly wind speed data [53]. Additionally, Yaghoubiard et al. developed a deep learning-based multistep-ahead forecasting model that focuses on discrete methods, which offers a direct approach to predicting wind speed and power generation [54]. Further advancements were made by Karim et al., who introduced a bio-inspired optimization algorithm tailored specifically for wind power engineering applications in time series forecasting, showcasing the potential of bio-inspired methods to enhance deep learning models for energy forecasting [55]. These contributions underscore the significant role that advanced deep learning techniques and novel algorithmic strategies play in improving the accuracy and reliability of wind speed and power forecasts.
Many related works investigated the combination of ML with Numerical Weather Prediction (NWP) to offer promising accuracy with several limitations [56]. One significant challenge lies in the inherent differences between the two approaches: NWP models are physics-based and rely on complex atmospheric equations, which require extensive computational resources and can suffer from coarse spatial and temporal resolution [34]. These models may fail to capture localized weather phenomena, leading to inaccuracies in short-term predictions. On the other hand, machine learning can handle high-resolution data and learn complex patterns from historical information, which is heavily dependent on the quality and quantity of the input data. When these approaches are combined, there is a risk that the inaccuracies or biases present in the NWP data can be transferred to the ML models, potentially degrading prediction performance [57,58]. Also, hybrid systems are computationally expensive due to the need to run both high-resolution NWP simulations and complex ML algorithms [57,58].
Another limitation arises from the dynamic nature of atmospheric conditions, which can change rapidly, particularly in regions with high variability in wind patterns. While NWP models provide general trends based on physical laws, ML models struggle to adapt to unseen or rapidly changing weather conditions that deviate from historical trends. This makes it difficult for the combined models to generalize effectively across different time horizons or geographical regions [38,59]. In addition, the integration of NWP and ML requires sophisticated tuning and coordination between both models to avoid overfitting or underfitting [60,61].

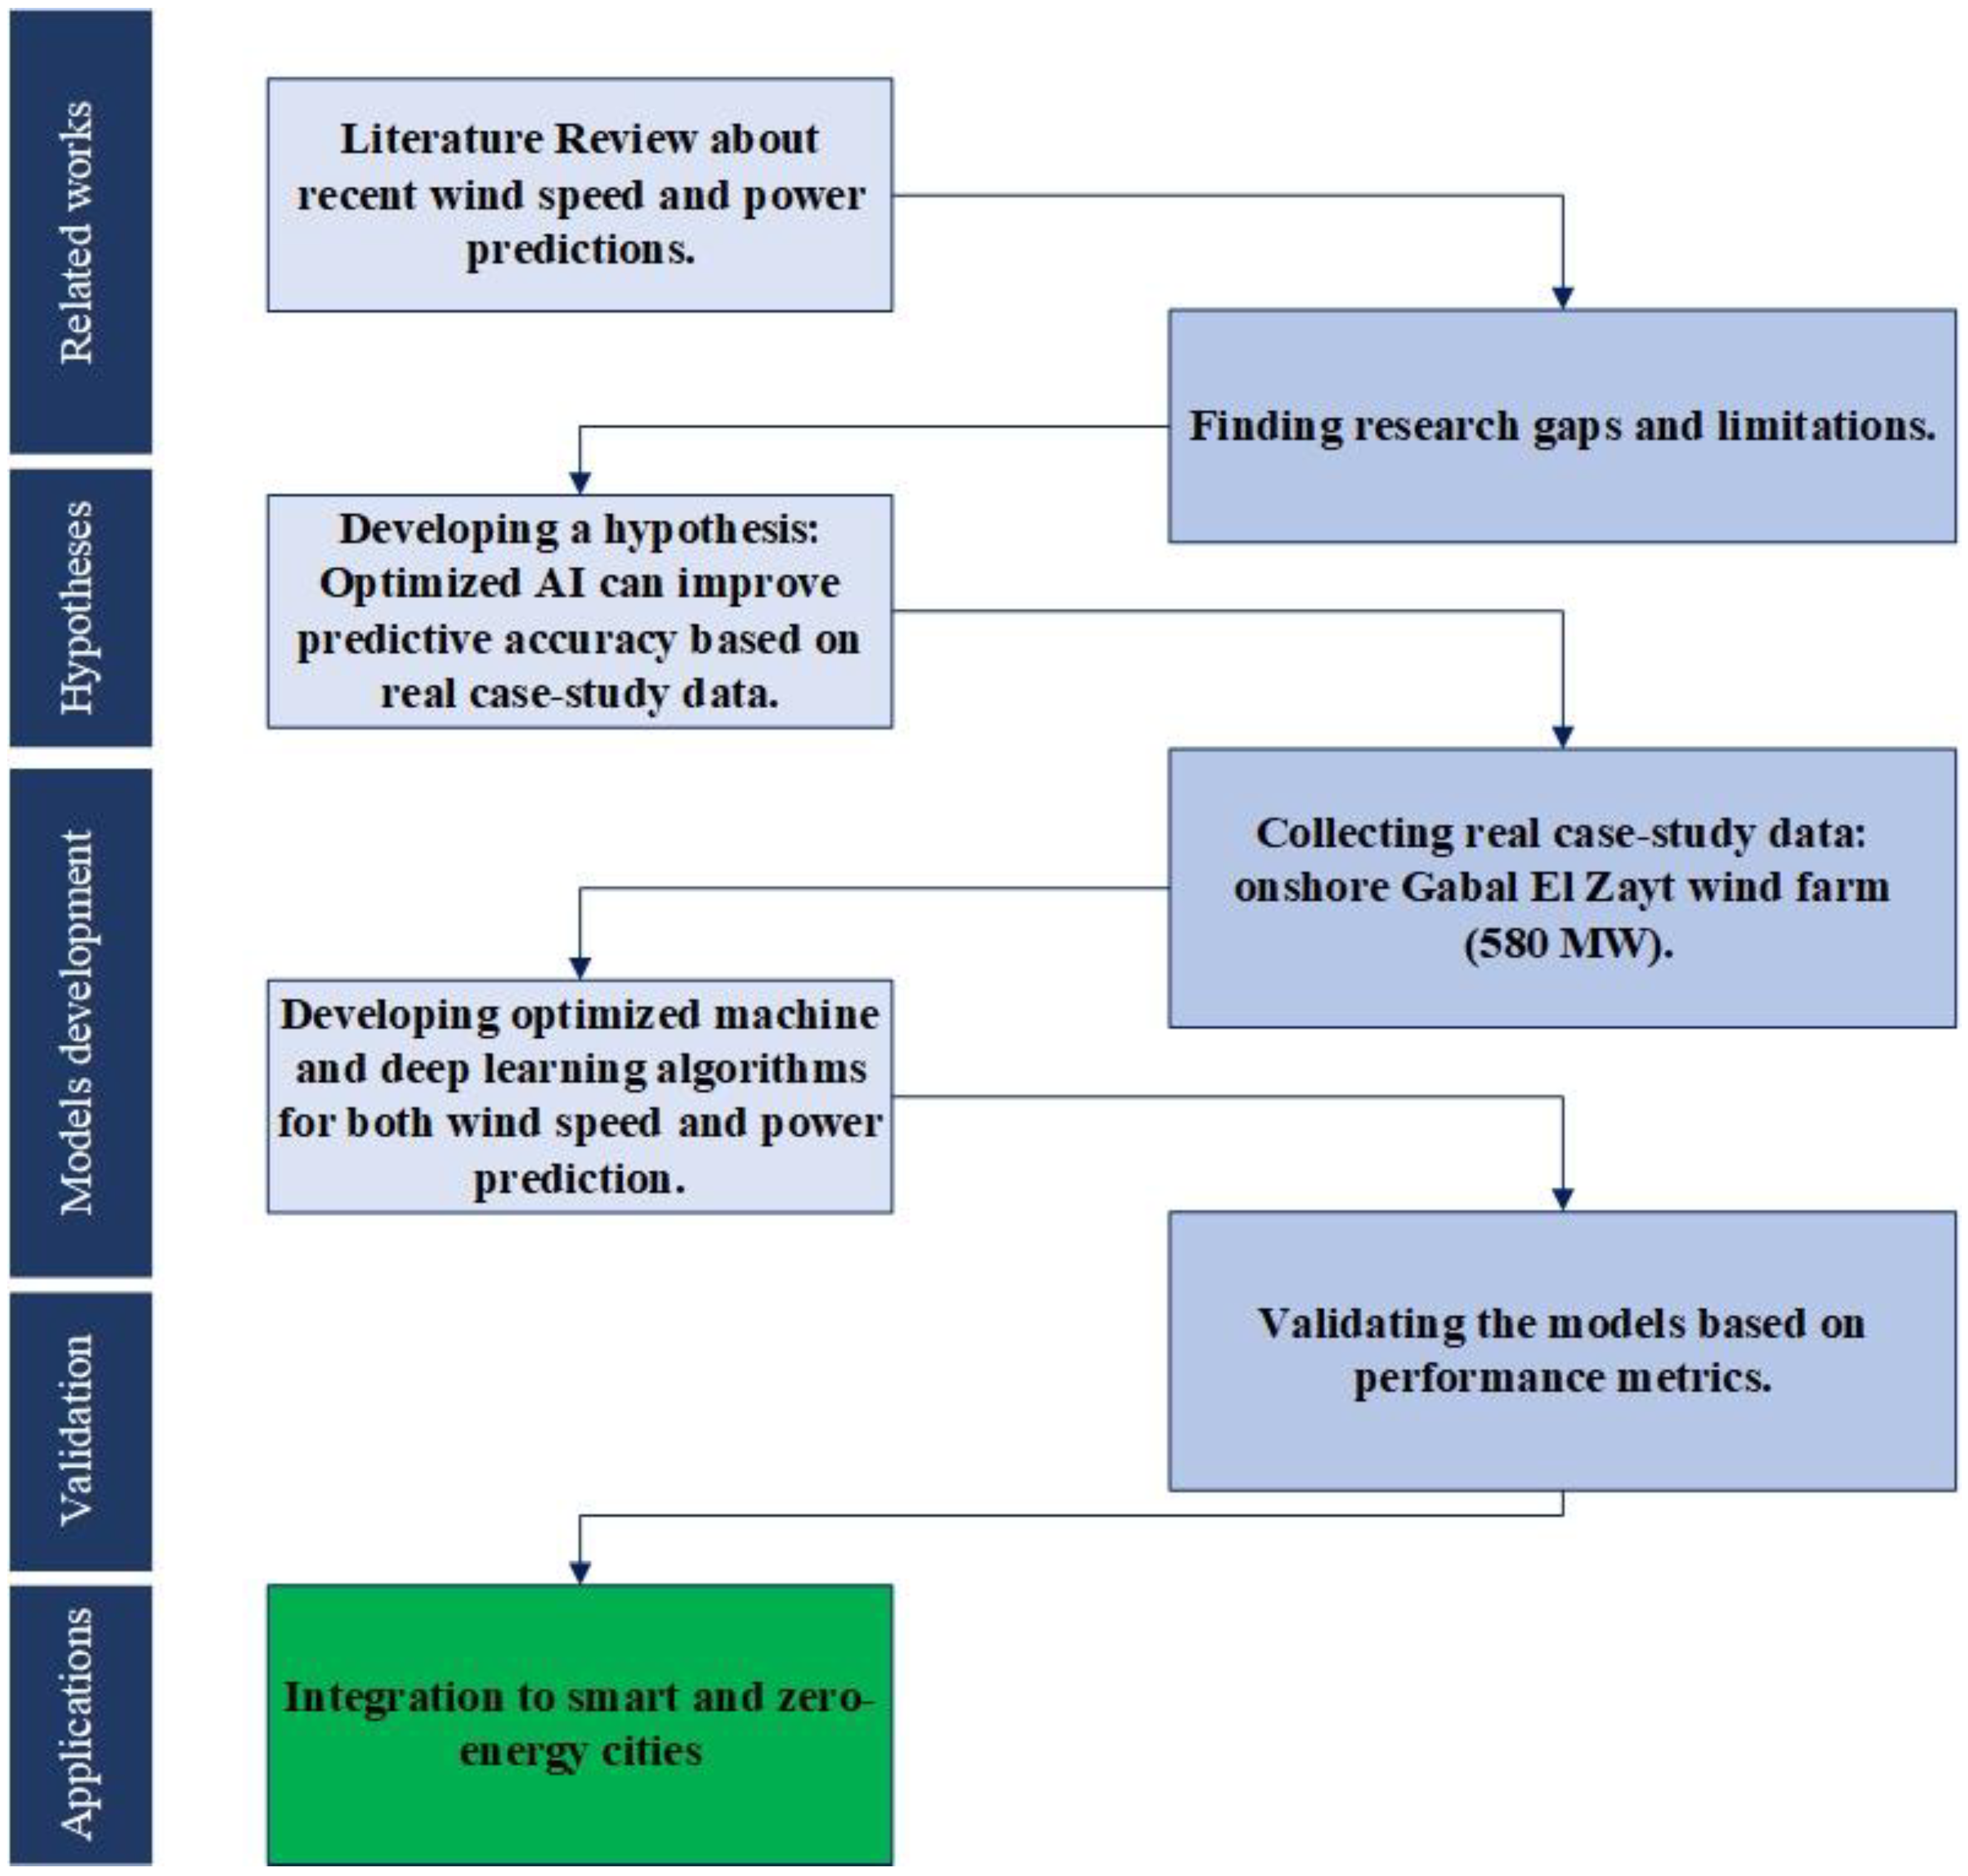
3. Research Methodology

The core aim of this paper is to develop a robust system for wind speed forecasting (WSF) and wind power forecasting (WPF) using pattern recognition models across various time scales. To achieve the study’s aim, this study applied a quantitative approach as illustrated in Figure 3. This research process outlines a systematic approach for enhancing wind speed and power prediction through AI. The research process begins with a literature review to understand current methodologies and identify gaps. A hypothesis is formed that optimized AI could enhance prediction accuracy using real-world data from the Gabal El Zayt wind farm. These AI models are validated using performance metrics. Finally, the validated models are integrated into the planning and operation of smart, zero-energy cities, showcasing their practical application in sustainable urban development.
The research methodology of this paper is grounded in the analysis of an extensive actual dataset comprising over 200,000 data points, collected from a high-wind area in the Middle East. The dataset includes detailed records of wind generation and meteorological parameters such as wind speed, wind direction, temperature, air pressure, and humidity. These data points are sampled at intervals aligned with the forecasting time horizons, ranging from 10 min to 36 h. For instance, a typical training record might include inputs such as historical wind speed measurements (e.g., 8.5 m/s, 9.2 m/s) at specific timestamps, temperature (e.g., 25 °C), and air pressure (e.g., 1015 hPa), alongside corresponding wind power outputs (e.g., 2 MW). This comprehensive dataset enables the training and evaluation of 12 AI algorithms, facilitating multi-horizon predictions and ensuring robust model validation. By leveraging such a rich dataset, the study ensures the reliability and scalability of the proposed wind speed–power forecasting system under varying climatic and operational conditions.
The methodology in Figure 4 outlines a structured process for developing ML models for wind speed and power prediction. The dataset is split into training (70%), validation (15%), and testing (15%) subsets. Pre-processed data undergo 5-fold cross-validation to assess accuracy and robustness. Hyperparameter optimization fine-tunes models using validation data, iteratively refining parameters based on metrics like MAPE and MSE. The best-performing model is then selected for accurate and efficient forecasting.

4. The Research Case Study, Gabel El-Zeit Wind Farm Complex (580 MW)

Egypt leads the MENA region in wind and solar energy production, boasting a capacity of 3.5 GW, with ambitions to expand this to 6.8 GW by 2025. The Gabal El-Zeit wind farm complex, located in the Gulf of Suez in Egypt, serves as the data source for this paper. This wind farm complex is the largest in the MENA region, with a total installed capacity of 580 MW. It is divided into three phases: Gulf of Zeit (1), with a capacity of 240 MW; Gulf of Zeit (2), with 220 MW; and Gulf of Zeit (3), with 120 MW. The turbine rotation speed reaches 16 rpm, and the actual wind speed at 100 m height above ground level reaches 12–33 m/s. The production rate of the wind farm reached a standard number, which is 52% of the station’s total capacity. To maintain the birds’ safety, the wind farm contains a radar monitoring system for bird migration to save more than 300,000 birds annually.
The onshore Gabal El-Zeit wind farm (580 MW) was chosen due to its significance and capacity, providing a comprehensive dataset for the models under development [62]. The strategic placement of renewable wind energy stations in proximity to the Suez Canal, Egypt, Jordan, and NEOM offers several significant advantages as shown in Figure 5. European investments and Saudi Arabian in the Gabal El-Zeit wind farm underscore a strategic partnership aimed at bolstering renewable energy capacities and environmental sustainability. Saudi Arabia’s interest, particularly in alignment with its Vision 2030 for energy diversification, complements European expertise and commitment to reducing carbon footprints, as demonstrated through various green initiatives and funding mechanisms [63,64]. The critical strengths at Gabal El-Zeit and the Gulf of Suez are as follows:
  • The region’s arid climate and consistent winds provide ideal conditions for wind power generation.
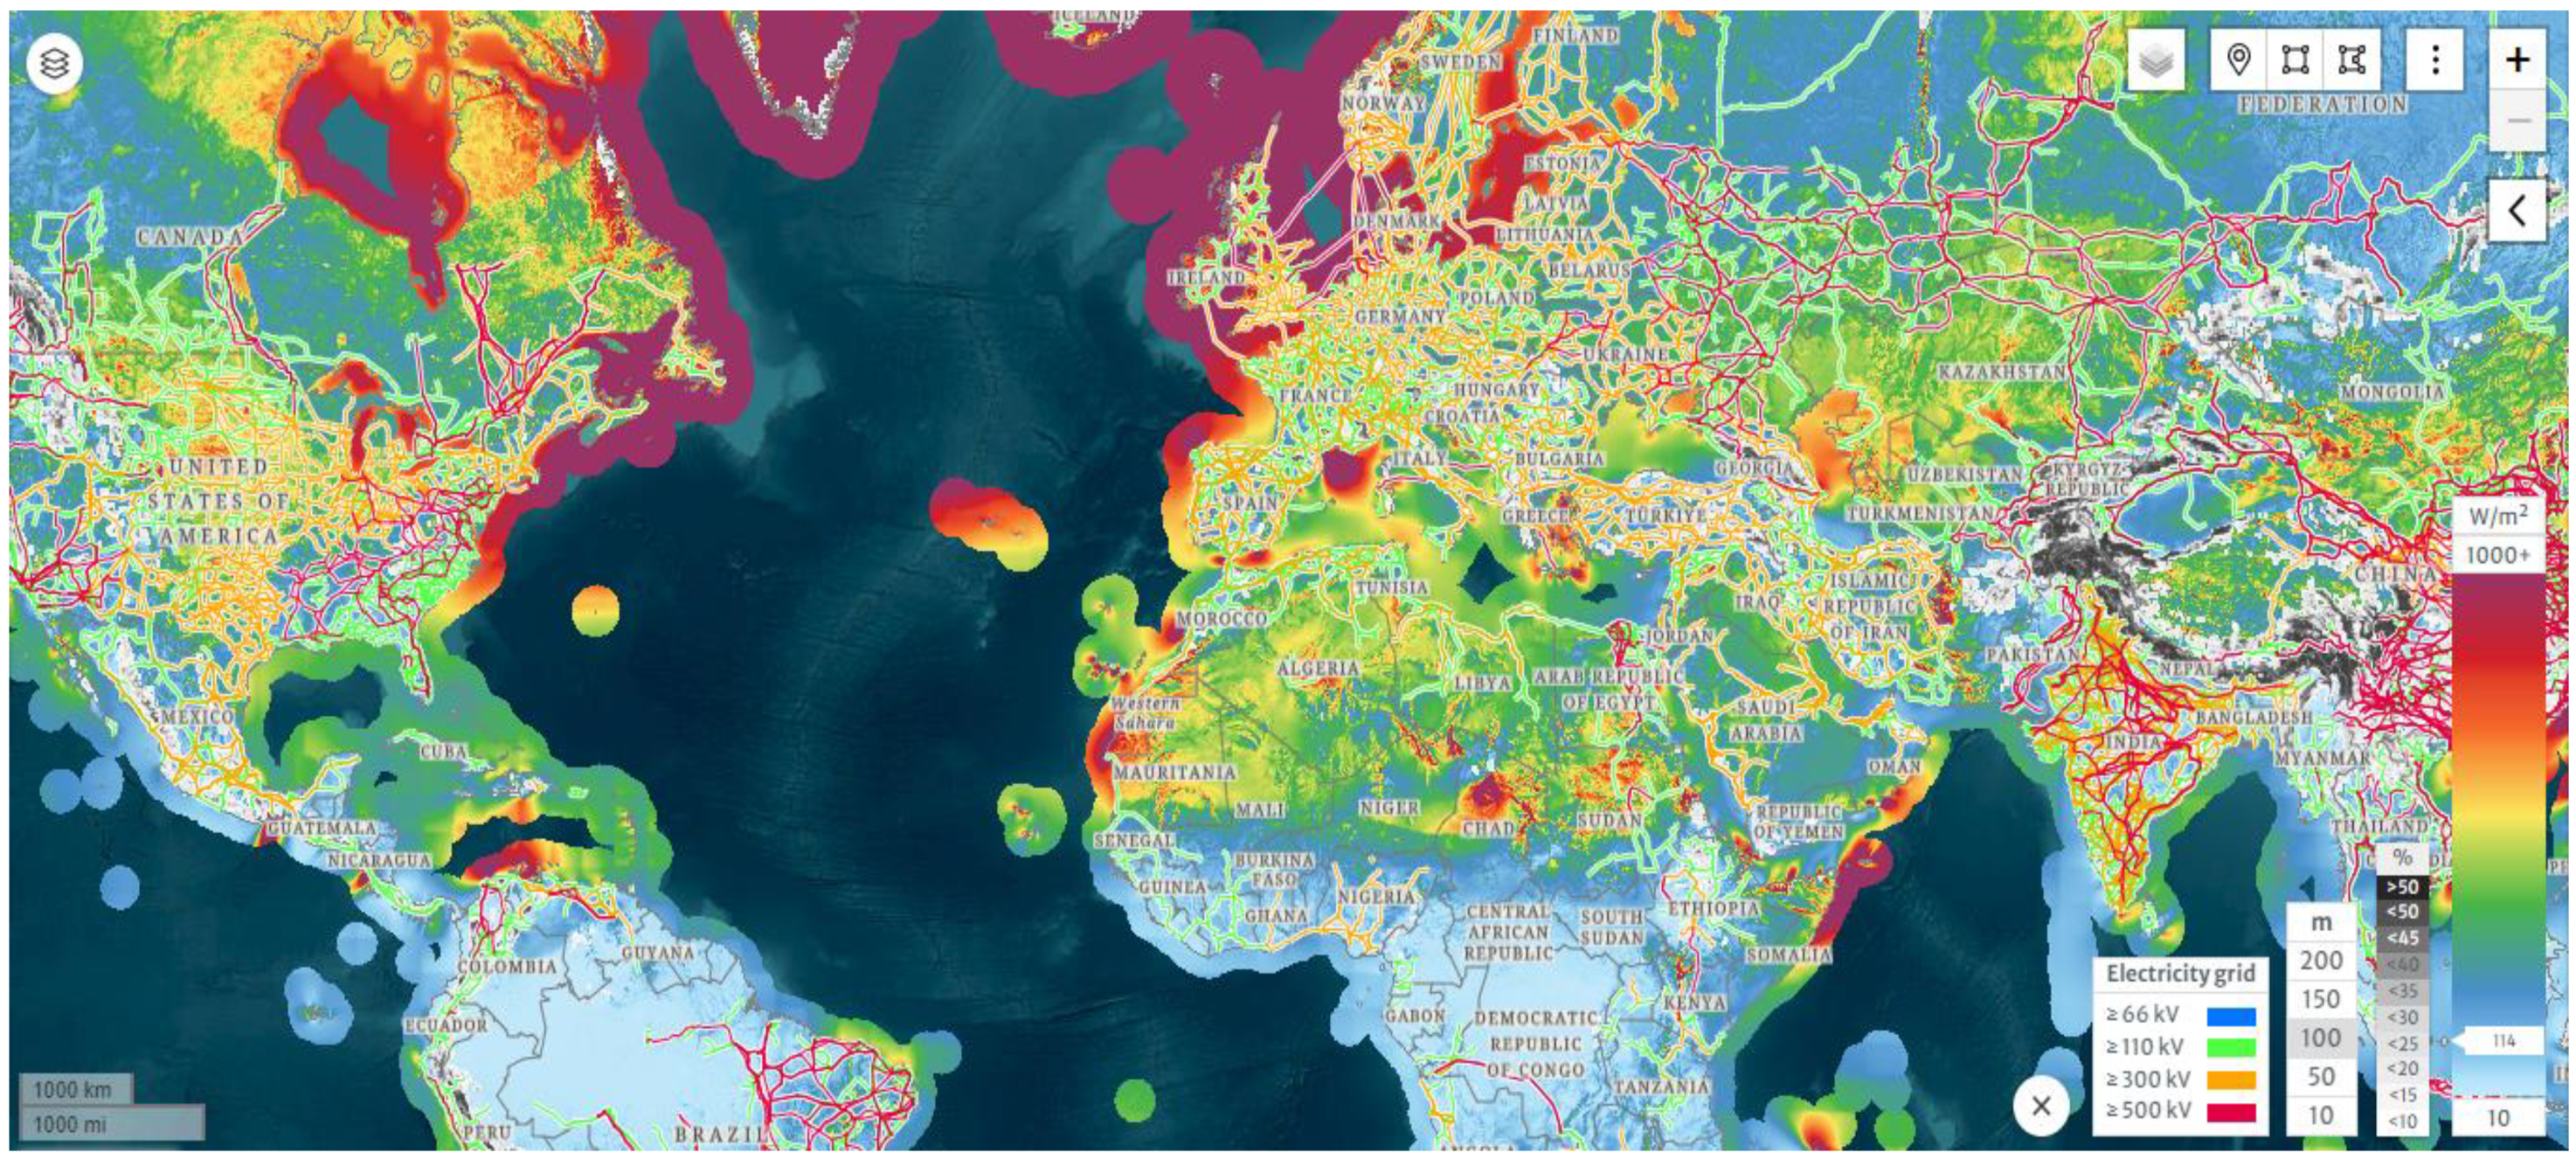
  • The wind power potential reaches 1300 W/m2 onshore and 1700 W/m2 offshore.
  • The wind speed reaches 11.5 m/s onshore and 12.5 m/s m/s offshore. Therefore, Gabal El-Zeit and the Gulf of Suez have the highest wind energy potential in the MENA region.
  • The location’s proximity to major trade routes, including the Suez Canal and 12% of the world trade passing route, presents opportunities for energy export and regional cooperation, especially with existing electrical grid infrastructure.
  • By harnessing wind energy, these countries can reduce their reliance on fossil fuels, mitigate climate change impacts, and contribute to global energy security.
  • Developing wind energy infrastructure can stimulate economic growth, create jobs, and foster technological advancement in the region.
Figure 5. The location of the Gabel El Zeit wind farm.
Applsci 14 11918 g005

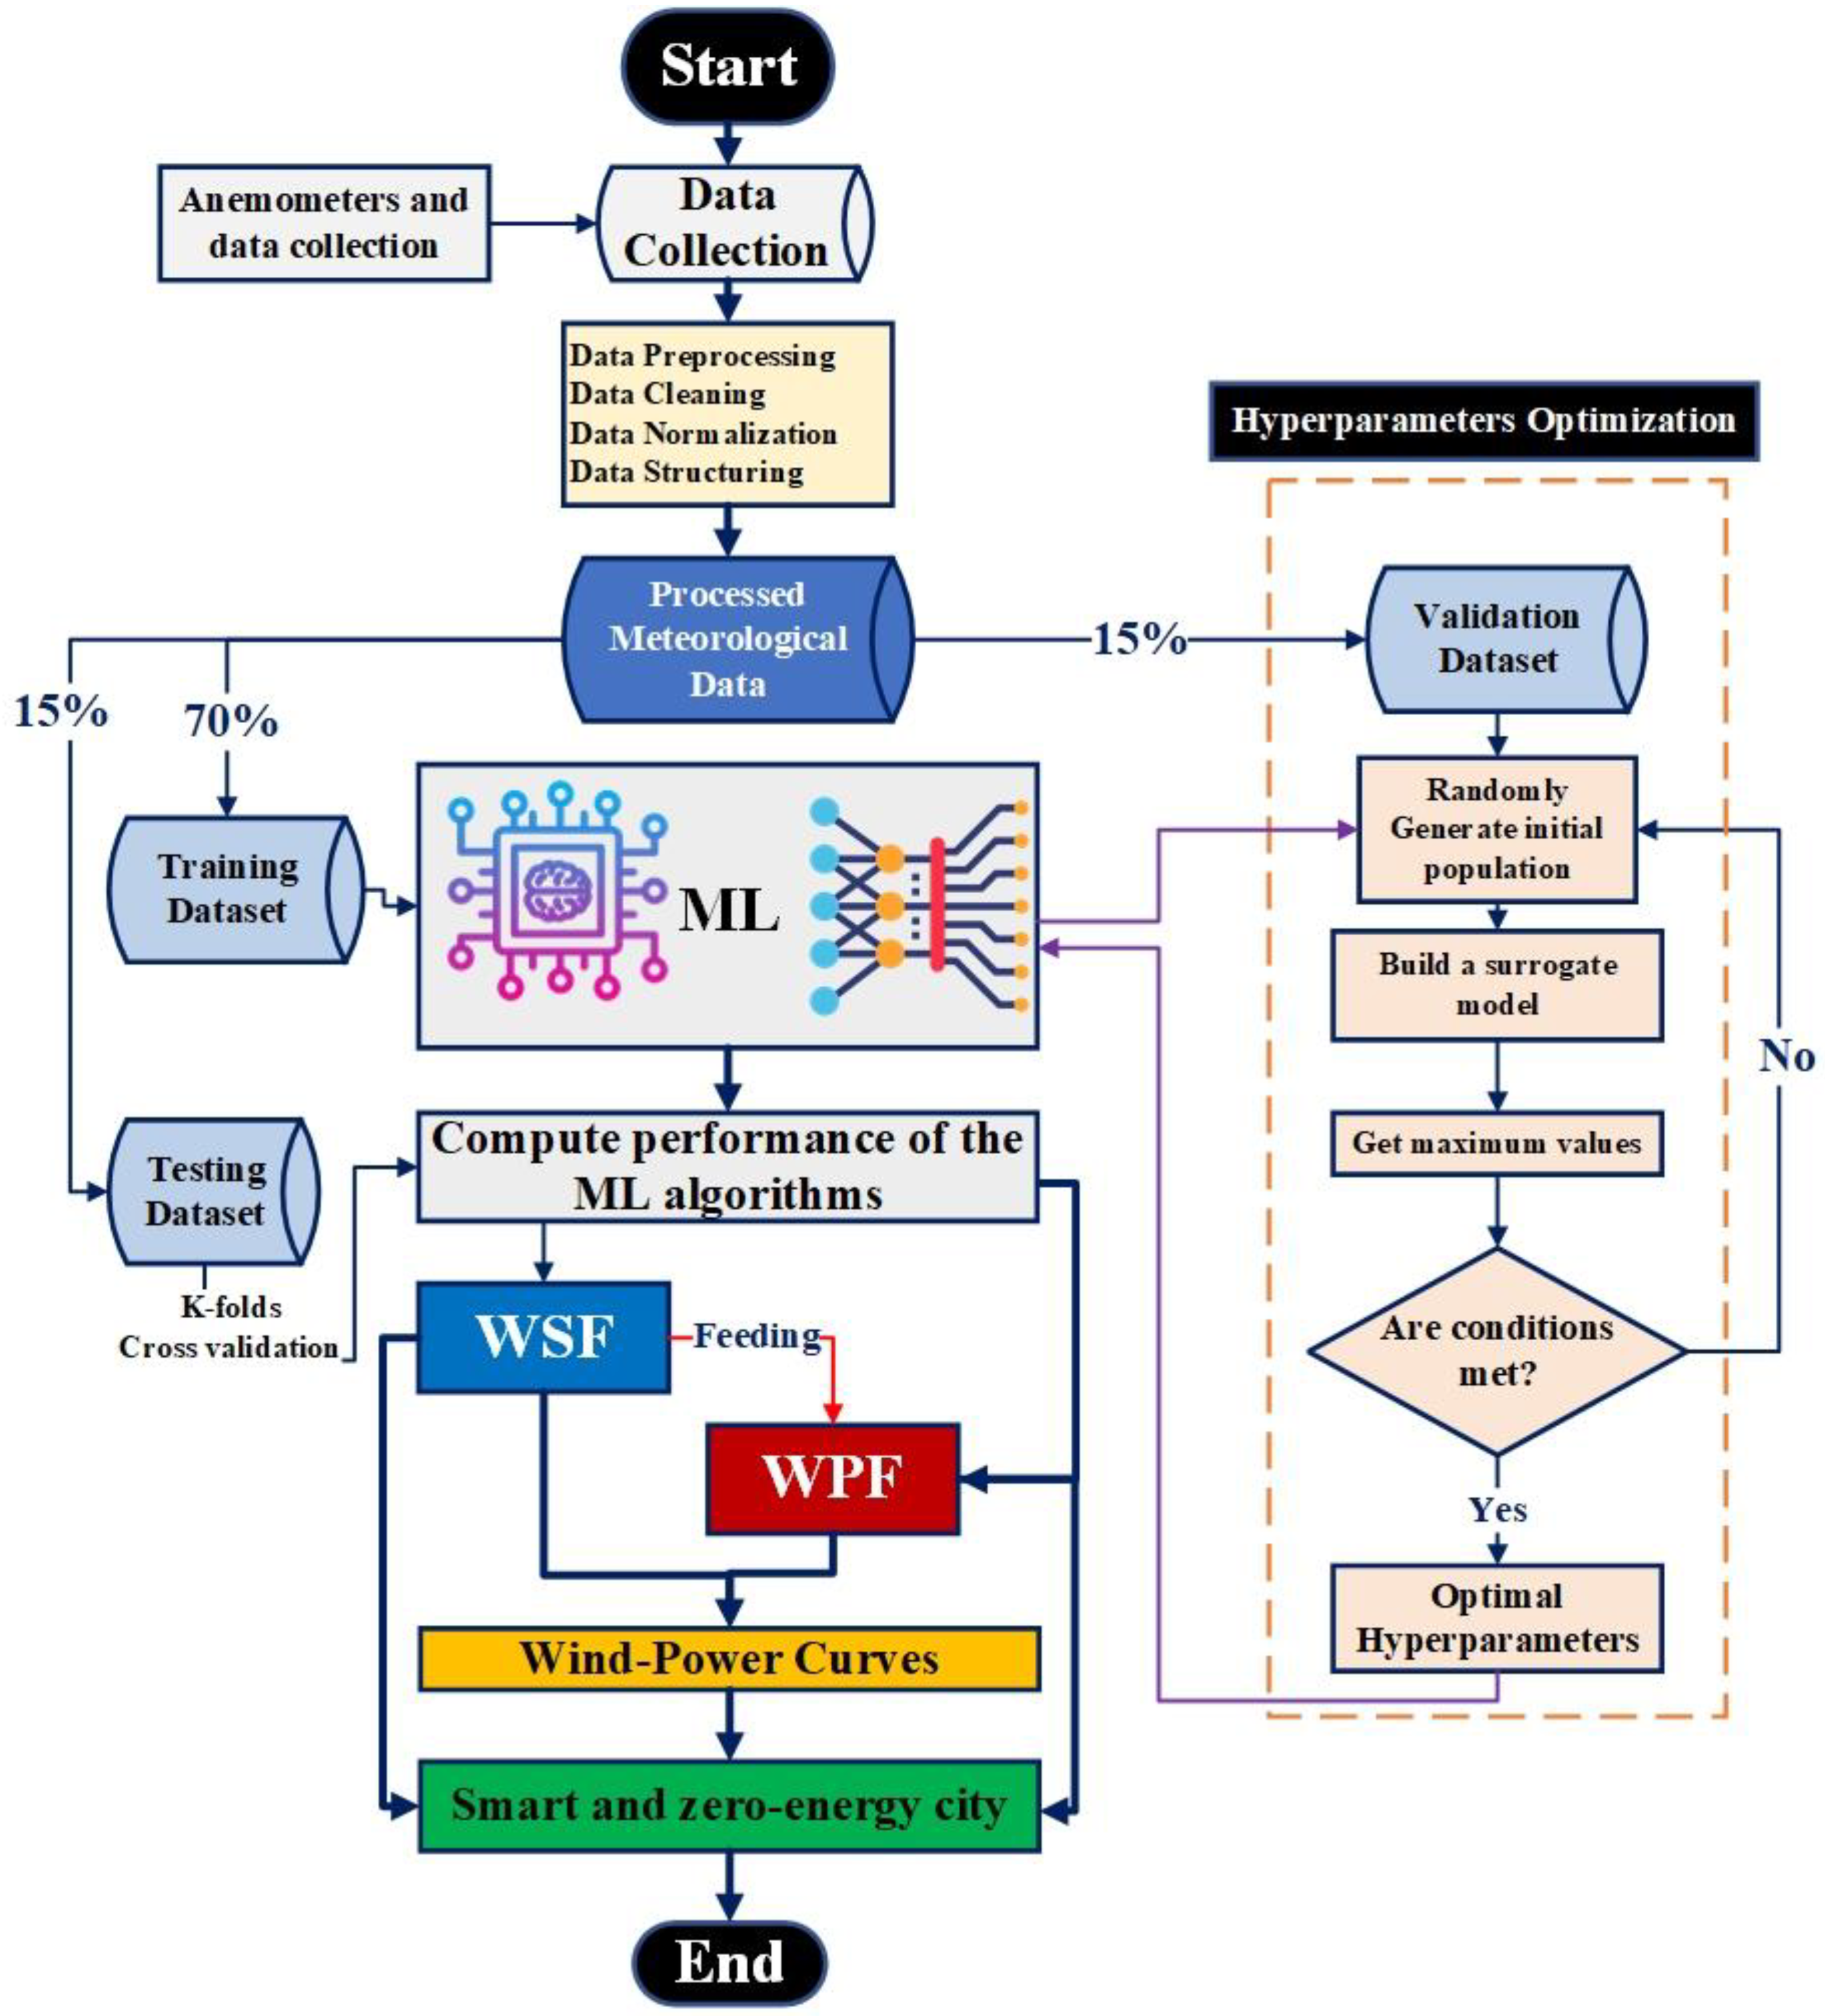
5. ML Algorithms Application

5.1. Algorithms’ Training

The initial phase of ML model development involves collecting training and validation data, demonstrated through the Gabel El-Zeit Wind Farm case study (580 MW), highlighting its regional applicability. Anemometers provide 10 min measurements, enabling very short-term wind speed forecasting (VSTWSF). Predictions span various time scales: 10 min, 30 min, 6 h, 24 h, and 36 h. Seven predictors—atmospheric pressure, humidity, wind vane, temperature, hour, height, and month—serve as inputs for 12 ML models. Models include Decision Trees (CART method), SVM (RBF kernel), and deep neural networks (ANNs, LSTMs) with three hidden layers (100 neurons each), optimizing VSTWSF (7-100-200-100-1) based on heuristic guidelines.
The Gaussian-error linear unit (GELU) activation function is utilized across all layers in ANNs because it promotes sparse representations, enhancing efficiency in variable-size representation and linear separability [65]. Additionally, multiple linear and fourth-order polynomial regression models with (kp = 4) have been applied. The backpropagation (BP) algorithm has been used to train the weights in the ANNs. To further improve performance, ensemble learning algorithms such as Random Forest (RF), bagging, boosting, Stochastic Gradient Descent (SGD), Extra Trees, and XGBoost have been employed as well. These ensemble models can integrate base learners such as ANN, Decision Tree (DT), and Support Vector Machine (SVM), with DT being the base learner for all ensemble models in this study. The very short-term wind power prediction (VSTWPF) process utilizes the same dataset with seven predictors as VSTWSF, incorporating its optimal model as an eighth predictor. This integration enhances accuracy, with DNNs using 309 neurons (8-100-200-100-1).

5.2. Hyperparameters Optimization and Models Validation

Bayesian optimization offers several specific strengths more than traditional hyperparameter optimization techniques, such as Random Search and Grid Search, particularly in the context of ML models used for wind speed and power prediction [66]. One key advantage is its efficiency in finding optimal hyperparameters with fewer function evaluations. However, Random Search, which samples hyperparameters randomly, or Grid Search, which exhaustively tests all combinations within a predefined range, Bayesian optimization builds a probabilistic model (Gaussian processes) to predict the performance of different hyperparameter configurations [32]. This model enables it to intelligently explore the hyperparameter space by balancing exploration (testing new regions of the space) with exploitation (refining the search around promising configurations). This targeted approach reduces the number of experiments needed to find the best hyperparameters, which is particularly beneficial for complex models such as ensemble methods or deep learning architectures, where each evaluation can be computationally expensive [54].
Another significant advantage of Bayesian optimization is its ability to handle noisy or expensive-to-evaluate objective functions. While techniques such as Grid and Random Search are agnostic to the complexity of the model and waste computational resources testing suboptimal configurations, Bayesian optimization incorporates the uncertainty of each function evaluation into its search process [67,68]. By leveraging prior knowledge and updating its probabilistic model with each new evaluation, it can converge to optimal hyperparameters more quickly and with higher accuracy [69]. Additionally, this probabilistic method is more adaptable to high-dimensional hyperparameter spaces, where Random and Grid Searches may struggle due to the curse of dimensionality.
Hyperparameter tuning is conducted using Bayesian optimization on the validation set (15%), employing 5-fold cross-validation to identify optimal parameters based on Equations (1)–(4):
M A P E = 1 n i = 1 n y i y ^ i y ^ i × 100
M S E = 1 n i = 1 n [ y i y ^ i ] 2    
R 2 = 1 i = 1 n     y i y ^ i 2 i = 1 n     y i y ¯ i 2 ,       0     R 2     1
R 2 = R 2 1 R 2 K n K + 1
where K is the number of included variables and R*2 represents the adjusted number of features included in the algorithm, whereas R*2 is lower than the R2 value.

6. Results and Analysis

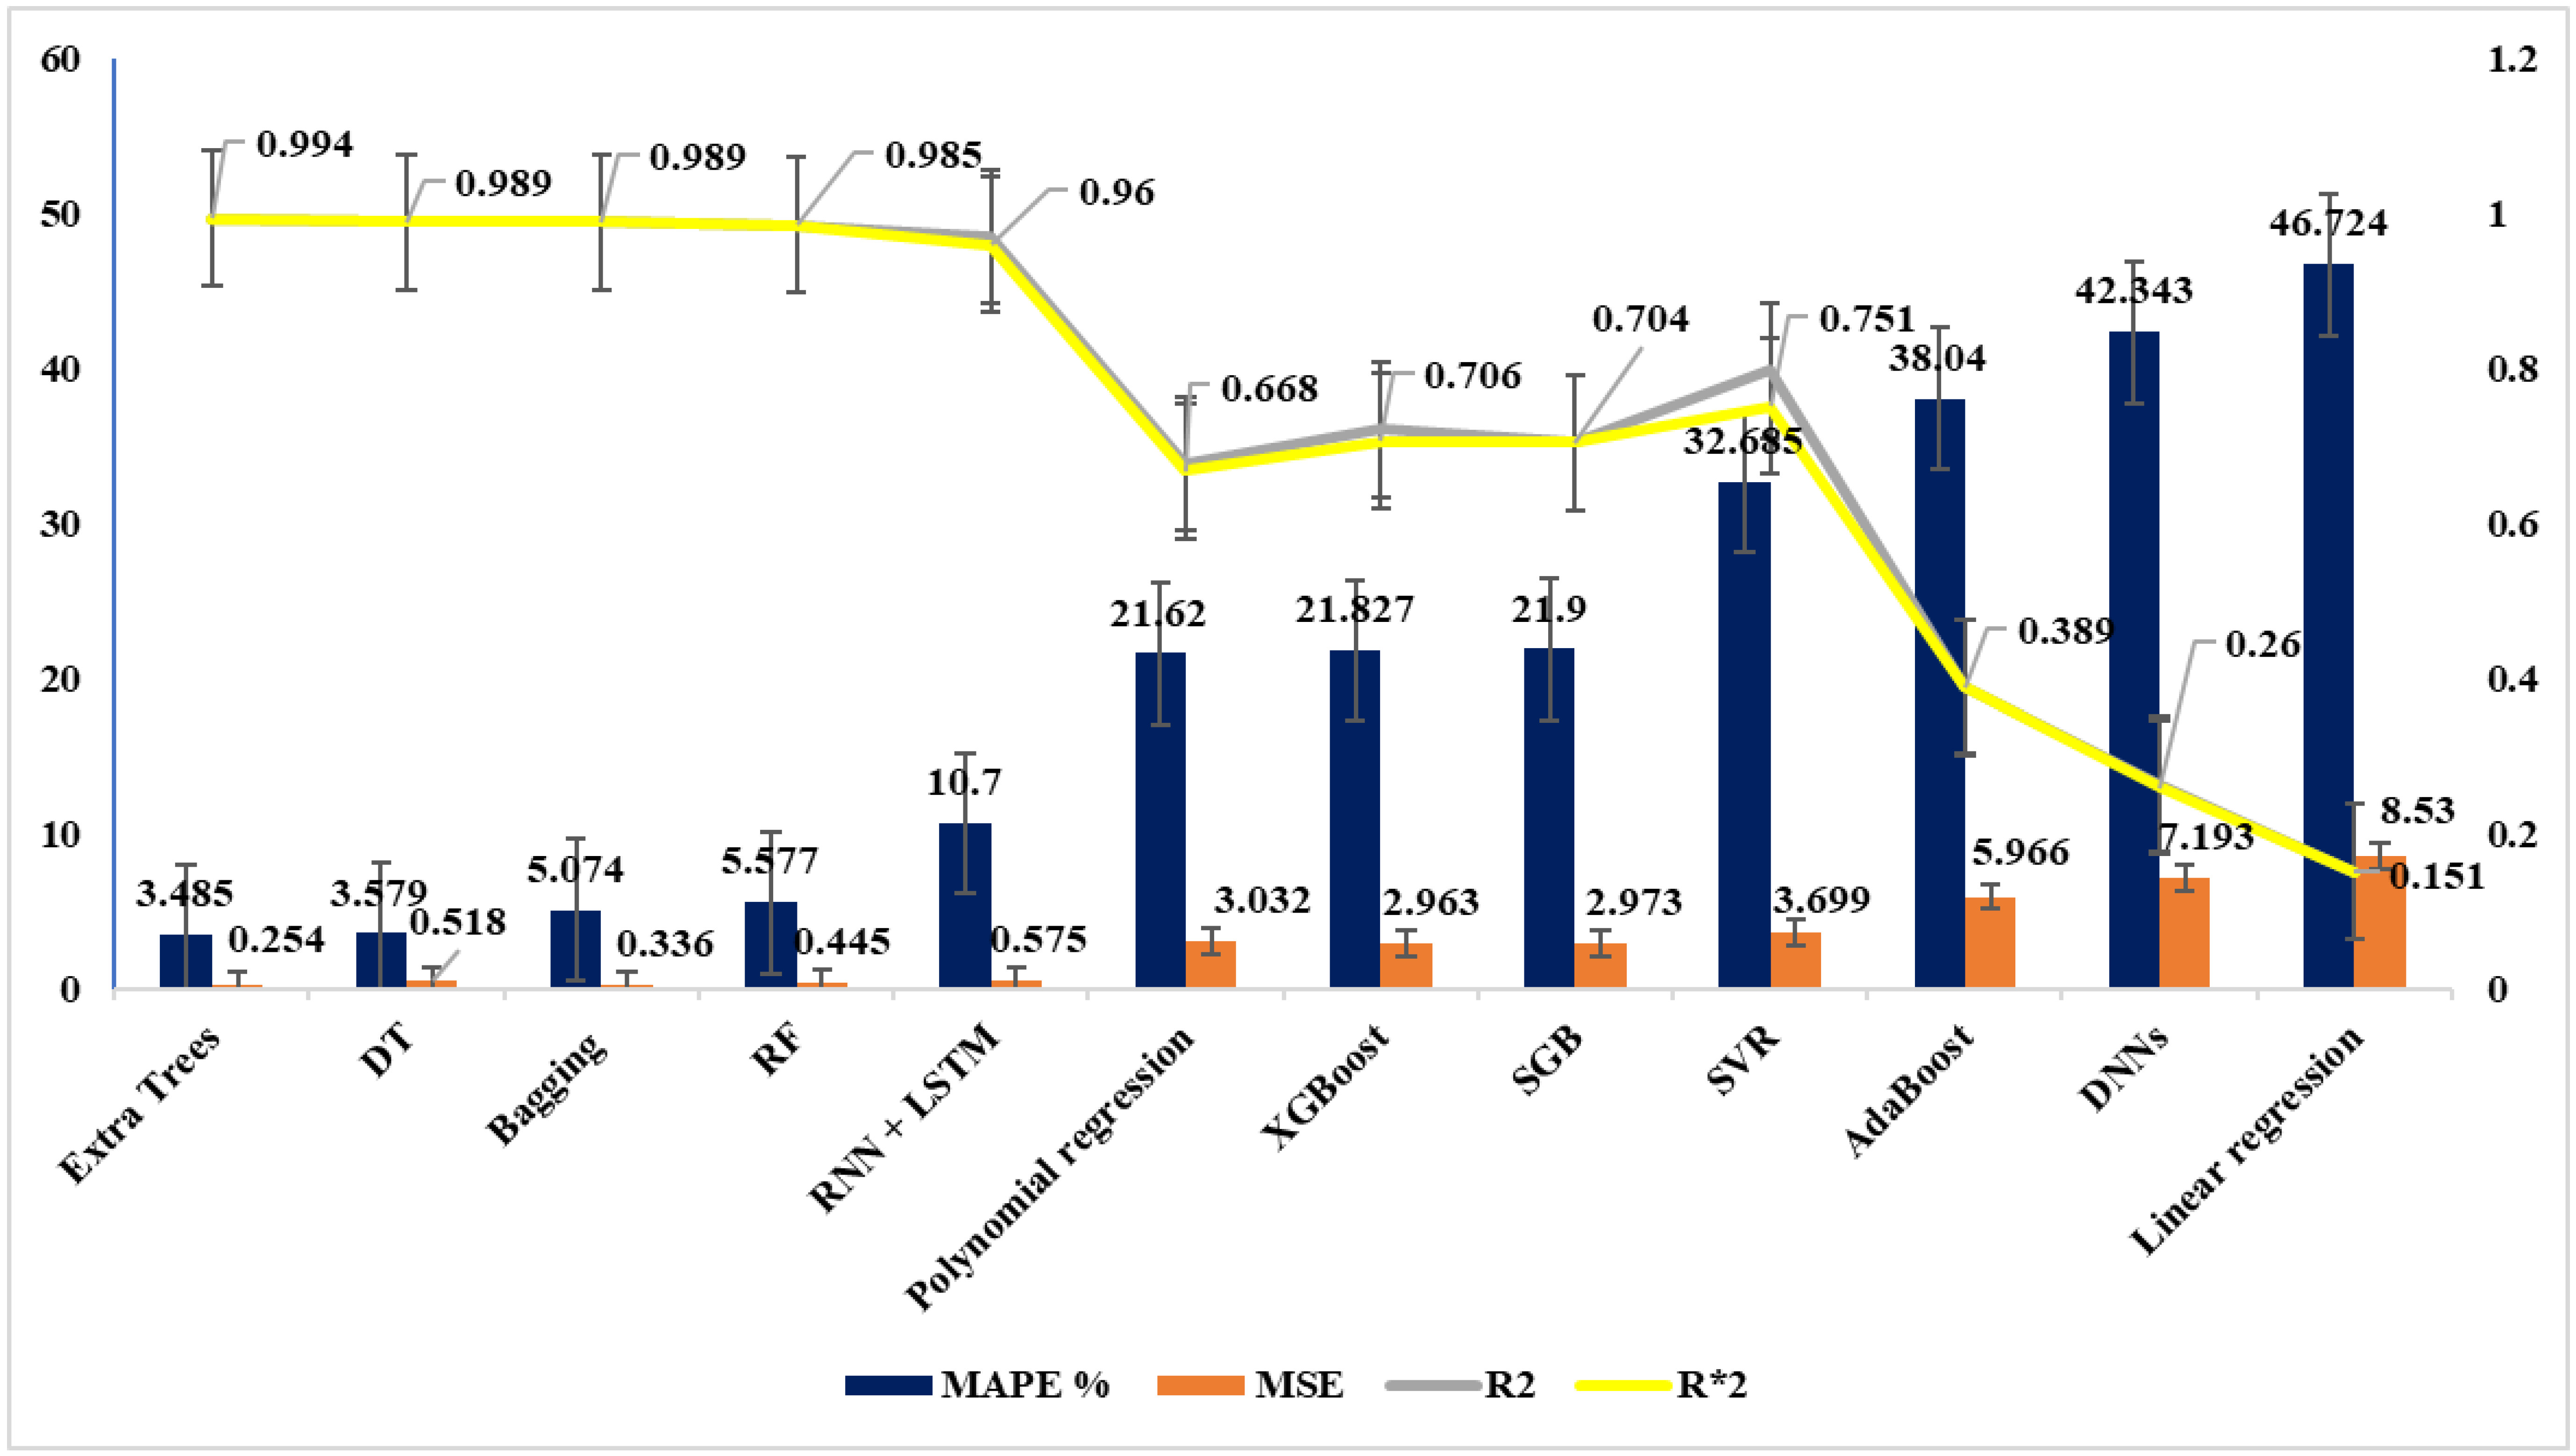
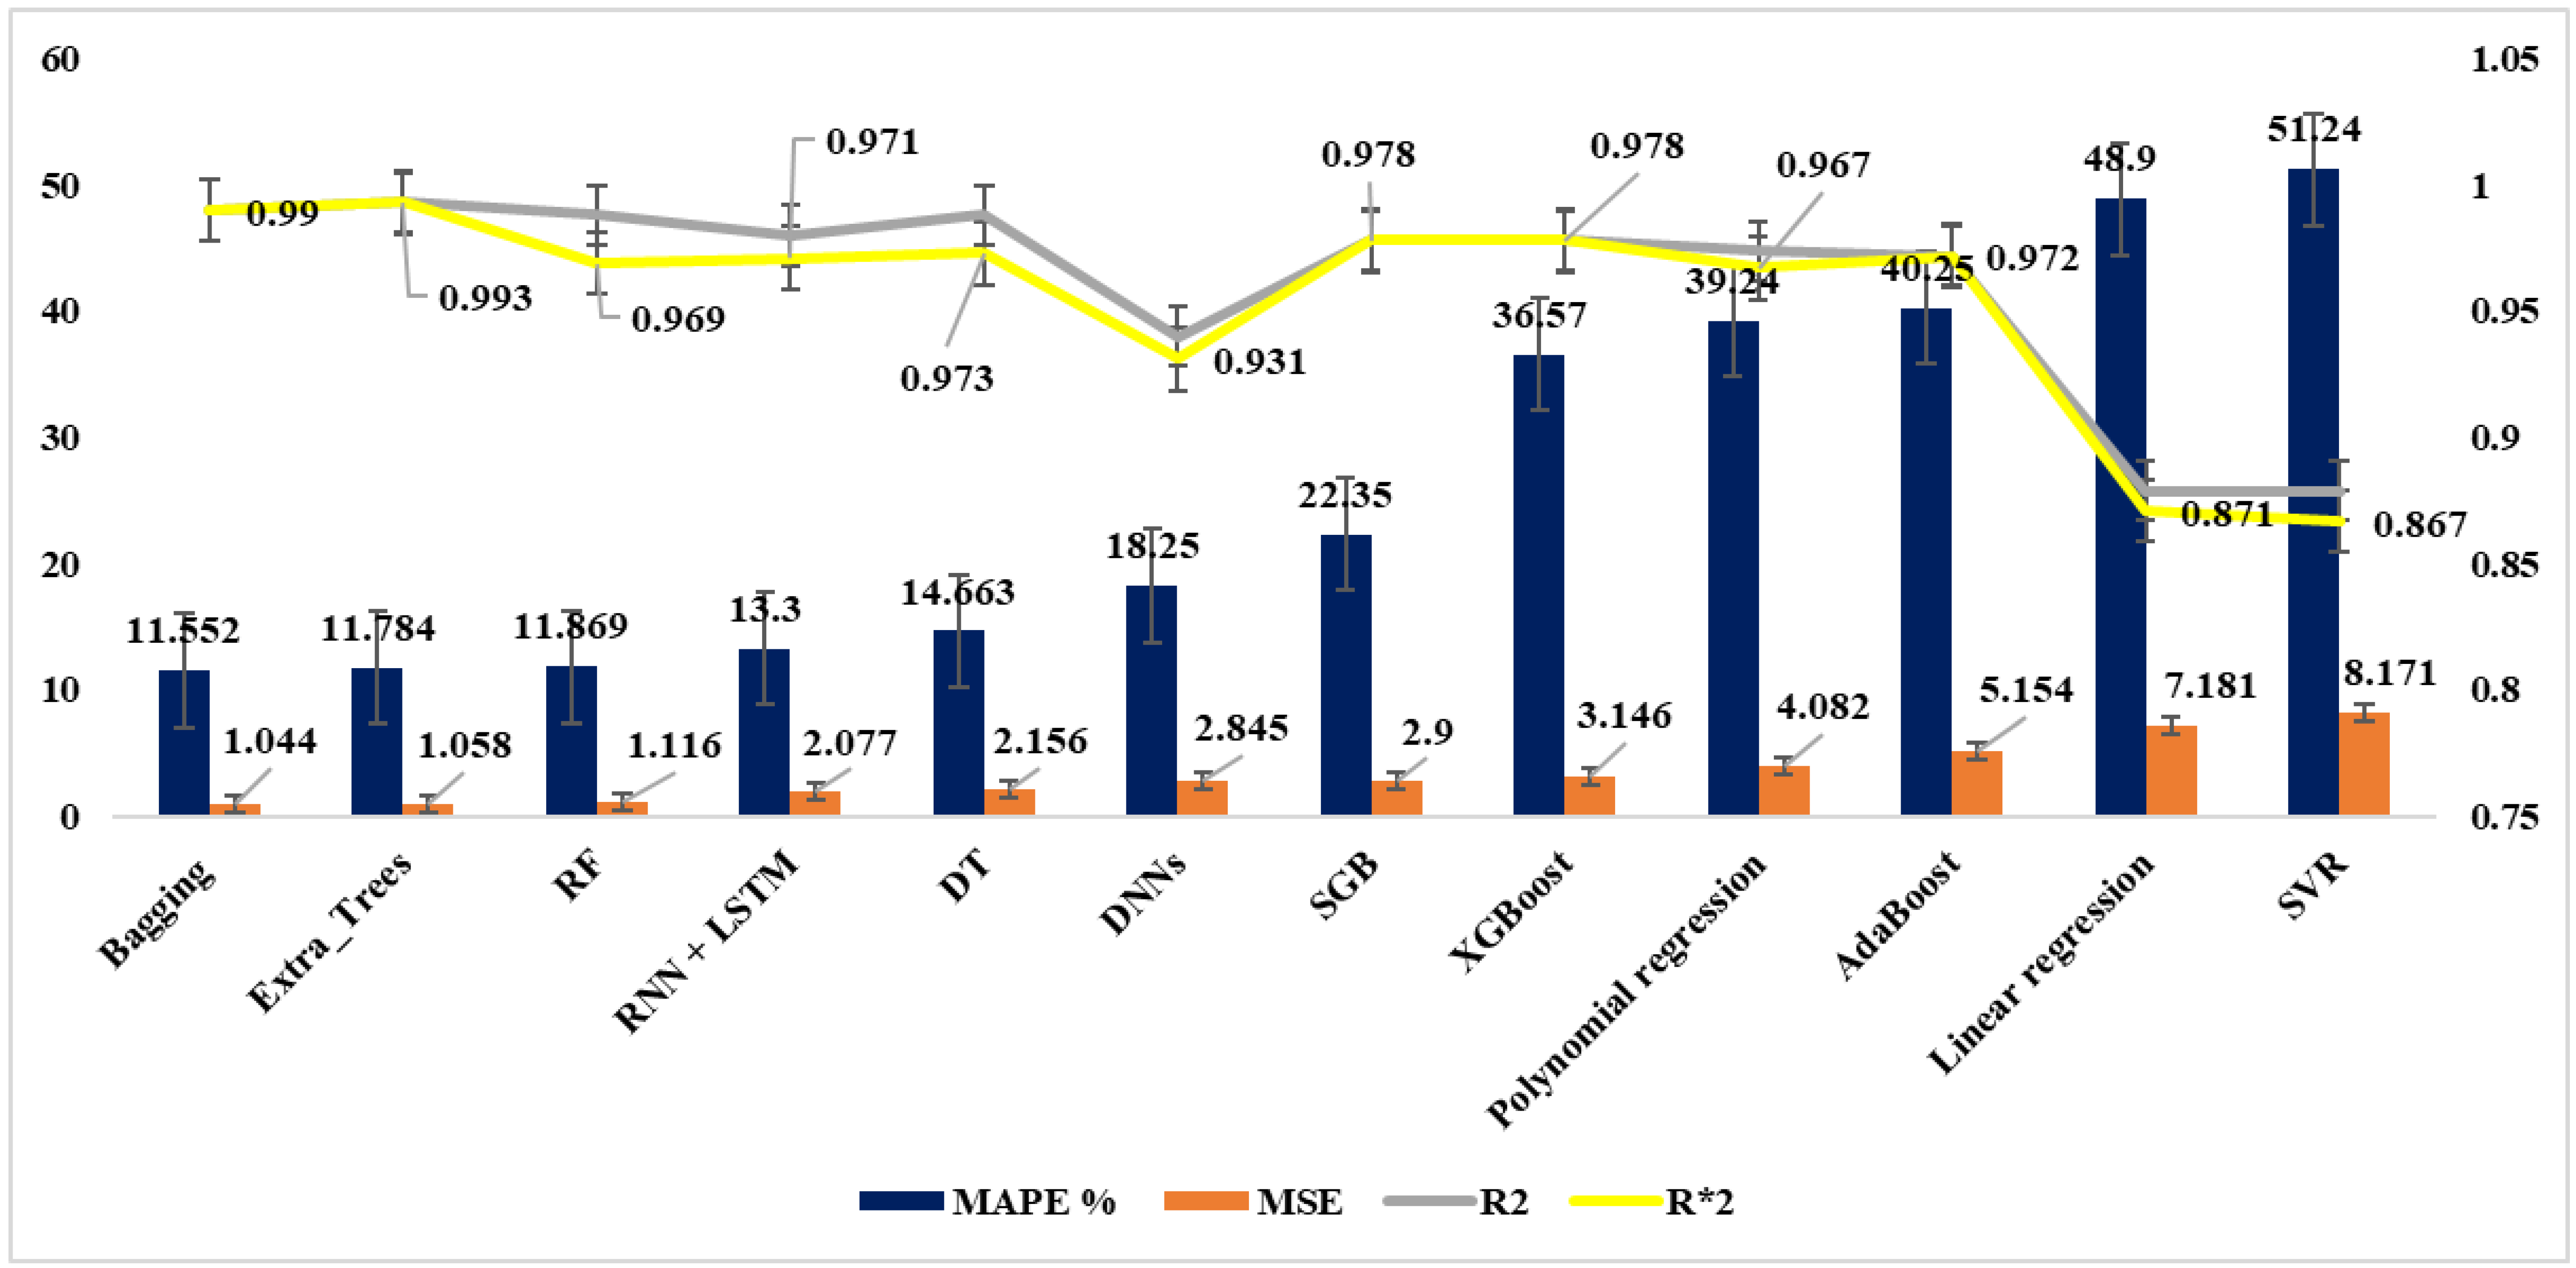
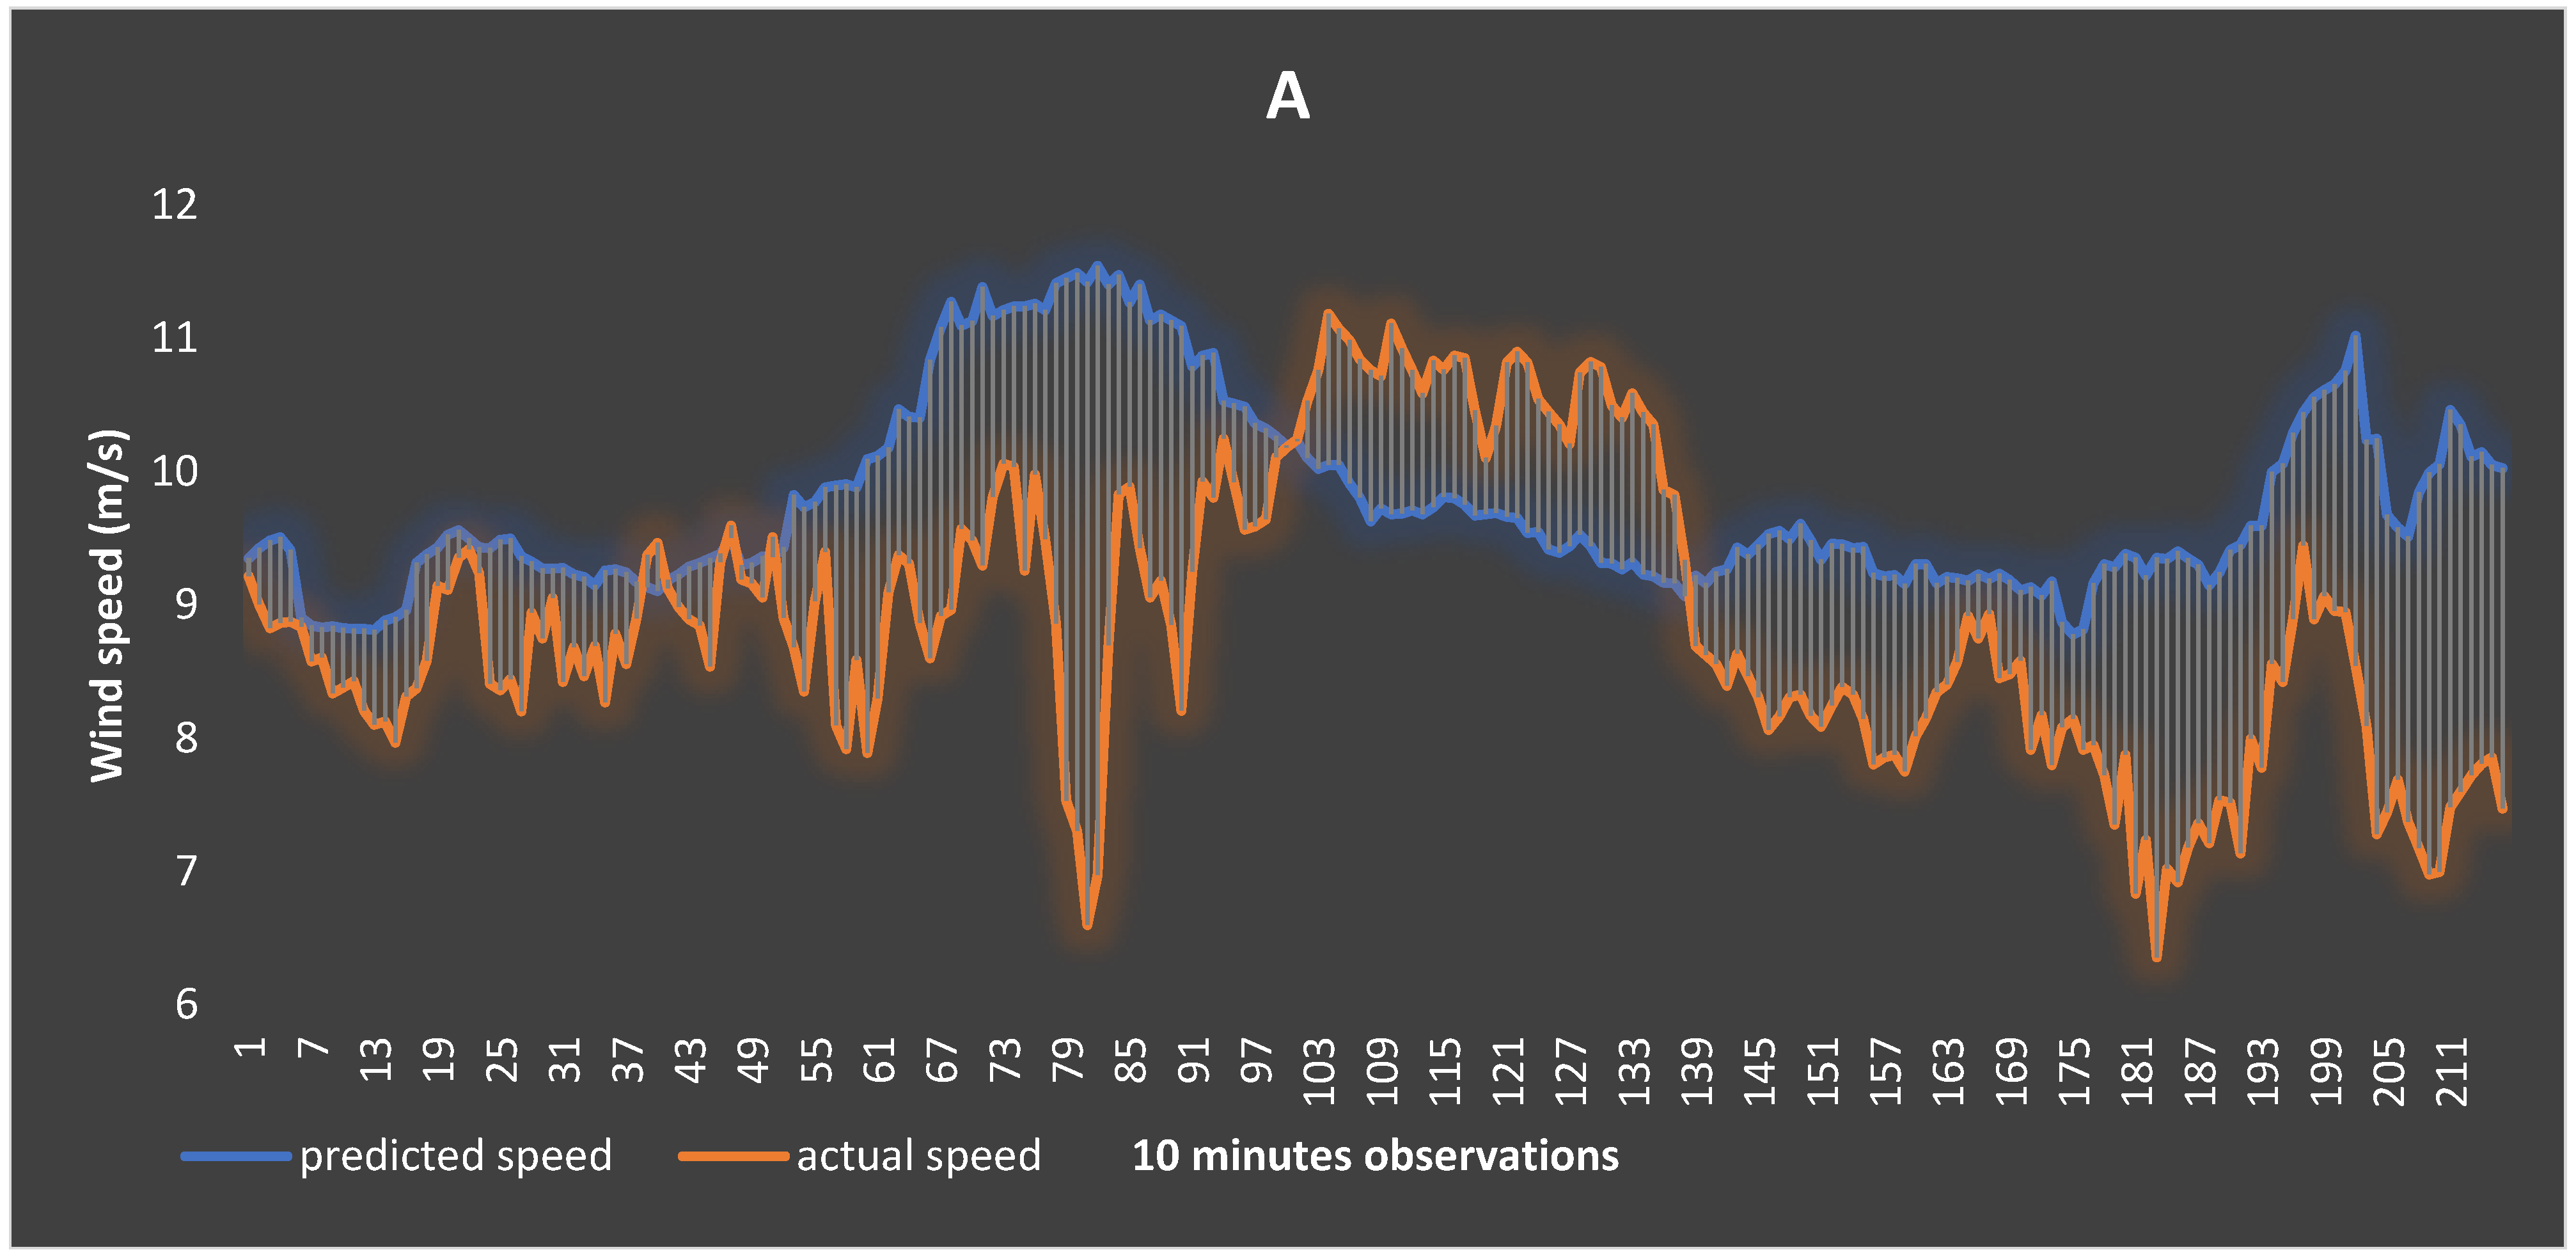
6.1. Results and Analysis of WSF

The performance of various ML models for wind speed forecasting (WSF) and wind power forecasting (WPF) was assessed using evaluation metrics such as MAPE, MSE, and adjusted R2. For very short-term WSF (10 min scale), Extra Trees, Random Forest (RF), Decision Tree (DT), and XGBoost were the most accurate models. Extra Trees achieved the lowest MAPE (3.485%) and MSE (0.254), while DT and RF had the highest adjusted R2 values of 0.989 and 0.984 (Figure 6). In contrast, Deep Neural Networks (DNNs) and Linear Regression performed poorly, with MAPE values of 42.343% and 46.724%, respectively.
At the 30 min scale (Figure 7), DT and Extra Trees remained the top performers, achieving MAPE values of 7.8% and 8.635%. Bagging and RF also showed strong results, with MAPE values of 11.439% and 13.484%. Other models did not meet acceptable accuracy thresholds. For 6 h ahead WSF (Figure 8), DT, Bagging, Extra Trees, and RF excelled with MAPE values of 4.103%, 4.171%, 4.6%, and 4.9%, respectively, consistently outperforming regression and DNN models.
For 24 h ahead WSF (Figure 9), DT, Bagging, Extra Trees, and RF again led the rankings, achieving MAPE values of 4.645%, 5.179%, 6.502%, and 6.538%. While models like XGBoost and polynomial regression performed satisfactorily, DNN and SVM models showed poor accuracy. Finally, at the 36 h scale (Figure 10), Extra Trees, DT, Bagging, and RF continued their strong performance, with MAPE values around 9%, reinforcing their reliability across time scales. Overall, tree-based and ensemble models, particularly Extra Trees and DT, consistently outperformed others for WSF, while DNNs underperformed across all time scales.

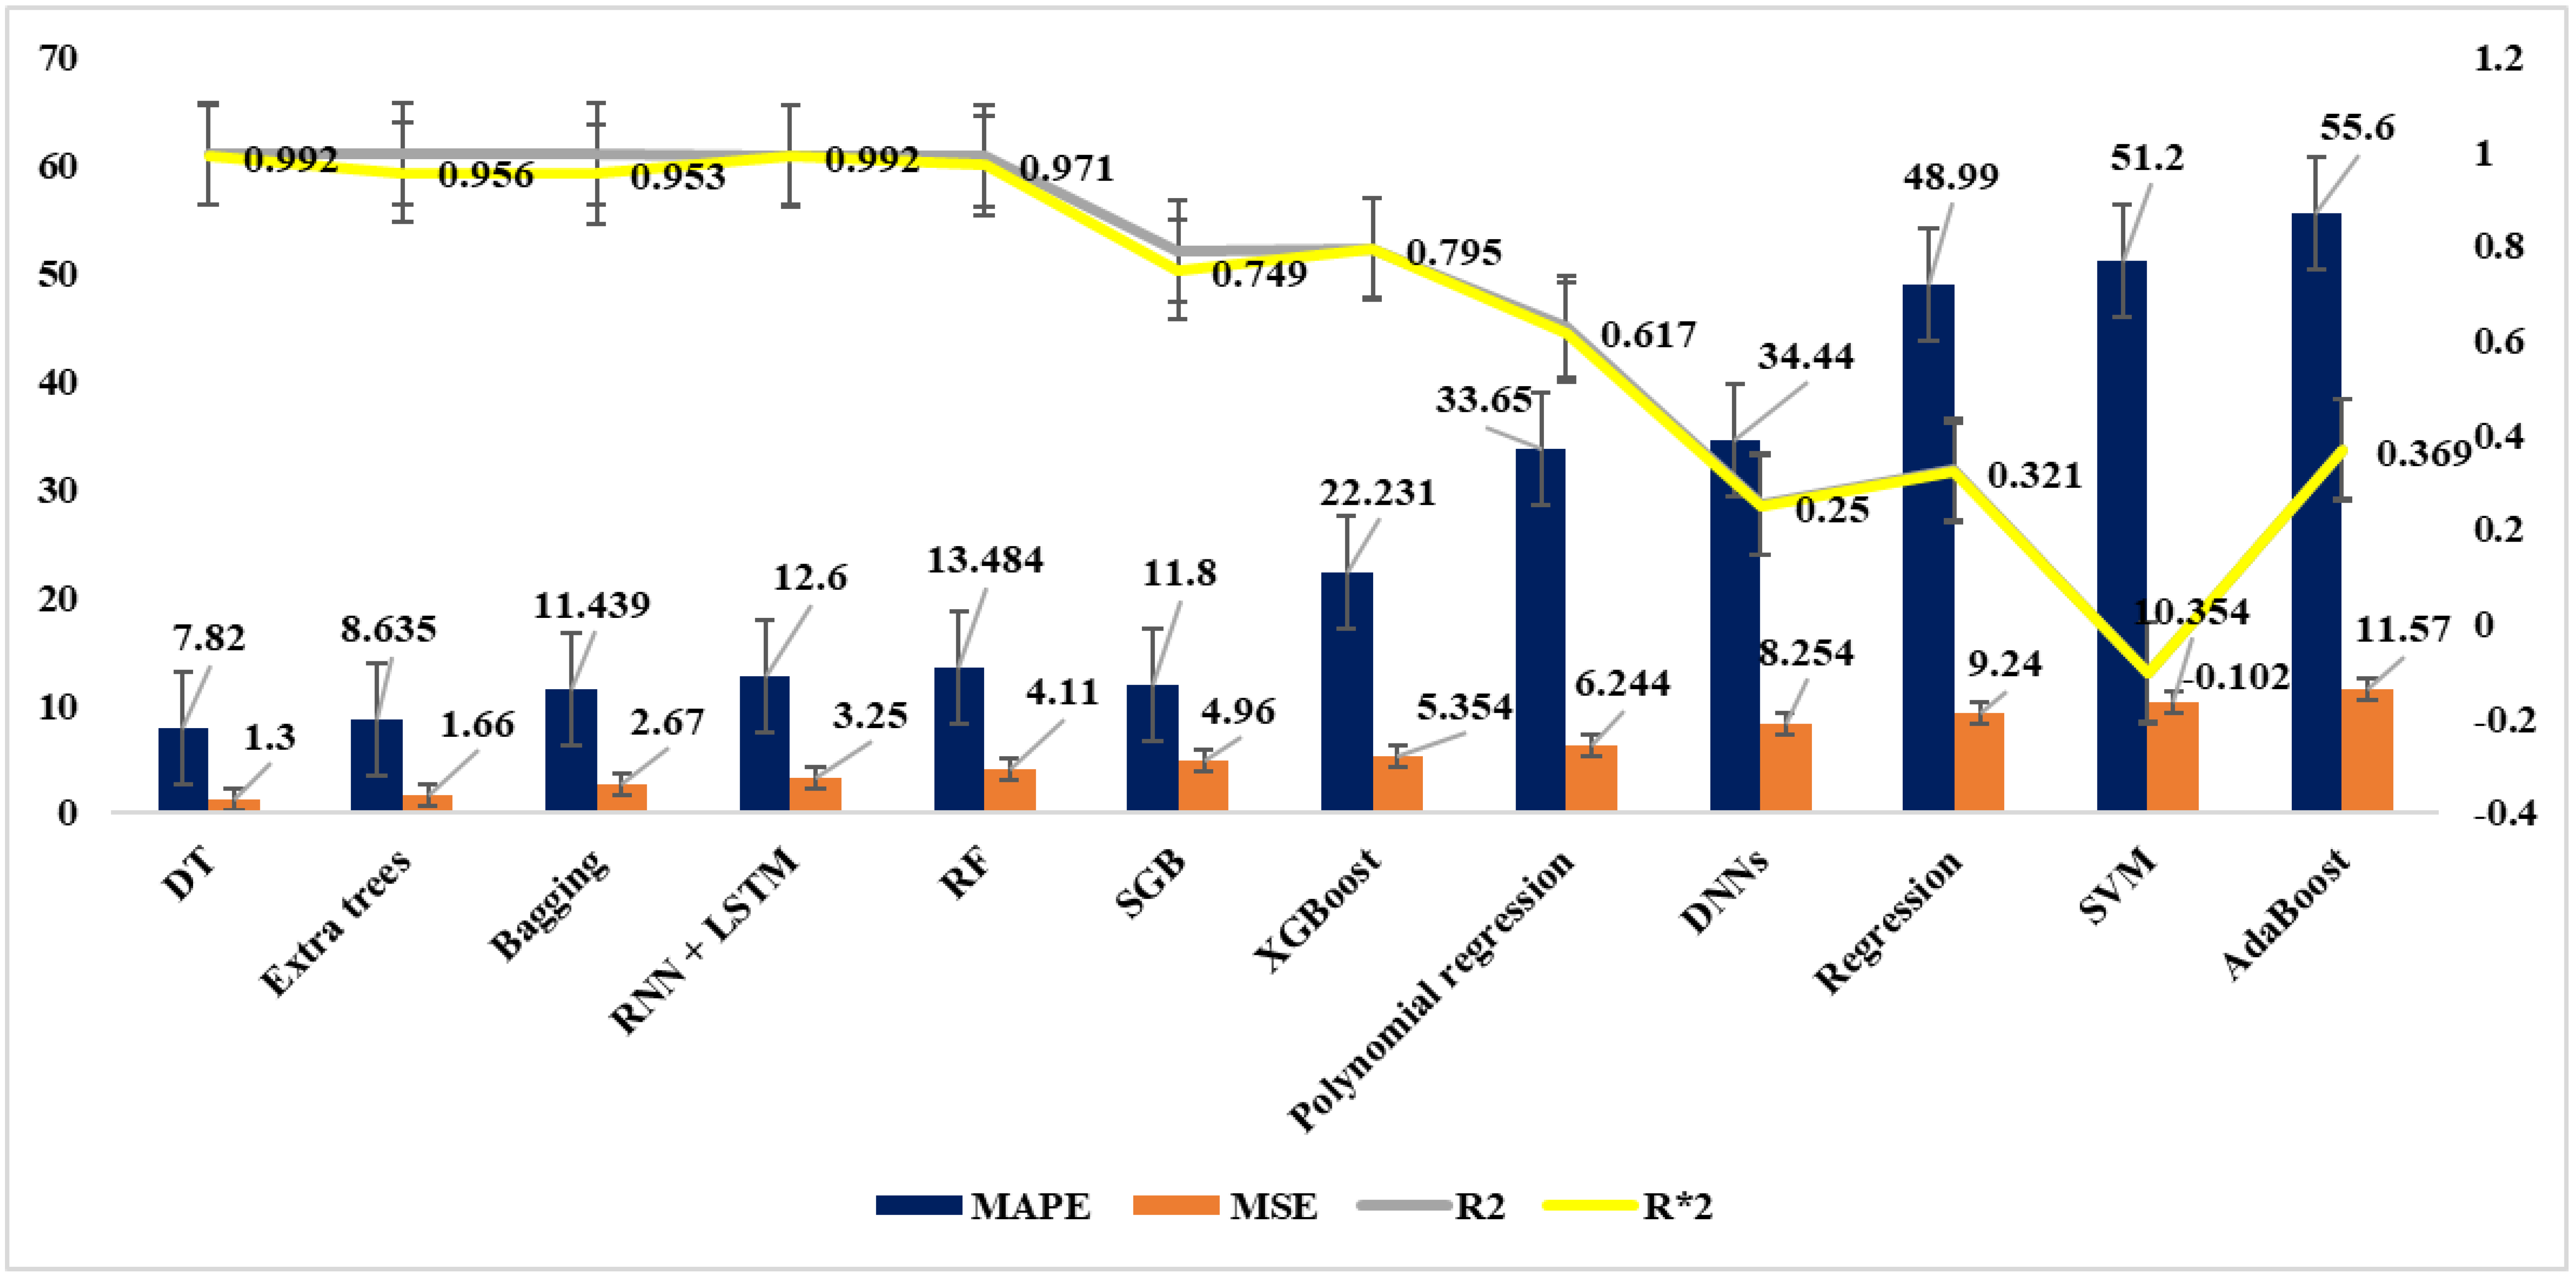
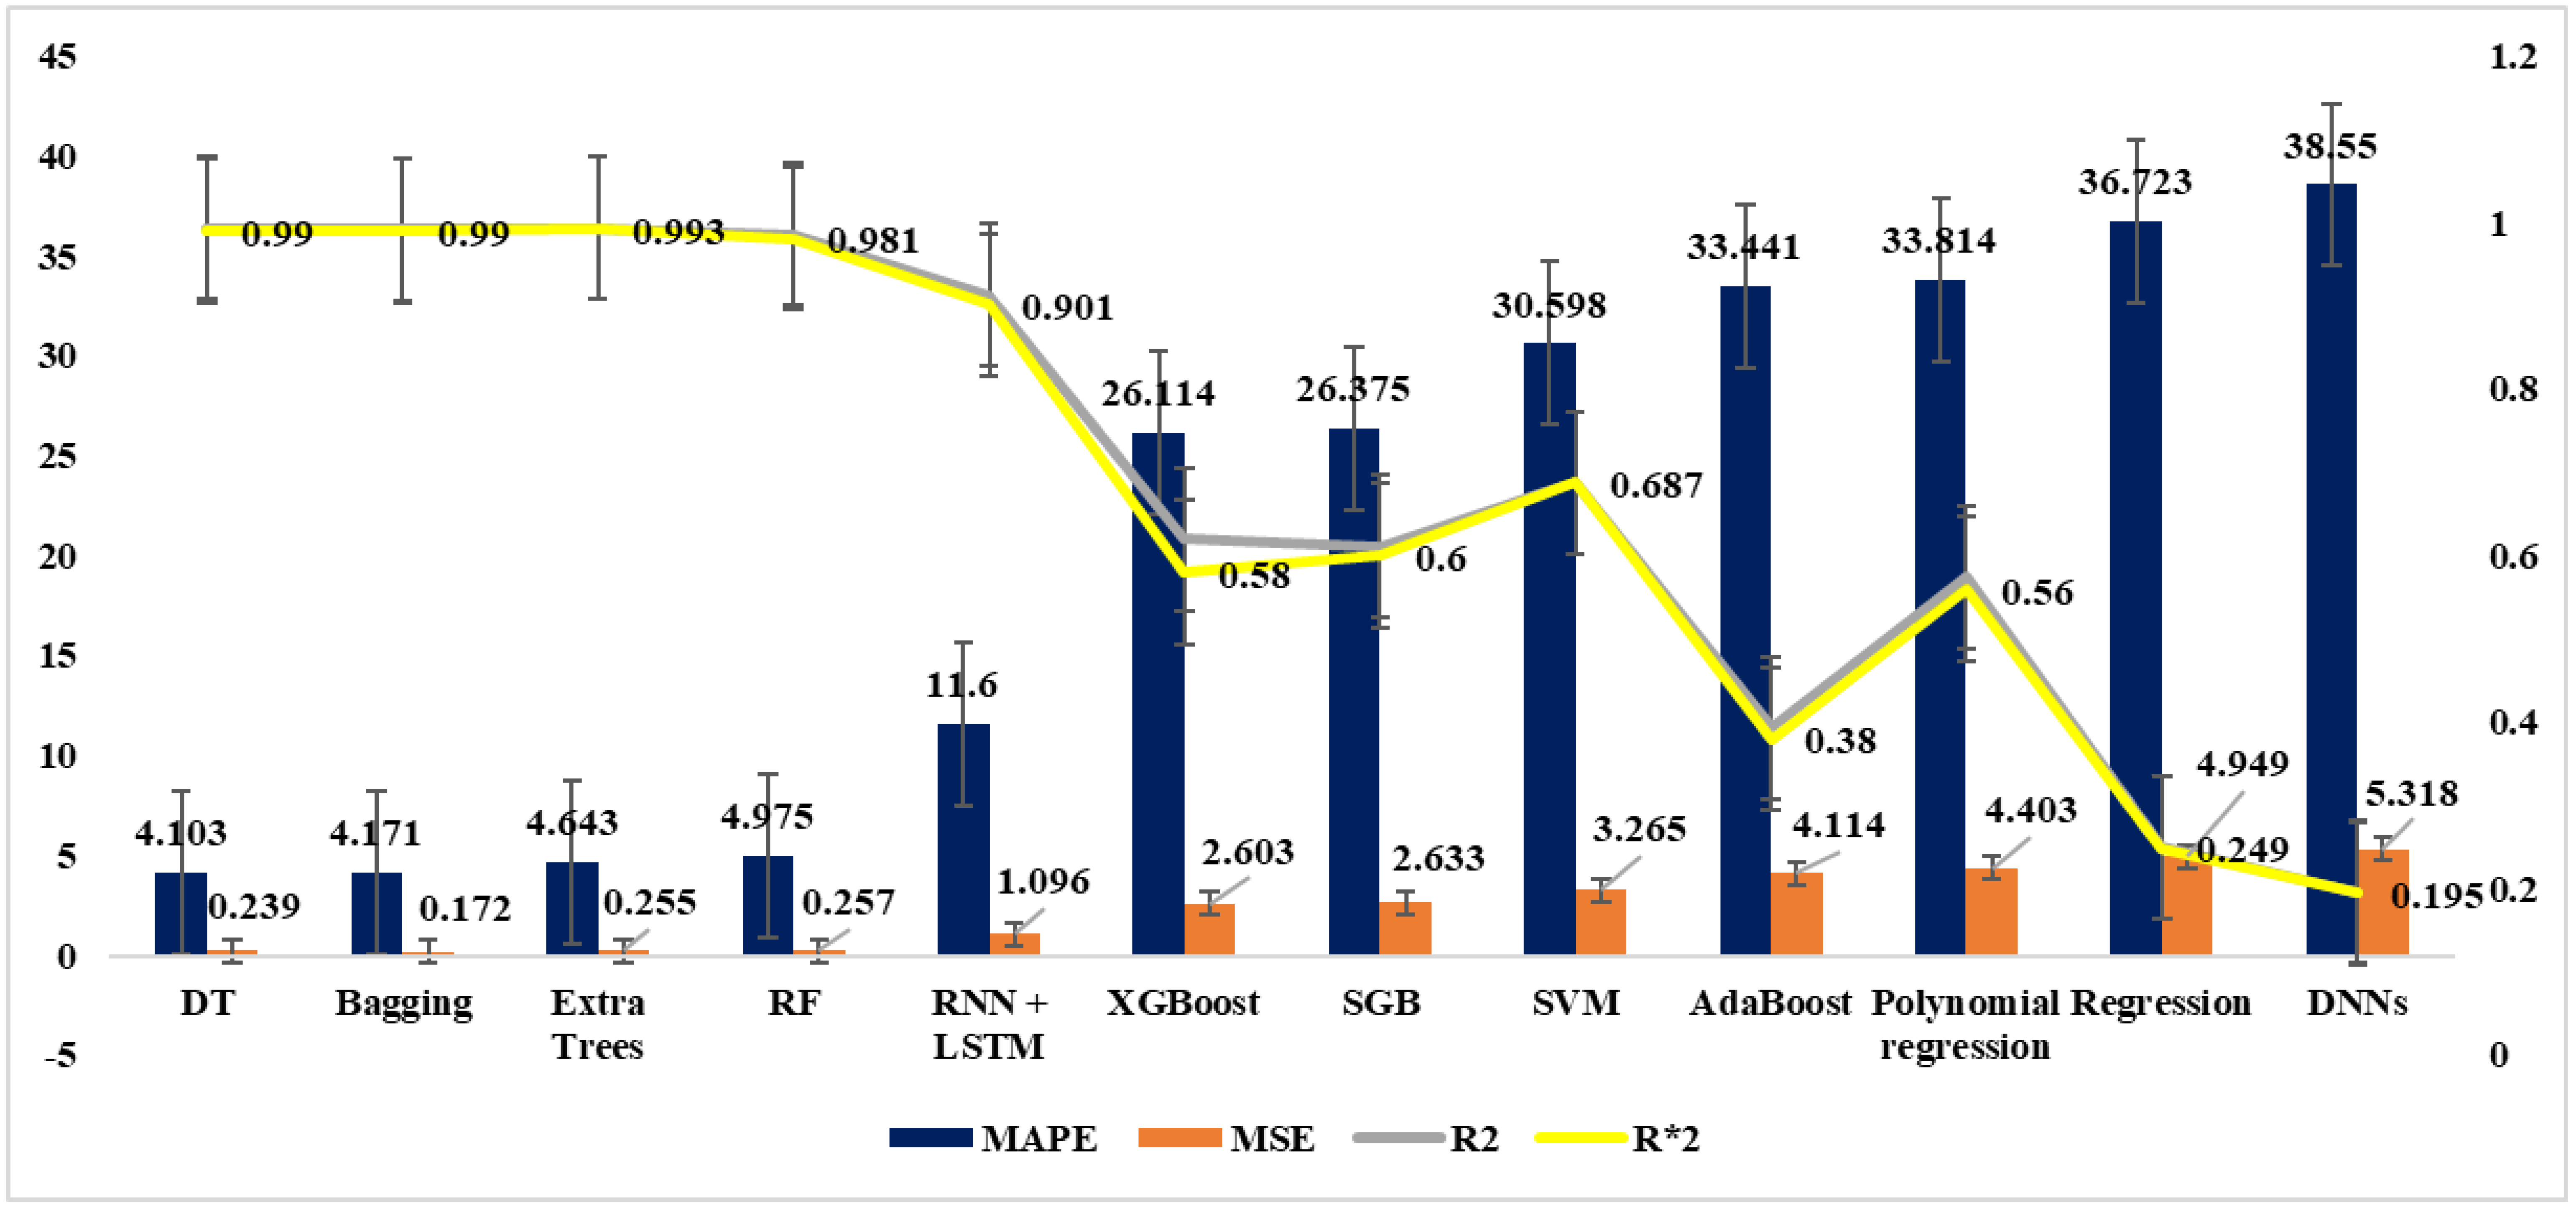
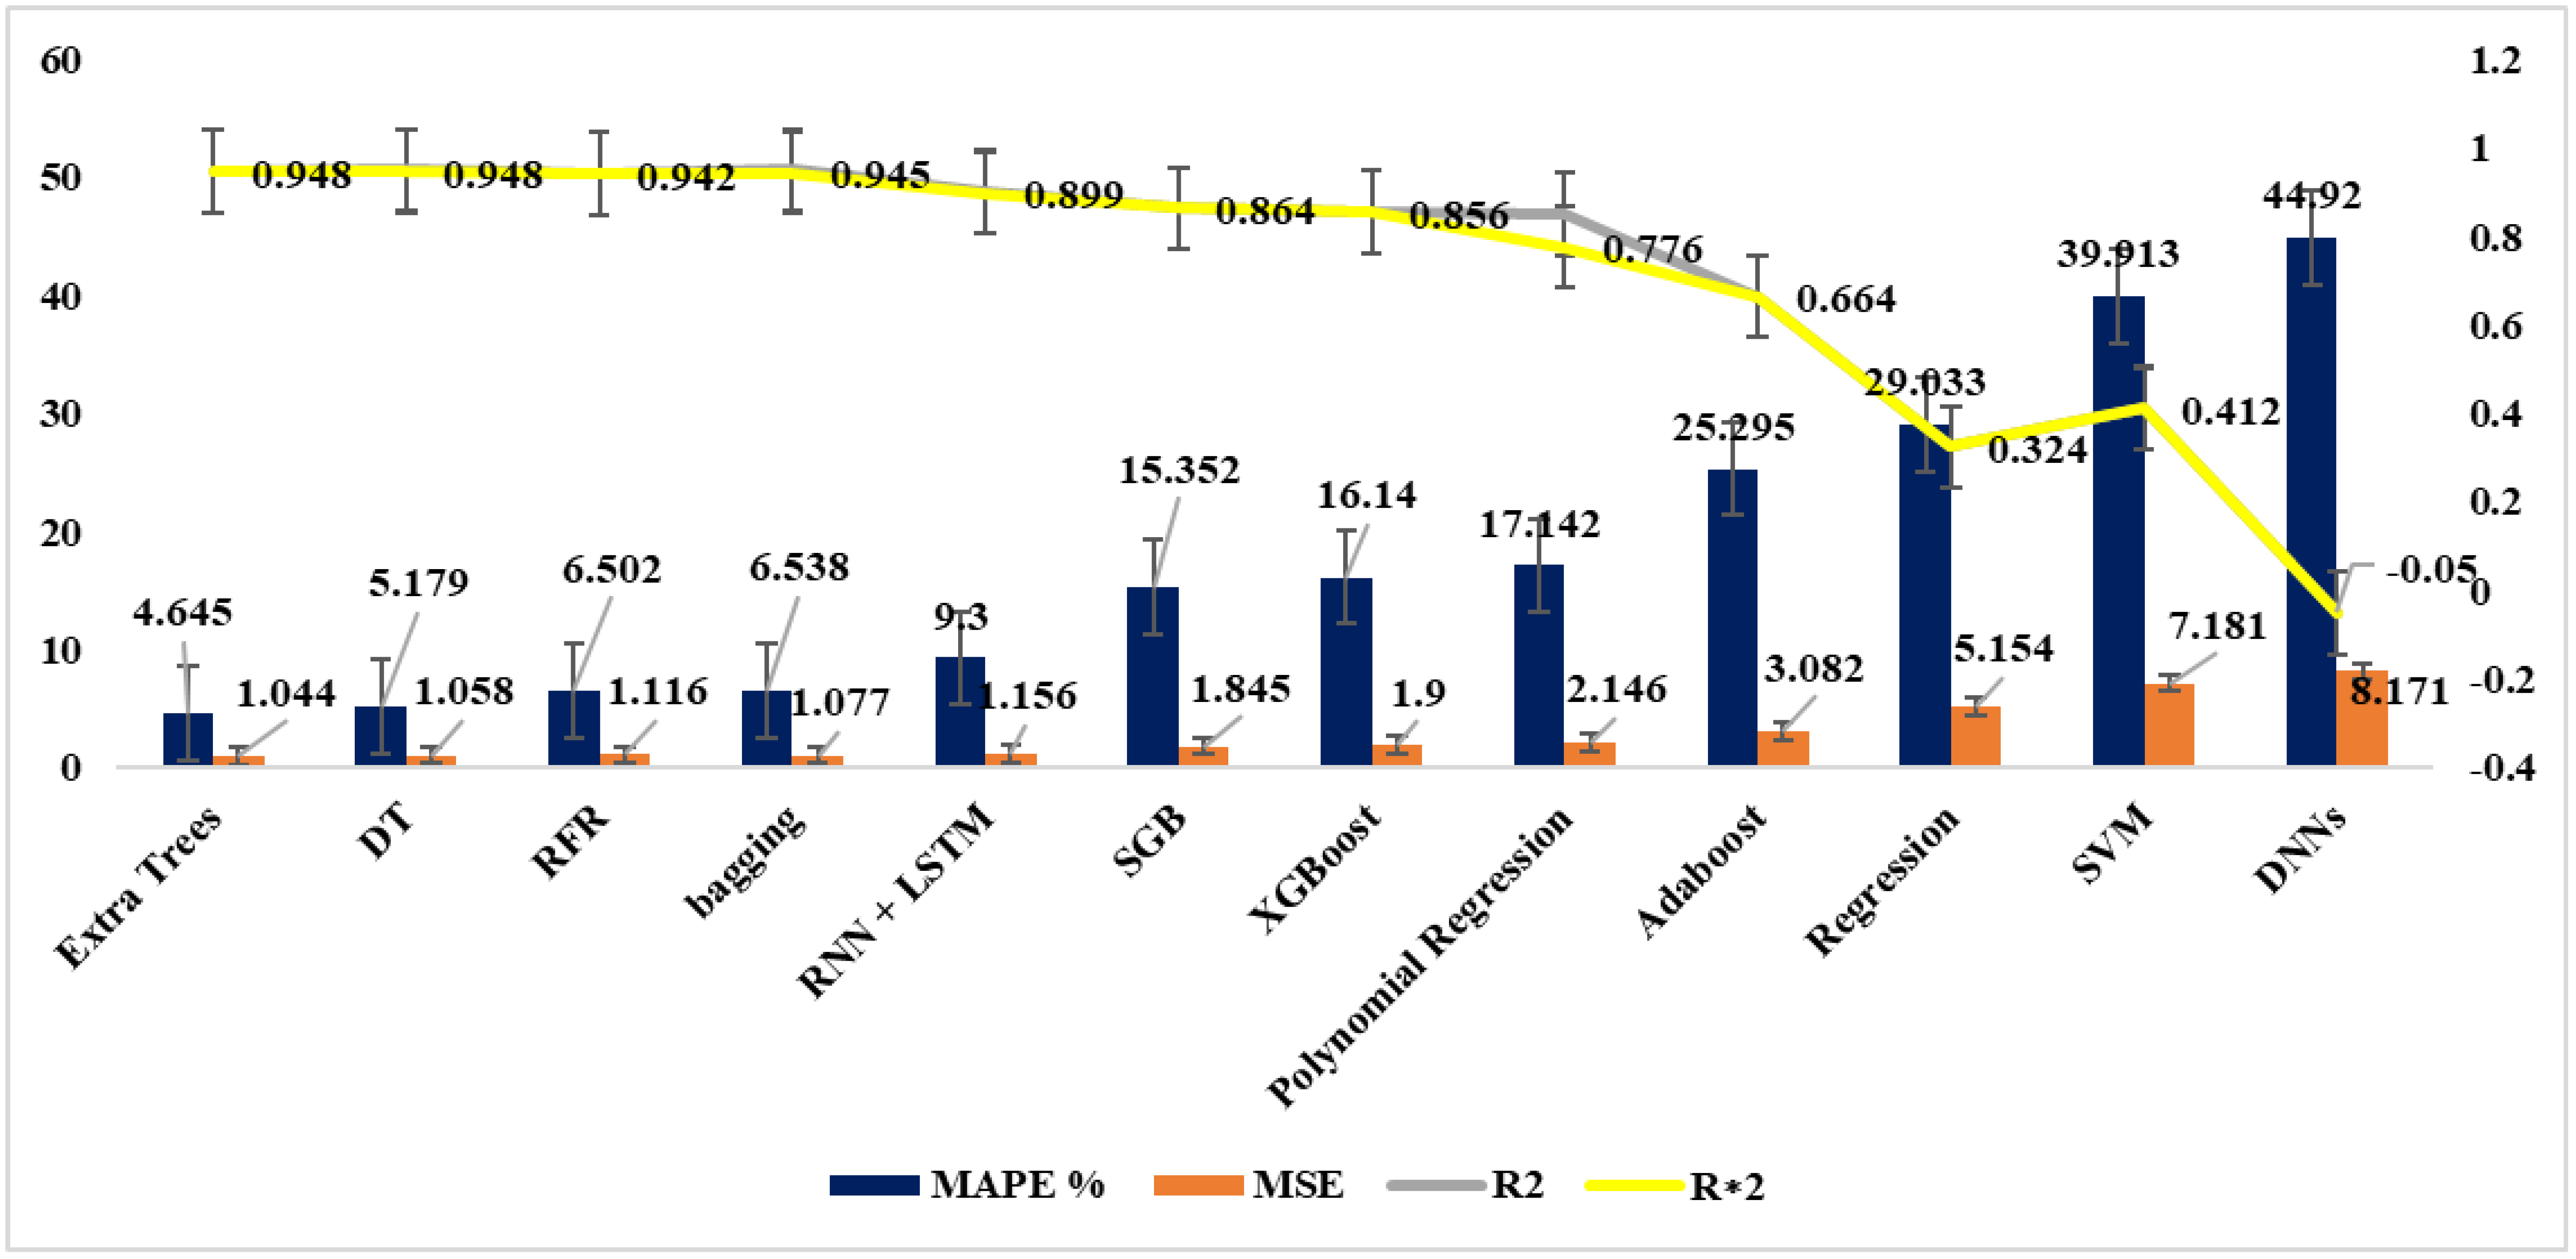
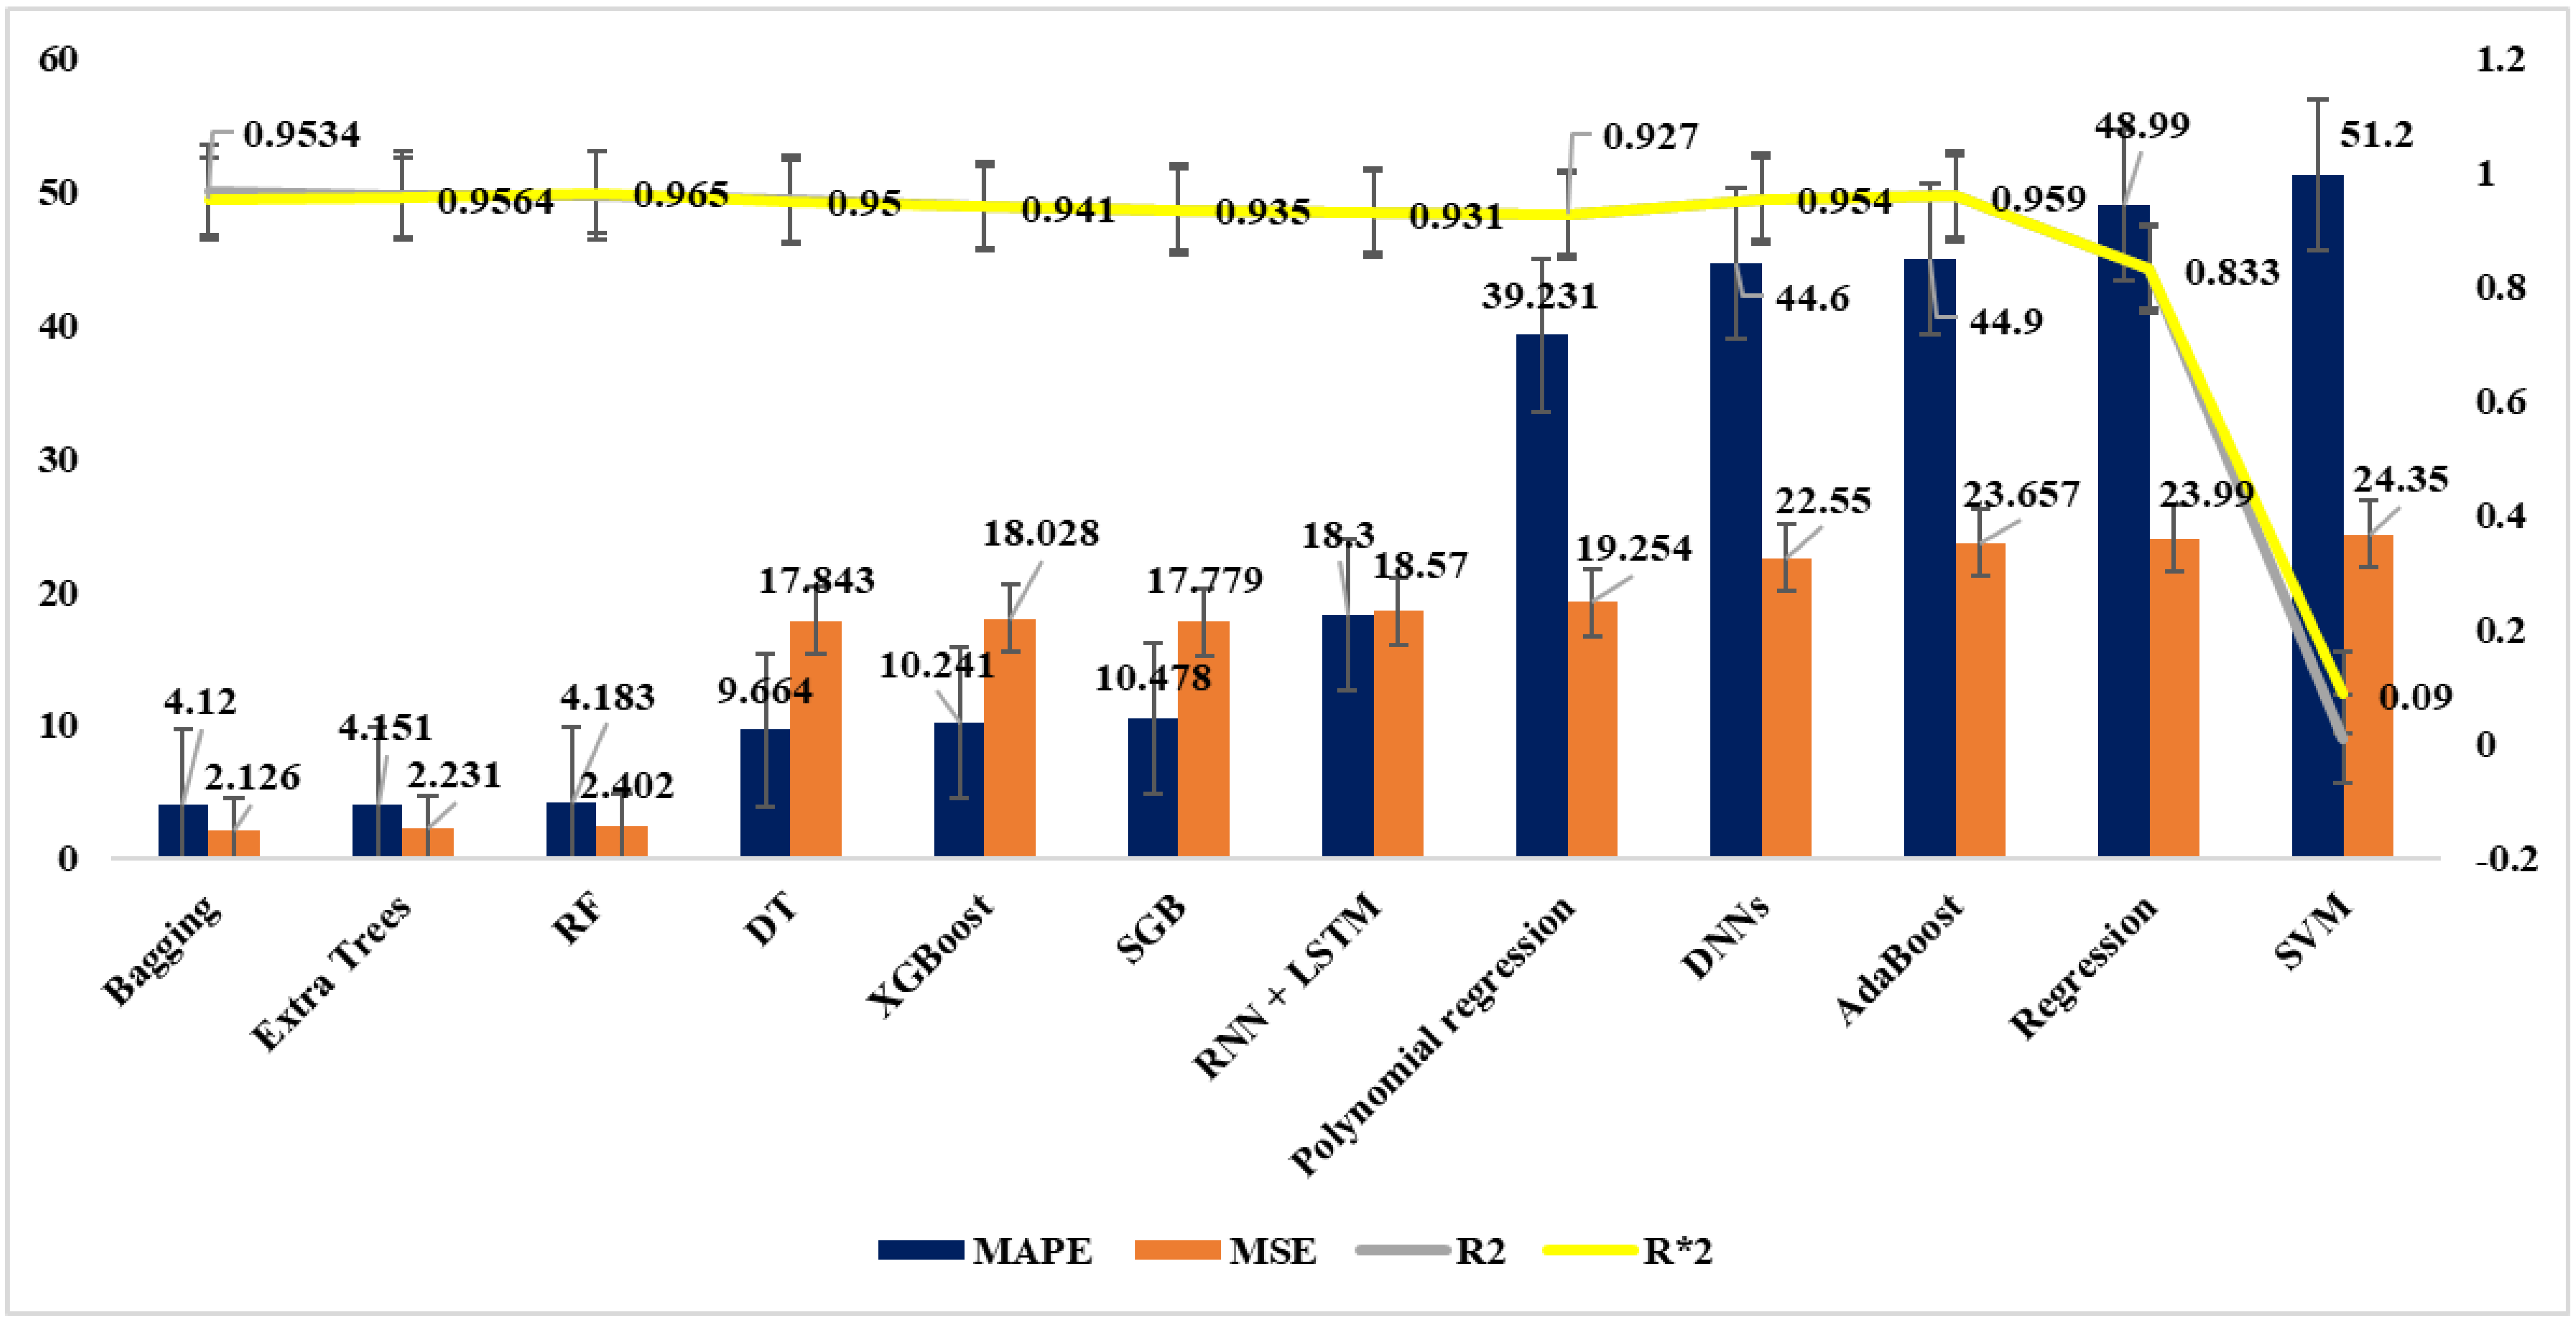
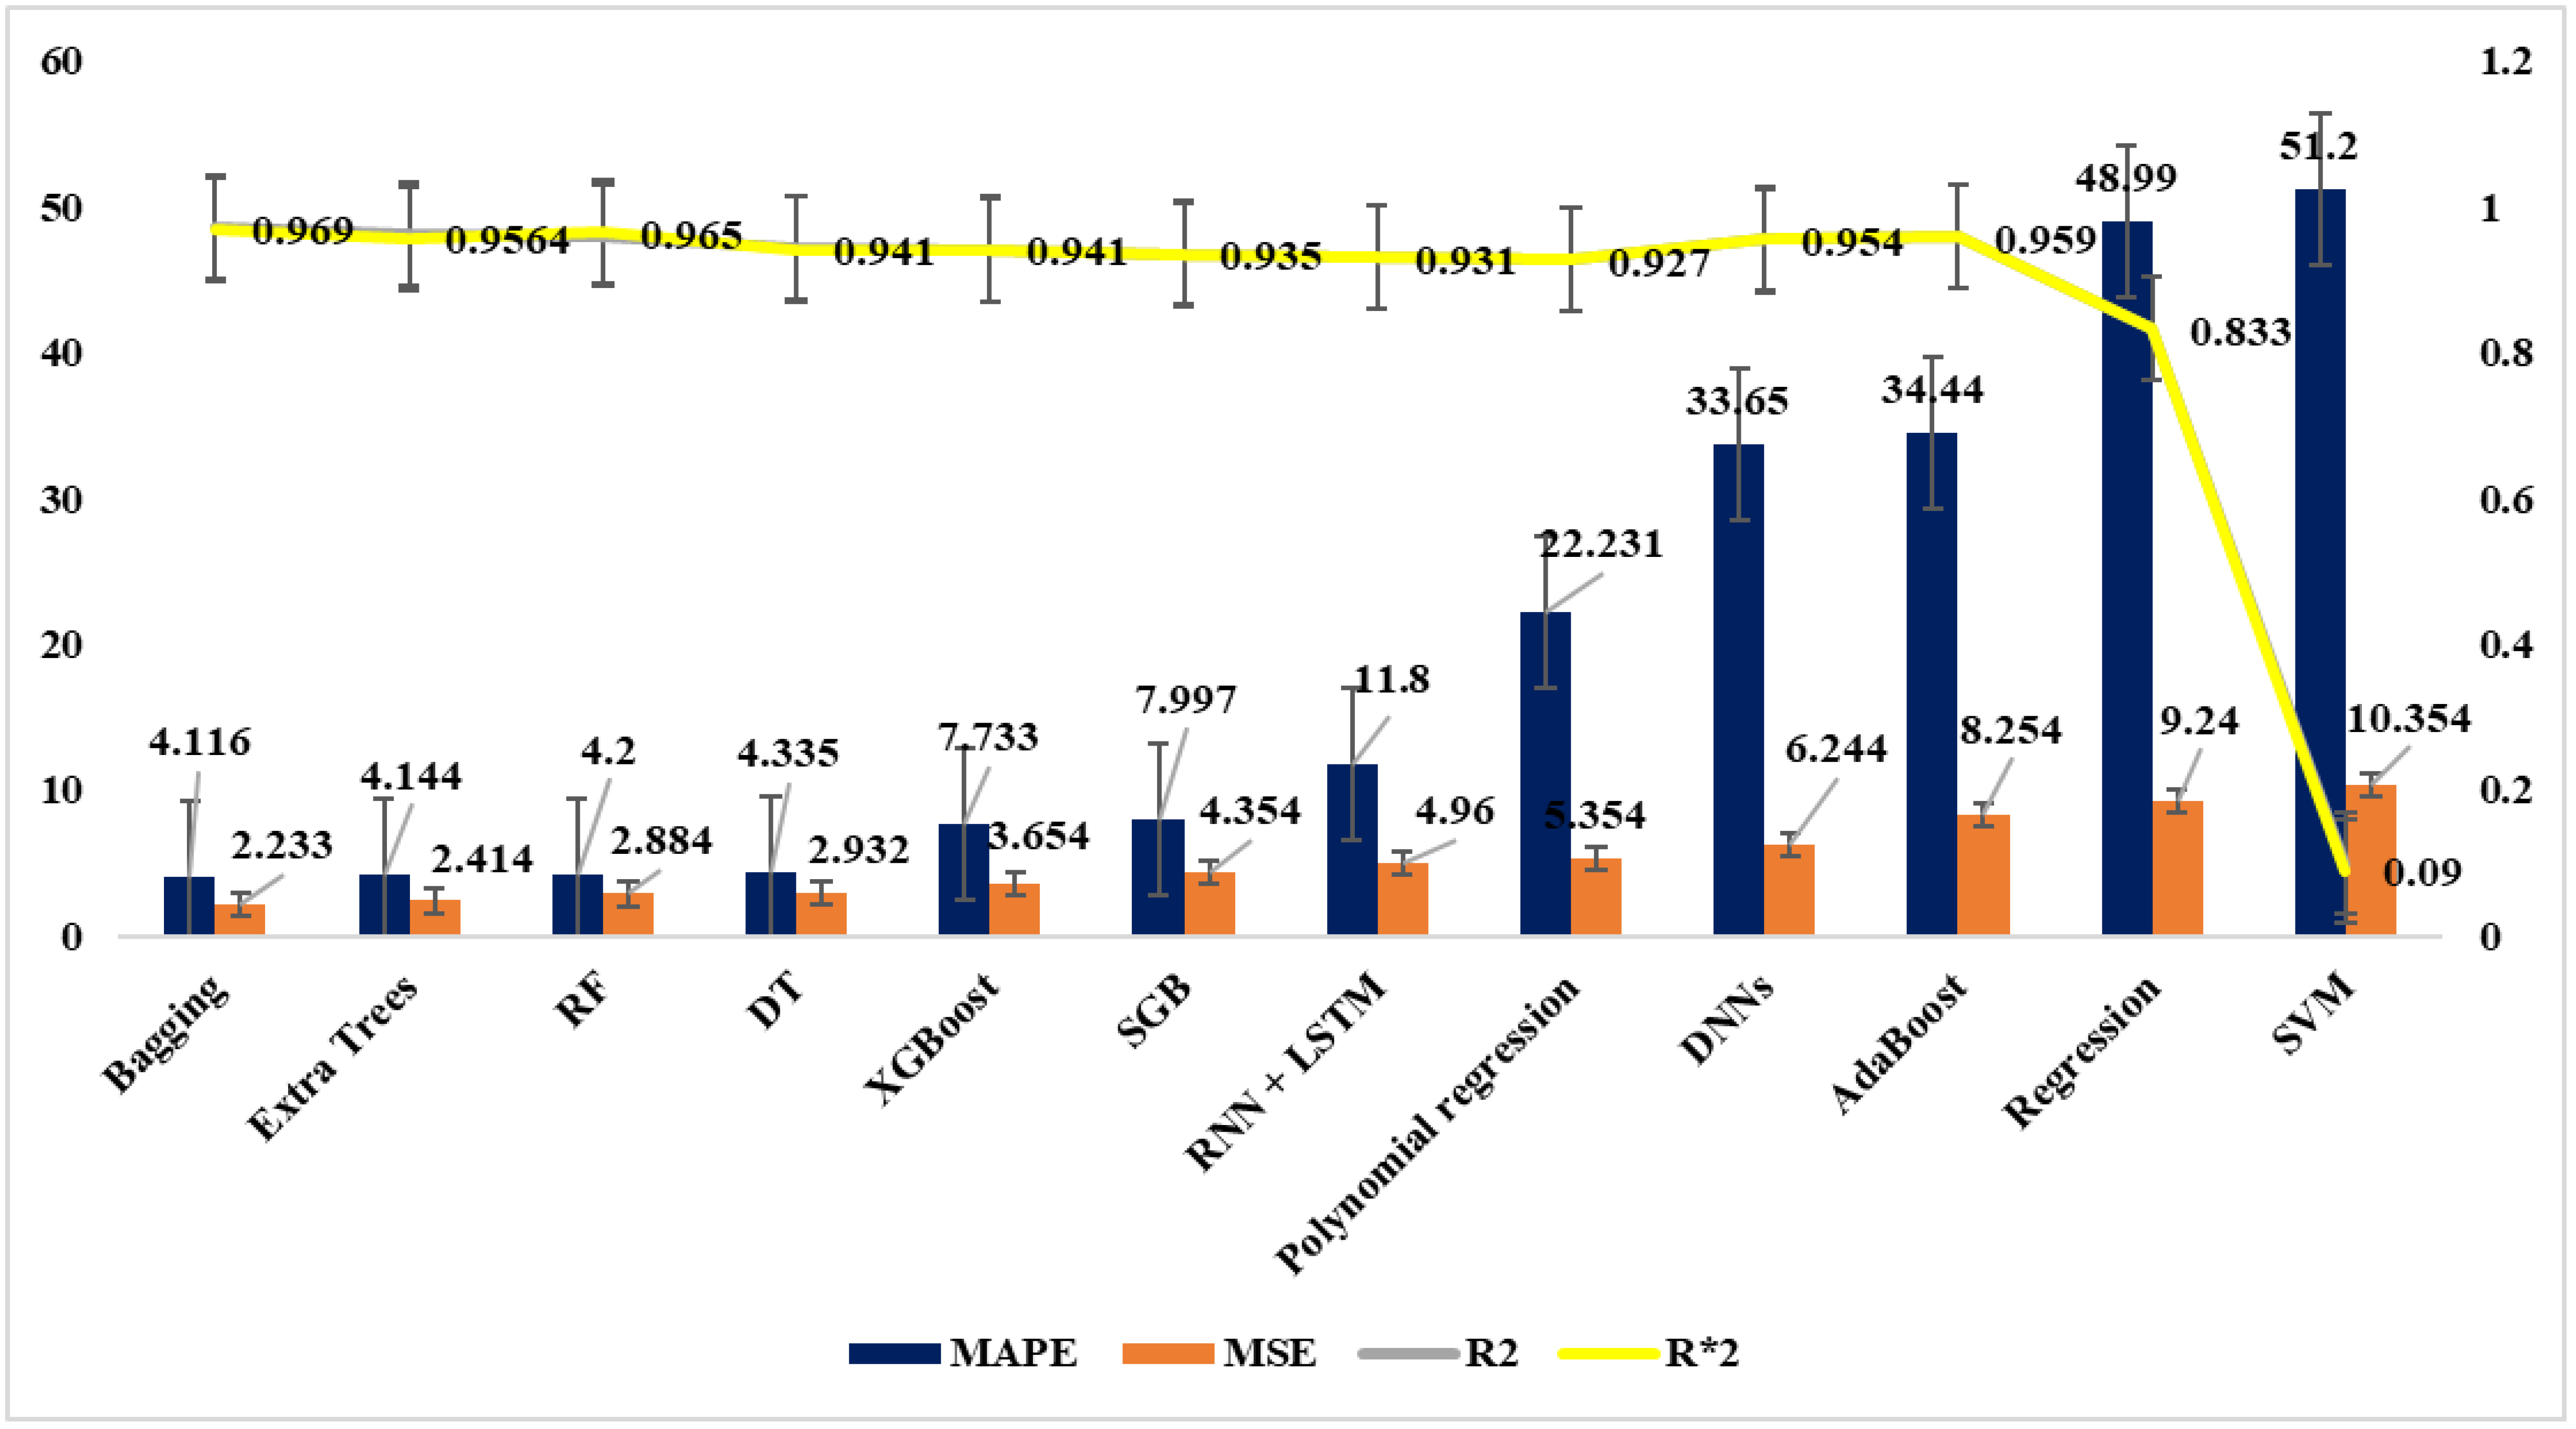
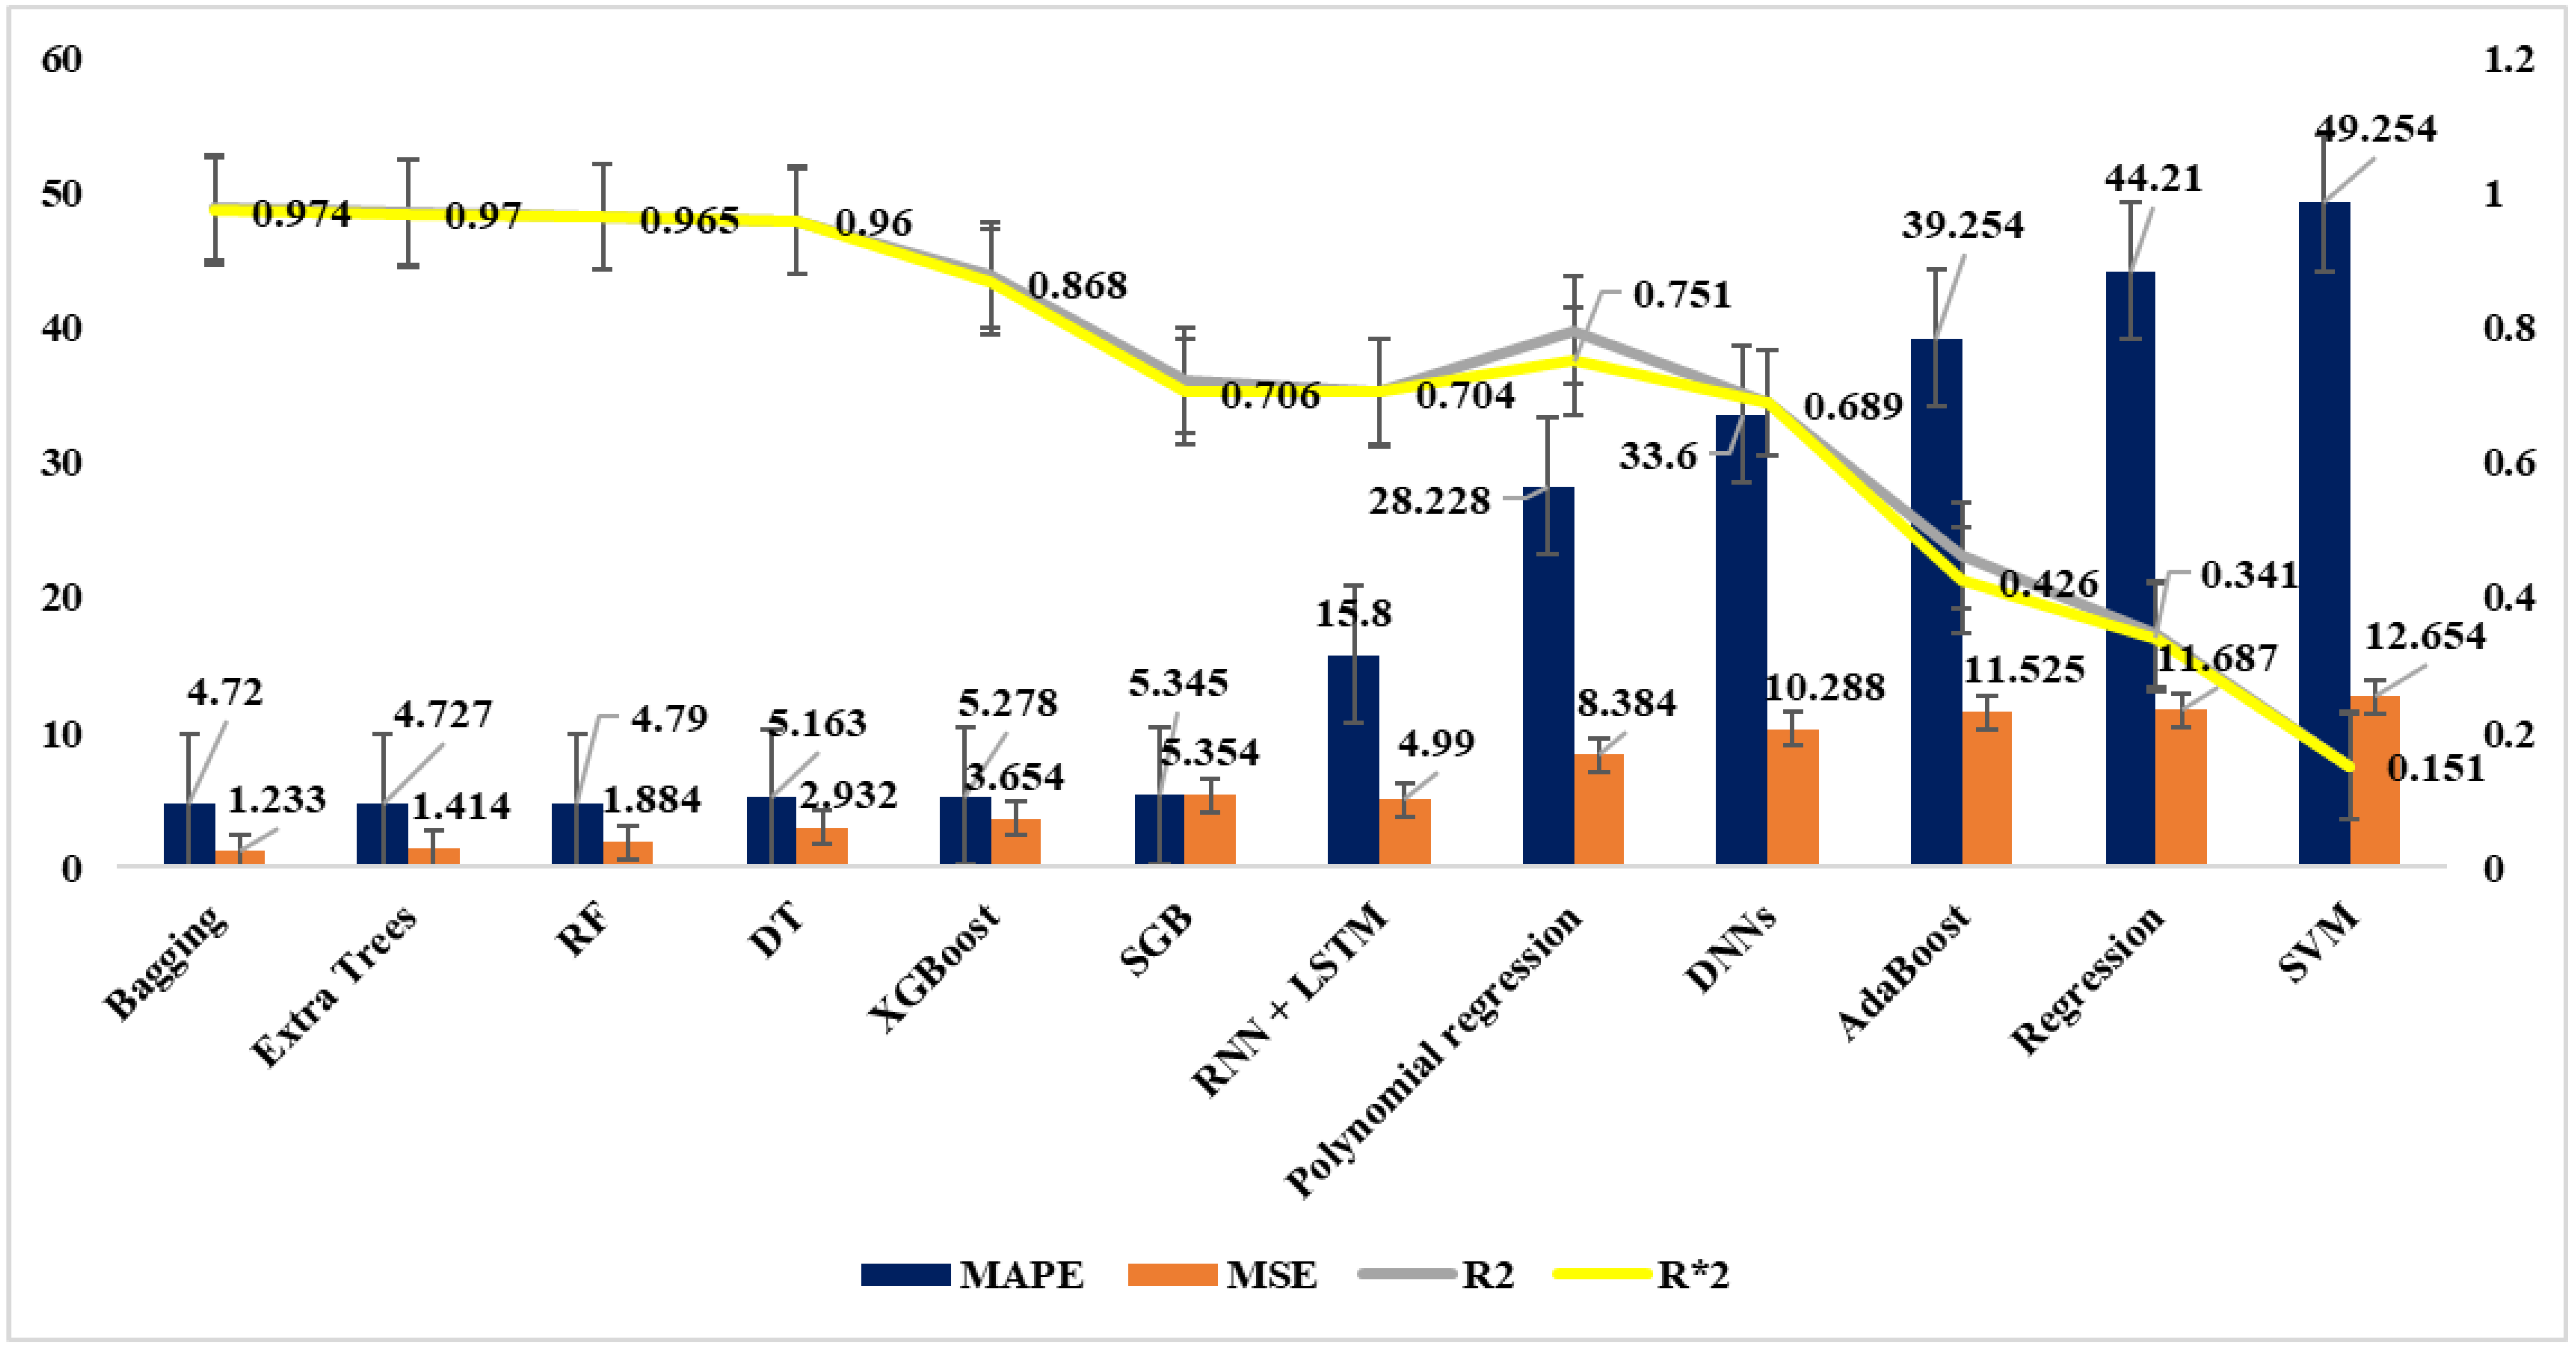
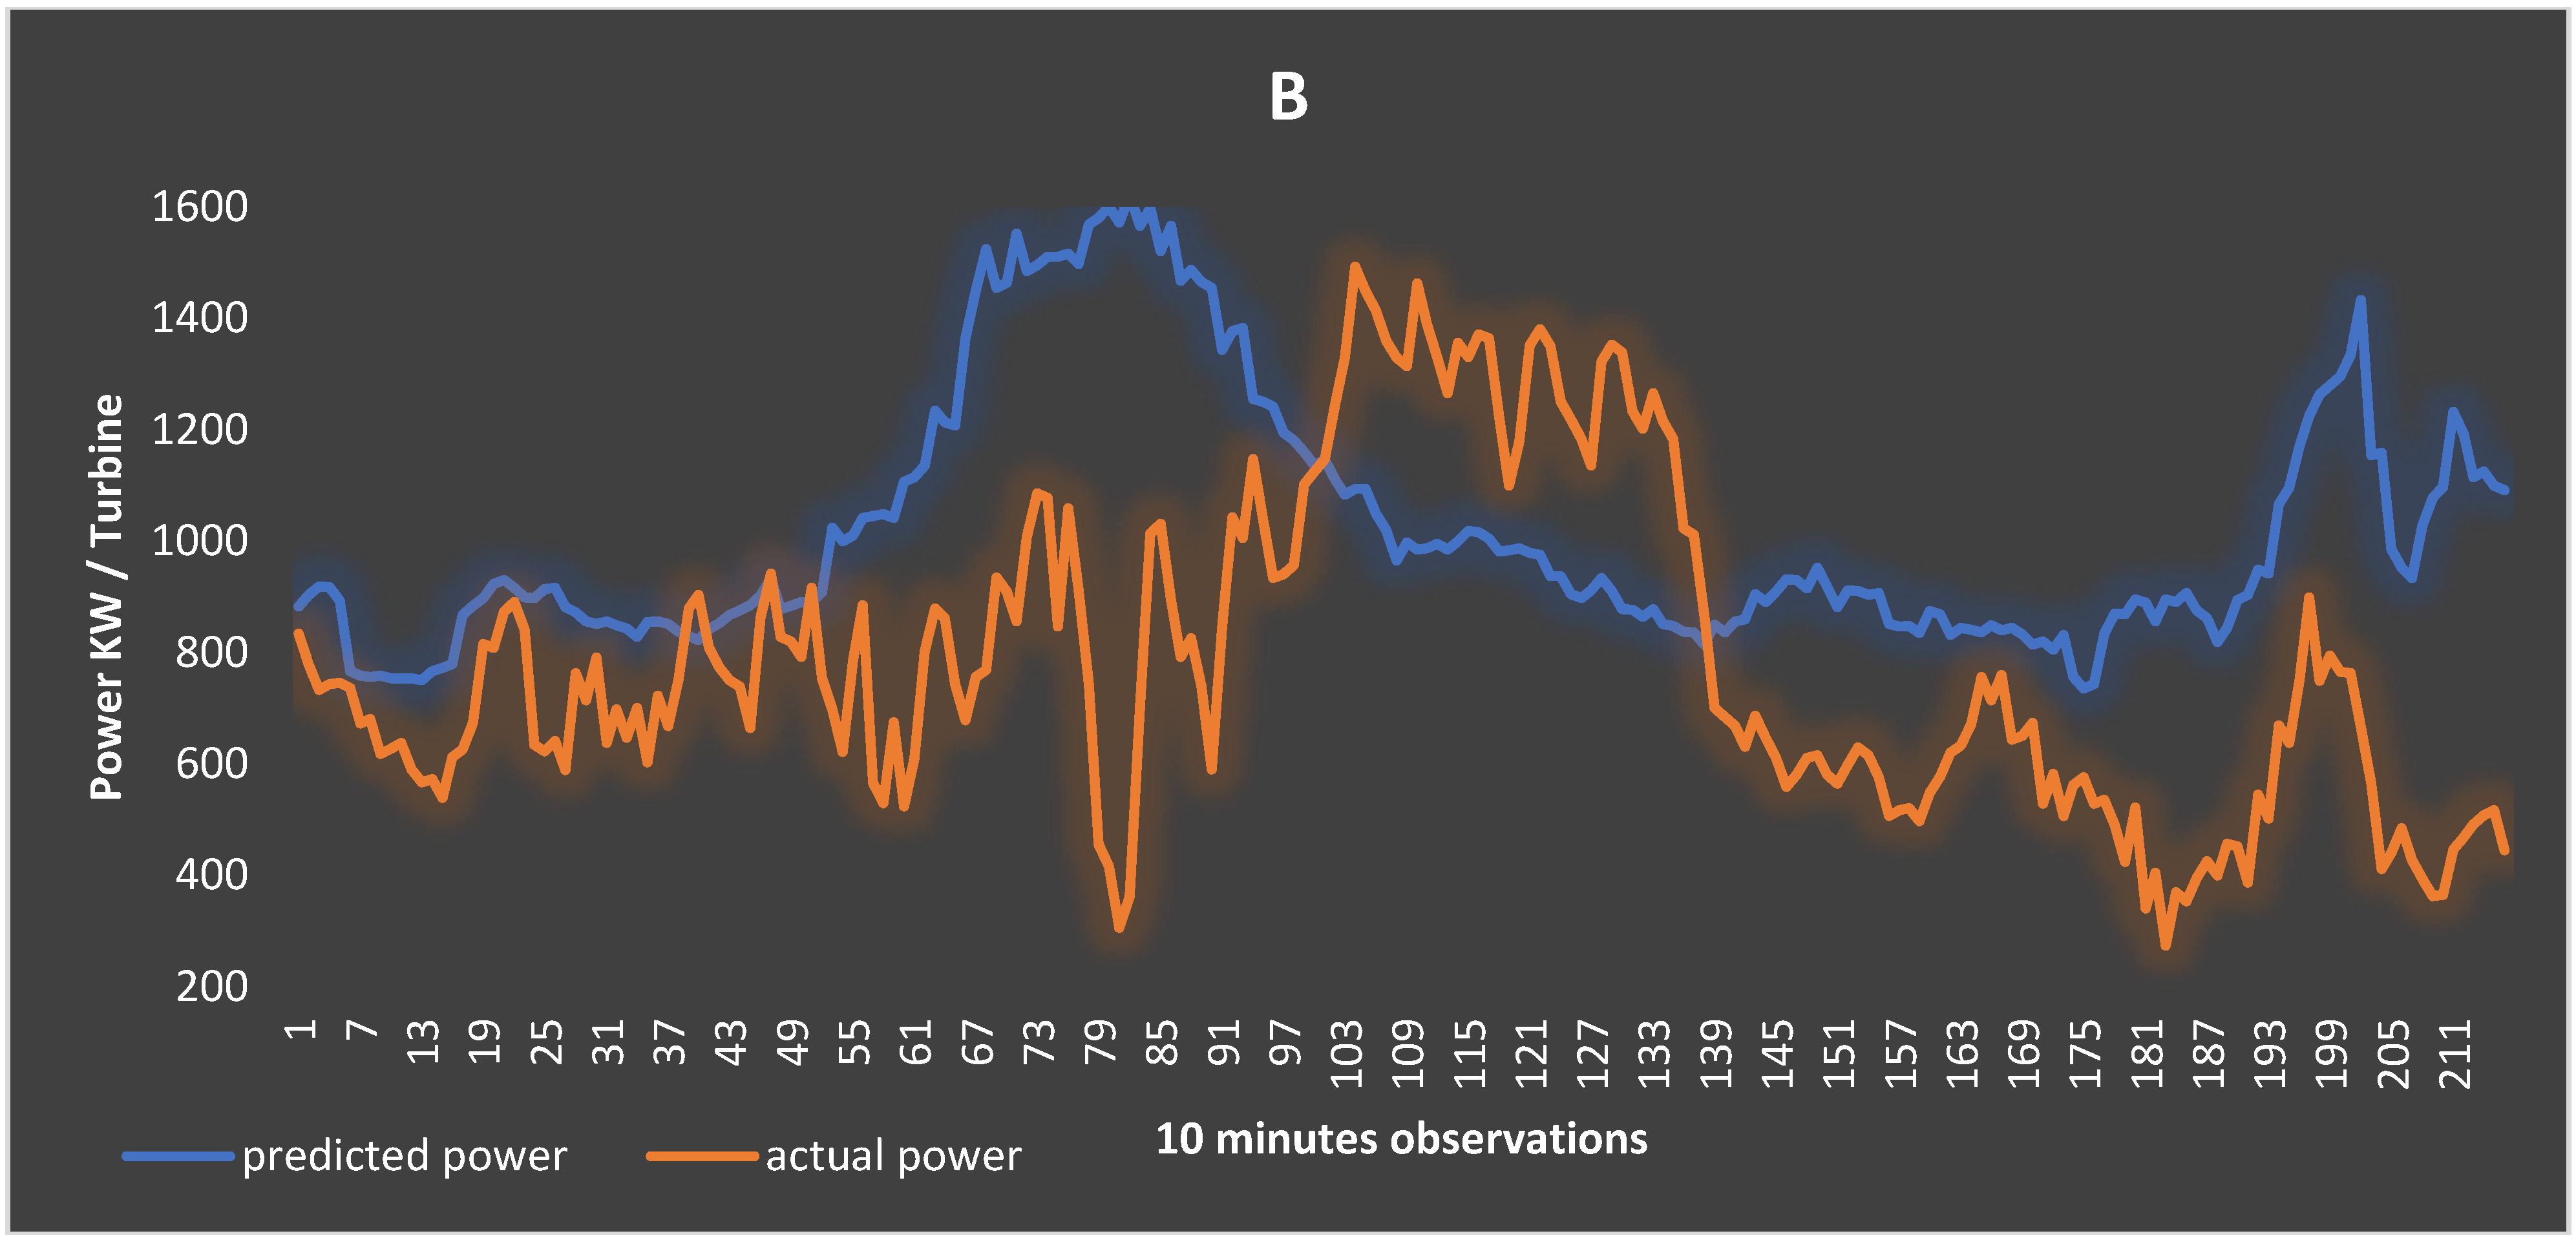
6.2. Results and Analysis of WPF

The optimal wind speed forecasting (WSF) models for each time scale were selected based on validation results (Figure 11, Figure 12, Figure 13, Figure 14 and Figure 15) and integrated into wind power forecasting (WPF). For very short-term wind power forecasting (VSTWPF) on a 10 min scale (Figure 11), models such as Bagging, Extra Trees, Random Forest (RF), Decision Trees (DT), Deep Neural Networks (DNNs), and XGBoost performed well. RF, DT, DNNs, Stochastic Gradient Descent (SGD), and XGBoost had acceptable MAPE values starting from 11.552%. Bagging, Extra Trees, and RF achieved the highest adjusted R2 scores (0.990, 0.993, and 0.969, respectively). Overall, ensemble methods and tree models outperformed linear models, AdaBoost, and SVM.
At the 30 min forecasting interval (Figure 12), Bagging and Extra Trees models demonstrated exceptional accuracy, achieving MAPE values of 4.12% and 4.15%, respectively. This performance highlights their robustness and ability to effectively handle short-term fluctuations in wind speed. RF and DT followed closely, achieving MAPE values of 4.183% and 9.664%, respectively, confirming their utility for short-term predictions. XGBoost and SGB also delivered reasonably good results, reinforcing their versatility for various forecasting tasks, although they fell short of the top performers. On the other hand, DNNs, AdaBoost, regression, and SVM struggled to produce reliable forecasts, potentially due to their higher sensitivity to parameter tuning and overfitting on smaller datasets. These findings emphasize that ensemble methods such as Bagging and Extra Trees excel in capturing the inherent complexities of wind speed variability over shorter periods, offering both precision and stability.
For longer forecasting intervals, such as the 6 h, 24 h, and 36 h scales (Figure 13, Figure 14 and Figure 15), the trends remained consistent, with Bagging, Extra Trees, RF, DT, XGBoost, and SGB models consistently achieving high performance. At the 6 h scale, the top models achieved MAPE values near 4%, showcasing their capability to handle extended prediction horizons while maintaining accuracy. At the 24 h scale, Bagging and Extra Trees emerged as the most reliable models, followed by RF, DT, XGBoost, and SGB, indicating their adaptability to medium-term predictions. The same ensemble-based methods retained their edge at the 36 h scale, solidifying their position as reliable tools for long-term wind speed and power forecasting. In contrast, models such as DNNs, AdaBoost, regression, and SVM consistently underperformed across all intervals. These results underscore the importance of leveraging ensemble methods and decision-tree-based models for comprehensive wind forecasting, as they effectively balance accuracy, computational efficiency, and scalability over varying time horizons.
For further elaboration, Figure 16A and Figure 17A demonstrate the performance of the Extra Trees model for VSTWSF in meters per second (m/s). These figures show that the predicted VSTWSF values closely match the actual observed wind speeds, indicating a high level of accuracy in the model’s predictions. Similarly, Figure 16B and Figure 17B highlight the effectiveness of the Bagging model for predicting VSTWPF in kilowatts per turbine (kW/turbine).
As shown in Figure 16A, the regression equation: y = 0.9724x + 0.2432y = 0.9724x + 0.2432y demonstrates a strong correlation between actual and predicted values of VSTWSF, with an R2 value of 0.98, indicating high accuracy. Similarly, Figure 16B shows the regression equation y = 0.9841x + 14.234y = 0.9841x + 14.234y = 0.9841x + 14.234 for VSTWPF, with an R² value of 0.97, also reflecting a strong correlation and reliable predictions. Figure 17A,B highlight the performance of Extra Trees in forecasting VSTWSF and VSTWPF, showing high reliability. Figure 18A illustrates the Extra Trees model’s accuracy in predicting wind speed 36 h ahead, while Figure 18B demonstrates the Bagging model’s ability to forecast wind power, capturing trends over 36 h with some accuracy limitations.
The two-sample t-test between the ensemble and single models resulted in a t-statistic of −1.14 and a p-value of 0.28. Since the p-value is greater than 0.05, the observed differences in accuracy (MAPE) between the ensemble and single methods are not statistically significant at the 5% level. This suggests that the superior performance of ensemble methods over single models in terms of MAPE, based on this data, is not statistically confirmed. Therefore, the paper included a confidence interval to all the result figures and selected the most accurate models based on performance metrics, where ensemble models outperformed the single machine learning algorithms. The computational cost comparison of ML models section discussed the computational cost of the developed models.

6.3. Computational Time and Memory of ML Models

Figure 19A,B reveal that Polynomial Regression, Extra Trees, Decision Tree Regression (DTR), and AdaBoost required over 250 s for wind speed (WSF) and wind power forecasting (WPF) computations, respectively. In contrast, Figure 19C shows that XGBoost, Random Forest Regression (RFR), and DNNs had the lowest computational times, with XGBoost being the fastest, completing data fitting in just 3 s. Regarding memory usage, Figure 19D illustrates that XGBoost, DNNs, Regression, Stochastic Gradient Boosting (SGB), AdaBoost, DTR, RFR, and SVM used less than 200 MB of memory.

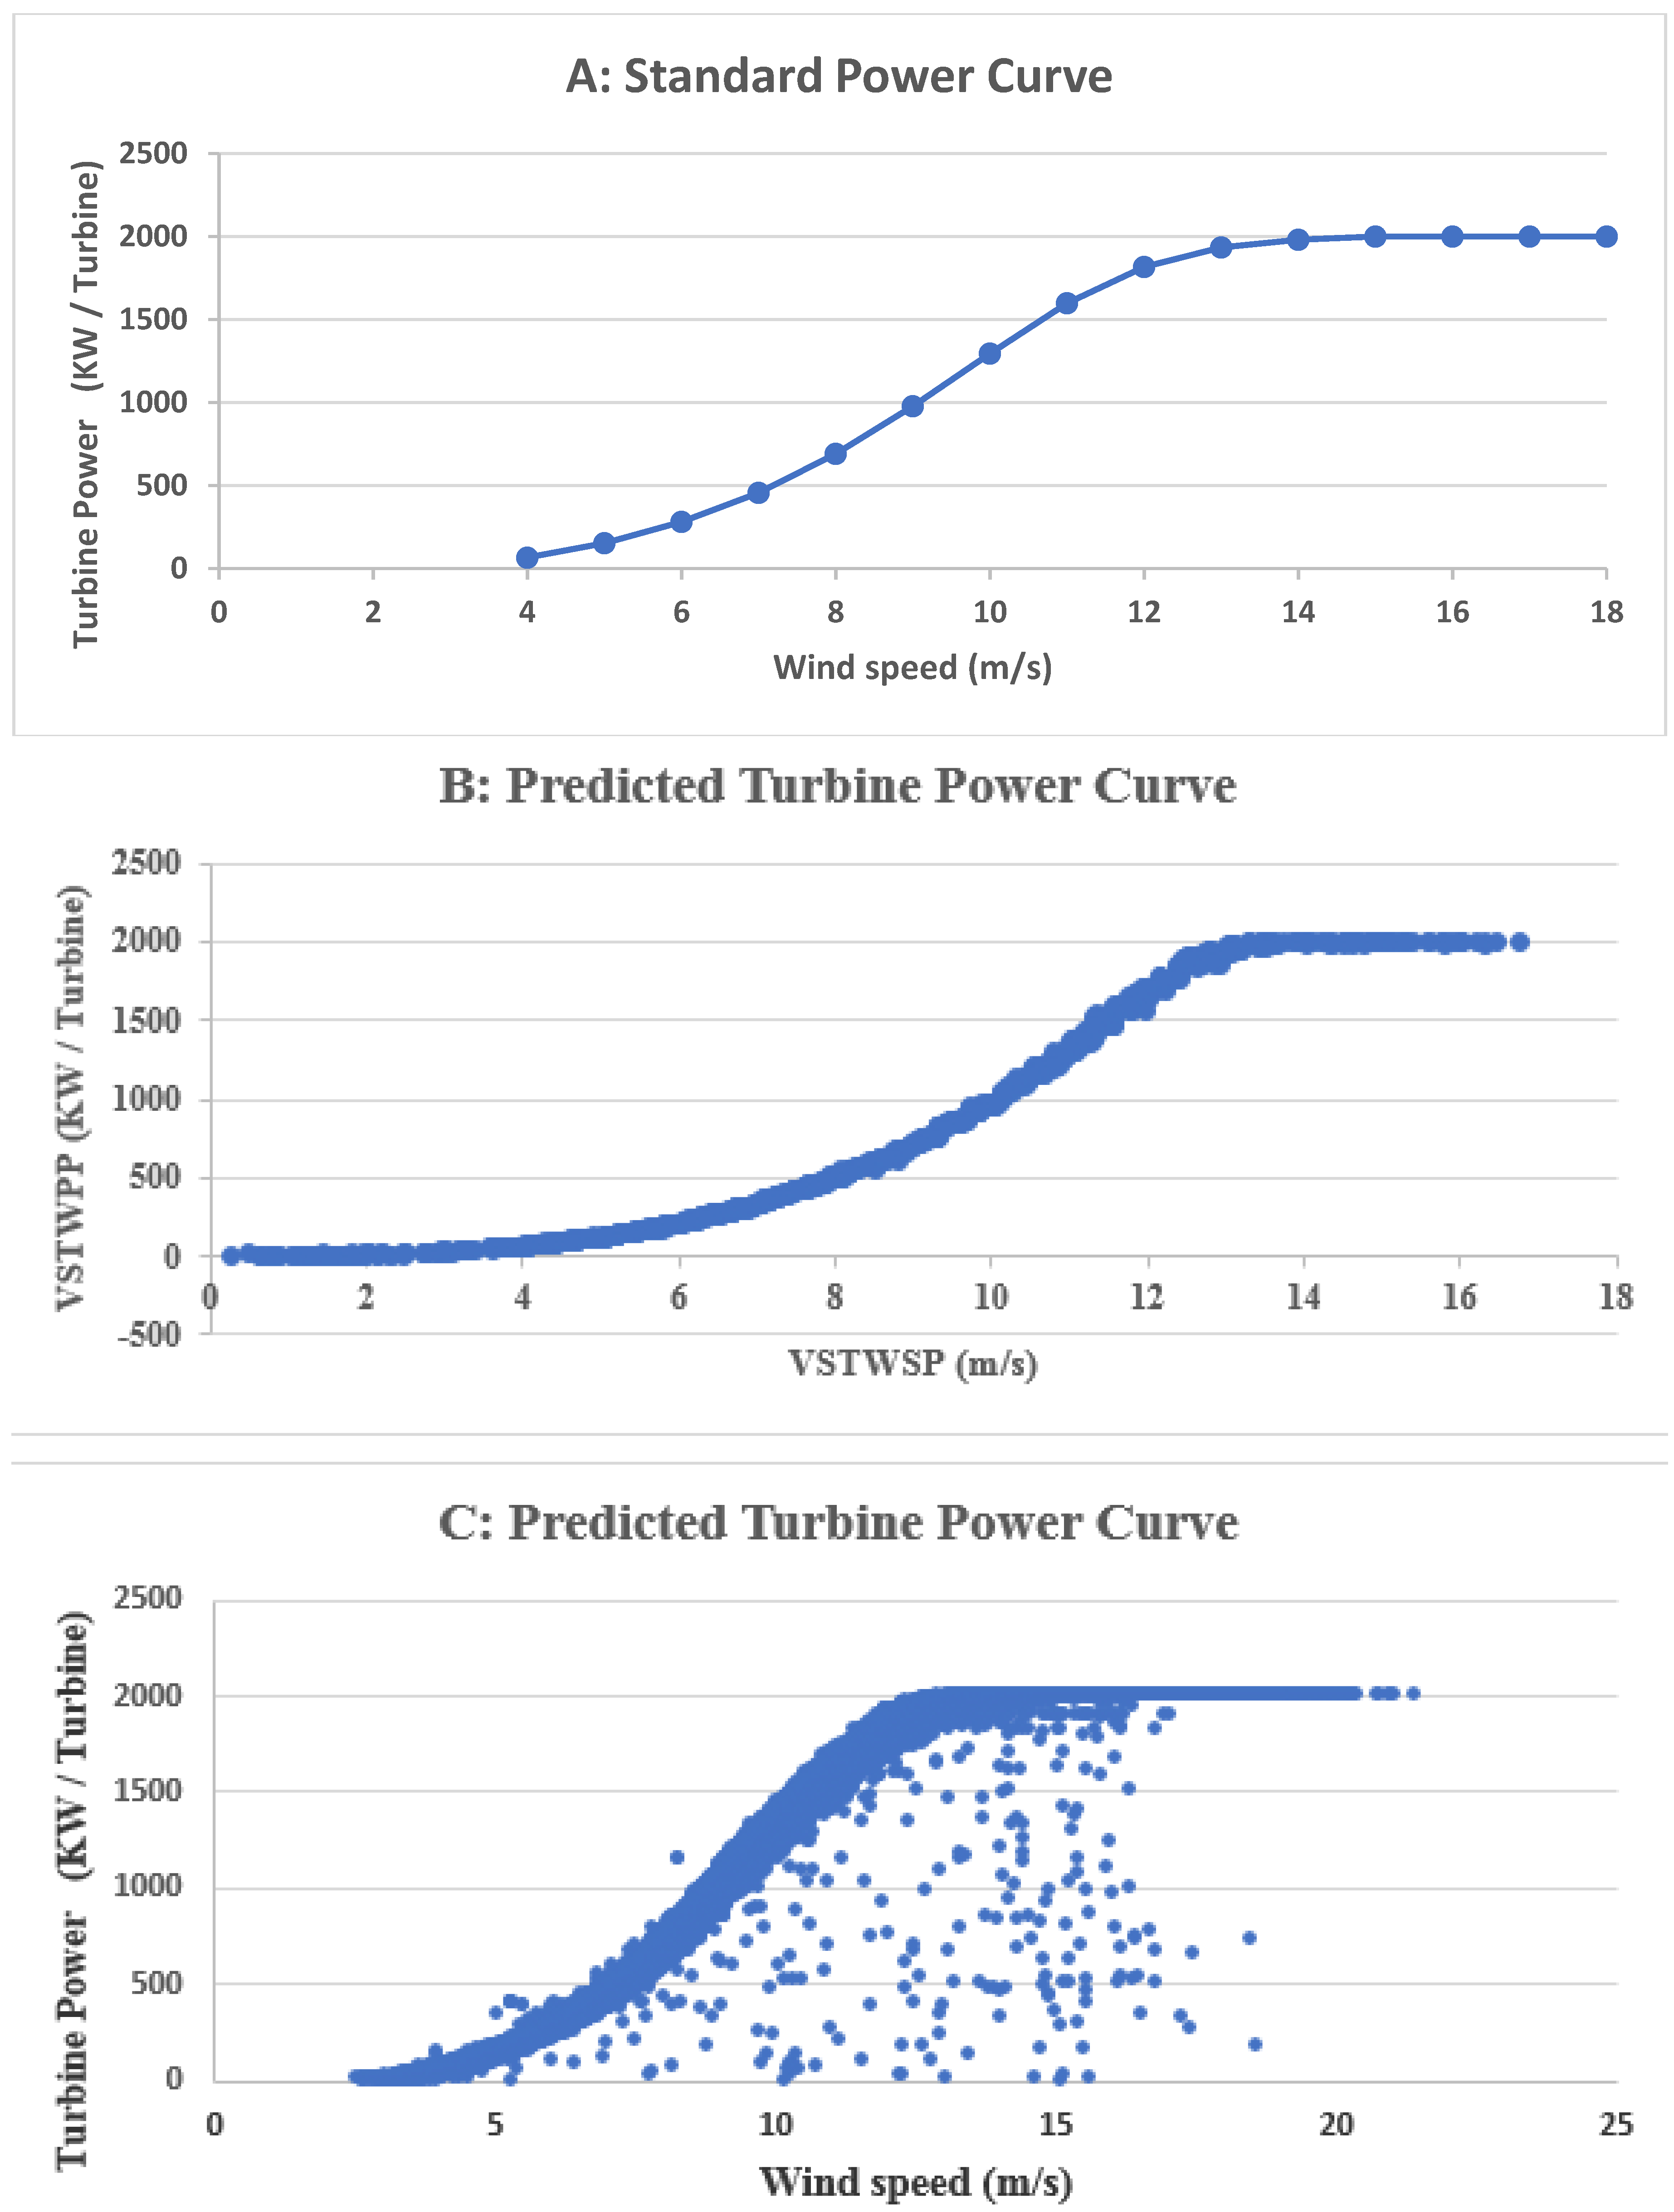
6.4. Wind Turbine Power Curve Modeling and Applications

The wind turbine power curve is an essential characteristic of the turbine, as it describes the relationship between hub height wind speed and the generated wind power, as shown in Figure 20A. Precise models of wind turbine power curves have a crucial role in enhancing the performance of the wind energy system and operating the wind energy conversion system [70,71,72]. During various wind speeds, the power curve reflects the power response. Therefore, precise models can be applied in several wind energy applications as follows:
  • Wind power prediction [73,74].
  • Wind turbines selection [75].
  • Early faults identification and [73].
  • Online capacity factor estimation [76].
  • Online power monitoring [73,74].
Wind turbine operators need to accurately forecast the turbine’s power output to deliver the traded amount of power directly to the electricity market [77]. Moreover, the prediction of wind output power is required for cost optimization studies, as well as the design and sizing of wind energy systems [78]. Moreover, 10 min ahead of wind speed and power prediction can be used to efficiently adjust wind turbine control to maximize harvesting the wind energy [79]. Capacity factor prediction is needed to choose potential sites, optimum turbine-site selection, sizing, and cost optimization [80]. In addition, predicting the power curve can aid in selecting a suitable turbine [75]. Based on power curves, online monitoring and analysis of the detected outliers can predict power curves early to warn of various faults and anomalies of the turbine, such as pitch system faults or blade faults [81]. Moreover, VSTWPP can be utilized to deal with different sudden scenarios, such as zero wind velocity. Consequently, a system of spare generators would be powered on to compensate for the lost energy to ensure a continuous supply of electrical energy.
Figure 20A illustrates the standard turbine wind power curve, where the cut-in speed (Vc) was 4 m/s, the rated wind speed (Vr) was 14 m/s, and the cut-out speed (Vf) was 25 m/s for (GAMESA G80-2.0 MW) [82]. Nonparametric methods of power curve modeling, including ANNs or ensemble models, provide superior performance than other models such as clustering, parametric, and probabilistic models [72]. This study uses the Extra Trees model for VSTWSP and the bagging model for VSTWPP. Consequently, both VSTWSP and VSTWPP can be combined to generate 10 min ahead of the wind turbine power curve as shown in Figure 20B. Figure 20B illustrates the predicted wind power curve where the two curves are approximately identical. The measured wind speed and its corresponding wind turbine power produced a reference power curve. During field operation, the expected power curve as shown in Figure 20B, and actual values as shown in Figure 20C can be collected and compared to the benchmark curve. The actual value deviations from the expected output can identify underperformance or faults in wind power systems [83].
Figure 20. (A) Standard power curve, (B) 10 min ahead power curve for a single turbine, and (C) actual wind power curve.
Applsci 14 11918 g020

7. Applications and Contributions

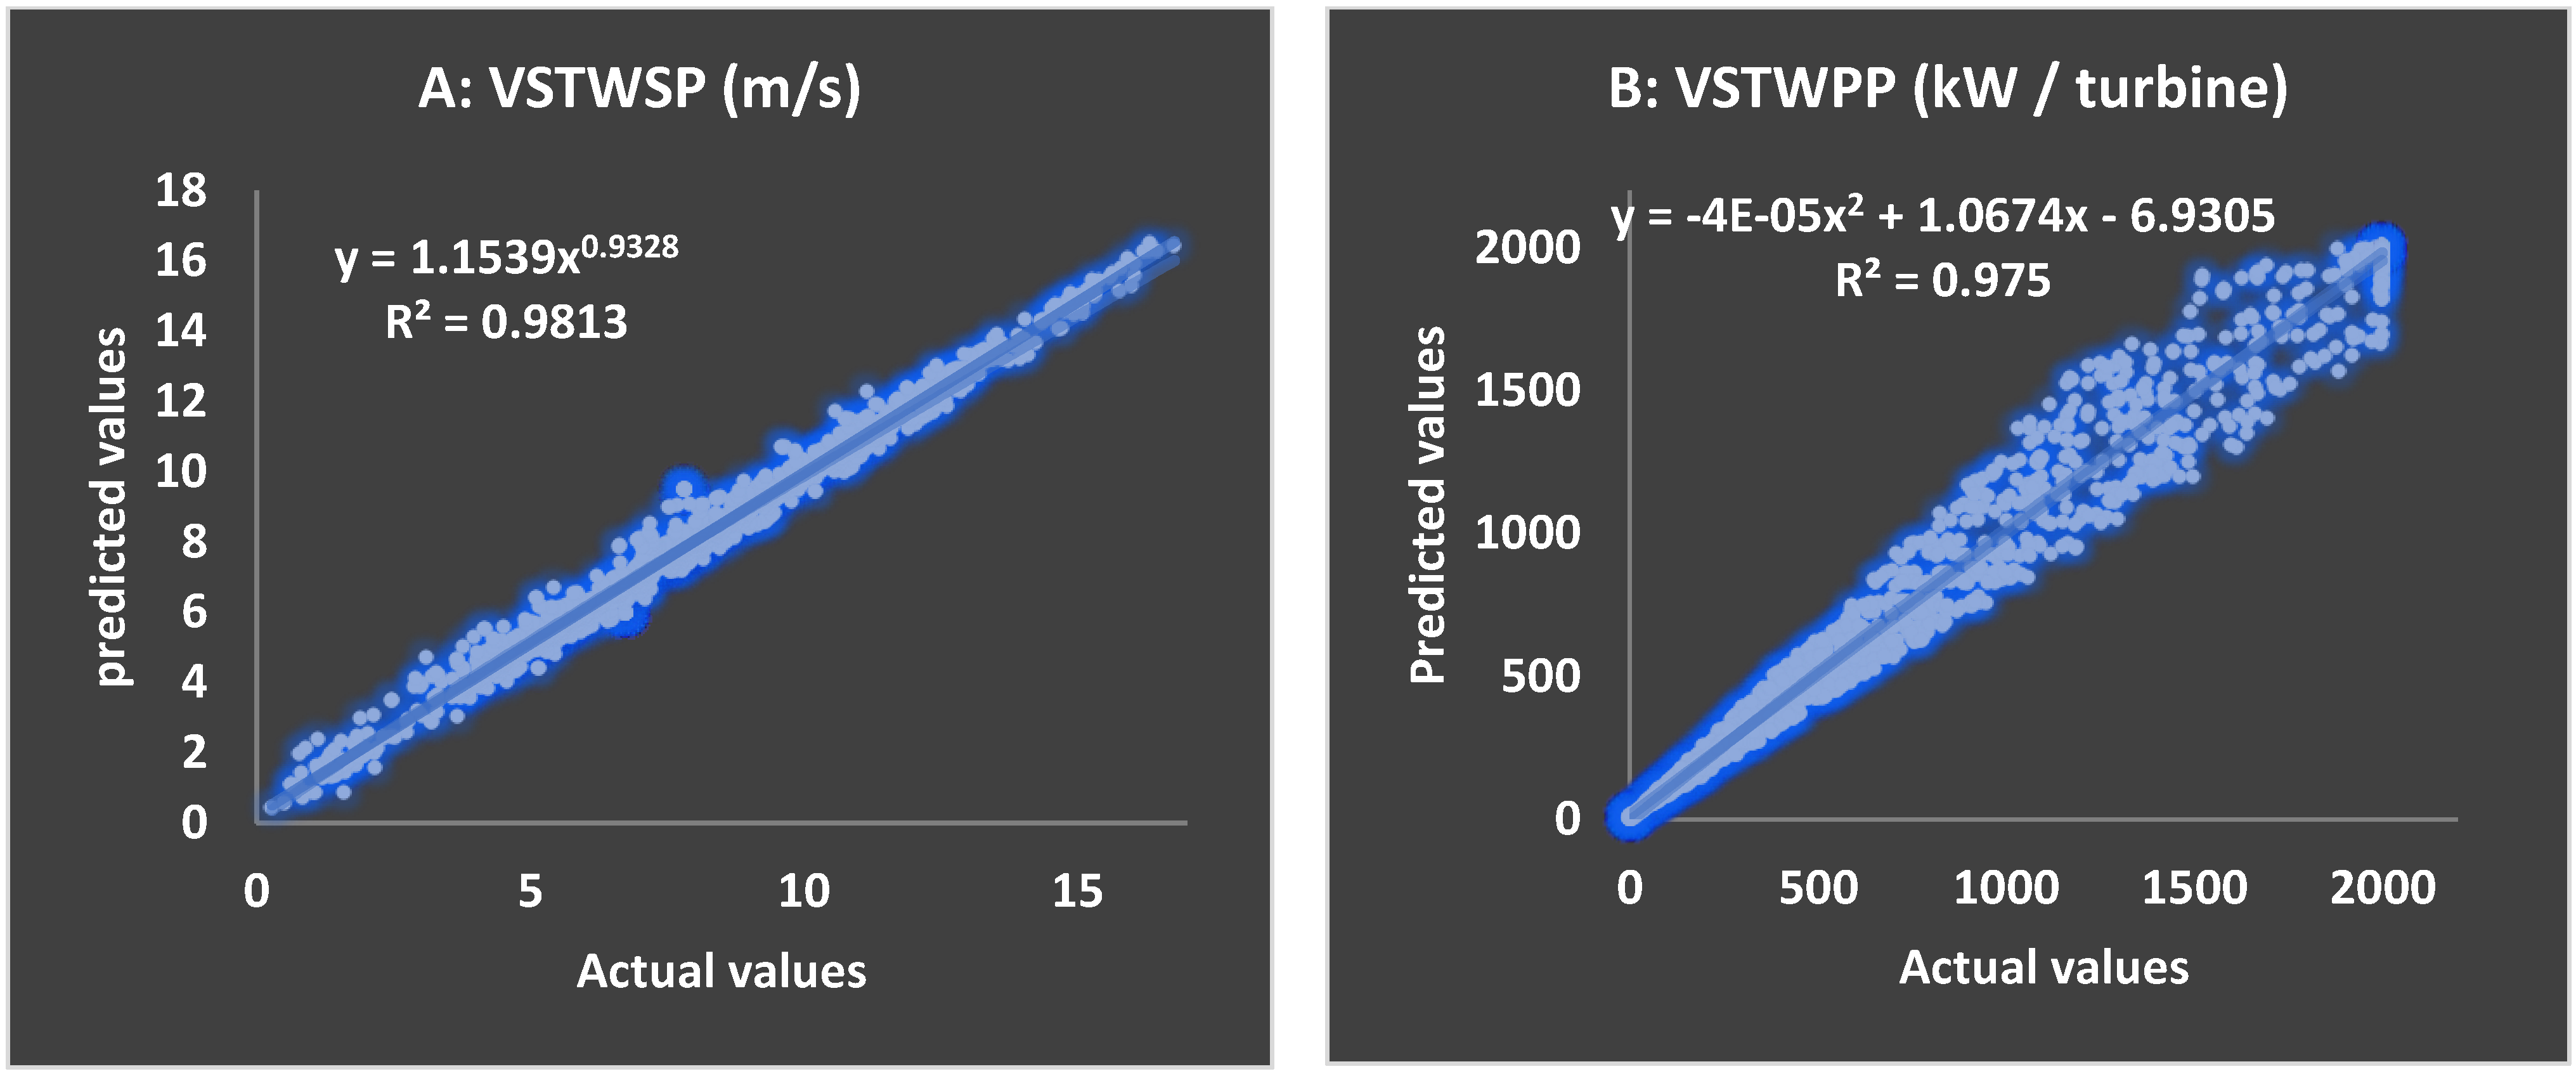
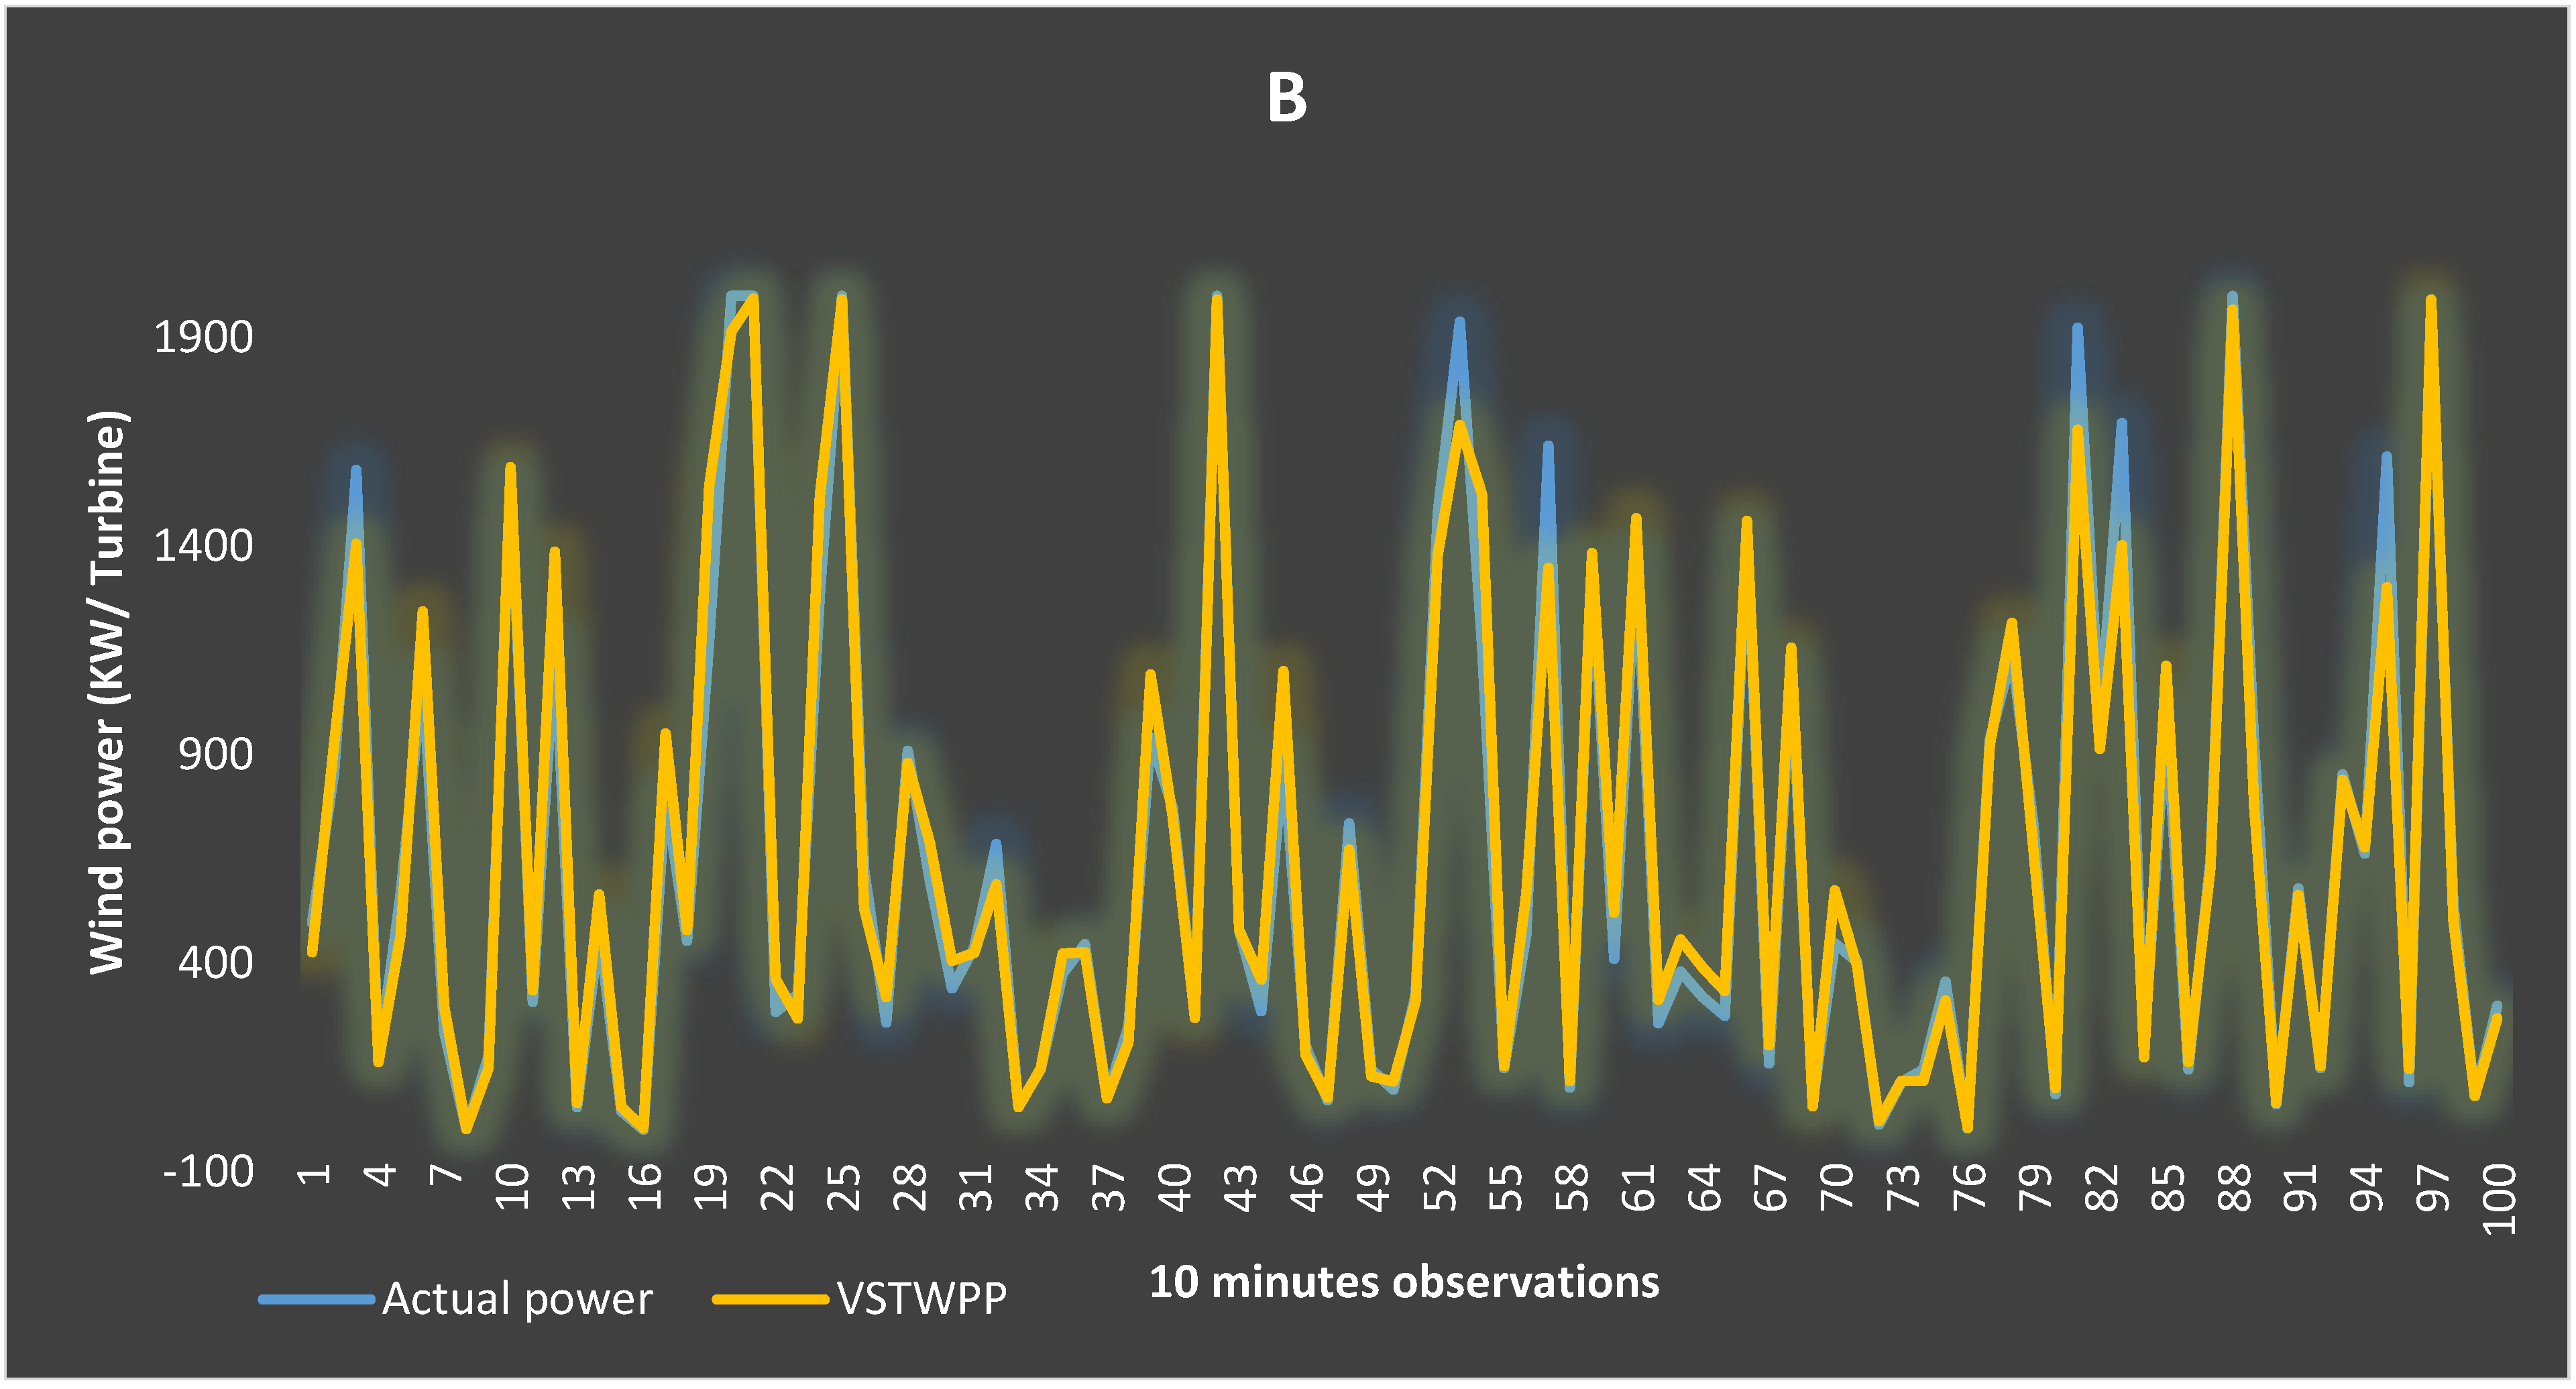
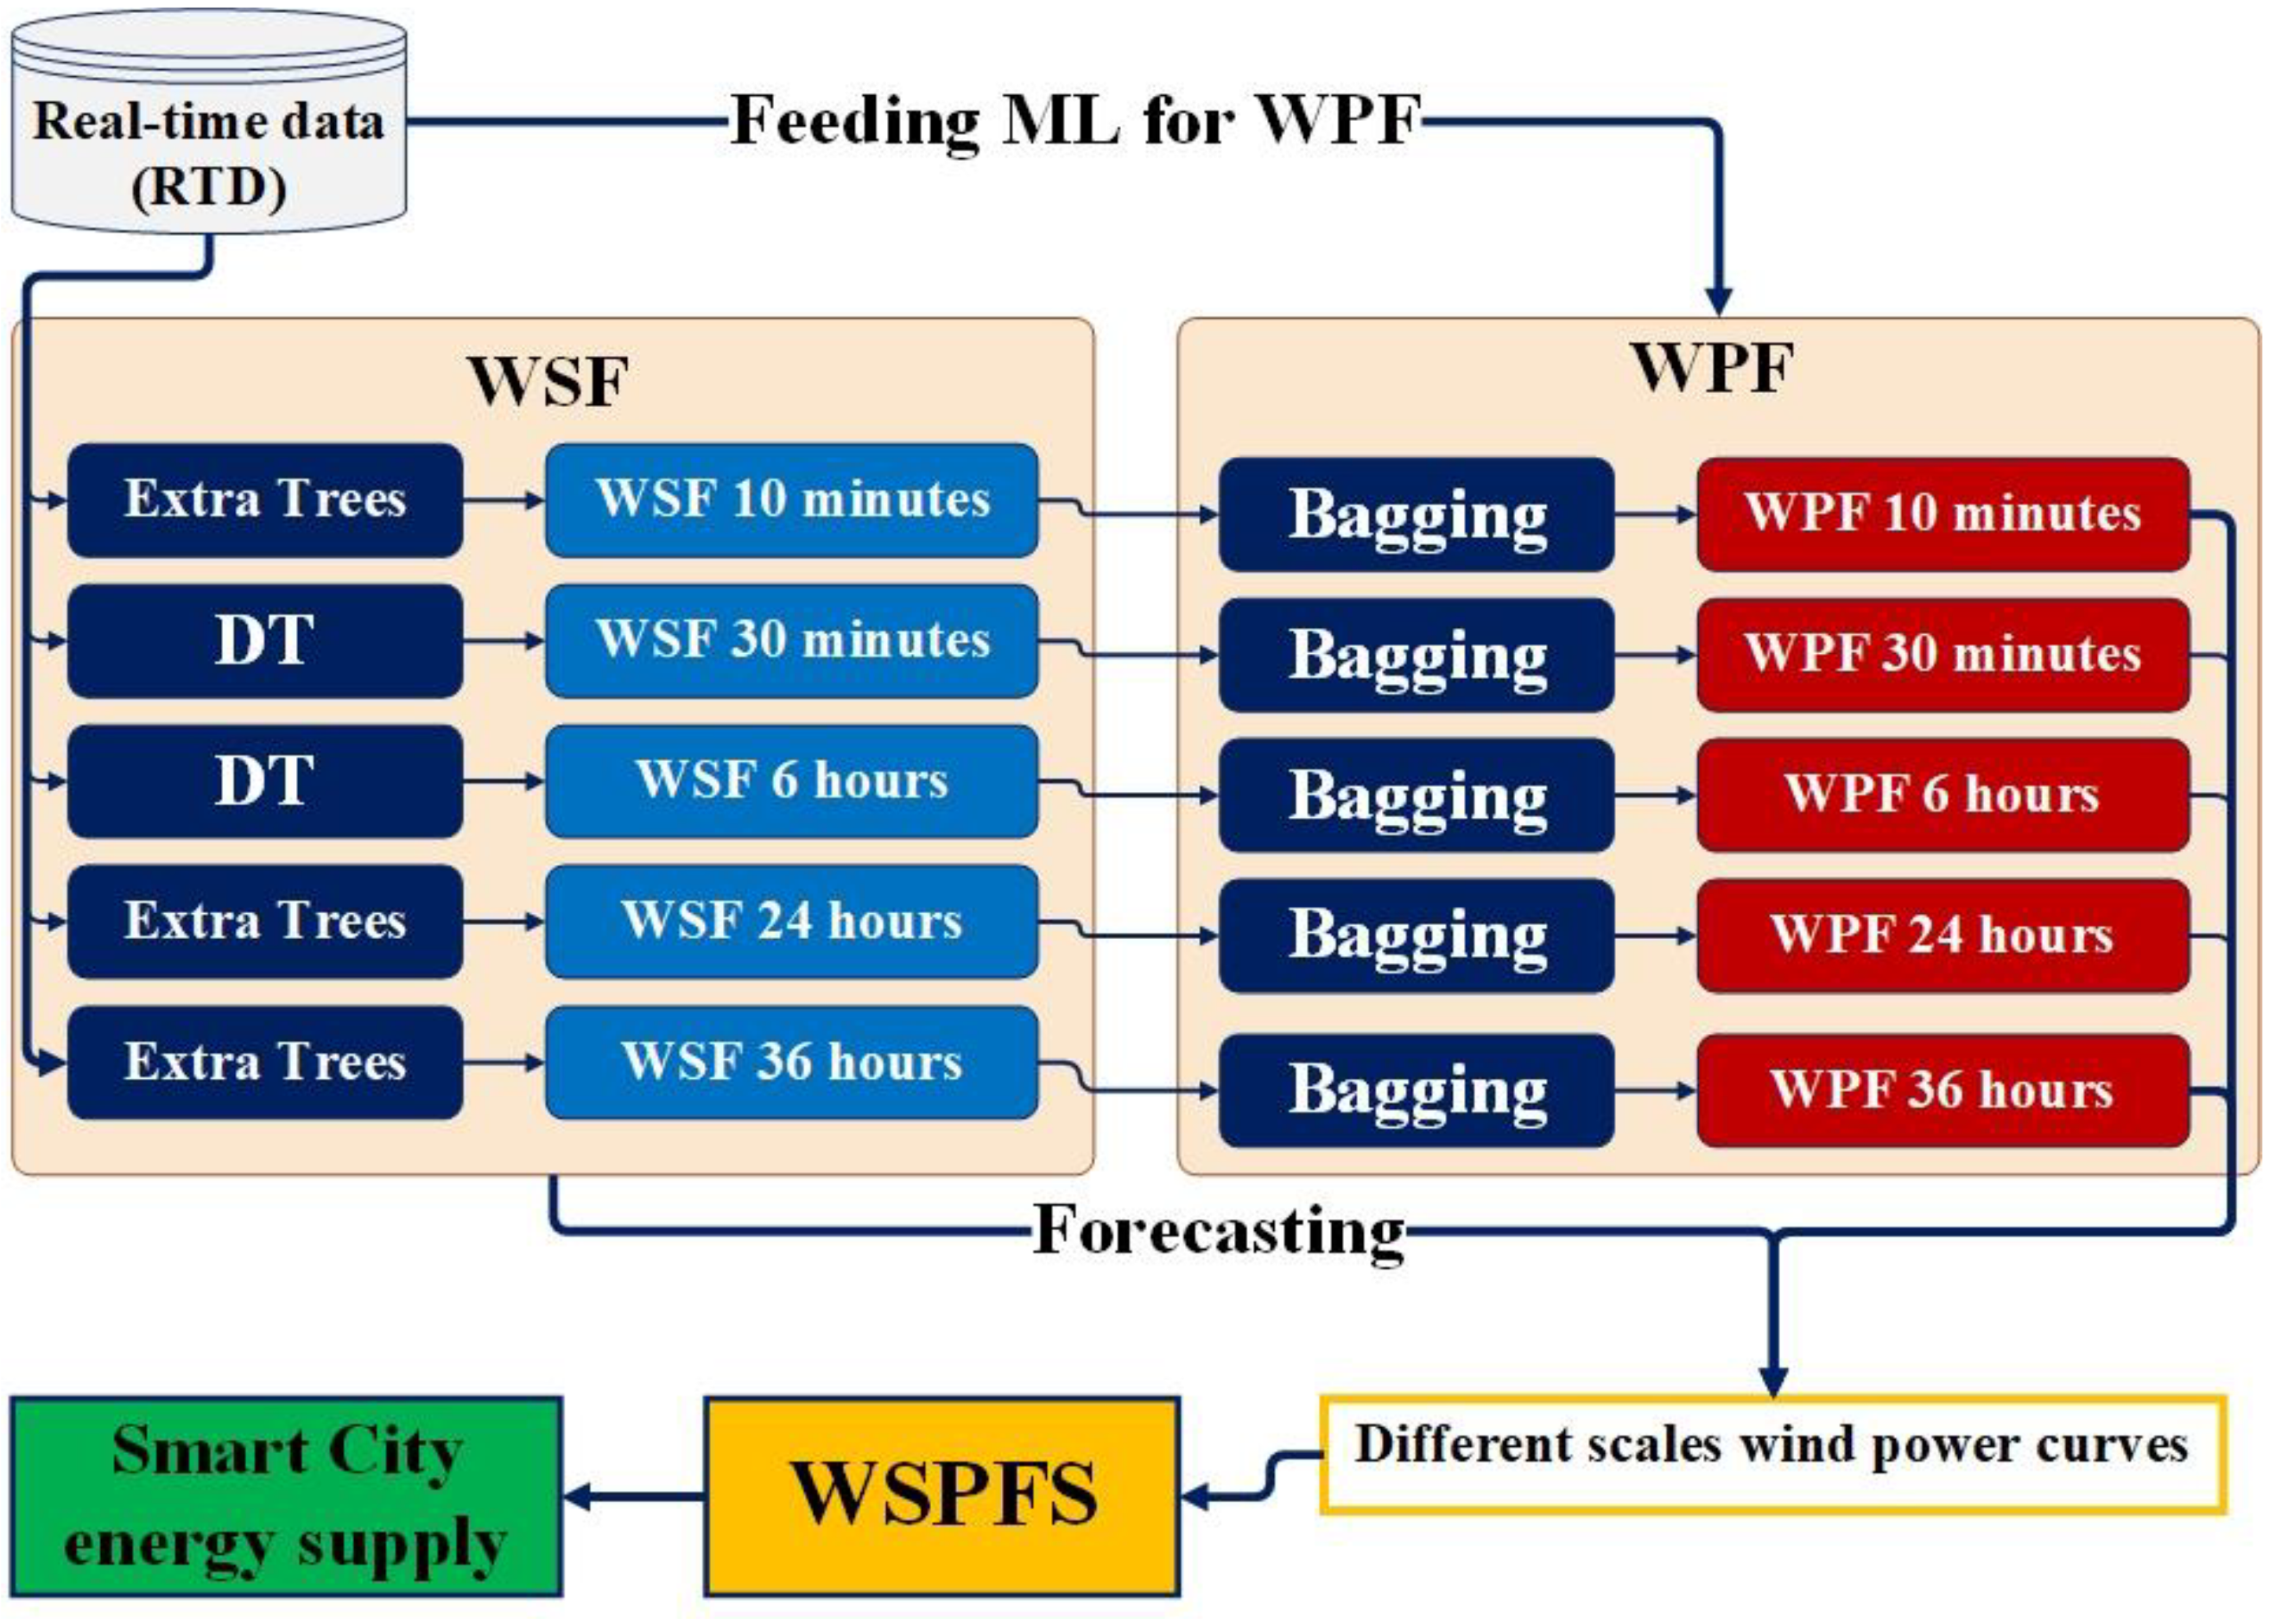
7.1. Integrated Wind Speed–Power Forecasting System (WSPFS)

The unique aspect of our integrated WSF-WPF model lies in its holistic approach to wind energy forecasting, where the output of the wind speed forecasting model directly informs the wind power prediction model, as shown in Figure 21. This real-time data integration improves forecasting accuracy using real-time computation (RTC) to manage the wind station using informed decision-making effectively and feed smart and zero-energy cities with reliable wind electricity supply.
WSPFS addresses power supply interruptions and associated revenue losses in manufacturing by enhancing the predictability and reliability of wind energy. The WSPFS enables more informed and precise management of wind stations. This real-time computational approach allows industrial microgrids to operate more effectively, supporting (near) zero-emission processes and combined heat and power (CHP) generation. The integration of reliable wind energy forecasts into microgrid systems ensures a stable and resilient energy supply, minimizing downtime and optimizing operational efficiency in industrial settings. On the other hand, WSPFS can significantly enhance remote off-grid and electricity microgrids by providing accurate, real-time wind energy forecasts. This capability allows for optimal utilization of wind resources, improving energy supply reliability and efficiency. By reducing dependency on external power sources and lowering operational costs, WSPFS supports the sustainability of these microgrids in isolated locations, making renewable energy a more feasible and stable option.
The integration of general weather forecasts into long-term wind speed and power predictions is valuable; however, the contribution of this paper lies in developing a multi-horizon forecasting framework that effectively captures both the dynamics of actual values and the intricate relationships between wind speed and power. By leveraging machine learning models, including tree-based and ensemble approaches, the system bridges the gap between short- and long-term forecasting through robust data-driven methodologies. The incorporation of over 200,000 meteorological data points, combined with the innovative use of wind speed forecasts as direct inputs for power predictions, enhances predictive accuracy across diverse time scales. While general weather forecasts offer broader insights, this study demonstrates how a data-centric approach, complemented by precise AI models and computational optimization, can yield high-resolution, location-specific predictions that address the unique challenges of wind energy systems. This dual focus ensures both practical relevance and scientific advancement.

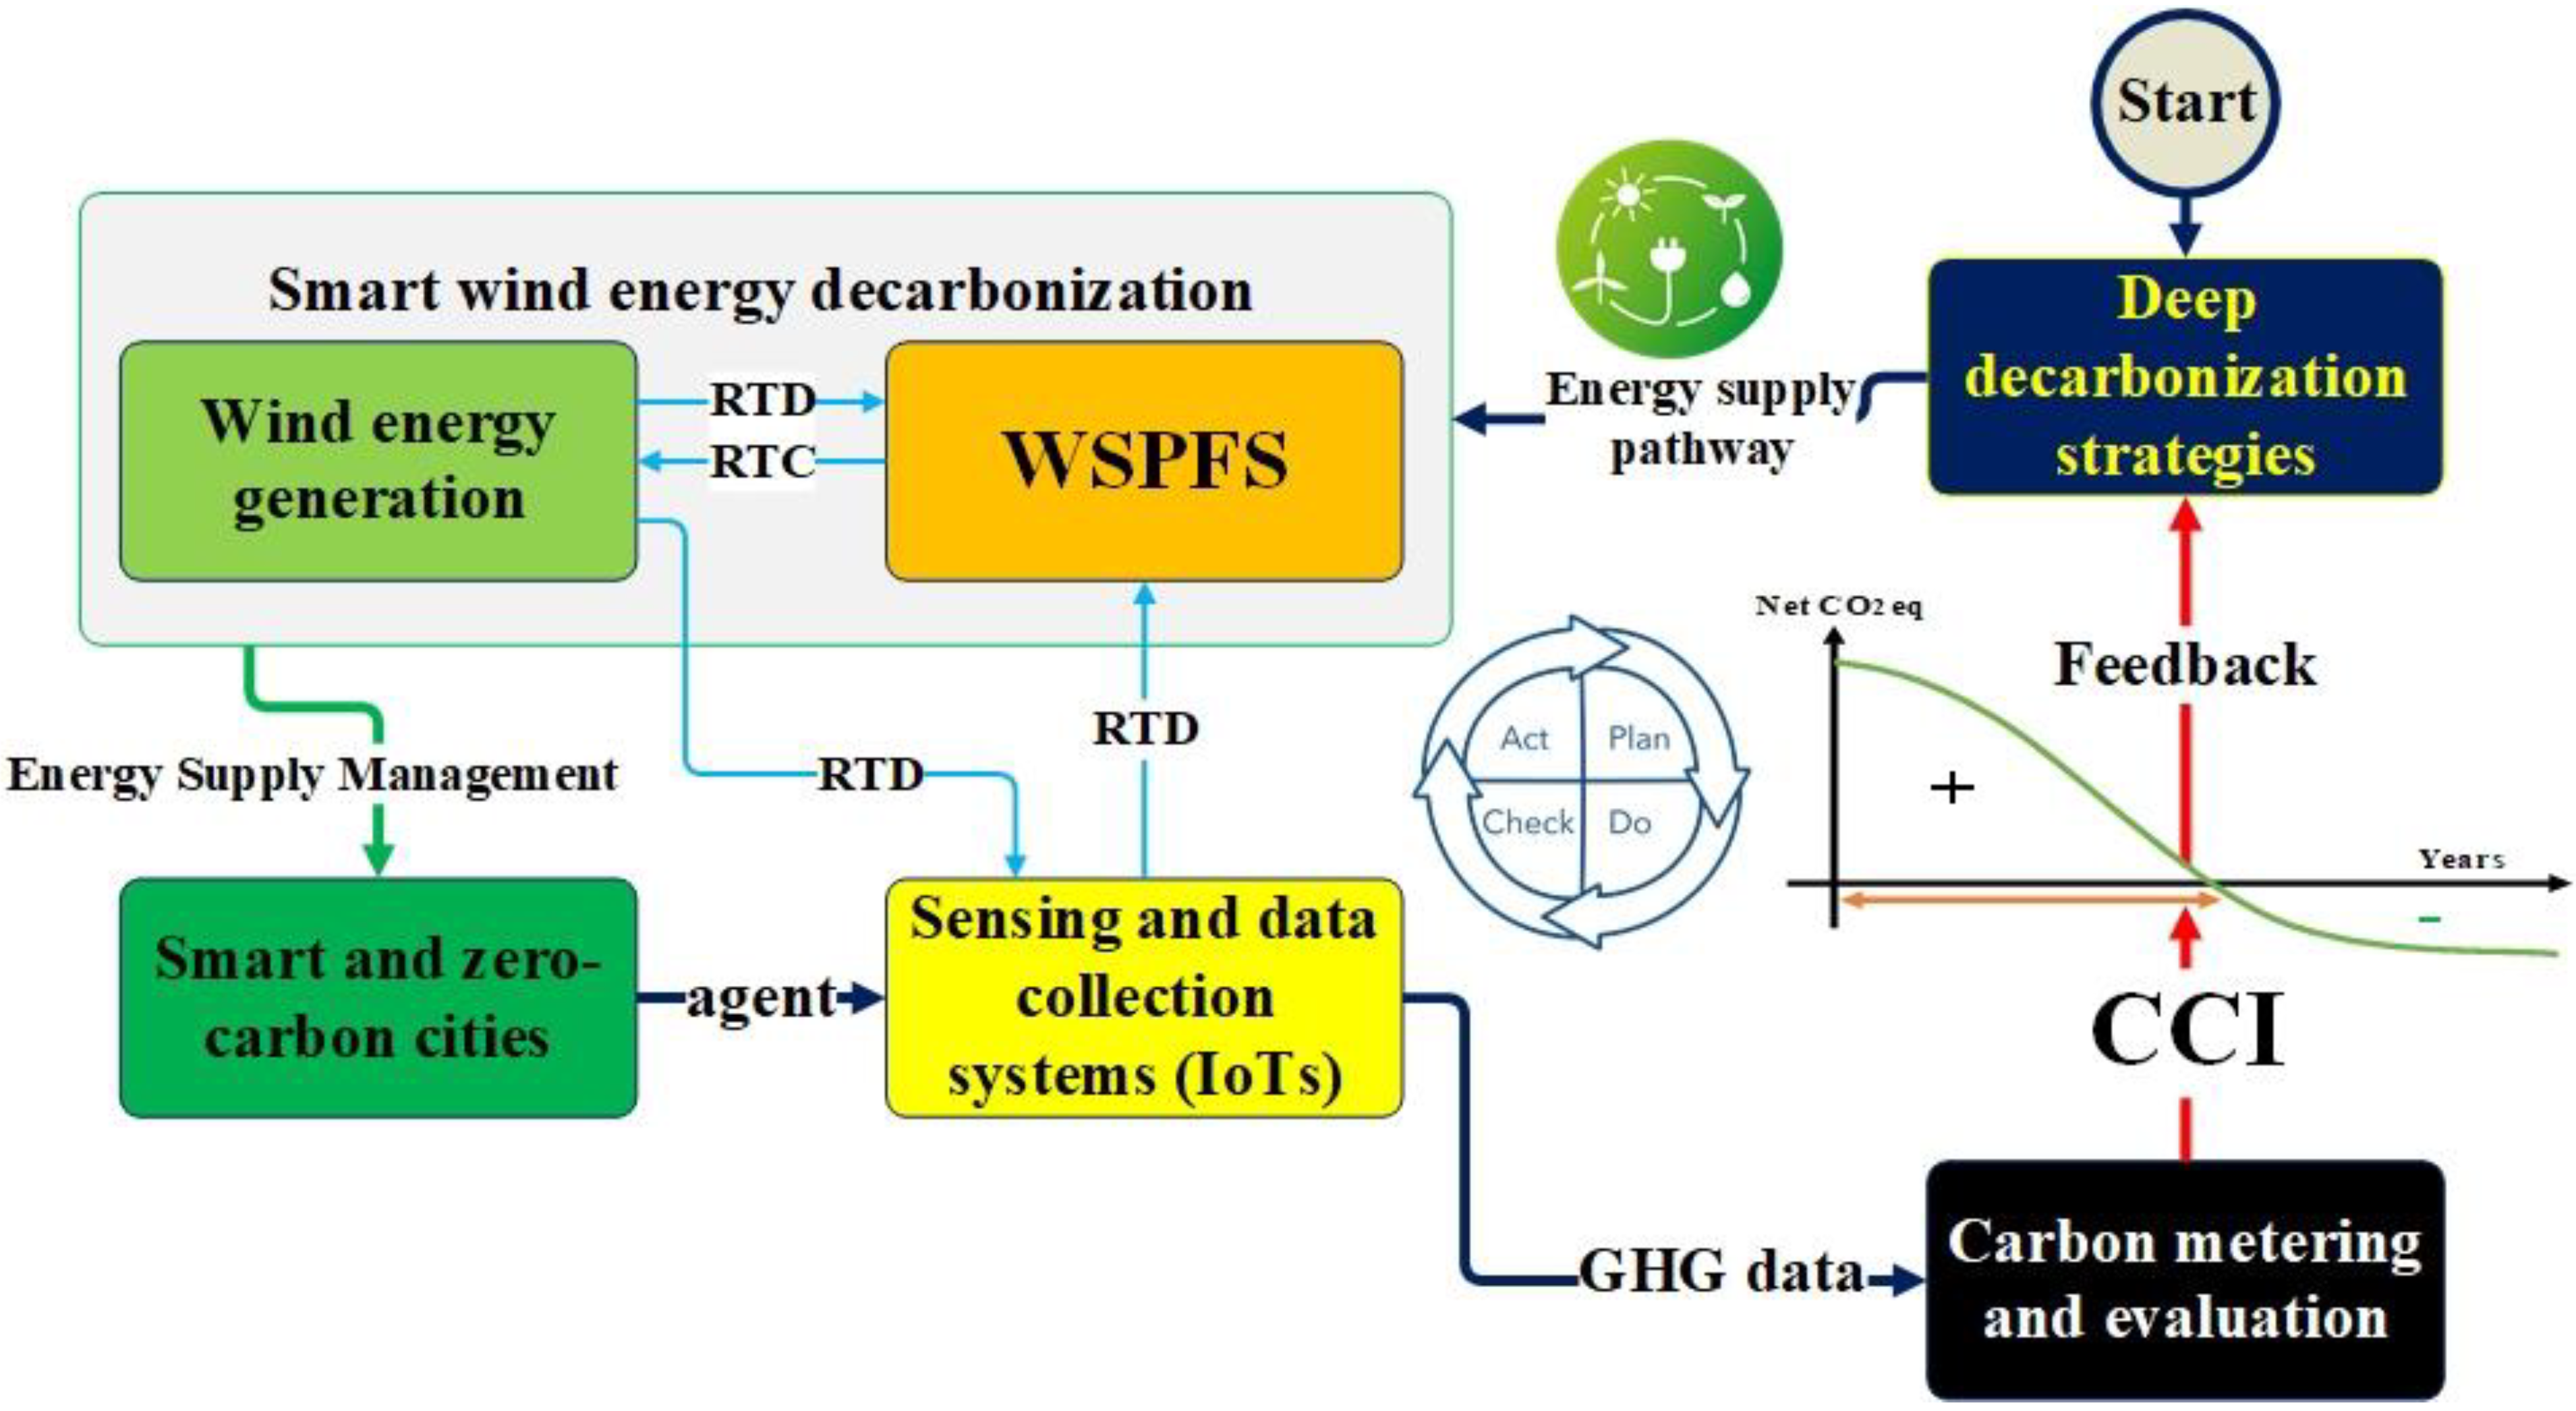
7.2. Smart Wind Energy Deep Decarbonization (SWEDD) Framework

The carbon-city transformation curve (CCTC) presents a conceptual model for the transformation of cities based on greenhouse gas (GHG) emissions, illustrating the progression from high-carbon to carbon-negative cities over time as shown in Figure 22. CCTC highlights various stages of urban carbon reduction, from high-carbon cities (emitting over 80% GHG), through low- and nearly-zero carbon stages (around 20% GHG), to zero-carbon and ultimately carbon-negative cities (around zero GHG). The CCTC shows a decrease in net CO2 equivalents over the years, depicting a clear downward trend in emissions as cities transform. This transformation period is marked by an orange arrow indicating the period required to achieve the GHG reductions.
The CCTC maps out a trajectory towards decreasing city carbon footprints and integrates a system of classification for city types based on their carbon emission levels. Such classifications are essential for policymakers, urban planners, and developers engaged in projects aimed at enhancing urban sustainability. On the other hand, the CCTC serves as a visual aid to complement studies and discussions focused on transitioning towards sustainable, zero-energy urban environments, underpinning the necessity for robust wind speed and power forecasting systems that support renewable energy management and contribute to achieving these ambitious carbon reduction goals.
The Carbon City Index (CCI) is a simple method to assess the effectiveness of a city’s efforts in reducing its carbon footprint to a predetermined baseline level of city CO2 eq emissions as in Equation (5):
C C I = C i t y   N e t   C O 2   e q C i t y   C O 2   e q   b a s e l i n e = C O 2   e q   p r o d u c e d C O 2   e q   a b s o r b e d   C i t y   C O 2   e q   b a s e l i n e
Net CO2 eq is calculated as the difference between the city CO2 eq produced and the city CO2 eq absorbed. City CO2 produced encompasses all emissions from sources such as transportation, industry, and buildings. City CO2 absorbed includes carbon uptake through means such as urban greenery and other carbon sequestration practices. The city CO2 eq baseline is a reference value against which current CO2 eq emissions are compared. The city CO2 eq baseline typically represents a historical emission level from a specific base year or an average over a selected period. Establishing a baseline is crucial as it provides a point of reference to measure reduction efforts. CCI (Carbon City Index) is the ratio of the net CO2 eq emissions to the baseline CO2 emissions. This index provides a quantitative measure of the city’s efforts to reduce GHG emissions relative to its baseline.
A CCI value lower than 1 indicates that the city has reduced its net emissions below the baseline level, reflecting effective carbon management and mitigation strategies. Conversely, a CCI greater than 1 suggests that emissions have increased relative to the baseline, indicating that dramatic reduction efforts are needed. The lower the CCI, the greener the city will be, ranging from a high-carbon city to a negative-carbon city. This index is particularly useful for city planners, policymakers, and environmental scientists to monitor the progress of urban areas toward becoming more sustainable and carbon-efficient. CCI helps in understanding the impact of various initiatives and policies aimed at reducing GHG and promoting a transition to a low-carbon or zero-carbon future. The city transformation period is the number of years needed to transform a city into a zero-carbon city, where CCI equals zero and netCO2 eq equals zero.
The Smart Wind Energy Deep Decarbonization (SWEDD) framework depicted in Figure 23 is a comprehensive framework that integrates wind energy to facilitate urban deep decarbonization strategies. SWEDD involves wind energy generation and the wind speed–power forecasting system (WSPFS), both crucial for predicting and managing the energy output from wind resources. Real-time data (RTD) and real-time computing (RTC) capabilities are employed to ensure that the energy supply is optimized in response to varying wind speeds and power needs. SWEDD framework is tightly integrated with sensing and data collection systems, which can utilize the Internet of Things (IoTs) to gather and communicate essential greenhouse gas (GHG) data, thereby enhancing the accuracy of carbon footprint assessments and enabling smarter energy supply management.
In addition, the SWEDD framework incorporates a strategic pathway for energy supply, feeding into smart and zero-carbon city initiatives. The Deming cycle of “Plan, Do, Check, Act” is fundamental within the framework, allowing for continuous improvement in strategies aimed at deep decarbonization [84,85,86]. “Plan” is formulating decarbonization strategies, “Do” is developing intelligent and automated decision systems for green energy management, and “Check” is connected to Carbon Metering and Evaluation (CCI and CCTC), which tracks and verifies the impact of implemented strategies on reducing GHG emissions. “Act” is to provide feedback to policymakers and key stakeholders to take corrective and preventive actions [87,88,89]. SWEDD facilitates precise monitoring and management of energy generation and consumption and ensures that cities can progressively transition towards lower carbon footprints, in alignment with global sustainability goals.

7.3. Real-World Case Study and Promising Investments

The practical usefulness of the SWEDD framework is improved by the inclusion of a real-world case study. The impact of the SWEDD is directly applicable to sizable renewable energy projects that extend to onshore and offshore of 60,863 km2 as in Figure 24. The Middle East is a strategically important region as a significant crude oil supply source for the world [90]. This region is in the heart of the Middle East and has the highest potential for wind power generation. The wind power analysis displays a region with high wind speeds, particularly in the Gulf of Suez and along the Red Sea coast. This wind power analysis suggests that an offshore wind farm in this area will be highly promising. The strong winds, coupled with the vast expanse of water, provide a significant renewable energy source. Additionally, the region’s proximity to major energy markets in Egypt, Jordan, and Saudi Arabia makes it a valuable asset for grid integration and energy security. Therefore, studying the Gabal El Zeit wind farm provides a solid foundation for analysis of this promising wind energy area.
On the other hand, the wind power electrical interconnection between NEOM and surrounding countries such as Egypt, Jordan, and Saudi Arabia presents a significant opportunity for regional energy collaboration [87,88]. NEOM, with its ambitious plans to harness 100% renewable energy, particularly from wind and solar, to become a primary energy hub in the region. The interconnection enables NEOM to export surplus wind power to neighboring countries, helping to stabilize energy grids and reduce dependency on fossil fuels. Countries such as Egypt and Jordan, which also have substantial renewable energy potential, especially in wind and solar, could benefit from this collaboration by sharing resources and balancing supply and demand across borders.
Such a cross-border electrical interconnection would enhance energy security and foster economic cooperation. Egypt, Jordan, and Saudi Arabia are already exploring renewable energy projects, and linking them with NEOM’s wind power network could pave the way for a sustainable energy corridor in the region. This interconnected grid could optimize the use of wind energy, reduce carbon emissions, and support the goals of energy diversification across the Middle East. Additionally, it could create a foundation for the export of clean energy to other regions, such as Europe and Africa, further positioning the region as a leader in the global renewable energy market.
Accordingly, Saudi Arabia has signed a Memorandum of Understanding (MoU) with the Egyptian Electricity Transmission Company to develop a 10 GW wind energy project. Egypt will provide land for feasibility studies before finalizing contracts. This follows ACWA Power’s recent $1.5 billion investment in an 1100 MW wind station in Egypt’s Gulf of Suez, aiming to reduce carbon emissions by 2.4 million tons of GHG annually and power over a million homes. Promoted as the largest single contracted wind farm in the Middle East and among the largest onshore wind farms globally, this power plant is located in the Gulf of Suez and the Gabal El Zeit region. As a result, the key importance of high wind speed and power in this region is as follows:
  • Abundant Renewable Energy Source: High wind speeds and power density in the region offer a significant and readily available renewable energy resource, as shown in Figure 24.
  • Reduced Dependence on Fossil Fuels: Harnessing wind energy can reduce reliance on fossil fuels and mitigate the associated environmental impacts, such as greenhouse gas emissions.
  • Zero Energy Cities and Energy Independence: The region can become more energy independent by generating its electricity from renewable sources, reducing its vulnerability to global energy market fluctuations.
  • Economic Benefits: Large-scale wind energy projects can create jobs, stimulate economic growth, and attract investment in the region.
  • Regional Cooperation: Developing wind energy infrastructure can foster regional cooperation and collaboration in addressing shared energy challenges.

7.4. Expanding Renewable Forecasting

Accurate and timely predictions are critical for real-time energy management for smart and zero-energy cities, where balancing supply and demand, integrating renewable energy into the grid, and reducing reliance on fossil fuels are paramount. The enhanced accuracy of WSPFS offers the potential to improve energy forecasting reliability, thereby supporting more informed decision-making in grid management, energy trading, and policy development. Furthermore, the system’s efficiency in terms of computational time and memory usage positions it as a viable solution for large-scale, real-time applications in renewable energy, setting new benchmarks for predictive accuracy and operational efficiency.
The impact of this paper extends beyond wind energy, with potential applications across other renewable energy sources. The integrated prediction framework developed for wind speed and power can be adapted to address prediction challenges in other sectors, such as hydropower or solar energy. For example, the hybrid ML and DL models employed for wind power forecasting, based on wind speed, could be repurposed for solar energy forecasting by incorporating variables such as solar irradiance and temperature. Similarly, in hydropower, essential predictors such as water flow and reservoir levels can be incorporated into ensemble algorithms, enhancing prediction accuracy, and improving energy management across multiple renewable sources. Moreover, WSPFS can be adapted to various geographic regions, increasing the reliability of energy supply forecasts globally. Its flexibility to account for local environmental conditions makes it a valuable tool for optimizing energy management across diverse locations, ultimately improving the precision of renewable energy forecasts worldwide.

7.5. Sustainability Contribution

This paper contributes to Sustainable Development Goals (SDGs) by the integration of clean energy, sustainable urban development, and global partnerships. Specifically, Figure 25 highlights goals related to affordable and clean energy (SDG 7), sustainable cities and communities (SDG 11), industry innovation and infrastructure (SDG 9), climate action (SDG 13), and partnerships for the goals (SDG 17). These SDGs emphasize scalable solutions to enhance access to clean, reliable, and affordable energy, support the development of low-carbon cities, and encourage sustainable industrialization through innovative green technologies.
For instance, SDG 7 focuses on ensuring energy security and combating energy poverty globally. Similarly, SDG 11 and SDG 9 together promote a holistic view of sustainability that encompasses environmental aspects and economic and social dimensions by fostering innovation and infrastructure that lead to more sustainable cities. The role of SDG 13 and SDG 17 is pivotal, as they emphasize the need for concerted climate action and international partnerships that can mobilize resources, knowledge, and technologies across borders to accelerate progress toward all these interconnected goals. These integrated efforts are essential to realize the vision of a sustainable, resilient world where economic growth and environmental sustainability are not mutually exclusive but are pursued through shared global commitment and innovative solutions.

8. Conclusions

The Smart Wind Energy Deep Decarbonization (SWEDD) framework is an innovative approach designed to enhance the integration of wind energy into urban energy systems as a means to significantly reduce carbon emissions. This framework utilizes advanced AI algorithms to optimize wind energy forecasting, which is crucial for efficient wind farm management and energy supply adjustments in real time. By improving prediction accuracy across various time horizons, SWEDD supports the development of smart energy grids that are capable of handling the variability of wind power, thus facilitating the transition of urban environments from high carbon outputs to net-zero or carbon-negative statuses by calculating Carbon City Index (CCI) to track carbon-city transformation curve (CCTC). This incorporation of technology and renewable energy sources is pivotal in enabling cities to meet their decarbonization targets while maintaining energy security and economic viability.
This paper presents a novel integrated wind speed–power forecasting system (WSPFS) that provides accurate predictions across multiple time scales, ranging from 10 min to 36 h ahead. By combining WSF and WPF into a cohesive model, this paper addresses a critical gap in wind energy prediction methodologies. The integrated approach ensures that the output of the wind speed forecasting model directly informs the wind power prediction model, enhancing the overall accuracy and reliability of forecasts. The results demonstrate that the extremely randomized trees (Extra Trees) and Bagging ensemble models are particularly effective, achieving MAPE and high adjusted R² values across various time scales. This integration provides a robust tool for managing and optimizing wind energy generation, thereby contributing significantly to the field of renewable energy forecasting. As a result, a comprehensive methodology employed in this research, which includes a detailed comparison of 12 ML and DL algorithms, underscores the depth of analysis conducted. The study’s evaluation of different models at multiple time scales from 10 min to 36 h offers valuable insights into performance metrics such as MAPE, MSE, and R².
The practical implications of this research are profound, particularly in the context of real-time energy management and regional energy collaboration. By improving the accuracy, the developed system supports better decision-making in grid management, energy trading, and policy development. The case study of the Gabal El Zeit station and the potential for regional cooperation with neighboring countries like Egypt, Jordan, and Saudi Arabia illustrates the broader impact of these findings. Additionally, the adaptability of the integrated prediction system to other renewable energy sources, such as solar and hydropower, suggests that the methodologies developed here could enhance forecasting accuracy and energy management on a global scale. Overall, this study advances the field of wind energy forecasting and provides a foundation for future innovations in renewable energy prediction and management.

8.1. Research Limitations

To ensure the credibility and comprehensiveness of the study, it is essential to address ethical concerns such as algorithmic bias and data privacy. ML models can inadvertently reflect biases present in the training data, leading to unequal outcomes in wind power predictions across different geographic regions or weather conditions. For instance, if the dataset predominantly represents certain locations or weather patterns, the algorithm may underperform in less-represented areas, resulting in less accurate predictions. Such biases could affect the reliability of wind energy systems, particularly in regions where precise forecasting is critical for grid management and energy supply. To mitigate this risk, diverse and representative data should be incorporated, and model performance should be monitored across various contexts to ensure fairness and accuracy. Additionally, data privacy concerns arise as these models require vast amounts of meteorological and operational data, which could include sensitive information about energy usage patterns. Safeguarding this data through encryption, anonymization, and stringent access control protocols is vital to maintain trust and prevent misuse.
Moreover, considering the practical applications of ML models in renewable energy management, their potential societal and environmental impact must be critically examined. The integration of such predictive systems into energy grids could transform the way wind power is harnessed and utilized, leading to improved efficiency and sustainability. However, the deployment of these models at scale necessitates transparency in their decision-making processes, particularly in critical sectors such as energy supply, where errors or inefficiencies can have wide-reaching consequences. Regulators and stakeholders must ensure the models are robust, explainable, and subject to ethical guidelines that minimize harm and maximize public benefit. Ethical AI practices, including regular audits of model performance and bias, should be adopted to ensure that technological advancements contribute positively to both environmental goals and societal equity.
The scope of this study is confined to predictions up to 36 h ahead. Extending the forecast horizon beyond 36 h, such as 48 or 72 h, requires additional analysis and computational resources. These extended forecasts present more complex challenges due to the increasing uncertainty and variability in wind patterns over longer time frames. As a result, the development of models capable of maintaining accuracy over extended horizons necessitates further refinement in the algorithms, increased data inputs, and potentially more sophisticated computational techniques. Future work in this area should address these challenges to enhance the reliability of wind power forecasting for longer durations, which is critical for optimizing energy grid operations and ensuring efficient resource management. To conclude, all these challenges are summarized in Figure 26.

8.2. Future Work

Future work should focus on combining Numerical Weather Prediction (NWP) models with physics-informed deep learning (PIDL) to overcome some of the limitations associated with traditional machine learning and NWP integration [89]. Physics-informed deep learning directly incorporates physical laws and constraints into the learning process, allowing the model to leverage data-driven insights and domain-specific knowledge. By embedding the governing equations of fluid dynamics, thermodynamics, and atmospheric physics into the learning architecture, PIDL models can provide more accurate and generalizable predictions, even in regions or timeframes where observational data are sparse [90]. This approach helps mitigate the risk of overfitting historical data and allows the model to remain consistent with known physical principles, leading to more reliable and interpretable forecasts.
In addition, integrating NWP with physics-informed deep learning could address challenges such as computational complexity and adaptability to changing weather conditions. PIDL models can be trained to prioritize computational efficiency by learning to approximate NWP outputs with lower computational costs while maintaining accuracy. In addition, they can dynamically adjust to new data or emerging patterns, making them more robust in real-time wind speed and power prediction scenarios. This hybrid approach, combining the rigor of physics-based models with the flexibility of deep learning, holds the potential to significantly enhance forecasting capabilities and pave the way for more efficient renewable energy management.
After obtaining permission from the New and Renewable Energy Authority (NREA) in Egypt, the authors plan to test the model in real time on operational wind farms as part of future work to further validate the results. While the current study evaluates the models using historical data, real-time testing is essential for assessing the practical applicability and robustness of the proposed system under actual operating conditions. By deploying the model in real-world environments, the authors aim to determine its reliability, adaptability to dynamic weather conditions, and performance over extended periods. This real-time validation will also help identify potential challenges related to integration with existing energy systems and assess the computational efficiency of the model in live operational settings.

Author Contributions

Conceptualization, H.E. and A.A.A.; data curation, H.E.; formal analysis; H.E.; funding acquisition, A.A.A.; investigation, H.E., A.A.A. and F.K.P.H.; methodology, H.E.; project administration, H.E. and A.A.A.; resources, H.E. and A.A.A.; software, H.E.; supervision, H.E.; validation, H.E., A.A.A., and F.K.P.H.; visualization, H.E., A.A.A., and F.K.P.H.; roles/writing—original draft, H.E., A.A.A. and F.K.P.H.; writing—review and editing, H.E., A.A.A. and F.K.P.H. All authors have reviewed and approved the manuscript as written. All authors have read and agreed to the published version of the manuscript.

Funding

The authors extend their appreciation to the Researchers Supporting Project number (RSPD2024R590), King Saud University, Riyadh, Saudi Arabia.

Institutional Review Board Statement

Not applicable.

Informed Consent Statement

Not applicable.

Data Availability Statement

Data will be available upon request.

Acknowledgments

The collected data of metrological data and the actual measurements of wind speed and wind power at Gabal El Zeit station (580 MW) have been provided by the New and Renewable Energy Authority (NREA) in Egypt and Engineer\Hazem Ahmed Abd Elmaksoud.

Conflicts of Interest

Haytham Elmousalami was employed by General Petroleum Company (GPC). The remaining authors declare that the research was conducted in the absence of any commercial or financial relationships that could be construed as a potential conflict of interest.

Abbreviations

AdaBoostAdaptive boostingMLPMulti-layer perceptron
AIArtificial intelligence MRAMultiple regression analysis
ANFISAdaptive neuro-fuzzy inference systemMSEMean square error
ANNsArtificial neural networks MWMegawatts
BPBackpropagationNREANew and Renewable Energy Authority in Egypt
CARTClassification and Regression TreesNWNorthwest
CCICarbon City IndexNWPNumerical weather prediction
CCTCCarbon-city transformation curve RBFRadial base function
CIComputational intelligenceRFRandom forest
CNNConvolutional Neural NetworksRFRRandom Forest regression
CO2Carbon dioxideRMSEThe root mean squared error
CO2 eqcarbon dioxide equivalentRNNRecurrent neural network
DNNsDeep neural networks RTCReal-time computing
DT, DTRDecision tree, decision tree regressionRTD:Real-time data
ELMExtreme learning machine
Extra TreesExtremely randomized treesSDGsUnited Nations Sustainability Development Goals
GAGenetic algorithmsSVMSupport vector machine
GELUGaussian-error linear unitSVRSupport vector regression
GHGGreenhouse gasSWEDDSmart Wind Energy Deep Decarbonization (SWEDD)
IoTsInternet of thingsVSTWPFVery short-term wind power forecasting (kW/turbine)
kWKilowattsVSTWSFVery short-term wind speed forecasting (m/s)
MAMoving average WPFWind power forecasting (kW/turbine)
MAPEMean absolute percentage error WSF Wind speed forecasting (m/s)
MBMegabyteWSPFSWind speed–power forecasting system (WSPFS)
MLMachine learning XGBoostExtreme gradient boosting

References

  1. Stieva, R. Public Health Interventions in Historical Perspective: Cholera in Victorian London, 1849, 1854, and 1866. 2023. Available online: https://escholarship.mcgill.ca/concern/theses/ht24wq70f (accessed on 20 September 2024).
  2. Cointe, B.; Guillemot, H. A history of the 1.5 °C target. WIREs Clim. Change 2023, 14, e824. [Google Scholar] [CrossRef]
  3. Bergero, C.; Gosnell, G.; Gielen, D.; Kang, S.; Bazilian, M.; Davis, S.J. Pathways to net-zero emissions from aviation. Nat. Sustain. 2023, 6, 404–414. [Google Scholar] [CrossRef]
  4. Kazlou, T.; Cherp, A.; Jewell, J. Feasible deployment of carbon capture and storage and the requirements of climate targets. Nat. Clim. Change 2024, 14, 1047–1055. [Google Scholar] [CrossRef] [PubMed]
  5. Chiquetto, J.B.; Leichsenring, A.R.; dos Santos, G.M. Socioeconomic conditions and fossil fuel CO2 in the Metropolitan Area of Rio de Janeiro. Urban Clim. 2022, 43, 101176. [Google Scholar] [CrossRef]
  6. Dashkevych, O.; Portnov, B.A. Does city smartness improve urban environment and reduce income disparity? Evidence from an empirical analysis of major cities worldwide. Sustain. Cities Soc. 2023, 96, 104711. [Google Scholar] [CrossRef]
  7. Ramaswami, A.; Pandey, B.; Li, Q.; Das, K.; Nagpure, A. Toward Zero-Carbon Urban Transitions with Health, Climate Resilience, and Equity Co-Benefits: Assessing Nexus Linkages. Annu. Rev. Environ. Resour. 2023, 48, 81–121. [Google Scholar] [CrossRef]
  8. Ohene, E.; Chan, A.P.; Darko, A.; Nani, G. Navigating toward net zero by 2050: Drivers, barriers, and strategies for net zero carbon buildings in an emerging market. Build. Environ. 2023, 242, 110472. [Google Scholar] [CrossRef]
  9. Zhu, Y.; Koutra, S.; Zhang, J. Zero-carbon communities: Research hotspots, evolution, and prospects. Buildings 2022, 12, 674. [Google Scholar] [CrossRef]
  10. Seto, K.C. Strategies for Smart Net Zero Carbon Cities. Bridge 2023, 15, 15–21. [Google Scholar]
  11. Duan, Z.; Kim, S. Progress in Research on Net-Zero-Carbon Cities: A Literature Review and Knowledge Framework. Energies 2023, 16, 6279. [Google Scholar] [CrossRef]
  12. Fan, Y.; Wei, F. Contributions of natural carbon sink capacity and carbon neutrality in the context of net-zero carbon cities: A case study of Hangzhou. Sustainability 2022, 14, 2680. [Google Scholar] [CrossRef]
  13. Pamucar, D.; Deveci, M.; Canıtez, F.; Paksoy, T.; Lukovac, V. A novel methodology for prioritizing zero-carbon measures for sustainable transport. Sustain. Prod. Consum. 2021, 27, 1093–1112. [Google Scholar] [CrossRef]
  14. Griffiths, S.; Sovacool, B.K. Rethinking the future low-carbon city: Carbon neutrality, green design, and sustainability tensions in the making of Masdar City. Energy Res. Soc. Sci. 2020, 62, 101368. [Google Scholar] [CrossRef]
  15. Wang, X.; Wang, G.; Chen, T.; Zeng, Z.; Heng, C.K. Low-carbon city and its future research trends: A bibliometric analysis and systematic review. Sustain. Cities Soc. 2023, 90, 104381. [Google Scholar] [CrossRef]
  16. Kennedy, C.; Stewart, I.D.; Westphal, M.I.; Facchini, A.; Mele, R. Keeping global climate change within 1.5 C through net negative electric cities. Curr. Opin. Environ. Sustain. 2018, 30, 18–25. [Google Scholar] [CrossRef]
  17. Kharissova, A.B.; Kharissova, O.V.; Kharisov, B.I.; Méndez, Y.P. Carbon negative footprint materials: A review. Nano-Struct. Nano-Objects 2024, 37, 101100. [Google Scholar] [CrossRef]
  18. Wang, Z.; Chu, E. The path toward urban carbon neutrality: How does the low-carbon city pilot policy stimulate low-carbon technology? Econ. Anal. Policy 2024, 82, 954–975. [Google Scholar] [CrossRef]
  19. Kirimtat, A.; Krejcar, O.; Kertesz, A.; Tasgetiren, M.F. Future trends and current state of smart city concepts: A survey. IEEE Access 2020, 8, 86448–86467. [Google Scholar] [CrossRef]
  20. Stübinger, J.; Schneider, L. Understanding smart city—A data-driven literature review. Sustainability 2020, 12, 8460. [Google Scholar] [CrossRef]
  21. Zhao, F.; Fashola, O.I.; Olarewaju, T.I.; Onwumere, I. Smart city research: A holistic and state-of-the-art literature review. Cities 2021, 119, 103406. [Google Scholar] [CrossRef]
  22. Al Sharif, R.; Pokharel, S. Smart city dimensions and associated risks: Review of literature. Sustain. Cities Soc. 2022, 77, 103542. [Google Scholar] [CrossRef]
  23. Chu, Z.; Cheng, M.; Yu, N.N. A smart city is a less polluted city. Technol. Forecast. Soc. Change 2021, 172, 121037. [Google Scholar] [CrossRef]
  24. Haque, A.K.M.B.; Bhushan, B.; Dhiman, G. Conceptualizing smart city applications: Requirements, architecture, security issues, and emerging trends. Expert Syst. 2022, 39, e12753. [Google Scholar] [CrossRef]
  25. Lai, C.S.; Jia, Y.; Dong, Z.; Wang, D.; Tao, Y.; Lai, Q.H.; Wong, R.T.; Zobaa, A.F.; Wu, R.; Lai, L.L. A review of technical standards for smart cities. Clean Technol. 2020, 2, 290–310. [Google Scholar] [CrossRef]
  26. Shamsuzzoha, A.; Nieminen, J.; Piya, S.; Rutledge, K. Smart city for sustainable environment: A comparison of participatory strategies from Helsinki, Singapore and London. Cities 2021, 114, 103194. [Google Scholar] [CrossRef]
  27. Kashef, M.; Visvizi, A.; Troisi, O. Smart city as a smart service system: Human-computer interaction and smart city surveillance systems. Comput. Hum. Behav. 2021, 124, 106923. [Google Scholar] [CrossRef]
  28. Portocarrero Mendoza, P.S. Technical-economic evaluation of a 94.5 MW wind power plant at different elevation heights. A case study in Peru’s countryside. J. Eng. Res. 2024, in press. [Google Scholar] [CrossRef]
  29. Alves, M.A.; Oliveira, B.A.S.; Guimarães, F.G. Ensemble ranking: An aggregation of multiple multicriteria methods and scenarios and its application to power generation planning. Decis. Anal. J. 2024, 10, 100435. [Google Scholar] [CrossRef]
  30. Di Piazza, A.; Di Piazza, M.; La Tona, G.; Luna, M. An artificial neural network-based forecasting model of energy-related time series for electrical grid management. Math. Comput. Simul. 2020, 184, 294–305. [Google Scholar] [CrossRef]
  31. Sun, Y.; Zhou, Q.; Sun, L.; Sun, L.; Kang, J.; Li, H. CNN–LSTM–AM: A power prediction model for offshore wind turbines. Ocean Eng. 2024, 301, 117598. [Google Scholar] [CrossRef]
  32. Elmousalami, H.; Elshaboury, N.; Elyamany, A.H. Green artificial intelligence for cost-duration variance prediction (CDVP) for irrigation canals rehabilitation projects. Expert Syst. Appl. 2024, 249, 123789. [Google Scholar] [CrossRef]
  33. Elmousalami, H.; Sakr, I. Artificial Intelligence for Drilling Lost Circulation: A Systematic Literature Review. Geoenergy Sci. Eng. 2024, 239, 212837. [Google Scholar] [CrossRef]
  34. Davis, N.N.; Badger, J.; Hahmann, A.N.; Hansen, B.O.; Mortensen, N.G.; Kelly, M.; Larsén, X.G.; Olsen, B.T.; Floors, R.; Lizcano, G. The Global Wind Atlas: A high-resolution dataset of climatologies and associated web-based application. Bull. Am. Meteorol. Soc. 2023, 104, E1507–E1525. [Google Scholar] [CrossRef]
  35. Breslow, P.; Sailor, D. Vulnerability of wind power resources to climate change in the continental United States. Renew. Energy 2002, 27, 585–598. [Google Scholar] [CrossRef]
  36. Stamatellos, G.; Stamatelos, T. Short-Term Load Forecasting of the Greek Electricity System. Appl. Sci. 2023, 13, 2719. [Google Scholar] [CrossRef]
  37. Hu, X.; Jaraitė, J.; Kažukauskas, A. The effects of wind power on electricity markets: A case study of the Swedish intraday market. Energy Econ. 2021, 96, 105159. [Google Scholar] [CrossRef]
  38. Lydia, M.; Edwin Prem Kumar, G.; Akash, R. Wind speed and wind power forecasting models. Energy Environ. 2024, 958305X241228515. [Google Scholar] [CrossRef]
  39. Liao, S.; Tian, X.; Liu, B.; Liu, T.; Su, H.; Zhou, B. Short-Term Wind Power Prediction Based on LightGBM and Meteorological Reanalysis. Energies 2022, 15, 6287. [Google Scholar] [CrossRef]
  40. Ahmad, A.; Xiao, X.; Mo, H.; Dong, D. Tuning data preprocessing techniques for improved wind speed prediction. Energy Rep. 2024, 11, 287–303. [Google Scholar] [CrossRef]
  41. Cakiroglu, C.; Demir, S.; Hakan Ozdemir, M.; Latif Aylak, B.; Sariisik, G.; Abualigah, L. Data-driven interpretable ensemble learning methods for the prediction of wind turbine power incorporating SHAP analysis. Expert Syst. Appl. 2024, 237, 121464. [Google Scholar] [CrossRef]
  42. Zhang, Y.; Kong, X.; Wang, J.; Wang, H.; Cheng, X. Wind power forecasting system with data enhancement and algorithm improvement. Renew. Sustain. Energy Rev. 2024, 196, 114349. [Google Scholar] [CrossRef]
  43. Shahid, F.; Zameer, A.; Muneeb, M. A novel genetic LSTM model for wind power forecast. Energy 2021, 223, 120069. [Google Scholar] [CrossRef]
  44. Ghaderi, A.; Sanandaji, B.M.; Ghaderi, F. Deep forecast: Deep learning-based spatio-temporal forecasting. arXiv 2017, arXiv:170708110. [Google Scholar]
  45. Elmousalami, H.H. Comparison of artificial intelligence techniques for project conceptual cost prediction: A case study and comparative analysis. IEEE Trans. Eng. Manag. 2020, 68, 183–196. [Google Scholar] [CrossRef]
  46. Pei, S.; Qin, H.; Zhang, Z.; Yao, L.; Wang, Y.; Wang, C.; Liu, Y.; Jiang, Z.; Zhou, J.; Yi, T. Wind speed prediction method based on Empirical Wavelet Transform and New Cell Update Long Short-Term Memory network. Energy Convers. Manag. 2019, 196, 779–792. [Google Scholar] [CrossRef]
  47. Zhu, Q.; Chen, J.; Shi, D.; Zhu, L.; Bai, X.; Duan, X.; Liu, Y. Learning Temporal and Spatial Correlations Jointly: A Unified Framework for Wind Speed Prediction. IEEE Trans. Sustain. Energy 2019, 11, 509–523. [Google Scholar] [CrossRef]
  48. Ren, Y.; Suganthan, P.; Srikanth, N. A comparative study of empirical mode decomposition-based short-term wind speed forecasting methods. IEEE Trans. Sustain. Energy 2015, 6, 236–244. [Google Scholar] [CrossRef]
  49. Nascimento, E.G.S.; de Melo, T.A.; Moreira, D.M. A transformer-based deep neural network with wavelet transform for forecasting wind speed and wind energy. Energy 2023, 278, 127678. [Google Scholar] [CrossRef]
  50. Bentsen, L.Ø.; Warakagoda, N.D.; Stenbro, R.; Engelstad, P. Spatio-temporal wind speed forecasting using graph networks and novel Transformer architectures. Appl. Energy 2023, 333, 120565. [Google Scholar] [CrossRef]
  51. Bommidi, B.S.; Teeparthi, K.; Kosana, V. Hybrid wind speed forecasting using ICEEMDAN and transformer model with novel loss function. Energy 2023, 265, 126383. [Google Scholar] [CrossRef]
  52. Wang, S.; Shi, J.; Yang, W.; Yin, Q. High and low frequency wind power prediction based on Transformer and BiGRU-Attention. Energy 2024, 288, 129753. [Google Scholar] [CrossRef]
  53. Wang, J.; Qian, Y.; Zhang, L.; Wang, K.; Zhang, H. A novel wind power forecasting system integrating time series refining, nonlinear multi-objective optimized deep learning and linear error correction. Energy Convers. Manag. 2024, 299, 117818. [Google Scholar] [CrossRef]
  54. Yaghoubirad, M.; Azizi, N.; Farajollahi, M.; Ahmadi, A. Deep learning-based multistep ahead wind speed and power generation forecasting using direct method. Energy Convers. Manag. 2023, 281, 116760. [Google Scholar] [CrossRef]
  55. Karim, F.K.; Khafaga, D.S.; Eid, M.M.; Towfek, S.K.; Alkahtani, H.K. A novel bio-inspired optimization algorithm design for wind power engineering applications time-series forecasting. Biomimetics 2023, 8, 321. [Google Scholar] [CrossRef]
  56. Mayer, M.J.; Yang, D. Pairing ensemble numerical weather prediction with ensemble physical model chain for probabilistic photovoltaic power forecasting. Renew. Sustain. Energy Rev. 2023, 175, 113171. [Google Scholar] [CrossRef]
  57. Bauer, P.; Thorpe, A.; Brunet, G. The quiet revolution of numerical weather prediction. Nature 2015, 525, 47–55. [Google Scholar] [CrossRef]
  58. Elmousalami, H.H.; Elyamany, A.H.; Ibrahim, A.H. Evaluation of cost drivers for field canals improvement projects. Water Resour. Manag. 2018, 32, 53–65. [Google Scholar] [CrossRef]
  59. Alnaser, A.A.; Hassan Ali, A.; Elmousalami, H.H.; Elyamany, A.; Gouda Mohamed, A. Assessment Framework for BIM-Digital Twin Readiness in the Construction Industry. Buildings 2024, 14, 268. [Google Scholar] [CrossRef]
  60. Zhang, J.; Draxl, C.; Hopson, T.; Monache, L.D.; Vanvyve, E.; Hodge, B.M. Comparison of numerical weather prediction based deterministic and probabilistic wind resource assessment methods. Appl. Energy 2015, 156, 528–541. [Google Scholar] [CrossRef]
  61. Chen, N.; Qian, Z.; Nabney, I.T.; Meng, X. Wind power forecasts using Gaussian processes and numerical weather prediction. IEEE Trans. Power Syst. 2013, 29, 656–665. [Google Scholar] [CrossRef]
  62. NERA Annual Report 2018. Available online: http://www.nrea.gov.eg/Content/reports/English%20AnnualReport.pdf (accessed on 20 September 2024).
  63. Ersoy, S.R.; Terrapon-Pfaff, J. Sustainable Transformation of Egypt’s Energy System: Development of a Phase Model. 2022. Available online: https://epub.wupperinst.org/files/7892/7892_Egypt.pdf (accessed on 21 September 2024).
  64. Abdelwahab, S.A.M.; El-Rifaie, A.M.; Hegazy, H.Y.; Tolba, M.A.; Mohamed, W.I.; Mohamed, M. Optimal Control and Optimization of Grid-Connected PV and Wind Turbine Hybrid Systems Using Electric Eel Foraging Optimization Algorithms. Sensors 2024, 24, 2354. [Google Scholar] [CrossRef] [PubMed]
  65. Glorot, X.; Bordes, A.; Bengio, Y. Deep sparse rectifier neural networks. In Proceedings of the 14th International Conference on Artificial Intelligence and Statistics, Fort Lauderdale, FL, USA, 11–13 April 2011; pp. 315–323. [Google Scholar]
  66. Elmousalami, H.H. Closure to “Artificial Intelligence and Parametric Construction Cost Estimate Modeling: State-of-the-Art Review” by Haytham H. Elmousalami. J. Constr. Eng. Manag. 2021, 147, 7021002. [Google Scholar] [CrossRef]
  67. Jiang, Y.; Song, Z.; Kusiak, A. Very short-term wind speed forecasting with Bayesian structural break model. Renew. Energy 2013, 50, 637–647. [Google Scholar] [CrossRef]
  68. Elmousalami, H.; Sakr, I. Automated lost circulation severity classification and mitigation system using explainable Bayesian optimized ensemble learning algorithms. J. Pet. Explor. Prod. Technol. 2024, 14, 2735–2752. [Google Scholar] [CrossRef]
  69. Elmousalami, H.H. Intelligent methodology for project conceptual cost prediction. Heliyon 2019, 5, e01625. Available online: https://www.cell.com/heliyon/pdf/S2405-8440(18)37863-0.pdf (accessed on 15 June 2024). [CrossRef]
  70. Elmousalami, H.H.; Elshaboury, N.A.T.; Maxi, M.M.I.; Ibrahim, A.H.; Elyamany, A.H. Bayesian Optimized Ensemble Learning System for Predicting Conceptual Cost and Construction Duration of Irrigation Improvement Systems. KSCE J. Civ. Eng. 2024, 100014. [Google Scholar]
  71. Elmousalami, H.H. Artificial intelligence and parametric construction cost estimate modeling: State-of-the-art review. J. Constr. Eng. Manag. 2020, 146, 3119008. [Google Scholar] [CrossRef]
  72. Sohoni, V.; Gupta, S.; Nema, R. A critical review on wind turbine power curve modelling techniques and their applications in wind-based energy systems. J. Energy 2016, 2016, 8519785. [Google Scholar] [CrossRef]
  73. Fahim, M.; Sharma, V.; Cao, T.-V.; Canberk, B.; Duong, T.Q. Machine Learning-Based Digital Twin for Predictive Modeling in Wind Turbines. IEEE Access 2022, 10, 14184–14194. [Google Scholar] [CrossRef]
  74. Schlechtingen, M.; Santos, I.; Achiche, S. Using data-mining approaches for wind turbine power curve monitoring: A comparative study. IEEE Trans. Sustain. Energy 2013, 4, 671–679. [Google Scholar] [CrossRef]
  75. Bilendo, F.; Meyer, A.; Badihi, H.; Lu, N.; Cambron, P.; Jiang, B. Applications and Modeling Techniques of Wind Turbine Power Curve for Wind Farms—A Review. Energies 2022, 16, 180. [Google Scholar] [CrossRef]
  76. Hur, J. Potential capacity factor estimates of wind generating resources for transmission planning. Renew. Energy 2021, 179, 1742–1750. [Google Scholar] [CrossRef]
  77. Boland, J.; Farah, S. Probabilistic Forecasting of Wind and Solar Farm Output. Energies 2021, 14, 5154. [Google Scholar] [CrossRef]
  78. Khamees, A.K.; Abdelaziz, A.Y.; Eskaros, M.R.; El-Shahat, A.; Attia, M.A. Optimal Power Flow Solution of Wind-Integrated Power System Using Novel Metaheuristic Method. Energies 2021, 14, 6117. [Google Scholar] [CrossRef]
  79. Shiravani, F.; Cortajarena, J.A.; Alkorta, P.; Barambones, O. Generalized Predictive Control Scheme for a Wind Turbine System. Sustainability 2022, 14, 8865. [Google Scholar] [CrossRef]
  80. Xu, J.; Zou, J.; Ziegler, A.D.; Wu, J.; Zeng, Z. What drives the change of capacity factor of wind turbine in the United States? Environ. Res. Lett. 2023, 18, 64009. [Google Scholar] [CrossRef]
  81. Park, J.-Y.; Lee, J.-K.; Oh, K.-Y.; Lee, J.-S. Development of a novel power curve monitoring method for wind turbines and its field tests. IEEE Trans. Energy Convers. 2014, 29, 119–128. [Google Scholar] [CrossRef]
  82. Lee, J.T.; Kim, H.G.; Kang, Y.H.; Kim, J.Y. Determining the Optimized Hub Height of Wind Turbine Using the Wind Resource Map of South Korea. Energies 2019, 12, 2949. [Google Scholar] [CrossRef]
  83. Basu, J.B.; Dawn, S.; Saha, P.K.; Chakraborty, M.R.; Ustun, T.S. Economic Enhancement of Wind–Thermal–Hydro System Considering Imbalance Cost in Deregulated Power Market. Sustainability 2022, 14, 15604. [Google Scholar] [CrossRef]
  84. Javied, T.; Esfandyari, A.; Franke, J. Systematic energy management: A foundation for sustainable production. In Proceedings of the 2016 IEEE Conference on Technologies for Sustainability (SusTech), Phoenix, AZ, USA, 9–11 October 2016; IEEE: Piscataway, NJ, USA, 2016; pp. 20–27. Available online: https://ieeexplore.ieee.org/abstract/document/7897137/ (accessed on 21 September 2024).
  85. Fukutomi, M. Oil or geopolitical issues?: Quantitative rethinking of political instability in the Middle East and North Africa. GeoJournal 2024, 89, 55. [Google Scholar] [CrossRef]
  86. Elmousalami, H.H.; Darwish, A.; Hassanien, A.E. The Truth About 5G and COVID-19: Basics, Analysis, and Opportunities. In Digital Transformation and Emerging Technologies for Fighting COVID-19 Pandemic: Innovative Approaches; Hassanien, A.E., Darwish, A., Eds.; Studies in Systems, Decision and Control; Springer International Publishing: Cham, Switzerland, 2021; Volume 322, pp. 249–259. ISBN 978-3-030-63306-6. [Google Scholar]
  87. Boretti, A.; Castelletto, S. Cost of solar and wind electricity made dispatchable through hydrogen, thermal, and battery energy storage in NEOM City. Int. J. Energy Water Resour. 2023, 7, 309–326. [Google Scholar] [CrossRef]
  88. Elmousalami, H.H.; Ali, A.H.; Kineber, A.F.; Elyamany, A. A novel conceptual cost estimation decision-making model for field canal improvement projects. Int. J. Constr. Manag. 2023, 24, 651–663. [Google Scholar] [CrossRef]
  89. Jeong, Y.; Lee, S.; Lee, J.; Choi, W. Data-efficient surrogate modeling using meta-learning and physics-informed deep learning approaches. Expert Syst. Appl. 2024, 250, 123758. [Google Scholar] [CrossRef]
  90. Yang, G.; Jiang, Y.; Liu, F.; Liu, J. Magnetic Field Analysis of Reactor Based on TL-PIDL and Time Domain PIDL. IEEE Trans. Appl. Supercond. 2024, 34, 4905205. Available online: https://ieeexplore.ieee.org/abstract/document/10633846/ (accessed on 9 September 2024). [CrossRef]
Figure 1. Wind power potential atlas in the world map at 100 m height [34].
Applsci 14 11918 g001
Figure 2. Wind speed and power forecasting time scales and applications [38,39].
Applsci 14 11918 g002
Figure 3. Key research steps.
Applsci 14 11918 g003
Figure 4. Wind speed and power integration methodology.
Applsci 14 11918 g004
Figure 6. Results of ML models for VSTWSF 10 minutes (10 min).
Applsci 14 11918 g006
Figure 7. ML results for 30 min ahead of WSF.
Applsci 14 11918 g007
Figure 8. ML results for 6 h ahead of WSF.
Applsci 14 11918 g008
Figure 9. ML results for 24 h ahead of WSF.
Applsci 14 11918 g009
Figure 10. ML results for 36 h ahead of WSF.
Applsci 14 11918 g010
Figure 11. Results of ML models for VSTWPF (10 min).
Applsci 14 11918 g011
Figure 12. ML results for 30 min ahead WPF.
Applsci 14 11918 g012
Figure 13. ML results for 6 h ahead WPF.
Applsci 14 11918 g013
Figure 14. ML results for 24 h ahead WPF.
Applsci 14 11918 g014
Figure 15. ML results for 36 h ahead WPF.
Applsci 14 11918 g015
Figure 16. (A) Actual wind speed (m/s) against VSTWSF (m/s) and (B) actual wind power (kW/turbine) against VSTWPF (kW/turbine).
Applsci 14 11918 g016
Figure 17. (A) Actual wind speed (m/s) observations against VSTWSF (m/s) and (B) actual power (kW/turbine) observations against VSTWPF (kW/turbine).
Applsci 14 11918 g017aApplsci 14 11918 g017b
Figure 18. (A) Performance of Extra Tree models for 36 h ahead of WSF and (B) performance of bagging for 36 h ahead of WPF.
Applsci 14 11918 g018aApplsci 14 11918 g018b
Figure 19. (A) Average computational time for WSF, (B) average computational time for WPF, (C) average computational memory usage for WSF, and (D) average computational memory usage for WPF.
Applsci 14 11918 g019aApplsci 14 11918 g019b
Figure 21. An integrated real-time computing wind speed–-power forecasting system (WSPFS) from 10 min to 36 h ahead.
Applsci 14 11918 g021
Figure 22. Carbon-city transformation curve (CCTC).
Applsci 14 11918 g022
Figure 23. Smart wind energy deep decarbonization (SWEDD) framework.
Applsci 14 11918 g023
Figure 24. Gulf of Suez and Gulf of Aqaba: one of the highest wind power potential areas in the Middle East and North Africa (MENA) region reaching a maximum of 1903 W/m2 and 1235 W/m2 as a top 10% [34].
Applsci 14 11918 g024
Figure 25. Sustainable development goals (SDGs).
Applsci 14 11918 g025
Figure 26. Challenges and limitations of wind energy forecasting.
Applsci 14 11918 g026
Table 1. Different concepts of smart and sustainable city development.
City Level ConceptExamples/Potential Examples *Ref.
High-carbon cityA city with high greenhouse gas (GHG) emissions.Beijing, Chicago, Shanghai, New York, Seoul, Tokyo, Hong Kong, Los Angeles [11,12,13]
Low-carbon cityA city with reduced greenhouse gas emissions.Copenhagen, Oslo, Vancouver, Barcelona, Sydney[9,10,11]
Nearly zero-carbon cityA city approaching carbon neutrality.Melbourne, Reykjavik, Stockholm, Freiburg[14,15]
Zero-carbon city (ZS) or zero-energy cityA city with net-zero greenhouse gas emissions.Canberra *, Oslo *, Bulawayo *, Chongming *, Denver *, Cape Town *[11,12]
Negative-carbon cityA city that absorbs more carbon than it emits.Curitiba, Brazil (for its extensive urban green spaces)[16,17,18]
100% renewable energy cityA city that has to target a 100% renewable energy supply.Reykjavík, Canberra *, Paris *, San Francisco *, Minneapolis[9,10,11]
Smart city (SC)A city uses digital technologies such as AI, digital twins, and the Internet of Things (IoTs) for resource management efficiency.Singapore, London, Dubai, Masdar City, Brisbane, New administrative capital, Taipei, GIFT City, Amsterdam, Manchester[19,20,21]
Smart and zero-carbon city (SZC)A city combining smart technologies and zero-carbon goals.NEOM *, Copenhagen *, Melbourne *[22,23,24]
Smart and positive-carbon cityA city combining smart technologies and carbon absorption such as tree planting and carbon sequestration including bio-sequestration.NEOM *, Stockholm *, Canberra, Dar es Salaam *[25,26,27,28,29,30]
Potential Examples *: The city has ambitious goals to become climate-neutral or positive by 2050 and is investing in renewable energy and sustainable transportation.
Table 2. Comparison of recent relative studies.
ReferenceMain ObjectiveYearAspects
Wind Speed ForecastingWind Speed-Power ForecastingSmart Cities FrameworkComputational Time and CostDifferent Time Horizons
[38]Wind speed and power forecasting models2024×××
[39]Short-term combined forecasting for wind power2024×××
[31]Offshore wind turbine power prediction model2024×××
[40]Enhanced wind speed prediction techniques2024××××
[41]Ensemble learning methods for wind turbine power forecasting2024××××
[42]Wind power forecasting system using data augmentation2024×××
This paperIntegrated wind speed–power prediction system2024
Disclaimer/Publisher’s Note: The statements, opinions and data contained in all publications are solely those of the individual author(s) and contributor(s) and not of MDPI and/or the editor(s). MDPI and/or the editor(s) disclaim responsibility for any injury to people or property resulting from any ideas, methods, instructions or products referred to in the content.

