Abstract
The rise of malware attacks presents a significant cyber-security challenge, with advanced techniques and offline command-and-control (C2) servers causing disruptions and financial losses. This paper proposes a methodology for dynamic malware analysis and classification using a malware Portable Executable (PE) file from the MalwareBazaar repository. It suggests effective strategies to mitigate the impact of evolving malware threats. For this purpose, a five-level approach for data management and experiments was utilised: (1) generation of a customised dataset by analysing a total of 582 malware and 438 goodware samples from Windows PE files; (2) feature extraction and feature scoring based on Chi2 and Gini importance; (3) empirical evaluation of six state-of-the-art baseline machine learning (ML) models, including Logistic Regression (LR), Support Vector Machine (SVM), Naive Bayes (NB), Random Forest (RF), XGBoost (XGB), and K-Nearest Neighbour (KNN), with the curated dataset; (4) malware family classification using VirusTotal APIs; and, finally, (5) categorisation of 23 distinct APIs from 266 malware APIs. According to the results, Gini’s method takes a holistic view of feature scoring, considering a wider range of API activities. The RF achieved the highest precision of 0.99, accuracy of 0.96, area under the curve (AUC) of 0.98, and F1-score of 0.96, with a 0.93 true-positive rate (TPR) and 0.0098 false-positive rate (FPR), among all applied ML models. The results show that Trojans (27%) and ransomware (22%) are the most risky among 11 malware families. Windows-based APIs (22%), the file system (12%), and registry manipulation (8.2%) showcased their importance in detecting malicious activity in API categorisation. This paper considers a dual approach for feature reduction and scoring, resulting in an improved F1-score (2%), and the inclusion of AUC and specificity metrics distinguishes it from existing research (Section Comparative Analysis with Existing Approaches). The newly generated dataset is publicly available in the GitHub repository (Data Availability Statement) to facilitate aspirant researchers’ dynamic malware analysis.
1. Introduction
In the age of interconnected computer networks, malware poses a significant threat to computer security [1,2,3]. To mitigate the risks posed by cyberattacks, the establishment of Computer Emergency Response Teams (CERTs) has been crucial. These CERTs play a vital role in safeguarding IT infrastructures by actively monitoring and analysing cyber-security events, as well as raising awareness about cyber security among various stakeholders [2].
As reported by Cybercrime Magazine [4], the global damage caused by ransomware alone, which is a type of malware, amounted to USD 20 billion in 2021 and is estimated to increase to USD 265 billion in 2031. This is a result of not only the attackers’ innovative methods but also the rapid proliferation of malware, with an expected production of over 91 million new pieces in 2022 [5]. Due to its user-friendly interface and lightweight use, the Windows operating system has experienced rapid growth in demand. However, the popularity of the Windows operating system also makes it a target for security threats [6]. Users who lack advanced computer skills may not be aware of these threats, which can take the form of illegal exploitation of the system. Malware is one of the most common methods used to carry out such attacks. For example, the Windows Portable Executable (PE) is a file format used by Windows operating systems to store executable code, data, and resources. Malware authors can create malicious programs in the form of Windows PE files, which can then be distributed and executed on Windows systems. These types of malware are referred to as Windows PE malware or simply PE malware [7]. Over the years, malware has undergone significant structural changes; however, there are still identifiable features that could help analysts to detect it. When malware runs on a Windows operating system, it typically utilises some of the operating system’s services. It accesses Windows DLLs to invoke various API functions, and the sets of DLLs accessed or the API functions called produce the malicious behaviour. Additionally, analysing the information in the PE header and its various sections [8] can aid in detecting malware. Ultimately, if the malicious behaviour is thoroughly analysed, it is possible to detect malware.
Classification of malicious software is an ongoing challenge due to constant development and improvement by malicious actors. Various techniques, such as signature-based, behaviour-based, and specification-based methods, are commonly employed for malware detection [3]. Signature-based techniques offer fast detection and low computational requirements but struggle with new or unknown malware. Behaviour-based methods can detect both known and unknown malware but require high computational resources [9]. To address these limitations, researchers have developed specification-based techniques, which leverage behaviour-based approaches. Data mining and ML techniques have been successfully applied, achieving high accuracy in malware detection and classification [10,11,12]. These methods, particularly effective for metamorphic malware, focus on behavioural features rather than structural ones [13,14]. API call sequences, offering valuable insights into malware behaviour, have been widely utilised by researchers [15,16,17,18]. The ability to classify malware based on API call behaviour enables faster attribution and a better understanding of the malware’s impact. This knowledge empowers administrators to devise appropriate mitigation strategies. Despite the existing approaches that utilize Windows PE executable files for feature extraction and employ ML algorithms for malware detection, there is a lack of comprehensive research investigating the correlation between feature extraction and scoring techniques for API calls and their impact on the accuracy and efficiency of various ML algorithms in malware detection.
Hence, this paper aims to answer the following three research questions:
RQ1: How does the extracting the frequency of API calls from Windows PE files contribute to the detection and classification of malware (Section 4.3)?
RQ2: What are the most influential features identified by the feature extraction and scoring methods in distinguishing between malware and goodware (Section 4.4)?
RQ3: How does the performance of state-of-the-art (SOTA) ML algorithms vary in terms of accuracy and efficiency for malware detection when trained on the extracted features from Windows PE files (Section 4.5)?
By considering these research questions, the research contributions of this paper are as follows:
Malware analysis: Dynamic analysis of malware samples within a controlled Cuckoo Sandbox environment, which yielded critical insights into malware behaviour (Section 3.1.2).
Dataset generation: Curation of a new dataset consisting of API calls of both malware and goodware derived from Windows PE files (Section 3.1.3).
Malware classification: Classification of malware families by leveraging the Virustotal API for accurate labelling (Section 4.2).
API categorisation: Detailed categorisation of APIs used within each PE file (Section 4.3).
Feature scoring: Identification of APIs that contribute to malicious activities utilising feature scoring methods (Section 4.4).
Performance evaluation: A comprehensive performance analysis of ML models based on performance metrics (Section 4.5).
Comparative analysis: A comparative analysis highlighting the distinguishing features of our approach compared to existing research in the field (Section 5).
The remainder of the paper is organised in the following sections: Section 2 provides an overview of the related work in the field. Section 3 presents the methodology employed in our research. Section 4, presents and discusses the results obtained from the classification algorithms used. Section 5 presents a comprehensive comparative analysis, highlighting the unique aspects of our work compared to existing studies. Section 6, focuses on the limitations of the research, as well as outlining future research directions, particularly focusing on addressing the highlighted shortcomings. The paper concludes with Section 7, where a summary of the key findings and contributions of the research is presented.
2. Related Work
This section discusses the existing research that has used ML for malware analysis, with a focus on API calls and feature extraction. Dynamic feature-based malware detection techniques are widely used to detect and classify unseen malware. These techniques typically inspect activities such as resource consumption, triggered system calls [19], invoked API calls [20], function-based features [21], and others to differentiate between malware and benign software. Usually, behaviour patterns are collected while the input file is executed in an isolated environment known as a sandbox. Numerous dynamic feature-based malware detection approaches that employ sandbox technology have been proposed over the years [22,23]. Yazi et al. [13] used Cuckoo Sandbox to extract several API calls from several malware types. Qiao et al. [24] showed that, in the context of malware analysis, a sequence of API calls can be viewed as a set of transaction data, where each API call and its corresponding arguments form a collection of items that can potentially reveal patterns of behaviour that are indicative of malicious activity. Shudong Li et al. [25] utilised category weights for each malware family before selecting features and then performed feature selection based on the weights to ensure the accuracy of the classification task. Hansen et al. [26] employed API call sequences and frequency to identify and classify malware by utilising the Random Forest classifier. Daeef et al. [27] proposed a method to uncover the underlying patterns of malicious behaviour among different malware families by utilising the Jaccard index and visualisation techniques. J. Singh et al. [28] and Albishry et al. [29] explained how ML techniques have been widely utilised in the field of malware detection. These techniques involve training classification algorithms using features extracted from malware samples. Vadrevu et al. [30], Mills et al. [31], Uppal et al. [32], and Kwon et al. [33] employed Random Forest classifiers to detect malware based on PE file characteristics and network behaviours. Similarly, Mao et al. [34], Wüchner et al. [35], and Ahmadi et al. [36] developed Random Forest classifiers to detect malware using features such as system calls, file system activities, and Windows registry information. Amer and Zelinka [37] proposed an approach focused on extracting the most significant features from malware PE files to reduce data dimensionality. In addition, Dener et al. [38] and Azmee et al. [39] compared the performance of various ML algorithms for PE malware detection. They found that XGBoost and logistic regression exhibited the best performance among the tested methods.
Due to the varying lengths of API call sequences, it can be challenging to identify robust features for malware detection. To address this issue, researchers have proposed using deep learning models based on API request sequences. Recurrent neural networks (RNNs) are particularly effective in handling time-series sequences, especially in the field of natural language processing. Li et al. [40] utilised an RNN model to classify malware families, with Long API call sequences used as the basis for categorising different types of malware. Eskandari et al. [41] utilised RNNs and features extracted from API requests to differentiate between malware and benign files. Oliveira et al. [42] proposed a method of converting API calls into a graph structure by using the depth graph convolution neural network (DGCNN) to distinguish between malware and legitimate samples. Tang et al. [43] proposed a method to represent malware behaviour by converting API calls to images based on a colour-mapping criterion by using a convolutional neural network (CNN). The work by Fujino et al. [44] introduced the concept of API call topics as a way to identify similar malware samples based on their API call behaviour. David and Netanyahu [45] proposed an approach called DeepSign, which utilises deep learning to automatically generate malware signatures. Salehi et al. [46] proposed a dynamic malware detection approach named MAAR that analyses the behaviour of malware in the system during runtime. The method generates features based on API calls and their corresponding arguments to identify malicious activities.
Existing approaches often use Windows APIs for feature extraction and employ machine learning algorithms for malware detection. However, there is a research gap concerning the significance of API-call feature extraction, the role of scoring techniques, and their combined impact on various ML algorithms for efficient malware detection. This paper adopts established methodologies in malware detection, particularly concentrating on malware family classification and API categorisation, aligning with the existing studies. However, what distinctly differentiates this research is the strategic use of feature selection and scoring models, particularly Chi2 and Gini importance, to reduce the feature space and assess individual feature significance in identifying malicious activities. This dual-layered approach improves precision and effectiveness in malware detection by pinpointing key API calls indicative of malicious behaviour. The evaluation using ML models on a new dataset enhances our understanding of specific API calls’ contributions to identifying malicious activity, thereby offering a significant contribution to the ongoing efforts in malware detection and analysis.
3. Materials and Methods
This section, as illustrated in Figure 1, outlines in detail the five stages of the proposed methodology. Initially, a diverse set of PE files were gathered, comprising both malware and goodware samples. These files were subjected to dynamic analysis within the Cuckoo Sandbox environment, yielding comprehensive JSON reports. The next phase involved the extraction of API calls and their counts from these reports, leading to the generation of a new dataset. A subsequent step involved malware family classification and API categorisation according to their role in malicious activities. Afterwards, this dataset underwent feature extraction and scoring using Chi2 and Gini to assess the relevance and impact of different APIs. The final stage included an empirical evaluation using six state-of-the-art ML models.
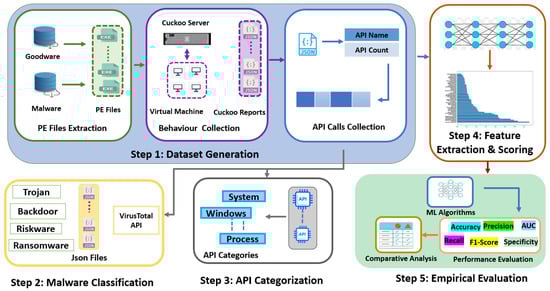
Figure 1.
Adopted research methodology.
3.1. Data Collection, Dynamic Analysis, and Dataset Generation
3.1.1. Data Collection
The first stage of the adopted methodology involved meticulous selection of PE files, drawing from two distinct sources to ensure a balanced dataset for dynamic malware analysis. The 1500 Windows PE malware files were collected from the MalwareBazaar repository [47] specifically focusing on samples from the year 2023. To complement this, 1000 goodware files from the GitHub repository [48] were gathered, aiming to create a balanced dataset that equally represented both malware and goodware. It is important to highlight that, to the best of our knowledge, the specific malware samples included in this study have not been dynamically analysed in previous research. This unique aspect of this research not only contributes to its novelty but also ensures that these findings and insights are based on fresh and unexplored data.
3.1.2. Cuckoo Sandbox Setup
The dynamic analysis component of this research is a critical aspect of the methodology, leveraging the capabilities of Cuckoo Sandbox [49] a renowned open-source tool for analysing malicious code. It provides an isolated environment using virtual machines to ensure that the malware does not affect the host system or network. Cuckoo Sandbox employs API hooks, which are instrumental in capturing the malware’s behaviour, providing insights into how it interacts with the system. Multiple virtual machines, with the usage of docker containers, were employed for this purpose. Each virtual machine ran a 64-bit Windows 10 system. A virtual machine snapshot was used to maintain the integrity of the analysis environment. After the execution of each PE file, the virtual machine was reverted to a clean state using these snapshots to ensure an uncontaminated environment. The execution of each Windows PE file resulted in the generation of a JSON file. These JSON files were comprehensive, detailing the behaviour of the malware during its execution. The study amassed a significant collection of these files, with 583 malware and 438 goodware JSON files. The selection criteria were based on the presence of imported functions, API calls, or both within these files. This process led to a curated dataset comprising 1021 JSON files to facilitate a comprehensive analysis.
3.1.3. Dataset Generation
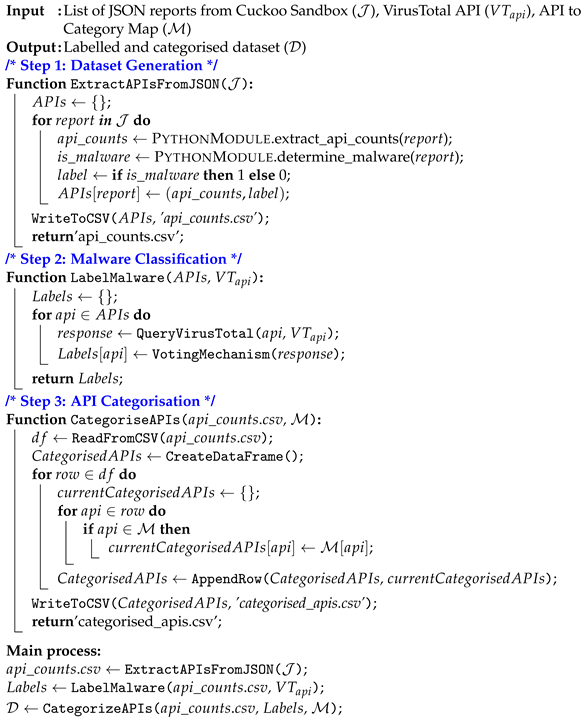
This phase involved filtering out irrelevant data from the Cuckoo JSON reports for dataset generation. To facilitate this, a Python json and os libraries (Table A1) were employed to sift through the JSON data by extracting API calls and their respective counts. API calls are crucial indicators of how malware interacts with a system, and their frequency can provide insights into the nature and intent of the malware. The next step was to transform these curated data into the Comma Separated Values (CSV) format, which is more accessible and amenable to analysis. For this purpose, the Python pandas library as referred in Table A1 was employed to convert the JSON data into a CSV format. The resulting dataset, as shown in Table 1, was structured with rows representing individual malware samples and columns representing different API calls. Each cell within this table provides the frequency of triggers for the corresponding API calls in a specific malware sample. This structure allows for a clear and comprehensive representation of the data, where each row offers a complete profile of a malware sample in terms of its API calls. Step:1 in Algorithm 1 describes the function (ExtractAPIsFromJSON ()), which processes a collection of Cuckoo JSON reports (), extracts API call counts from each report, assigns 1 for malware and 0 for goodware, and stores this information in a CSV file.

Table 1.
Dataset representation.
3.2. Malware Family Classification
In the second phase, we leveraged the capabilities of VirusTotal, a widely recognised online service that provides malware analysis through an extensive network of over 70 antivirus engines [50]. The VirusTotal API [51] was utilised using Python request library referred in Table A1, which facilitates the submission of SHA256 hashes and responds with a JSON object containing the analysis results from various antivirus application engines. This response is pivotal in determining the family names of each malware sample. The voting mechanism was employed to ascertain the most commonly identified family name for each sample. This mechanism involves aggregating the family names provided by the majority of the antivirus engines and assigning the most frequently occurring name to each malware sample. The use of this voting mechanism ensures more accurate and consensus-based malware family classification, thereby enhancing the reliability of our dataset for subsequent research. The results of this voting mechanism were compiled and stored in a CSV file. Step:2 in Algorithm 1 describes the function (LabelMalware (, )), which undertakes malware family classification on a set of APIs by querying the VirusTotal API (). For each API, the responses are collected using the function QueryVirusTotal (, ) and the classification outcome determined through the VotingMechanism function. It ultimately returns a dictionary of labels () representing the malware families.
3.3. API Categorisation
At this stage, the focus shifted towards categorising APIs based on the specific families they belonged to. This categorisation is essential for gaining granular insights into the roles these APIs play in malicious code execution. To facilitate this categorisation, a dedicated Python module was developed to rigorously analyse the APIs and assign them to their respective categories. By understanding which categories of APIs are most commonly used in malicious code, researchers and analysts can gain a deeper understanding of the techniques employed by malicious actors. Furthermore, it makes it possible to tailor security measures that are more responsive to these specific types of API calls. Step:3 in Algorithm 1 provides an overview of the function (CategoriseAPIs (, )), which categorises API call data stored in a CSV file (api_counts.csv) based on a provided mapping () of APIs to categories. It reads the CSV data, iterates through each row, identifies relevant APIs present in the mapping, and creates a categorised dataset. The resulting dataset is written to a new CSV file (categorised_apis.csv), and the function returns the path to this categorized dataset file.
| Algorithm 1: Algorithm for generating labelled and categorised malware dataset |
 |
3.4. Feature Selection and Scoring
In this section, the specifics of both the Chi-Square and Gini Index methodologies are discussed. The use of both Chi2 and the Gini Index serves a dual function of feature selection and scoring. This approach is crucial in pinpointing the key features that play a significant role in the detection of malicious activities.
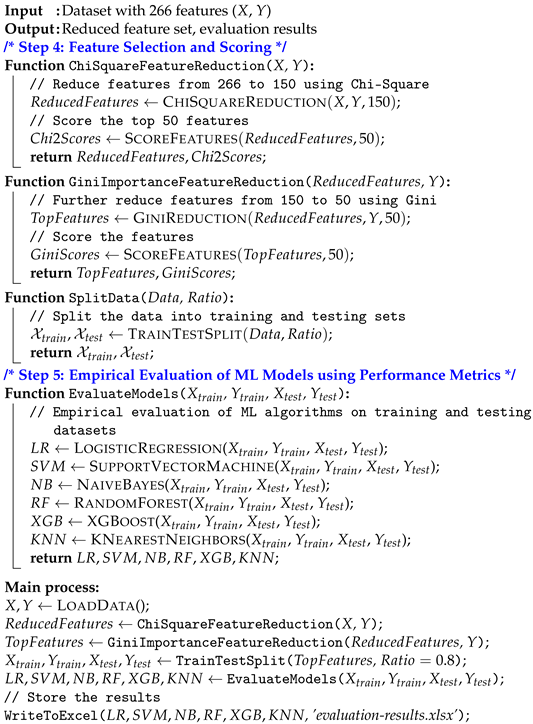
In the initial stage, the Chi2 algorithm was applied to evaluate the independence between each feature and the target variable. This further narrowed down the feature selection process, resulting in a reduced set of 105 features from the initial 266. Furthermore, feature scoring was utilised, focusing on pinpointing the most critical features for detecting malicious activity. The function (ChiSquareFeatureReduction (X, Y)) in Step:4 of Algorithm 2 provides an overview of the feature set (X) reduction, retaining the most informative features (ReducedFeatures), and computes Chi2Scores for the top 50 features, returning both for further analysis.
Equation (1) illustrates how the Chi2 statistic () measures the discrepancy between observed and expected frequencies in a feature set. It calculates the squared differences between observed () and expected () frequencies for each feature. The expected frequencies are derived assuming independence between variables. The sum (∑) indicates that the calculations are performed for each feature, from to , of these squared differences divided by the expected frequencies (), providing a measure of overall discrepancy from the expected distribution.
In the second stage, the Gini Importance was applied to assess feature importance. Features were ranked according to their Gini Importance values, enabling the identification of a subset of the most influential features. Consequently, the feature count decreased from the original 266 to 50, streamlining the analysis for greater focus and efficiency. The function GiniImportance (GiniImportance (, Y)) explains the further reduction in the feature set () from 150 to the top 50 features using the Gini importance criterion. It also calculates GiniScores for these features and returns them along with the TopFeatures set.
Equation (2) shows the utilisation of the Gini Importance (GI) metric for a feature “f”. The GI is obtained by summing the Gini Gain (GG) across all trees in the ensemble, measuring the improvement in Gini impurity achieved by splitting on “f” in a particular tree. The dataset, which included extracted features, underwent division into training and testing sets, with 80% of the data allocated for training the models and the remaining 20% reserved for evaluating their performance by using Python’s Scikit-Learn library as illustrated in Table A1. This division is illustrated by the function SplitData (SplitData (, )), which splits the input dataset () into training and testing sets with the specified ratio (). It returns the training and testing sets as and , respectively, for use in machine learning model training and evaluation.
3.5. Implemented SOTA Baseline ML Models
In the evaluation of the newly curated dataset, six baseline ML models were utilised to assess their correctness. These models were Logistic Regression (LR), Random Forest (RF), Support Vector Machine (SVM), Naive Bayes (NB), XGBoost (XGB), and K-Nearest Neighbour (KNN). Each of these models offers a unique approach to classification and prediction, making them suitable for a comprehensive analysis of the dataset’s accuracy and reliability. The diversity of these models ensured a thorough evaluation, covering various aspects of ML from simple linear approaches to more complex ensemble-based methods.
Logistic Regression was used to create a decision boundary to separate malware and goodware based on input features. Equation (3) illustrates the formula, where are the model coefficients, and e is the base of the natural logarithm.
Random Forest was used to build multiple decision trees and combine their predictions to classify input (Equation (4)), where N is the number of trees, and is the prediction of the i-th decision tree.
Support Vector Machine was used to create a hyperplane to classify a given program as malicious or benign (Equation (5)), where is the bias and is the weight vector.
Naive Bayes was used to calculate the probabilities for each feature belonging to malware or goodware to predict a given input. Equation (6) calculates probabilities using Bayes’ theorem, where is the posterior probability, is the likelihood, is the class prior probability, and is the predictor prior probability.
XGBoost is a gradient-boosting algorithm used for classification and regression tasks, known for its high performance and scalability. In Equation (7), L is the loss function, y is the true label, and is the predicted label.
K-Nearest Neighbour is a lazy learning algorithm used for classification and regression, where predictions are based on the majority vote of the nearest neighbours in the training data. Equation (8) represents the formula, where k is the number of nearest neighbours and are the labels of the k nearest neighbours.
3.6. Performance Evaluation
Accuracy (A) is a common evaluation metric used to measure the performance of a classification model. It represents the percentage of correctly classified instances out of the total number of instances in the dataset.
Precision (P) is used to measure how often the model is correct when it predicts the positive classes.
Recall (R) is used to measure how well the model can detect positive samples and is useful for evaluating models that need to avoid false negatives.
F1-score (F1) is used to balance precision and recall, indicating the model’s overall performance. A high F1-score indicates that the model is good at avoiding both false positives and false negatives.
Area under the curve (AUC) is used to measure the ability of a binary classification model to distinguish between positive and negative samples.
Specificity (S) is an evaluation metric used to measure the ability of a classification model to correctly identify negative instances or the true-negative rate.
Step:5 in Algorithm 2 explains the function EvaluateModels (, , , ), which conducts an empirical evaluation of machine learning algorithms on training and testing datasets. It trains and evaluates six different models ((), (), (), (), (), and ()) using the provided training (, ) and testing (, ) data.
| Algorithm 2: Feature selection, scoring, and empirical evaluation of ML |
 |
4. Results and Discussion
This section systematically presents the findings of the conducted research, highlighting key results in malware classification, API categorisation, feature scoring, and the evaluation of the utilised ML models. The research outcomes are discussed in detail, providing a comprehensive overview of the significant discoveries.
4.1. Experimental Setup
Table 2 presents the system and software specifications (experimental setup) used for evaluation. The research environment also included the usage of VirtualBox 7.0 for virtualization, Docker version 23.0.3 for containerization, Cuckoo Sandbox version 2.0.7 for dynamic analysis, and the Virustotal API (v3) for malware family classification.
Table 2.
Experimental setup.
4.2. Malware Family Classification
Malware classification encompassed 11 distinct families, each assigned labels and corresponding distribution percentages. This is crucial for understanding the diverse nature of malware and its prevalence. Each of these categories is represented in Table 3, providing an overview of the malware families as observed in this dataset.
Table 3.
Malware family classification.
The analysis of malware families provides crucial insights for tailoring cyber-security measures to combat specific threats effectively. The high prevalence of Trojans (27%) suggests a need for enhanced vigilance in software verification processes, as Trojans often masquerade as legitimate applications. The prevalence of ransomware (22%) emphasises the importance of robust backup systems and advanced encryption detection tools. Regular backups can mitigate the impact of data encryption by ransomware, while specialised algorithms can help in the early detection and prevention of ransomware attacks. Downloaders and droppers, each at 11%, highlight the necessity for advanced network monitoring and endpoint security solutions. These types of malware often initiate the downloading and installation of additional malicious software, making it crucial to detect and block them at the earliest stages. The presence of generic malware, also at 11%, highlights the need for versatile and adaptive malware detection systems capable of identifying and responding to a wide range of malicious behaviours that may not fit into specific categories. Backdoors and stealers, each constituting 5%, call for enhanced network security and data protection measures. Backdoors require robust system integrity checks to prevent unauthorised access, while stealers necessitate strong encryption and privacy safeguards to protect sensitive information. Spyware, at 4%, and adware, at 3%, highlight the importance of privacy protection and user consent mechanisms. Effective adware-blocker algorithms can help mitigate the risks associated with these types of malware. Rootkits and worms, each making up 1% of the dataset, demand specialised detection algorithms that use deep system scans to uncover hidden malware, and Worms necessitate network security measures to prevent their spread across systems and networks. These findings emphasise the need for a multi-faceted and proactive approach to cyber security, with tailored strategies to address the unique challenges posed by each malware family.
4.3. API Categorisation
This section discusses the results of the overall categorisation of 266 APIs and gives a detailed overview of the top 50 APIs deemed significant by the feature selection models, Chi2 and Gini. The analysis offers a comprehensive overview of these crucial APIs, determining their roles and importance in the context of malware behaviours and their operational patterns.
4.3.1. Overall API Categorisation
Table 4 provides details on the breakdown of 266 API calls in the context of malware analysis, categorising them into 23 distinct categories. This detailed categorising offers valuable insights into how various API categories are leveraged by malware. It not only allows the derivation of significant conclusions but also enhances the understanding of malware behaviour.
Table 4.
Overall categorisation of 266 APIs with % score.
The significance of Windows APIs in detecting malicious activities is evident from their extensive use by malware, as highlighted in our findings. Approximately 22% of the analysed malware samples interact with Windows operating systems through these APIs, often for system manipulation and exploiting vulnerabilities. This high usage indicates that monitoring Windows API calls can be a critical strategy in identifying and mitigating malware threats. The prevalence of file system (12%) and registry manipulation (8.2%) APIs highlights the malware’s tendency to modify files and system registries. This behaviour is typically aimed at establishing persistence and concealing the malware’s presence, making these APIs crucial targets for monitoring. The security and identity category (10%) reveals that a significant portion of malware focuses on bypassing security measures. This finding suggests the need for enhanced security protocols and vigilant monitoring of these APIs to prevent unauthorised access and identity theft. The socket category (8%) highlights the malware’s focus on establishing network connections for communication or data transfer. It shows the importance of monitoring network activities to detect and thwart malware that relies on network sockets for malicious operations. The Internet category (8%) reflects the malware’s engagement in online activities, possibly for data exfiltration, command and control communication, or downloading additional payloads. Vigilant monitoring of these APIs can be instrumental in identifying and mitigating these threats. The kernel category (5%) is indicative of the malware’s attempts to access and manipulate core system functions. This level of interaction suggests a sophisticated approach to control system operations at a fundamental level, making these APIs critical points for monitoring to prevent deep system intrusions. The threading category (5%) indicates that malware often employs multithreading techniques to evade detection and enhance efficiency. This insight can guide the development of more sophisticated detection mechanisms that can identify and counteract such evasive tactics. The error handling category (3%) demonstrates the malware’s capability to manage errors effectively, indicating a level of sophistication in maintaining operational stability while avoiding detection. This aspect highlights the need for advanced analytical tools capable of discerning such subtle operational patterns. The data access and storage category (3%) reflects the malware’s operations related to data manipulation and storage, often for harmful purposes like data exfiltration or encryption. Monitoring these APIs can help in the early detection of data breaches and unauthorised encryption activities. The other categories, like menu and resources (3.3%), developer (2.2%), COM/OLE/DDE (2%), networking (1%), shell (1%), process (1%), input/output (1%), remote procedure call (0.4%), and DNS (0.4%), each contribute to the malware’s diverse functionalities. These include propagation, evasion, orchestrating distributed attacks, and maintaining persistence. This detailed analysis of Windows APIs and their categorisation offers valuable insights into malware behaviour. This knowledge can improve cyber-security measures by helping to develop more effective detection and mitigation strategies against evolving threats employed by malware.
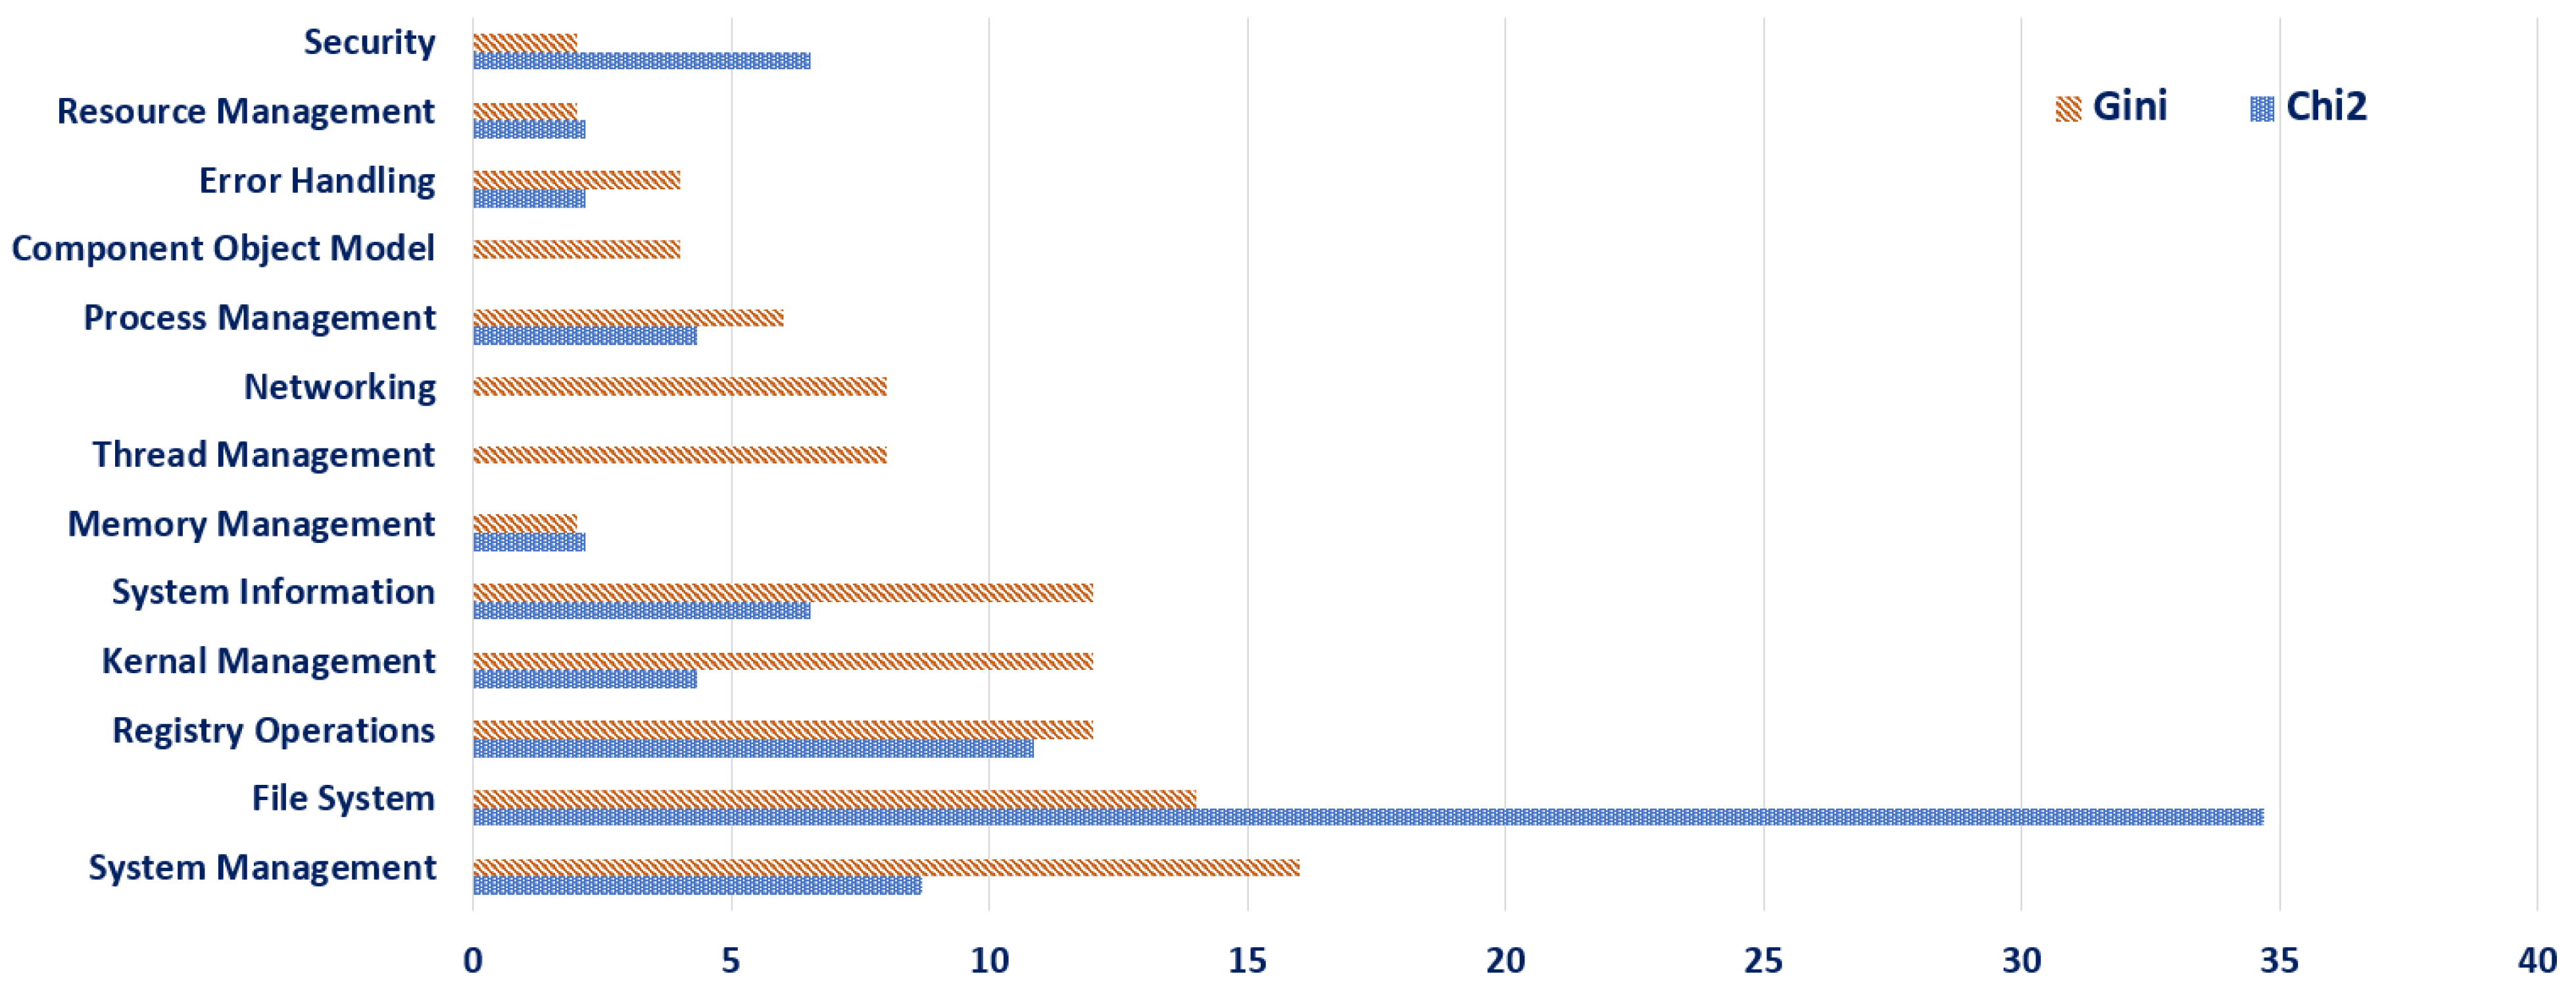
4.3.2. Top 50 API Categories According to Chi2 and Gini
The analysis of Windows API preferences and prioritisation using the Chi2 and Gini methods, as depicted in Figure 2, offers significant insights into the detection of malicious activities and contributes to the understanding of cyber threats. The Chi2 method focuses on internal system aspects, particularly security and file system interactions, with no consideration for thread management, networking, and component object model APIs, indicating their perceived importance in malware detection. This method’s emphasis on these specific areas suggests a strategic concentration on internal system vulnerabilities and manipulations commonly exploited by malware. On the other hand, the Gini method presents a more balanced and comprehensive perspective, encompassing a broader range of API categories. This method’s allocation across system management, registry operations, kernel management, system information, thread management, networking, process management, and error handling indicates its recognition of the multifaceted nature of malware. By considering both internal system processes and external communications, the Gini method acknowledges the diverse tactics employed by malware, from system infiltration to network-based activities. The distinct approaches of these two methods in prioritising Windows APIs underscore the complexity of malware detection. The Chi2 method’s focused approach is beneficial for honing in on specific system vulnerabilities, while the Gini method’s comprehensive coverage aids in recognising a wider array of malicious behaviours. Together, these results contribute significantly to cyber-security efforts by providing a nuanced understanding of how different aspects of Windows APIs are exploited by malware, thereby informing more targeted and effective defensive strategies against evolving cyber threats.

Figure 2.
Top 50 API categories according to Chi2 and Gini.
4.4. Feature Scoring
Table 5 provides an insightful comparison of the top 10 features obtained by the Chi2 and Gini selection models and their relevance in malware detection. Each API, based on its scoring and categorisation, plays a unique role in identifying and classifying malware behaviour. In the comparison, NtAllocateVirtualMemory and NtProtectVirtualMemory emerge as key APIs, with Chi2 assigning them scores of 10.18% and 9.70% and Gini assigning 6.81% and 7.86%, respectively, indicating their significant role in kernel management. Involvement in memory allocation and protection is a common characteristic of advanced malware, which often manipulates memory to execute malicious code or evade detection. Their high relevance in both models shows their critical role in identifying malware that interacts with system memory. LdrGetProcedureAddress and NtFreeVirtualMemory, categorised under system and kernel management, respectively, show notable differences in their Chi2 and Gini scores, reflecting their varied impact in these specific categories. This disparity indicates their varying impact on malware operations, such as loading procedures and freeing memory resources, which are essential for understanding malware’s interaction with a system’s core processes. Other APIs, such as FindResourceExA, NtClose, and GetSystemTimeAsFileTime, despite having lower Gini scores, are still significant in their respective categories of resource, kernel, and system information management. They are involved in resource location, system resource management, and time-based operations, respectively. Their inclusion, even with lower scores, highlights their role in specific malware activities, such as resource exploitation and time manipulation. The lowest-scoring features, NtDelayExecution and NtDeviceIoControlFile, categorised under system and file system management, were still recognised within the Chi2’s and Gini’s top 50 rankings, highlighting their relevance in these specific API categories. NtDelayExecution is involved in delaying execution, a tactic used by malware to avoid detection during analysis, while NtDeviceIoControlFile deals with device I/O operations, which can be critical in understanding malware’s interaction with hardware components. The strategic selection and scoring of these APIs contribute significantly to the effectiveness of malware classification systems. By understanding the specific roles and impacts of these APIs, malware detection systems can be tailored to recognise and respond to a wide range of malicious activities.
Table 5.
Top 10 selected features, Chi2 and Gini importance percentage scores, and API categories.
4.5. Evaluation of Machine Learning Models
This section discusses the evaluation of six ML models employed in this research, focusing on performance metrics, as illustrated in Table 6.
Table 6.
ML Models and performance evaluation metrics.
4.5.1. Performance Evaluation
Based on the evaluation presented in Table 6, the performance of different ML models was evaluated. The results of each implemented model are discussed as follows: The LR model exhibited a strong overall performance, with a relatively low accuracy of 0.88 and F1-score of 0.92 as compared to RF and XGB. It maintained an excellent balance between precision (0.92) and recall (0.92), with a respectable AUC of 0.93 and good specificity at 0.80. SVM showed decent accuracy at 0.72 but fell short in terms of its F1-score of 0.67, indicating potential challenges in balancing precision (0.98) and recall (0.51). The AUC was reasonable at 0.88, while specificity was notably high at 0.98. NB performed reasonably well, with an accuracy of 0.84 and an F1-score of 0.83. It exhibited good precision of 0.96 but a slightly lower recall of 0.73, with the AUC standing at 0.84; specificity was solid at 0.96. RF outperformed the other implemented models with the highest accuracy of 0.96 and demonstrated impressive results across other metrics, achieving a high F1-score of 0.96, indicating a well-balanced trade-off between precision (0.99) and recall (0.93). Additionally, it boasted a substantial AUC (0.98) and maintained a noteworthy specificity of 0.96. XGB also demonstrated excellent performance in terms of classification accuracy (0.93), with an F1-score of 0.96. This indicated its ability to achieve a balance between precision and recall of 0.96. Additionally, XGB showcased strong discriminatory power, as evidenced by its AUC of 0.97 and specificity of 0.95. KNN exhibited a decent accuracy of 0.92 and an F1-score of 0.91. It provided a reasonable balance between a precision of 0.97 and a recall of 0.87. The AUC was 0.93, and the specificity was 0.89.
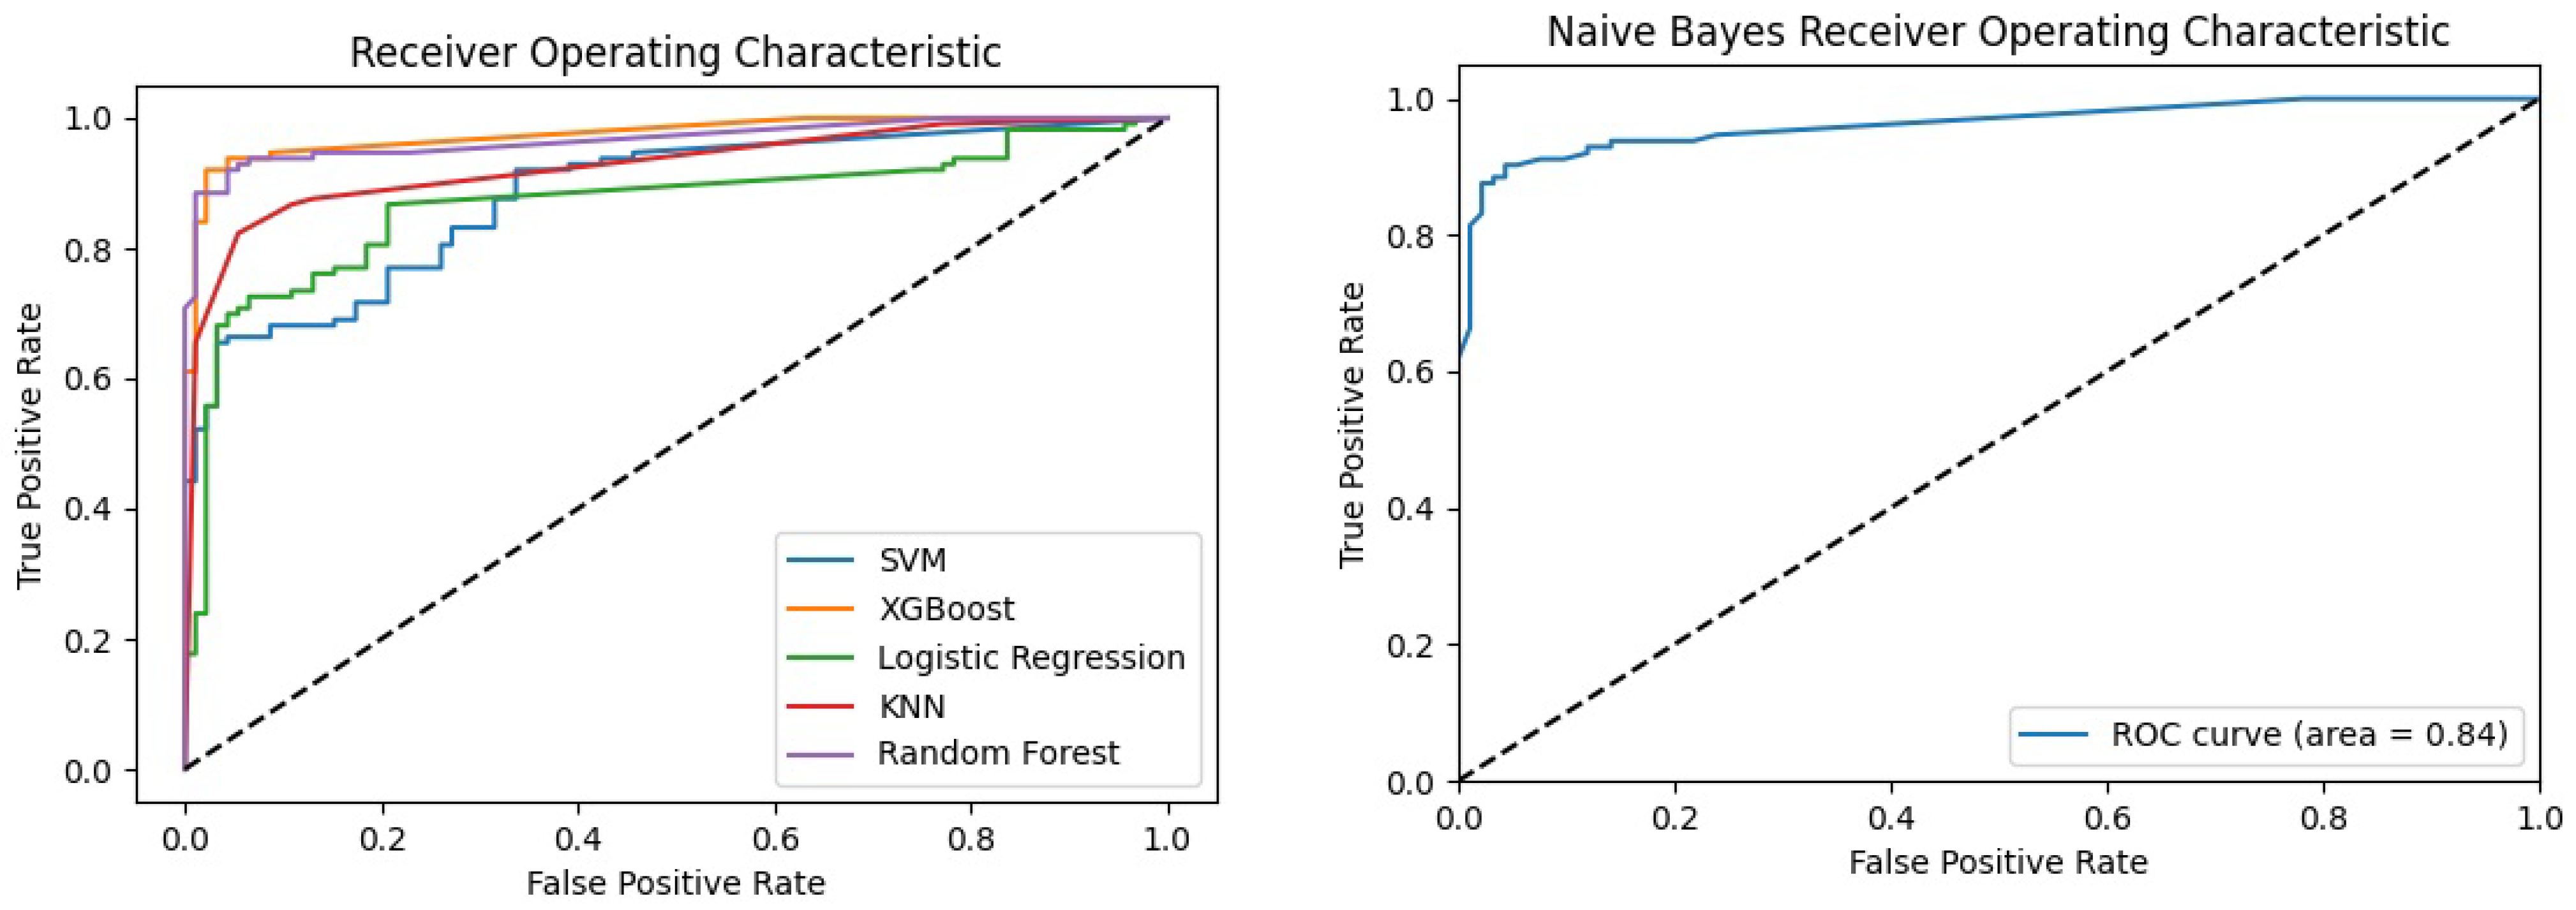
4.5.2. Receiver Operating Characteristic (ROC)
The ROC curves (Figure 3) depict the performance of various ML models in distinguishing between malware and goodware samples generated by Python matplotlib Table A1 libraries. It is important to note that the NB follows a slightly different approach compared to the other models, as it does not have a predict_proba method available in the Python Scikit-Learn library as illustrated in Table A1. To adapt to this distinction, the prediction method for the Naive Bayes classifier was employed. This resulted in two ROC curves, as shown in Figure 3, one dedicated to the Naive Bayes classifier and the other representing the remaining ML models. Examining the ROC curves reveals that the RF and XGB models performed exceptionally well. This indicates their effectiveness in achieving high true-positive rates while maintaining low false-positive rates. The KNN model also demonstrated a favourable ROC curve, indicating strong discriminatory power. On the other hand, the LR, SVM, and NB models showed relatively lower ROC curves compared to RF, XGB, and KNN. This implies a relatively lower ability to accurately classify instances from both classes.
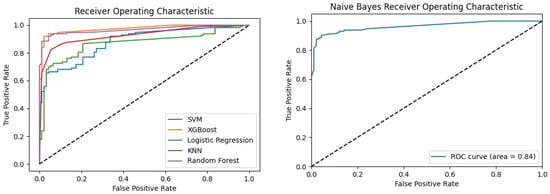
Figure 3.
Receiver operating characteristic (ROC) curves for ML models.
4.5.3. Confusion Matrix and Error Analysis
Table 7 elaborates on the performance of the ML models used in this study. These confusion matrices provide a comprehensive breakdown of how each utilised model performed in classifying instances correctly and incorrectly.
Table 7.
ML models and performance evaluation metrics.
The error analysis focused on analysing misclassifications and identifying common patterns in malware classification. LR and SVM showed 3 false positives and 13 false negatives. They appeared to struggle more with the negative class, resulting in lower precision for the positive class. Nevertheless, both maintained a relatively high recall for the positive class, indicating their ability to capture true malware instances. NB showed four false positives and eight false negatives, indicating higher precision but lower recall for the positive class, as it tended to classify fewer instances as positive when they were actually positive. However, RF and XGB demonstrated strong performance. RF had only one false positive and seven false negatives, whereas XGB, with only two false positives and seven false negatives, displayed good precision and recall for both classes, indicating a balanced performance. Both models excelled in minimising false positives while effectively capturing true positives. KNN, on the other hand, had 4 false positives and 23 false negatives, which demonstrates reasonable precision and lower recall for both classes. KNN had a slightly higher false-negative rate, implying that it sometimes misses true malware instances. Among these models, XGB and RF demonstrated the highest overall performance. They achieved remarkable accuracy, precision, and recall for both malware and goodware samples, outperforming other models.
5. Comparative Analysis with Existing Approaches
This section provides a comparative analysis using related existing studies to highlight the distinguishing contribution of this research. The comparison is based on the utilisation of API calls, feature selections, scoring methods, and implemented ML techniques. An overview of these studies follows.
Feature Selection and Scoring:Table 8 evidences that the studies by Yazi et al. [14], Pektacs et al. [20], Eskandari et al. [41], Catak et al. [52], and Daeef et al. [27] primarily focused on feature selection methods, such as feature vectors and N-grams, and they did not emphasise feature scoring. Most of these studies also incorporated malware labelling, while Pektacs et al. [20] additionally integrated API categorisation. However, our research distinctly incorporated both Chi2 and Gini Importance for effective reduction in feature space and stands out for its inclusion of feature scoring. This approach, combined with the integration of API categorisation and malware labelling, marks it as more comprehensive in its methodology compared to the others in malware detection and classification.
Table 8.
Research comparison in terms of feature selection, feature scoring, API categorisation, and malware labelling.
Enhanced F1-Score: As illustrated in Table 9, although Pektacs et al. [20] and Eskandari et al. [41] achieved impressive accuracy scores of 98%, our research went a step further by improving the F1-score by 2%. This improvement is significant as it indicates a better balance between recall and precision in the implemented models. The enhanced F1-score demonstrates our model’s ability to accurately classify malware without compromising either the recall or precision, which is crucial for the reliability of malware detection systems.
Table 9.
Research comparison in terms of machine learning models and the use of performance metrics.
Comprehensive Model Evaluation: Table 9 highlights the fact that our study also considered both the area under the curve (AUC) and specificity metrics for each ML model used. These metrics are vital for a thorough evaluation of a model’s performance, providing a more rounded assessment of its effectiveness in malware classification. The inclusion of AUC and specificity offers a deeper understanding of the model’s true-positive versus false-positive rates, which is an aspect not covered in the other compared studies. The combination of detailed feature scoring, improved F1-scores, and the inclusion of comprehensive evaluation metrics like AUC and specificity positions our research as a more balanced and holistic approach to malware classification. By addressing the limitations found in previous studies and introducing these comprehensive methods, this paper enhances the reliability and depth of malware analysis.
6. Limitations and Future Directions
The limitations and the future directions for the proposed work are as follows:
- In the current study, the malware samples were limited. It relied on samples from MalwareBazaar and GitHub, but including malware from varied sources and of various types, especially advanced and emerging strains, would enhance the model’s robustness and adaptability. Therefore, the dataset’s diversity could be expanded.
- The current methodology focused on dynamic analysis for capturing malware behaviour in an execution environment, and it might have missed static properties that are crucial for a comprehensive malware profile. Therefore, comparing the current API dataset with other available API-based datasets could improve its relevance and effectiveness.
- While the research successfully implemented traditional (baseline) ML models, there is an opportunity to explore more advanced neural network architectures. These advanced models could potentially offer a deeper understanding and more accurate detection of complex malware behaviours that traditional models might miss.
- In future extensions of this work, a hybrid analytical approach could be implemented by using a variety of Neural Networks [53], such as Convolutional Neural Networks (CNNs), Recurrent Neural Networks (RNNs), and Long Short-Term Memory (LSTM) networks, with the inclusion of diverse big datasets. This expansion would improve the robustness and adaptability of the models to new and sophisticated malware threats. The hybrid strategy would focus on both static and dynamic malware attributes and behaviours. It would also provide a more holistic view of malware, capturing both its behavioural patterns during execution and its inherent static properties.
- Furthermore, the utilisation of CNNs for their exceptional pattern recognition capabilities and RNNs and LSTMs for analysing sequential data makes them ideal for identifying complex malware signatures and their evolution over a period. This multifaceted approach would aim to enhance the precision of malware detection and develop defence mechanisms that are both robust and adaptable to the constantly evolving nature of cyber threats.
7. Conclusions
In today’s digital age, the threat of malware is ever-present and constantly on the rise. It can wreak havoc on computer systems, compromising personal and sensitive information. Therefore, it is crucial to take necessary precautions to protect assets against such threats. This paper tackled the significant challenge of malware threats through the generation of a novel dataset from the MalwareBazaar repository. The curated dataset included 582 malware and 438 goodware samples from Windows PE files, which served as a foundation for our dynamic analysis and classification framework. For evaluation, a comprehensive five-stage approach was adopted: generating a tailored dataset, labelling malware samples, categorising APIs, extracting and scoring pivotal features using Chi2 and Gini Importance, and applying six cutting-edge ML models. The results highlighted that the RF model demonstrated superior performance, with an impressive precision rate of 99% and an accuracy of 96%. The RF model’s AUC stood at 98%, and it achieved an F1-score of 96%, indicating a highly effective balance between precision and recall. These results were further authenticated by a TPR of 0.93 and an exceptionally low FPR of 0.0098, marking it as the most reliable among the evaluated models. The study revealed that Trojans and ransomware, constituting 27% and 22%, respectively, were predominant among the 11 analysed malware families. This indicates that we need to adopt more sophisticated strategies for these malware. In API categorisation, Windows APIs (22%) and APIs related to the file system (12%) and registry manipulation (8.2%) showcased their importance in detecting malicious activity. The high API usage indicates the need for monitoring to develop targeted security solutions by tracking unauthorized or suspicious changes that can provide early warning signs of malware infection. Our research distinguished itself by adopting a dual approach for feature reduction and scoring, as well as by achieving an improved F1-score (2%) and including AUC and specificity metrics, aspects not comprehensively addressed in previous studies. The curated dataset is now publicly available for further research and lays a solid groundwork for future studies on malware evolution prediction.
Author Contributions
D.Z.S.: Conceptualisation, Data Curation, Validation, Experimentation, and Writing. M.N.A.: Editing, Reviewing, Validation, and Supervision. All authors have read and agreed to the published version of the manuscript.
Funding
This research is funded by the Hardiman PhD Scholarship 2023 in the School of Computer Science, University of Galway, Ireland.
Data Availability Statement
Publicly available dataset is accessible on GitHub https://github.com/drzehra14/Windows-PE-Malware-API-dataset/ (accessed on 9 March 2023). By providing access to this comprehensive collection of data, the goal is to facilitate a wide range of experiments, especially those new to the field of dynamic malware analysis. By offering a pre-processed and structured dataset, it eliminates the initial barriers associated with data collection and preparation. This initiative not only supports current research efforts but also encourages the development of innovative approaches through the performance of cross-dataset analysis to enhance the robustness of their findings. The dataset’s accessibility is expected to inspire new insights, foster collaboration, and contribute significantly to advancements in cyber-security research.
Acknowledgments
We would like to extend our sincere appreciation to the teams behind MalwareBazaar, Cuckoo Sandbox, and VirusTotal API for their invaluable contributions to our research. Their commitment to providing access to critical resources and services has been instrumental in the successful execution of our experiments. We acknowledge their dedication to advancing the field of cyber security and their role in enabling researchers to explore new horizons in malware analysis and classification.
Conflicts of Interest
The authors declare no conflict of interest.
Abbreviations
The following abbreviations are used in this manuscript:
| Abbreviations | Description |
| SVM | Support Vector Machine |
| LR | Logistic Regression |
| RF | Random Forest |
| NB | Naive Byes |
| XGB | XGBoost |
| KNN | K-Nearest Neighbour |
| AUC | area under the curve |
| TPR | true-positive rate |
| FPR | false-positive rate |
| TP | true positive |
| TN | true negative |
| FP | false positive |
| FN | false negative |
Appendix A
Table A1.
List of Python packages used.
Table A1.
List of Python packages used.
| Library | Description |
|---|---|
| Request | For making HTTP requests |
| Pandas | Data pre-processing and engineering |
| Numpy | Data pre-processing and engineering |
| Json | Retrieve information from servers or an API at public endpoint |
| Os | Interacting with the operating system |
| Sklearn | Training and cross-validation of ML models such as LR, SVM, NB, RF, XGB, and KNN |
| Seaborn | Data visualisation based on matplotlib |
| Matplotlib | Display of graphs and charts |
References
- Xhafa, F. Autonomous and Connected Heavy Vehicle Technology; Academic Press: Cambridge, MA, USA, 2022. [Google Scholar]
- Basyurt, A.S.; Fromm, J.; Kuehn, P.; Kaufhold, M.A.; Mirbabaie, M. Help Wanted—Challenges in Data Collection, Analysis and Communication of Cyber Threats in Security Operation Centers. In Proceedings of the 17th International Conference on Wirtschaftsinformatik 2022, Nuremberg, Germany, 21–23 February 2022. [Google Scholar]
- Gibert, D.; Mateu, C.; Planes, J. The rise of machine learning for detection and classification of malware: Research developments, trends and challenges. J. Netw. Comput. Appl. 2020, 153, 102526. [Google Scholar] [CrossRef]
- Global Ransomware Damage Costs. Available online: https://cybersecurityventures.com/global-ransomware-damage-costs-predicted-to-reach-250-billion-usd-by-2031/ (accessed on 12 June 2023).
- A.T. ATLAS Malware & PUA. 2022. Available online: https://portal.av-atlas.org/malware/ (accessed on 12 June 2023).
- Alcaraz, C.; Lopez, J. Digital twin: A comprehensive survey of security threats. IEEE Commun. Surv. Tutorials 2022, 24, 1475–1503. [Google Scholar] [CrossRef]
- Azshwanth, D.; Ponsam, J.G. A novel approach to detect malware in portable executables of major operating systems. In Proceedings of the 2022 International Conference on Innovative Computing, Intelligent Communication and Smart Electrical Systems (ICSES), Chennai, India, 15–16 July 2022; pp. 1–9. [Google Scholar]
- Li, S.; Jiang, L.; Zhang, Q.; Wang, Z.; Tian, Z.; Guizani, M. A malicious mining code detection method based on multi-features fusion. IEEE Trans. Netw. Sci. Eng. 2022, 10, 2731–2739. [Google Scholar] [CrossRef]
- Landage, J.; Wankhade, M. Malware and malware detection techniques: A survey. Int. J. Eng. Res. 2013, 2, 61–68. [Google Scholar]
- Čeponis, D.; Goranin, N. Evaluation of deep learning methods efficiency for malicious and benign system calls classification on the AWSCTD. Secur. Commun. Netw. 2019, 2019, 2317976. [Google Scholar] [CrossRef]
- Bahtiyar, Ş.; Yaman, M.B.; Altıniğne, C.Y. A multi-dimensional machine learning approach to predict advanced malware. Comput. Netw. 2019, 160, 118–129. [Google Scholar] [CrossRef]
- Kim, G.; Yi, H.; Lee, J.; Paek, Y.; Yoon, S. LSTM-based system-call language modeling and robust ensemble method for designing host-based intrusion detection systems. arXiv 2016, arXiv:1611.01726. [Google Scholar]
- Yazi, A.F.; Çatak, F.Ö.; Gül, E. Classification of methamorphic malware with deep learning (LSTM). In Proceedings of the 2019 27th Signal Processing and Communications Applications Conference (SIU), Sivas, Turkey, 24–26 April 2019; pp. 1–4. [Google Scholar]
- Catak, F.O.; Yazı, A.F. A benchmark API call dataset for windows PE malware classification. arXiv 2019, arXiv:1905.01999. [Google Scholar]
- Amer, E.; Zelinka, I. A dynamic Windows malware detection and prediction method based on contextual understanding of API call sequence. Comput. Secur. 2020, 92, 101760. [Google Scholar] [CrossRef]
- Zhao, Y.; Bo, B.; Feng, Y.; Xu, C.; Yu, B. A feature extraction method of hybrid gram for malicious behavior based on machine learning. Secur. Commun. Netw. 2019, 2019, 2674684. [Google Scholar] [CrossRef]
- Choi, C.; Esposito, C.; Lee, M.; Choi, J. Metamorphic malicious code behavior detection using probabilistic inference methods. Cogn. Syst. Res. 2019, 56, 142–150. [Google Scholar] [CrossRef]
- Tajoddin, A.; Jalili, S. HM 3 alD: Polymorphic Malware detection using program behavior-aware hidden Markov model. Appl. Sci. 2018, 8, 1044. [Google Scholar] [CrossRef]
- Lin, C.H.; Pao, H.K.; Liao, J.W. Efficient dynamic malware analysis using virtual time control mechanics. Comput. Secur. 2018, 73, 359–373. [Google Scholar] [CrossRef]
- Pektaş, A.; Acarman, T. Malware classification based on API calls and behaviour analysis. IET Inf. Secur. 2018, 12, 107–117. [Google Scholar] [CrossRef]
- Menahem, E.; Shabtai, A.; Rokach, L.; Elovici, Y. Improving malware detection by applying multi-inducer ensemble. Comput. Stat. Data Anal. 2009, 53, 1483–1494. [Google Scholar] [CrossRef]
- Qiao, Y.; Yang, Y.; He, J.; Tang, C.; Liu, Z. CBM: Free, automatic malware analysis framework using API call sequences. In Knowledge Engineering and Management: Proceedings of the Seventh International Conference on Intelligent Systems and Knowledge Engineering, Beijing, China, December 2012 (ISKE 2012); Springer: Berlin/Heidelberg, Germany, 2014; pp. 225–236. [Google Scholar]
- Sethi, K.; Chaudhary, S.K.; Tripathy, B.K.; Bera, P. A novel malware analysis framework for malware detection and classification using machine learning approach. In Proceedings of the 19th International Conference on Distributed Computing and Networking, Varanasi, India, 4–7 January 2018; pp. 1–4. [Google Scholar]
- Qiao, Y.; Yang, Y.; Ji, L.; He, J. Analyzing malware by abstracting the frequent itemsets in API call sequences. In Proceedings of the 2013 12th IEEE International Conference on Trust, Security and Privacy in Computing and Communications, Melbourne, VIC, Australia, 16–18 July 2013; pp. 265–270. [Google Scholar]
- Li, S.; Li, Y.; Wu, X.; Al Otaibi, S.; Tian, Z. Imbalanced Malware Family Classification Using Multimodal Fusion and Weight Self-Learning. IEEE Trans. Intell. Transp. Syst. 2022, 24, 7642–7652. [Google Scholar] [CrossRef]
- Hansen, S.S.; Larsen, T.M.T.; Stevanovic, M.; Pedersen, J.M. An approach for detection and family classification of malware based on behavioral analysis. In Proceedings of the 2016 International Conference on Computing, Networking and Communications (ICNC), Kauai, HI, USA, 15–18 February 2016; pp. 1–5. [Google Scholar]
- Daeef, A.Y.; Al-Naji, A.; Chahl, J. Features Engineering for Malware Family Classification Based API Call. Computers 2022, 11, 160. [Google Scholar] [CrossRef]
- Singh, J.; Singh, J. A survey on machine learning-based malware detection in executable files. J. Syst. Archit. 2021, 112, 101861. [Google Scholar] [CrossRef]
- Albishry, N.; AlGhamdi, R.; Almalawi, A.; Khan, A.I.; Kshirsagar, P.R.; BaruDebtera. An Attribute Extraction for Automated Malware Attack Classification and Detection Using Soft Computing Techniques. Comput. Intell. Neurosci. 2022, 2022, 5061059. [Google Scholar] [CrossRef]
- Vadrevu, P.; Rahbarinia, B.; Perdisci, R.; Li, K.; Antonakakis, M. Measuring and detecting malware downloads in live network traffic. In Proceedings of the Computer Security—ESORICS 2013: 18th European Symposium on Research in Computer Security, Egham, UK, 9–13 September 2013; Proceedings 18. Springer: Berlin/Heidelberg, Germany, 2013; pp. 556–573. [Google Scholar]
- Mills, A.; Spyridopoulos, T.; Legg, P. Efficient and interpretable real-time malware detection using random-forest. In Proceedings of the 2019 International Conference on Cyber Situational Awareness, Data Analytics and Assessment (Cyber SA), Oxford, UK, 3–4 June 2019; pp. 1–8. [Google Scholar]
- Uppal, D.; Sinha, R.; Mehra, V.; Jain, V. Malware detection and classification based on extraction of API sequences. In Proceedings of the 2014 International Conference on Advances in Computing, Communications and Informatics (ICACCI), Delhi, India, 24–27 September 2014; pp. 2337–2342. [Google Scholar]
- Kwon, B.J.; Mondal, J.; Jang, J.; Bilge, L.; Dumitraş, T. The dropper effect: Insights into malware distribution with downloader graph analytics. In Proceedings of the 22nd ACM SIGSAC Conference on Computer and Communications Security, Denver, CO, USA, 12–16 October 2015; pp. 1118–1129. [Google Scholar]
- Mao, W.; Cai, Z.; Towsley, D.; Guan, X. Probabilistic inference on integrity for access behavior based malware detection. In Proceedings of the Research in Attacks, Intrusions, and Defenses: 18th International Symposium, RAID 2015, Kyoto, Japan, 2–4 November 2015; Proceedings 18; Springer: Berlin/Heidelberg, Germany, 2015; pp. 155–176. [Google Scholar]
- Wüchner, T.; Ochoa, M.; Pretschner, A. Robust and effective malware detection through quantitative data flow graph metrics. In Proceedings of the Detection of Intrusions and Malware, and Vulnerability Assessment: 12th International Conference, DIMVA 2015, Milan, Italy, 9–10 July 2015; Proceedings 12. Springer: Berlin/Heidelberg, Germany, 2015; pp. 98–118. [Google Scholar]
- Ahmadi, M.; Ulyanov, D.; Semenov, S.; Trofimov, M.; Giacinto, G. Novel feature extraction, selection and fusion for effective malware family classification. In Proceedings of the Sixth ACM Conference on Data and Application Security and Privacy, New Orleans, LO, USA, 9–11 March 2016; pp. 183–194. [Google Scholar]
- Zelinka, I.; Amer, E. An ensemble-based malware detection model using minimum feature set. Mendel 2019, 25, 1–10. [Google Scholar] [CrossRef]
- Dener, M.; Ok, G.; Orman, A. Malware detection using memory analysis data in big data environment. Appl. Sci. 2022, 12, 8604. [Google Scholar] [CrossRef]
- Azmee, A.; Choudhury, P.P.; Alam, M.A.; Dutta, O. Performance Analysis of Machine Learning Classifiers for Detecting PE Malware. Ph.D. Thesis, Brac University, Dhaka, Bangladesh, 2019. [Google Scholar]
- Li, C.; Zheng, J. API call-based malware classification using recurrent neural networks. J. Cyber Secur. Mobil. 2021, 10, 617–640. [Google Scholar] [CrossRef]
- Eskandari, M.; Khorshidpur, Z.; Hashemi, S. To incorporate sequential dynamic features in malware detection engines. In Proceedings of the 2012 European Intelligence and Security Informatics Conference, Odense, Denmark, 22–24 August 2012; pp. 46–52. [Google Scholar]
- Oliveira, A.; Sassi, R. Behavioral malware detection using deep graph convolutional neural networks. TechRxiv 2019. preprint. [Google Scholar] [CrossRef]
- Tang, M.; Qian, Q. Dynamic API call sequence visualisation for malware classification. IET Inf. Secur. 2019, 13, 367–377. [Google Scholar] [CrossRef]
- Fujino, A.; Murakami, J.; Mori, T. Discovering similar malware samples using API call topics. In Proceedings of the 2015 12th Annual IEEE Consumer Communications and Networking Conference (CCNC), Las Vegas, NV, USA, 9–12 January 2015; pp. 140–147. [Google Scholar]
- David, O.E.; Netanyahu, N.S. Deepsign: Deep learning for automatic malware signature generation and classification. In Proceedings of the 2015 International Joint Conference on Neural Networks (IJCNN), Killarney, Ireland, 12–17 July 2015; pp. 1–8. [Google Scholar]
- Salehi, Z.; Sami, A.; Ghiasi, M. MAAR: Robust features to detect malicious activity based on API calls, their arguments and return values. Eng. Appl. Artif. Intell. 2017, 59, 93–102. [Google Scholar] [CrossRef]
- Malwarebazar Dataset. Available online: https://bazaar.abuse.ch/ (accessed on 3 December 2023).
- Goodware Git Repository. Available online: https://github.com/iosifache/DikeDataset/tree/main/files/benign// (accessed on 20 April 2023).
- Cuckoo Sandbox. Available online: https://cuckoo.readthedocs.io/en/latest/ (accessed on 4 May 2023).
- Shiel, I.; O’Shaughnessy, S. Improving file-level fuzzy hashes for malware variant classification. Digit. Investig. 2019, 28, S88–S94. [Google Scholar] [CrossRef]
- VirusTotal API. Available online: https://www.virustotal.com/gui/home/upload (accessed on 27 March 2023).
- Catak, F.O.; Yazı, A.F.; Elezaj, O.; Ahmed, J. Deep learning based Sequential model for malware analysis using Windows exe API Calls. PeerJ Comput. Sci. 2020, 6, e285. [Google Scholar] [CrossRef]
- Tian, Z.; Luo, C.; Qiu, J.; Du, X.; Guizani, M. A distributed deep learning system for web attack detection on edge devices. IEEE Trans. Ind. Inform. 2019, 16, 1963–1971. [Google Scholar] [CrossRef]

Disclaimer/Publisher’s Note: The statements, opinions and data contained in all publications are solely those of the individual author(s) and contributor(s) and not of MDPI and/or the editor(s). MDPI and/or the editor(s) disclaim responsibility for any injury to people or property resulting from any ideas, methods, instructions or products referred to in the content. |
© 2024 by the authors. Licensee MDPI, Basel, Switzerland. This article is an open access article distributed under the terms and conditions of the Creative Commons Attribution (CC BY) license (https://creativecommons.org/licenses/by/4.0/).