Article

Parametric Analysis on Creep Deformation of Deep-Sea PMMA Observation Window

1
Shanghai Engineering Research Center of Hadal Science and Technology, College of Engineering Science and Technology, Shanghai Ocean University, Shanghai 201306, China
2
School of Marine Engineering, Jimei University, Xiamen 361021, China
3
Naval Architecture and Shipping College, Guangdong Ocean University, Zhanjiang 524088, China
*
Author to whom correspondence should be addressed.
Appl. Sci. 2024, 14(3), 1040; https://doi.org/10.3390/app14031040
Submission received: 13 November 2023 / Revised: 11 January 2024 / Accepted: 12 January 2024 / Published: 25 January 2024
(This article belongs to the Section Marine Science and Engineering)

Abstract

:
Observation windows are core components of the submersible manned cabins. The strength and stiffness of the observation window during the loading and load-sustaining process are crucial to ensure the safety of the equipment and personnel inside the manned cabin. It is extremely important to accurately calculate the structural creep performance of the observation window under a long-period sustaining load in seawater. In the present study, finite element analyses based on a temperature-dependent time-hardening creep model are conducted to investigate the performance of the observation window. The mesh convergence is studied first and the parametric analysis is accordingly carried out, taking different combinations of temperatures from 2~30 °C, different loading rates of 2.3 MPa/min, 4.5 MPa/min, 6 MPa/min, and 8 MPa/min, and different friction coefficients of 0.05, 0.1, 0.15, 0.2, 0.25, and 0.3 into account. The results show that the displacement in the y-axis direction of the center point of the lower surface of the viewport window increases with the increasing temperature and loading rate. On the contrary, the axial displacement of the observation window gradually decreases with the increase of the friction coefficient, and the axial displacement is the largest when the lowest friction coefficient is applied. This study aims to offer a more unified analysis and design methodology for the creep deformation of PMMA structures in underwater facilities.

1. Introduction

In recent years, there has been an increasing emphasis on exploring the deep sea, with a specific focus on the research involving manned submersibles as essential tools. The main elements of these manned cabins are pressure hulls made of either titanium alloy or steel, and they are equipped with transparent observation windows, as shown in Figure 1. In deep-sea environments, scientists rely on observation windows integrated into manned cabins for observing and controlling manipulators [1]. Three people can usually dive inside a manned submersible, hence at least three PMMA observation windows are needed. One of the pressure hull’s most susceptible parts is also the PMMA observation window. A failure of the observation window at greater depths can lead to intolerable pressure levels for humans. Consequently, the observation window constitutes a highly crucial component in the design of the pressure hull.
Observation windows come in various types, distinguished by their curvature and perimeter characteristics. Observation windows are designed using three fundamental structural forms: flat circle, conical table, and spherical fan shaped [2]. The flat circle represents the earliest form of observation windows utilized in submersibles. Its advantages include the ease of processing and installation, along with a low manufacturing cost. However, it comes with limitations such as a restricted horizon and the need for a substantial window seat, contributing to an increased pressure hull weight. The conical frustum serves as the primary structural design for the observation window in submersibles. The spherical fan-shaped design stands out as the most ideal form for withstanding external pressure in observation windows. Stachiw conducted thorough theoretical and experimental research focusing on the performance and design of observation windows. Comprehensive long-term hydrostatic pressure tests were executed on conical frustum observation windows with varying cone angles and different window diameter-thickness ratios. The results provided valuable insights into the critical pressure and axial displacement of conical frustum windows under different working conditions [3,4,5].
Polymethyl methacrylate (PMMA) is a commonly selected material for deep-sea viewport windows due to its exceptional material properties [6]. PMMA possesses excellent properties such as superb colorability and transparency. In particular, the observation windows made of transparent PMMA are specially crafted for underwater observation and are connected to the titanium hull using O-ring sealing equipment. In order to ensure safety, the prescribed procedure requires the observation window to be tested in the pressure cylinder before being put into use to validate its reliability.
PMMA demonstrates significant deformation under high-stress load conditions due to its relatively small elastic modulus. Furthermore, PMMA exhibits both elastic and viscous deformation characteristics. Creep is an inherent characteristic of polymers, and it can manifest even at room temperature [7,8]. Gao et al. [9] conducted creep tests under various stresses and temperatures, developing a UMAT (User Material Subroutine) program to simulate the creep behavior of PMMA. Adibeig et al. [10] investigated through both experimental and numerical methods at different temperatures (30 °C, 40 °C, and 50 °C) and stress levels. Furthermore, Khan et al. [11] investigated the non-monotonic creep behaviors exhibited by polymers. The aforementioned scholars conducted a series of creep tests and analyses using PMMA samples. However, the inherent creep issue in polymer observation windows represents a long-term damage mechanism. To ensure safety, observation windows must meet the necessary strength and stability requirements [12]. Therefore, it is crucial to study the behavior of observation windows under underwater pressure conditions.
The observation window for a manned submersible typically has a conical shape. In the case of deep-sea submersibles, either 90° conical-frustum windows or spherical windows can be employed. However, for practical manufacturing considerations, a 90° conical-frustum window is generally preferred. During the submersible’s service, the viscoelastic properties of the PMMA material may lead to the deformation of the viewport window over time, a phenomenon known as creep [13]. Hence, certain researchers have conducted stress analyses on frustum viewport windows, considering various thickness-to-diameter ratios and angles [14,15]. Yue and Tian [16,17] performed both theoretical and numerical calculations for various viewport conical angles, ranging from 60° to 120°. They suggested that the preferred included conical angle falls within the range of 80° to 120°. Wang [12] examined the fatigue behavior of PMMA windows and diving shells using the rain flow counting method and cumulative damage principle. In the high-pressure seawater environment, the space between the inner window and the window seat within the metal spherical hull undergoes compression as a result of increased displacement. Increased displacement could potentially lead to the complete destruction of the observation window. Given this scenario, multiple researchers have explored the displacement and stress in observation windows through the incorporation of theoretical calculation methods, parametric analysis, and experimental research [18,19,20]. However, the predominant method for the long-term analysis of PMMA windows is based on tensile tests, despite the fact that PMMA windows are predominantly subjected to complex compression states. Du et al. [21] applied the creep time hardening model for finite element parametric analysis on the viewport window, demonstrating the model’s suitability for PMMA windows. Nevertheless, this model does not take into account the influence of temperature. Wang et al. [22] investigated the impact of temperature and non-linearity on acrylic windows through finite element analysis and tests. In summary, there is still a lack of parametric analysis considering the temperature creep behavior of PMMA viewport windows. The aging theoretical model proposed by Chen et al. [23] accounts for the temperature factor, with model parameters derived from compression creep tests. In summary, there is still a need for a parametric analysis that takes into account the temperature-dependent creep behavior of PMMA observation windows.
The above research requires further refinement to yield more robust conclusions, as the creep behavior influenced by temperature effects on the window has not been comprehensively examined. In the present study, the commercial software ABAQUS 2022 was employed to build a finite element calculation model for the frustum observation window. Subsequently, improved creep model parameters were determined based on the fundamental properties of the PMMA material of the observation window. Furthermore, the agreement between the calculation results based on the creep model and the experimental data is analyzed and the simulation model is verified. Finally, the creep characteristics and structural properties of the observation window under various loading speeds, friction coefficients, temperature variations, and different loading levels are investigated. In the process of long-term deep-sea operations, the influence of creep on the displacement of the observation window becomes very significant, so the research on creep experiments and finite element simulations is very valuable to lay a foundation for further service life research on the observation window structure.

2. Material and Structure of Frustum Observation Window

2.1. Material

The selection of the observation window material is based on considerations such as strength, impact resistance, density, and transparency. PMMA is a classic viscoelastic material that exhibits the dual properties of both a viscous liquid and an elastic solid. This material exhibits noticeable creep characteristics which can keep the stress at a low level and do not result in significant stress concentrations. The mechanical characteristics of the PMMA frustum observation window under current investigation are summarized in Table 1.

2.2. Structure

Referring to the frustum observation window of the manned submersible designed according to ASME PVHO-1 [24], as illustrated in Figure 2, the inner diameter Di, the cone angle α , the thickness t, and the arc transition radius R processed at the lower part of the cone are, respectively, 130 mm, 90°, 153 mm, and 2000 mm. The model is installed on the window seat. The inner circle of the window seat is sealed with the low-pressure base to ensure the low-pressure state.

3. Temperature-Dependent Time-Hardening Creep Model

According to the time-hardening theory, the decrease of the creep rate during creep shows that the main factor of material hardening is time, which has nothing to do with creep deformation. When the temperature is constant, there is a certain relationship between stress, σ , the creep rate, ε c r , and time, t [25].
Φ ( ε ˙ c r , σ , t ) = 0
{ ε = f 1 ( σ ) f 2 ( t ) f 1 ( σ ) = σ n f 2 ( t ) = A m + 1 t m + 1
ε c r = A m + 1 σ n t m + 1
where f 1 ( σ ) is the stress function; n is the exponential parameter of the stress power function; f 2 ( t ) is the time response function; and A and m are the coefficients and exponential parameters of the time power function, respectively.
To consider the environmental temperature effect, a temperature-dependent time-hardening model has been proposed by the author as follows,
ε . cr = A σ n t m
ε c r = A σ n t m + 1 + C
ε . cr = ( a 1 T 3 + b 1 T 2 + c 1 T + k 1 σ + d 1 ) σ n t ( a 2 T 2 + b 2 T + k 2 σ + c 2 )
where ε ˙ c r is creep strain rate; σ is the uniaxial stress or equivalence stress in MPa; t is the total time in second; T is the temperature in °C; and a1, b1, c1, k1, d1, n, a2, b2, c2, and k2 are the material parameters.
Similar to Formula (5), Formula (7) is obtained by integrating the creep strain of Formula (6), where the integral constant C depends on the elastic strain before loading. The definitions of A1 and m1 are shown in Equation (7).
{ ε c r = A 1 σ n t m 1 + 1 + C A 1 = a 1 T 3 + b 1 T 2 + c 1 T + k 1 σ + d 1 m 1 = a 2 T 2 + b 2 T + k 2 σ + c 2
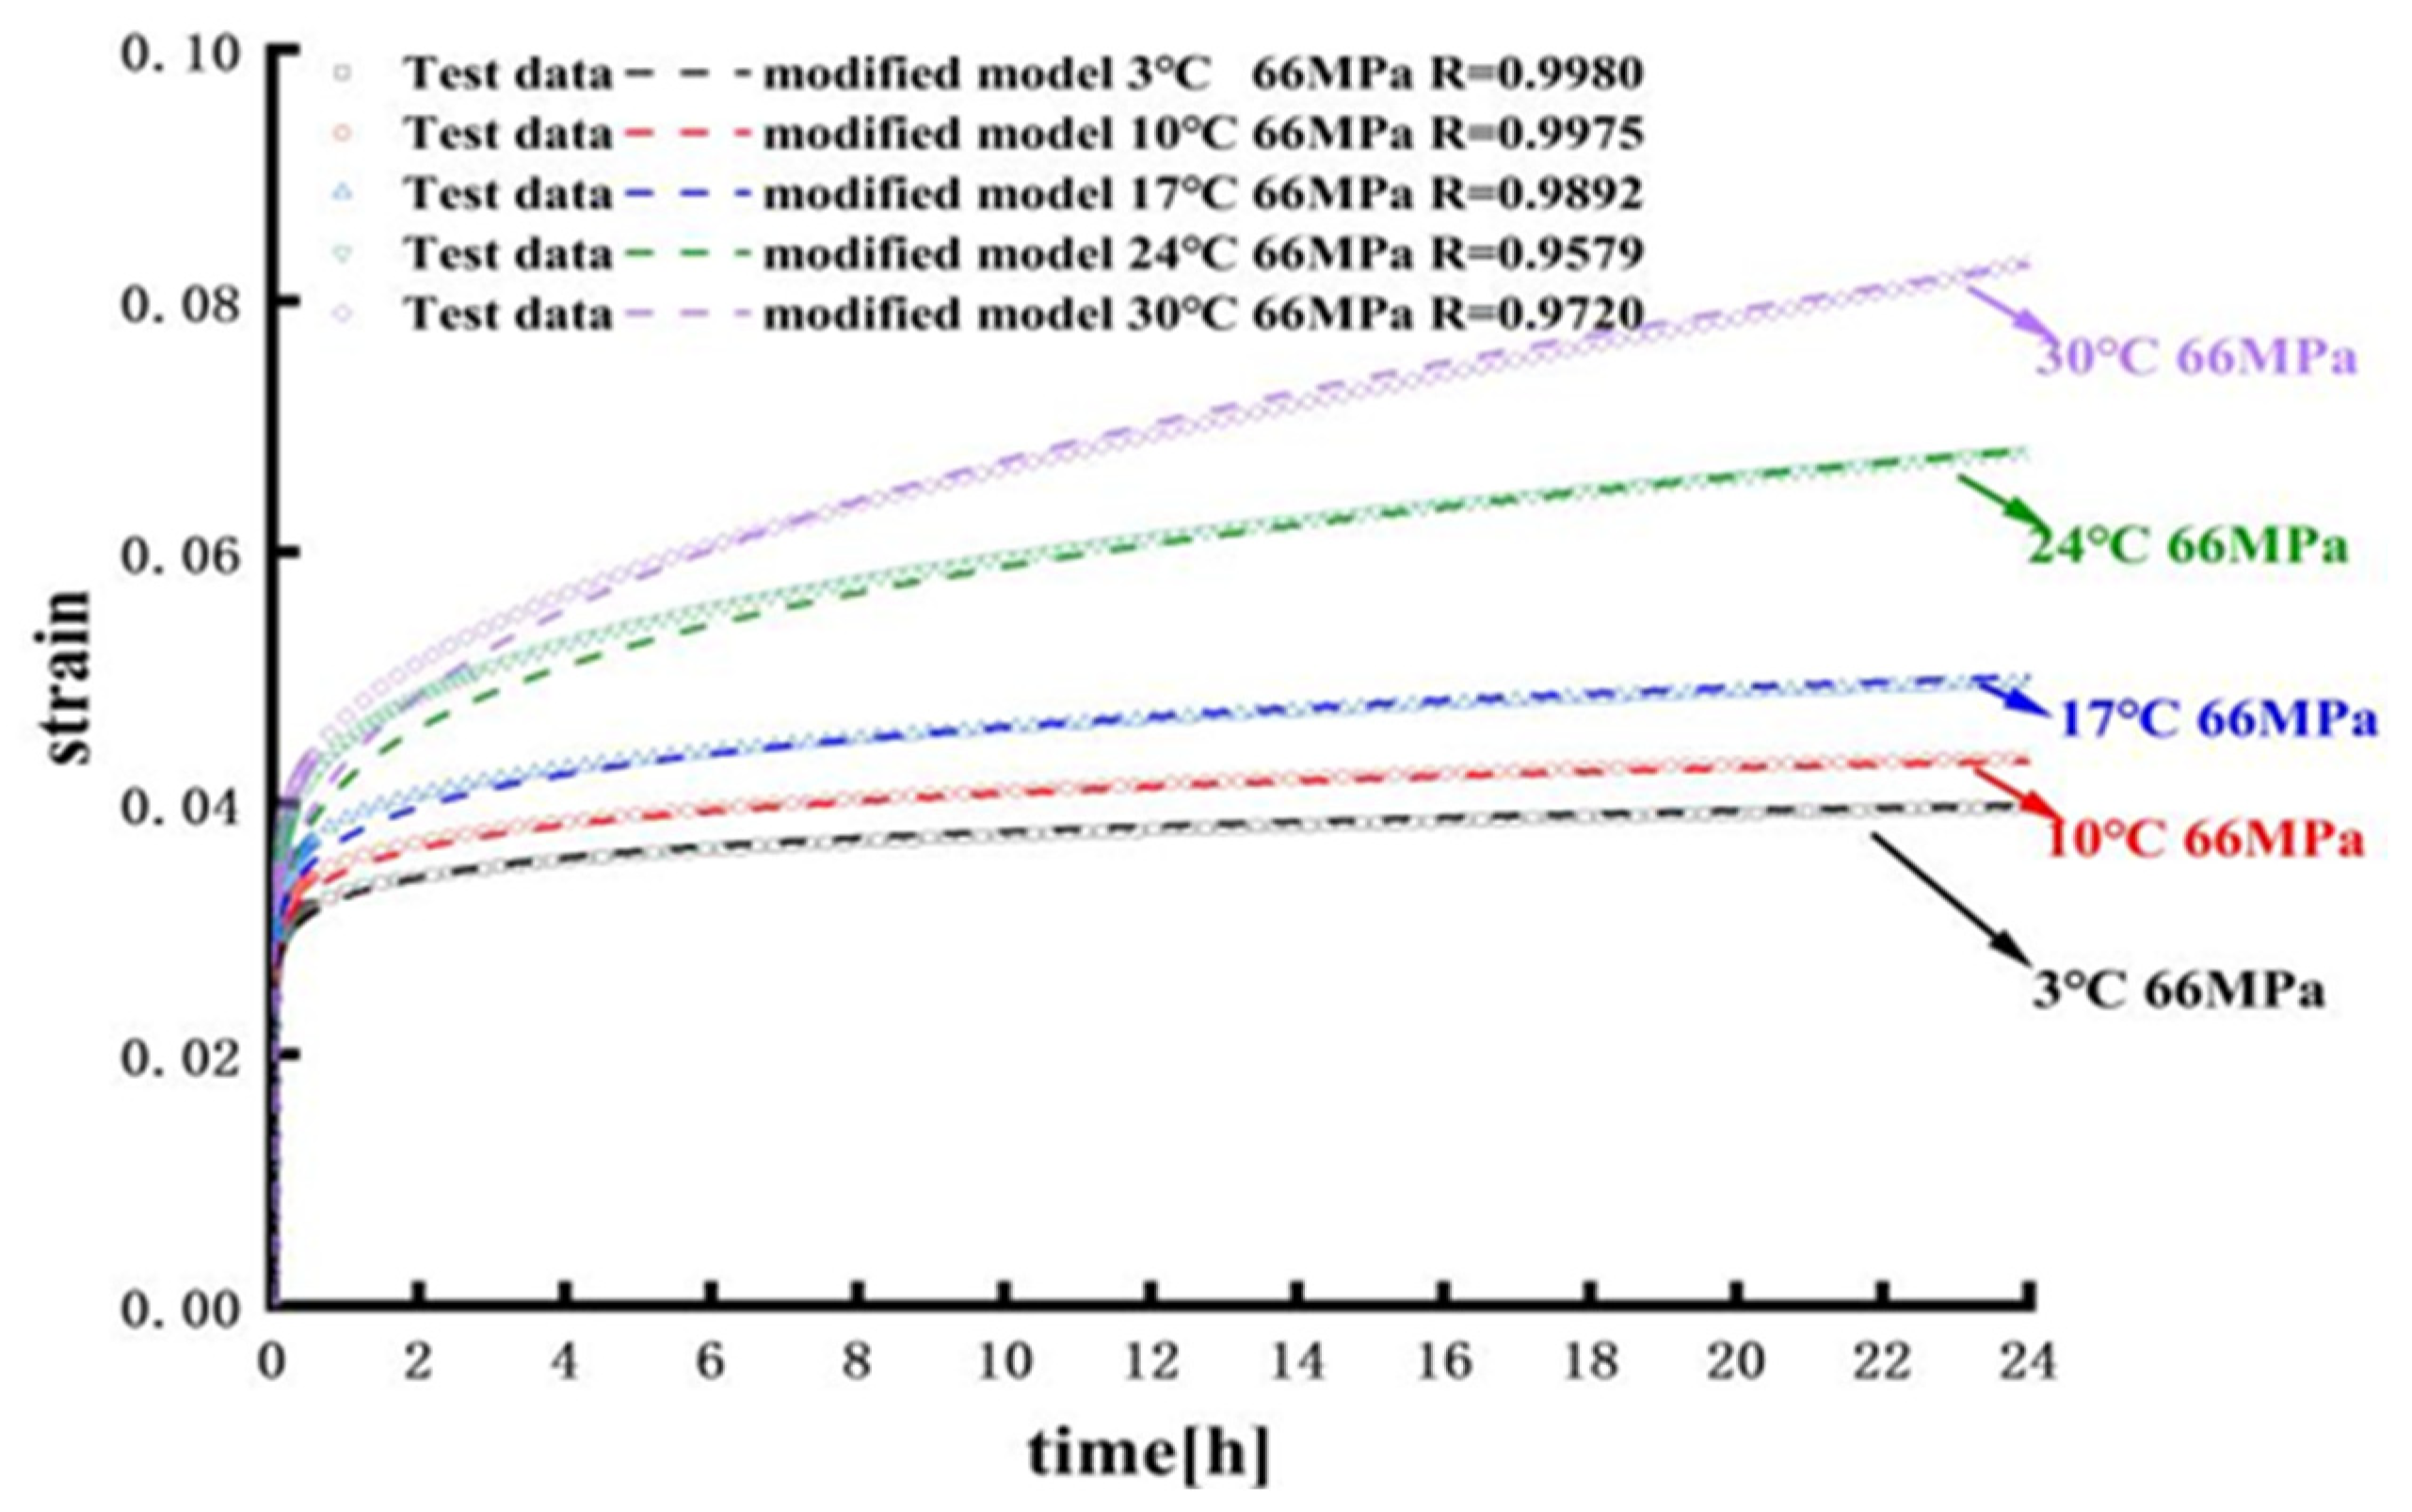
As depicted in Figure 3, the strain exhibits a time-dependent variation. The experimental data distinctly illustrate that strain increases over time, and this effect is more pronounced at higher temperatures. During the loading period, the strain shows a linear upward trend. Under sustained loading, the strain experiences an initial rapid increase followed by a gradual reduction in the strain rate. This behavior corresponds to the first and second stages of creep. With the increase of temperature, the time of the first creep stage becomes longer, and the creep rate also increases.
Utilizing the compression creep test data for the PMMA material at different temperatures, the nonlinear least square method is employed to fit the multiple parameters required for the improved time-hardening creep model. First, the individual curve parameters at each temperature are fitted, and then the parameters are fitted. Assuming that n is a fixed value, A1 and m1 will change, and the parameters are fitted by MATLAB. The parameters of the improved model are obtained by fitting the parameters of A1 and m1, and the results are verified. The fitting results are summarized in Table 2. As shown in Figure 3, the goodness of fit for each curve consistently reaches or exceeds 0.95, with an average value of 0.98292. This shows that the improved time-hardening model is suitable for various temperature conditions at a single stress level.

4. Parametric Analysis on Creep Deformation of PMMA Frustum Observation Windows

The observation window experiences a significant hydrostatic pressure in the deep sea, leading to support and rubbing from the window seat, causing relative displacement. This process primarily involves two components including the extrusion deformation of the observation window and the window seat under the influence of seawater pressure, and the observation of the creep deformation of the window with time. However, with the increase in the diving depth, the observation window will be subjected to hydrostatic loads for a longer time and at a higher pressure during the diving process, and the creep effect of this stage will become very important. The subsequent simulation will replicate the seawater pressure on the observation window at varying depths, specifically at 2000 m, 5000 m, 8000 m, and 11,000 m (corresponding to pressures of 20 MPa, 50 MPa, 80 MPa, and 110 MPa, respectively).

4.1. Finite Element Model and Calculation Methodology for the Observation Window

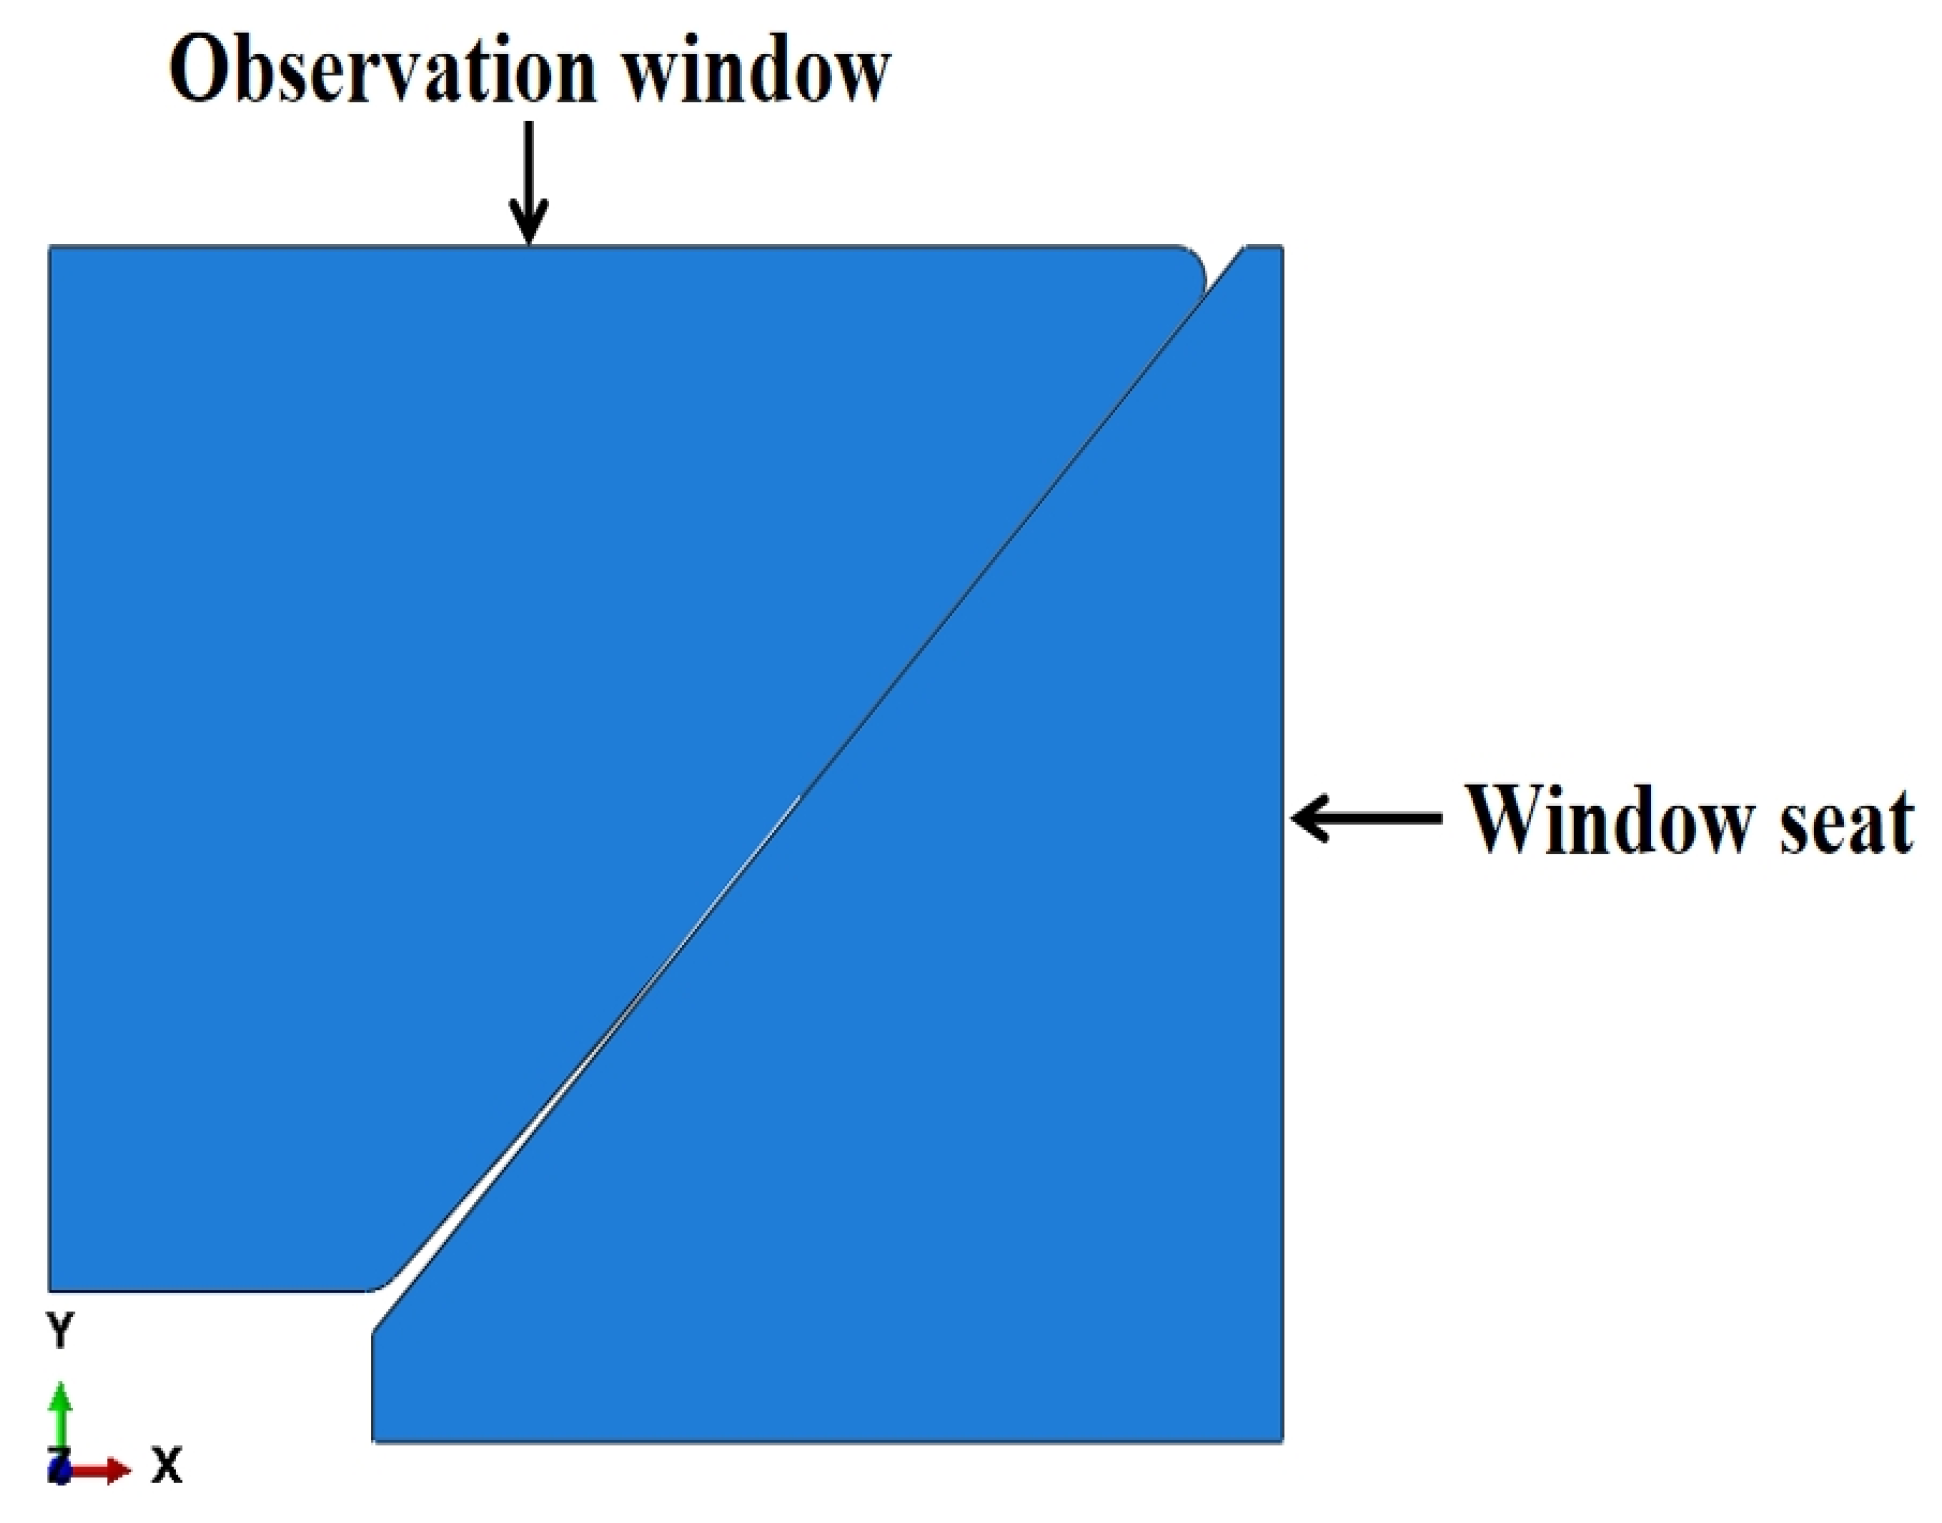
Due to the symmetry of the geometric shape, constraint conditions, and external forces with respect to the central axis, the distribution of displacement, stress, and strain on any rotational section passing through the central axis is identical. Consequently, the spatial axisymmetric problem can be simplified and transformed into a plane problem. The simulation and calculation of the observation window structure are performed using a two-dimensional axisymmetric plane model, as depicted in Figure 4.
Given the absence of precise material performance data, it is recommended to set simulation parameters by considering two sets of combinations for an elastic modulus and Poisson’s ratio: (2000 MPa, 0.38) and (2400 MPa, 0.35) [22]. In this paper, the material properties of the observation window are established using an elastic modulus of 2000 MPa and a Poisson’s ratio of 0.38 for simulation. The external loading input is applied as a pressure of 115 MPa to the model. For the two-dimensional model, the element type selects the four-node bilinear axisymmetric quadrilateral element, reduces the integration, and the hourglass control divides the mesh, as shown in Figure 5a. The interaction between the window and the window seat is defined as surface-to-surface contact. The rigid window seat surface serves as the main surface, while the observation window is designated as the secondary surface. Contact is established between the window seat and the window body, and friction is introduced with a friction coefficient set at 0.1. The contact definition and interaction relationship of the observation window are shown in Figure 5b. During the finite element simulation, the contact direction is consistently aligned with the normal direction of the main surface. This ensures that nodes on the slave surface do not penetrate the main surface, while nodes on the main surface may cross the slave surface. A fixed constraint is applied to the bottom of the window seat, and a symmetrical constraint is established on the section, as shown in Figure 5c. Based on the test loading conditions, the finite element analysis steps are configured, with two analysis steps. The first step involves quasi-static loading, and the pressurization time is set to be 4173 s. In the second step, a viscosity analysis is conducted. When the pressure reaches 115 MPa, the loading state is sustained, and the holding time is set to 18,000 s.
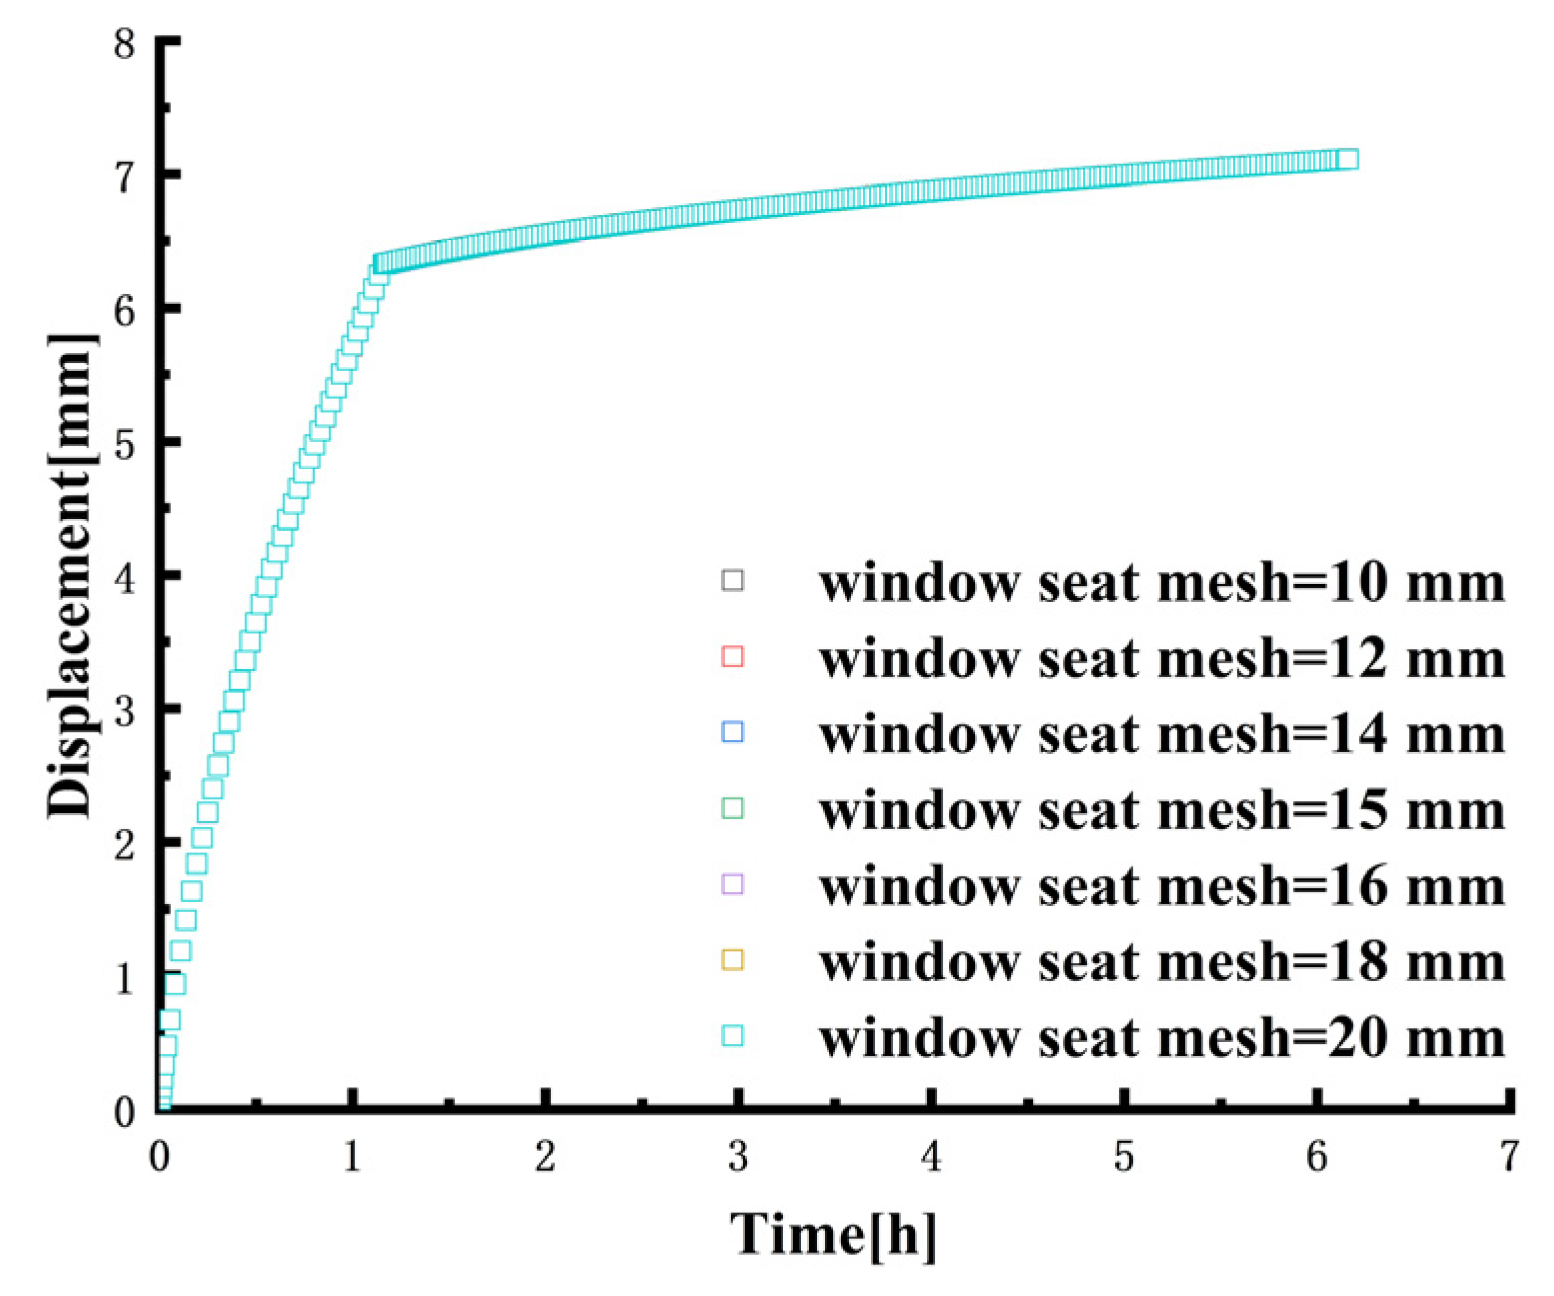
In the finite element contact nonlinear analysis, different mesh sizes may result from variations in the contact master and slave surfaces, leading to potential penetration issues in the contact calculations. Typically, the mesh size is set and divided differently. The rigid window seat is used as the main surface, and the mesh size can be slightly larger, while the flexible window is used as the slave surface. The mesh should be denser and the mesh size should be smaller. To prevent escalation in the computational cost resulting from a high number of meshes in subsequent calculations, a convergence test is conducted with different sizes for the window and window seat meshes. Initially, a convergence study is conducted with mesh sizes of 1 mm, 2 mm, 3 mm, 4 mm, 5 mm, 6 mm, and 8 mm. The results, as depicted in Figure 6, reveal that as time increases, the y-axis displacement of the center of the lower surface of the window stabilizes. The y-axis displacement tends to converge as the mesh size of the window is set to 5 mm. Then, the convergence of the mesh size of the window seat is 10 mm, 12 mm, 14 mm, 15 mm, 16 mm, 18 mm, and 20 mm. The results are illustrated in Figure 7. As time increases, the y-axis displacement of the center of the inner surface remains stable. The y-axis displacement tends to converge when the mesh size of the window seat is set to the intermediate size of 15 mm. Table 3 and Table 4 reveal that the finite element results exhibit minor fluctuations within a narrow range and demonstrate a convergent trend. While ensuring the accuracy requirements, and with the goal of reducing computational costs, a mesh size of 15 mm is chosen for the window seat, and a mesh size of 5 mm is selected for the observation window. The model is then divided accordingly.

4.2. Simulation Model Validation by Experiment

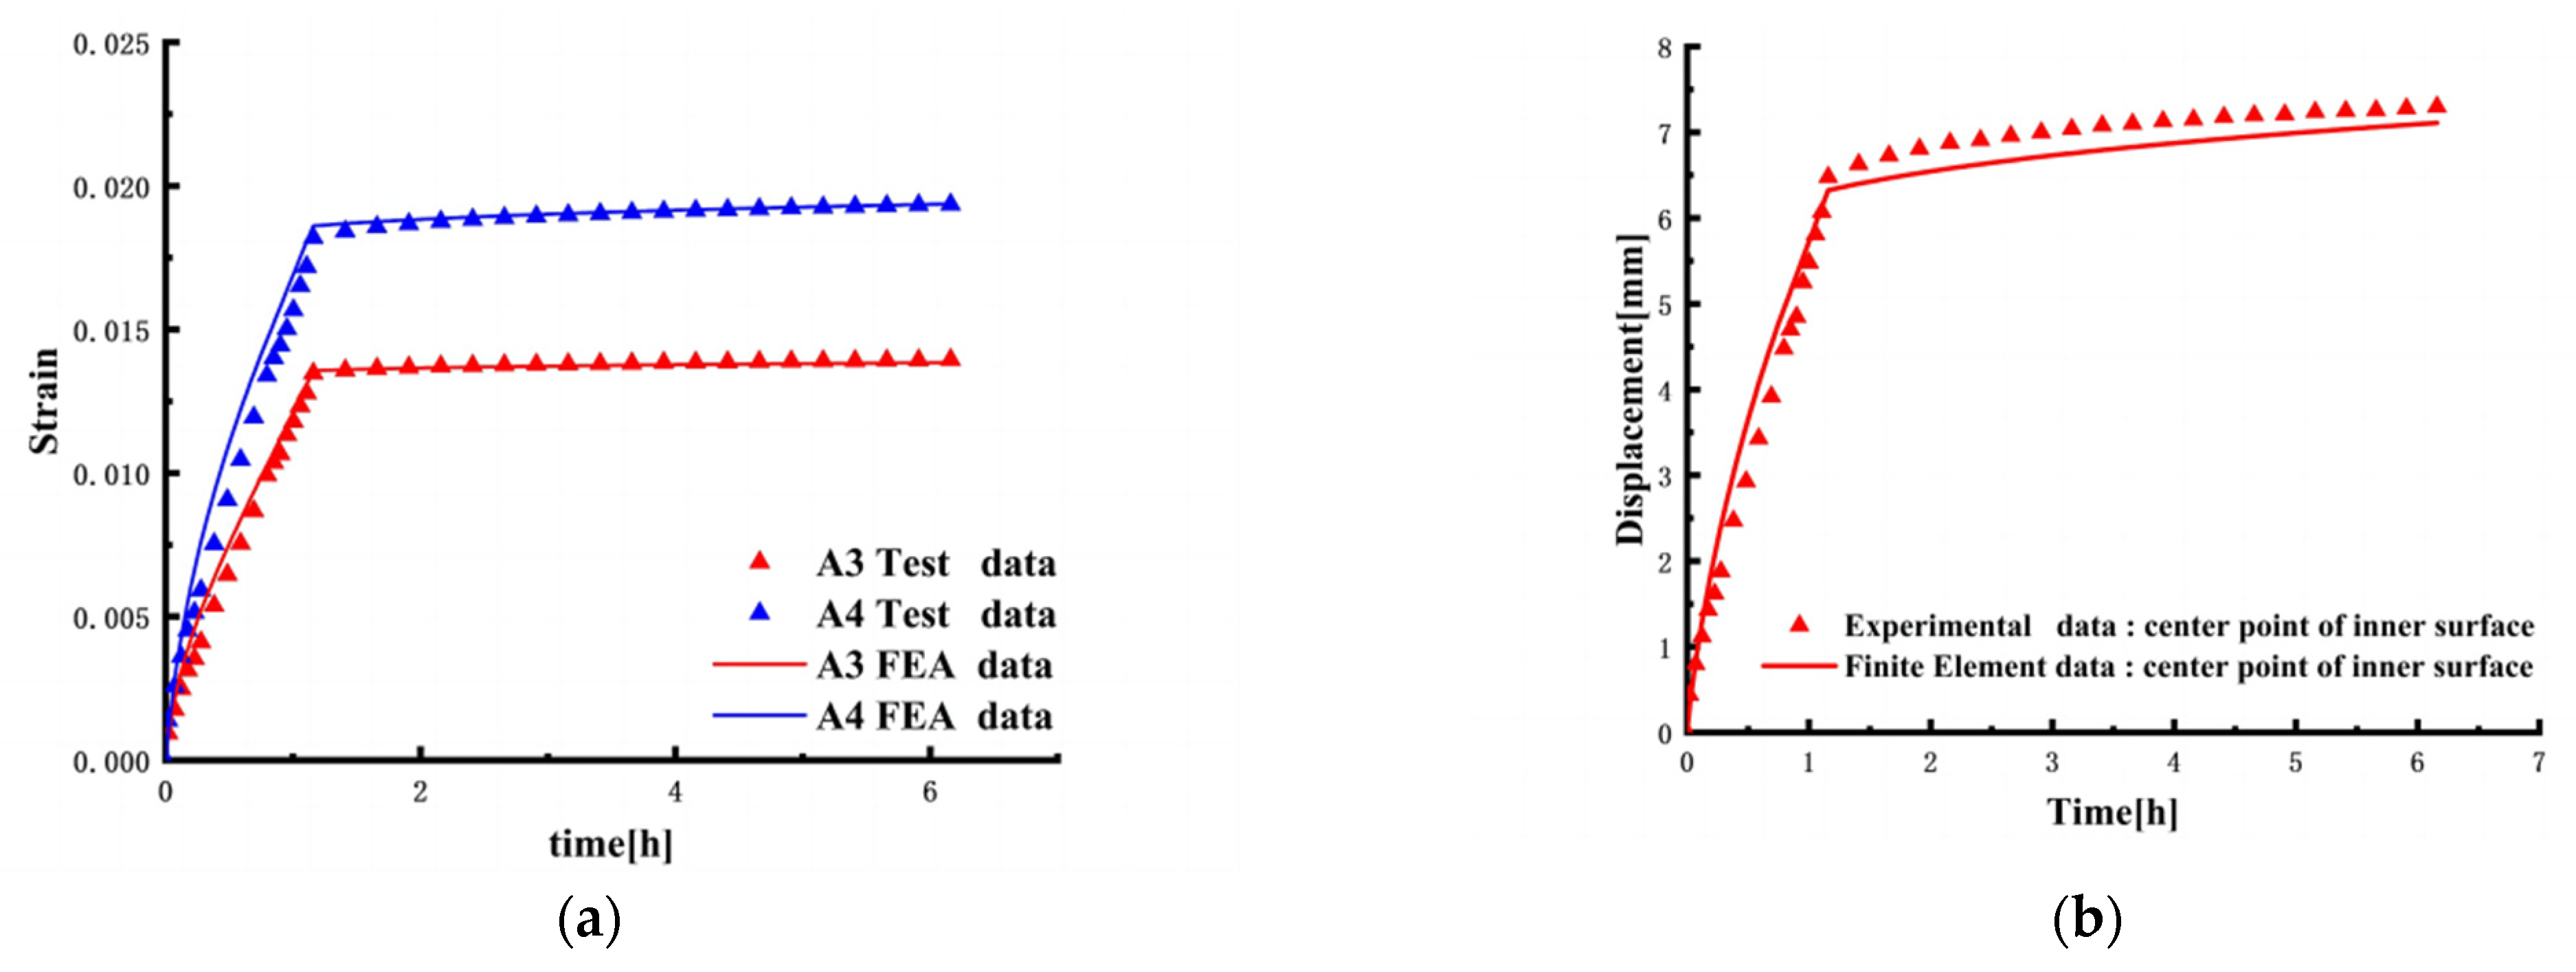
Under high pressure, the space between the inner window and the window seat of the metal spherical shell compresses due to an increase in displacement. At greater depths, the failure deformation of the observation window may result in an intolerable pressure level for humans. Consequently, the observation window is a crucial component in the design of the pressure hull. Therefore, a full-scale model test was carried out on the PMMA observation window, as shown in Figure 8. The type of strain gauge used is 120–3 AA, block 120.3 ± 0.1 Ω, substrate size 6.6 × 3.2 mm, wire grid size 3.0 × 2.3 mm, and the manufacturer is CHENG TEC. The strain measurement instrument model is UCAM-60B-AC, the power supply specification is 85 to 264 VAC, 50/60 Hz, and the manufacturer is KYOWA.
The pressure-holding experiment for the observation window involves loading the pressure to 115 MPa and maintaining the load for 5 h, with a loading speed not exceeding 4.5 MPa/min. Each load increment is 5 MPa, followed by a 2 min wait before the next loading cycle. The indoor temperature is 30 °C. The improved time-hardening model is implemented in UMAT and subsequently calculated using ABAQUS, demonstrating good agreement with the experimental results, as depicted in Figure 9. It shows that the improved time-hardening model is well-suited for the creep analysis of the PMMA observation window.

4.3. Effect of Temperature on Creep of Frustum Observation Window

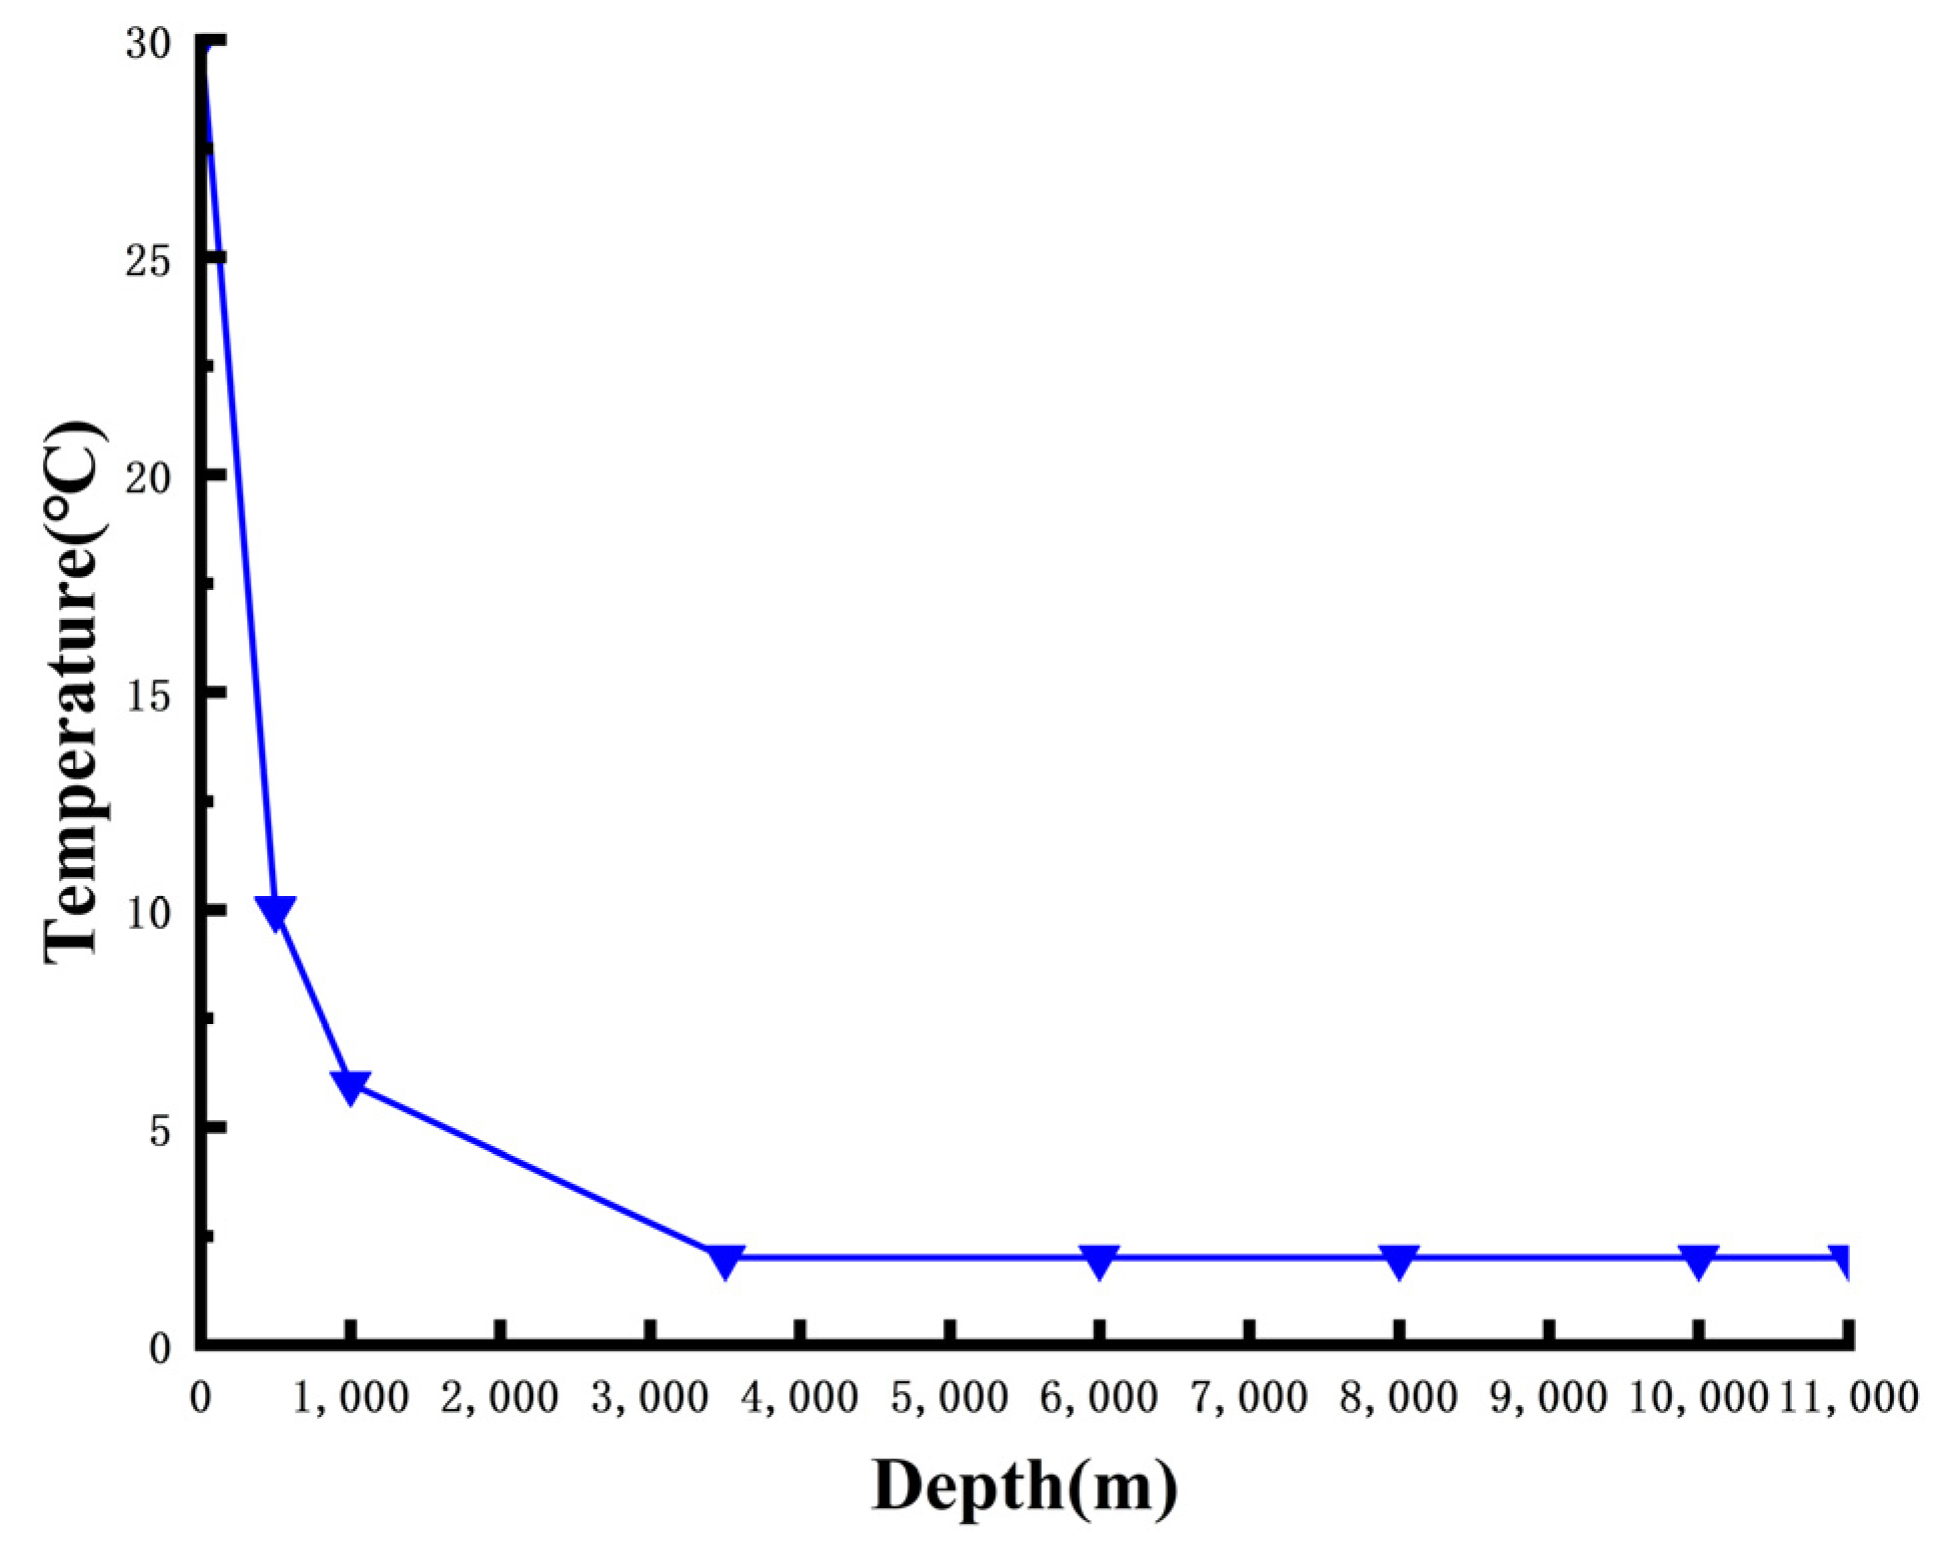
Given the weak penetration of sunlight in the ocean, the intensity of sunlight rapidly diminishes after entering seawater. Typically, seawater temperature decreases by 1 to 2 °C for every 1000 m of seawater depth. In the depth range of 3500 to 11,000 m, the seawater temperature is approximately 2 °C, as depicted in Figure 10. Additionally, Table 5 indicates that the seawater temperature exhibits seasonal variations. In Section 4.2, the improved time-hardening creep model’s good applicability is verified. To more realistically simulate the creep behavior of the observation window in a seawater environment, the model will be employed to analyze the creep behavior while accounting for temperature variations, particularly those occurring during the summer. The temperature range is set from 2 °C to 30 °C.
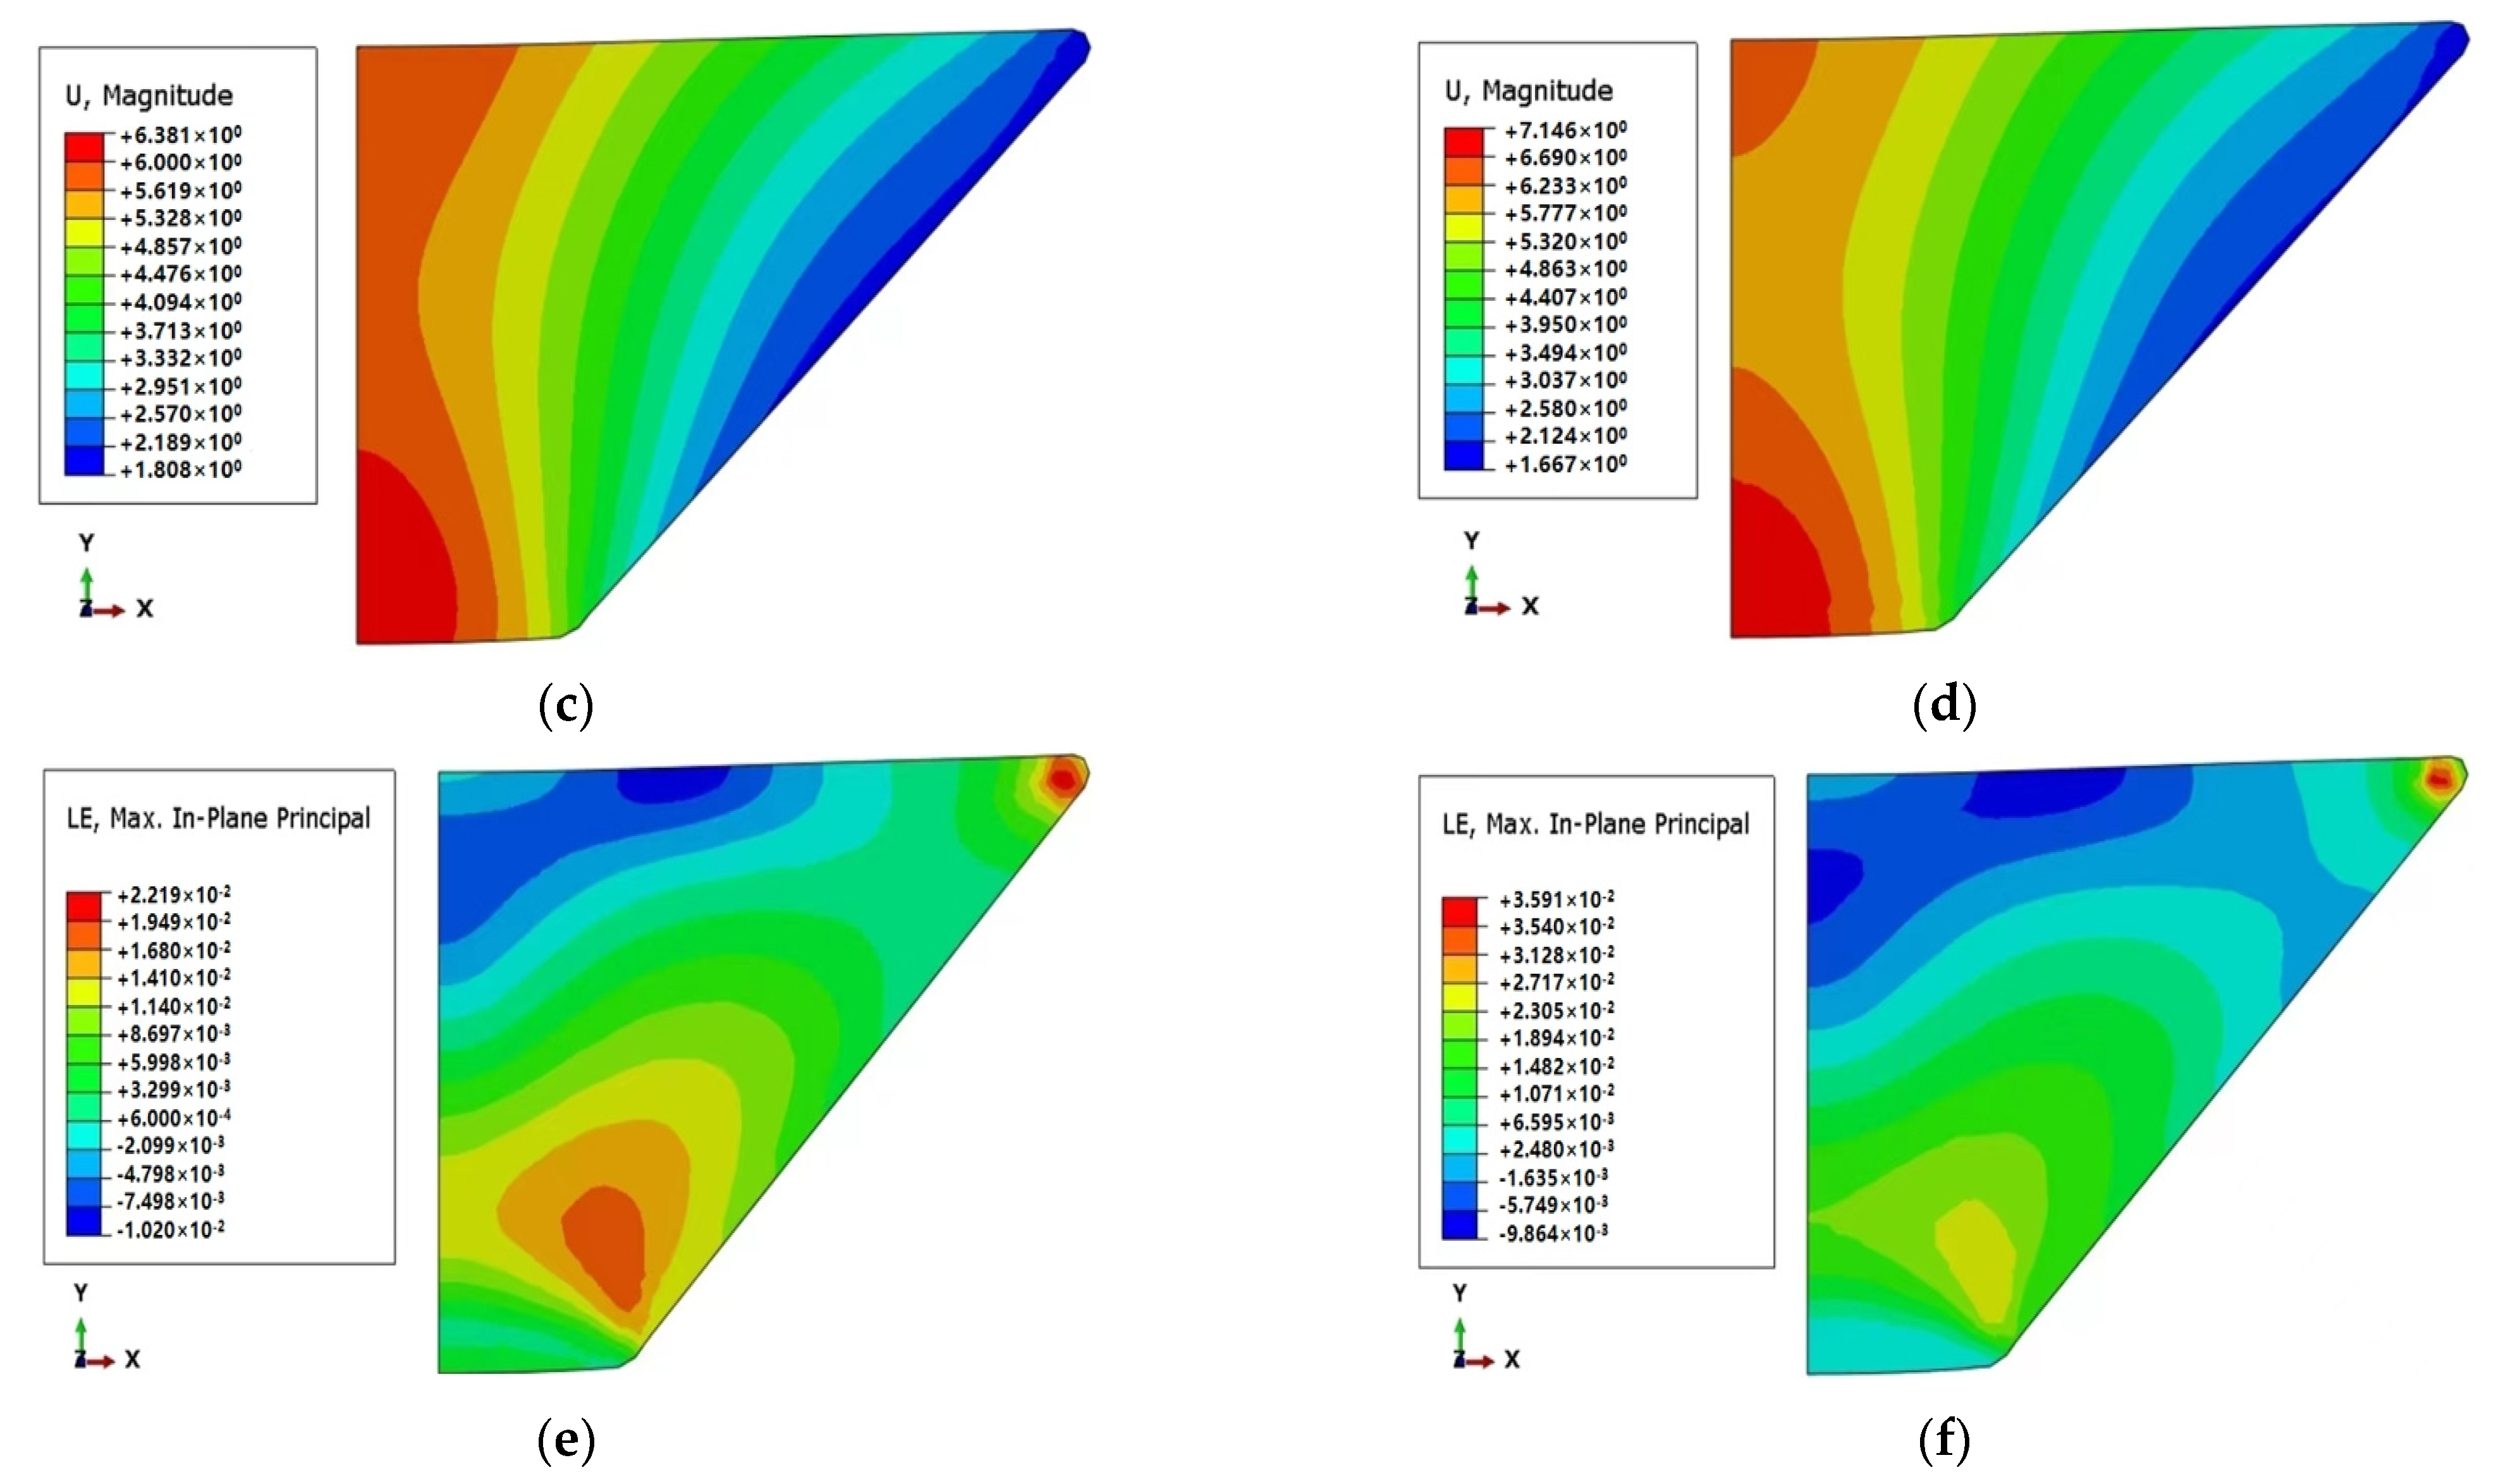
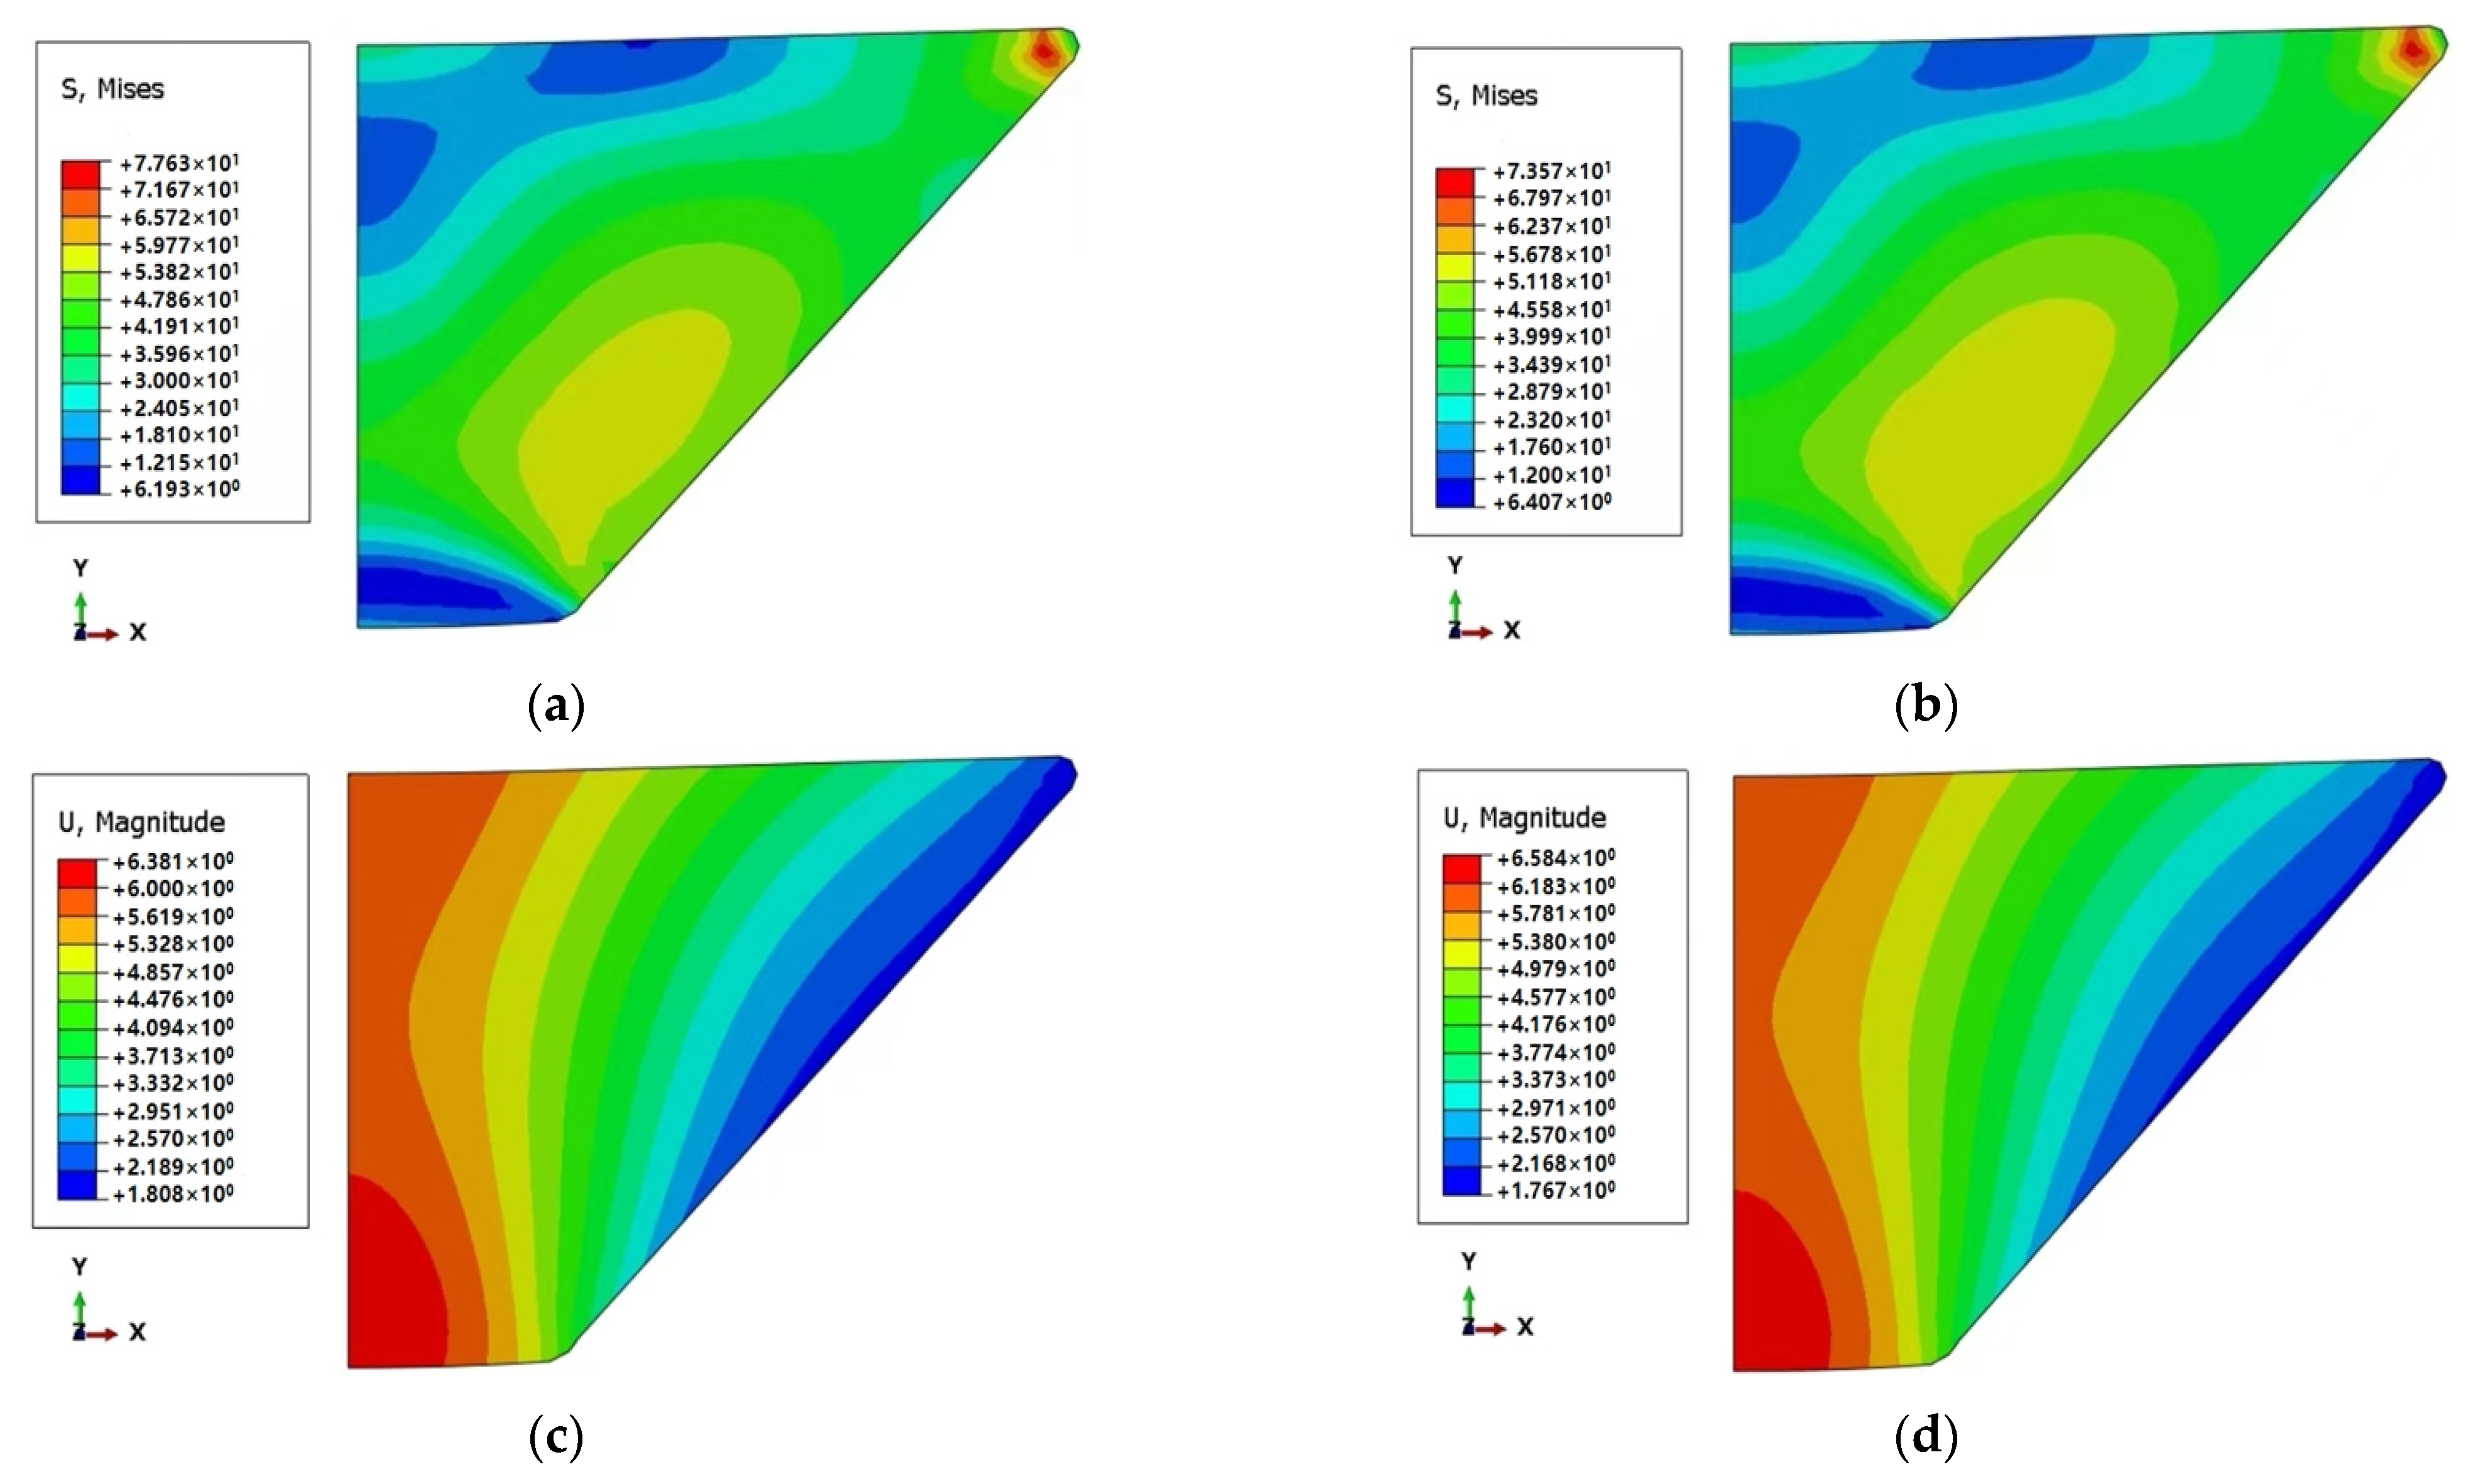
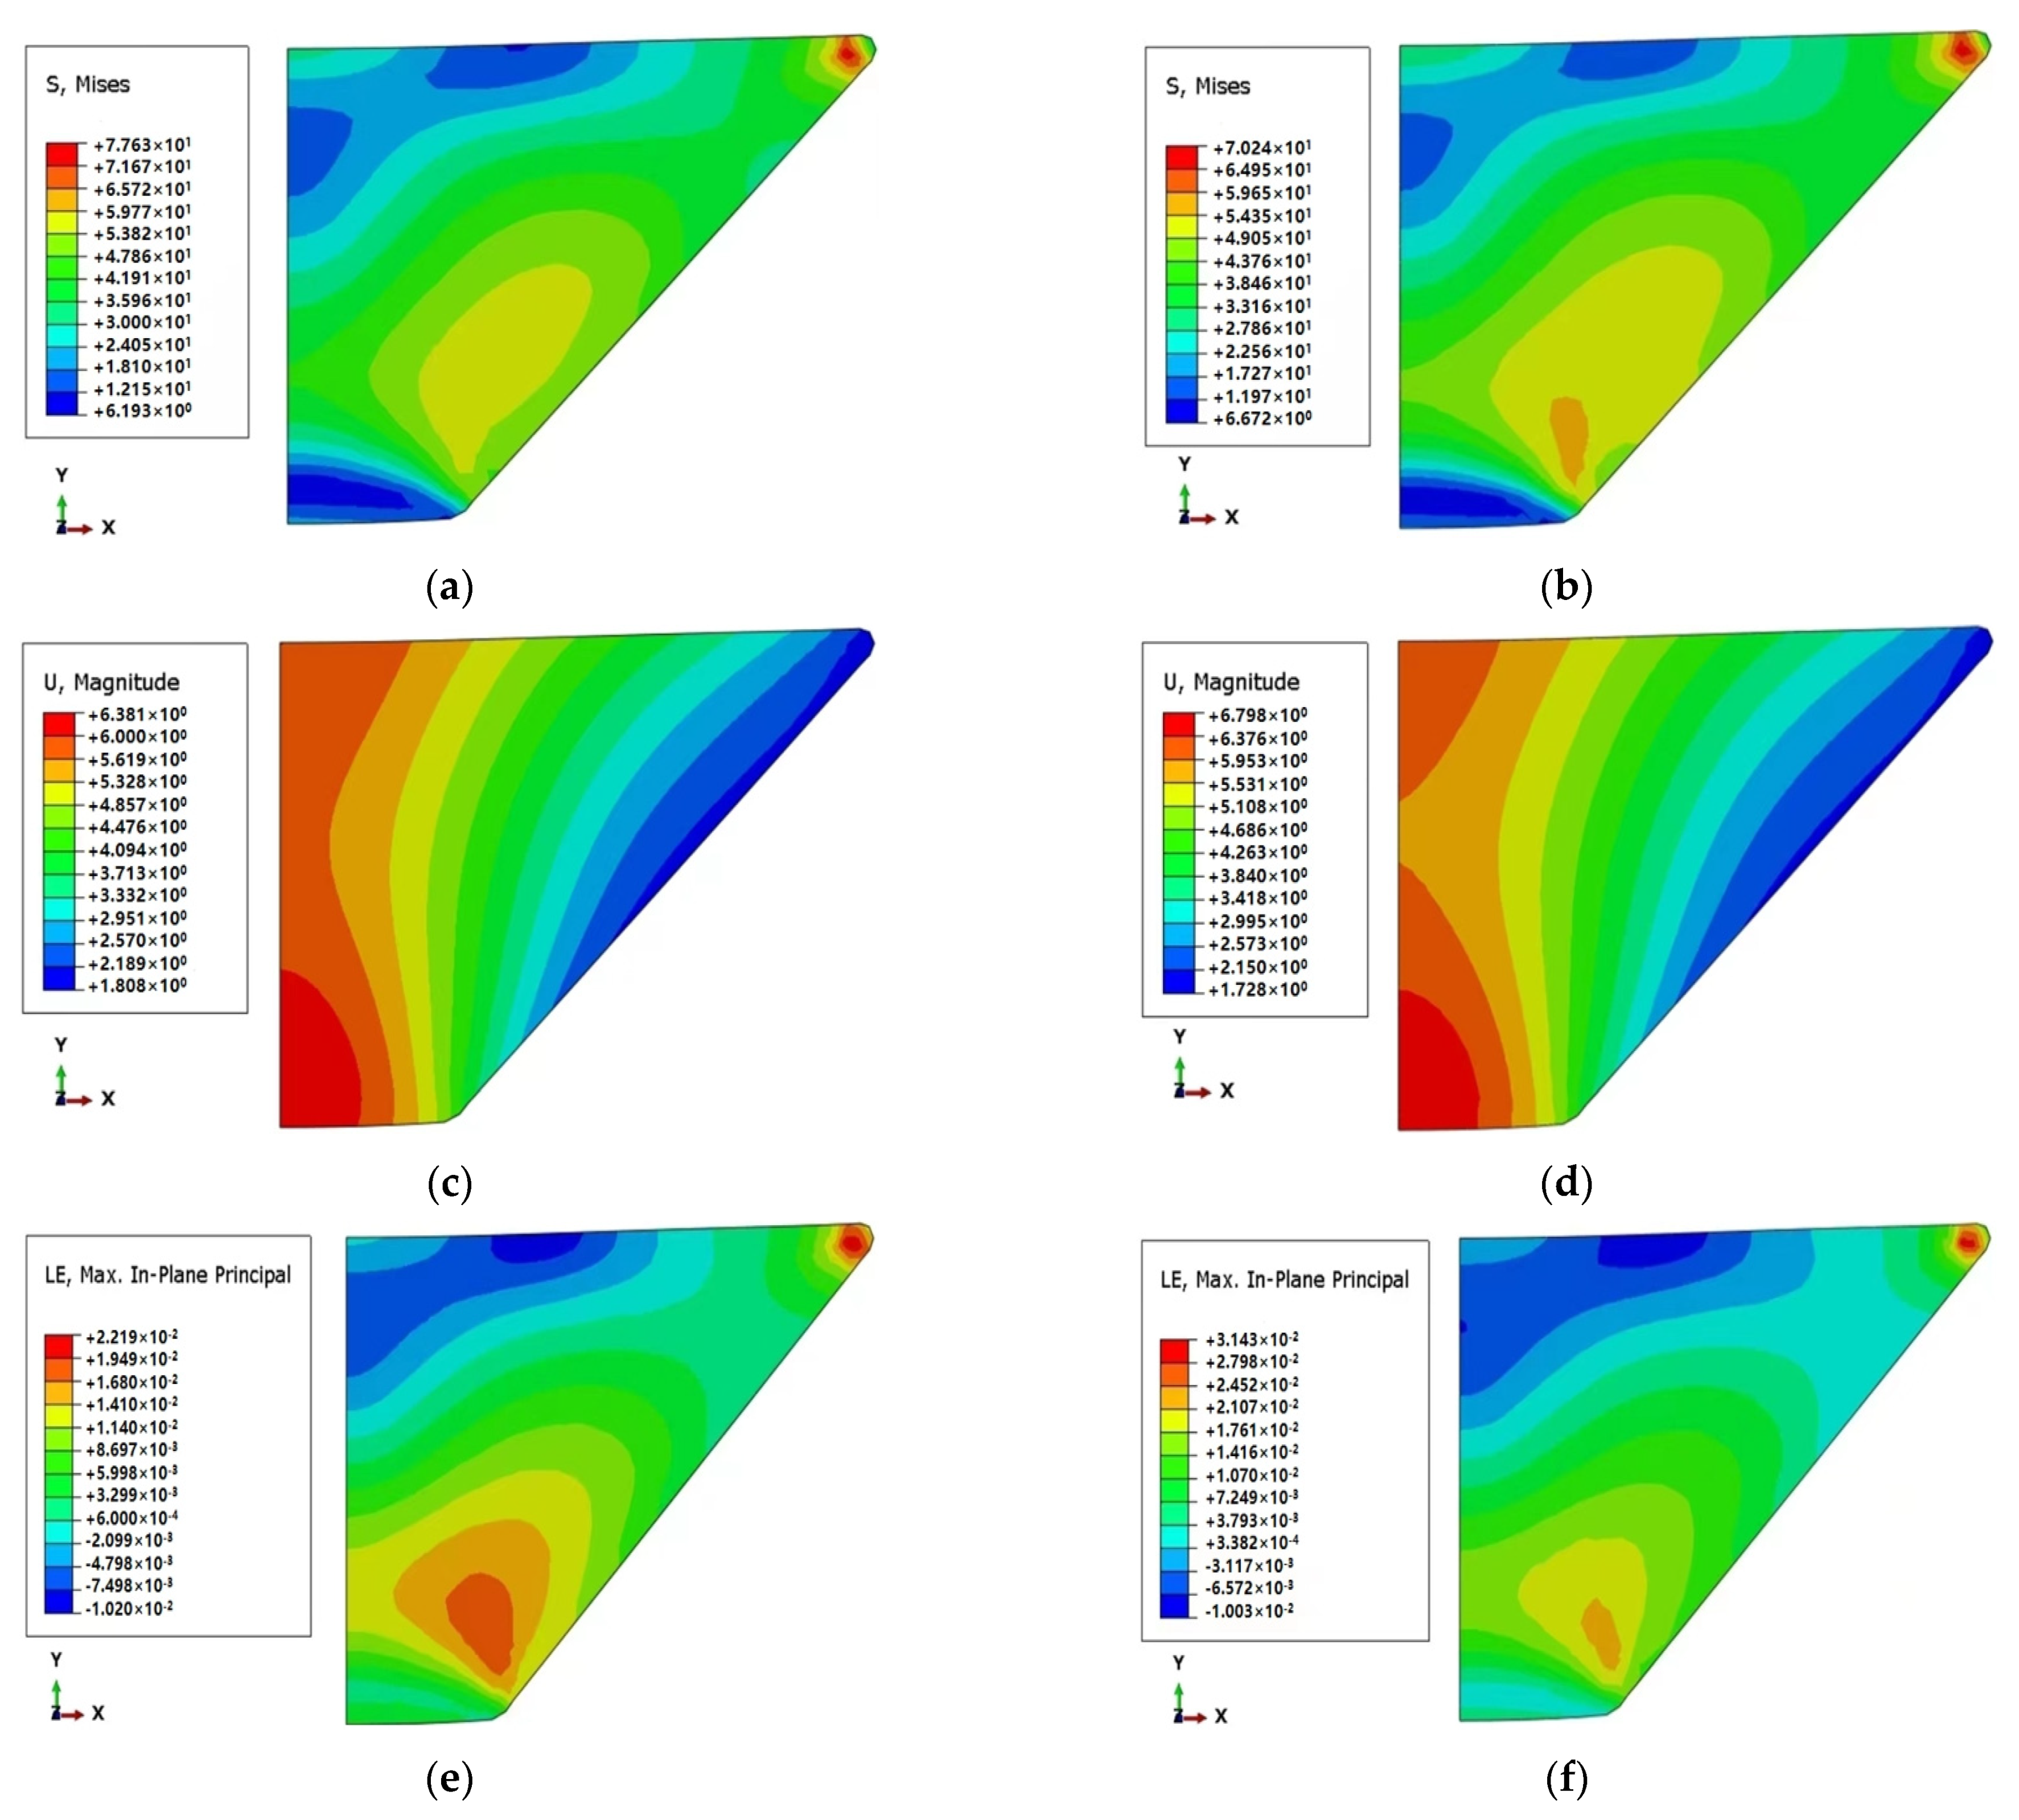
Utilizing the modified time-hardening creep model, finite element numerical calculations were employed to analyze the y-axis displacement of the center of the lower surface of the observation window in various temperature ranges. Among them, the temperature during the loading stages L1 and L2 changes linearly within the ranges of 2 °C to 30 °C and 30 °C to 2 °C, respectively. Meanwhile, the temperature during the holding stage remains consistent with the temperature at the end of the respective loading stage, specifically 30 °C and 2 °C. In addition, the temperature of the loading stage of L3 and L4 is 2 °C and 30 °C, respectively, while the temperature of the holding load stage changes linearly within 2~30 °C and 30~2 °C, respectively. As illustrated in Figure 11, the maximum axial displacements at the center of the inner surface of the observation window during the holding time for L1, L2, L3, and L4 are 7.1103 mm, 6.7667 mm, 6.7532 mm, and 6.5339 mm, respectively. The y-axis displacement at the center of the lower surface of the observation window is evidently influenced by temperature changes during both the loading and holding load stages. As the temperature increases, the displacement increases faster. As illustrated in Figure 12, Figure 13, Figure 14 and Figure 15, the stress distribution across the observation window exhibits an initial increase followed by a decrease from the upper surface to the lower surface under four different temperature ranges. Notably, there is a significant stress concentration in the lower surface area, particularly at the position where the lower surface of the observation window and the window seat are in contact. The stress distribution of the observation window remains largely consistent before and after creep, with an overall reduction in stress after the creep process. The displacement distribution of the observation window remains generally consistent before and after creep, with an overall increase in displacement after creep. Along the central axis, the axial displacement of the observation window initially decreases and then increases from the upper surface to the lower surface. The maximum axial displacement is observed at the lower surface axis. L1 was 6.381 mm before creep and 7.146 mm after creep, with a creep of 0.765 mm. L2 was 6.381 mm before creep and 6.584 mm after creep, with a creep of 0.203 mm. L3 was 6.381 mm before creep and 6.811 after creep, with a creep of 0.430 mm. L4 was 6.381 mm before creep and 6.798 after creep, with a creep of 0.417 mm. The strain shows an upward trend as the loading time increases. The finite element numerical analysis indicates that the impact of temperature on the displacement and stress of the PMMA observation window, encompassing both creep deformation during the loading stage and the holding one, is substantial.

4.4. Effect of Loading Rate on Creep of Frustum Observation Window

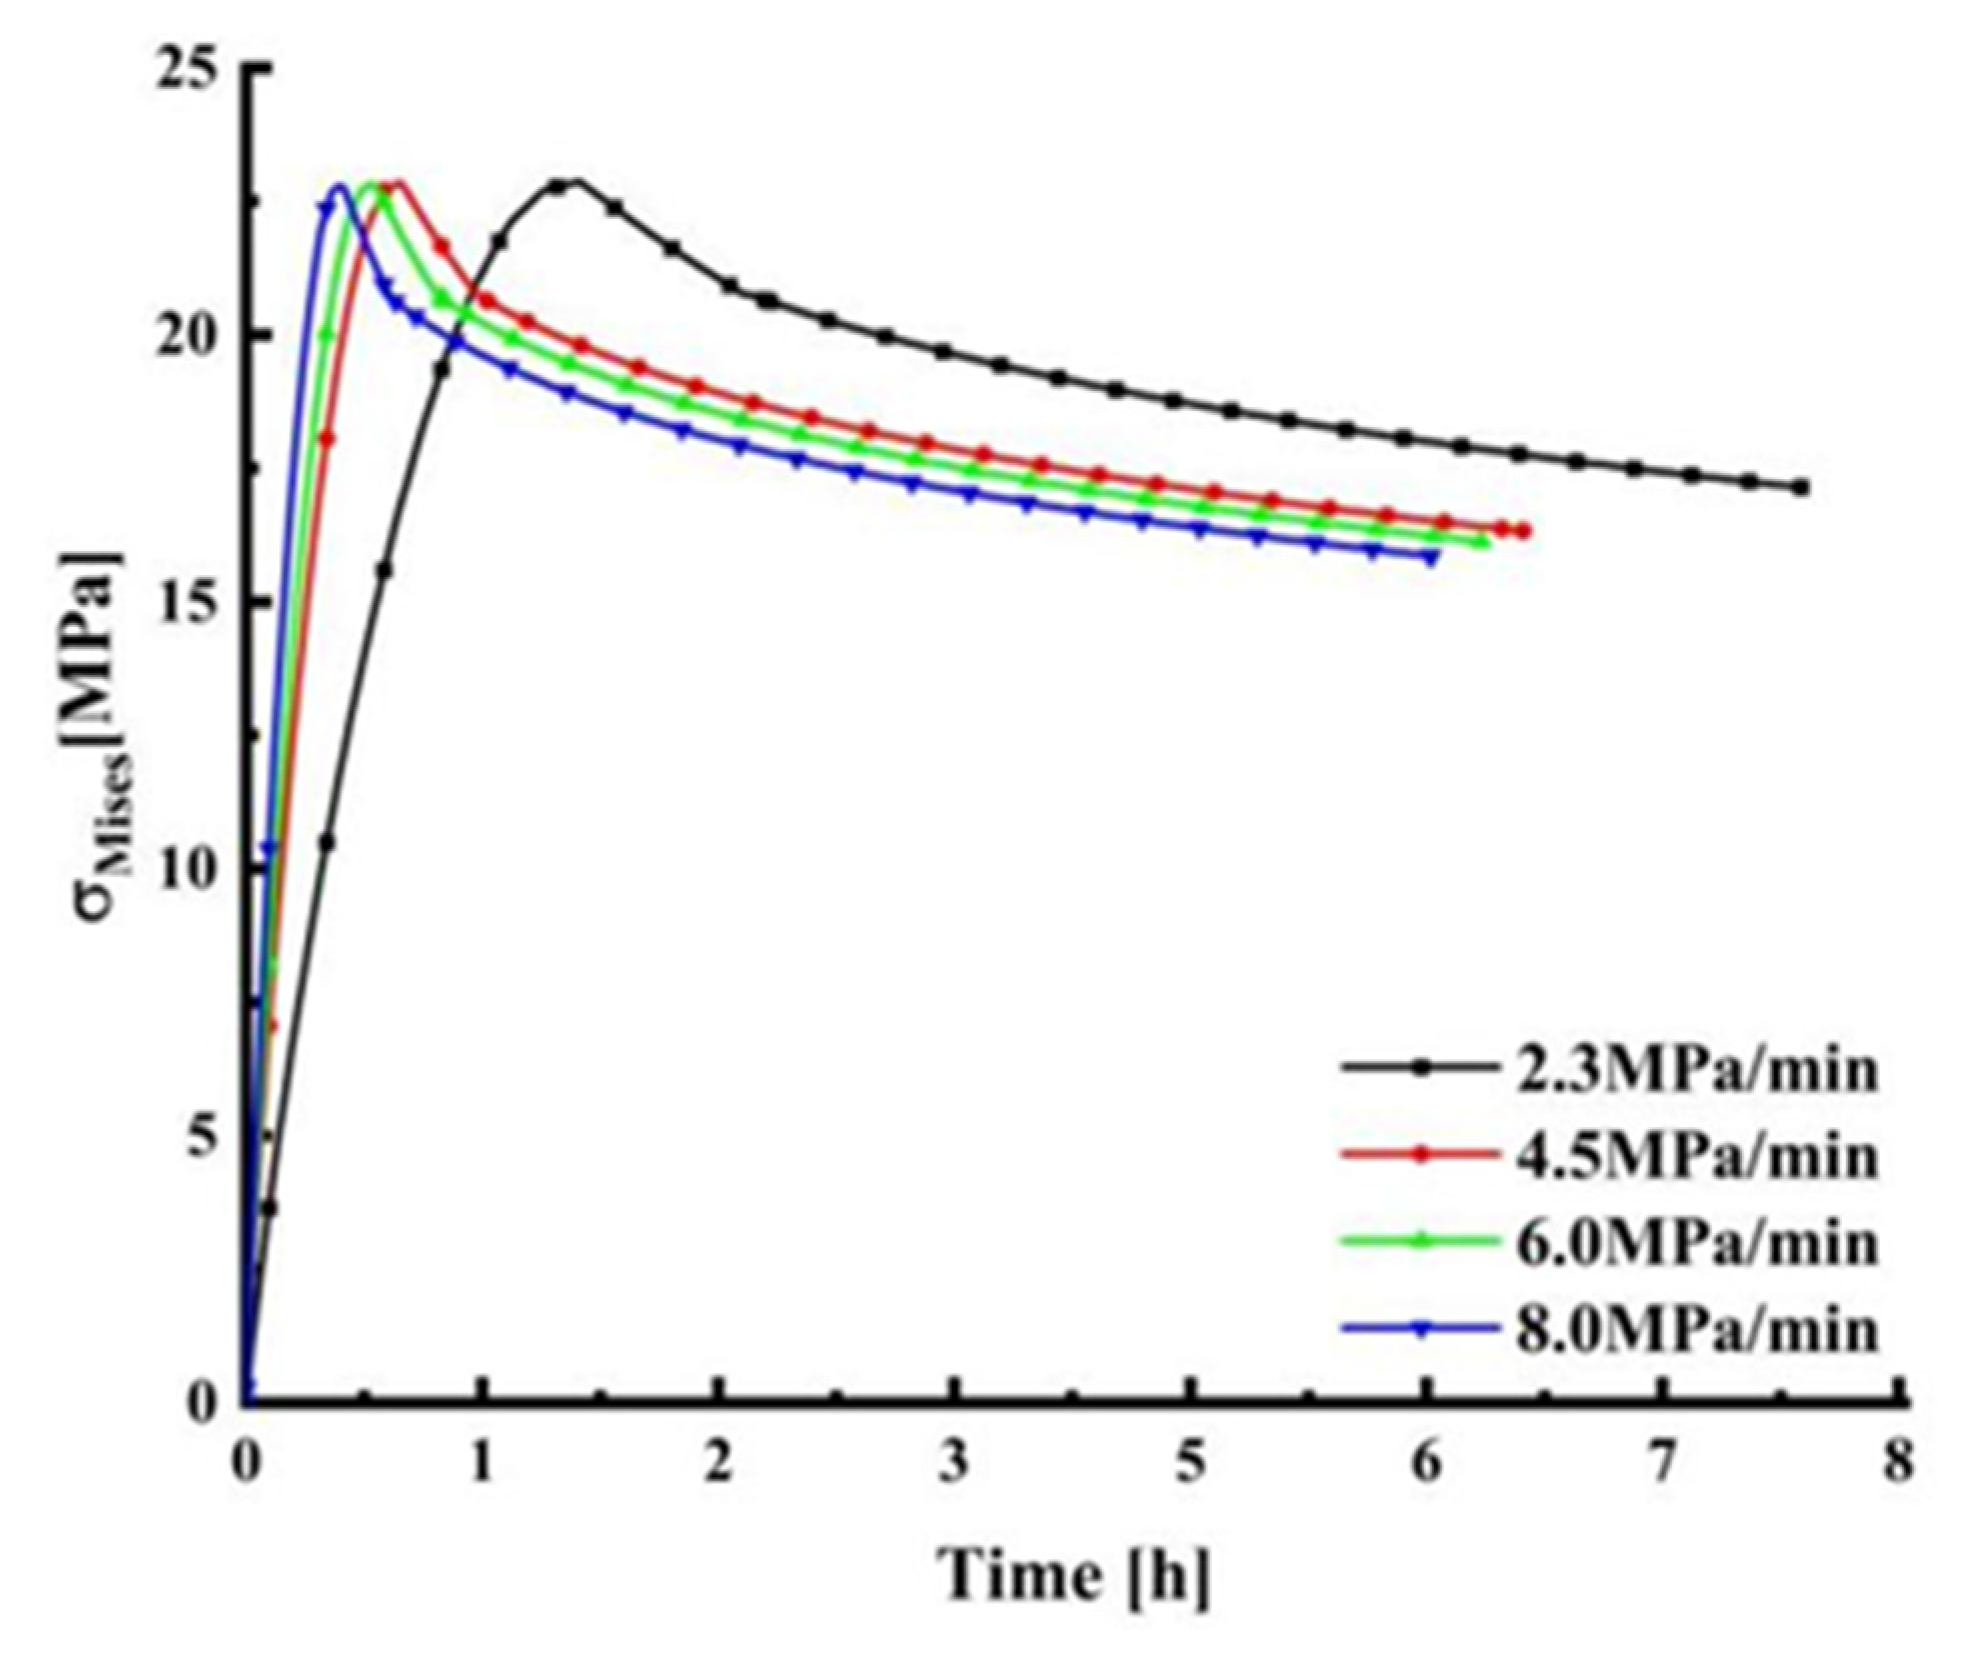
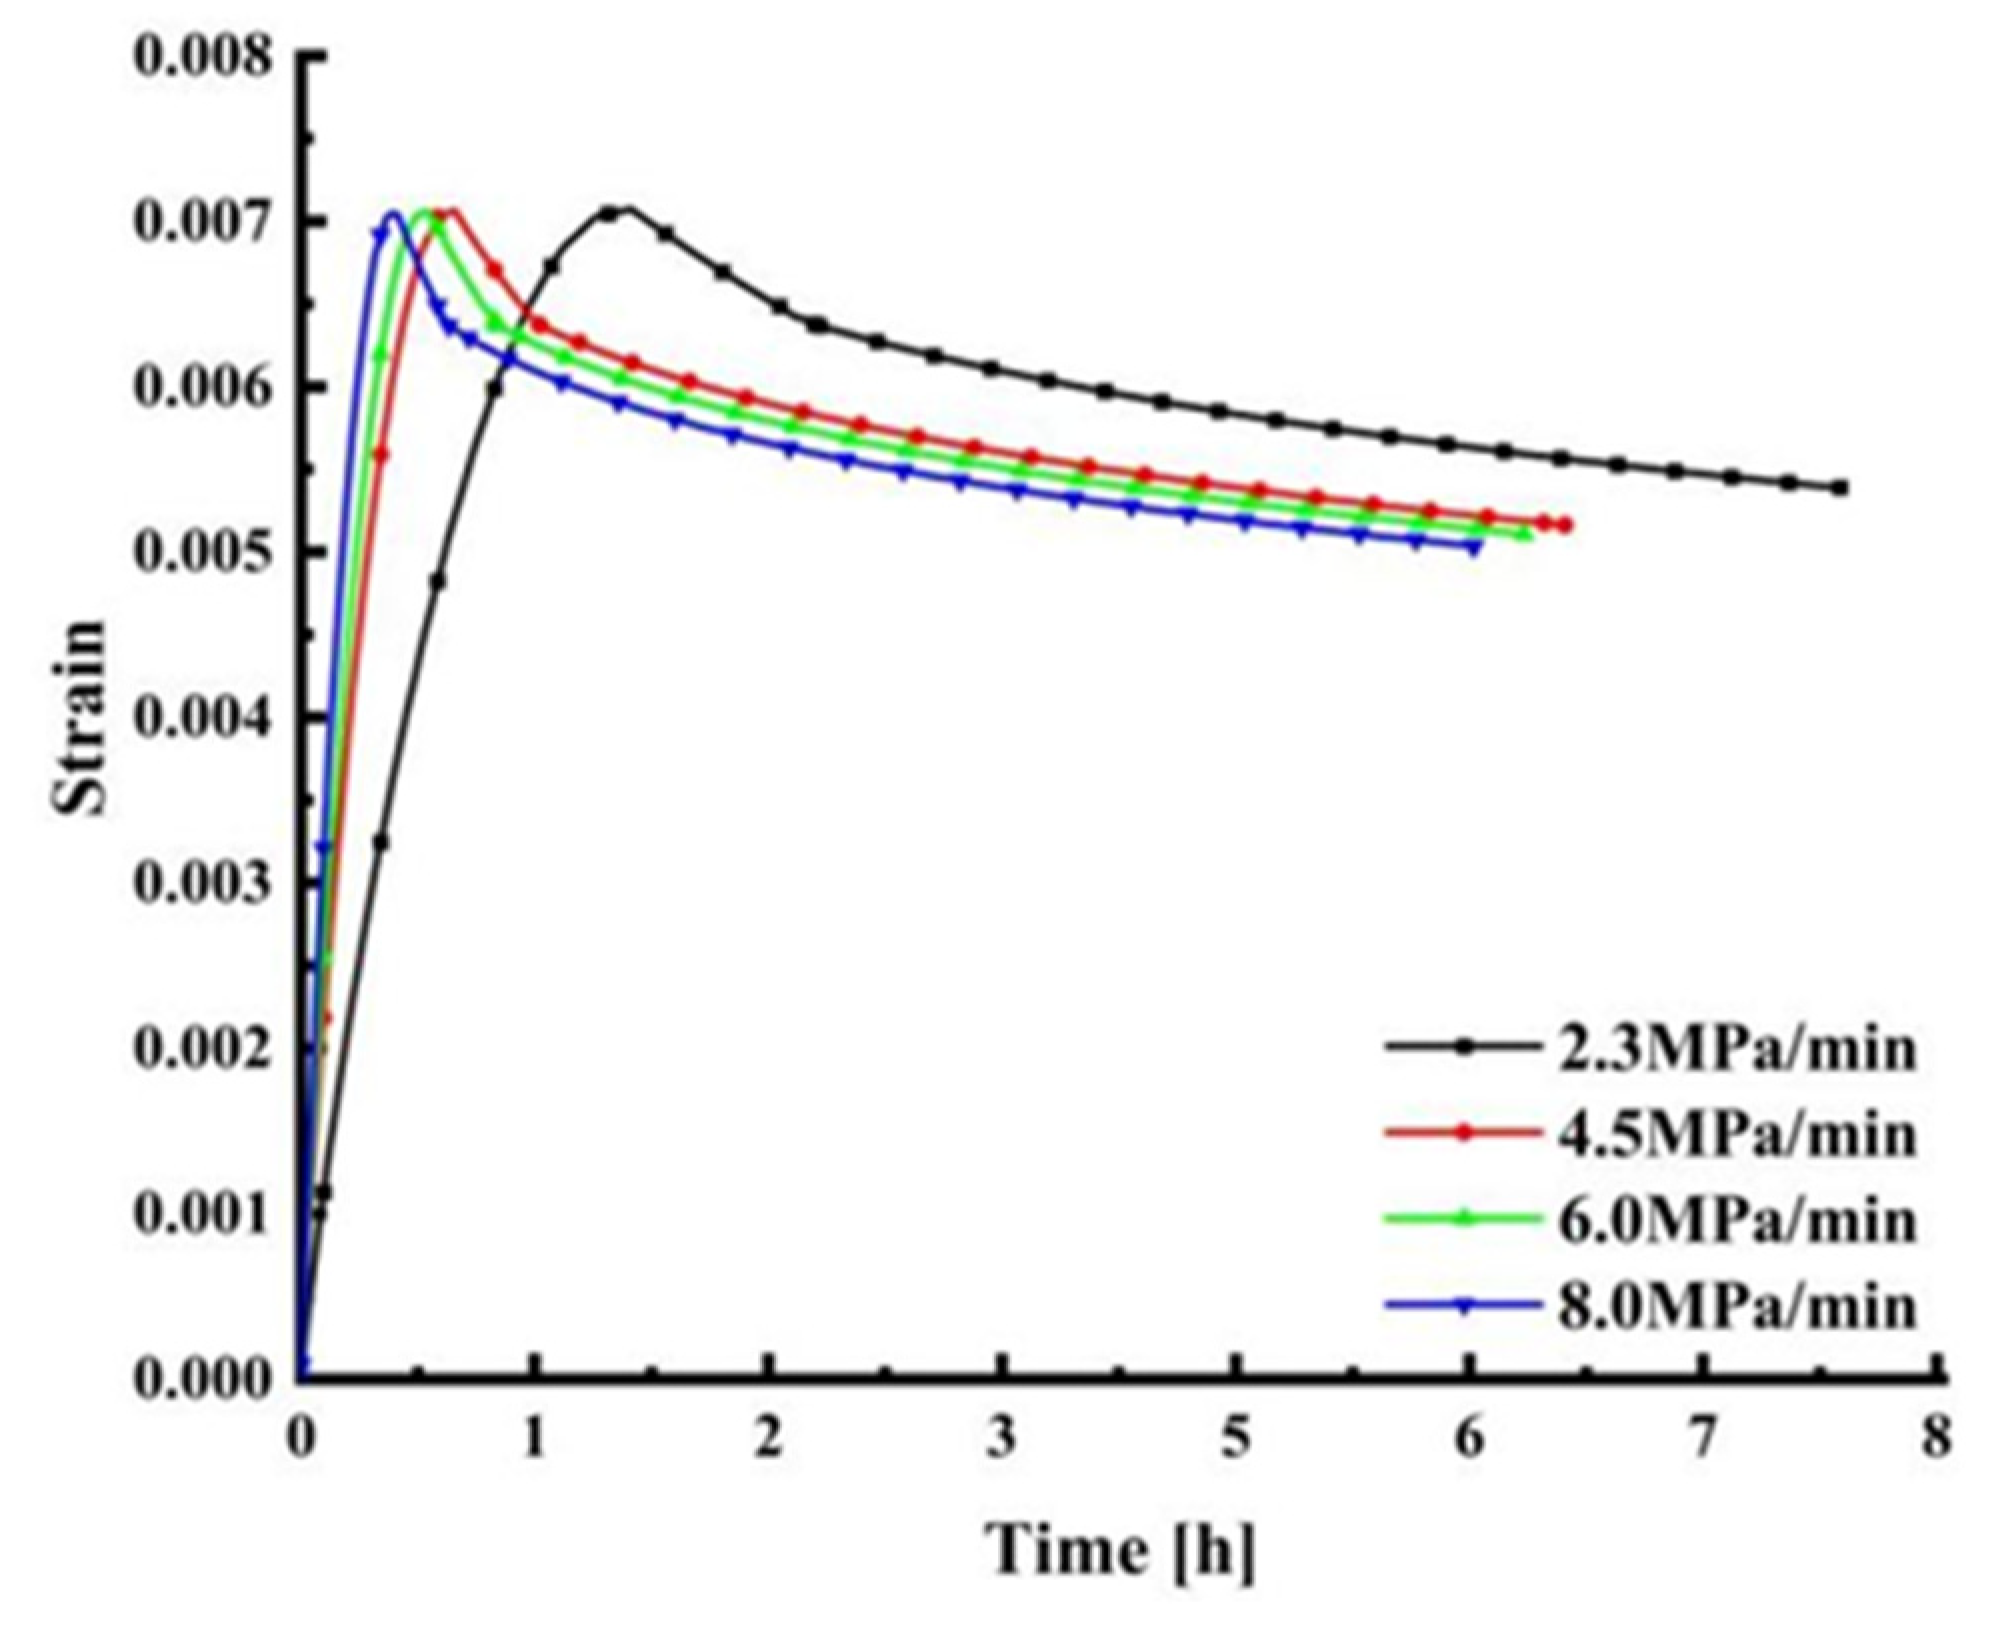
Utilizing the parametric analysis of the aforementioned observation window, finite element modeling is conducted based on the structural parameters of the optimized observation window model (with a mesh size of 5 mm for the observation window, a mesh size of 15 mm for the window seat, and a temperature of 30 °C). Through a substantial number of finite element calculations, it has been observed that different loading rates influence the displacement, strain, stress, and other output values of the observation window. This also has a certain influence on the creep behavior of the observation window. By employing four different loading rates, respectively, 2.3 MPa/min, 4.5 MPa/min, 6 MPa/min, and 8 MPa/min, the pressure of the observation window model was ultimately loaded to 115 MPa and maintained for 5 h. The finite element calculation results depicting the center position of the lower surface of the observation window at different loading rates are presented in Figure 16, Figure 17 and Figure 18. Due to the variations in the four loading rates, the time spent in the loading stage differs, with lower loading rates requiring more time. It is apparent from Figure 16, Figure 17 and Figure 18 that the differences in the values of displacement, stress, and strain among the four different loading rates during the loading stage are minimal. Nevertheless, in the holding load stage, the differences become more pronounced. Although the holding load time is consistent, the amplitude of strain and stress in the holding load stage decreases with an increase in the loading rate. During the stage of holding the load, the displacement at the center of the inner surface of the observation window increases with the rise in the loading rate. Under loading rates of 8 MPa/min and 2.3 MPa/min, the observation window exhibits its maximum and minimum axial displacements, respectively. Specifically, the axial displacement at 8 MPa/min is 7.2213 mm, while at 2.3 MPa/min, it is 6.9279 mm. The axial displacement of 4.5 MPa/min is 7.1107 mm, and the axial displacement of 6 MPa/min is 7.1554 mm. Therefore, in the finite element simulation calculation of the observation window, the loading rate should not be too fast during the pressurization process, otherwise it is not conducive to the creep strain and displacement release of the observation window in the high-pressure environment.

4.5. Effect of Friction Coefficient on Creep of Frustum Observation Window

Under the influence of deep-sea pressure, variations in the friction coefficient at the contact surface between the observation window and the window seat can impact the stress and deformation of the observation window. Six groups were taken between the friction coefficient of [0.001~0.3], which were 0.05, 0.1, 0.15, 0.2, 0.25, and 0.3, respectively. The finite element model parameters for the observation window in this section, based on the analysis of the aforementioned loading rate, are specified as follows: the observation window’s mesh size is 5 mm, the window seat’s mesh size is 15 mm, the temperature is set at 30 °C, and the loading rate is 4.5 MPa/min. The calculation employs the improved time-hardening creep model subroutine. Figure 19 reveals notable variations in the maximum stress at the center of the inner surface of the observation window during the loading stage prior to creep. Specifically, when the friction coefficient is 0.05, the maximum stress is 17.0423 MPa, whereas it increases to 55.5423 MPa with a friction coefficient of 0.3. Following creep, the maximum stress in the observation window decreases with an increase in the friction coefficient, and the stress gradually stabilizes over time. It can be seen from Figure 20 that before and after the creep of the observation window, the y-axis displacement at the center of the lower surface decreases with an increase in the friction coefficient of the contact surface, and the axial displacement of the observation window after creep is greater than that before creep. The maximum axial displacement is 7.7638 mm when the friction coefficient is 0.05, and the minimum axial displacement is 6.0814 mm when the friction coefficient is 0.3. As illustrated in Figure 21, the strain at the center of the inner surface of the observation window progressively increases with an elevation in the friction coefficient. When the friction coefficient is 0.05, the maximum strain is 0.0053; when the friction coefficient is 0.1, the maximum strain is 0.0071; when the friction coefficient is 0.15, the maximum strain is 0.0099; when the friction coefficient is 0.2, the maximum strain is 0.0131; when the friction coefficient is 0.25, the maximum strain is 0.0157; and when the friction coefficient is 0.3, the maximum strain is 0.0174. In summary, an elevation in the friction coefficient on the contact surface of the observation window leads to increased adhesion, resulting in a reduction in the creep displacement of the viewport window. Notably, both stress and strain at the center of the inner surface of the observation window show an upward trend with an increase in the friction coefficient, eventually stabilizing. Consequently, for the finite element simulation of the observation window, a friction coefficient of 0.1 is recommended. It is advisable to appropriately lubricate the contact surface during installation to mitigate potential safety hazards.

4.6. The Influence of Friction Coefficient Coupling Pressure at Changing Temperature

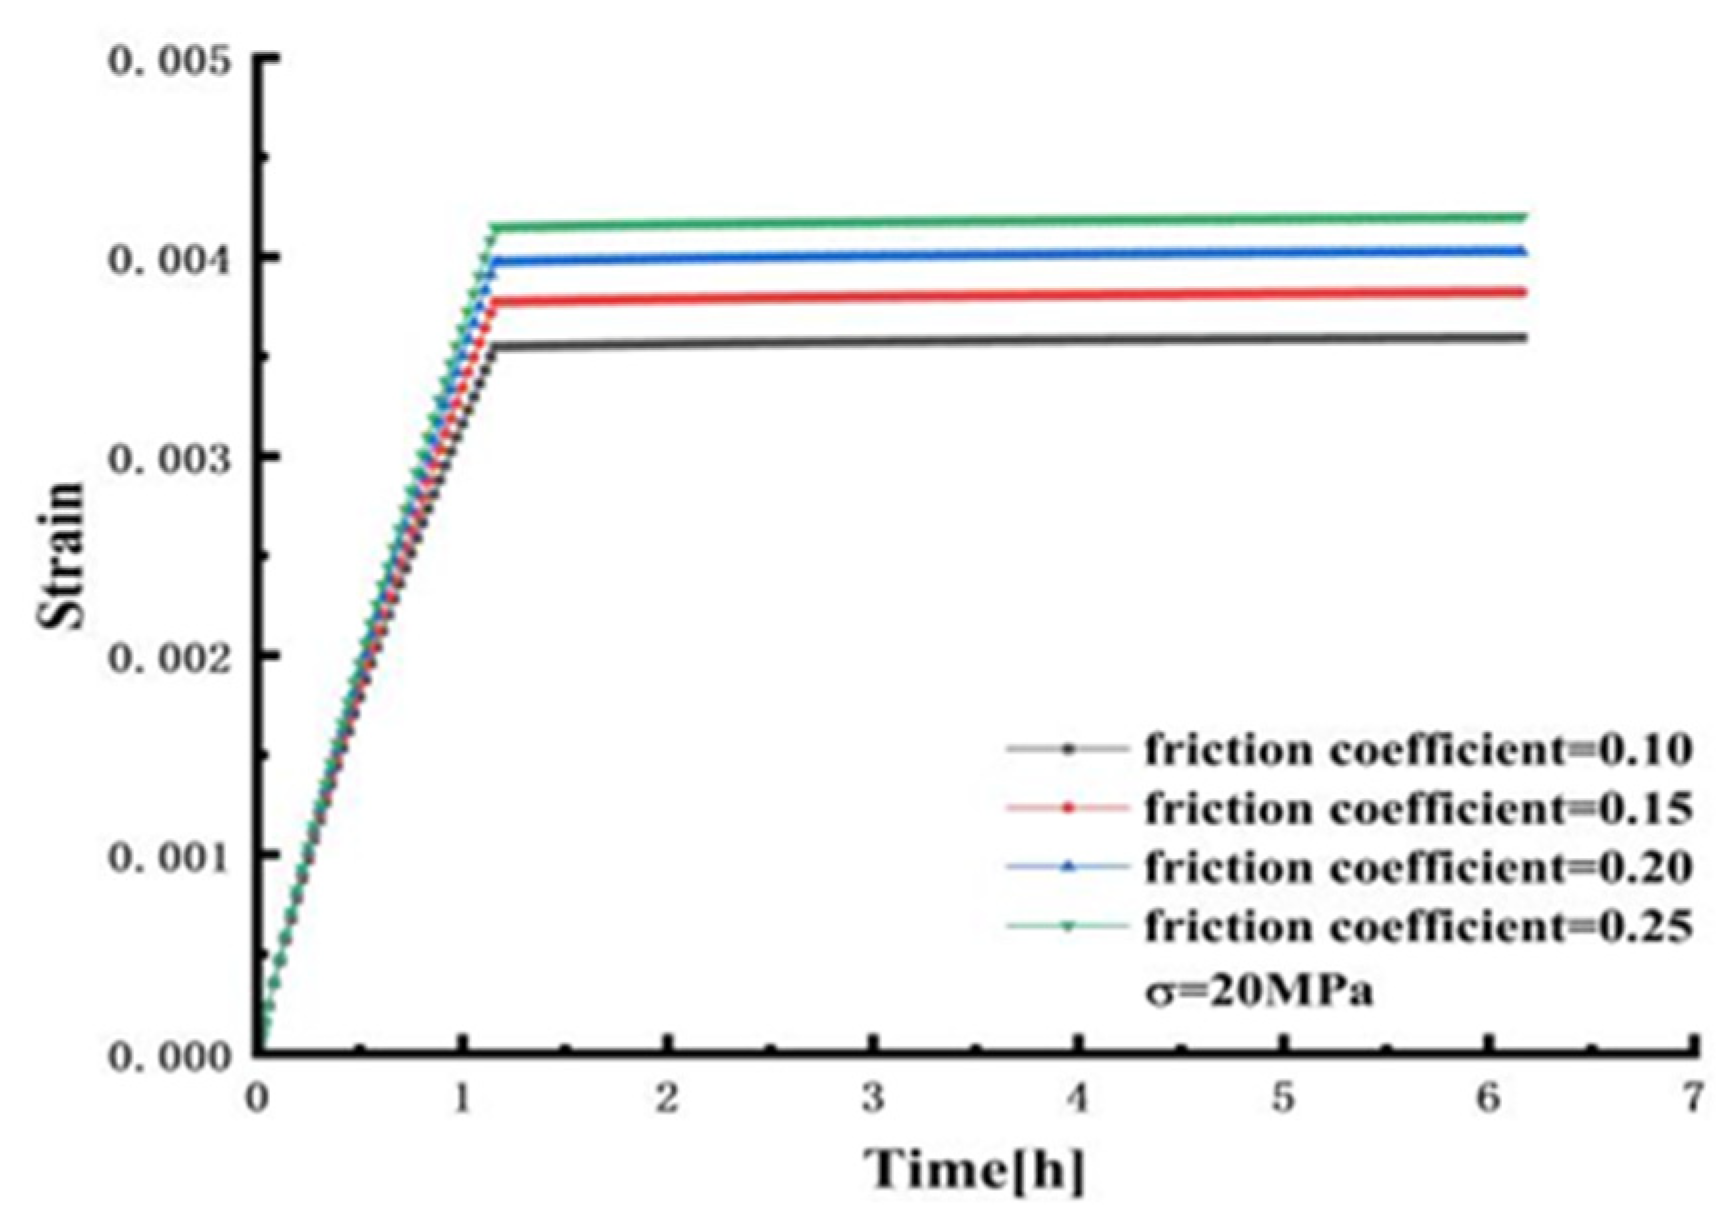
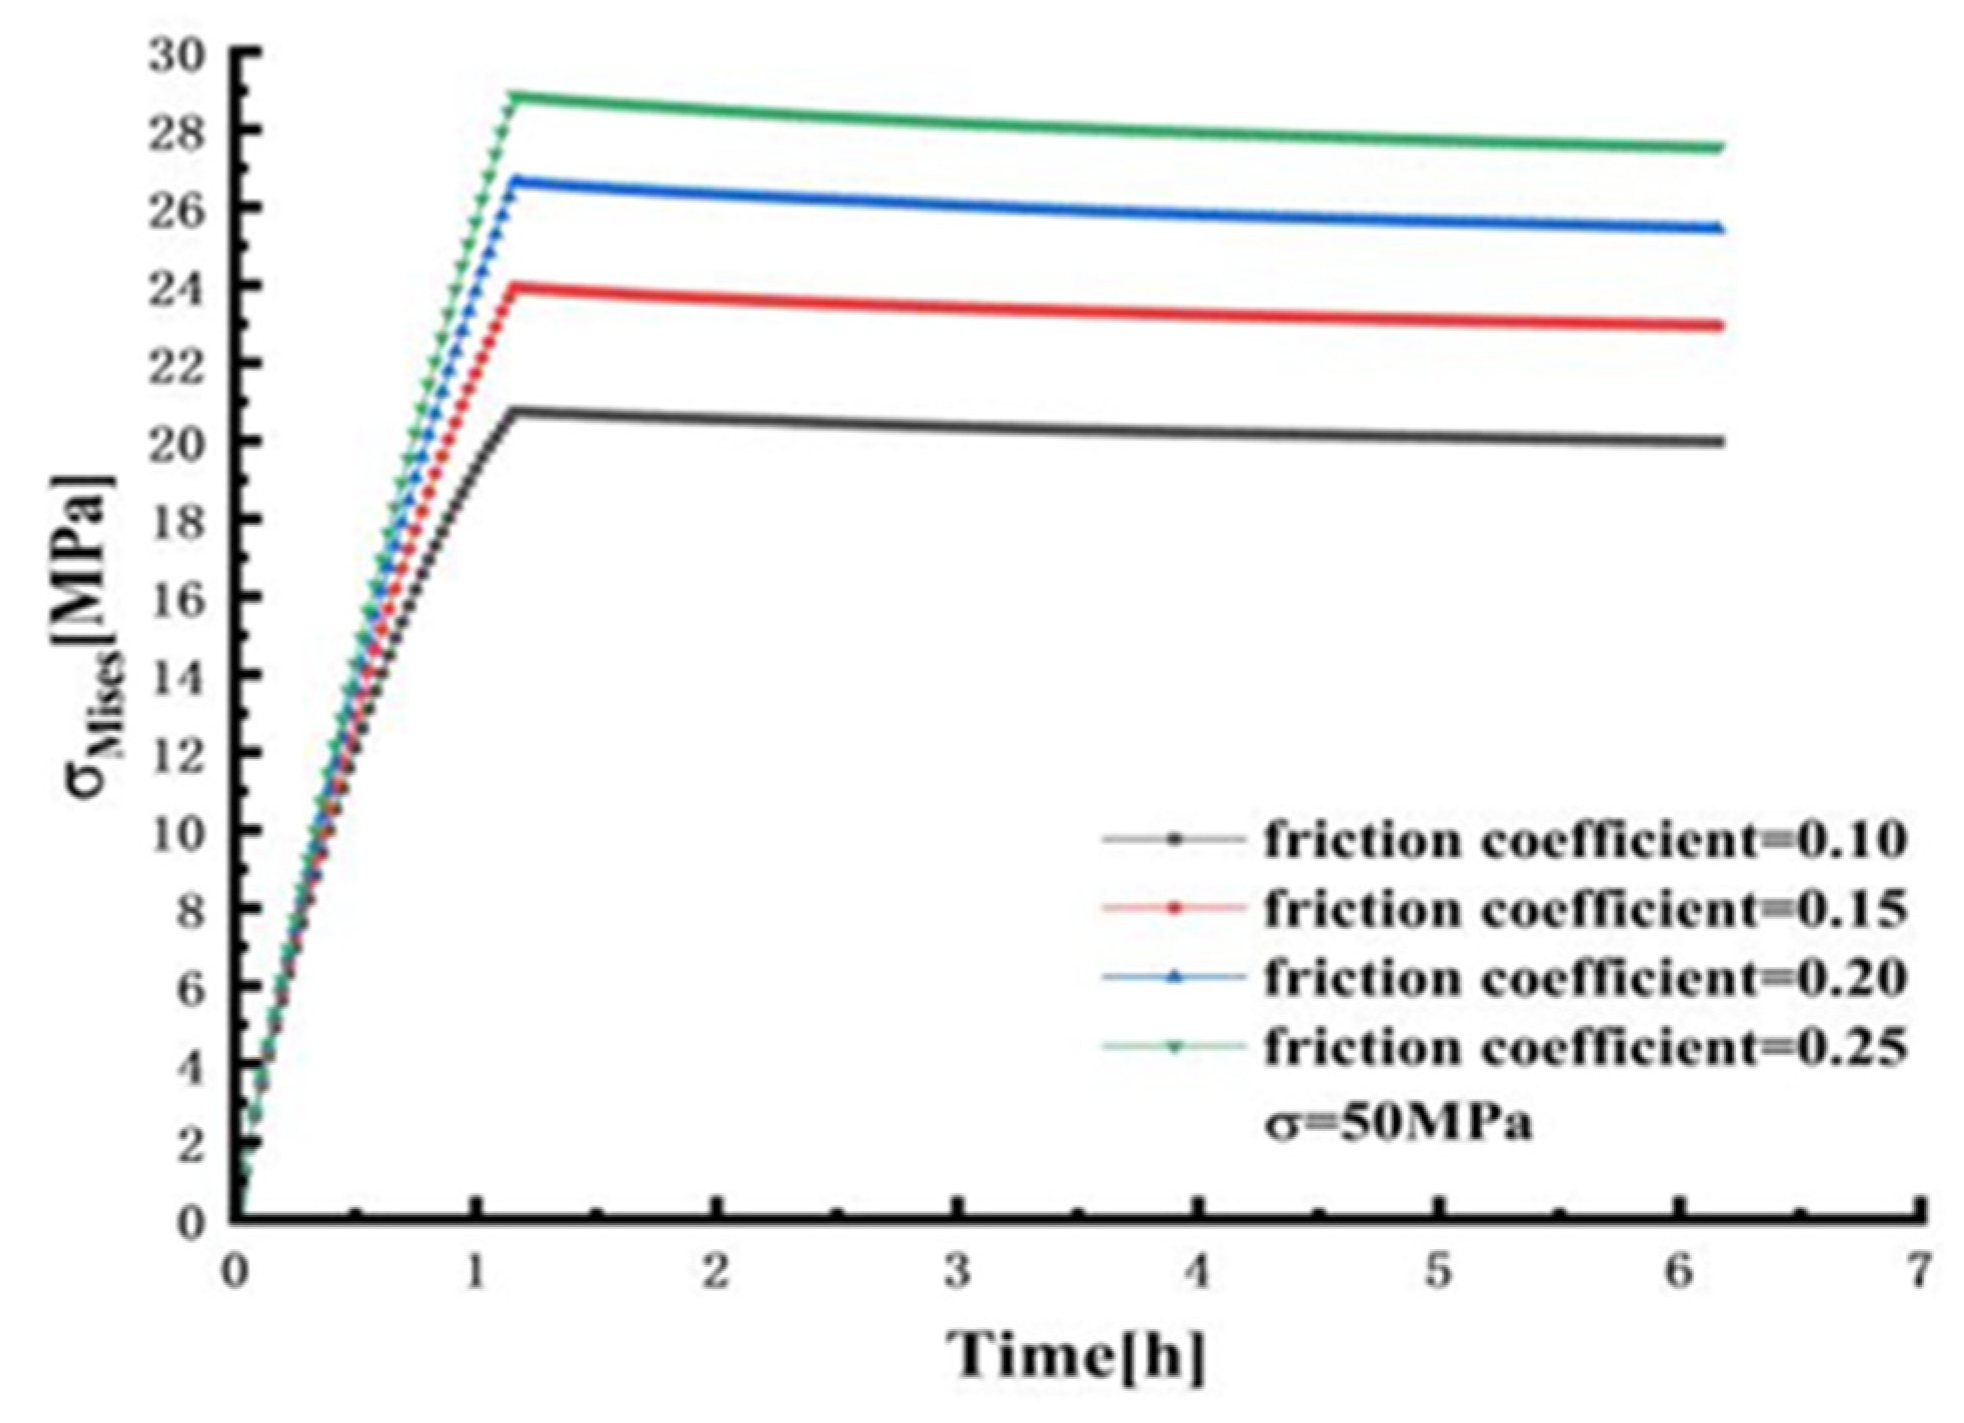
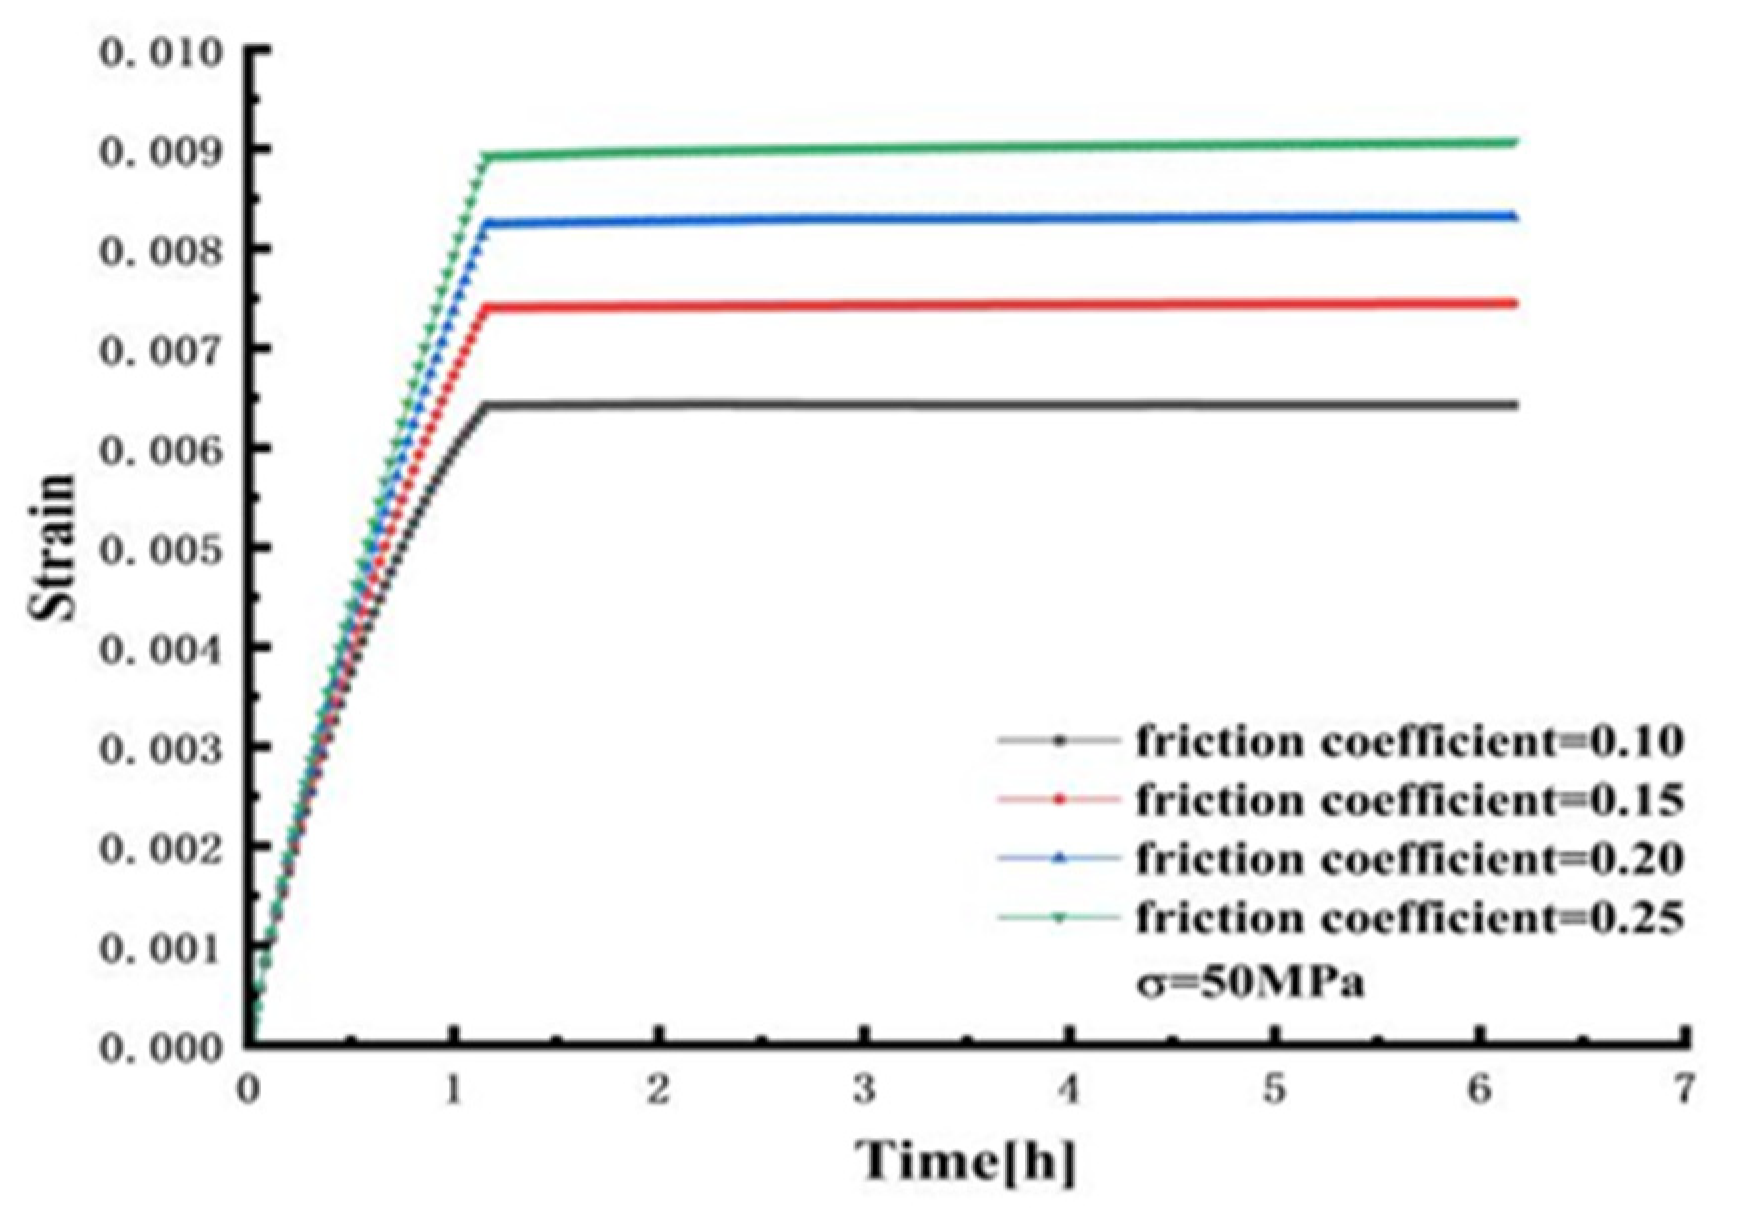
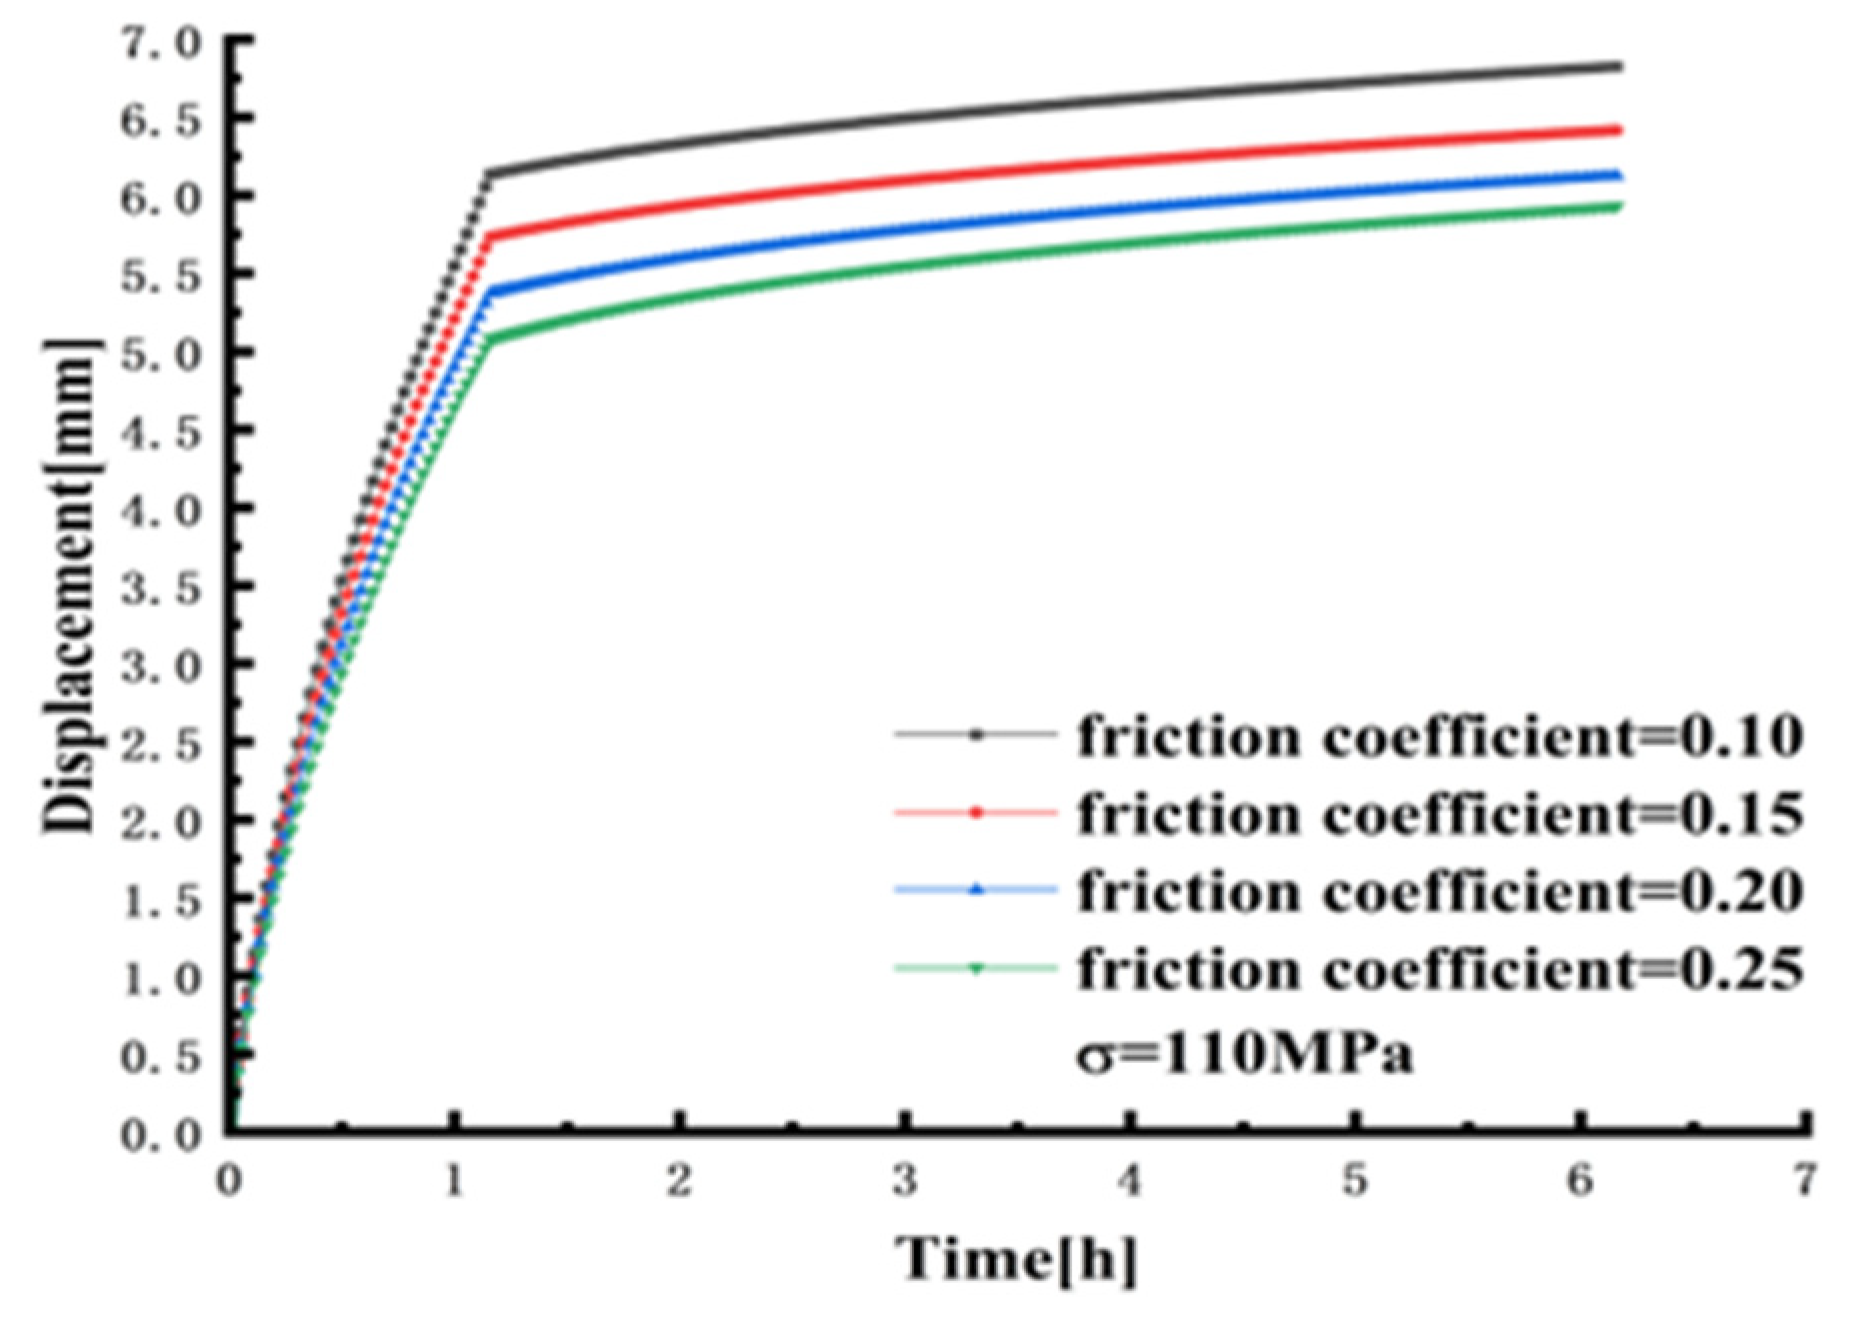
To investigate the performance of PMMA observation windows under diverse friction coefficients, pressures, and temperatures, the following simulation calculations are conducted. In order to fully consider the simulation of the actual situation, the pressure levels on the observation window at depths of 2000 m, 5000 m, 8000 m, and 11,000 m in deep water (20 MPa, 50 MPa, 80 MPa, and 110 MPa, respectively) are considered. The temperature range is 30 °C in the loading stage and 30~2 °C in the holding stage. The friction coefficients between the observation window and the window seat are taken as 0.1, 0.15, 0.2, and 0.25, respectively. As depicted in Figure 22, Figure 23, Figure 24, Figure 25, Figure 26, Figure 27, Figure 28, Figure 29, Figure 30, Figure 31, Figure 32 and Figure 33, a clear trend emerges. The stress and strain on the observation window increase with the rising friction coefficients across different pressure levels (20 MPa, 50 MPa, 80 MPa, and 110 MPa). Concurrently, the axial displacement at the center of the lower surface gradually decreases as the friction coefficient increases. Under the pressure of 20 MPa, the maximum stress is 13.4164 MPa, the maximum strain is 0.0042, and the maximum displacement is 1.9345 mm. Under the pressure of 50 MPa, the maximum stress is 28.8726 MPa, the maximum strain is 0.0091, and the maximum displacement is 3.8151 mm. The maximum stress under an 80 MPa pressure and different friction coefficients is 41.0237 MPa, the maximum strain is 0.0127, and the maximum displacement is 5.2905 mm. Under a 110 MPa pressure and various friction coefficients, the maximum stress recorded is 49.5571 MPa, the maximum strain reaches 0.0153, and the maximum displacement is measured at 6.8233 mm. Considering the diverse operational conditions and environmental fluctuations, it is advisable to apply proper lubrication to the contact surface during installation. This precautionary measure helps mitigate safety hazards effectively.

5. Summary and Conclusions

The manned submersible consists of a variety of mechanical components and structural types. The observation window plays a very important role as a component that provides a field of view. Investigating the structure and optimizing the design of the observation window is crucial to ensuring the manned submersible can effectively fulfill its role in deep-sea exploration. This paper focuses on studying the creep characteristics of the observation window structure in manned submersibles using the finite element method. The frustum observation window structure undergoes various parametric analyses utilizing the improved time-hardening creep model. Summary and conclusions can be made as follows:
(1)
According to the experimental data at different temperatures, the improved time-hardening creep model is verified to be in good agreement with the experimental data.
(2)
The mesh convergence of the observation window and the window seat is analyzed. The different mesh sizes have little effect on the axial displacement. The mesh size of the observation window is 5 mm, and the mesh size of the window seat is 15 mm.
(3)
The UMAT program is written by the improved time-hardening creep model, and the observation window test data are verified. The curve and the test data are well fitted.
(4)
The creep behavior of the observation window considering four temperature changes is analyzed. Under the condition of four kinds of temperature changes, the y-axis displacement difference between 30 °C and 2 °C is the largest in the stage of the maintaining load. The maximum axial displacement at 30 °C is 7.1103 mm, and the minimum axial displacement at 2 °C is 6.5329 mm. The axial displacements of the other two temperature ranges are 6.7667 mm and 6.7532 mm, respectively. As the temperature increases, the total displacement increases, indicating that the temperature effect has a significant effect on the observation window.
(5)
The parametric analysis of different loading rates of the observation window was carried out. Under the loading rate of 8 MPa/min and 2.3 MPa/min, the y-axis displacement of the observation window is the largest and the smallest respectively. The y-axis displacement of 8 MPa/min is 7.2213 mm, and the axial displacement of 2.3 MPa/min is 6.9279 mm. As the loading rate continues to increase, the displacement at the center of the lower surface of the observation window continues to increase. However, the stress and strain decrease with the increase of the loading rate of the observation window.
(6)
The parametric analysis of the different friction coefficients of the observation window was carried out. As the friction coefficient increases, the stress and strain at the center of the inner surface of the observation window gradually increase. However, the y-axis displacement at the center of the inner surface gradually decreases with the increase in the friction coefficient. When the friction coefficient (0.05) is the smallest, the y-axis displacement at the center of the lower surface of the observation window is the largest, and the displacement is 7.7638 mm. When the friction coefficient (0.3) is the largest, the y-axis displacement at the center of the lower surface of the observation window is the smallest, and the displacement is 6.0814 mm.
(7)
The performance of the PMMA observation window under different friction coefficients, pressures, and temperatures was studied and simulated. The results show that the stress and strain on the observation window increase with the increase in the friction coefficient under different pressure levels. At the same time, the axial displacement at the center of the lower surface gradually decreases with the increase in the friction coefficient.

Author Contributions

Methodology, F.W.; Software, Z.H.; Validation, H.W.; Formal analysis, Z.H. and H.W.; Investigation, Z.H. and F.W.; Data curation, Z.H., H.W. and B.Z.; Writing—original draft, Z.H.; Writing—review & editing, F.W.; Supervision, F.W.; Project administration, F.W.; Funding acquisition, F.W. All authors have read and agreed to the published version of the manuscript.

Funding

The National Natural Science Foundation of China (Grant No. 52071203) and the National Key Research and Development Program of China (Grand No. 2021YFC2800600).

Data Availability Statement

Relevant data can be requested from the corresponding author if readers need it.

Acknowledgments

And the authors would like to express their gratitude for the support of the Fishery Engineering and Equipment Innovation Team of Shanghai High-Level Local University.

Conflicts of Interest

The authors declare no conflict of interest.

References

  1. Wang, F.; Cui, W.C. Experimental investigation on dwell-fatigue property of Ti-6Al-4V ELI used in deep-sea manned cabin. Mater. Sci. Eng. A 2015, 642, 136–141. [Google Scholar] [CrossRef]
  2. Lin, G.J.; Zhang, W.M.; Feng, Y.L. Review of the research on the observation window of manned submersible. Ship Eng. 2013, 3, 1–5+75. (In Chinese) [Google Scholar]
  3. Stachiw, J.D. Conical acrylic windows under long term hydrostatic pressure of 20,000 psi. J. Eng. Ind. 1970, 92, 237–256. [Google Scholar] [CrossRef]
  4. Stachiw, J.D. Conical Acrylic Windows Under Long Term Hydrostatic Pressure of 10,000 psi. J. Eng. Ind. 1972, 94, 1053–1059. [Google Scholar] [CrossRef]
  5. Stachiw, J.D. Conical Acrylic Windows Under Long-Term Hydrostatic Pressure of 5000 psi. J. Eng. Ind. 1972, 94, 843–848. [Google Scholar] [CrossRef]
  6. Stachiw, J.D. Handbook of Acrylics for Submersibles, Hyperbaric Chambers and Aquaria; Best Publishing: Flagstaff, AZ, USA, 2003. [Google Scholar]
  7. Vakili-Tahami, F.; Adibeig, M.R. Using developed creep constitutive model for optimum design of HDPE pipes. Polym. Test. 2017, 63, 392–397. [Google Scholar] [CrossRef]
  8. Vakili-Tahami, F.; Adibeig, M.R.; Hassanifard, S. Optimizing creep lifetime of friction stir welded PMMA pipes subjected to combined loadings using rheological model. Polym. Test. 2019, 79, 106049. [Google Scholar] [CrossRef]
  9. Gao, Z.Z.; Liu, W.; Liu, Z.Q.; Yue, Z.F. Experiment and Simulation Study on the Creep Behavior of PMMA at Different Temperatures. Polym.-Plast. Technol. Eng. 2010, 49, 1478–1482. [Google Scholar] [CrossRef]
  10. Adibeig, M.R.; Hassanifard, S.; Vakili-Tahami, F. Optimum creep lifetime of Polymethyl Methacrylate (PMMA) tube using rheological creep constitutive models based on experimental data. Polym. Test. 2019, 75, 107–116. [Google Scholar] [CrossRef]
  11. Khan, F.; Yeakle, C. Experimental investigation and modeling of non-monotonic creep behavior in polymers. Int. J. Plast. 2011, 27, 512–521. [Google Scholar] [CrossRef]
  12. Wang, Y.Y. Research on Fatigue Reliability of Manned Cabin of Full Ocean Depth Submersibles; China Ship Scientific Research Center: Wuxi, China, 2017. (In Chinese) [Google Scholar]
  13. Tian, C.L.; Hu, Y.; Liu, D.Q. Creep analysis on deep-sea structure’s viewport windows. Ship Mech. 2010, 14, 526–532. (In Chinese) [Google Scholar]
  14. Du, Q.H.; Hu, Y.; Cui, W.C. Safety assessment of the acrylic conical frustum viewport structure for a deep-sea manned submersible. Ships Offshore Struct. 2017, 12 (Suppl. S1), S221–S229. [Google Scholar] [CrossRef]
  15. Pranesh, S.B.; Kumar, D.; Anantha Subramanian, V.; Sathianarayanan, D.; Ramadass, G.A. Structural analysis of spherical pressure hull viewport for manned submersibles using biological growth method. Ships Offshore Struct. 2018, 13, 601–616. [Google Scholar]
  16. Yue, K.; Tian, C.L. Stress analysis method and comparison of different angle of the view-port windows of the deep-sea vehicle. Jiangnan Univ. (Natl. Sci. Ed.) 2011, 5, 015. (In Chinese) [Google Scholar]
  17. Yue, K.; Tian, C.L. Stress analysis of deep-sea view-port windows and its optimization. Jiangnan Univ. (Natl. Sci. Ed.) 2011, 1, 014. (In Chinese) [Google Scholar]
  18. Pranesh, S.B.; Kumar, D.; Anantha Subramanian, V.; Sathianarayanan, D.; Ramadass, G.A. Numerical and experimental study on the safety of viewport window in a deep sea manned submersible. Ships Offshore Struct. 2020, 15, 769–779. [Google Scholar] [CrossRef]
  19. Liu, P.F.; Li, J.X.; Wang, S.B.; Leng, J.X. Finite element analysis of viscoelastic creep behaviors of deep-sea manned submersible viewport windows. Int. J. Press. Vessel. Pip. 2020, 188, 104218. [Google Scholar] [CrossRef]
  20. Li, J.X.; Liu, P.F.; Tong, X.Y. A simplified method for studying cyclic creep behaviors of deep-sea manned submersible viewport windows. Int. J. Press. Vessel. Pip. 2021, 194, 104565. [Google Scholar] [CrossRef]
  21. Du, Q.H.; Jiang, H.G.; Hu, X.K. Creep behavior analysis of conical observation window for human occupied vehicle based on ABAQUS. J. Ship Res. 2022, 17, 108–116. (In Chinese) [Google Scholar]
  22. Wang, F.; Wang, W.W.; Cui, W.C. Effect of temperature and nonlinearity of PMMA material in the design of observation windows for a full ocean depth manned submersible. Mar. Technol. Soc. J. 2019, 53, 27–36. [Google Scholar] [CrossRef]
  23. Chen, W.; Gu, P.; Zhang, A.F. Study on viewport creep characteristics based on compression creep test. J. Ship Mech. 2021, 25, 73–79. (In Chinese) [Google Scholar]
  24. ASME PVHO-1; Safety Standard for Pressure Vessels for Human Occupancy: In-Service Guidelines. American Society of Mechanical Engineers: New York, NY, USA, 2016.
  25. Mu, X.Y. Creep Mechanics; Xi’an Jiaotong University Press: Xi’an, China, 1990; pp. 11–16. (In Chinese) [Google Scholar]
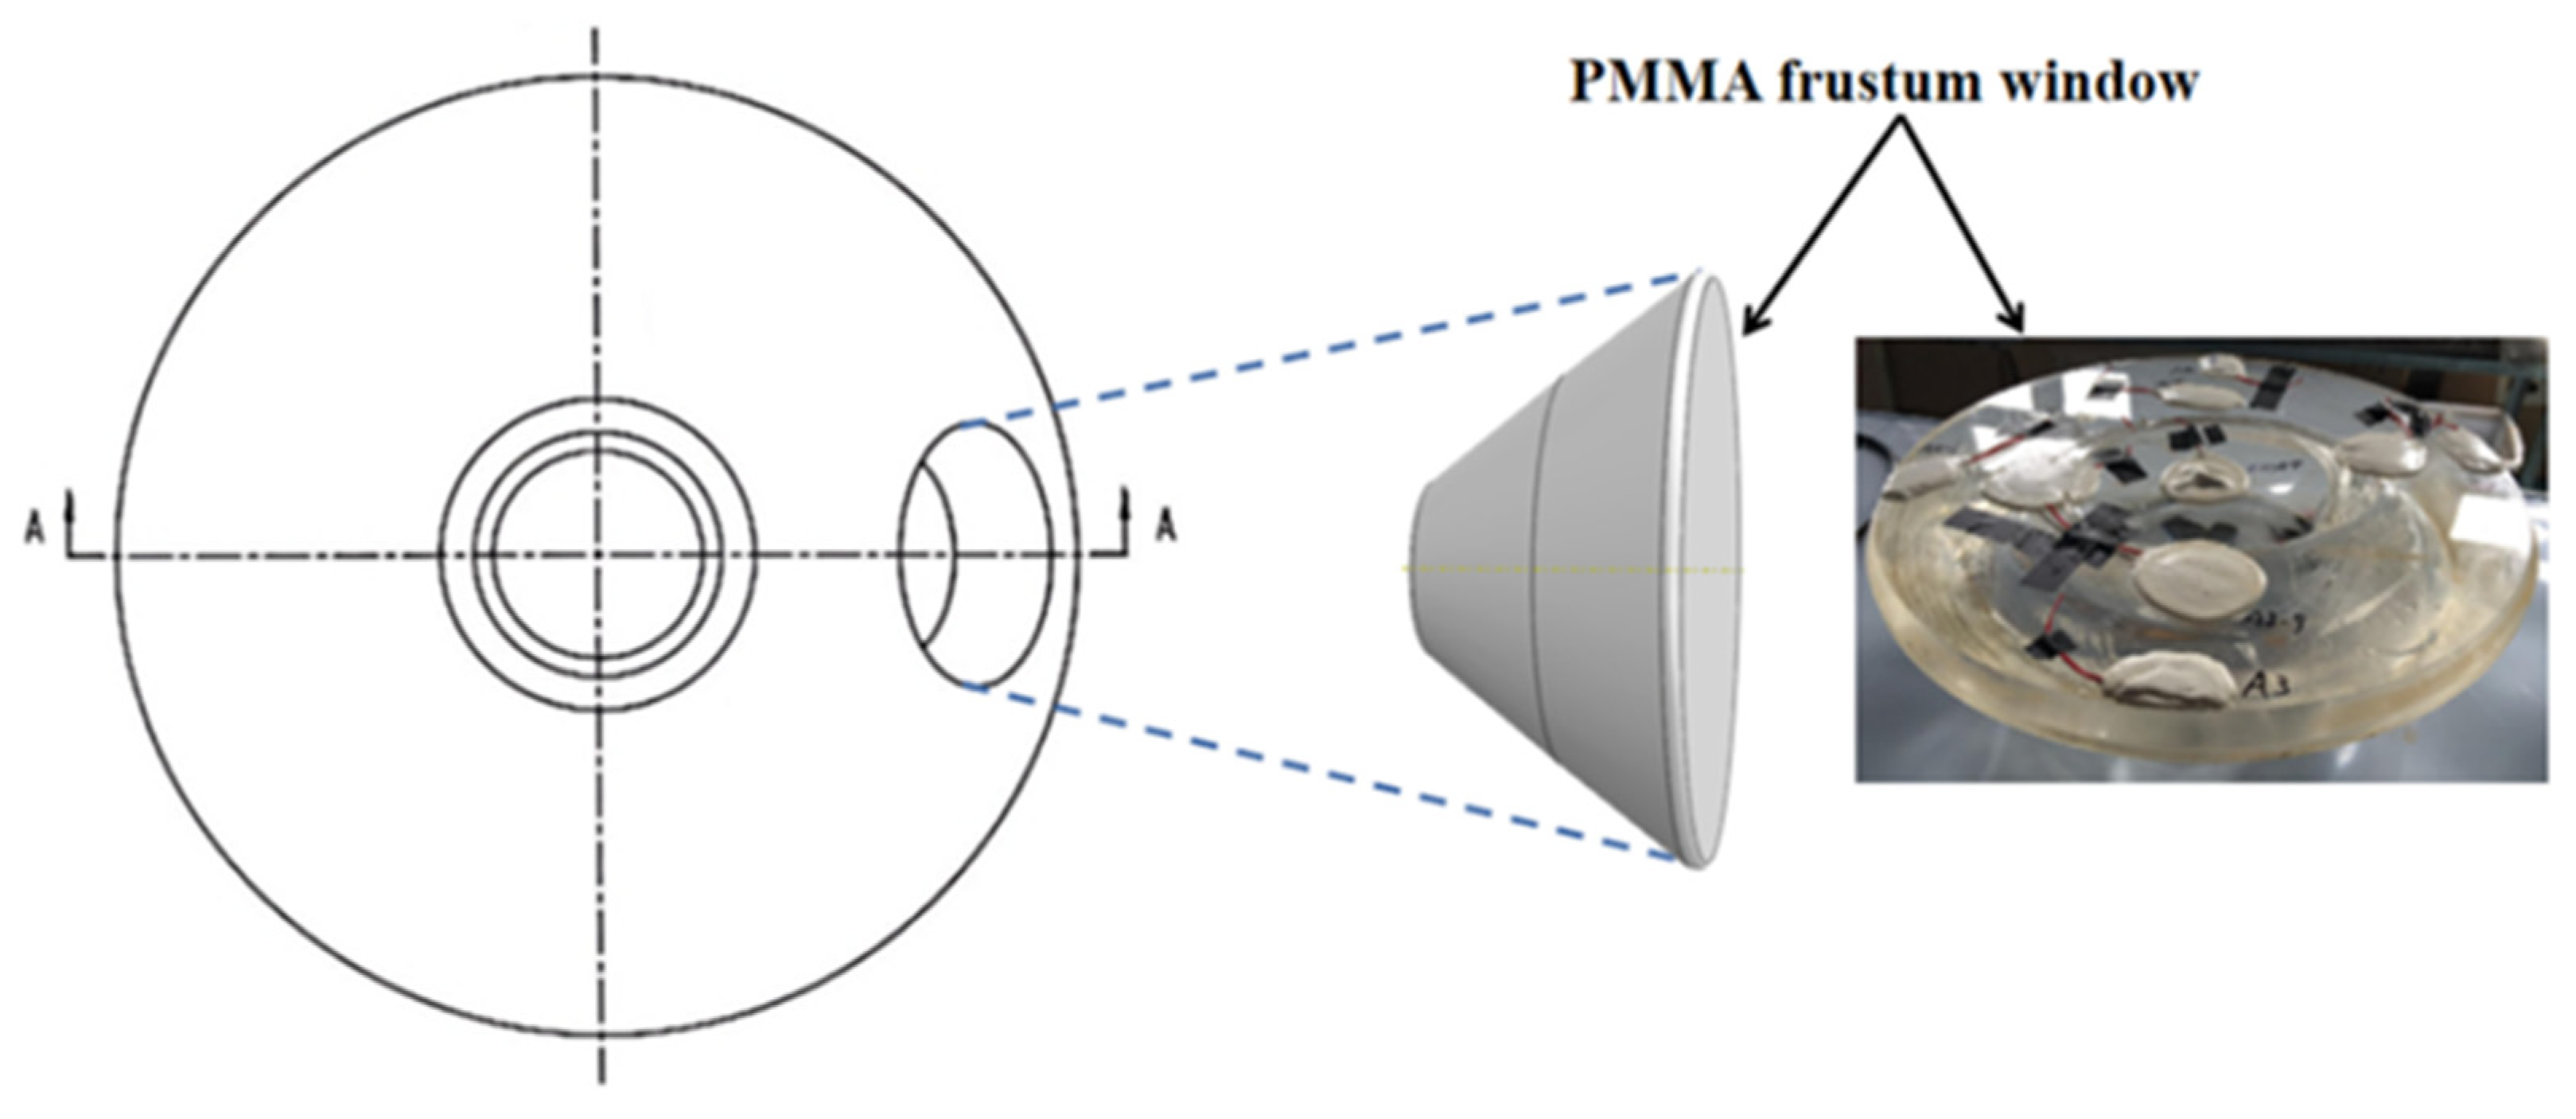
Figure 1. The observation window of deep-sea manned cabin.
Applsci 14 01040 g001
Figure 2. Basic structural parameters of frustum observation window.
Applsci 14 01040 g002
Figure 3. Modified time hardening model fitting for the creep curve of PMMA.
Applsci 14 01040 g003
Figure 4. Two-dimensional geometric model of the window.
Applsci 14 01040 g004
Figure 5. (a) Mesh division of the observation window. (b) The contact definition and interaction relationship of the observation window. (c) Boundary conditions and loading.
Applsci 14 01040 g005
Figure 6. Mesh convergence analysis of the observation window.
Applsci 14 01040 g006
Figure 7. Mesh convergence analysis of the window seat.
Applsci 14 01040 g007
Figure 8. Location of sensors in the observation window.
Applsci 14 01040 g008
Figure 9. Model test data and finite element simulation data. (a) Data of outer surface. (b) Data of inner surface.
Applsci 14 01040 g009
Figure 10. Environment temperature versus seawater depth.
Applsci 14 01040 g010
Figure 11. The impact of temperature on the axial displacement of the observation window.
Applsci 14 01040 g011
Figure 12. Loading stage (2~30 °C), maintaining stage (30 °C): (a) Stress cloud before creep; (b) Stress cloud after creep; (c) Displacement (mm) cloud before creep; (d) Displacement (mm) cloud after creep; (e) Strain cloud before creep; (f) Strain cloud after creep.
Applsci 14 01040 g012aApplsci 14 01040 g012b
Figure 13. Loading stage (30~2 °C), maintaining stage (2 °C): (a) Stress cloud before creep; (b) Stress cloud after creep; (c) Displacement (mm) cloud before creep; (d) Displacement (mm) cloud after creep; (e) Strain cloud before creep; (f) Strain cloud after creep.
Applsci 14 01040 g013aApplsci 14 01040 g013b
Figure 14. Loading stage (2 °C), maintaining stage (2~30 °C): (a) Stress cloud before creep; (b) Stress cloud after creep; (c) Displacement (mm) cloud before creep; (d) Displacement (mm) cloud after creep; (e) Strain cloud before creep; (f) Strain cloud after creep.
Applsci 14 01040 g014
Figure 15. Loading stage (30 °C), maintaining stage (30~2 °C): (a) Stress cloud before creep; (b) Stress cloud after creep; (c) Displacement (mm) cloud before creep; (d) Displacement (mm) cloud after creep; (e) Strain cloud before creep; (f) Strain cloud after creep.
Applsci 14 01040 g015
Figure 16. The stress change curve at the center of the inner surface at different stress rates.
Applsci 14 01040 g016
Figure 17. The displacement curves at the center of the inner surface under different stress rates.
Applsci 14 01040 g017
Figure 18. The strain curves at the center of the inner surface at different stress rates.
Applsci 14 01040 g018
Figure 19. The variation curve of observation window stress with friction coefficient.
Applsci 14 01040 g019
Figure 20. The variation curve of observation window displacement with friction coefficient.
Applsci 14 01040 g020
Figure 21. The variation curve of observation window strain with friction coefficient.
Applsci 14 01040 g021
Figure 22. The variation curve of the stress of the observation window with the friction coefficient at the pressure level of 20 MPa.
Applsci 14 01040 g022
Figure 23. The variation curve of the displacement of the observation window with the friction coefficient at the pressure level of 20 MPa.
Applsci 14 01040 g023
Figure 24. The variation curve of the strain of the observation window with the friction coefficient at the pressure level of 20 MPa.
Applsci 14 01040 g024
Figure 25. The variation curve of the stress of the observation window with the friction coefficient at the pressure level of 50 MPa.
Applsci 14 01040 g025
Figure 26. The variation curve of the displacement of the observation window with the friction coefficient at the pressure level of 50 MPa.
Applsci 14 01040 g026
Figure 27. The variation curve of the strain of the observation window with the friction coefficient at the pressure level of 50 MPa.
Applsci 14 01040 g027
Figure 28. The variation curve of the stress of the observation window with the friction coefficient at the pressure level of 80 MPa.
Applsci 14 01040 g028
Figure 29. The variation curve of the displacement of the observation window with the friction coefficient at the pressure level of 80 MPa.
Applsci 14 01040 g029
Figure 30. The variation curve of the strain of the observation window with the friction coefficient at the pressure level of 80 MPa.
Applsci 14 01040 g030
Figure 31. The variation curve of the stress of the observation window with the friction coefficient at the pressure level of 110 MPa.
Applsci 14 01040 g031
Figure 32. The variation curve of the displacement of the observation window with the friction coefficient at the pressure level of 110 MPa.
Applsci 14 01040 g032
Figure 33. The variation curve of the strain of the observation window with the friction coefficient at the pressure level of 110 MPa.
Applsci 14 01040 g033
Table 1. Material properties of PMMA.
Material PropertyValue
Elastic Modulus, E/MPa2740
Density, ρ/kg·m−31190
Poisson’s ratio, u0.38
Compressive yield strength, σs/MPa115
Table 2. Material parameters of the improved time-hardening creep model of PMMA.
a1b1c1d1k1
9.7522 × 10⁻¹¹−8.8688 × 10−82.6692 × 10−5−2.6576 × 10−36.5806 × 10−9
a2b2c2k2
4.7402 × 10⁻⁴−2.6192 × 10−13.4994 × 1013.1974 × 10−3
Table 3. The finite element simulation results corresponding to different meshes of the observation window.
Mesh Size (mm)Element NumberDisplacement (mm)Relative Error
126,5166.93462.5%
264226.95882.1%
328886.99321.7%
416186.96882.0%
510597.1107-
67287.09310.2%
84006.95152.2%
Table 4. The finite element simulation results corresponding to different meshes of the window seat.
Mesh Size (mm)Element NumberDisplacement (mm)Relative Error
101987.11210.0197%
121447.11080.0014%
141097.11110.0056%
15907.1107-
16757.11080.0014%
18557.11090.0028%
20467.11100.0042%
Table 5. Environment temperature in seawater.
Working DepthTemperature/°C
SpringSummerAutumnWinter
0 m→500 m24302827
500 m→1000 m81098
1000 m→3500 m4.5654.5
3500 m→11,000 m2222
Disclaimer/Publisher’s Note: The statements, opinions and data contained in all publications are solely those of the individual author(s) and contributor(s) and not of MDPI and/or the editor(s). MDPI and/or the editor(s) disclaim responsibility for any injury to people or property resulting from any ideas, methods, instructions or products referred to in the content.