Abstract
Although the modern education system is highly developed, educators have never stopped looking for new ways to improve it. After entering the 21st century, more and more educational data are stored, and data mining techniques have developed rapidly. Educational data mining has become a hot topic for educators who want to discover the information hiding among educational data. As a sub-branch of educational data mining, student performance prediction aims to predict student performance based on student datasets. This research attempts to improve the performance of predictive algorithms on a 5-level student performance grading system. This research changes the prediction method from a classification approach to a regression approach and enlarges small datasets with synthetic data. Algorithms including Support Vector Machine (SVM), Random Forest (RF), Neural Network (NN), and Generative Adversarial Networks (GANs) are used in this research. From the results obtained, it is concluded that the regression approach outperforms the classification approach in predicting student performance. The classification approach is currently widely used in student performance prediction. This research also explores the possibility of using synthetic student data to augment small educational datasets. The course and evaluation system differ among different regions, making student data hard to collect or merge. Augmenting small student datasets with synthetic data may help educators to better evaluate their teaching skills. This research shows that a regression approach using synthetic data improves the prediction accuracy by up to 21.9%, 15.6%, and 6.6%, respectively, using SVM, NN, and RF.
1. Introduction
As the key not only to individual success but also to the development and prosperity of a society, the education system is so important that educators have never stopped looking for new ways to improve it. With the development of technology and society, education now covers more subjects and is available to everyone. Apart from attending schools and offline educational institutions, more and more students choose to take online courses. During the global COVID-19 pandemic, by April 2020, about 1.3 billion learners, representing 81.8% of the total enrolled learners around the world, were affected by school closures [1], and many of them had to take online courses to finish their education. According to the National Center for Education Statistics (U.S.) [2], in 2021, 11.2 million students took at least one online course, covering about 60% of college students in the U.S.
Unlike traditional face-to-face teaching, online teachers cannot receive as much of a response from their students as they could when teaching offline. For example, student interactions such as eye contact become unavailable to teachers when teaching online. The difference between online and offline courses can greatly affect a teacher’s teaching ability. For teachers to teach students more effectively, new pedagogical tools are needed to adapt to the new educational environment.
Data Mining (DM), also known as knowledge discovery in databases, is an interdisciplinary sub-field of computer science and statistics, which inspects, cleanses, reformats, and models data to find out implicit but useful information behind the data [3,4,5]. Unlike traditional data analysis that focuses on using statistical methods, DM combines computational methods like Machine Learning (ML) to discover the information that might be ignored or go unnoticed by traditional methods. DM has been successful in various fields, including business and economics. A huge amount of educational data is now stored by both offline educational institutions and online course providers, which is like a gold mine to DM. Discovering useful information hidden in educational data could greatly help teachers better understand their students and their teaching process. The application of data mining techniques to educational databases is called Educational Data Mining (EDM). Student performance prediction is a branch of EDM that predicts student performance based on collected information (family educational background, health condition, time spent on coursework, previous performance, etc.). By predicting student performance, teachers can adjust their teaching plan in time to avoid unnecessary failures and make plans according to each student’s condition.
In practice, although there is a huge amount of educational data stored all over the world, it is still hard for educators to obtain access to large educational datasets. Different schools have different course settings, making it almost impossible to merge datasets from different schools. Furthermore, because student datasets contain sensitive information, they are usually not accessible to outsiders. In this situation, the performance of DM techniques that prefer large datasets, such as NNs, is limited.
In 2008, Paulo Cortez from the University of Minho carried out a study using DM techniques to predict the performance of secondary school students in Portuguese and Mathematics [6]. As stated in the research, Portugal was facing a high student failure and drop-out rate at that time. This issue is also a concern for many other countries facing a shortage of educational resources. In addition, countries that do not use English as a primary language may also face the difficulty of learning from English-based course settings. Therefore, the use of a Portuguese educational dataset is considered meaningful. In Paulo’s research, SVM, RF, and NN are used to predict student performance on a 2-level grading scale (pass/fail) and a 5-level grading scale (from 1 to 5). Paulo’s research reported good predictive accuracy on the 2-level grading scale but relatively not ideal on the 5-level grading scale, as shown in Table 1. Nowadays, students are often required to possess more than just the minimum requirements to gain admission to reputable schools or companies. It is believed that more detailed predictions, such as 5-level prediction, can help students achieve greater success. This research improves prediction performance on the 5-level grading scale by using a regression approach instead of a classification approach. This research also shows the possibility of using synthetic educational data to alleviate the problems caused by a small volume of datasets.

Table 1.
Performance reported by Paulo Crotez [6].
2. Related Works
Educational databases are like gold mines to educators. To better understand the meaning of the data, or to find out the relationship among various factors, educators have put a lot of effort into trying out new methods to analyze the databases. The use of data mining techniques on educational databases to extract hidden information from the data is called educational data mining. The idea of educational data mining emerged with the spread of online courses. The history of its development can be traced back to 1990s when the application of data mining to e-commerce proved to be a success [7]. As EDM is an interdisciplinary field, various methods are used by EDM researchers, including machine learning, statistics, psycho-pedagogy, information retrieval, cognitive psychology, and recommendation systems [8].
A study conducted by researchers in Singapore uses a new scoring function and model (Scoring Based on Associations [9]) to estimate a student’s probability of failing and then use the association rule to select the recommended courses for the student [10]. The retention problem of students is mentioned in Luan’s research [11]. DM techniques, including clustering, NN, and Decision Tree (DT), are used in the research to classify students, identify transfer candidates, and increase financial efficiency. Varun’s study uses GritNet to predict student performance [12]. The study uses embedded student learning activity sequences as the input. By automatically processing these data with GritNet, this research attempts to shrink the feature dimensions of the data by avoiding the use of deficient data factors. From the results reported in this research, the GritNet is expected to have an advantage in “creating a quickly adaptable but accurate metric to estimate long-term student outcomes”, which can speed up the feedback loop of student performance. A Recurrent Neural Network (RNN) is used on the Khan Academy Database to model student learning behavior in Chris’s research [11]. Compared to non-neural network methods, RNN handles continuity better. Benefiting from RNN, the research is able to perform student modeling on sequential data. According to the results reported by Chris [11], RNN shows a 25% improvement compared to Bayesian knowledge tracing using AUC (area under the curve) scoring. Among all the research on student performance prediction, a lot of researchers use classification algorithms. These researches are mostly limited to binary classification (fail/pass) [13,14]. As the number of performance levels to be predicted increases, the performance of classification algorithms becomes worse. Huda’s research [15] reports a prediction accuracy of around 52%, and Agathe’s research [16] reports an accuracy of around 65% for 5-level classification.
Current educational data mining research is facing the following difficulties:
- Unlike some Artificial Intelligence (AI) research fields, current educational data mining does not have a widely used public dataset like CIFAR-10 in computer vision. Educational databases are highly varied. Educational databases from different sources can have very different features, components, and structures. In addition, sensitive information stored in student databases, such as grade, family educational level, parents’ jobs, etc., makes student datasets accessible only to the institution that collected them. Due to the limitation of the dataset size, DM techniques that require large datasets do not perform ideally on student datasets.
- The prediction accuracy of student performance is not satisfactory when it comes to a more detailed grading system rather than just a pass or fail. However, currently, most schools do not use a pass/fail grading system to evaluate students. Students also need better performance rather than just passing in order to apply for higher education or good jobs. The possible reason is that the classification approach cannot keep the ranking relationship between different levels. Since grading systems are designed such that the higher the grade, the better the student’s performance, predicting student performance by classifying ignores the most important principle of a grading system.
To overcome the difficulties stated above, this work applies regression algorithms to focus on the ranking relationship between different levels of a grading system. This work also demonstrates the potential of data-generating methods on an educational dataset.
3. Experiment and Analysis of Results
This research builds upon Paulo Cortez’s previous work [6] and uses the same datasets. This section introduces the dataset, discusses the methods used in this experiment, and analyzes the experiment result.
3.1. Datasets and Experiment by Paulo Crotez
The datasets used in this research are collected from two secondary schools in Portugal. The datasets consist of a mathematics performance dataset with 395 pieces of student data and a Portuguese performance dataset with 649 pieces of student data. Both datasets have 33 features—3 grades in 3 periods of a semester and 30 datapoints of personal information, such as school, age, gender, family education, etc. Paulo Cortez used a naive predictor as the baseline. NN, SVM, and Random Forest (RF) are also used to predict the final performance of a student based on the collected student data. The prediction accuracy reported in the research [6] using all data features except the final grade is shown in Table 1.
Paulo’s research uses a classification approach to predict student performance. The result shows that in Paulo’s research, the prediction accuracy of a pass/fail grading system is better than a 5-level grading system, the accuracy of a pass/fail grading prediction is, on average, 21.7% higher on the mathematics dataset, and 22.1% higher on the Portuguese dataset.
3.2. Regression Approach
In Paulo’s datasets, student performance is stored as a number between 1 and 20. Then, the 5-level grading system classifies student performance into 5 levels according to Table 2, making it much more discrete than its original value.
Table 2.
The 5-level grading system design.
From the performance reported in Table 1, SVM performs the worst on 5-level grading out of all four DM methods, while RF performs better. Considering that RF is not only suitable for classification tasks but also for regression tasks [17], it is assumed that the regression approach is better than the classification approach in predicting student performance. Furthermore, predicting student performance with a 20-point grading can best reveal the student performance on a more continuous distribution. To verify the assumption that, compared to a classification approach, a regression approach is more suitable for predicting student performance, this research employs a regression approach with the same DM techniques used in Paulo’s research to compare the difference between a regression approach and a classification approach.
In the experiment of this research, NNs and RFs are trained with a 20-point grading scale. Instead of training the NNs and RFs to predict the likelihood that a student “belongs to” a grade, the NNs and RFs directly predict the value of a student’s performance. During the training process, the Mean Squared Error (MSE) is used as the loss function of the NNs and RFs. The NNs used in this experiment all have one input layer, two hidden layers of size of 16 and 4, respectively, and an output layer of output size 1. All layers of the NNs are fully connected. The RFs used in this experiment all consist of 1000 estimators. SVM is replaced by Support Vector Regression (SVR), which uses an SVM structure for regression tasks. In this experiment, the Radial Basis Function (RBF) is chosen as the kernel function of the SVR, which projects the student performance data into a hyper-panel where the SVR can learn the regression. During the testing process, each model first predicts student performance and outputs a float number. The float number is then converted into its nearest integer (from 1 to 20). The predicted grade is then converted into a 5-level grading system, according to Table 2. Then, the prediction accuracy is calculated with the converted 5-level grades. The experiment in this research uses 70% of the data from the datasets as training data and the other 30% of the data as test data for both the mathematics performance dataset and the Portuguese performance dataset. The experiment results are shown in Table 3.
Table 3.
Prediction accuracy with the regression approach.
Based on the experiment results, SVR and NN using the regression approach outperform those using the classification approach by an average of 15.2%. SVR for mathematics performance prediction achieved a better accuracy of 21.9%, showing the great advantage of the regression approach in predicting students’ performance. In contrast to SVR and NN, the performance of RF changes slightly, which can be considered an experimental error. The experiment result supports the assumption that the regression approach is more suitable for predicting student performance.
3.3. Generation and Use of Synthetic Data
According to Table 1 and Table 3, it is evident that NNs perform less effectively on the mathematics dataset compared to the Portuguese dataset, regardless of whether the regression or classification approach is used. With limited artificial design in their structures, simple fully connected NNs are very flexible and, thus, can perform many tasks well. Less artificial design also makes NNs prefer large training datasets; since everything in an NN has to be learned from the very start, the more data, the clearer the knowledge, and the better the learning result.
Given that the student mathematics performance dataset used in this research is smaller than the Portuguese dataset, it is possible that the lack of student mathematics performance data causes NNs to perform worse on the mathematics dataset. Although the best way to improve the performance of NNs on small datasets is to collect more data, it is still unavoidable for researchers to encounter conditions where data volume is limited. Considering the differences between schools, regions, teacher skills, etc., it is difficult to combine student data from different schools. Furthermore, due to privacy concerns, many students may not agree with the use of their personal information for educational data mining. Improving prediction performance on small datasets is still meaningful.
AI-Generated Content (AIGC) has recently become a hot topic, while research into generative AI has been underway for a long time. From 2014 on, Goodfellow has been conducting research using two adversarial networks to generate images [18] and named the networks Generative Adversarial Networks (GANs). After the success of GANs, some researchers used AI-generated images to improve the performance of models on small datasets [19,20]. In this research, GANs are chosen to generate student performance data to augment the student mathematics dataset.
The student data used in this research contain 33 features, each of which has a different value domain. Some of the features use text values (such as school names, gender, etc.). This makes the student data highly discrete. A common method of dealing with text data is to convert it to 0’s and 1’s using one-hot encoding. However, this makes the number of features in the data much larger—there will be 59 features after one-hot encoding, and most data in the features created by one-hot encoding is 0, which contains very little information. As reported in Table 4, GANs trained with one-hot encoded data cannot properly generate data that cover the data distribution of the original data. The sampled data are very similar—their ages, Medu, and Fedu values are all the same. Furthermore, their grades G1 and G2 are also too low and hardly appear in the collected dataset. Considering that the original outputs of GANs are re-scaled into the value domain by post-processing (e.g., age smaller than 15 will be rescaled into 15 since the age domain is 15~22), it is possible that the original outputs of the GANs are much worse. The experiment result shows that one-hot encoded data are not compatible with GANs. More steps are needed for the GANs to work properly.
Table 4.
Sample data generated by GANs using one-hot encoding.
An encoder and a decoder are added to help the GANs. The encoder and decoder used in this research are trained as a three-layer neural network—an input layer of 59 dimensions, a hidden layer of 15 dimensions, and an output layer of 59 dimensions. The weights between the input layer and the hidden layer are chosen as the encoder, and the weights between the hidden layer and the output layer are chosen as the decoder. The hidden layer, which is the output layer of the encoder, uses sigmoid as the activation function—this scales the encoding result into 0~1, making it easier for the GANs to learn. The encoder and the decoder are trained on the whole student mathematics performance dataset to best encode and recover the data. Out of eleven trained autoencoders, the one with the best performance (recovering 75.3% of data after encoding) is chosen to embed the data. The imperfection of the auto-encoder also performs as a noise input in this structure since the decoded data are sometimes not the same as the input. The encoder and decoder compress the data dimension into a hyperspace, forming a denser vector, which alleviates the problem caused by highly discrete student data distribution.
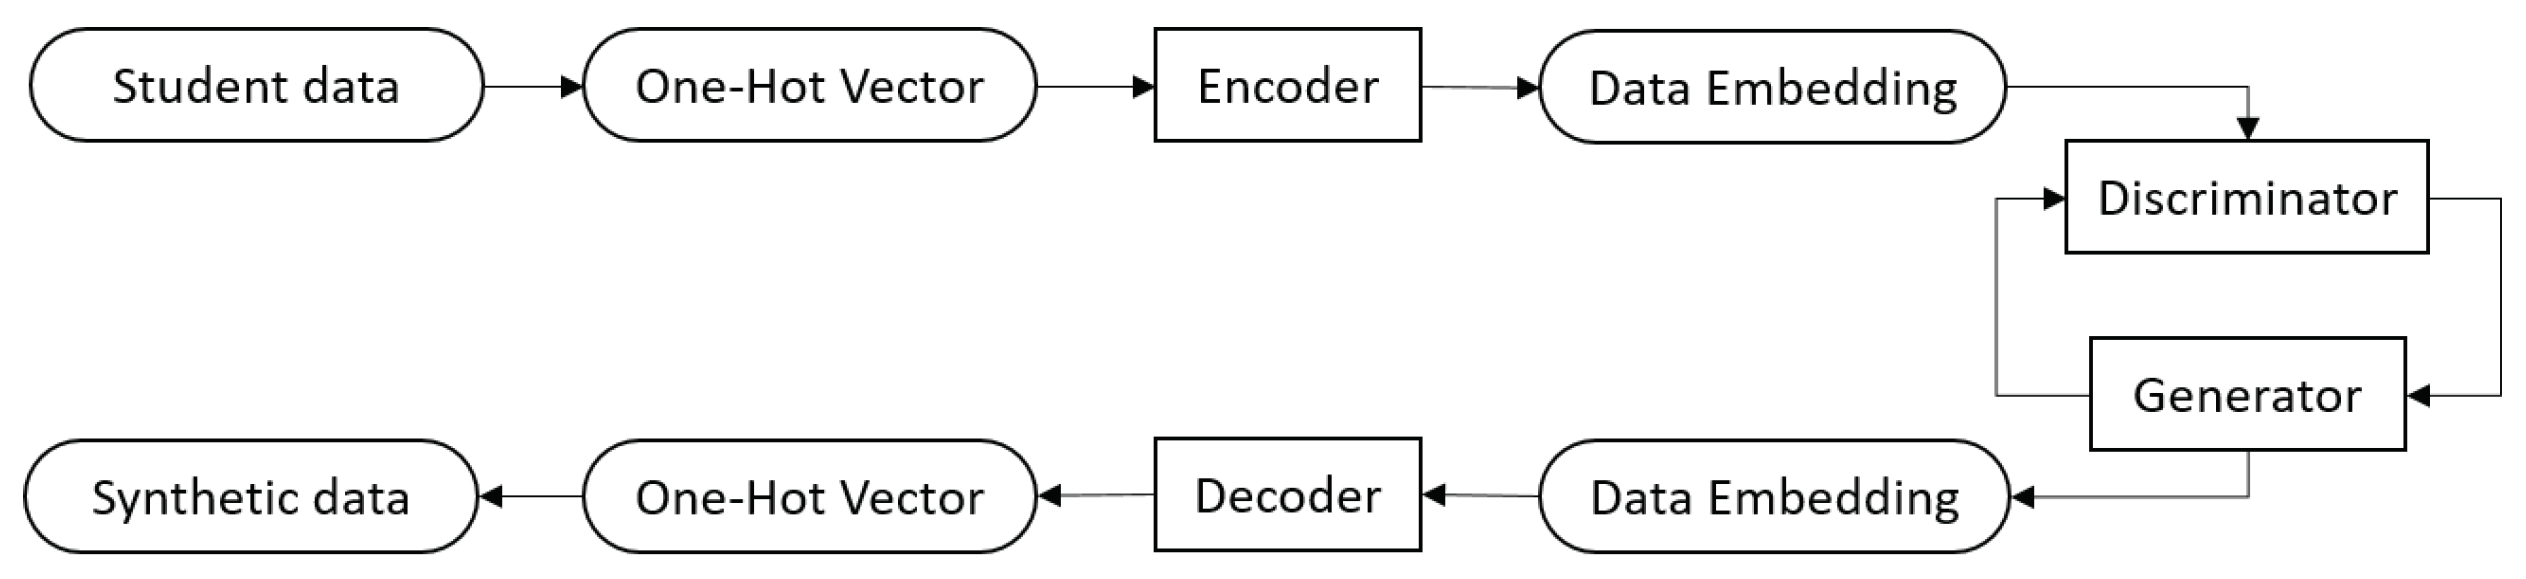
To train and test the GANs, the encoder first embeds the data from a 59-dimension vector (after one-hot encoding) into a 15-dimension vector. Then, the GANs are trained using the 15-dimension vectors as the collected data. After the GANs are trained, the decoder decodes the output vectors from the generator into one-hot vectors, and then the one-hot vectors are eventually parsed into normal student data format (Figure 1).
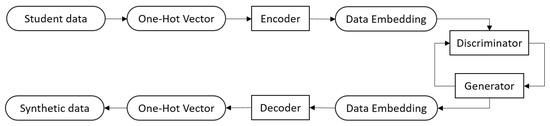
Figure 1.
Data generation workflow.
A GAN system consists of a generator and a discriminator. The discriminator is trained to discriminate data generated by the generator. The generator is trained to fool the discriminator by generating data that are as real as possible. Ideally, when the GANs training is finished, the discriminator reaches the highest loss because it cannot discriminate the generated data, and the generator reaches the lowest loss—0 because all the generated data are recognized as real data by the discriminator.
The loss function for the discriminator is shown as follows:
The loss function for the generator is shown as follows:
In Equations (1) and (2), x represents the collected data, z represents the input of the generator, G(z) represents generated data, D(a) represents the discriminant result of input a, and n represents the batch size. BCE stands for binary cross entropy loss.
During the experiment, multiple GANs are trained, and some GANs do not convert as expected. Table 5 shows some sampled data from an abandoned generator. The sampled data show that this generator generates data with similar feature values. These generated data may match a certain point of the real data distribution so that the discriminator cannot distinguish them. These data pieces are useless because they cannot fill in the gaps between the collected data samples and the real data distribution.
Table 5.
Sample data from abandoned GANs.
In Goodfellow’s paper [21], the improvement of GANs in image generation from 2014 to 2017 is simply demonstrated with an illustration. However, when it comes to student data synthesis, it becomes difficult to tell whether a generated piece of student performance data is good or not. In this research, the generator is chosen based on the following rules:
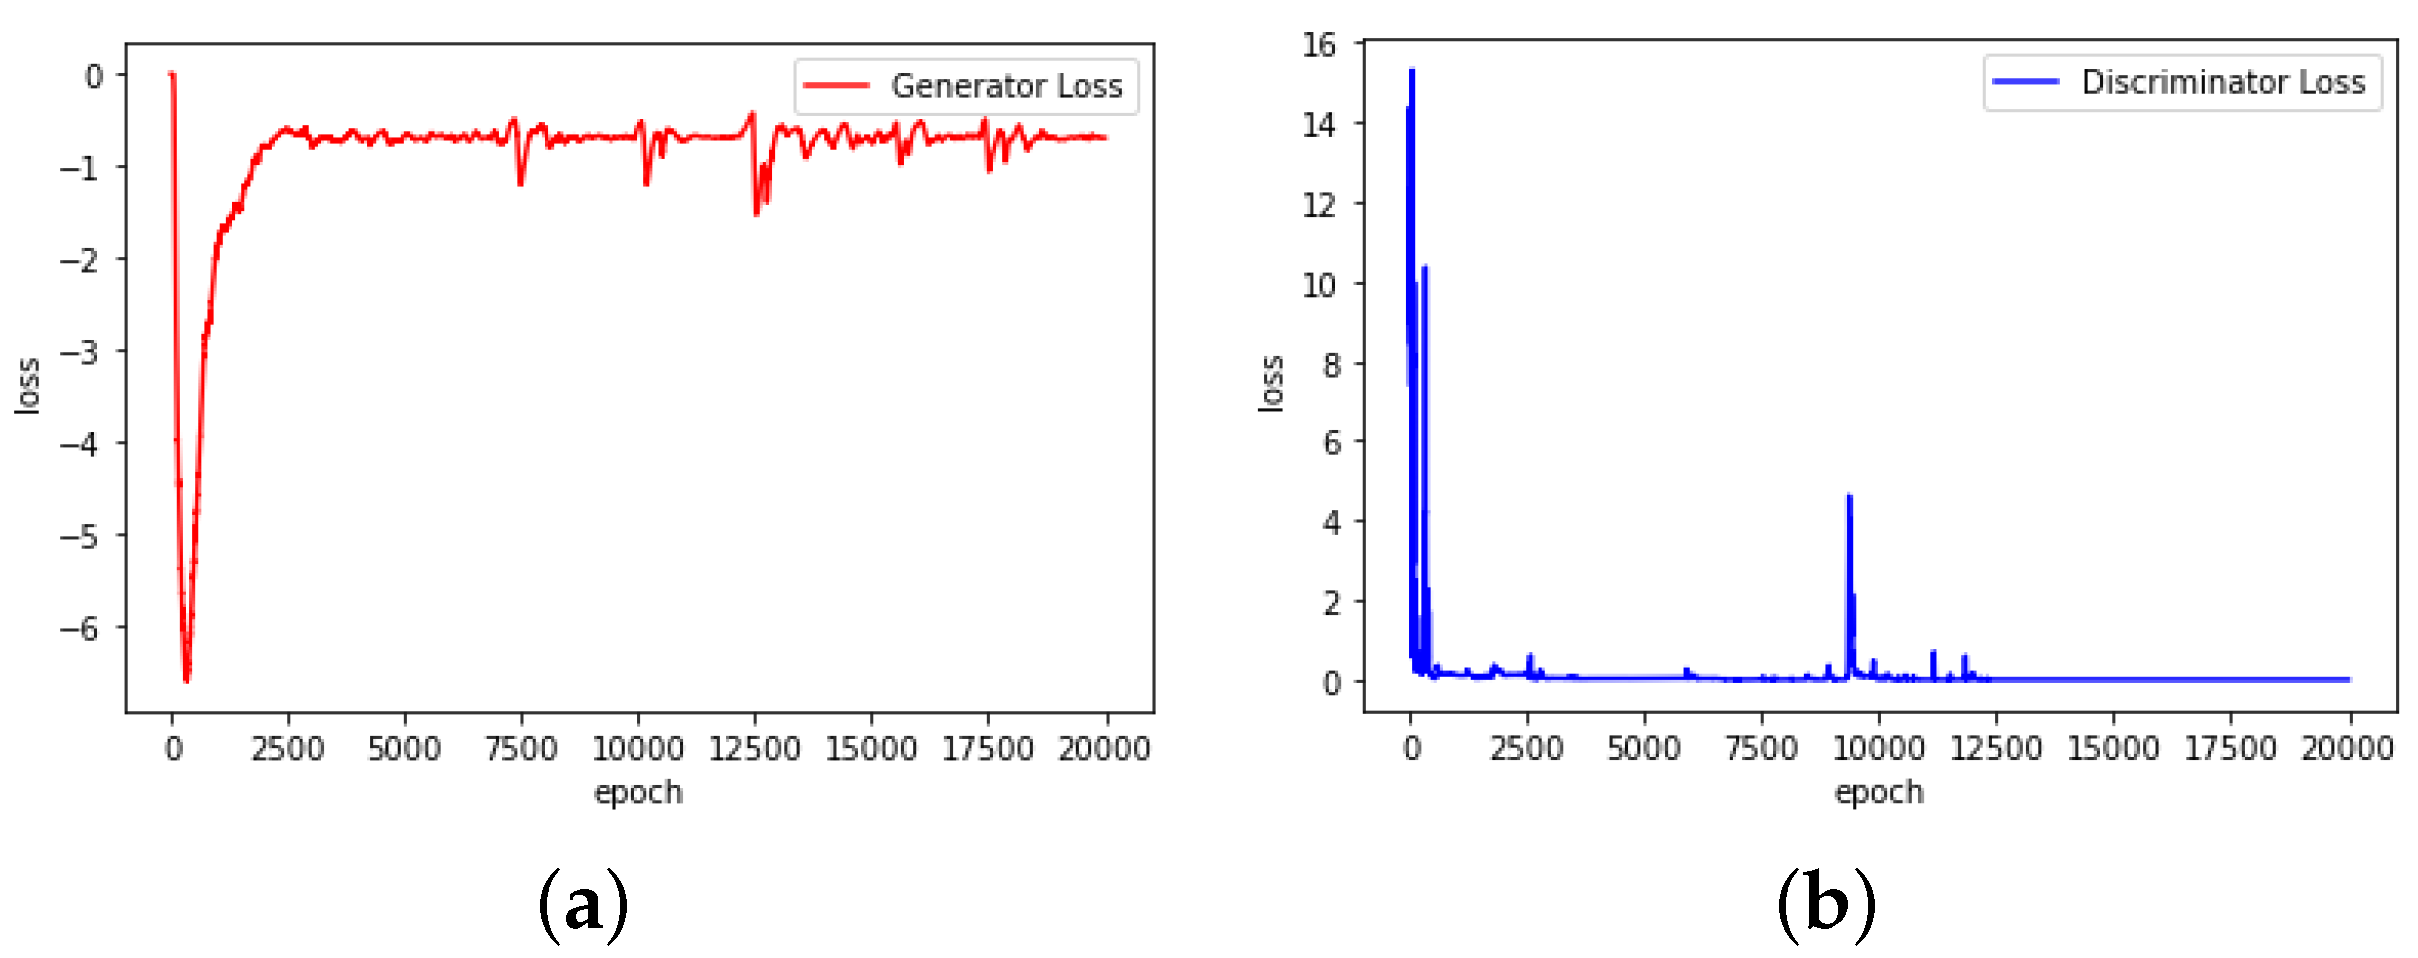
- First, the GANs should convert smoothly. As shown in Figure 2, the abandoned GANs convert with a very unusual loss change. It is found that during the experiment, ln(0) is processed as −1, which has a great impact on the training result. Figure 3 shows the converting process of the chosen GANs, which have smoother loss changes.
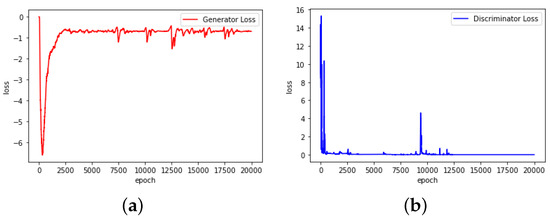 Figure 2. Loss–epoch relationship of abandoned GANs. (a) Generator. (b) Discriminator.
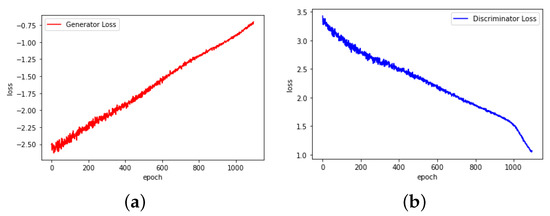 Figure 3. Loss–epoch relationship of chosen GANs. (a) Generator. (b) Discriminator.
 - Second, the GANs should generate more dispersed data. During the training process of the GANs, it is possible that the generator generates data concentrated in a certain range of the real data distribution. The generated data are real-like but all similar, while the discriminator cannot reflect this problem. By choosing a generator that generates dispersed data, this problem can be alleviated.
The example data generated by GANs chosen according to the above two rules are shown in Table 6. The data are generated with random inputs to the generator following Gaussian distribution.
Table 6.
Sample data from chosen GANs.
To evaluate the ability of the GANs, SVR, NN, and RF are trained again to predict student mathematics performance using a regression approach but on a dataset containing synthetic data. The training dataset contains 100 pieces of synthetic data and 70% of data randomly selected from the mathematics performance dataset collected. The other 30% of the collected data is used as the test set. The result is presented in Table 7.
Table 7.
Performance of regression approach with synthetic data.
An examination of the results presented in Table 7 shows that although NN has an increase of 2.5% in accuracy, RF and SVR remain largely unaffected. This aligns with the understanding that NN is more responsive to the volume of training data. The marginal improvement in NN’s accuracy suggests that the synthetic data are well matched to the distribution of the collected data. An analysis of the generated data (Table 6) shows that current synthetic data are still not sufficiently dispersed to fully cover the real data distribution. Some age values never appear in the generated data and failures are all 0. Furthermore, in the generated data, a larger student absence number occurs frequently, which does not match the collected data. As the synthetic data are concentrated, it only smoothes the distribution of the collected data a little, leading to a small improvement in NN’s performance. In addition, the encoder and decoder used in this research are not capable of correctly encoding and decoding each piece of data. Although this feature is used as random noise, it also makes data generation more uncertain. It is expected that a better auto-encoder with more collected data can help GANs achieve better performance.
4. Conclusions and Future Work
Following the concept of applying data mining techniques to educational data and the dataset contributed by Paulo Cortez [6], this research is able to achieve better results in predicting student performance. Based on the experiment result, it is evident that the regression approach has an advantage over the classification approach in predicting student performance. Improvements of 21.9%, 13.1%, and 5.8% are achieved with SVR, NN, and RF in predicting student mathematics grades, respectively. Improvements of 11.4% and 14.4% are achieved with SVR and NN in Portuguese, respectively. Switching from a classification approach to a regression approach significantly improves the accuracy of predicting student performance on the 5-level grading scale. The improvement in predictive accuracy on the multi-level grading system is expected to help educators better understand their students.
This research also explores the possibility of using AI-generated data to enhance the prediction performance on small datasets. The slight improvement of 2.5% achieved with NN shows the potential of employing synthetic data in educational data mining. The experiment on data generation also shows the difficulties of training GANs on small datasets with discrete data distribution and inconsistent data features. In conclusion, finding a method that efficiently projects collected data into a more GAN-friendly hyperspace could greatly improve the quality of generated data. To further improve the prediction performance, the quality of the synthetic data needs to be improved. In future studies, the search for a better projecting method should aid the training of GANs. Further, noise should be added to GANs to control the network and generate more dispersed data. In addition, methods that assess the quality of the generated data are preferred.
Overall, this research highlights the effectiveness of a regression approach over a classification approach in predicting student performance. Additionally, this research demonstrates the feasibility of using generated data to augment small educational datasets. As technology continues to develop, a variety of teaching methods, such as online courses, are available to the public. For educators, efficient use of modern techniques can greatly enhance their understanding of their students. Artificial Intelligence is currently a tool with unlimited potential. Applying artificial intelligence methods to educational datasets enables educators to adjust their teaching strategy according to students’ conditions in real time. Making more personalized teaching plans for each student to help them achieve greater success may one day become possible with the help of AI technology.
Author Contributions
Conceptualization, D.Y. and J.M.; methodology, D.Y.; software, D.Y.; validation, D.Y. and J.M.; formal analysis, D.Y.; investigation, D.Y.; resources, D.Y.; data curation, D.Y.; writing—original draft preparation, D.Y.; writing—review and editing, D.Y.; visualization, D.Y.; supervision, J.M.; project administration, D.Y. All authors have read and agreed to the published version of the manuscript.
Funding
This research received no external funding.
Institutional Review Board Statement
Not applicable.
Informed Consent Statement
Not applicable.
Data Availability Statement
The data that support the findings of this study are available from the corresponding author upon reasonable request.
Conflicts of Interest
The authors declare no conflict of interest.
References
- United Nations Educational Scientific and Cultural Organization. Education: From Disruption to Recovery; UNESCO: Paris, France, 2022. [Google Scholar]
- National Center for Education Statistics. Table 311.15. Number and Percentage of Students Enrolled in Degree-Granting Postsecondary Institutions, by Distance Education Participation, Location of Student, Level of Enrollment, and Control and Level of Institution: Fall 2020 and Fall 2021; National Center for Education Statistics: Washington, DC, USA, 2023.
- Chen, M.S.; Han, J.; Yu, P.S. Data mining: An overview from a database perspective. IEEE Trans. Knowl. Data Eng. 1996, 8, 866–883. [Google Scholar] [CrossRef]
- Clifton, C. Data Mining; Encyclopedia Britannica: Chicago, IL, USA, 2022. [Google Scholar]
- Frawley, W.J.; Piatetsky-Shapiro, G.; Matheus, C.J. Knowledge discovery in databases: An overview. AI Mag. 1992, 13, 57. [Google Scholar]
- Cortez, P.; Silva, A.M.G. Using data mining to predict secondary school student performance. In Proceedings of the 5th Annual Future Business Technology Conference, Porto, Portugal, 9–11 April 2008. [Google Scholar]
- Srivastava, J.; Cooley, R.; Deshpande, M.; Tan, P.N. Web usage mining: Discovery and applications of usage patterns from web data. ACM SIGKDD Explor. Newsl. 2000, 1, 12–23. [Google Scholar] [CrossRef]
- Romero, C.; Ventura, S. Educational data mining: A review of the state of the art. IEEE Trans. Syst. Man Cybern. Part C (Appl. Rev.) 2010, 40, 601–618. [Google Scholar] [CrossRef]
- Liu, B.; Ma, Y.; Wong, C.K.; Philip, S.Y. Target Selection via Scoring Using; IBM Research Report 21697; IBM: New York, NY, USA, 2000. [Google Scholar]
- Ma, Y.; Liu, B.; Wong, C.K.; Yu, P.S.; Lee, S.M. Targeting the right students using data mining. In Proceedings of the Sixth ACM SIGKDD International Conference on Knowledge Discovery and Data Mining, Boston, MA, USA, 20–23 August 2000; pp. 457–464. [Google Scholar]
- Luan, J. Data Mining and Its Applications in Higher Education. New Dir. Institutional Res. 2002, 113, 17–36. [Google Scholar] [CrossRef]
- Kim, B.H.; Vizitei, E.; Ganapathi, V. GritNet: Student performance prediction with deep learning. arXiv 2018, arXiv:1804.07405. [Google Scholar]
- Kabakchieva, D. Student performance prediction by using data mining classification algorithms. Int. J. Comput. Sci. Manag. Res. 2012, 1, 686–690. [Google Scholar]
- Kotsiantis, S.; Pierrakeas, C.; Pintelas, P. Predicting Students’ Performance in Distance Learning Using Machine Learning Techniques. Appl. Artif. Intell. 2004, 18, 411–426. [Google Scholar] [CrossRef]
- Al-Shehri, H.; Al-Qarni, A.; Al-Saati, L.; Batoaq, A.; Badukhen, H.; Alrashed, S.; Alhiyafi, J.; Olatunji, S.O. Student performance prediction using support vector machine and k-nearest neighbor. In Proceedings of the 2017 IEEE 30th Canadian Conference on Electrical and Computer Engineering (CCECE), Windsor, ON, Canada, 30 April–3 May 2017; IEEE: Piscataway, NJ, USA, 2017; pp. 1–4. [Google Scholar]
- Asif, R.; Merceron, A.; Pathan, M.K. Predicting student academic performance at degree level: A case study. Int. J. Intell. Syst. Appl. 2014, 7, 49–61. [Google Scholar] [CrossRef]
- Ho, T.K. Random decision forests. In Proceedings of the 3rd International Conference on Document Analysis and Recognition, Montreal, QC, Canada, 14–16 August 1995; IEEE: Piscataway, NJ, USA, 1995; Volume 1, pp. 278–282. [Google Scholar]
- Goodfellow, I.; Pouget-Abadie, J.; Mirza, M.; Xu, B.; Warde-Farley, D.; Ozair, S.; Courville, A.; Bengio, Y. Generative Adversarial Nets. In Advances in Neural Information Processing Systems; Ghahramani, Z., Welling, M., Cortes, C., Lawrence, N., Weinberger, K., Eds.; Curran Associates, Inc.: Red Hook, NY, USA, 2014; Volume 27. [Google Scholar]
- Li, D.C.; Wen, I.H. A genetic algorithm-based virtual sample generation technique to improve small data set learning. Neurocomputing 2014, 143, 222–230. [Google Scholar] [CrossRef]
- Fang, W.; Zhang, F.; Sheng, V.S.; Ding, Y. A Method for Improving CNN-Based Image Recognition Using DCGAN. Comput. Mater. Contin. 2018, 57, 167–178. [Google Scholar] [CrossRef]
- Goodfellow, I.; Pouget-Abadie, J.; Mirza, M.; Xu, B.; Warde-Farley, D.; Ozair, S.; Courville, A.; Bengio, Y. Generative adversarial networks. Commun. ACM 2020, 63, 139–144. [Google Scholar] [CrossRef]

Disclaimer/Publisher’s Note: The statements, opinions and data contained in all publications are solely those of the individual author(s) and contributor(s) and not of MDPI and/or the editor(s). MDPI and/or the editor(s) disclaim responsibility for any injury to people or property resulting from any ideas, methods, instructions or products referred to in the content. |
© 2024 by the authors. Licensee MDPI, Basel, Switzerland. This article is an open access article distributed under the terms and conditions of the Creative Commons Attribution (CC BY) license (https://creativecommons.org/licenses/by/4.0/).