Article

Study on Corrosion Monitoring of Reinforced Concrete Based on Longitudinal Guided Ultrasonic Waves

1
State Key Laboratory of Bridge Engineering Structural Dynamics, Chongqing 400074, China
2
School of Civil Engineering, Chongqing Jiaotong University, Chongqing 400074, China
3
State Key Laboratory of Bridge Engineering Safety and Resilience, Beijing University of Technology, Beijing 100124, China
*
Author to whom correspondence should be addressed.
Appl. Sci. 2024, 14(3), 1201; https://doi.org/10.3390/app14031201
Submission received: 28 November 2023 / Revised: 24 January 2024 / Accepted: 25 January 2024 / Published: 31 January 2024
(This article belongs to the Special Issue Structural Health Monitoring for Bridge Structures)

Abstract

:
The corrosion of reinforced concrete (RC) is one of the most serious durability problems in civil engineering structures, and the corrosion detection of internal reinforcements is an important basis for structural durability assessment. In this paper, the appropriate frequency required to cause excitation signals in the specimen is first analyzed by means of frequency dispersion curves. Subsequently, the effectiveness of five damage indexes (DIs) is discussed using random corrosion in finite elements. Finally, guided ultrasonic wave (GUW) tests are conducted on reinforcement and RC specimens at different corrosion degrees, and the test results are verified using a theoretical corrosion model. The results show that the larger the covered thickness is at the same frequency, the higher the modal order of the GUW in the frequency dispersion curve is, and the smaller the group velocity is. The SAD is the most sensitive to the corrosion state of the reinforcement compared with the other DIs, and it shows a linear increasing trend with the increase in the corrosion degree of the reinforcement. The SAD values of the RC specimens showed a three-stage change with the increase in the corrosion time, and the time until the appearance of corrosion cracks was increased with the increase in the covered thickness. It can be seen that increasing the covered thickness is an effective method to delay the time until the appearance of corrosion cracks in RC specimens.

1. Introduction

Reinforced concrete (RC) and prestressed concrete both make full use of the mechanical properties of reinforcement in tension and concrete in compression and are widely used in various types of structures such as bridges, houses, and nuclear power plants. During their long service life, these structures display long-term durability problems in bad operating environments, such as concrete carbonation [1] and reinforcement corrosion [2,3] of which the latter is the most serious durability problem. Monitoring the corrosion status of reinforcement in concrete has been a topical research in civil engineering. The current detection methods are still based on indirect measurements [4], such as chloride content, concrete resistivity, and half-cell potential, which are used to indirectly determine the corrosion status of the reinforcement by measuring the corrosion environment parameters of the reinforcement inside the concrete [5].
GUW testing is widely used as a non-destructive testing technique for the damage monitoring of structures [6]. When GUWs propagate along a corroded reinforcement, the presence of a large number of surface pits due to corrosion will affect the propagation characteristics of the GUWs in the reinforcement, which is a more direct method for monitoring reinforcement corrosion. Sharma et al. [7] investigated the propagation characteristics of GUWs in reinforcement and solved their displacement based on the frequency dispersion curves of the longitudinal wave modes, which showed that the strain energy of the L(0, 1) mode is mainly concentrated on the surface of the reinforcement, and is more suitable for corrosion studies of reinforcement damage. Many scholars [8,9,10,11,12] have simulated the local corrosion of reinforcement by grinding or notching and have found that the amplitude of the GUWs showed a linearly decreasing variation with the depth increase in grinding or notching. Sriramadasu et al. [13] proposed a damage identification index based on the amplitude difference in the corrosion signal by carrying out GUW finite element simulations of corroded reinforcement and effectively validated the index through GUW tests of corroded reinforcement. Farhidzadeh et al. [14] carried out a test study concerning the corrosion process of GUWs on steel strands and proposed a method to identify the residual corrosion diameter of steel strands utilizing the variation in the group velocity. More signal processing techniques are being applied to GUW detection with the rapid development of computing software. Umar et al. [15] used the time-of-flight method to obtain the travel time of wave packets as a monitoring indicator based on the variation in the wave velocity with the reinforcement diameter and found that the signal travel time obtained by the cross-correlation signal processing technique was more accurate for the identification of the remaining diameter of the corroded reinforcement. Majhi et al. [16] proposed a method to predict the corrosion status based on the K-means algorithm according to the dispersion and multimodal properties of GUWs. Sun et al. [17] proposed a feature-level data fusion strategy method for monitoring reinforcements with different corrosion degrees using a combination of direct and coda waves.
Extensive research on the GUWs’ propagation characteristics of multilayer waveguide conductors reports on the propagation characteristics of GUWs in RC. There have been many studies [18,19,20,21] to identify the corrosion stage of reinforcement in concrete by monitoring the signal changes under different corrosion states. Li et al. [18] analyzed the signal amplitude changes during the corrosion process and proved that it is feasible to identify the corrosion state by using the amplitude changes. Through a GUW test of corroded RC, Sriramadasu et al. [21] found a corresponding relationship between the amplitude variation curve of the corrosion signal and the RC corrosion stage. Shi et al. [22] and Liu et al. [23] monitored the RC corrosion process by the positive and negative bimodal amplitudes of GUWs on this basis and studied and analyzed three factors: the reinforcement type, the water–cement ratio and the concrete cover thickness. Zhang et al. [24] found that the embedded ultrasonic transducer method could detect concrete damage during the corrosion process and proposed a method that could determine the damage stage according to the relationship between the ultrasonic transducer data and the corrosion rate. Mayakuntla et al. [25] proposed a histogram-based qualitative analysis method using contact-based ultrasonic excitation and non-contact laser-based sensing to monitor corrosion in concrete and the ultrasonic scanning of specimens with different corrosion degrees. The GUW method of identifying the corrosion state of reinforcement in concrete has achieved more results, but there are still some shortcomings: on the one hand, most of the existing finite element simulations of corroded reinforcement simplify corrosion as a regular notch, and this simplified method cannot accurately quantify the influence of corrosion damage on GUW propagation; on the other hand, many corrosion identification indexes of RC rely on the test results, and lack an explanation of the mechanism linking corrosion parameters and the rust expansion process.
In this paper, GUWs are used to carry out numerical simulations and test studies on the corrosion process of reinforcement and RC. Firstly, five damage indexes (DIs) that can identify the corrosion process are proposed, and the indexes with good sensitivity are selected by a finite element simulation analysis. Secondly, the reinforcement and RC under corrosion tests are carried out to verify the effectiveness of the selected indexes. Finally, the correlation between the theoretical corrosion model of the RC and the measured DI is analyzed, which theoretically explains the rationality and effectiveness of the ultrasonic identification indexes.

2. Theoretical Background

2.1. Corrosion Process Model

To facilitate research and analysis, the following assumptions are made:
(1)
The concrete surrounding the reinforcement is a thick-walled cylinder with its wall thickness equal to the cover thickness.
(2)
The thickness of the corrosion products around the reinforcement is the same, that is, the reinforcement is uniformly corroded, and the pressure exerted by the corrosion products on the concrete around the reinforcement is uniform.
(3)
The effects of external factors are not taken into account in the calculations; only the expansion of the corrosion products induced by stresses and strains is considered.
Figure 1 shows that the time required for cover cracking is divided into three time intervals [26]:
(1)
Tfree interval (determined by the Ar1 surface): as shown in Figure 1a, corrosion products do not induce pressure on the concrete at the beginning of reinforcement corrosion until the porous zone (δ0) is filled with corrosion products.
(2)
Tstress interval (associated with the Ar2 surface): Corrosion products gradually penetrate into the concrete and densify the transition zone at the interface between the reinforcement and the concrete. Once the corrosion products fill the porous zone, they exert pressure on the surrounding concrete (Figure 1b). When the pressure is so high that the concrete cannot withstand it, initial cracks will develop in the concrete, as shown in Figure 1c.
(3)
Tingress interval (corresponding to the Ar3 surface): When initial cracks induced by internal pressure appear in the concrete, corrosion continues to expand and reduce the cross-section of the reinforcement. The corrosion products accumulated in the cracks will further lead to cover cracking, as shown in Figure 1d.
As corrosion continues to expand, the initial cracks can evolve into cover cracking, and even lead to concrete crushing and spalling in severe cases, as shown in Figure 1e, which indicates that corrosion may exceed the acceptable damage threshold. Therefore, monitoring the initial corrosion and initial cracks can help to determine the safety of the concrete structures.
One of the effective parameters for calculating the cover cracking time is the ratio of the volume of the corrosion products to that of the consumed reinforcement in the corrosion process (n). In this paper, the main type of corrosion product is Fe2O3; it is therefore assumed that the parameter (n) is determined to be 2.20 according to Ref. [27].
A l o s s = A r n = A r 1 + A r 2 + A r 3 n   ,
where Aloss is the reinforcement area loss, and Ar is the cross-sectional area of the rust causing cover cracking.
Faraday’s law has been used to estimate the time by Jamshidi et al. [26]. To obtain the total cover cracking time, it is necessary to calculate it using Equation (2).
T = 1879.2 m l D i c o r   ,
where ml = 100Aloss/Ast; ml is the mass loss percentage of reinforcement; Aloss is the reinforcement area loss; Ast is the original cross-sectional area of reinforcement; icor is the corrosion current density (A/cm2).

2.2. Frequency Dispersion Characteristics

Reinforcement as a wave conductor has multimodal and dispersive properties in terms of propagation, and longitudinal modal GUWs are widely used for damage detection in rod-like structures. The frequency dispersion curves describe an important feature of the propagation characteristics of GUWs in wave conductors. For a wave conductor with a regular cross-section, such as a circular rod, its frequency dispersion curve can be obtained by solving the characteristic equation. The frequency dispersion curve for a longitudinal GUW can be obtained by numerically solving the Pochhammer–Chree equation as shown in Equation (3).
2 α a ( β 2 + k 2 ) J 1 ( α a ) J 1 ( β a ) ( β 2 k 2 ) × J 0 ( α a ) J 1 ( β a ) 4 k 2 α β J 1 ( α a ) J 0 ( β a ) = 0   ,
where α2 = ω2/cL2 − k2, β2 = ω2/cT2 − k2. cL and cT are the longitudinal and transverse wave velocities, respectively. ω is the angular frequency. k is the wave number. J0 and J1 are the corresponding Bessel functions, respectively.
The specimens are of two types, reinforcement, and RC, where the RC consists of the reinforcement and covered concrete. The parameters of both materials are shown in Table 1. The frequency dispersion curves of the specimens were solved using the PCDISP program as a means of investigating the effect of the covered thickness on the propagation of GUWs in reinforcement.
One of the unusual properties of GUWs are the infinite number of modes. Depending on the thickness of the object, the material under study, and the frequency, other higher-order dispersive modes appear (Figure 2). With a higher excitation frequency, depending on the thickness and material, higher-order modes are also excited, meaning separating the different modes and/or identifying the useful signal is a difficult task. Therefore, the first-order mode L(0, 1) is mainly utilized in the later sections of the finite element simulation and test study.
The double-layer composite waveguide structure formed by the concrete and the reinforcement causes the GUW to be constantly refracted, scattered, and reflected in the contact area between the concrete and the reinforcement, which makes the modal components of the GUW more and more complex. Compared with Figure 2a, the group and phase velocities of the same mode L(0, n) at the same frequency shown in Figure 2b–d decrease with the increase in the covered diameter of the concrete. There are two attenuation forms of GUWs in RC: one is leakage and the other is absorption by the material. This leakage and absorption results in a decrease in the amplitude of the received GUW signal. The signal attenuation has two factors [28]: (1) The factors affecting the absorption of the GUW energy by the reinforcement are the material acoustic impedance and the GUW frequency. High-frequency signals have more energy attenuation caused by acoustic impedance. (2) The factors affecting energy leakage in concrete are the frequency, radius, and bond strength of RC. Ahmed et al. [29] pointed out that the leaked energy would not provide enough information for debonding detection. Similarly, since this debonding detection is similar to corrosion detection, it is also suggested that this leaked energy will not have an impact on corrosion detection.

3. Finite Element Simulation of Corroded Reinforcement

3.1. Finite Element Model

3.1.1. Model Establishment

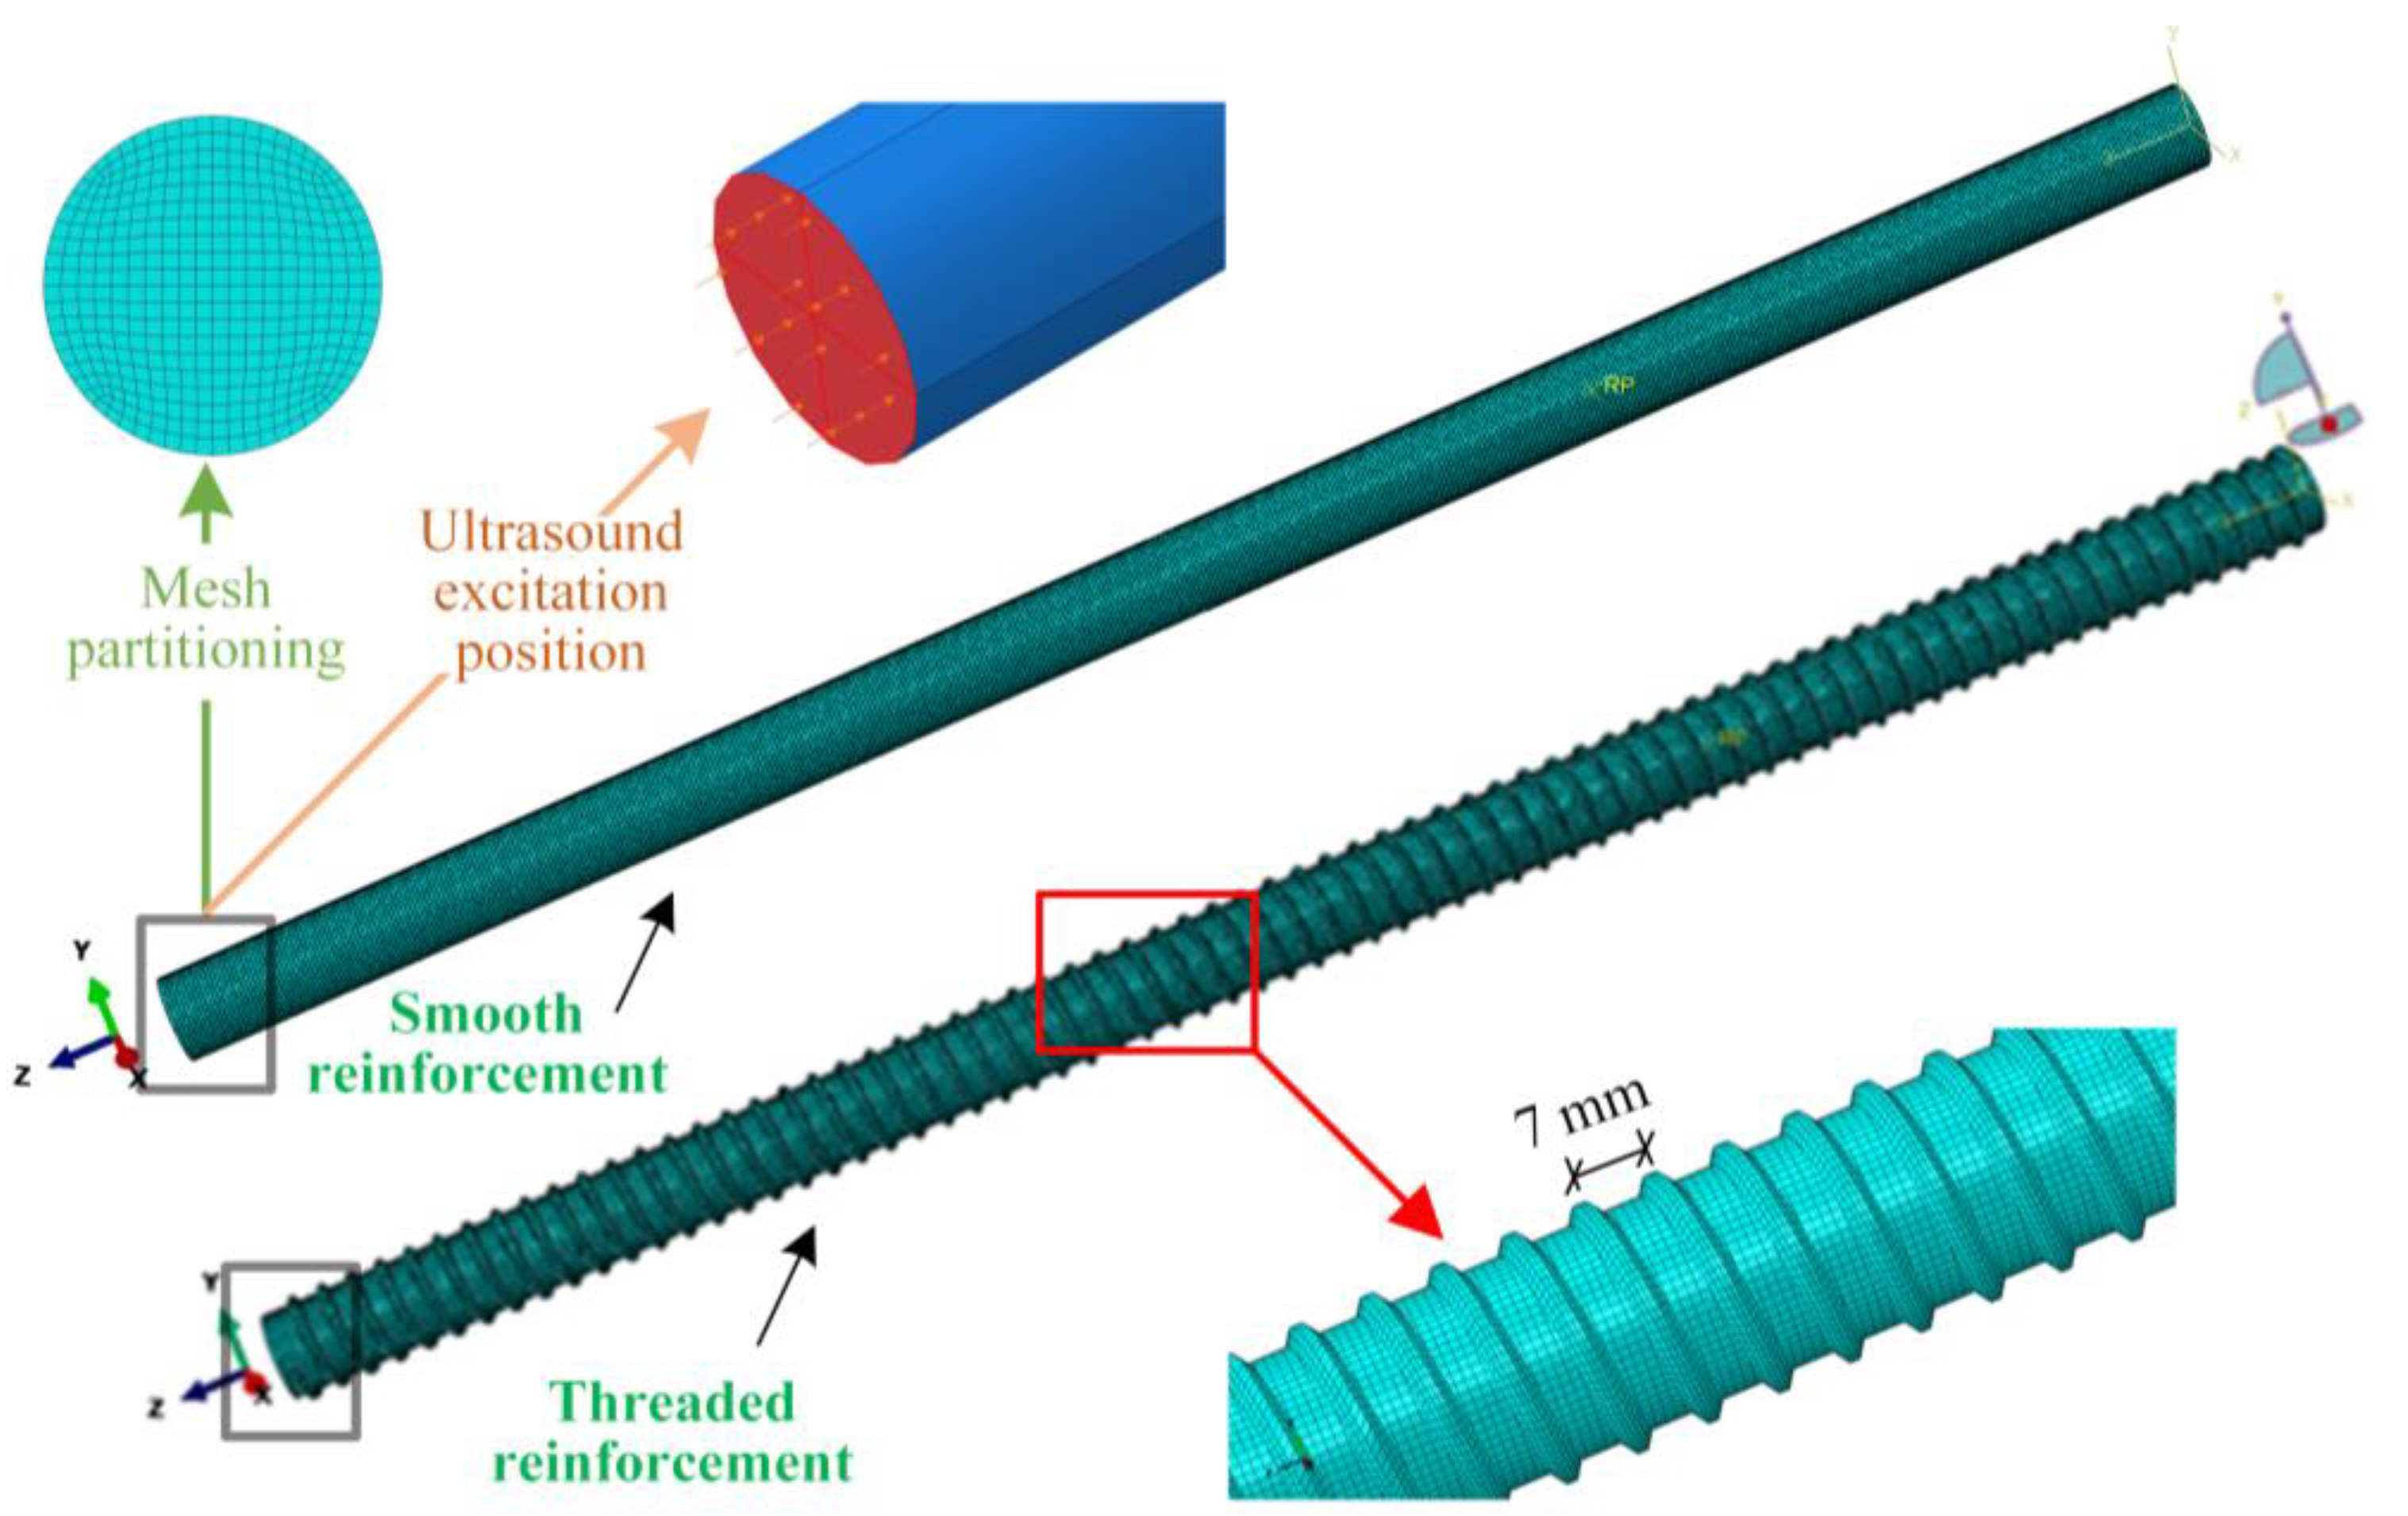
The propagation of GUWs in a reinforcement (length L = 1100 mm, diameter D = 18 mm, modulus of elasticity MOE = 208 GPa, density ρ = 7850 kg/m3, Poisson’s ratio ν = 0.3, no material damping effects) is simulated by ABAQUS/Explicit. The axial unit size in the model is 1 mm, and the automatic integration time step is used in the analysis process. The simulation process is divided into two stages: ultrasonic excitation and ultrasonic propagation. The mesh division and ultrasonic excitation of the reinforcement model are shown in Figure 3. One end of the model is completely fixed, and the other end only releases the axial displacement.

3.1.2. Effects of Reinforcement Corrugation

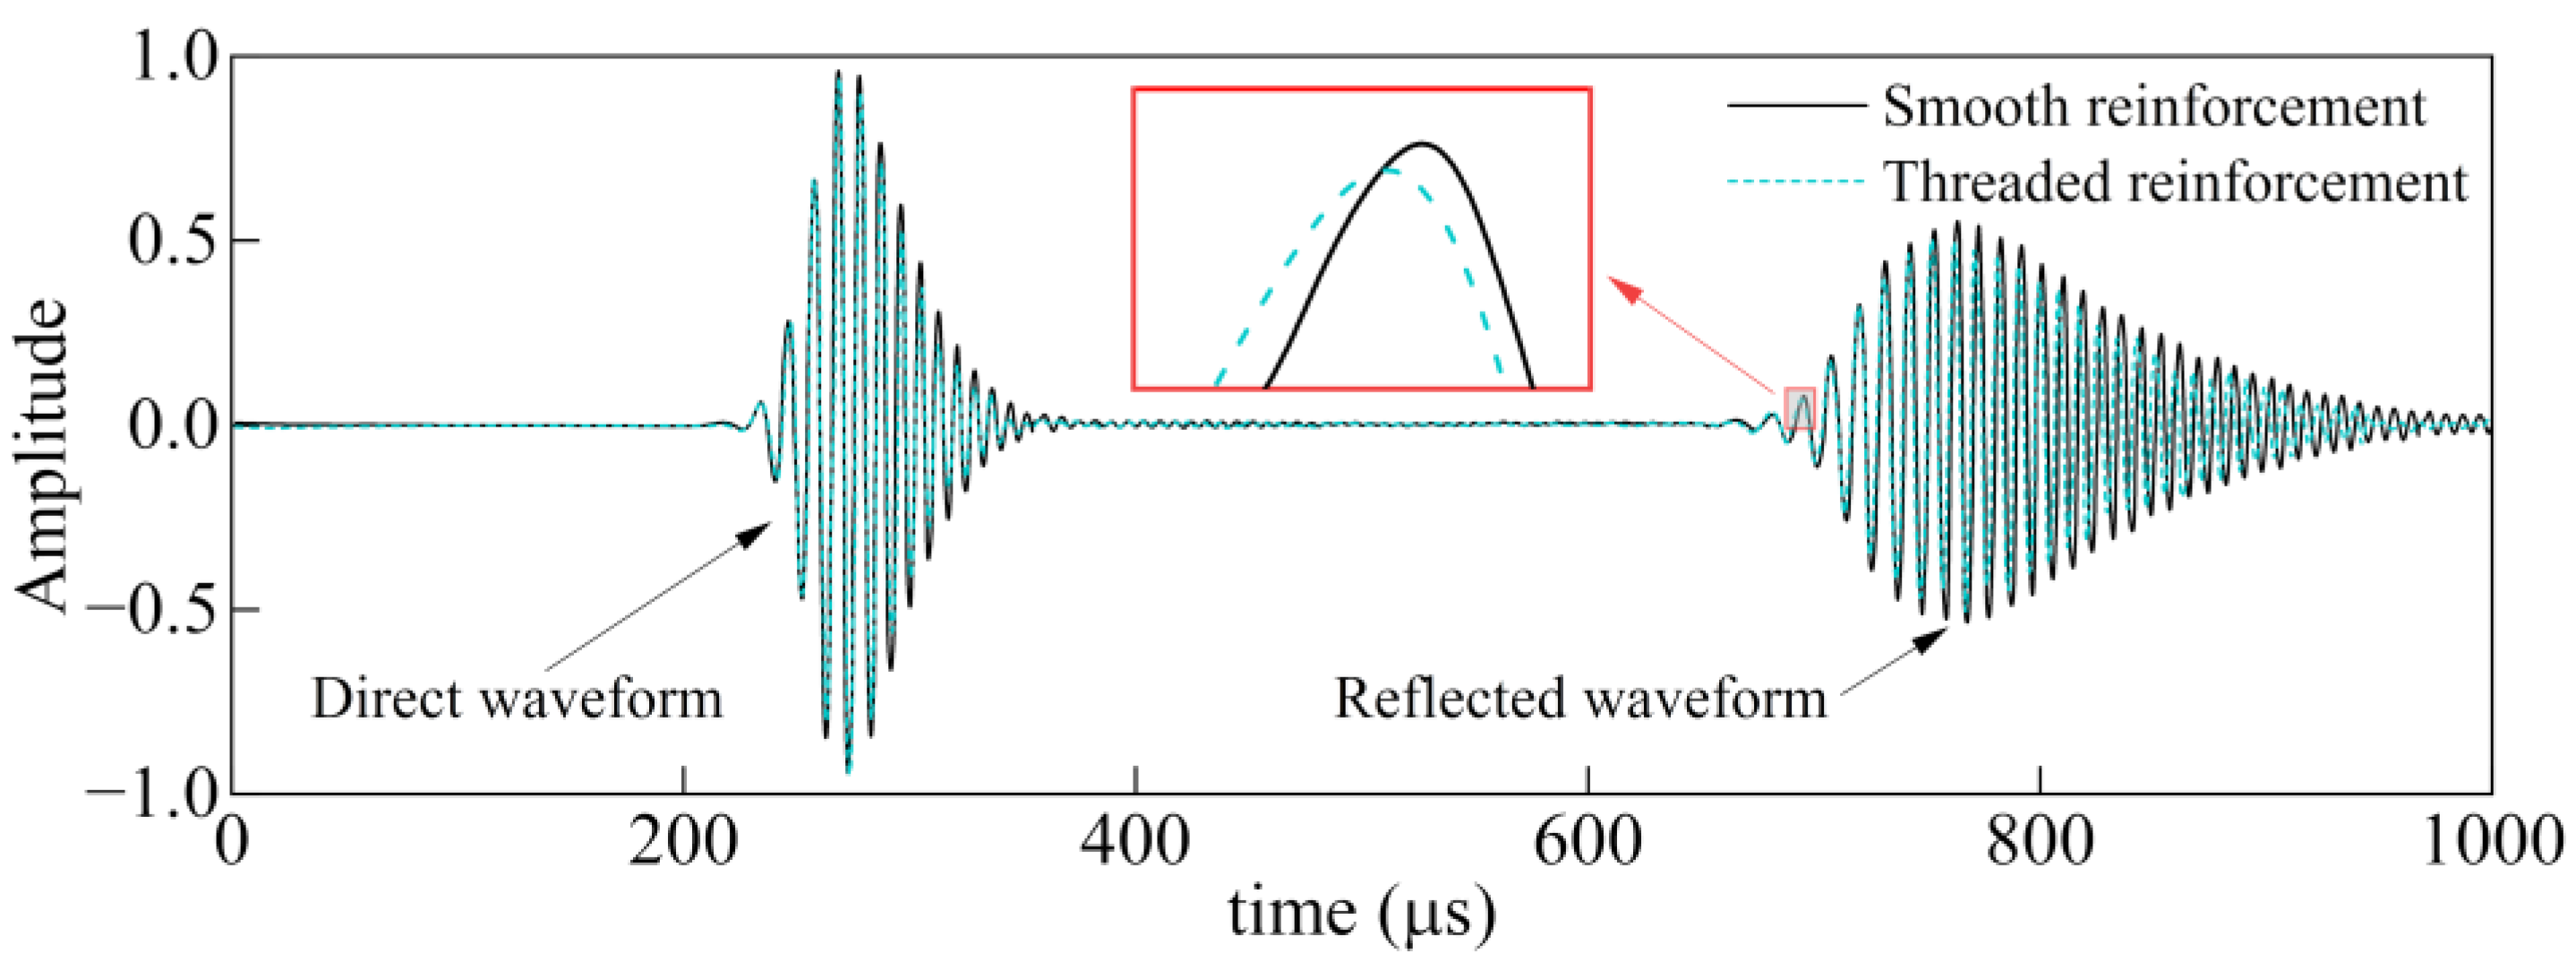
Taking the excitation signal with a frequency of 100 kHz as an example, the time domain signal waveforms at the center node of the rod end face are extracted, as shown in Figure 4, and it is found that the signal waveforms received at the end of the smooth and threaded reinforcement are nearly similar. The corrugation on the threaded reinforcement does not have any significant effect on the GUW propagation property. The wavelength (45.1 mm) of the excitation signal is much larger than the corrugation spacing (10 mm) on the threaded reinforcement. Beard et al. [30] performed a modal analysis of GUWs for threaded reinforcement and found that when the ratio of the wavelength to the feature size of the corrugation is sufficiently large, the modal features are almost unaffected by the corrugation, and the threaded reinforcement can be equivalently treated as smooth reinforcement. This is consistent with the simplified treatment of Ahmed et al. [29], who simulated the propagation of GUWs in reinforcement to study debonding. Therefore, the longitudinal GUWs do not interact with corrugation and generate other wave modes or reflection. In view of this, the smooth reinforcement was used for the corrosion study in RC due to ease of finite element modeling, and geometrical and practical considerations.

3.1.3. Simulation Method for Random Corrosion Pits on Reinforcement Surfaces

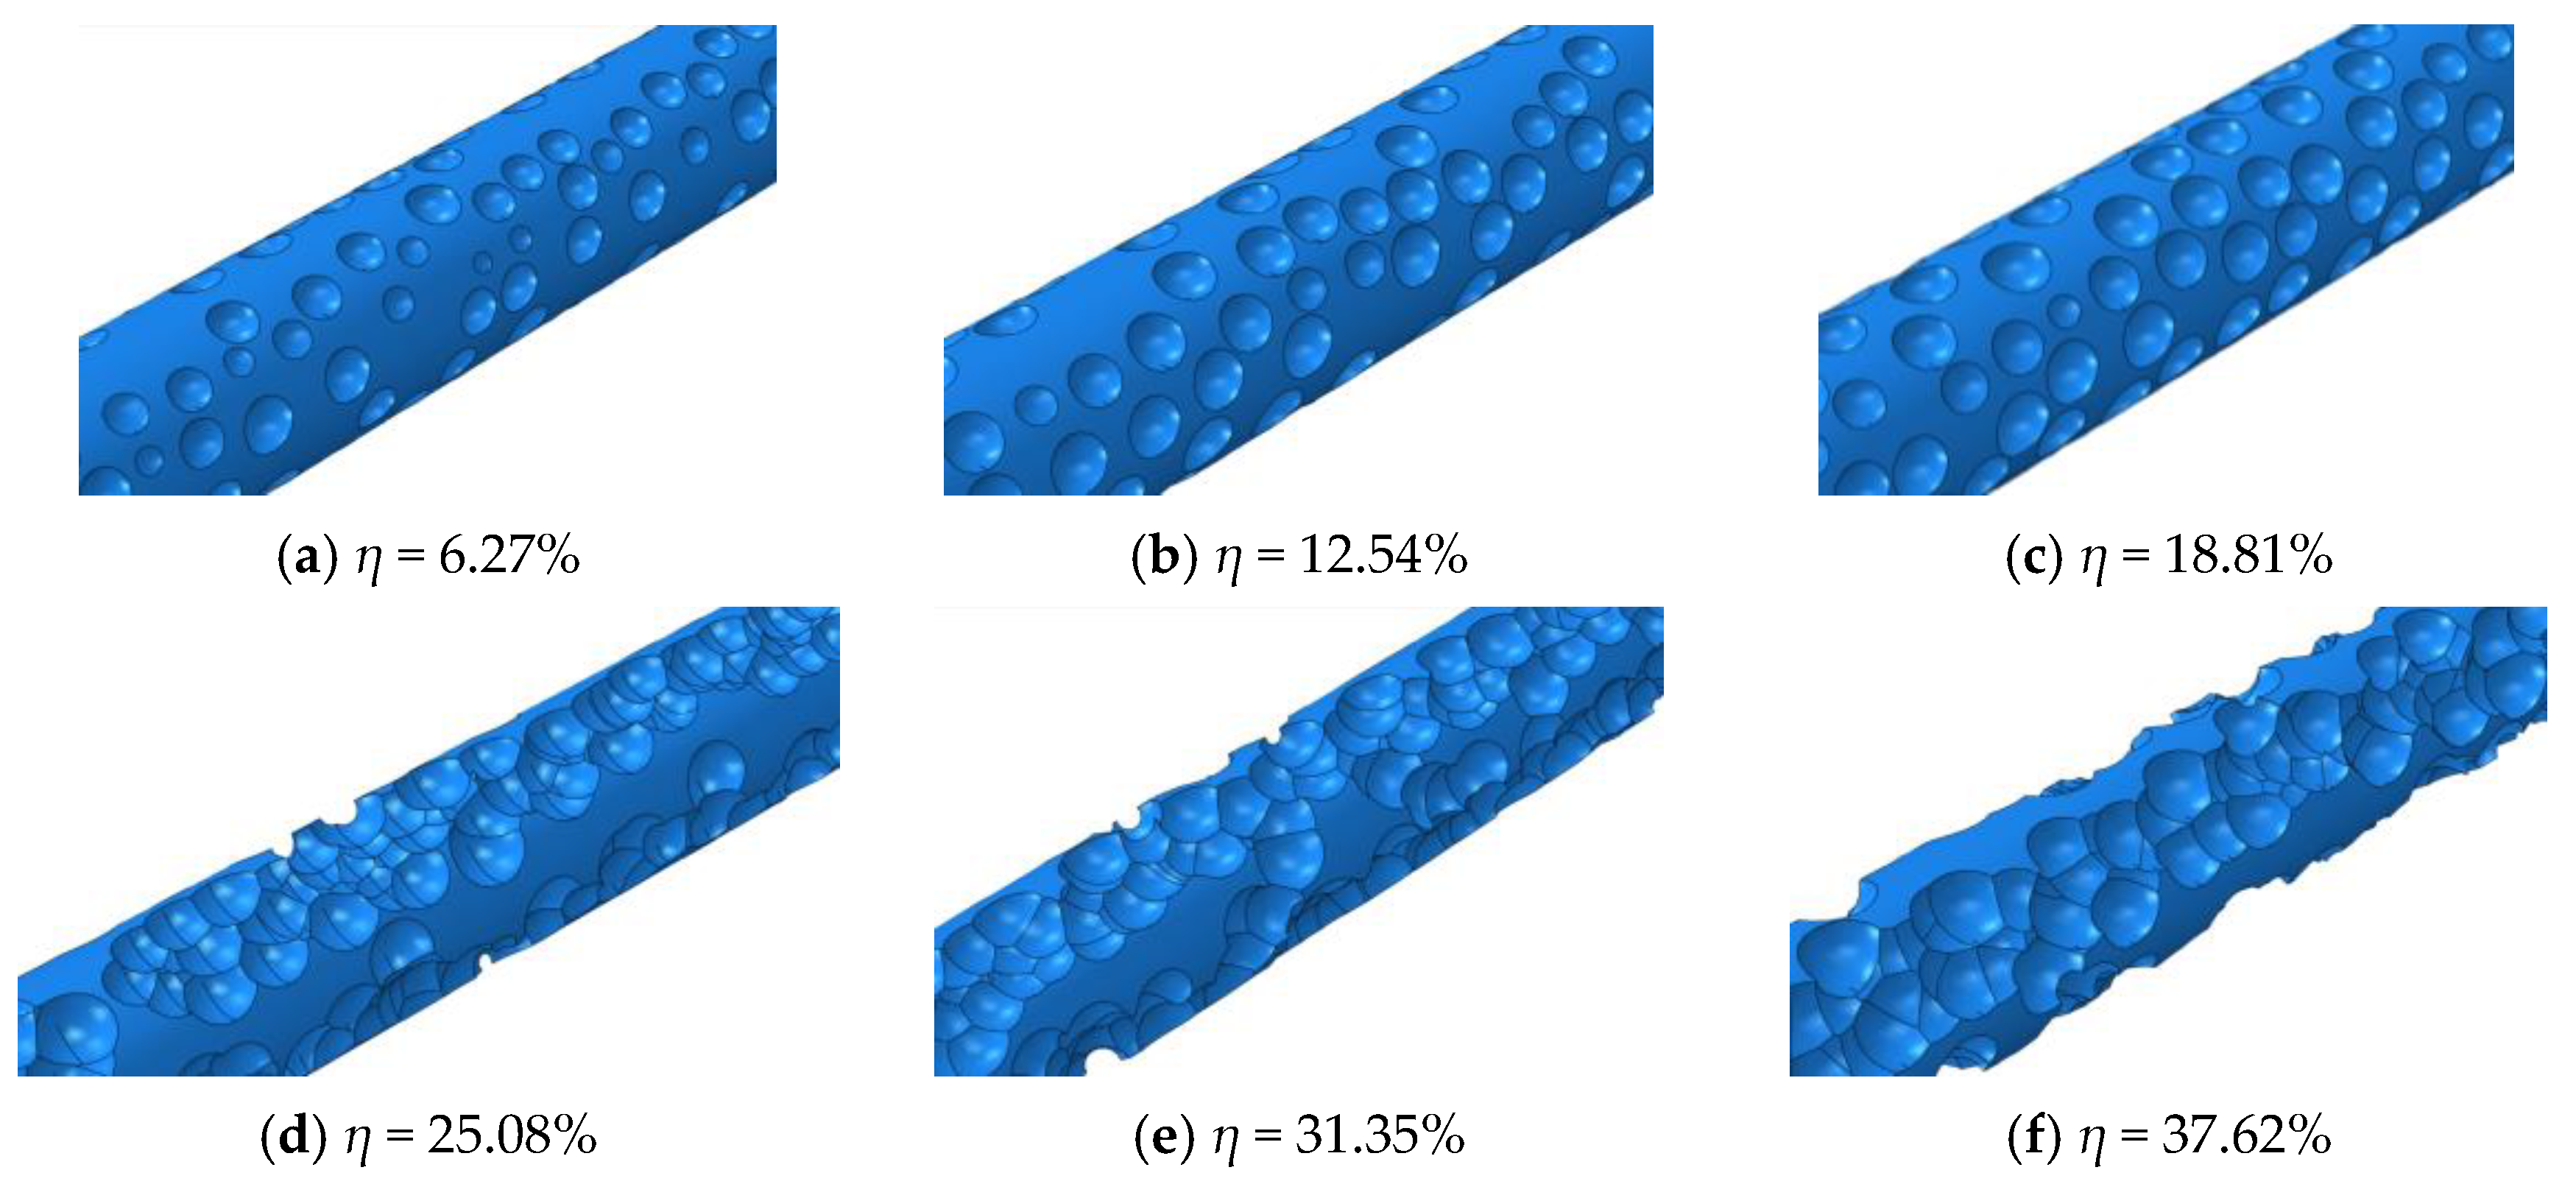
Based on the real morphology, the simulation of corrosion pits is somewhat simplified; that is, the shape of the pits is modeled as a sphere, the position of the pits is uniformly distributed along the surface of the reinforcement, and the depth of the pits obeys a Gaussian distribution. A mathematical model for the probability distribution of the etch pit depth distribution during corrosion was investigated in Ref. [31]. In this paper, the corrosion pit depth is adopted as a Gaussian distribution with average value μ = 0.396 mm and variance σ2 = 0.3052, through drawing on the results of this reference. The relationship (Equation (4)) between the mass loss rate η as a description of the corrosion degree and the pit number n is as described in Ref. [32]. The mass loss rate of the reinforcement under different conditions is calculated from Faraday’s law to determine the number of pits and the average radius of the pits in the finite element model. The code for the random distribution of the pits is written in Python (3.11.15) and imported into ABAQUS (2022) software to produce a geometric reinforcement model with different corrosion degrees, as shown in Figure 5.
η = 1.625 × 1 e n / 224.017 D

3.1.4. Determination of Excitation Frequency

In practical detection, the propagation pattern of GUWs in reinforcement is affected by the dispersion property, which will make the signal analysis difficult and the detection accuracy reduced, so it is especially important to select the appropriate excitation signal. Wu et al. [33] found that it is feasible to select the L(0, 1) mode of GUWs to detect defects in steel rods at specific frequencies, and pointed out that the dispersion phenomenon of the L(0, 1) mode is weak at lower frequencies (such as less than 50 kHz). Sun et al. [34] showed that the excitation of multiple modes should be avoided as much as possible in GUW tests of rods, and that the excitation frequency needs to be selected as flat as possible in the frequency dispersion curve. According to the frequency dispersion curve shown in Figure 2a, it is found that the slope of the curve with a frequency lower than 100 kHz is flatter, which indicates that the dispersion degree is smaller, and the deformation of the GUWs in the propagation process is smaller, which makes it easier to accurately identify the reach time. Therefore, the GUW with a frequency within 50–100 kHz is selected as the excitation frequency. A modulated sinusoidal function with a center frequency of 50, 80, and 100 kHz is used for ultrasonic excitation at the non-completely fixed end face to avoid octave interference.

3.2. Results of Finite Element Simulation

3.2.1. GUW Signals

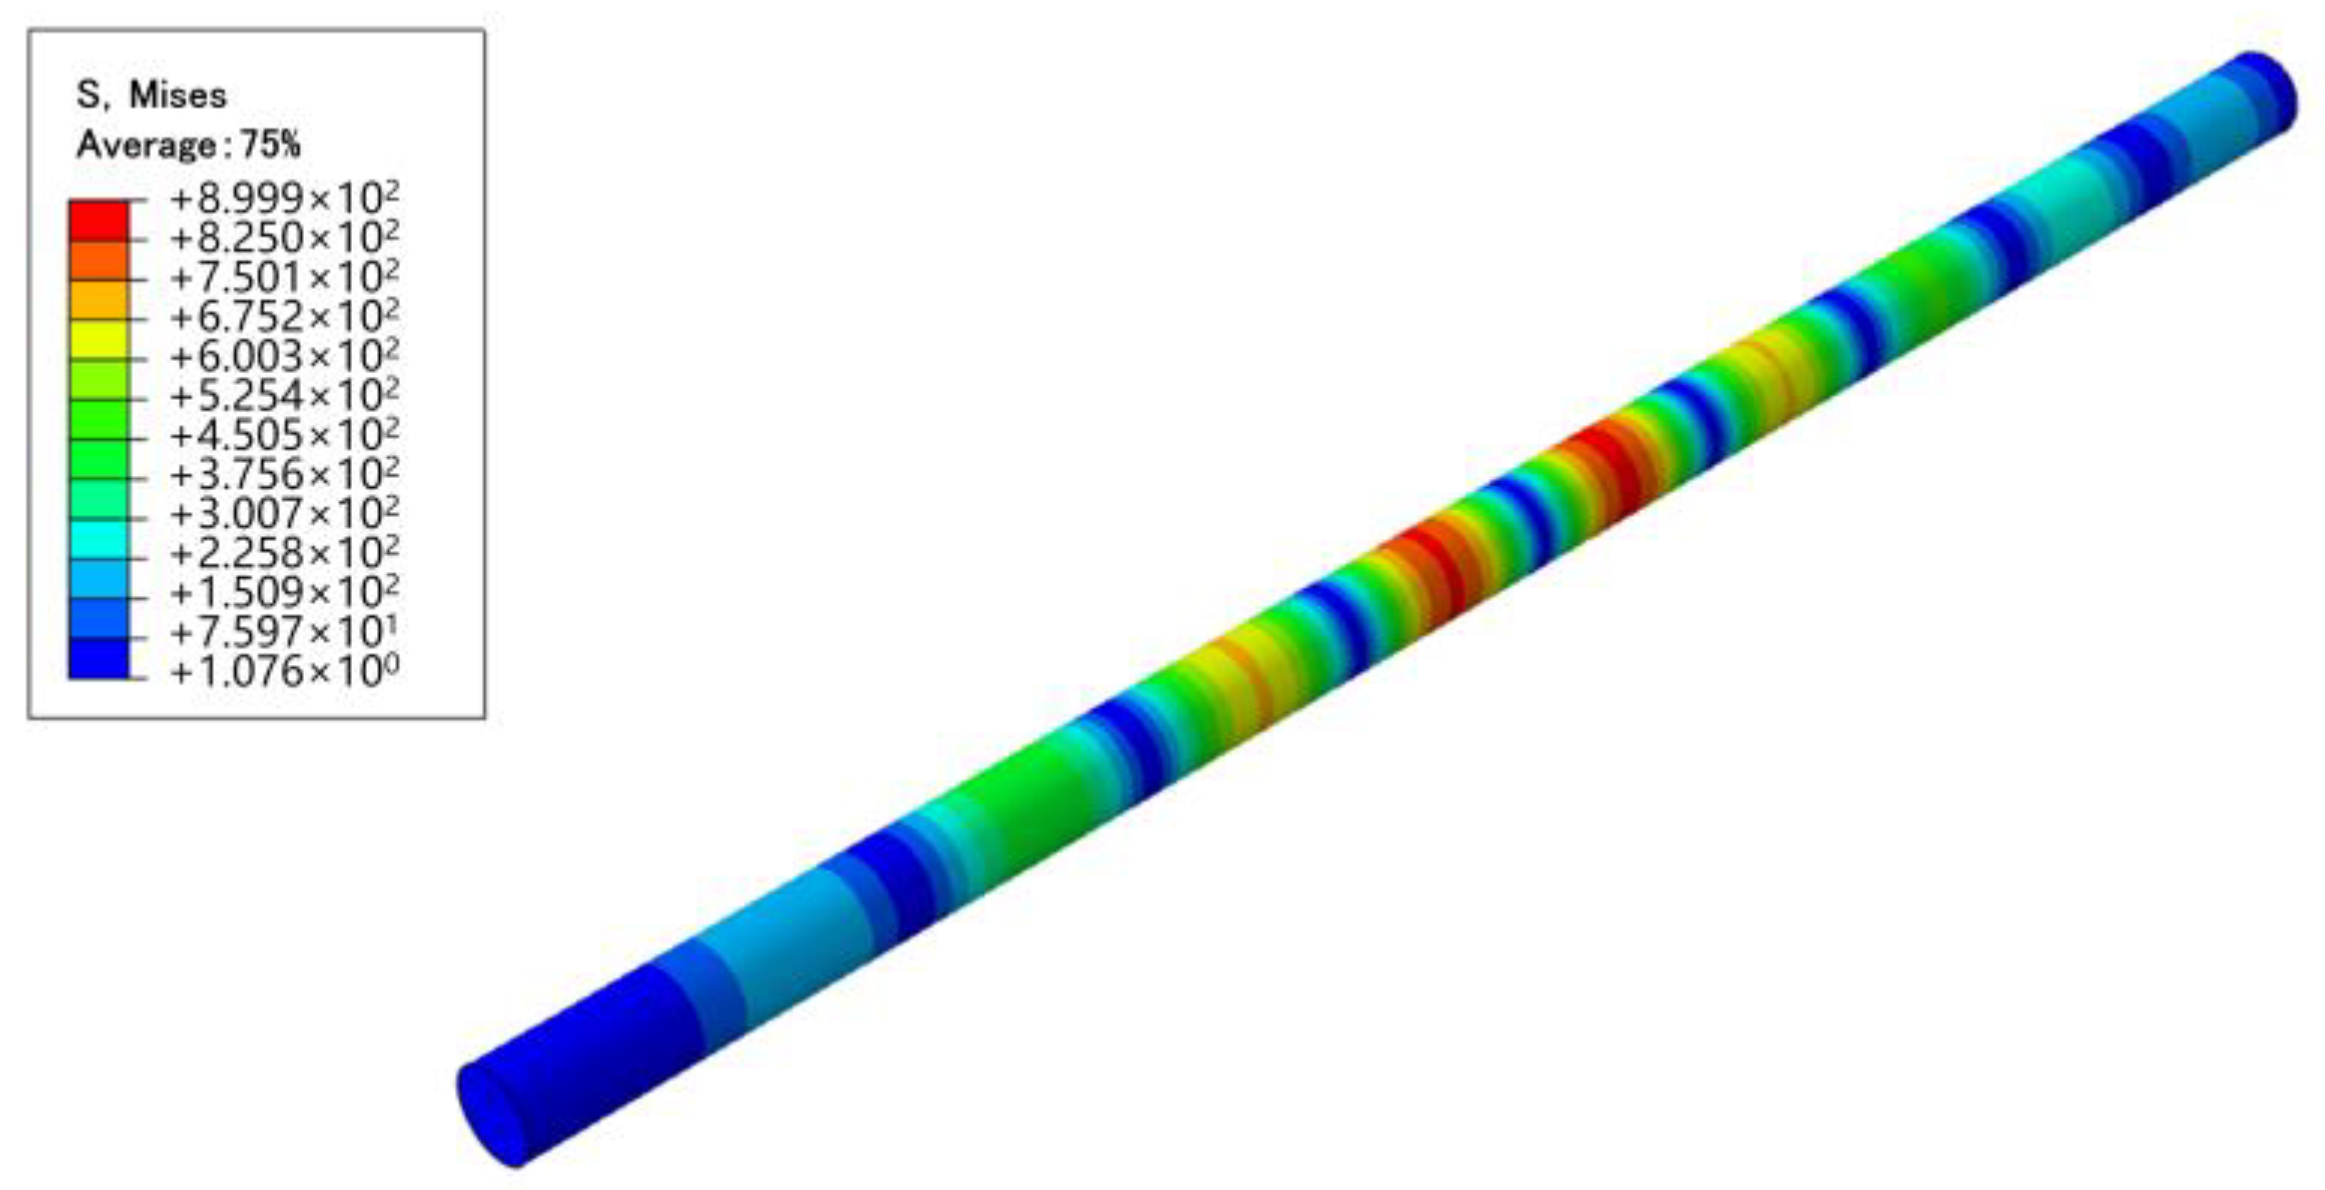
The stress contour of the elastic wave propagating within the reinforcement is shown in Figure 6. The ultrasonic wave forms significant GUWs at the boundaries after multiple reflections, and the axial time domain waveforms of the central node at the end of the reinforcement are extracted for analysis at different corrosion degrees.
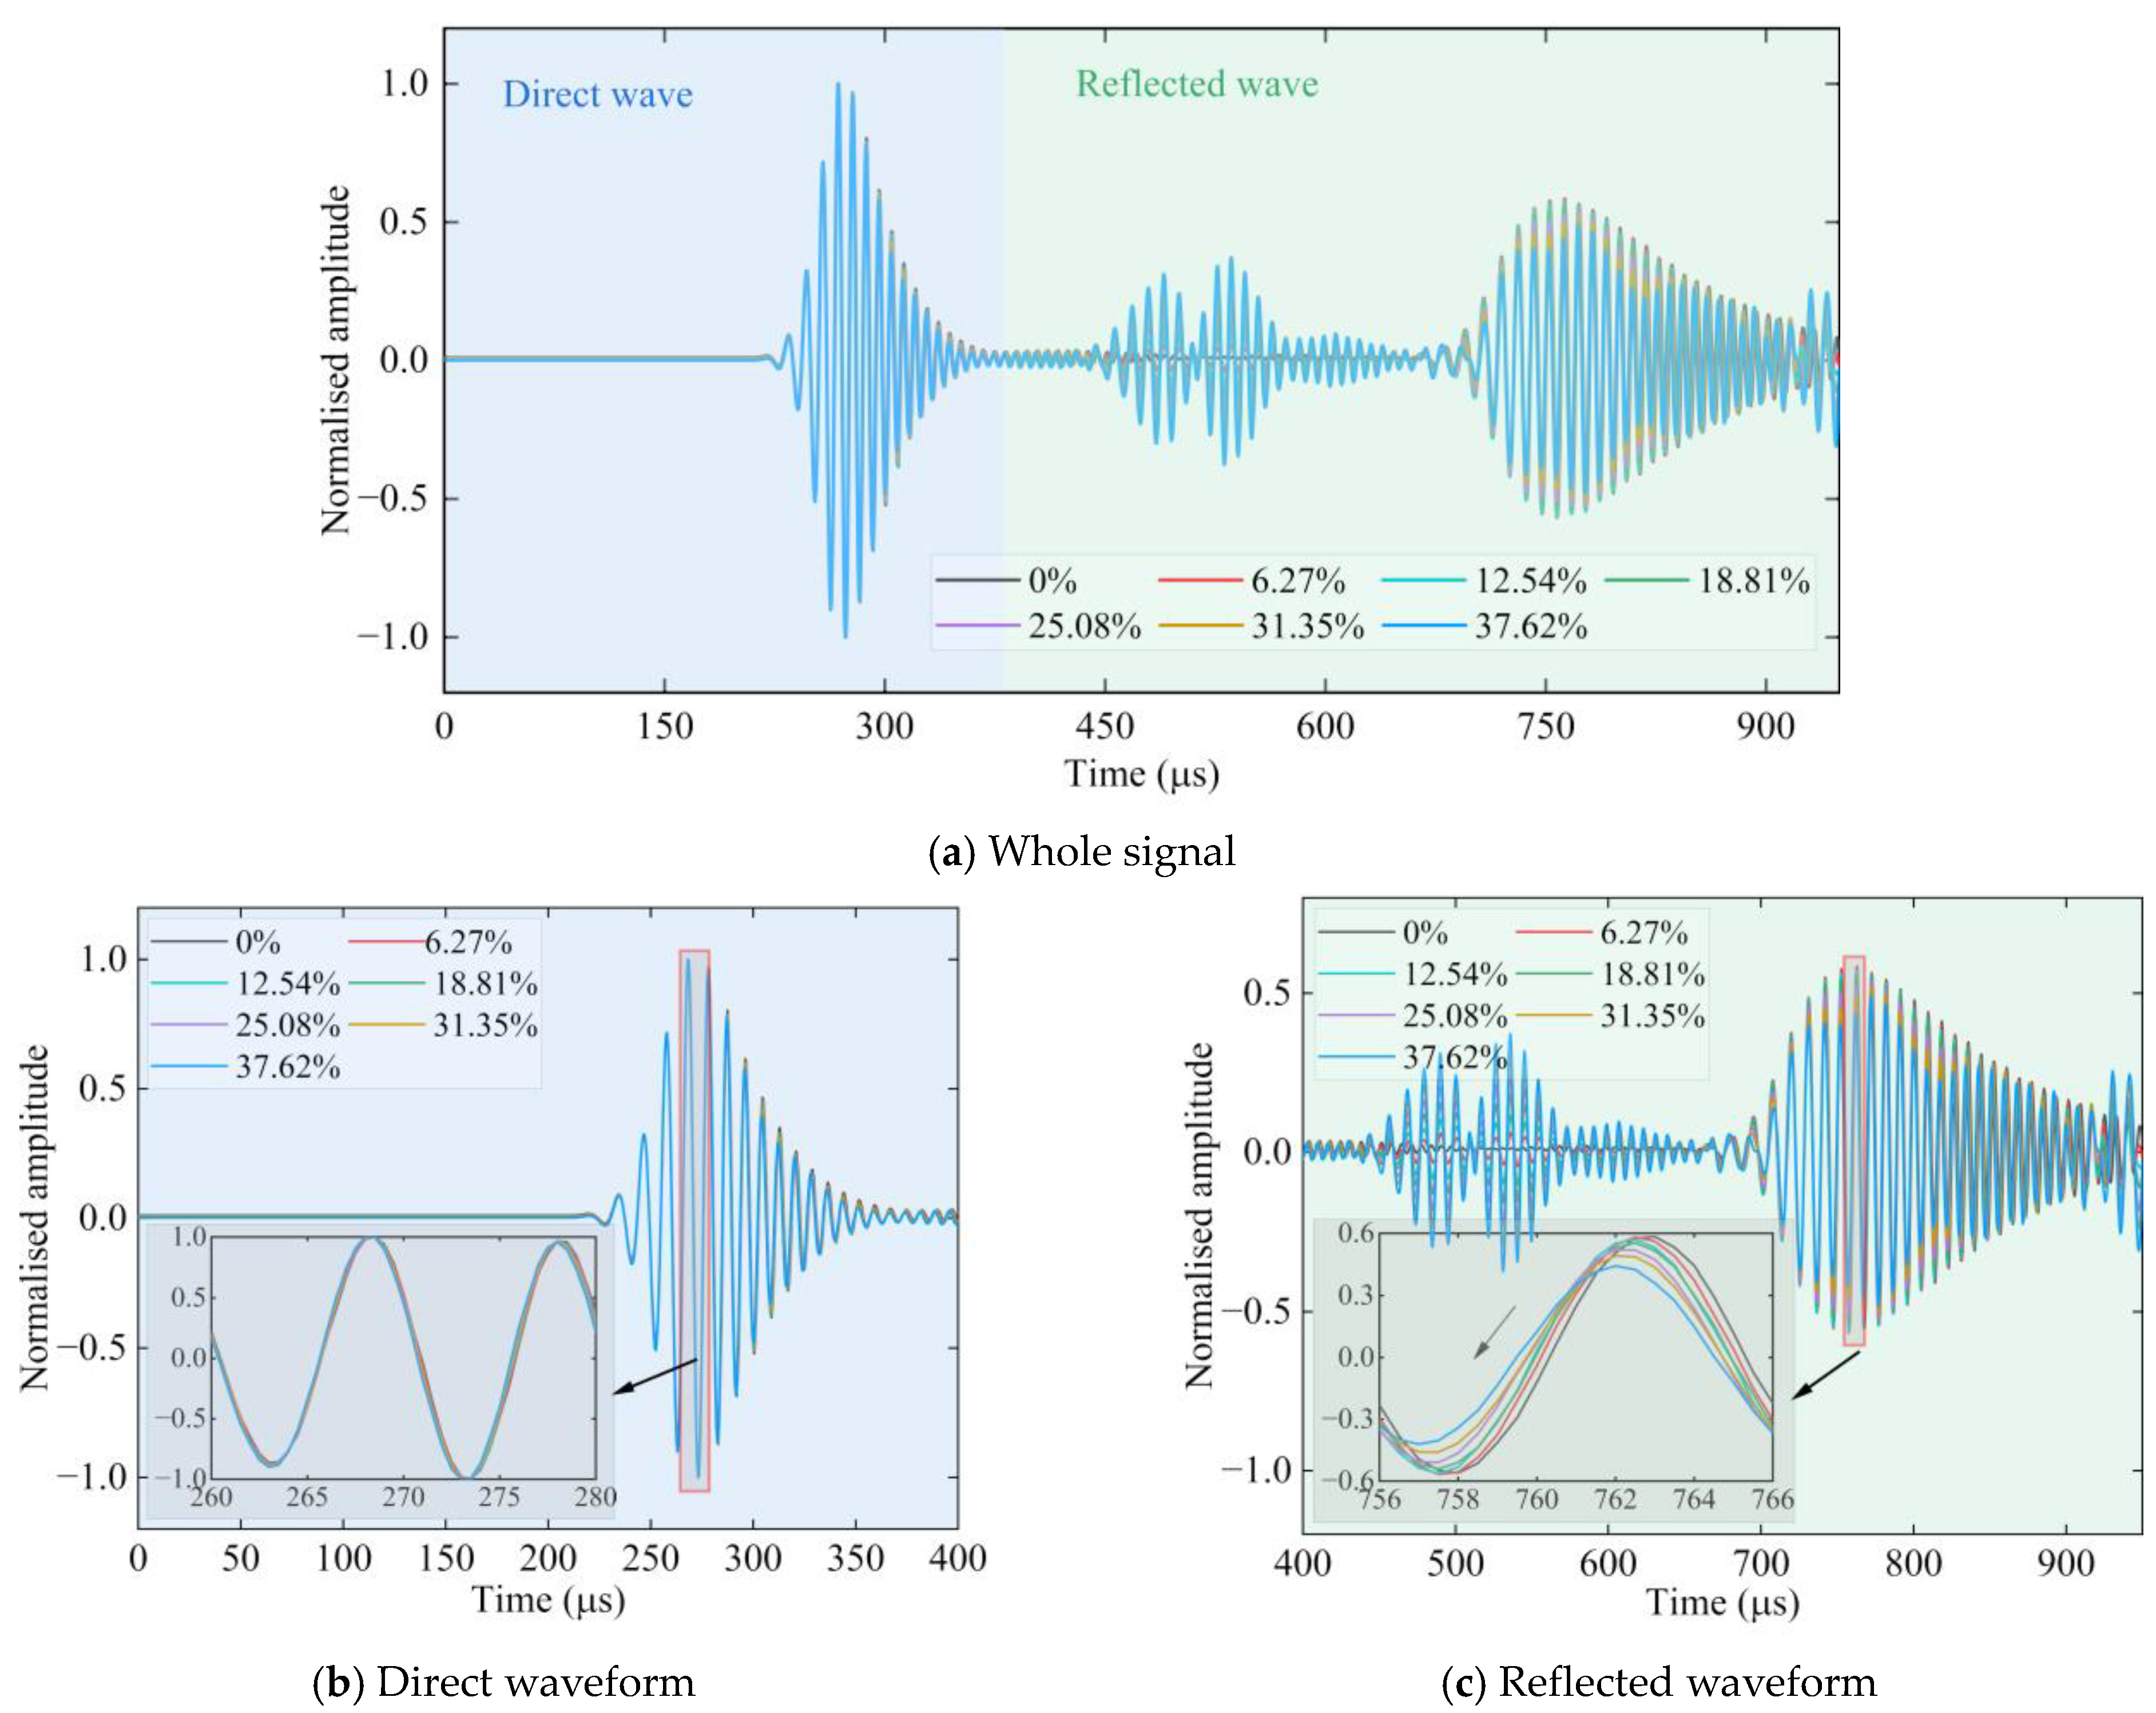
Taking the excitation signal with a frequency of 100 kHz as an example, the GUW signals received at the center of the reinforcement end under different corrosion degrees are shown in Figure 7a, where the direct waveform is shown in Figure 7b, and the reflected waveform is shown in Figure 7c. From the GUW waveforms of different corrosion degrees, it can be seen that the waveforms show a regular change as the corrosion degree increases; that is, the amplitude decreases, and the waveform moves forward, indicating that the amplitude decreases with the increase in the corrosion degree, and the arrival time also decreases. This is generally consistent with current research findings [35], and some studies [36,37] have shown a more obvious trend in the amplitude relative to the acoustic time difference.

3.2.2. Damage Index

Corrosion products generated by the reinforcement in concrete cause cracks, rust pits, and other defects. It causes different reflection, scattering, diffraction, etc. when the GUW propagates in the reinforcement under different corrosion degrees. During initial corrosion, the volume of the corrosion products increases and then penetrates into concrete, resulting in a denser interface transition zone, which can mitigate the gradient difference of impedance and allow for more energy to be transmitted into the concrete [38]. Cracking leads to the contact between the reinforcement and air, and the impedance difference between the reinforcement and air is larger than that between the reinforcement and concrete, thereby reducing the energy leak from the reinforcement.
The damage index (DI) is a quantitative analysis of the response and monitoring of GUWs to corrosion damage by associating corrosion damage with some characteristic of the response signal of GUWs. To study the influence of corrosion damage on the propagation of GUWs in structures, five damage indexes characterizing the corrosion degree, such as the time domain cross-correlation (TDC), time domain difference (TDD), spectrum amplitude difference (SAD), mean square difference (MSD), and normalized correlation moment (NCM), are proposed in this paper based on existing research [39,40].
(1)
DI-TDC
The TDC is based on time domain signal correlation and focuses on obtaining the time domain waveform of the signal over time.
DI - TDC = 1 t 0 t 1 b t μ b t m t μ m t d t σ b t σ m t   ,
where t is time, b(t) is the reference signal corresponding to the uncorroded state, and m(t) is the detection signal corresponding to different corrosion degrees. t0 and t1 are the start time and stop time corresponding to the time window of the detection signal, respectively. µb(t) and µm(t) are the average values of the signal, while σb(t) and σm(t) are the variances of the signal.
(2)
DI-TDD
The principle of the TDD is that the detection signal is first normalized by α, which is the scale factor of the reference signal, then calculated from the minimum of the mean squared difference between the normalized detection signal and the reference signal. Therefore, the difference between the signals reflected by the TDD is independent of the signal amplitude.
DI - TDD = t 0 t 1 d ˜ 2 t d t = t 0 t 1 d ˜ 2 t d t   ,
where d ˜ t = D ˜ t α b t ; D ˜ t = m t / t 0 t 1 m 2 t d t ; D ˜ t = m t / t 0 t 1 m 2 t d t .
(3)
DI-SAD
The SAD is based on the amplitude of the signal to measure the difference in the frequency response amplitude of the signal, and is calculated as follows:
DI - SAD = ω 0 ω 1 b ω m ω 2 d ω ω 0 ω 1 b ω 2 d ω   ,
where b ω = t 0 t 1 b t e j 2 π f t d t ;   m ω = t 0 t 1 m t e j 2 π f t d t ; ω0 and ω1 are the start and stop frequencies corresponding to the spectral window of the signal, respectively.
(4)
DI-MSD
The definition of MSD is as follows:
DI - MSD = σ m t σ b t σ b t   ,
where σ m t = i = 1 N m t μ m t 2 / N 1 ; σ b t = i = 1 N b t μ b t 2 / N 1 ; the numerator of the MSD measures the difference between the overall mean square of the reference and detection signals, while the denominator is the mean square of the reference signals, which plays a finite normalization role. The difference in the overall mean squared deviation of the signal is also measured to exclude the influence of signal phase changes.
(5)
DI-NCM
The NCM can reflect the variation in the whole signal waveform in terms of both the amplitude and phase, and is calculated as follows:
DI - NCM = t 0 t 1 τ n r x x τ d τ t 0 t 1 τ n r x y τ d τ t 0 t 1 τ n r τ d τ   ,
where n is the order number of the correlation moment, which may not be an integer. rxy(τ) is the correlation between the signals x(t) and y(t), and the signal time domain length is [t0, t1], where τ is a lag parameter. As can be seen from Equation (10), the NCM is negative when the detected signal amplitude is greater than the reference signal and takes on a value in the range [0, 1] when the signal amplitude decreases due to damage.
r x y τ = + x t y t τ d t   .
To further investigate the effect of different excitation frequencies on the characterization of each DI at different corrosion degrees, the DIs at different corrosion degrees are shown in Figure 8, and the waveforms are analyzed at three excitation frequencies (50, 80, and 100 kHz). It can be seen from Figure 8 that each DI at different frequencies has a monotonically increasing relationship with the mass loss rate η. The sensitivity (change degree) of the five DIs to the mass loss rate η from strong to weak is DI-SAD > DI-MSD and DI-NCM > DI-TDC and DI-TDD. Therefore, the next section preferentially adopts the changing pattern between DI-SAD and the corrosion degree of the reinforcement. Another advantage of DI-SAD is that its calculation process does not involve mode separation. The normalized DI-SAD increases with the increase in the frequency; that is, the ability to characterize the change in the corrosion degree increases with the increase in frequency. Hence, selecting the center frequency of 100 kHz sine function excitation signal is superior.

4. Testing of Corroded Reinforcement

4.1. Testing Procedures

The coupled tests on corrosion and ultrasonics for the reinforcement and RC are shown in Figure 9. The parameters for these two materials are shown in Table 1, where the diameter of the covered concrete is 75, 110, and 160 mm. NaCl solution with a 5% mass percentage is used as an electrolytic medium.
In the corrosion circuit, the carbon rod acts as the cathode and the reinforcement acts as the anode. The absorbent cloth is used to cover the surface of the specimen to ensure that it is always saturated. Chloroprene rubber is applied to the exposed parts of the reinforcement to ensure the accuracy of the test results and to prevent erosion damage to the anode leads at the end of the reinforcement. After conducting the test, the DC power supply is activated, and the corrosion status of the specimen is observed periodically. The DC power supply is cut every 24 h for the corrosion detection tests with GUWs. The termination corrosion times for the RC specimens with covered diameters of 75, 110, and 160 mm are 216, 264, and 360 h, respectively.
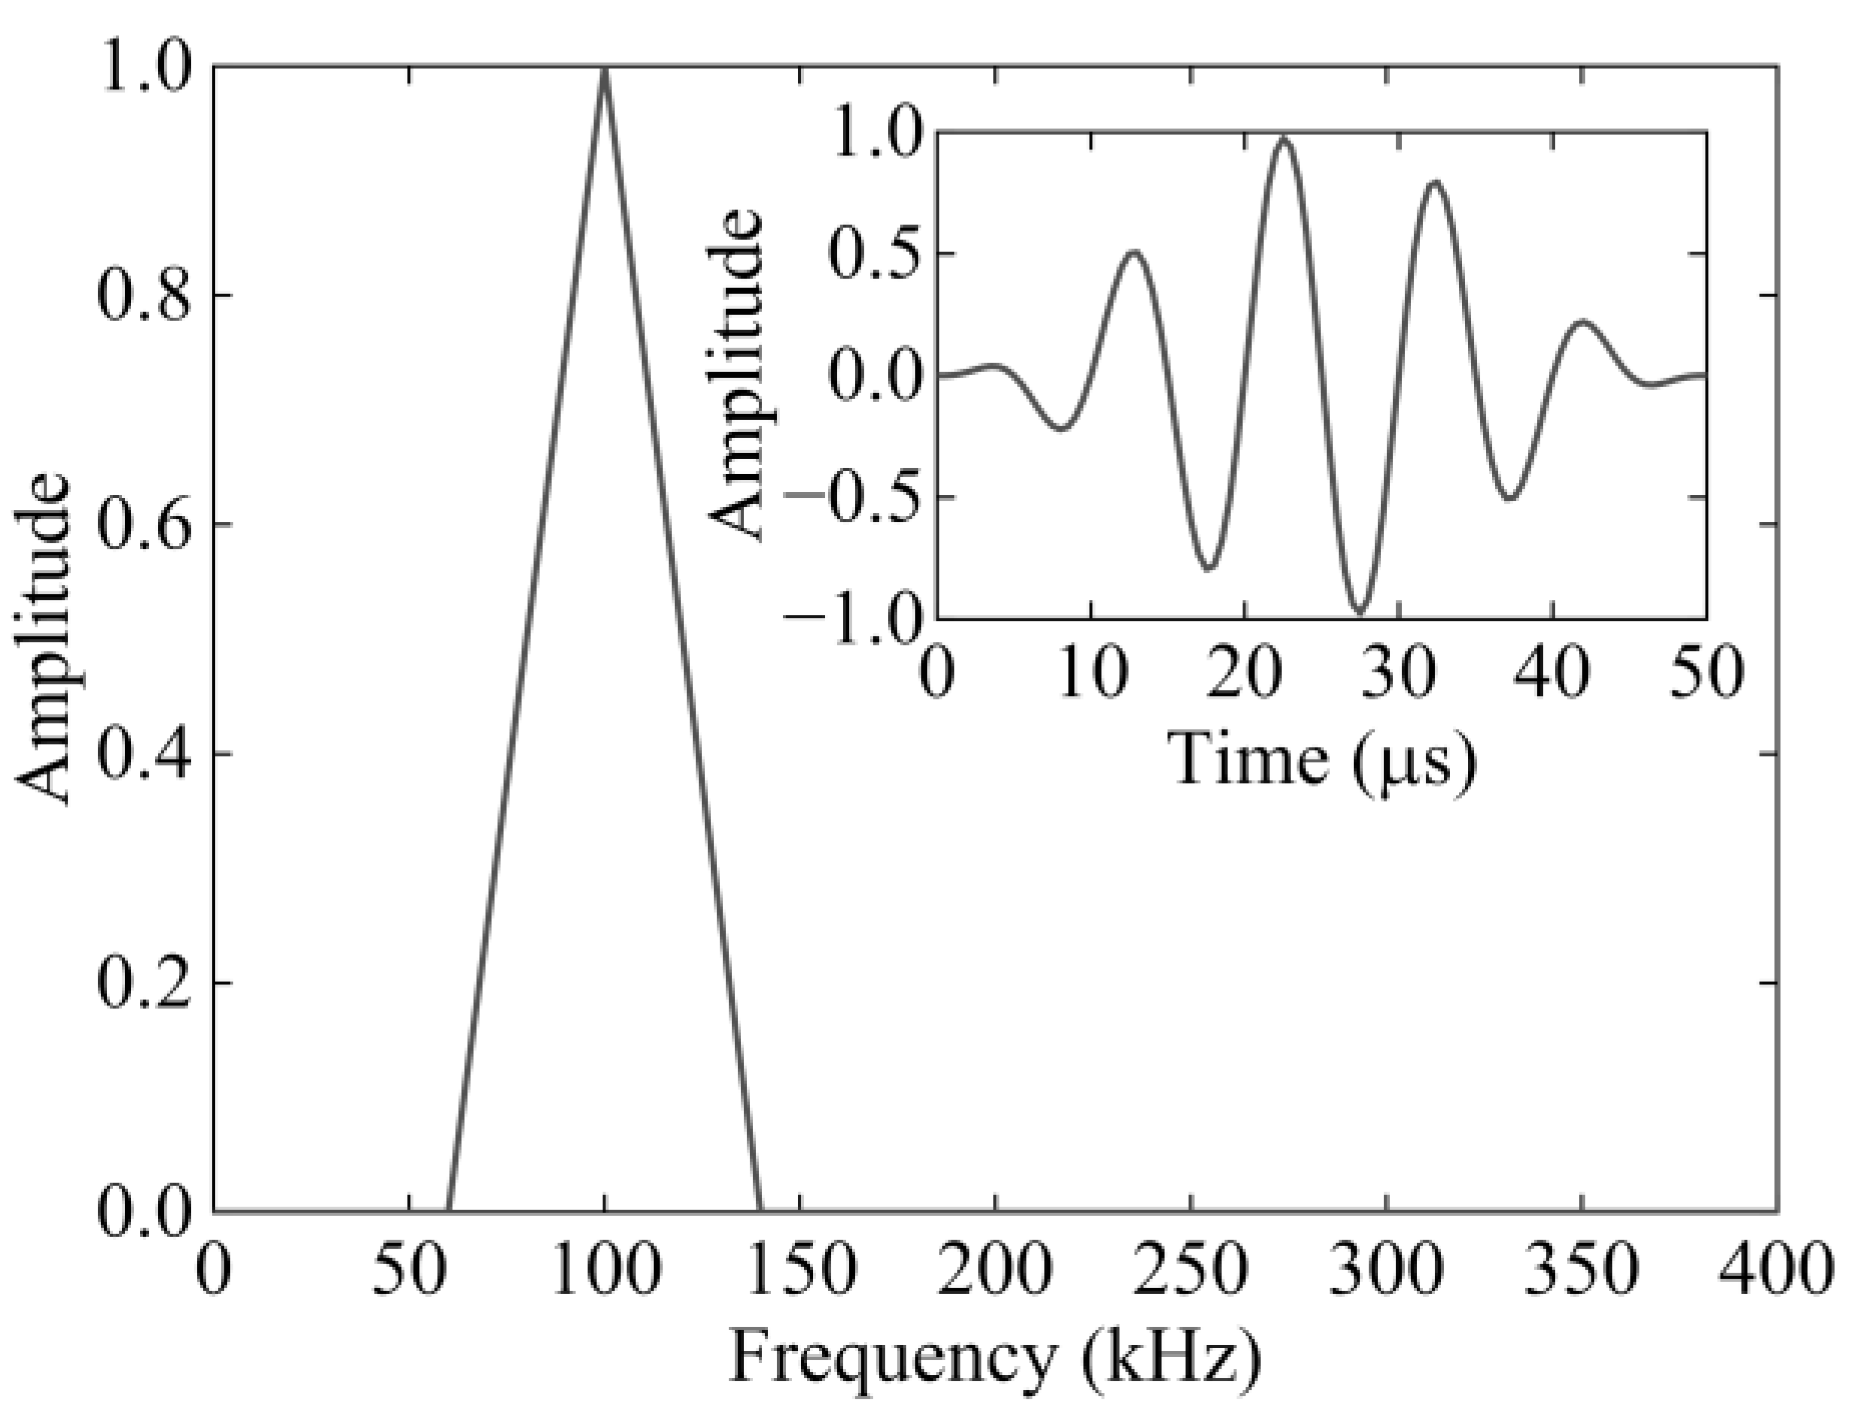
In the ultrasonic system, a 100 kHz sinusoidal signal (Figure 10) is selected as the ultrasonic excitation signal. The sampling frequency is 2 MHz, and the signal collection method is TRA (Time-Reverse Acoustics) mode. To ensure data stability, the detection data from the two receiver transducers must also be tested continuously for lead breakage until the signal amplitude difference between the two is less than 3 dB and then switched to the TRA collection mode. The corrosion test of reinforcement is stopped every 24 h, and the rust on the reinforcement corrosion area is wiped clean, and the remaining mass is weighed so as to calculate the mass loss rate, that is, the corrosion degree at this stage. The process is repeated until the end of a predetermined time. To ensure the regularity of the test results, the transducer is kept attached to the reinforcement throughout the test period.

4.2. Test Results for Bare Reinforcement

4.2.1. Mass Loss Rate of Reinforcement

Reinforcement with different corrosion degrees is produced by controlling the corrosion time through corrosion tests, and the mass loss of reinforcement is shown in Table 2. It can be seen that the reinforcement mass loss rate is linearly related to the corrosion time and that the mass loss rate observed in the tests is in general agreement with the theoretical value derived from Faraday’s law. Therefore, the mass loss at any time can be estimated according to Faraday’s law. In order to ensure the unity of the full text and facilitate the comparison between the finite element and the test, the theoretical mass loss rate will be used as the actual corrosion degree to analyze the results.

4.2.2. GUW Signals and DI-SAD of Reinforcement

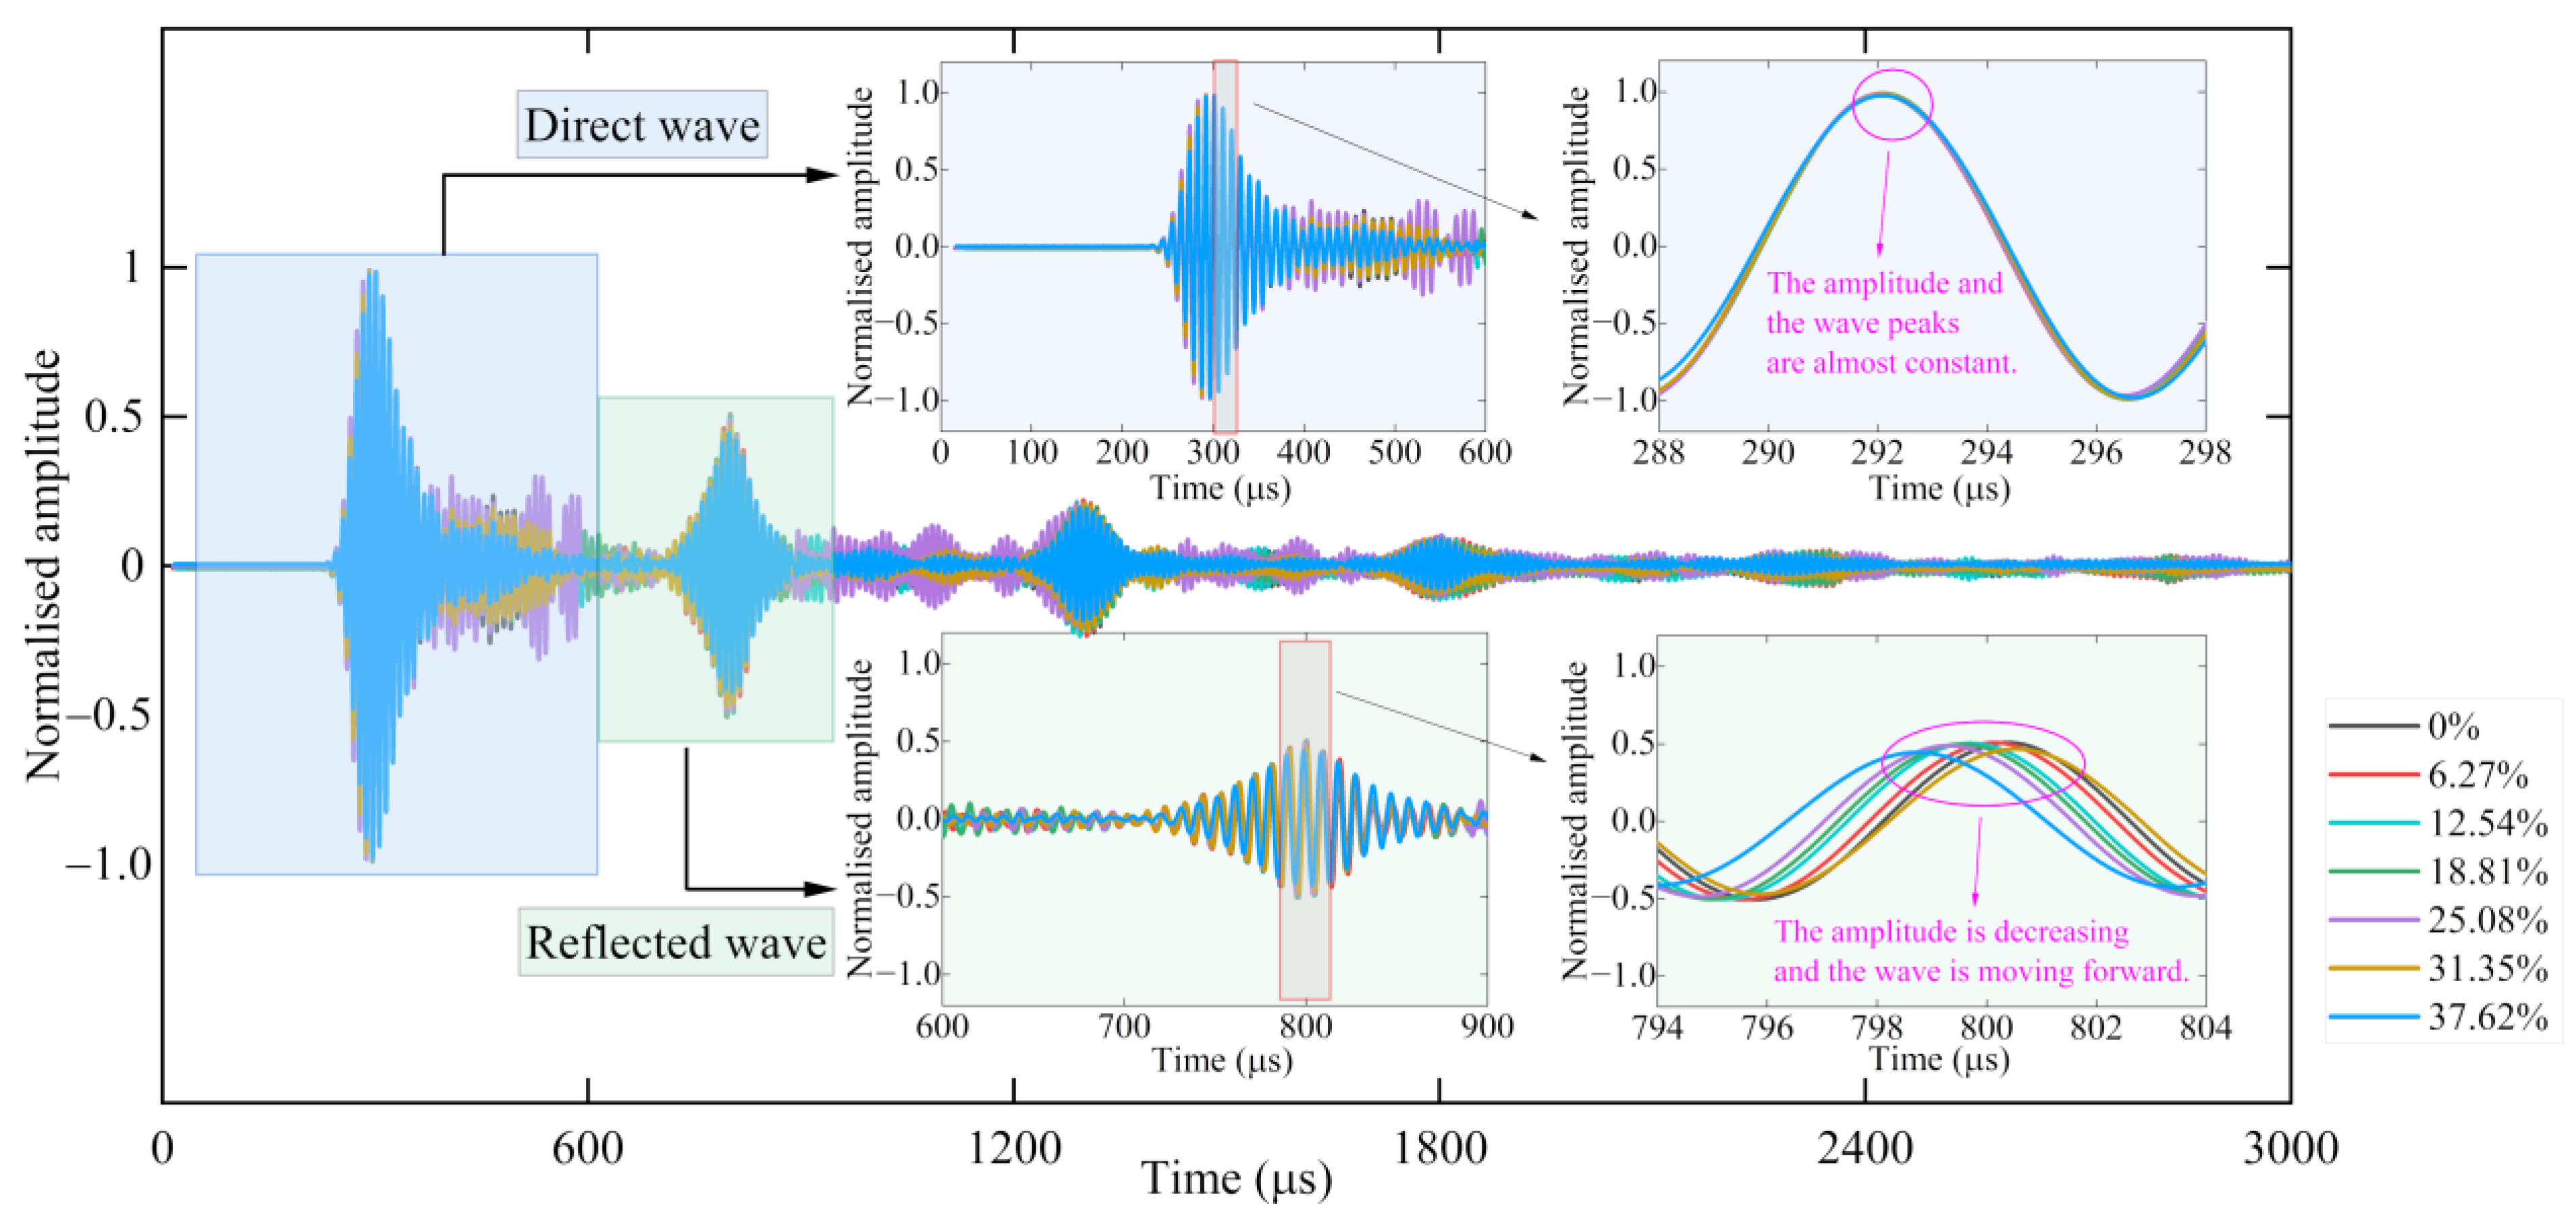
As shown in Figure 11, ultrasound waves propagate within the reinforcement and form GUWs under 100 kHz sinusoidal pulse excitation, and evidently reflected waves can be seen. The direct waveforms of the reinforcement at different corrosion degrees are not visibly different after amplification. When the reflected waves are formed, the waveforms of the GUWs with different corrosion degrees are different. From the direct waveforms, it can be seen that the time corresponding to the peak of the direct wave is almost the same (about 292 μs) for reinforcements with different corrosion degrees. From the reflected waveforms, it can be seen that with the increase in the corrosion degrees, the reflected waveforms of reinforcement show a forward shift and its peak value gradually decreases, that is, the time corresponding to the peak value gradually decreases (from 800.27 μs to 798.58 μs). In conclusion, the greater the corrosion degree, the lower the waveform amplitude and the lower the arrival time.
It has also been noted that the amplitude of the reflected wave is significantly decreased with respect to the direct wave, and Sun et al. [41] pointed out that this decreasing trend conforms to an exponential function. This is due to the refraction and scattering of the reflected wave after passing through the interface between the two media. Part of the energy is reflected back while the other part propagates through the medium during the GUW propagation. This results in the decrease in the amplitude of the reflected wave compared with the direct wave.
It can be seen in the frequency dispersion curve shown in Figure 2a that the group velocity of the reinforcement is 4510 m/s at a frequency of 100 kHz. The propagation velocities of the specimens in the finite element and test studies were calculated from the arrival times of the absolute peak amplitudes: The propagation velocity of the GUW in the reinforcement in finite elements is 4449 m/s according to Figure 7b,c; the propagation velocity of the GUW in the reinforcement in the test is 4329 m/s according to Figure 11. It can be seen in Figure 12 that the deviations in the propagation velocities obtained by these three are small, all within the 4% deviation range. This further validates the correctness of the finite element method and test. For the reinforcement embedded in concrete, various longitudinal GUW modes are observed at a single frequency, which makes it complicated to separate the wave modes and calculate the group velocities. Considering this complexity, the group velocity dispersion is only validated for bare reinforcement.
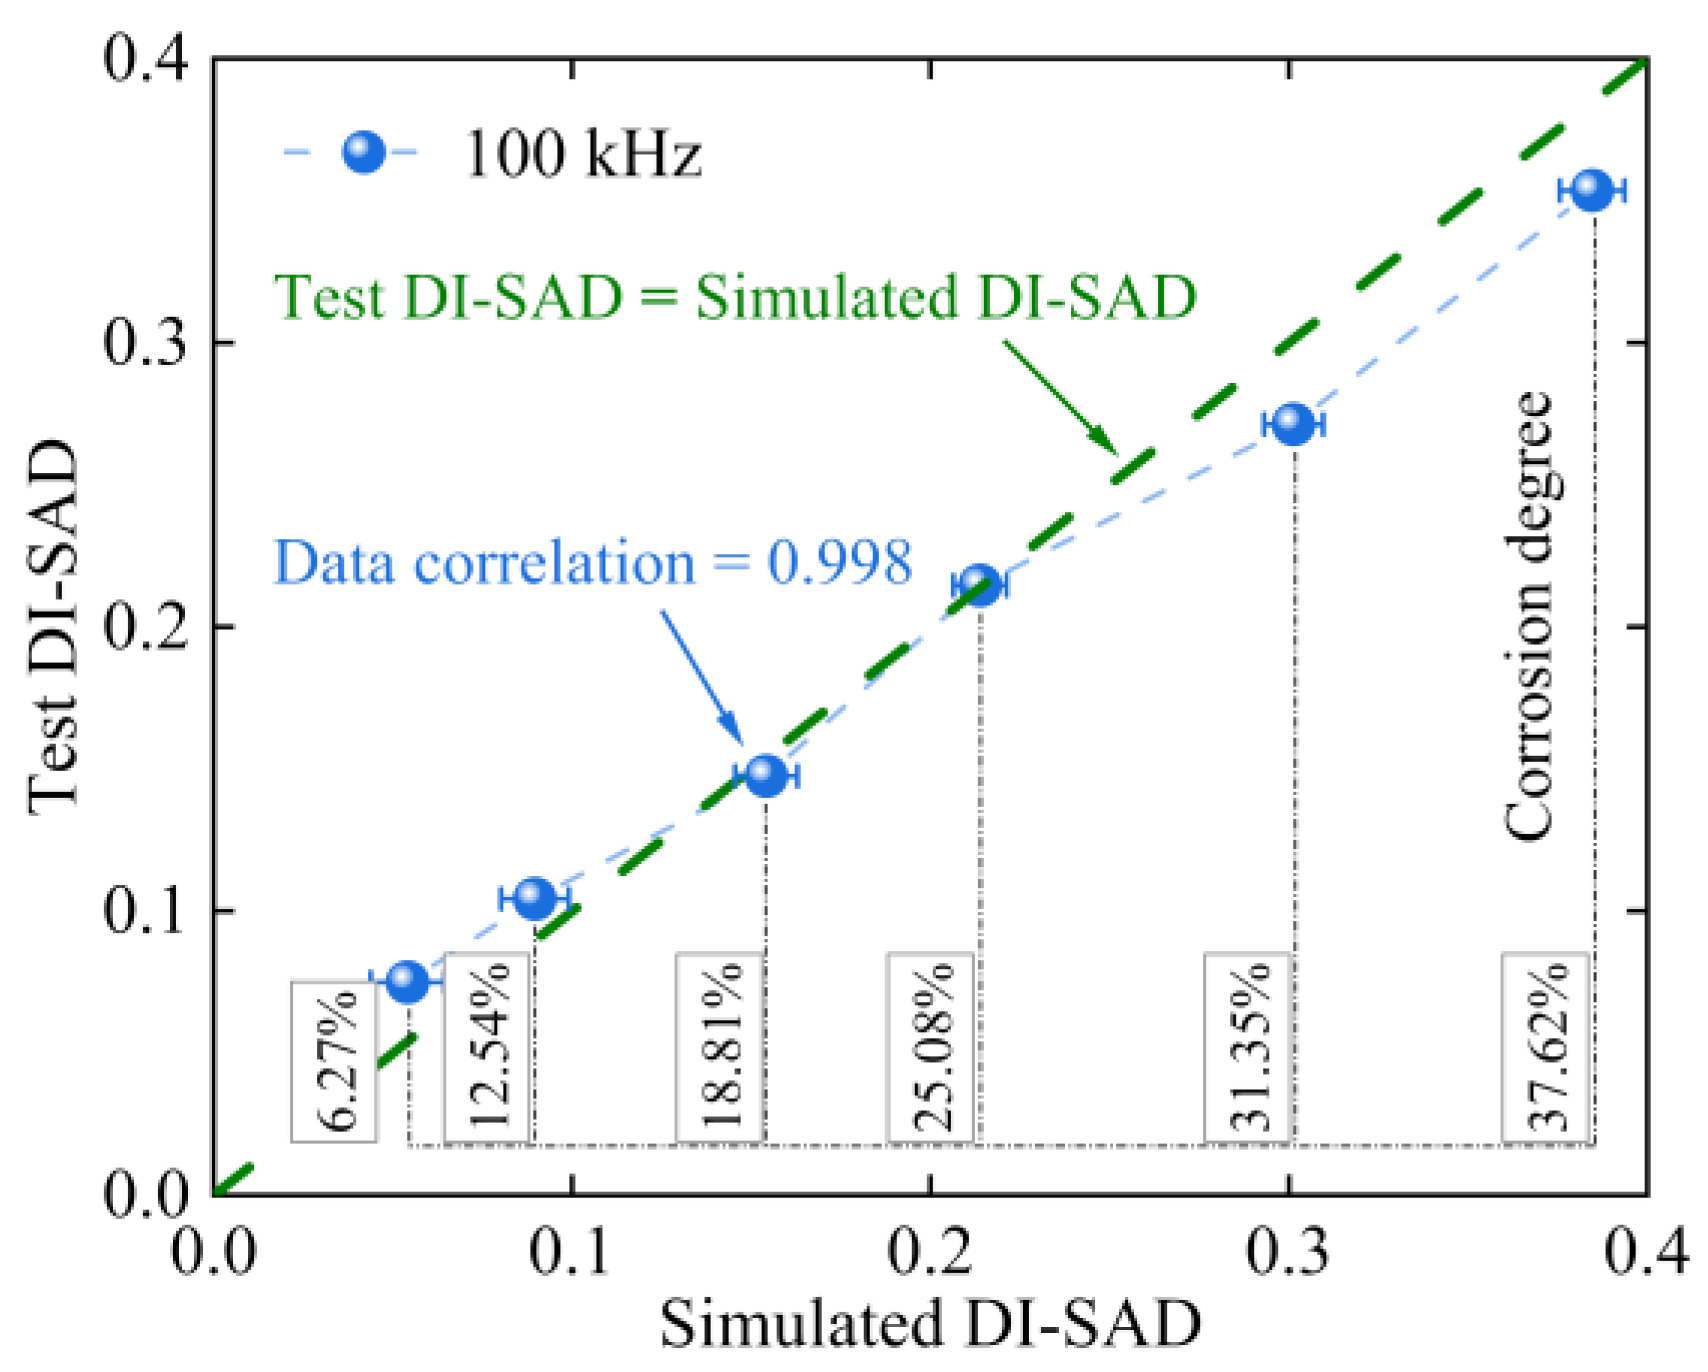
The same excitation frequency as the finite element simulation is used, and the test and simulated DI-SAD obtained after amplitude normalization are compared, as shown in Figure 13. The results show that the changing trend between the DI-SAD and corrosion degree of the corroded reinforcement is consistent. The sensitivity of the index is positively correlated with the frequency of the GUWs. Overall, both the test and simulated results indicate that it is feasible that the DI-SAD can be used as an index for determining the degree of corrosion of reinforcements.

4.3. Test Results for RC

4.3.1. Test Phenomenon of RC

The surfaces of the three RC specimens before and after the tests are shown in Figure 14. It shows that as the corrosion time of the reinforcement increases, the corrosion products continue to increase, and the specimens begin to show different degrees of cracks. The RC will undergo the whole process of slow rusting from the reinforcement surface to the concrete surface.

4.3.2. Mass Loss Rate of RC

Since the mass loss rate of the reinforcement at each corrosion moment cannot be measured after the reinforcement is covered in concrete, the corrosion time is used instead of the mass. Therefore, the following uses the corrosion time instead of the mass loss rate. The linear relationship between the mass loss rate and the corrosion time of the reinforcement is described in Section 3.2 (Table 2).

4.3.3. GUW Signals and DI-SAD of RC

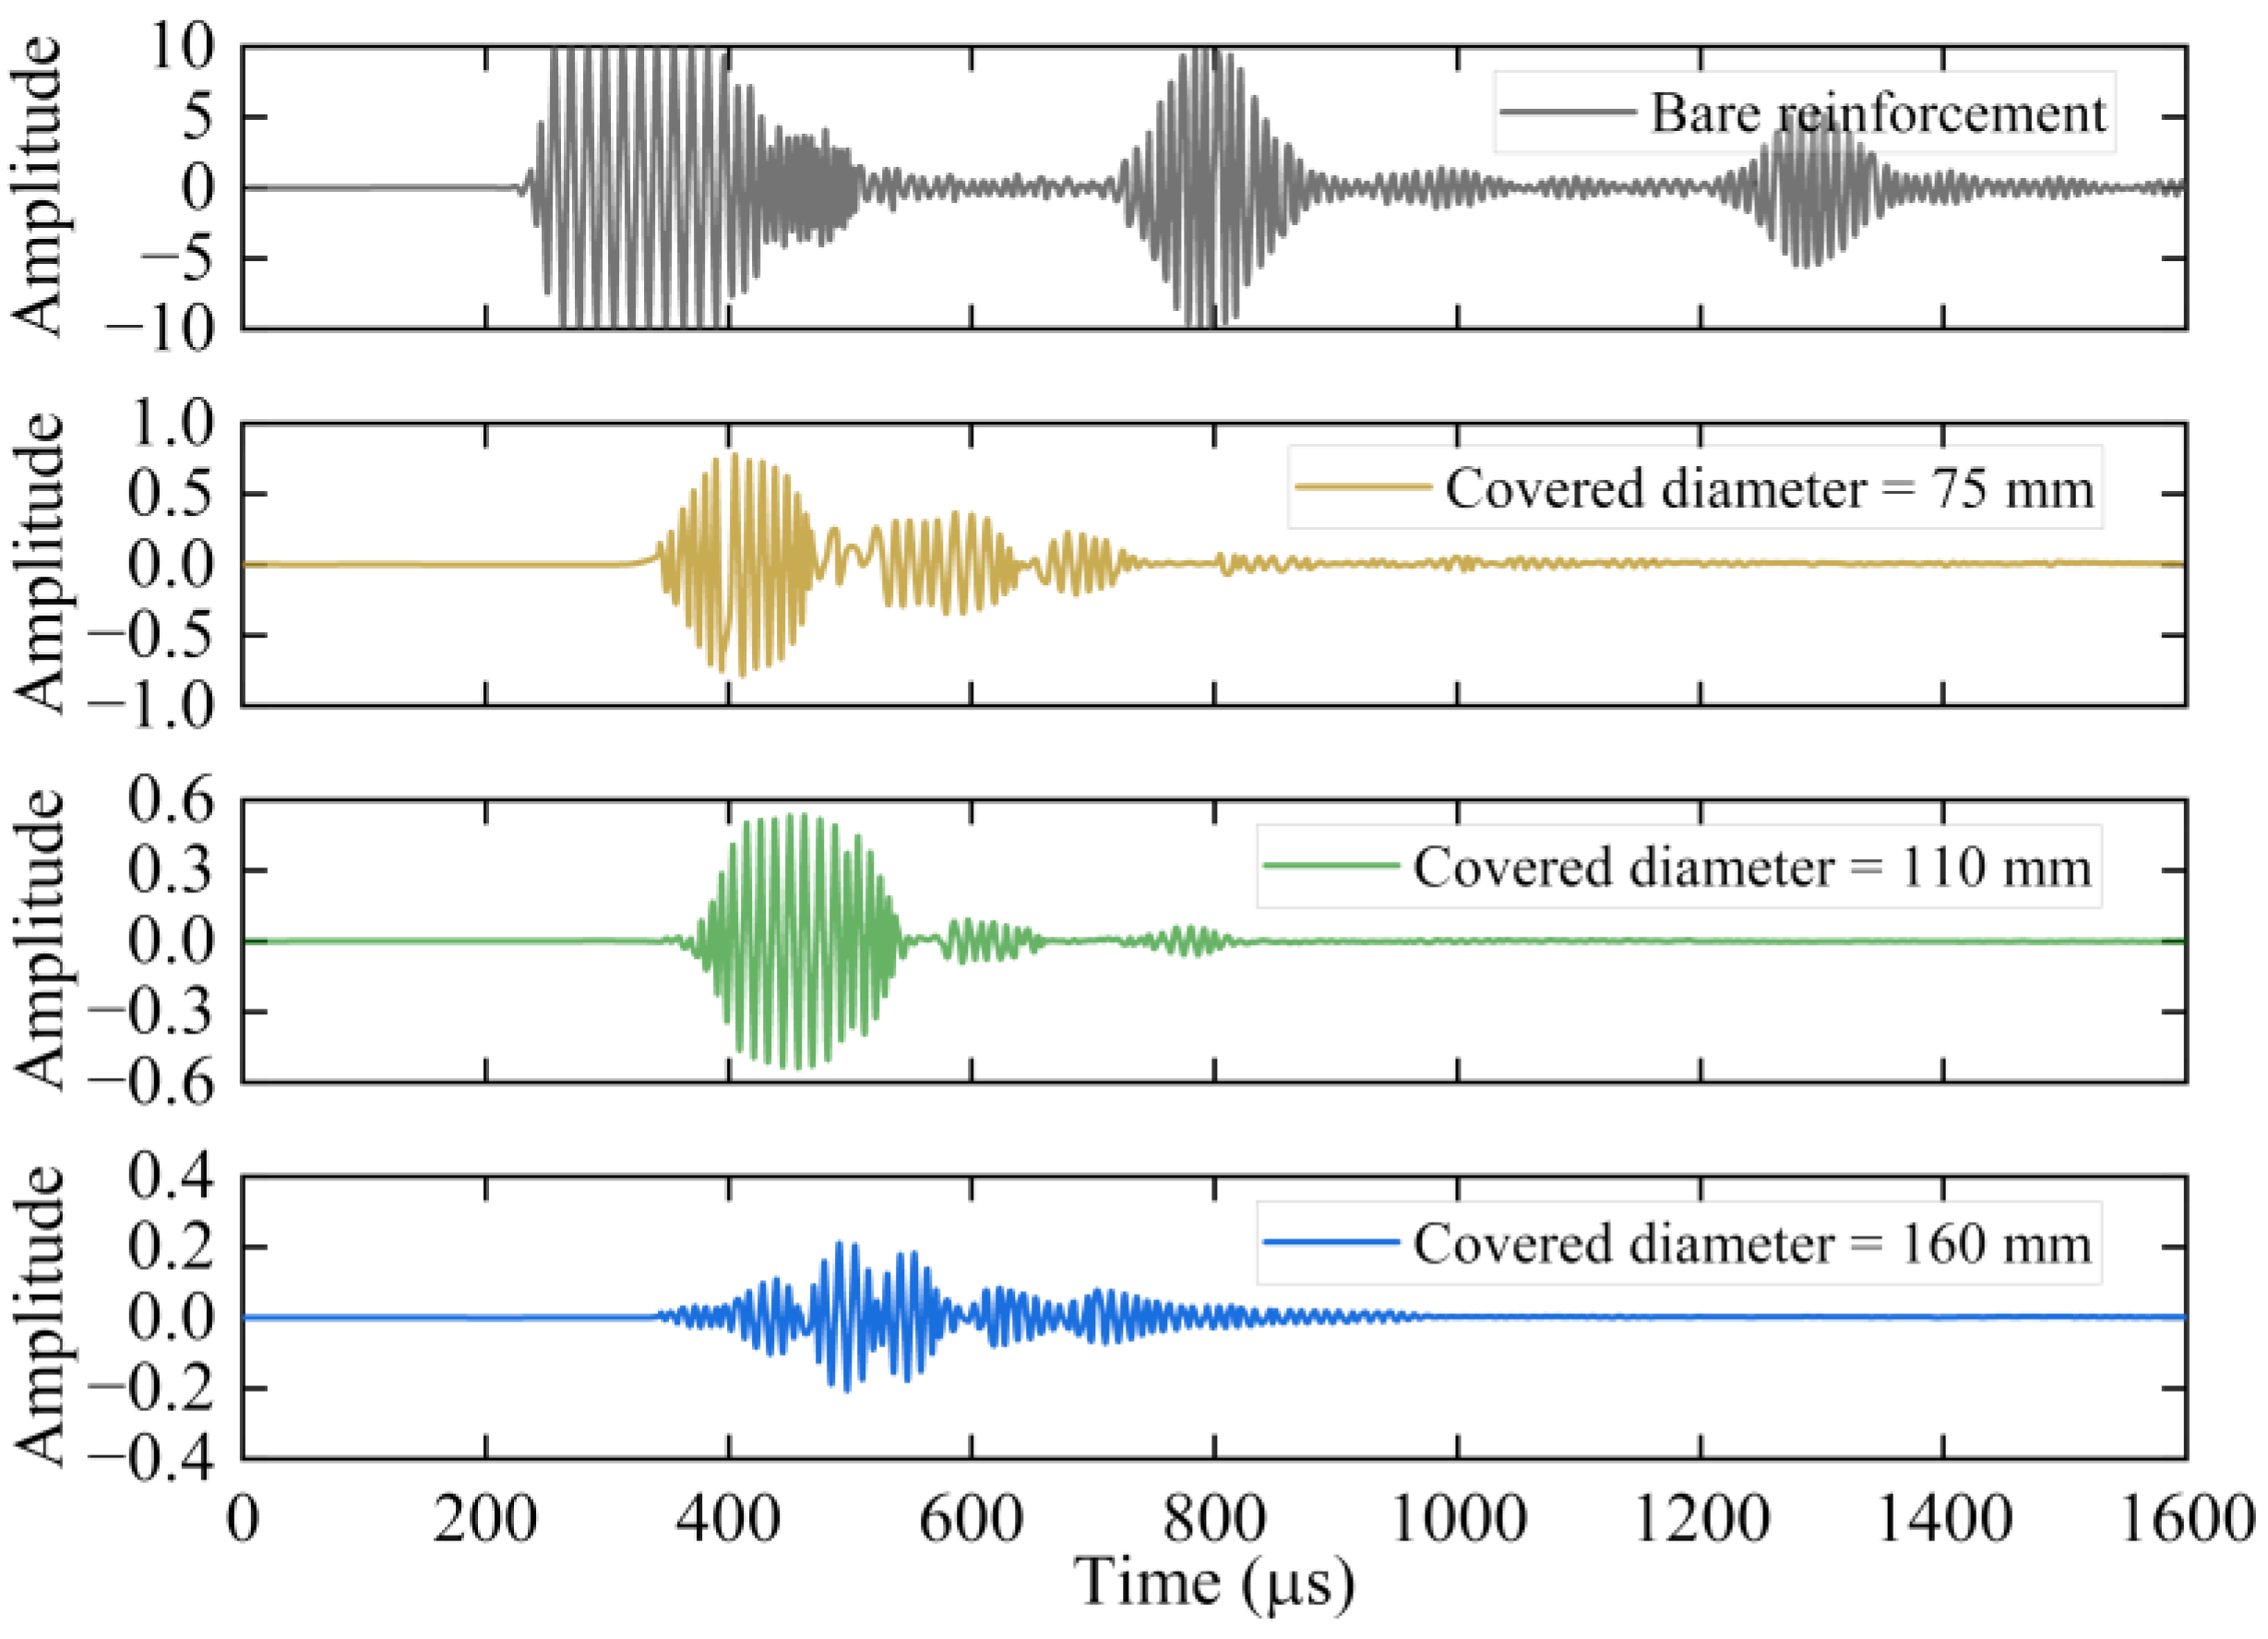
Figure 15 shows the GUW signal waveforms of bare reinforcement and RC without corrosion. It can be seen from Figure 15 that the influence of the concrete cover on the GUW characteristics is mainly as follows:
(1)
The amplitude of the GUW signal decreases as the covered thickness increases, and the more signal energy is leaked. The amplitudes in the reinforcement bars with the 75, 110, and 160 mm covered diameters are 1/19, 1/28, and 1/70 of those in the bare reinforcement, respectively.
(2)
With the increase in the covered thickness, the arrival time increases and the wave velocity decreases. The arrival time of the signal in the bare reinforcement is 292 μs, whereas the corresponding arrival times are 405, 462, and 491 μs for the reinforcements with 75, 110, and 160 mm covered diameters, respectively.
(3)
The mode components in the signals are increased and the signals are complex. Ma et al. [28] pointed out that on the one hand, due to the small signal amplitude, the signal-to-noise ratio is lower and more interfered with by noise; on the other hand, the modal components of the GUW signals are more complex in the composite reinforcement–concrete waveguide medium.
The above phenomenon is consistent with the results discussed in Section 2.2.
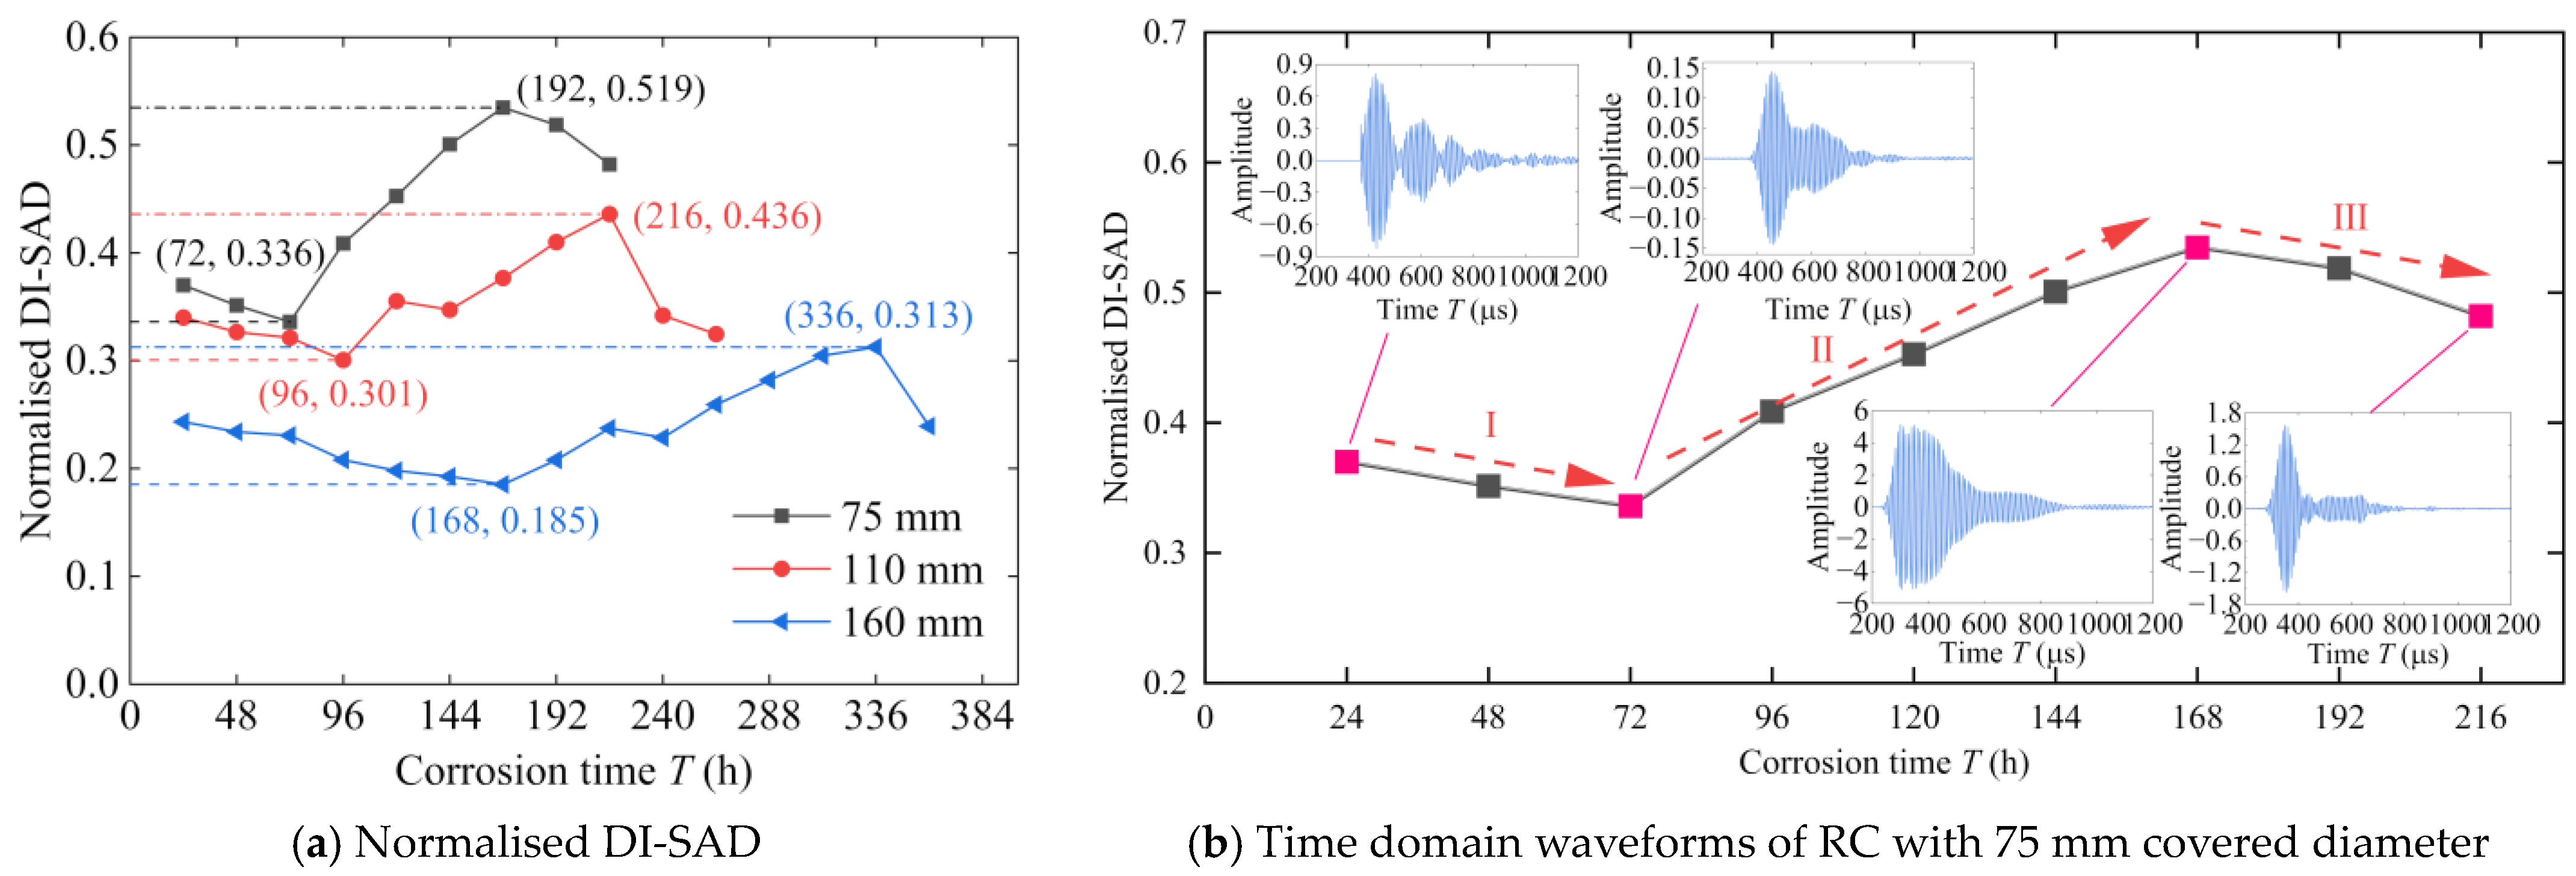
The effectiveness of DI-SAD has been discussed previously, and DI-SAD is still used here to identify the corrosion state of the reinforcement within the concrete. The relationship between the measured DI-SAD and corrosion time for the three RC specimens with the same excitation frequency at different corrosion times is shown in Figure 16a. During the corrosion process, the corrosion inside the concrete was measured intermittently using GUWs. In the RC specimen with a 75 mm diameter, the measured GUW signals at different corrosion times are shown in Figure 16b.
It can be seen from Figure 16 that the change in the GUW signal DI-SAD propagating in the reinforcement with the corrosion time (based on the minimum and maximum values of the normalized DI-SAD) can be divided into the following three stages in the case of covered concrete.
(I)
The first stage is the initial stage of reinforcement corrosion, which is characterized by a decrease in the amplitude of the GUWs. At this stage, the corrosion products are slowly filled in the pores of the concrete around the reinforcement, which does not cause the internal cracking of the concrete. Due to the filling of the corrosion products, the contact between the reinforcement and concrete is closer, and more GUW energy is leaked from the reinforcement to the concrete, making the amplitude decrease continuously.
(II)
The second stage is the development stage of the internal cracks in the concrete. After the corrosion products fill the pores, their volume continues to increase, and the resulting rust expansion pressure causes cracks to begin to develop within the concrete when the concrete stresses reach the tensile strength. The bond failure between the reinforcement and concrete leads to the gradual decrease in the GUW energy leaked into the concrete, so the amplitude of the GUWs propagating along the reinforcement tends to increase.
(III)
The third stage is the development stage of the concrete surface cracks. As the cracks within the concrete continue to extend and expand, cracks appear on the concrete surface. Corrosive products on the reinforcement surface seep out along the cracks, while the corrosion solution flows to the reinforcement surface along the cracks. Since the acoustic impedance of the liquid is much larger than that of the metal material, the amplitude of the GUWs propagating in the reinforcement decreases rapidly.
However, the corrosion time of the concrete at each stage is related to the diameter of the concrete. The larger the diameter, the longer the duration of each stage, and the fluctuation of DI-SAD (the difference between the maximum and minimum) is reduced. This results from the combined effect of the rust expansion pressure are generated by the corrosion and the ultimate tensile strength of concrete materials. Thus, it can be seen that the time until the appearance of corrosion cracks in the RC can be delayed by increasing the covered thickness of the reinforcement to protect the reinforcement in the concrete.

4.3.4. Comparative Analysis with Theoretical Corrosion Model

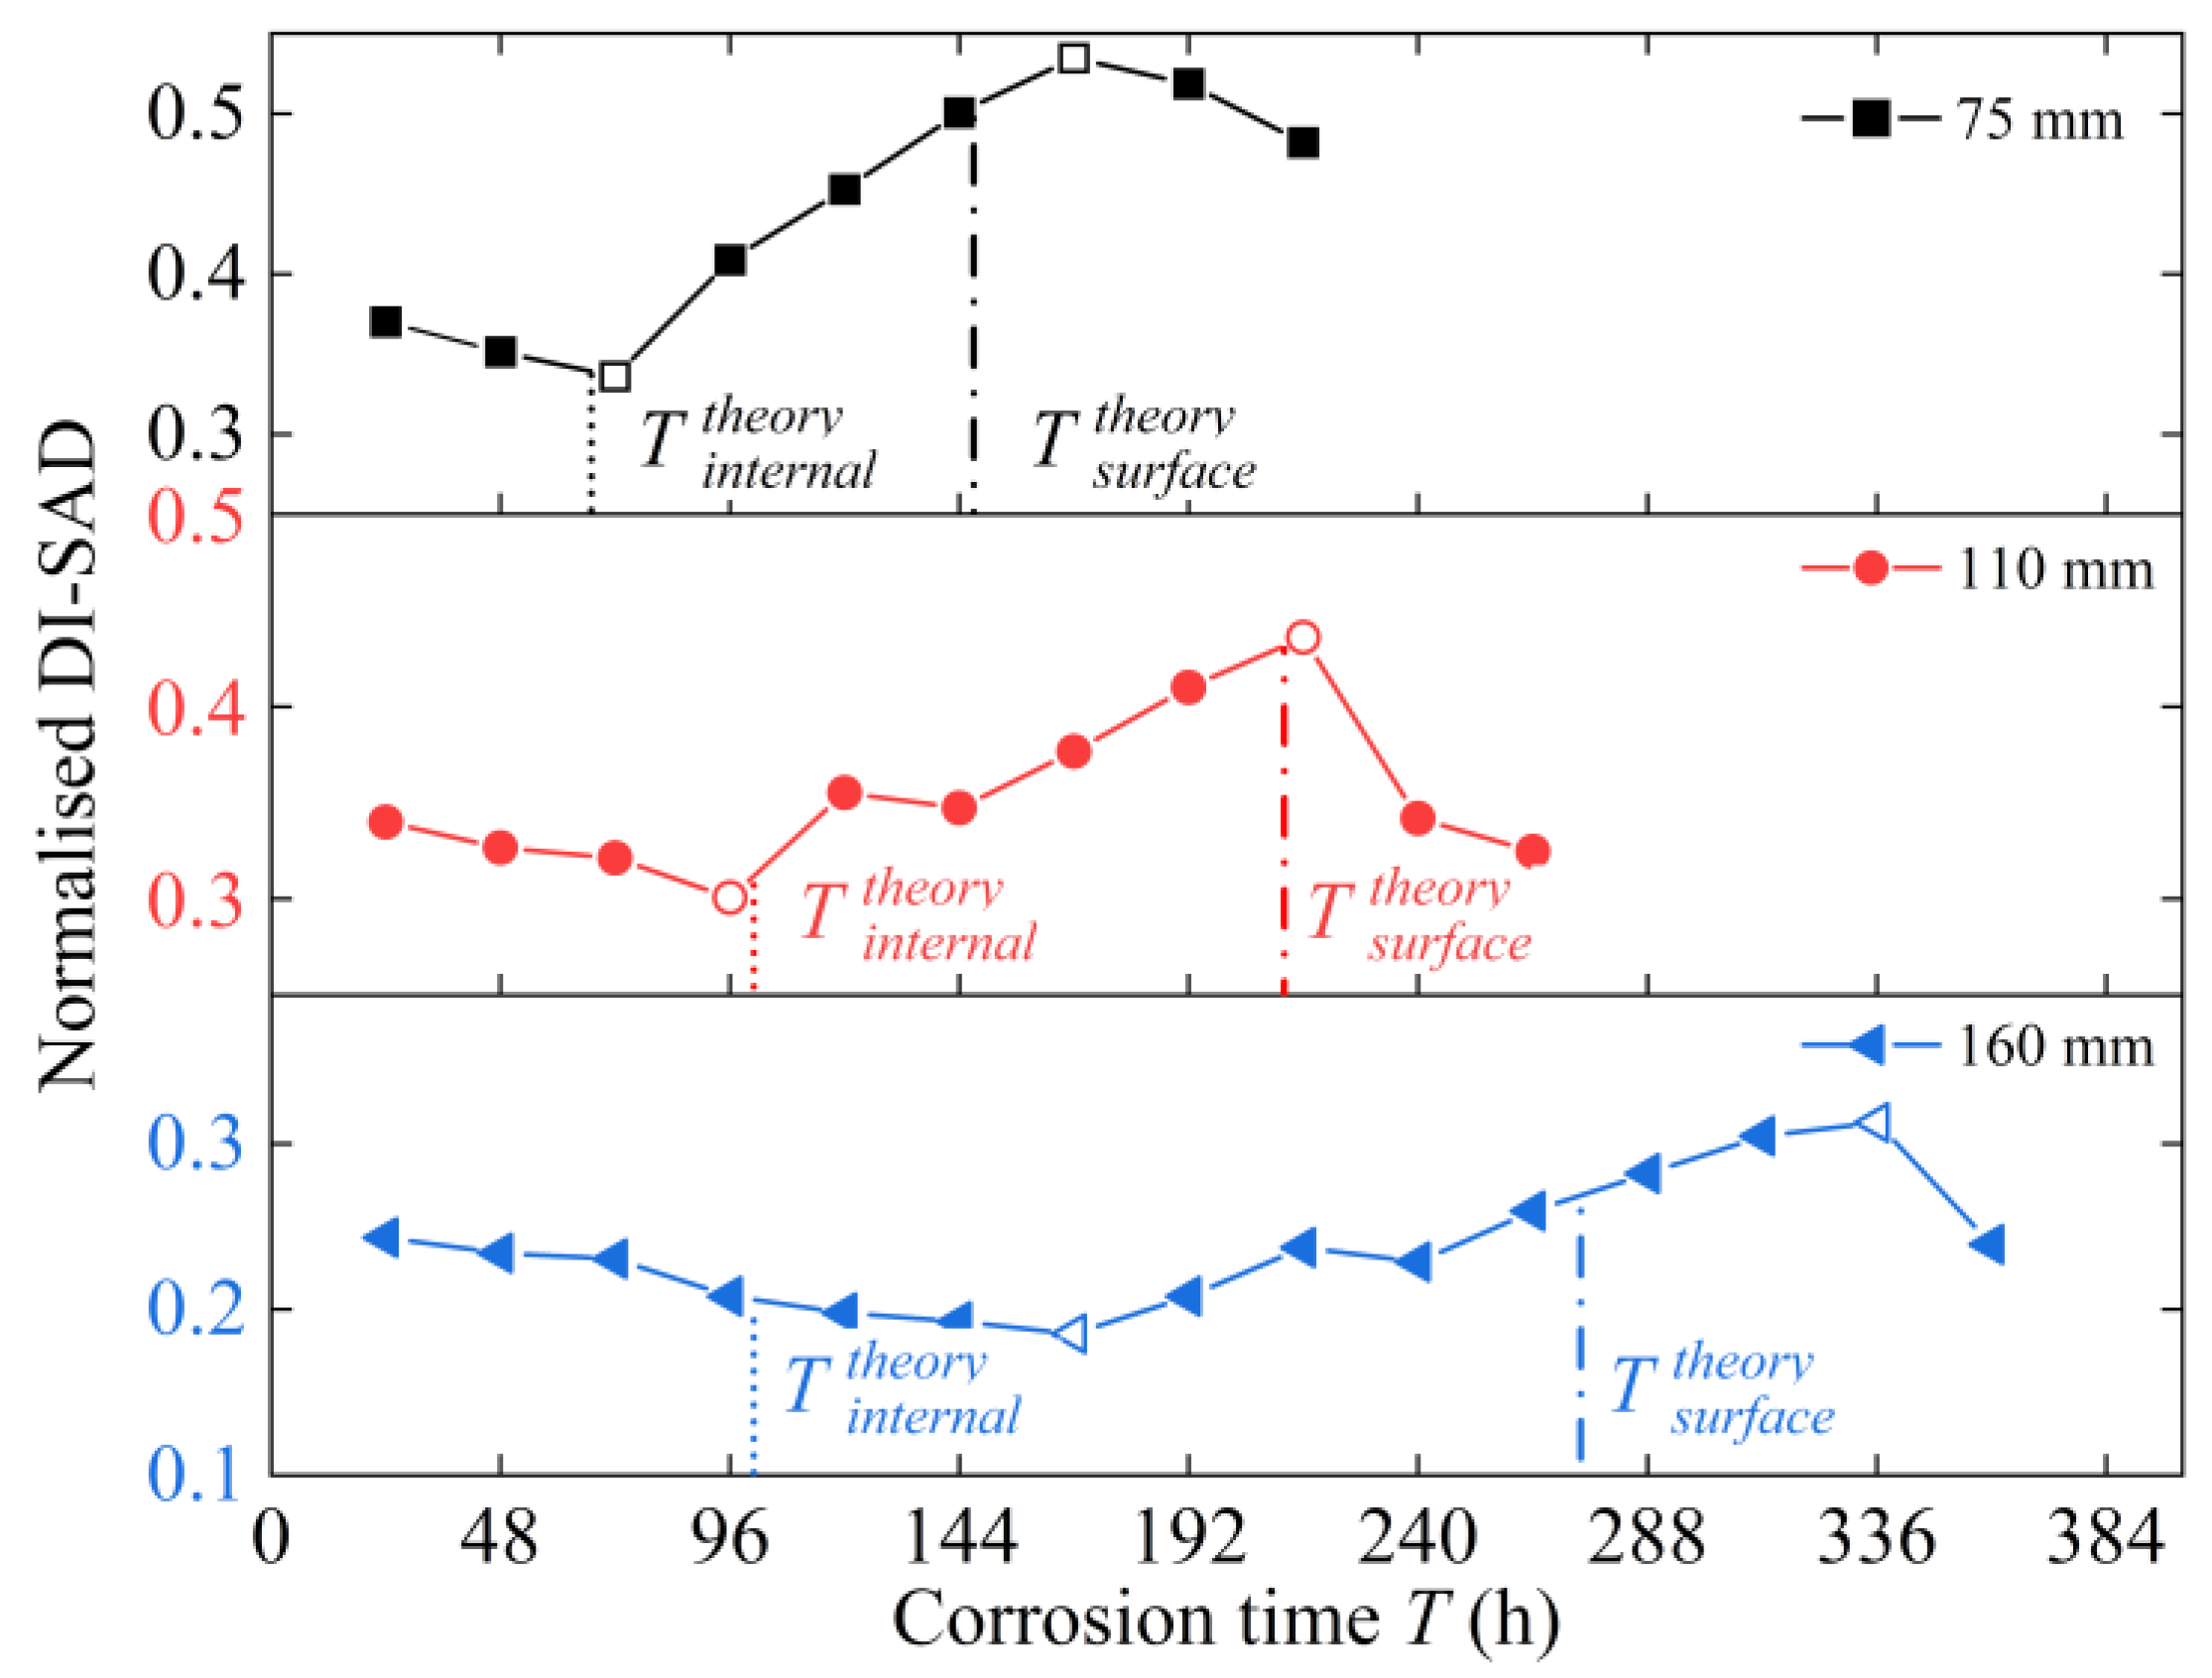
Combined with the existing corrosion model of the RC [26], the effectiveness of the DI proposed in the paper is demonstrated by comparing the theoretical corrosion times and measured DI-SAD results at different corrosion stages. Combining Figure 17 and Table 3, it can be found that the error of the internal cracking time is within 7% for the RC specimens with diameters of 75 and 110 mm, and the error of the surface cracking time is within 2% for the 110 mm diameter specimens.
At the same time, it is also seen that there is a large error between the test value and the theoretical value of the internal cracking time and the surface cracking time of the RC specimen with the 160 mm diameter, and the test results are obviously lagging behind. This is because the theoretical corrosion model assumes that when the cover thickness is greater than 30 mm, the opening necessary to start cracking no longer increases with increasing cover thickness. However, the test results show that for the RC specimens with a diameter of 160 mm (cover thickness of 70 mm), the cracking time lags significantly behind that of the RC specimens with a diameter of 110 mm (cover thickness of 45 mm). This phenomenon suggests that increasing the concrete cover thickness is advantageous in delaying the corrosion cracking of the RC specimens. Although the cover thickness of a typical RC structure does not exceed 40 mm, the cover thickness of piers and prestressed RC structures on sea-crossing bridges is usually much larger. Therefore, the internal reinforcement corrosion of the concrete at larger covered thicknesses should be considered; otherwise, the extent of internal reinforcement corrosion at large covered thicknesses will be underestimated.

5. Conclusions

In this paper, firstly, the GUW dispersion characteristics of the reinforcement and RC are analyzed. Secondly, the finite element simulation of a corroded reinforcement is carried out using random corrosion to determine the frequency of the excitation signal and the damage index. Finally, the identification of the corrosion stages of a reinforcement in concrete is carried out using GUW tests on reinforcement and RC specimens. The main conclusions are as follows:
(1)
The five proposed Dis all show a linear increasing trend with the increase in the reinforcement corrosion degree in the finite element analysis, and DI-SAD is the most sensitive to the corrosion state of the reinforcement compared with other DIs, as the excitation frequency increases in the range of 50–100 kHz. The results of the reinforcement corrosion test and the finite element are in good agreement, and their data correlation is 0.998.
(2)
The direct waveforms of the reinforcement in the finite element simulation and the test almost coincide, while the reflected waveforms tend to shift forward with the increase in the corrosion degree of the reinforcement, and their amplitudes are significantly decreased compared with the direct waveforms. The deviation between the GUW propagation velocity for the specimens with a different corrosion degree from the finite element and test and the numerical solution of the frequency dispersion curve (4510 m/s) is within 4%, which is in good agreement.
(3)
As the corrosion time of the RC specimens increases, the DI-SAD values of the GUW show three-stage changes. The larger the covered thickness of the RC specimens, the longer the corrosion time required for each stage. This is the result of the combined effect of the corrosion expansion pressure generated by corrosion and the ultimate tensile strength of the concrete material.
(4)
Increasing the covered thickness is beneficial to delay the appearance time of corrosion cracks in the RC specimens. When the covered thickness is small, the test value of the cracking time of the RC specimens is basically consistent with the theoretical results, and the error is within 12.5%, while the test values are significantly larger than the theoretical values when the covered thickness is larger, which is due to the assumed conditions of the theoretical model.

Author Contributions

Conceptualization, J.Q.; methodology, J.Q.; software: P.Z.; validation, J.Y.; formal analysis, Y.W.; investigation, Y.W.; data curation, R.J.; writing—original draft, J.Q.; visualization, P.Z.; writing—review and editing, J.Q.; project administration, J.Y.; funding acquisition: J.Q. All authors have read and agreed to the published version of the manuscript.

Funding

This work was supported by State Key Laboratory of Bridge Engineering Structural Dynamics, grant number: ZSJK-KF01; the National Natural Science Foundation of China (Grant No. 52378283); China Postdoctoral Science Foundation (Grant No. 2021M702782); Natural Science Foundation of Chongqing, China (Grant No. CSTB2023NSCQ-MSX0633); Chongqing Education Commission Science and Technology Research Youth Project (Project Number KJQN202300745).

Institutional Review Board Statement

Not applicable.

Informed Consent Statement

Not applicable.

Data Availability Statement

The data presented in this study are available in the main article.

Acknowledgments

The authors would like to appreciate Linqiang Zhou, who discussed the finite element simulation and suggested useful comments.

Conflicts of Interest

The authors declare no conflicts of interest.

References

  1. Feng, M.; Li, M.; Qu, H.; Tian, D.; Lu, M.; Gui, T.; Li, G. Degradation mechanism and evaluation of the carbonation resistance of concrete after high-temperature exposure. Structures 2023, 58, 105621. [Google Scholar] [CrossRef]
  2. Dong, B.; Ding, W.; Qin, S.; Han, N.; Fang, G.; Liu, Y.; Xing, F.; Hong, S. Chemical self-healing system with novel microcapsules for corrosion inhibition of rebar in concrete. Cem. Concr. Compos. 2018, 85, 83–91. [Google Scholar] [CrossRef]
  3. Dong, B.; Ding, W.; Qin, S.; Fang, G.; Liu, Y.; Dong, P.; Han, S.; Xing, F.; Hong, S. 3D visualized tracing of rebar corrosion-inhibiting features in concrete with a novel chemical self-healing system. Constr. Build. Mater. 2018, 168, 11–20. [Google Scholar] [CrossRef]
  4. Nafiseh, S.; Mohammad, A.M.; Farzaneh, H. Electrochemical paper-based biosensors for point-of-care diagnostics: Detection methods and applications. J. Electrochem. Sci. Eng. 2022, 12, 399–419. [Google Scholar]
  5. Wen, J.W.; Jiang, C.; Chen, H. High-precision corrosion detection via SH1 guided wave based on full waveform inversion. Sensors 2023, 23, 9902. [Google Scholar] [CrossRef]
  6. Mitra, M.; Gopalakrishnan, S. Guided wave based structural health monitoring: A review. Smart Mater. Struct. 2016, 25, 053001. [Google Scholar] [CrossRef]
  7. Sharma, S.; Mukherjee, A. Longitudinal guided waves for monitoring chloride corrosion in reinforcing bars in concrete. Struct. Health Monit. 2010, 9, 555–567. [Google Scholar] [CrossRef]
  8. Miller, T.H.; Hauser, C.J.; Kundu, T. Nondestructive inspection of corrosion and delamination at the concrete-steel reinforcement interface. ASME Int. Mech. Eng. Congr. Expo. 2002, 36495, 121–128. [Google Scholar]
  9. Zhang, Y.Y.; Li, D.S.; Zhou, Z. Time reversal method for guided waves with multimode and multipath on corrosion defect detection in wire. Appl. Sci. 2017, 7, 424–439. [Google Scholar] [CrossRef]
  10. Miller, T.H.; Kundu, T.; Huang, J.; Grill, J.Y. A new guided wave-based technique for corrosion monitoring in reinforced concrete. Struct. Health Monit. 2013, 12, 35–47. [Google Scholar] [CrossRef]
  11. Zhou, P.; Zhou, G.; Zhu, Z.; He, Z.; Ding, X.; Tang, C. A review of non-destructive damage detection methods for steel wire ropes. Appl. Sci. 2019, 9, 2771. [Google Scholar] [CrossRef]
  12. Sharma, S.; Mukherjee, A. Nondestructive evaluation of corrosion in varying environments using guided waves. Res. Nondestruct. Eval. 2013, 24, 63–88. [Google Scholar] [CrossRef]
  13. Sriramadasu, C.R.; Banerjee, S.; Lu, Y. Detection and assessment of pitting corrosion in rebars using scattering of ultrasonic guided waves. NDT&E Int. 2019, 101, 53–61. [Google Scholar]
  14. Farhidzadeh, A.; Salamone, S. Reference-free corrosion damage diagnosis in steel strands using guided ultrasonic waves. Ultrasonics 2015, 57, 198–208. [Google Scholar] [CrossRef]
  15. Umar, A.; Kumar, Y.S.; Tribikram, K. Detection and quantification of diameter reduction due to corrosion in reinforcing steel bars. Struct. Health Monit. 2015, 14, 532–543. [Google Scholar]
  16. Majhi, S.; Mukherjee, A.; George, N.V.; Uy, B. Corrosion detection in steel bar: A time-frequency approach. NDT E Int. 2019, 107, 102150. [Google Scholar] [CrossRef]
  17. Sun, X.T.; Zhang, M.H.; Gao, W.H.; Guo, C.; Kong, Q. A novel method for steel bar all-stage pitting corrosion monitoring using the feature-level fusion of ultrasonic direct waves and coda waves. Struct. Health Monit. 2023, 22, 714–729. [Google Scholar] [CrossRef]
  18. Li, D.S.; Zhang, S.F.; Yang, W.Y.; Zhang, W. Corrosion monitoring and evaluation of reinforced concrete structures utilizing the ultrasonic guided wave technique. Int. J. Distrib. Sens. Netw. 2014, 10, 827130. [Google Scholar] [CrossRef]
  19. Huo, L.S.; Li, C.B.; Jiang, T.Y.; Li, H.N. Feasibility study of steel bar corrosion monitoring using a piezoceramic transducer enabled time reversal method. Appl. Sci. 2018, 8, 2304. [Google Scholar] [CrossRef]
  20. Su RK, L.; Zhang, Y.L. A double-cylinder model incorporating confinement effects for the analysis of corrosion-caused cover cracking in reinforced concrete structures. Corros. Sci. 2015, 99, 205–218. [Google Scholar]
  21. Sriramadasu, R.C.; Banerjee, S.; Lu, Y. Sensitivity of longitudinal guided wave modes to pitting corrosion of rebars embedded in reinforced concrete. Constr. Build. Mater. 2020, 239, 117855. [Google Scholar] [CrossRef]
  22. Shi, F.; Wang, J.; Cui, W.; Qin, L. Monitoring steel corrosion by using the combination of ultrasonic guided wave and acoustic emission. IOP Conference Series. IOP Publ. Mater. Sci. Eng. 2019, 612, 022057. [Google Scholar]
  23. Liu, Y.; Ding, W.; Zhao, P.; Qin, L.; Shiotani, T. Research on in-situ corrosion process monitoring and evaluation of reinforced concrete via ultrasonic guided waves. Constr. Build. Mater. 2022, 321, 126317. [Google Scholar] [CrossRef]
  24. Zhang, S.Q.; Jia, Z.J.; Xiong, Y.L.; Cao, R.; Zhang, Y.; Banthia, N. Wave amplitude of embedded ultrasonic transducer-based damage monitoring of concrete due to steel bar corrosion. Struct. Health Monit. 2022, 21, 1694–1709. [Google Scholar] [CrossRef]
  25. Mayakuntla, P.K.; Ghosh, D.; Ganguli, A. Nondestructive evaluation of rebar corrosion in concrete structures using ultrasonics and laser-based sensing. Nondestruct. Test. Eval. 2022, 37, 297–314. [Google Scholar] [CrossRef]
  26. Jamshidi, F.; Dehestani, M. Time to cracking in concrete cover length due to reinforcement corrosion via a simplified fracture mechanics approach. Constr. Build. Mater. 2020, 258, 119588. [Google Scholar] [CrossRef]
  27. Bhargava, K.; Ghosh, A.K.; Mori, Y.; Ramanujam, S. Modeling of time to corrosion-induced cover cracking in reinforced concrete structures. Cem. Concr. Res. 2005, 35, 2203–2218. [Google Scholar] [CrossRef]
  28. Ma, C. Corrosion Monitoring of Rebar Embedded in Concrete Using Guided Ultrasonic Waves; Harbin Institute of Technology: Harbin, China, 2018. [Google Scholar]
  29. Ahmed, A.; Tai, C.N. Debonding detection in rebar-reinforced concrete structures using second harmonic generation of longitudinal guided wave. NDT&E Int. 2021, 122, 102496. [Google Scholar]
  30. David, B.M. Guided Wave Inspection of Embedded Cylindrical Structures; Imperial College London: London, UK, 2002. [Google Scholar]
  31. Velázquez, J.; Van Der Weide, J.; Hernández, E.; Hernández, H.H. Statistical modelling of pitting corrosion: Extrapolation of the maximum pit depth-growth. Int. J. Electrochem. Sci. 2014, 9, 4129–4143. [Google Scholar] [CrossRef]
  32. Melchers, R.E. A review of trends for corrosion loss and pit depth in longer-term exposures. Corros. Mater. Degrad. 2018, 1, 42–58. [Google Scholar] [CrossRef]
  33. Wu, B.; Li, L.T.; Wang, X.Y.; Yu, H.; Li, Y.; He, C. Non-destructive test of a surface defect on a steel bar based on ultrasonic guided wave techniques. Eng. Mech. 2003, 20, 149–154. [Google Scholar]
  34. Sun, J.P.; Sun, W.W.; Zhang, J.J.; Gao, C. Application of buckling energy dissipating steel plate in the research and development of seismic isolation bearing. Chin. J. Appl. Mech. 2021, 38, 2268–2274. [Google Scholar]
  35. Du, P.; Xu, D.; Huang, S.; Cheng, X. Assessment of corrosion of reinforcing steel bars in concrete using embedded piezoelectric transducers based on ultrasonic wave. Constr. Build. Mater. 2017, 151, 925–930. [Google Scholar] [CrossRef]
  36. Xue, Z.K. Optimization of Grout Ratio for Large-Span Precast Box Girder Pipeline Data Mining of Density Detection; Shijiazhuang Tiedao University: Shijiazhuang, China, 2023. [Google Scholar]
  37. Zeng, Z.H. Research on the Influence of Ultrasonic Impact Treatment on Acoustic Elastic Coefficient of Ultrasonic Nondestructive Evaluation; Jiangsu University of Science and Technology: Zhenjiang, China, 2022. [Google Scholar]
  38. Pagnotta, A. Probabilistic Impact-Echo Method for Nondestructive Detection of Defects Around Steel Reinforcing Bars in Reinforced Concrete; University of Illinois at Urbana-Champaign: Champaign, IL, USA, 2018. [Google Scholar]
  39. Qiu, L.; Yuan, S.F.; Chang, F.K.; Bao, Q.; Mei, H. On-line updating Gaussian mixture model for aircraft wing spar damage evaluation under time-varying boundary condition. Smart Mater. Struct. 2014, 23, 125001. [Google Scholar] [CrossRef]
  40. Torkamani, S.; Roy, S.; Barkey, E.M.; Sazonov, E.; Burkett, S.; Kotru, S. A novel damage index for damage identification using guided waves with application in laminated composites. Smart Mater. Struct. 2014, 23, 095015. [Google Scholar] [CrossRef]
  41. Sun, Y. Discussion on electromagnetic waves under the circumstances of total internal reflection and optical tunneling/International Informatization and Engineering Associations, Atlantis Press. In Proceedings of the 2015 4th National Conference on Electrical, Electronics and Computer Engineering (NCEECE 2015), Xi’an, China, 12–13 December 2015; Atlantis Press: Amsterdam, The Netherlands, 2015; Volume 6, pp. 170–175. [Google Scholar]
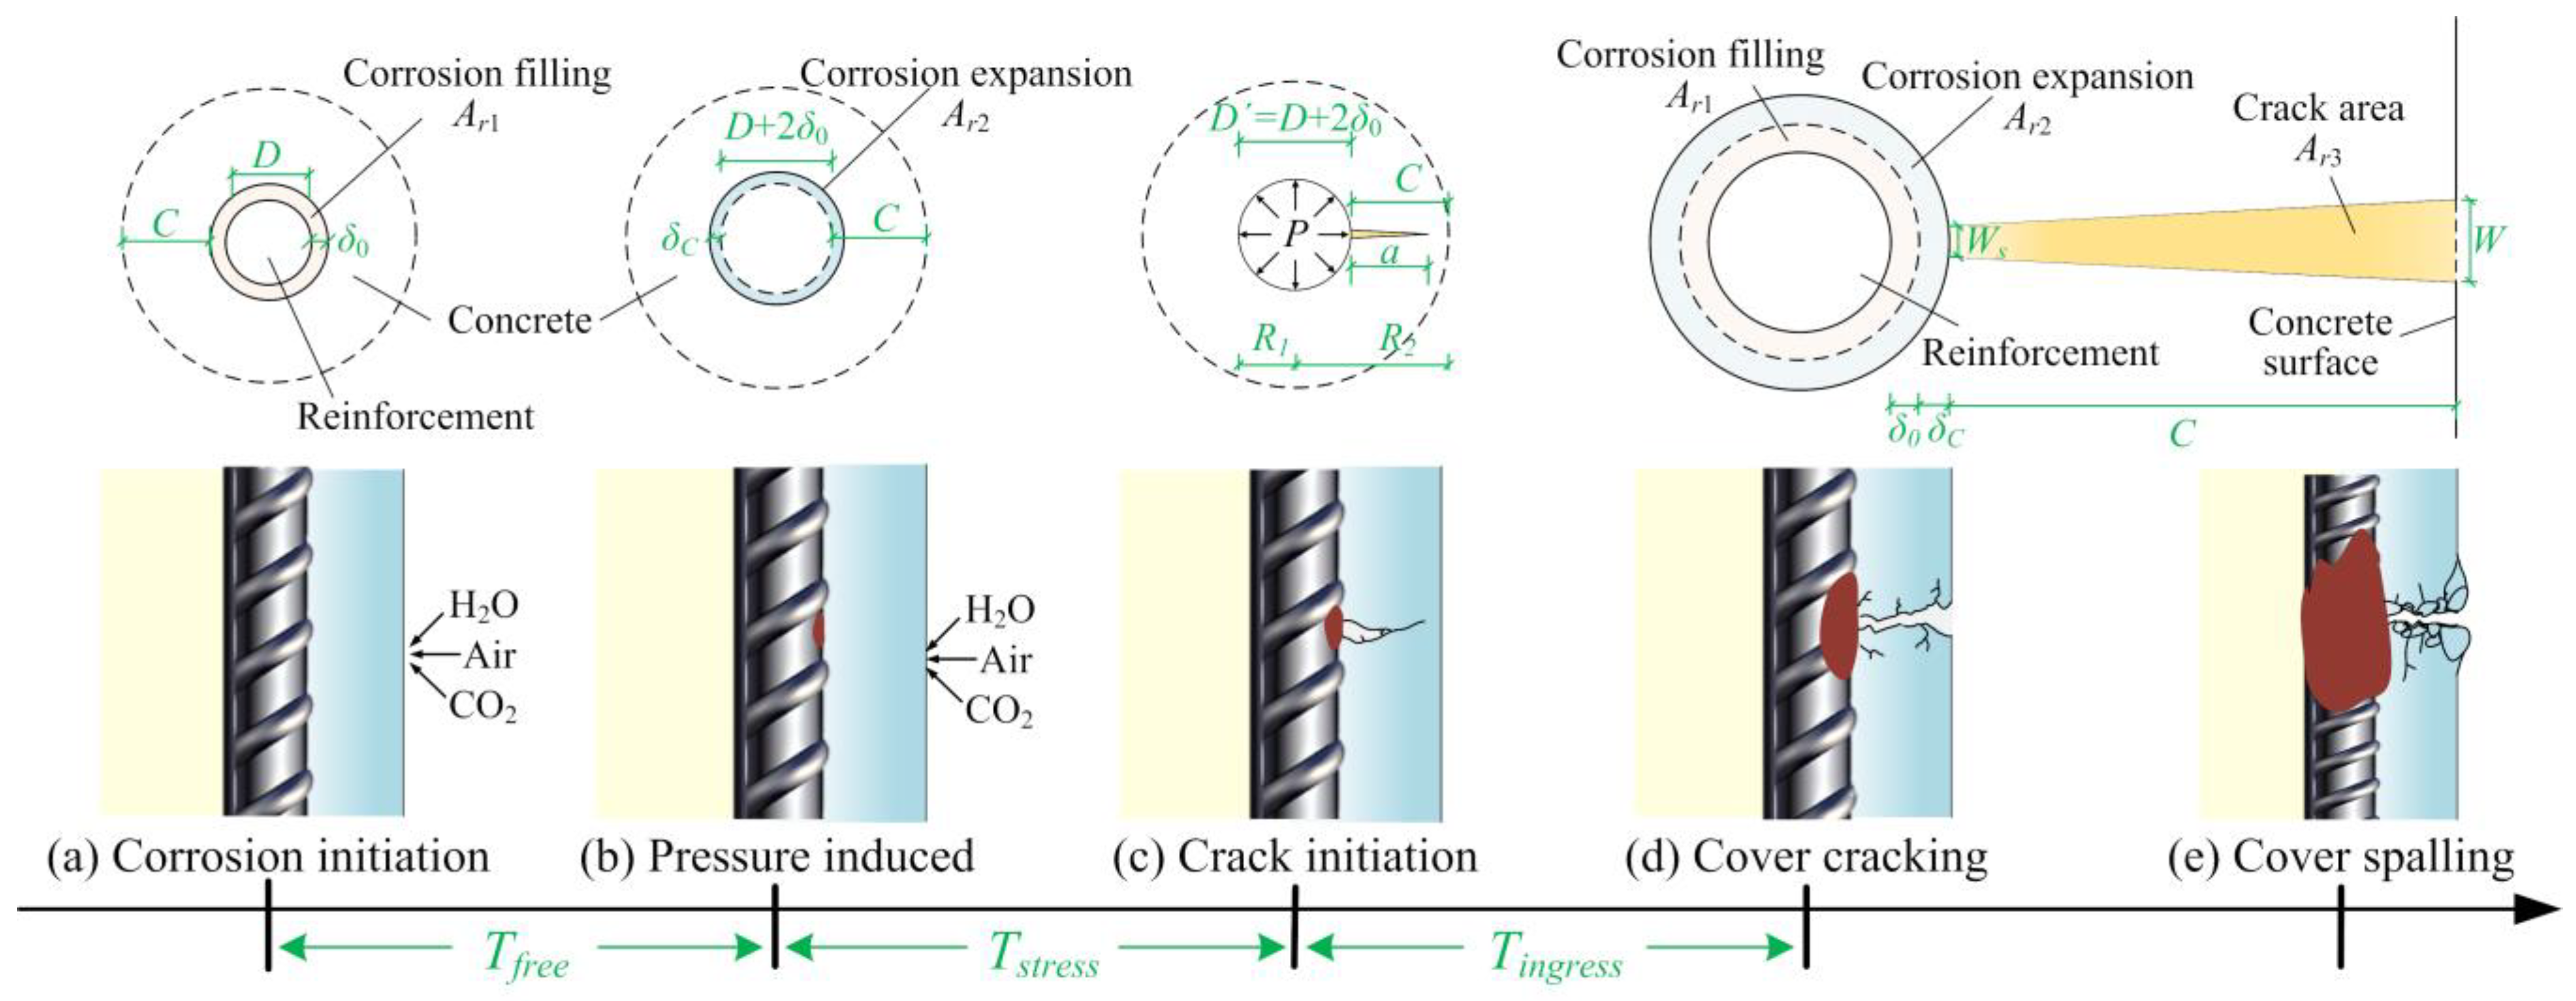
Figure 1. The process of development of corrosion of reinforcement. Note: where C is the thickness of concrete cover, D is the diameter of reinforcement, δ0 is porous zone of thickness, δC the amount of concrete displacement, a is the crack length, R1 and R2, respectively, are the internal and exterior cylinder radii.
Applsci 14 01201 g001
Figure 2. Frequency dispersion curves of specimens with different parameters.
Applsci 14 01201 g002
Figure 3. Finite element model of reinforcement.
Applsci 14 01201 g003
Figure 4. Comparison of GUW signal propagation in smooth and threaded reinforcement.
Applsci 14 01201 g004
Figure 5. Geometric models of reinforcement with different corrosion degrees (η).
Applsci 14 01201 g005
Figure 6. Stress contour for reinforcement.
Applsci 14 01201 g006
Figure 7. Waveforms of GUW signals at different corrosion degrees (100 kHz).
Applsci 14 01201 g007
Figure 8. DIs at different frequencies.
Applsci 14 01201 g008
Figure 9. Test setup.
Applsci 14 01201 g009
Figure 10. Time domain waveform and frequency spectrum of the excitation signal.
Applsci 14 01201 g010
Figure 11. GUW signals of reinforcement at different corrosion degrees.
Applsci 14 01201 g011
Figure 12. Comparison of propagation velocities in bare reinforcement.
Applsci 14 01201 g012
Figure 13. Comparison of test and simulated DI-SAD.
Applsci 14 01201 g013
Figure 14. Diagram of specimens with different covered thicknesses before and after corrosion.
Applsci 14 01201 g014
Figure 15. GUW signals for reinforcement and RC without corrosion.
Applsci 14 01201 g015
Figure 16. GUW signals and DI-SAD of RC with different covered thicknesses.
Applsci 14 01201 g016
Figure 17. Comparison of test and theoretical values for cracking time of RC specimens.
Applsci 14 01201 g017
Table 1. Material parameters for reinforcement and covered concrete.
MaterialTypeMOE (GPa)Poisson’s RatioDensity (kg/m3)Diameter (mm)Length (mm)
ReinforcementPSB5002080.37850181100
Covered concreteC30190.2206675/110/160700
Table 2. Comparison of test and theoretical loss rate for reinforcement.
Corrosion Time T (h)024487296120144
ηtest (%)05.8510.6718.2522.4932.0636.78
ηtheory (%)06.2712.5418.8125.0831.3537.62
Δη (%)0−6.70−14.91−2.98−10.332.26−2.23
Table 3. Comparison of test and theoretical values for cracking time of RC specimens.
Covered Diameter D (mm)Test Value for Internal Cracking Time
T i n t e r n a l t e s t (h)
Theoretical Value for Internal Cracking Time
T i n t e r n a l t h e o r y (h)
ErrorTest Value for Surface Cracking Time
T s u r f a c e t e s t (h)
Theoretical Value for Surface Cracking Time
T s u r f a c e t h e o r y (h)
Error
757267−6.94%168147−12.50%
110961015.21%216212−1.85%
160168101−39.88%336274−18.45%
Disclaimer/Publisher’s Note: The statements, opinions and data contained in all publications are solely those of the individual author(s) and contributor(s) and not of MDPI and/or the editor(s). MDPI and/or the editor(s) disclaim responsibility for any injury to people or property resulting from any ideas, methods, instructions or products referred to in the content.