

Chemical Characterization and Antioxidant Activity of Apilarnil, Royal Jelly, and Propolis Collected in Banat Region, Romania

 ,
,  , , , , , , ,

Abstract
1. Introduction
2. Materials and Methods
2.1. Samples of Bee Products
2.2. Determination of Water Content
2.3. Determination of Dry Matter
2.4. Determination of Acidity
2.5. Determination of pH
2.6. Determination of Impurities
2.7. Determination of Protein
2.8. Determination of Ash
2.9. Determination of Mineral Substance Content (Ash)
2.10. Determination of the Antioxidant Capacity via DPPH (2,2-Diphenyl-1-picrylhydrazyl) Assay
2.11. Statistical Analysis
3. Results and Discussion
3.1. Chemical Composition
3.1.1. Chemical Composition of Apilarnil
3.1.2. Chemical Composition of Royal Jelly
3.1.3. Chemical Composition of Propolis
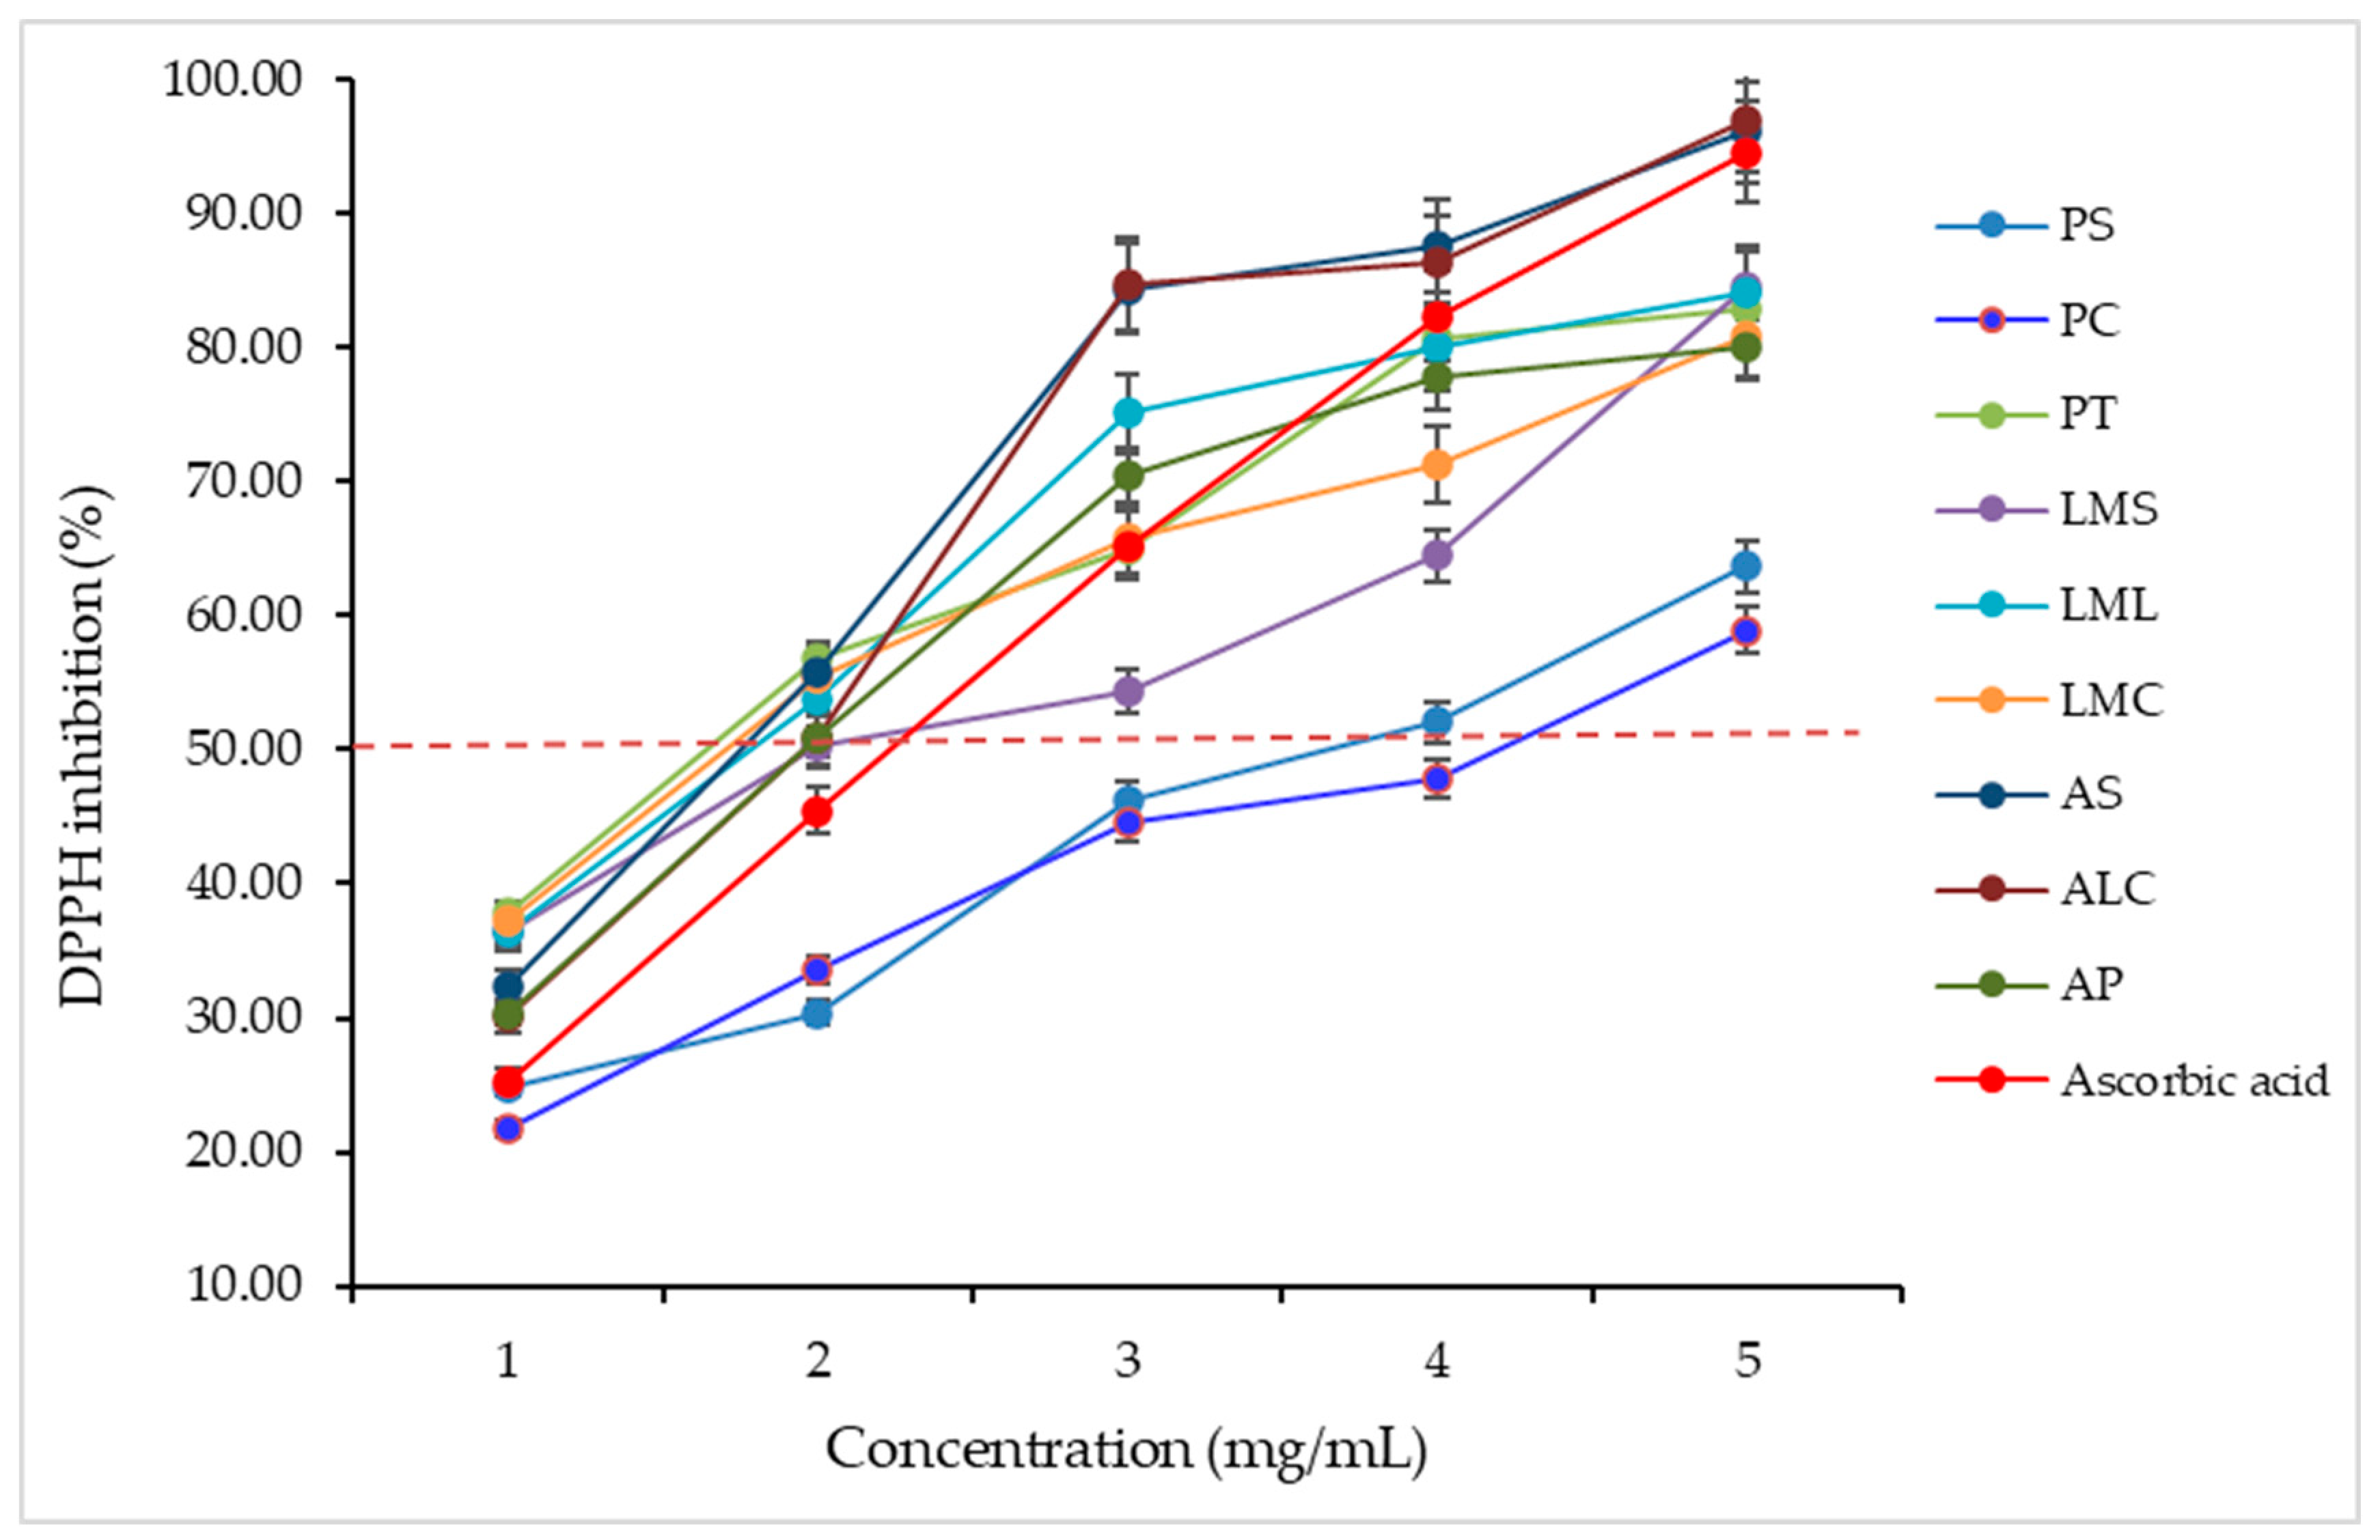
3.2. Antioxidant Activity by DPPH Method
4. Conclusions
Author Contributions
Funding
Institutional Review Board Statement
Informed Consent Statement
Data Availability Statement
Conflicts of Interest
References
- Kolayli, S.; Keskin, M. Natural bee products and their apitherapeutic applications. Stud. Nat. Prod. Chem. 2020, 66, 175–196. [Google Scholar] [CrossRef]
- Bartkiene, E.; Lele, V.; Sakiene, V.; Zavistanaviciute, P.; Zokaityte, E.; Dauksiene, A.; Jagminas, P.; Klupsaite, D.; Bliznikas, S.; Ruzauskas, M. Variations of the antimicrobial, antioxidant, sensory attributes and biogenic amines content in Lithuania-derived bee products. LWT Food Sci. Technol. 2020, 118, 108793. [Google Scholar] [CrossRef]
- Viuda-Martos, M.; Ruiz-Navajas, Y.; Fernández-López, J.; Pérez-Alvarez, J.A. Functional properties of honey, propolis, and royaljelly. J. Food Sci. 2008, 73, R117. [Google Scholar] [CrossRef] [PubMed]
- Martinello, M.; Mutinelli, F. Antioxidant Activity in Bee Products: A Review. Antioxidants 2021, 10, 71. [Google Scholar] [CrossRef]
- Iliesiu, N.V. Apilarnil; Editura Apimondia: Bucuresti, Romania, 1991; p. 33. [Google Scholar]
- Sidor, E.; Miłek, M.; Zaguła, G.; Bocian, A.; Dżugan, M. Searching for Differences in Chemical Composition and Biological Activity of Crude Drone Brood and Royal Jelly Useful for Their Authentication. Foods 2021, 10, 2233. [Google Scholar] [CrossRef] [PubMed]
- Bogdanov, S. Royal Jelly, Bee Brood: Composition, Health, Medicine: A Review. Bee Product Science. 2015. Available online: https://www.bee-hexagon.net/ (accessed on 14 February 2023).
- Lima, W.G.; Brito, J.C.; Da Cruz Nizer, W.S. Bee products as a source of promising therapeutic and chemoprophylaxis strategies against COVID-19 (SARS-CoV-2). Phytother. Res. 2021, 35, 743–750. [Google Scholar] [CrossRef]
- Bărnuţiu, L.I.; Mărghitaş, L.A.; Dezmirean, D.S.; Mihai, C.M.; Bobiş, O. Chemical composition and antimicrobial activity of Royal Jelly-REVIEW. Sci. Pap. Anim. Sci. Biotechnol. 2011, 44, 67–72. [Google Scholar]
- Ahmad, S.; Campos, M.G.; Fratini, F.; Altaye, S.Z.; Li, J. New Insights into the Biological and Pharmaceutical Properties of Royal Jelly. Int. J. Mol. Sci. 2020, 21, 382. [Google Scholar] [CrossRef]
- Bengü, A.Ş.; Adnan, A.Y.N.A.; Özbolat, S.; Abdullah, T.U.N.Ç.; Aykutoğlu, G.; Çiftci, M.; Darendelioğlu, E. Content and antimicrobial activities of bingol royal jelly. Türk Tarım Doğa Bilim. Derg. 2020, 7, 480–486. [Google Scholar] [CrossRef]
- Yükünç, G.O. Royal jelly: Proteins and peptides. J. Apitherapy Nat. 2020, 2, 59–70. [Google Scholar] [CrossRef]
- Shen, L.; Liu, D.; Li, M.; Jin, F.; Din, M.; Parnell, L.D.; Lai, C.Q. Mechanism of action of recombinant acc-royalisin from royal jelly of Asian honeybee against gram-positive bacteria. PLoS ONE 2012, 7, e47194. [Google Scholar] [CrossRef] [PubMed]
- Pătruică, S. Biotehnologii în Apicultură și Sericicultură; Editura Eurobit: Timișoara, Romania, 2021; pp. 39–62. [Google Scholar]
- Przybyłek, I.; Karpiński, T.M. Antibacterial Properties of Propolis. Molecules 2019, 24, 2047. [Google Scholar] [CrossRef] [PubMed]
- Huang, S.; Zhang, C.-P.; Wang, K.; Li, G.Q.; Hu, F.-L. Recent Advances in the Chemical Composition of Propolis. Molecules 2014, 19, 19610–19632. [Google Scholar] [CrossRef] [PubMed]
- Wieczorek, P.P.; Hudz, N.; Yezerska, O.; Horčinová-Sedláčková, V.; Shanaida, M.; Korytniuk, O.; Jasicka-Misiak, I. Chemical Variability and Pharmacological Potential of Propolis as a Source for the Development of New Pharmaceutical Products. Molecules 2022, 27, 1600. [Google Scholar] [CrossRef] [PubMed]
- Pavlovic, R.; Borgonovo, G.; Leoni, V.; Giupponi, L.; Ceciliani, G.; Sala, S.; Bassoli, A.; Giorgi, A. Effectiveness of Different Analytical Methods for the Characterization of Propolis: A Case of Study in Northern Italy. Molecules 2020, 25, 504. [Google Scholar] [CrossRef] [PubMed]
- Huang, S.; Zhang, C.-P.; Li, G.Q.; Sun, Y.-Y.; Wang, K.; Hu, F.-L. Identification of Catechol as a New Marker for Detecting Propolis Adulteration. Molecules 2014, 19, 10208–10217. [Google Scholar] [CrossRef] [PubMed]
- Martinotti, S.; Pellavio, G.; Laforenza, U.; Ranzato, E. Propolis Induces AQP3 Expression: A Possible Way of Action in Wound Healing. Molecules 2019, 24, 1544. [Google Scholar] [CrossRef] [PubMed]
- Tahira, F.; Akhlaq, A.F. Beneficial effects of propolis on human health and neurological diseases. Front. Biosci. 2012, 4, 779–793. [Google Scholar]
- Ali, A.M.; Kunugi, H. Propolis, Bee Honey, and Their Components Protect against Coronavirus Disease 2019 (COVID-19): A Review of In Silico, In Vitro, and Clinical Studies. Molecules 2021, 26, 1232. [Google Scholar] [CrossRef]
- ALaerjani, W.M.A.; Khan, K.A.; Al-Shehri, B.M.; Ghramh, H.A.; Hussain, A.; Mohammed, M.E.A.; Imran, M.; Ahmad, I.; Ahmad, S.; Al-Awadi, A.S. Chemical Profiling, Antioxidant, and Antimicrobial Activity of Saudi Propolis Collected by Arabian Honey Bee (Apis mellifera jemenitica) Colonies. Antioxidants 2022, 11, 1413. [Google Scholar] [CrossRef]
- Xu, X.; Pu, R.; Li, Y.; Wu, Z.; Li, C.; Miao, X.; Yang, W. Chemical Compositions of Propolis from China and the United States and their Antimicrobial Activities Against Penicillium notatum. Molecules 2019, 24, 3576. [Google Scholar] [CrossRef]
- An, S.-H.; Ban, E.; Chung, I.-Y.; Cho, Y.-H.; Kim, A. Antimicrobial Activities of Propolis in Poloxamer Based Topical Gels. Pharmaceutics 2021, 13, 2021. [Google Scholar] [CrossRef]
- Botteon, C.E.A.; Silva, L.B.; Ccana-Ccapatinta, G.V.; Silva, T.S.; Ambrosio, S.R.; Veneziani, R.C.S.; Bastos, J.K.; Marcato, P.D. Biosynthesis and characterization of gold nanoparticles using Brazilian red propolis and evaluation of its antimicrobial and anticancer activities. Sci. Rep. 2021, 11, 1974. [Google Scholar] [CrossRef] [PubMed]
- Ulag, S.; Ilhan, E.; Demirhan, R.; Sahin, A.; Yilmaz, B.K.; Aksu, B.; Sengor, M.; Ficai, D.; Titu, A.M.; Ficai, A.; et al. Propolis-Based Nanofiber Patches to Repair Corneal Microbial Keratitis. Molecules 2021, 26, 2577. [Google Scholar] [CrossRef] [PubMed]
- Salatino, A. Perspectives for Uses of Propolis in Therapy against Infectious Diseases. Molecules 2022, 27, 4594. [Google Scholar] [CrossRef] [PubMed]
- Yosri, N.; Abd El-Wahed, A.A.; Ghonaim, R.; Khattab, O.M.; Sabry, A.; Ibrahim, M.A.A.; Moustafa, M.F.; Guo, Z.; Zou, X.; Algethami, A.F.M.; et al. Anti-Viral and Immunomodulatory Properties of Propolis: Chemical Diversity, Pharmacological Properties, Preclinical and Clinical Applications, and In Silico Potential against SARS-CoV-2. Foods 2021, 10, 1776. [Google Scholar] [CrossRef]
- Chavda, V.P.; Chaudhari, A.Z.; Teli, D.; Balar, P.; Vora, L. Propolis and Their Active Constituents for Chronic Diseases. Biomedicines 2023, 11, 259. [Google Scholar] [CrossRef] [PubMed]
- SR 784-3:2009; Honey. Part 3: Analysis Methods. ASRO—Asociatia de Standardizare din România: Bucharest, Romania, 2009.
- Wagh, V.D. Propolis: A wonder bees product and its pharmacological potentials. Adv. Pharmacol. Pharm. Sci. 2013, 2023, 308249. [Google Scholar] [CrossRef] [PubMed]
- Gergen, I. Agri-Food Products Analysis; EUROSTAMPA Publishing House: Timisoara, Romania, 2004; 316p, ISBN 973-687-271-8. [Google Scholar]
- Pătruică, S.; Alexa, E.; Obiștioiu, D.; Cocan, I.; Radulov, I.; Berbecea, A.; Lazăr, R.N.; Simiz, E.; Vicar, N.M.; Hulea, A.; et al. Chemical Composition, Antioxidant and Antimicrobial Activity of Some Types of Honey from Banat Region, Romania. Molecules 2022, 27, 4179. [Google Scholar] [CrossRef]
- Lowry, O.H.; Rosebrough, N.J.; Farr, A.L.; Randall, R.J. Protein Measurement with Folin Phenol Reagent. J. Biol. Chem. 1951, 193, 256–275. [Google Scholar] [CrossRef]
- Preda, G.; Dragomirescu, M.; Peter, F. Biocatalizatori Enzimatici. Obţinere, Caracterizare, Aplicaţii; Editura Mirton: Timişoara, Romania, 2003; pp. 29–31. [Google Scholar]
- Cadariu, A.I.; Cocan, I.; Negrea, M.; Alexa, E.; Obistioiu, D.; Hotea, I.; Radulov, I.; Poiana, M. Exploring the potential of tomato processing by-product as a natural antioxidant in nitrite-free reformulated sausages. Sustainability 2022, 14, 11802. [Google Scholar] [CrossRef]
- Margaoan, R.; Marghitas, L.A.; Dezmirean, D.S.; Bobis, O.; Bonta, V.; Catana, C.; Urcan, A.; Mureşan, C.I.; Margin, M.G. Comparative study on quality parameters of royal jelly, apilarnil and queen bee larvae triturate. Bull. Univ. Agric. Sci. Vet. Med. Cluj-Napoca. Anim. Sci. Biotechnol. 2017, 74, 51–58. [Google Scholar] [CrossRef] [PubMed]
- Kim, S.G.; Woo, S.O.; Bang, K.W.; Jang, H.R.; Han, S.M. Chemical composition of drone pupa of Api mellifera and its nutritional evaluation. Korean J. Apic. 2018, 33, 17–23. [Google Scholar]
- Kim, J.E.; Kim, D.I.; Koo, H.Y.; Kim, H.J.; Kim, S.Y.; Lee, Y.B.; Kim, J.S.; Kim, H.H.; Moon, J.H.; Choi, Y.S. Analysis of nutritional compounds and antioxidant effect of freeze-dried powder of the honey bee (Apis mellifera L.) drone (pupal stage). Korean J. Appl. Entomol. 2020, 59, 265–275. [Google Scholar]
- Choi, Y.S.; Lee, M.L.; Lee, M.Y.; Kim, H.K.; Lee, K.G.; Yeo, J.H.; Woo, S.O. Management for high quality drone products. Korean J. Apic. 2009, 24, 1–7. [Google Scholar]
- Botezan, S.; Baci, G.-M.; Bagameri, L.; Pașca, C.; Dezmirean, D.S. Current Status of the Bioactive Properties of Royal Jelly: A Comprehensive Review with a Focus on Its Anticancer, Anti-Inflammatory, and Antioxidant Effects. Molecules 2023, 28, 1510. [Google Scholar] [CrossRef]
- Kunugi, H.; Mohammed Ali, A. Royal Jelly and Its Components Promote Healthy Aging and Longevity: From Animal Models to Humans. Int. J. Mol. Sci. 2019, 20, 4662. [Google Scholar] [CrossRef]
- Balkanska, R.; Kashamov, B. Composition and physico-chemical properties of lyophilized royal jelly. Uludag Bee J. 2011, 11, 114–117. [Google Scholar]
- Sabatini, A.G.; Marcazzan, G.L.; Caboni, M.F.; Bogdanov, S.; Almeida-Muradian, L.B. Quality and standardisation of royal jelly. J. ApiProd. ApiMed. Sci. 2009, 1, 1–6. [Google Scholar] [CrossRef]
- Schnitzler, P.; Neuner, A.; Nolkemper, S.; Zundel, C.; Nowack, H.; Sensch, K.H.; Reichling, J. Antiviral activity and mode of action of propolis extracts and selected compounds. Phytother. Res. 2010, 24 (Suppl. S1), S20–S28. [Google Scholar] [CrossRef]
- Ramanauskiene, K.; Inkeniene, A. Propolis oil extract: Quality analysis and evaluation of its antimicrobial activity. Nat. Prod. Res. 2011, 25, 1463–1468. [Google Scholar] [CrossRef] [PubMed]
- De Freitas, M.C.D.; de Miranda, M.B.; de Oliveira, D.T.; Vieira-Filho, S.A.; Caligiorne, R.B.; de Figueiredo, S.M. Biological activities of red propolis: A review. Recent Pat. Endocr. Metab. Immun. Drug Discov. 2017, 11, 3–12. [Google Scholar] [CrossRef] [PubMed]
- Tosic, S.; Stojanovic, G.; Mitic, S.; Pavlovic, A.; Alagic, S. Mineral composition of selected Serbian propolis samples. J. Apic. Sci. 2017, 61, 5–15. [Google Scholar] [CrossRef]
- Cvek, J.; Medić-Šarić, M.; Vitali, D.; Vedrina-Dragojević, I.; Šmit, Z.; Tomić, S. The content of essential and toxic elements in Croatian propolis samples and their tinctures. J. Apic. Res. 2008, 47, 35–45. [Google Scholar] [CrossRef]
- Mărghitaş, L.A.; Dezmirean, D.; Moise, A.; Mihai, C.M.; Laslo, S.L. DPPH Method for Evaluation of Propolis Antioxidant Activity. Bull. UASVM Anim. Sci. Biotechnol. 2009, 66, 253–258. [Google Scholar]
- Sun, C.; Wu, Z.; Wang, Z.; Zhang, H. Effect of Ethanol/Water Solvents on Phenolic Profiles and Antioxidant Properties of Beijing Propolis Extracts. Evid. Based Complement. Altern. Med. 2015, 2015, 595393. [Google Scholar] [CrossRef]
- Guzman-Gutierrez, S.L.; Nieto-Camacho, A.; Castillo-Arellano, J.I.; Huerta-Salazar, E.; Hernandez-Pasteur, G.; Silva-Miranda, M.; Arguello-Najera, O.; Sepulveda-Robles, O.; Espitia, C.I.; Reyes-Chilpa, R. Mexican Propolis: A Source of Antioxidants and Anti-Inflammatory Compounds, and Isolation of a Novel Chalcone and epsilon-Caprolactone Derivative. Molecules 2018, 23, 334. [Google Scholar] [CrossRef] [PubMed]
- Belfar, M.L.; Lanez, T.; Rebiai, A.; Ghiaba, Z. Evaluation of Antioxidant Capacity of Propolis Collected in Various Area of Algeria Using Electrochemical Techniques. Int. J. Electrochem. Sci. 2015, 10, 9641–9651. [Google Scholar] [CrossRef]
- Nagai, T.; Inoue, R.; Inoue, H.; Suzuki, N. Preparation and antioxidant properties of water extract of propolis. Food Chem. 2003, 80, 29–33. [Google Scholar] [CrossRef]
- Kumazawa, S.; Hamasaka, T.; Nakayama, T. Antioxidant activity of propolis of various geographic origins. Food Chem. 2004, 84, 325–498. [Google Scholar] [CrossRef]
- Ramnath, S.; Venkataramegowda, S. Antioxidant Activity of Indian Propolis—An In Vitro Evaluation. Int. J. Pharmacol. Phytochem. Ethnomed. 2016, 5, 79–85. [Google Scholar] [CrossRef]
- Wang, X.; Sankarapandian, K.; Cheng, Y.; Ok Woo, S.; Kwon, H.W.; Perumalsamy, H.; Ahn, Y.J. Relationship between total phenolic contents and biological properties of propolis from 20 different regions in South Korea. BMC Complement. Altern. Med. 2016, 16, 12. [Google Scholar]

| No. Sample | Product Type | Source of Origin | Abbreviation | Photo |
|---|---|---|---|---|
| 1 | Apilarnil pure | Own apiary | AS |  |
| 2 | Lyophilized apilarnil | Market | ALC |  |
| 3 | Apilarnil pure | Market | AP |  |
| 4 | Royal jelly pure | Own apiary | LMS | 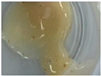 |
| 5 | Lyophilized royal jelly | Market | LML |  |
| 6 | Royal jelly pure | Market | LMC |  |
| 7 | Propolis raw | Own apiary | PS | 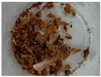 |
| 8 | Propolis raw | Market | PC | 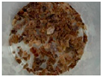 |
| 9 | Propolis tincture | Own apiary | PT |  |
| Metal | Wavelength ʎ (nm) | Lamp Current (mA) | Slit Width (nm) |
|---|---|---|---|
| Pb | 217.0 | 10 | 1.0 |
| Ca | 422.7 | 10 | 0.5 |
| Ni | 232.0 | 4 | 0.2 |
| Mg | 285.2 | 4 | 0.5 |
| Fe | 248.3 | 5 | 0.2 |
| Cu | 324.8 | 4 | 0.5 |
| Na | 589.0 | 3 | 0.8 |
| Cr | 357.9 | 8 | 0.2 |
| Zn | 213.9 | 5 | 1.0 |
| K | 766.5 | 4 | 0.2 |
| Mn | 279.5 | 5 | 0.2 |
| Cd | 228.8 | 4 | 0.5 |
| Fresh Apilarnil | Lyophilized Apilarnil | ||
|---|---|---|---|
| Own Apiary | Market | ||
| Mean ± SD | Mean ± SD | Mean ± SD | |
| Water content (%) | 68.54 ± 0.295 a | 78.58 ± 0.005 b | 6.78 ± 0.470 B |
| DM (%) | 31.36 ± 0.274 a | 21.43 ± 0.017 b | 93.19 ± 0.475 B |
| Acidity | 26.62 ± 0976 a | 12.62 ± 0.69 b | 78.25 ± 0.160 B |
| pH | 5.74 ± 0.010 a | 4.17 ± 0.152 b | 5.55 ± 0.050 A |
| Impurities (%) | 15.28 ± 0.091 a | 5.47 ± 0.026 b | 5.65 ± 0.735 A |
| Protein (mg/g) | 44.86 ± 0.335 a | 22.04 ± 1.235 a | 117.25 ± 4.695 B |
| Ash (%) | 0.88 ± 0.025 a | 1.45 ± 0.010 b | 1.89 ± 0.010 B |
| Macroelements | |||
| Na | 144.02 ± 52.962 a | 159.53 ± 8.209 a | 184.00 ± 8.174 A |
| Ca | 284.23 ± 176.104 a | 309.11 ± 36.465 a | 413.81 ± 40.722 A |
| K | 787.65 ± 780.596 a | 578.89 ± 338.69 a | 2252.91 ± 1262.09 A |
| Mg | 369.93 ± 372.89 a | 206.06 ± 11.377 a | 459.60 ± 187.333 A |
| P | 1233.00 ± 1256.88 a | 375.78 ± 85.878 a | 1343.25 ± 691.903 A |
| Microelements | |||
| Fe | 12.31 ± 9.461 a | 7.86 ± 2.064 a | 32.58 ± 19.219 A |
| Mn | 4.71 ± 1.605 a | 4.79 ± 0.919 a | 4.22 ± 0.403 A |
| Cu | 3.71 ± 1.767 a | 4.54 ± 0.989 a | 7.40 ± 3.478 A |
| Zn | 8.66 ± 6.455 a | 9.34 ± 2.743 a | 30.10 ± 23.129 A |
| Cr | 3.29 ± 0.848 a | 6.80 ± 0.049 b | 6.40 ± 0.127 A |
| Contaminants | |||
| Ni | Undetectable | Undetectable | Undetectable |
| Cd | 1.34 ± 0.268 a | 2.22 ± 0.374 a | 1.68 ± 0.516 A |
| Pb | Undetectable | Undetectable | Undetectable |
| Fresh Royal Jelly | Lyophilized Royal Jelly | ||
|---|---|---|---|
| Own Apiary | Market | ||
| Mean ± SD | Mean ± SD | Mean ± SD | |
| Water content (%) | 65.56 ± 1.064 a | 64.75 ± 0.079 a | 3.33 ± 0.010 B |
| DM (%) | 34.17 ± 0.987 a | 35.22 ± 0.078 a | 94.64 ± 2.000 B |
| Acidity | 29.45 ± 0.045 a | 31.77 ± 1.485 a | 33.03 ± 1.704 A |
| pH | 3.41 ± 0.042 a | 3.14 ± 0.020 b | 3.15 ± 0.050 A |
| Impurities (%) | 9.96 ± 0.656 a | 9.32 ± 0.809 a | 16.79 ± 0.738 B |
| Protein | 41.72 ± 1.005 a | 36.13 ± 0.110 b | 94.76 ± 5.705 B |
| Ash (%) | 1.46 ± 0.015 a | 0.93 ± 0.015 b | 2.95 ± 0.050 B |
| Macroelements | |||
| Na | 182.67 ± 8.457 a | 187.53 ± 8.761 a | 179.11 ± 4.992 A |
| Ca | 200.79 ± 1.994 a | 382.12 ± 30.716 b | 1218.42 ± 1101.62 A |
| K | 1182.42 ± 414.80 a | 1659.43 ± 509.61 a | 2553.17 ± 878.77 A |
| Mg | 365.77 ± 75.038 a | 423.32 ± 19.367 a | 782.40 ± 109.17 B |
| P | 1648.38 ± 343.83 a | 1125.75 ± 191.62 a | 2799.00 ± 890.95 A |
| Microelements | |||
| Fe | 17.87 ± 7.219 a | 19.43 ± 7.353 a | 36.34 ± 6.243 A |
| Mn | 4.20 ± 0.636 a | 5.32 ± 1.965 a | 4.91 ± 0.155 A |
| Cu | 6.26 ± 1.449 a | 7.12 ± 0.820 a | 15.78 ± 0.721 B |
| Zn | 19.71 ± 5.769 a | 21.95 ± 3.075 a | 51.07 ± 4.617 B |
| Cr | 1.03 ± 0.332 a | 2.95 ± 4.164 a | 2.68 ± 0.784 A |
| Contaminants | |||
| Ni | Undetectable | undetectable | Undetectable |
| Cd | 0.70 ± 0.169 a | 1.51 ± 0.106 b | 1.29 ± 0.247 A |
| Pb | Undetectable | undetectable | Undetectable |
| Fresh Propolis | Tincture of Propolis | ||
|---|---|---|---|
| Market | Own Apiary | ||
| Mean ± SD | Mean ± SD | Mean ± SD | |
| Water content (%) | 0.66 ± 0.010 a | 0.35 ± 0.010 b | 96.79 ± 0.188 B |
| DM (%) | 99.15 ± 0.175 a | 98.47 ± 1.051 a | 3.14 ± 0.173 B |
| Acidity | 5.95 ± 0.010 a | 3.97 ± 0.015 b | 15.87 ± 0.031 B |
| pH | 3.55 ± 0.136 a | 3.92 ± 0.020 b | 2.95 ± 0.025 B |
| Impurities (%) | 12.40 ± 0.791 a | 5.74 ± 0.393 b | 0.09 ± 0.015 B |
| Ash (%) | 0.94 ± 0.010 a | 0.98 ± 0.025 a | 0.93 ± 0.015 A |
| Macroelements | |||
| Na | 103.29 ± 7.636 a | 110.33 ± 6.648 a | 84.63 ± 4.956 A |
| Ca | 840.40 ± 12.537 a | 587.05 ± 63.01 b | 437.36 ± 18.915 A |
| K | 97.34 ± 26.467 a | 128.79 ± 44.491 A | 17.85 ± 3.068 A |
| Mg | 144.24 ± 15.711 a | 148.99 ± 0.084 a | 58.26 ± 4.617 B |
| P | 132.00 ± 46.669 a | 152.63 ± 31.99 a | 7.88 ± 3.005 B |
| Microelements | |||
| Fe | 54.58 ± 19.183 a | 41.97 ± 0.883 a | 2.03 ± 0.473 B |
| Mn | 4.91 ± 0.650 a | 5.67 ± 0.926 a | 2.74 ± 0.176 B |
| Cu | 3.13 ± 1.506 a | 2.32 ± 0.120 a | 2.22 ± 0.148 A |
| Zn | 15.85 ± 6.533 a | 42.73 ± 10.868 a | 4.14 ± 2.418 A |
| Cr | Undetectable | Undetectable | 0.49 ± 0.692 |
| Contaminants | |||
| Ni | 1.71 ± 0.876 a | Undetectable | Undetectable |
| Cd | 0.55 ± 0.212 a | 0.24 ± 0.091 a | 0.62 ± 0.176 A |
| Pb | Undetectable | Undetectable | Undetectable |
| Concentration (mg/mL) | Samples | Ascorbic Acid | |||||||||
|---|---|---|---|---|---|---|---|---|---|---|---|
| PS | PC | PT | LMS | LML | LMC | AS | ALC | AP | Concentration (mg/mL) | % Inhibition | |
| % Inhibition | |||||||||||
| 10 | 63.65 | 58.91 | 82.93 | 84.57 | 84.09 | 80.77 | 96.00 | 97.00 | 80.08 | 0.16 | 94.54 |
| 5 | 52.07 | 47.89 | 80.52 | 64.45 | 80.02 | 71.33 | 87.51 | 86.40 | 77.68 | 0.14 | 82.32 |
| 2.5 | 46.23 | 44.50 | 64.85 | 54.44 | 75.06 | 65.76 | 84.36 | 84.70 | 70.38 | 0.10 | 65.24 |
| 1 | 30.34 | 33.55 | 56.86 | 50.25 | 53.76 | 55.31 | 55.77 | 50.90 | 50.89 | 0.08 | 45.48 |
| 0.5 | 24.89 | 21.76 | 37.77 | 36.34 | 36.39 | 37.15 | 32.30 | 30.09 | 30.40 | 0.06 | 25.22 |
| Samples | PS | PC | PT | LMS | LML | LMC | AS | ALC | AP | Ascorbic Acid |
|---|---|---|---|---|---|---|---|---|---|---|
| IC50 ± SEM (mg/mL) | 3.661 ± 0.002 | 3.979 ± 0.002 | 1.720 ± 0.001 | 2.276 ± 0.002 | 1.696 ± 0.001 | 1.832 ± 0.001 | 1.669 ± 0.001 | 1.830 ± 0.001 | 2.058 ± 0.001 | 2.284 ± 0.001 |
| R2 | 0.9788 | 0.9752 | 0.9488 | 0.9497 | 0.9067 | 0.9556 | 0.9027 | 0.904 | 0.9017 | 0.9913 |
| Hill Slope | 9.925 | 8.864 | 11.398 | 11.066 | 12.166 | 10.326 | 15.914 | 16.932 | 12.615 | 17.548 |
Disclaimer/Publisher’s Note: The statements, opinions and data contained in all publications are solely those of the individual author(s) and contributor(s) and not of MDPI and/or the editor(s). MDPI and/or the editor(s) disclaim responsibility for any injury to people or property resulting from any ideas, methods, instructions or products referred to in the content. |
© 2024 by the authors. Licensee MDPI, Basel, Switzerland. This article is an open access article distributed under the terms and conditions of the Creative Commons Attribution (CC BY) license (https://creativecommons.org/licenses/by/4.0/).
Share and Cite
Moraru, D.; Alexa, E.; Cocan, I.; Obiștioiu, D.; Radulov, I.; Simiz, E.; Berbecea, A.; Grozea, A.; Dragomirescu, M.; Vintilă, T.; et al. Chemical Characterization and Antioxidant Activity of Apilarnil, Royal Jelly, and Propolis Collected in Banat Region, Romania. Appl. Sci. 2024, 14, 1242. https://doi.org/10.3390/app14031242
Moraru D, Alexa E, Cocan I, Obiștioiu D, Radulov I, Simiz E, Berbecea A, Grozea A, Dragomirescu M, Vintilă T, et al. Chemical Characterization and Antioxidant Activity of Apilarnil, Royal Jelly, and Propolis Collected in Banat Region, Romania. Applied Sciences. 2024; 14(3):1242. https://doi.org/10.3390/app14031242
Chicago/Turabian StyleMoraru, Dragoș, Ersilia Alexa, Ileana Cocan, Diana Obiștioiu, Isidora Radulov, Eliza Simiz, Adina Berbecea, Adrian Grozea, Monica Dragomirescu, Teodor Vintilă, and et al. 2024. "Chemical Characterization and Antioxidant Activity of Apilarnil, Royal Jelly, and Propolis Collected in Banat Region, Romania" Applied Sciences 14, no. 3: 1242. https://doi.org/10.3390/app14031242
APA StyleMoraru, D., Alexa, E., Cocan, I., Obiștioiu, D., Radulov, I., Simiz, E., Berbecea, A., Grozea, A., Dragomirescu, M., Vintilă, T., & Pătruică, S. (2024). Chemical Characterization and Antioxidant Activity of Apilarnil, Royal Jelly, and Propolis Collected in Banat Region, Romania. Applied Sciences, 14(3), 1242. https://doi.org/10.3390/app14031242