Article

Probabilistic Model Checking GitHub Repositories for Software Project Analysis

1
Department of SW Safety and Cyber Security, Kyonggi University, Suwon-si 154-42, Gyeonggi-do, Republic of Korea
2
Department of Computer Science, Kyonggi University, Suwon-si 154-42, Gyeonggi-do, Republic of Korea
*
Author to whom correspondence should be addressed.
These authors contributed equally to this work.
Appl. Sci. 2024, 14(3), 1260; https://doi.org/10.3390/app14031260
Submission received: 2 January 2024 / Revised: 27 January 2024 / Accepted: 28 January 2024 / Published: 2 February 2024

Abstract

:
GitHub serves as a platform for collaborative software development, where contributors engage, evolve projects, and shape the community. This study presents a novel approach to analyzing GitHub activity that departs from traditional methods. Using Discrete-Time Markov Chains and probabilistic Computation Tree Logic for model checking, we aim to uncover temporal dynamics, probabilities, and key factors influencing project behavior. By explicitly modeling state transitions, our approach provides transparency and explainability for sequential properties. The application of our method to five repositories demonstrates its feasibility and scalability and provides insights into the long-term probabilities of various activities. In particular, the analysis provides valuable perspectives for project managers to optimize team dynamics and resource allocation. The query specifications developed for model checking allow users to generate and execute queries for specific aspects, demonstrating scalability beyond the queries we present. In conclusion, our analysis provides an understanding of GitHub repository properties, branch management, and subscriber behavior. We anticipate its applicability to various open-source projects, revealing trends among contributors based on the unique characteristics of repositories.

1. Introduction

When software projects fail, the consequences can be substantial, resulting in significant time and cost losses [1]. To minimize these risks and ensure successful project completion, effective software project management is important [2]. Failures often stem from a lack of collaboration or communication within project teams [3]. However, understanding and improving collaboration patterns in software projects remain critical. Recent complexities in collaborative processes, coupled with the dispersion of team members, require more efficient organization and comprehension of software development activities by project managers and developers [4,5]. Since the software development process involves human activities across all stages, from design and development to testing and maintenance, managing human factors is a crucial aspect [6]. In essence, collaboration and communication among team members in the software development environment are fundamental elements for project success.
In response to these challenges, GitHub has gained prominence as a platform for collaborative software development. GitHub facilitates smooth collaboration among developers by offering numerous features such as issue tracking, code review, and pull requests, streamlining version control and project management [7]. This platform provides a transparent development environment, allowing people to observe and actively contribute to the actions and trends of other developers, fostering a collaborative atmosphere [8]. Additionally, GitHub promotes open collaboration by structuring workflows based on pull requests [9]. To contribute to GitHub’s open-source projects, developers must follow specific procedures. Analyzing these development processes is crucial from a project management perspective, providing insights into collaboration patterns and project trends, thereby enhancing the efficiency of development teams [10,11]. This study aims to capture the trends and characteristics of individual projects and developers through the analysis of GitHub’s development processes.
GitHub, as the fundamental unit of projects, enables easy communication and contributions from diverse developers through repositories. GitHub comprises a remote repository as a central hub and local repositories for individual developers to store their work. Particularly, when multiple developers contribute simultaneously or manage version control, GitHub enhances the organization and comprehension of software development activities. The procedures involved in integrating changes from local repositories to remote repositories, including branch creation, committing changes, submitting pull requests for completed features, and accepting or rejecting merge requests, unfold over time, allowing for the observation of various patterns [12].
To handle these time-series data, we employ Discrete-Time Markov Chain (DTMC) modeling. DTMC is a mathematical model representing a system transitioning between a finite set of states at discrete time intervals [13]. This modeling approach is adept at capturing probabilistic transitions between different states, making it useful for analyzing sequential data over time. It excels in handling categorical data sequences and aids in devising optimal plans through predictive analysis in decision processes [14,15]. Through DTMC modeling, we observe the trends in the development processes on GitHub over time.
Our research analyzes three aspects: repository characteristics, branch management, and participant analysis. Repository characteristics focus on the overall activities and trends of the project. Branch management centrally addresses the aspects of distributed version control systems inherent in GitHub. Lastly, participant analysis explores individual contributions, trends, and relationships among contributors. These results are expected to be utilized for identifying areas of improvement in project management or gaining insights into the project’s progress.
The structure of this paper is as follows: Section 2 provides background information, Section 3 introduces our research methodology for GitHub project analysis, Section 4 presents a case study applying the proposed methodology, Section 5 discusses our findings, and finally, Section 6 concludes the paper.

2. Background

2.1. Discrete-Time Markov Chain

DTMC is a probabilistic model used to analyze the stochastic transitions between different states or events [13,16]. Particularly useful for capturing and studying the dynamics of systems where transitions occur in discrete time steps, DTMC models the system’s behavior as a series of states with transitions occurring at specific intervals. The Markov property, indicating that the probability of transitioning to a future state depends only on the current state and is independent of past states, allows for simplified modeling and analysis of systems with stochastic behavior. DTMC can be defined in 4-tuple: M = ( S , P , L , A P )
  • S represents the state space, which is the set of all possible states the system can be in.
  • P : S × S [ 0 , 1 ] denotes the state transition probability matrix of the state space S.
  • L : S 2 A P is a labeling function that maps each state to its respective labels.
  • A P is a finite set of atomic propositions.
In more detail, for DTMC with n states, the state space S is defined as S = { s 1 , s 2 , , s n } , and the transition matrix P is an n × n matrix, where P i j represents the probability of transitioning from state s i to state s j . The labeling function L provides a means to label states with specific properties or characteristics, enhancing the representation of system behavior.
DTMC finds applications in studying various aspects related to social interactions, communication patterns, or behavioral dynamics within the context of interpersonal relationships. In [17,18], DTMC is employed to model dialogue acts, emotions, decision-making, and action information in conversations among project participants with assigned roles. Model checking is performed using probabilistic Computation Tree Logic (pCTL), allowing the analysis of relationships and interactions among participants over short or long periods and providing diverse quantitative metrics for analyzing interactions during meetings. In the context of continuous system behavior, Markov modeling is used to specify safety-related properties, and model checking verifies safety. Ref. [19] introduces a method for verifying the safety of human–robot interaction systems using probabilistic model checking. DTMC models the continuous states of robots and humans, and safety properties are specified and verified using probabilistic reward computation tree logic. Ref. [20] models the Automated Airspace Concept system for air traffic control using DTMC to ensure safety. Separation assurance algorithms defined over specific time intervals are modeled, safety requirements are specified using pCTL, and model checking calculates the likelihood of conflicts, evaluating various design options and providing quantitative measurement methods.
Our choice to use DTMC and model-checking techniques in this research is motivated by the need to comprehensively analyze the temporal dynamics of contributions and collaboration patterns within GitHub repositories. By modeling essential GitHub actions through DTMC and employing model checking, we can quantitatively assess various aspects, such as repository characteristics, branch management, and participant analysis. This approach enables us to gain insights into the evolving behavior and interaction patterns of contributors over time, contributing to a more holistic understanding of GitHub project dynamics.

2.2. Probabilistic Computation Tree Logic

To perform model checking for Markov models, property specifications must be written in Probability Temporal Logic (PTL). PTL serves as the formal logic framework used for reasoning about the properties and behaviors of probabilistic systems [21]. It extends classical temporal logic by integrating probabilistic operators, enabling the specification and verification of properties with probabilistic aspects. In our study, we leverage a specific instance of PTL called pCTL. pCTL allows the expression of probabilities such as reaching a specific state, the expected time until a certain event occurs, or the likelihood of satisfying certain conditions in probabilistic systems [22]. pCTL formulas consist of state and path formulas, incorporating transient state probability operators denoted as P and steady-state probability operators denoted as S. Path formula properties are composed of operators like X (neXt), U (Until), and F (Future), which allows for reasoning about future occurrences using the U operator. The formula can be represented as follows:
  • State formula
    Φ : : = t r u e | a | ¬ Φ | Φ 1 Φ 2 | P p [ φ ] | S p [ Φ ]
  • Path formula
    φ : : = X Φ | Φ 1 U N Φ 2
  • F operator
    F Φ t r u e U Φ
We use PRISM 4.7 as the model-checking tool. PRISM [23] automatically verifies and quantifies properties expressed in pCTL by automatically exploring the entire state space of DTMC models. PRISM allows us to provide quantitative information in addition to probabilistic values by integrating the reward structure into DTMC. The reward structure assigns numerical values to system states or transitions, capturing quantitative aspects such as costs or utilities associated with specific events [24]. In this paper, the function ρ is added to the state formula to use a state reward structure. In the formula for the reward used in this paper, C k represents the cumulative reward value up to step k, and F Φ represents the expected value until it is reached.
  • State reward function
    ρ : S R 0
  • State formula with reward
    Φ : : = R = ? [ C k ] | R = ? [ F Φ ]
PRISM also allows the usage of filter operators, which address the limitation of PRISM requiring the specification of an initial state. We utilize filter operators to find averages or values that satisfy specific conditions. It selects the states that satisfy c o n d as the initial state and calculates the average or values of the result of performing Φ . The formalism used in our paper is as follows:
  • Filter formula to find the average
    f i l t e r ( a v g , Φ , c o n d )
  • Return the value for the single state satisfying states
    f i l t e r ( s t a t e , Φ , c o n d )

2.3. Model Checking

Model checking is a formal verification technique that systematically analyzes and verifies properties of a system model against specified requirements or specifications [25,26]. It provides a rigorous and automated approach to thoroughly explore all possible system states and transitions, detect errors, and identify potential problems to ensure the correctness and reliability of the system’s behavior. Thus, formulating an appropriate pCTL for the created model such as DTMC is important for verifying various aspects. In our research, we apply model-checking techniques to gain insight into the behavior of GitHub repositories over time, analyze specific collaboration patterns, and observe individual participants.

3. GitHub Model Checking

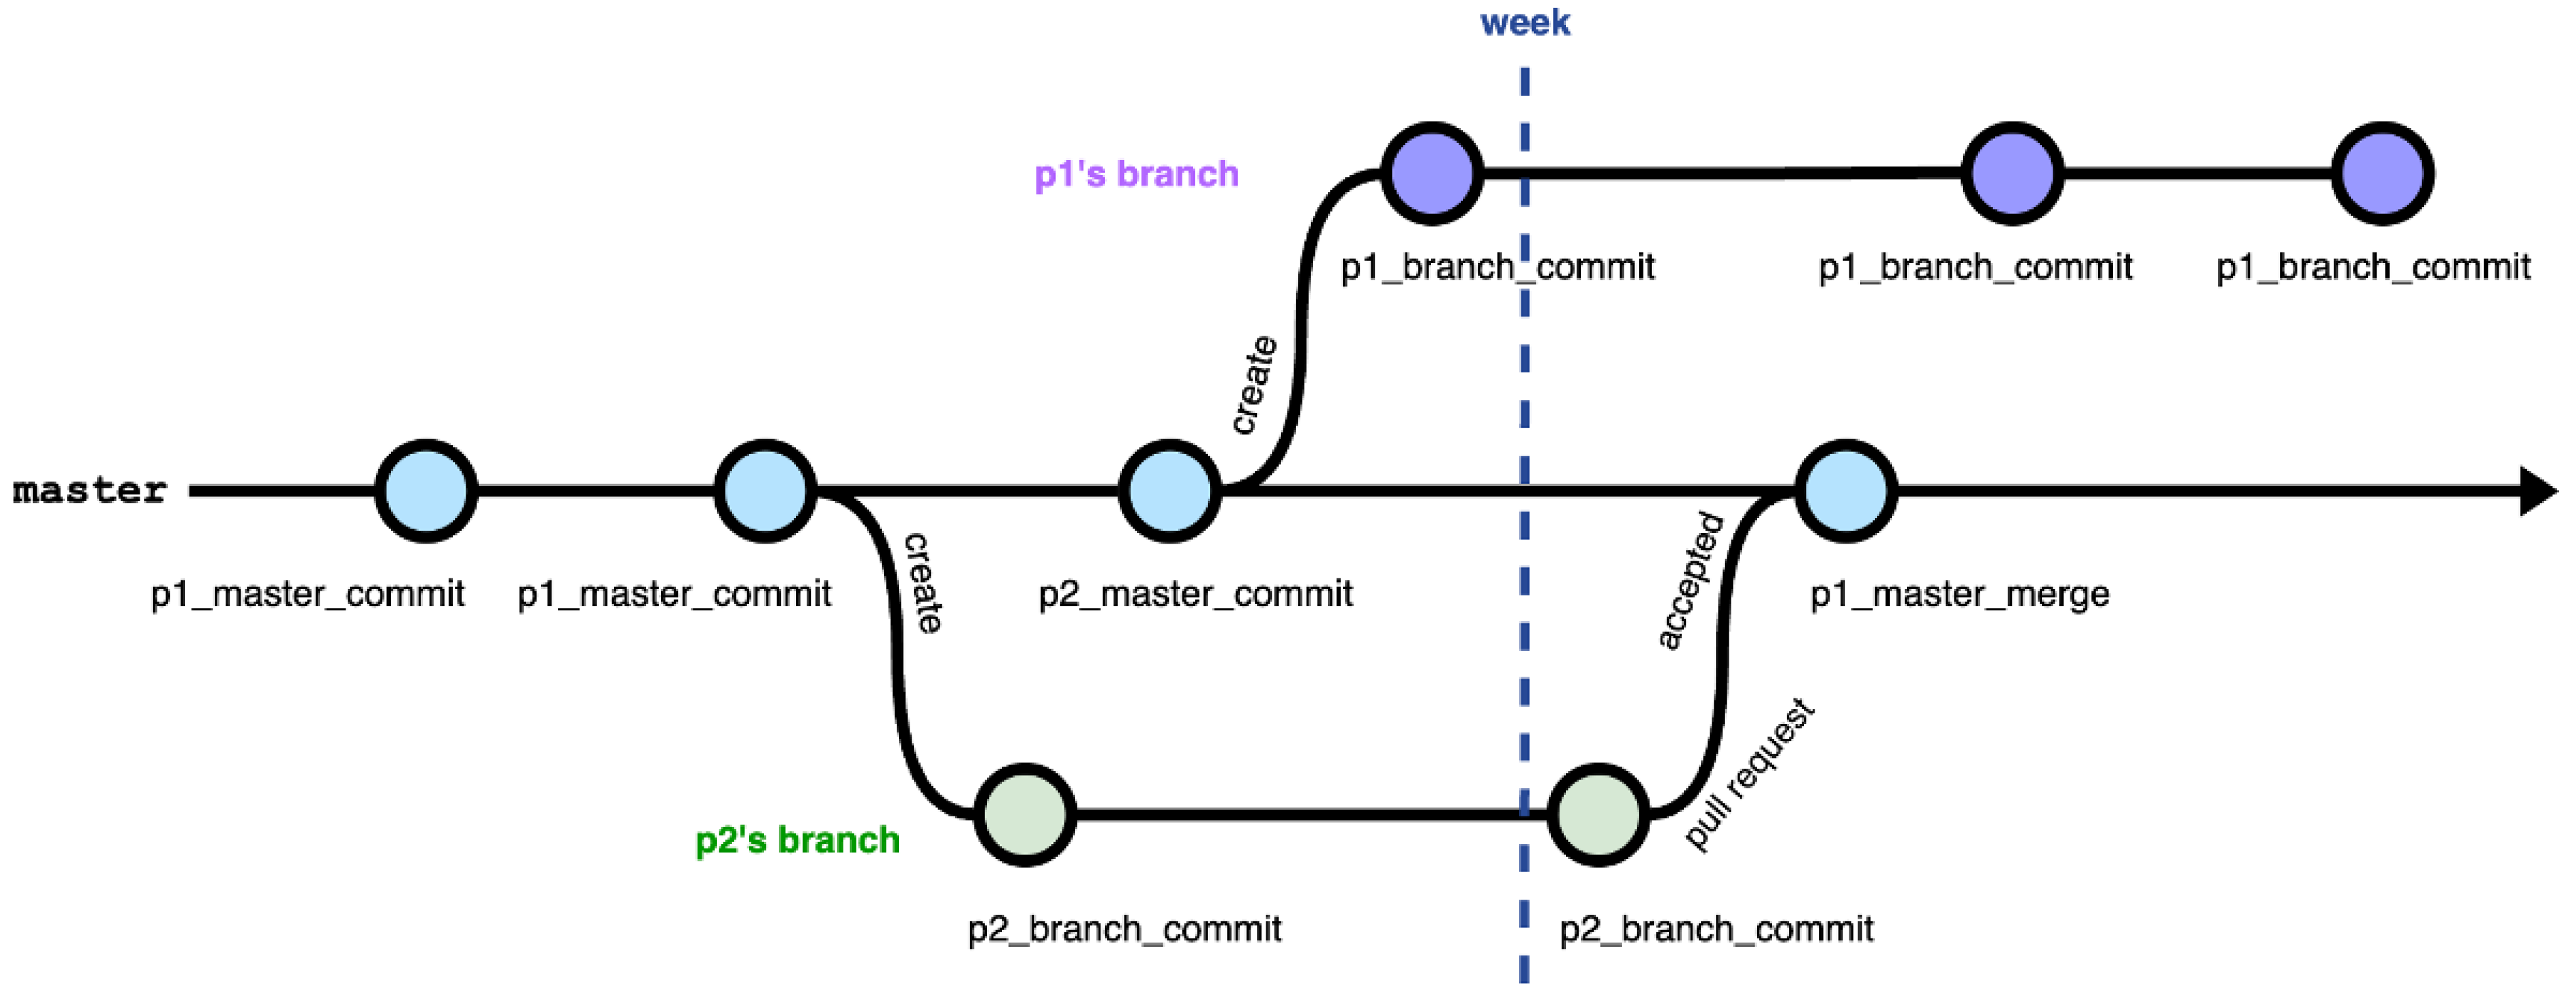
3.1. GitHub Workflow

Our study models and analyzes the workflow based on key actions essential in GitHub’s collaborative environment. In this research, we delve into the primary actions within GitHub, as they play crucial roles in the collaboration and development processes. The key actions addressed in GitHub are as follows:
  • create: This action is employed to create a new branch, signifying the initiation of a separate branch for specific tasks such as implementing features or fixing bugs. This allows developers to work without impacting the main codebase.
  • commit: Developers utilize the “commit” action to upload changes to the repository. Commits encapsulate sets of changes made to files, enabling version control and tracking modifications over time.
  • pull request: Upon completing feature implementations or bug fixes, developers propose changes through a “pull request”. This action serves as the mechanism to merge changes into the main codebase or another branch.
  • accepted: The “accepted” status indicates that a submitted pull request has been approved for integration.
  • merge: Project maintainers or collaborators review and approve proposed changes through the “merge” action, signifying the integration of the changes into the main branch. This process consolidates new features or bug fixes.
  • rejected: The “rejected” status denotes that a submitted pull request has not been approved for integration.
Figure 1 shows a branch network example to aid the understanding of the relationships between actions. In this context, p1 and p2 represent individual participants, defined in this paper as developers who have engaged in at least one action. In Figure 1, “master” signifies the default branch serving as the main codebase. Each node represents a state where changes have been applied, indicating occurrences of “commit” or “merge”. By arranging and modeling actions in chronological order, we observe interactions among participants contributing to the project’s evolution over time. Thus, our analysis involves chronological sorting and modeling of actions to gain insights into the collaborative dynamics within the GitHub environment.

3.2. State Structure

To create the DTMC model for development actions, it is necessary to define each state. In this paper, a state represents individual development actions and includes information about the actors involved. Each state is composed of a triple of participants, locations, and actions. The components of a state are as follows:
  • participant: {p1, …, pn}
  • location: {master, branch}
  • action: {create, commit, pullRequest, accepted, merge, rejected}
Participant refers to individuals who have attempted to contribute to the project, and for anonymity, they are assigned as p1 to pn in the order they appear in the project. Thus, p1 represents the first person who initiated the project. Location indicates the location of the action performed, where the default branch is labeled as “master”, and all other branches are labeled as “branch”. Action represents essential activities for project development on GitHub. In this context, “rejected” and “accepted” are added to indicate the acceptance status of the pull requests submitted by participants. Each state is represented by a combination of <participant_location_action>, which can be interpreted as <participant> performing <action> on <location>. Examples of states include:
  • <p1_branch_create> denotes p1 creating a branch.
  • <p2_master_commit> represents p2 committing to the master branch.
  • <p3_branch_pullRequest> indicates p3 initiating a pull request for a branch.
  • <p4_branch_rejected> signifies that the pull request submitted by p4 has been rejected.
In addition, the state marked “week” is used to distinguish the interval of one week. Here, a weekly analysis is assumed, but the period can be changed in various ways depending on the purpose.

3.3. DTMC Modeling

Once the states to be used in the model are defined, the next step is to calculate the transition probability between each state. First, the data logs extracted from GitHub are sorted chronologically, and each log is transformed into the state structure defined earlier. Additionally, the label “week” is inserted at the beginning and end of the model. Finally, transition probabilities for transitioning from the current state to the next state are calculated to create the transition matrix.
Figure 1 provides an example of a branch network used to aid in understanding this process. In this example, there are two participants, and the project spans approximately two weeks. When the data logs are extracted from Figure 1, sorted in chronological order, and transformed into the defined state structure, the result appears as shown in Figure 2a. Now, based on this, transition probabilities between states are calculated. For instance, let us consider “p1_branch_commit”. This state is followed by “week” twice and “p1_branch_commit” once. Therefore, the next state after “p1_branch_commit” has a 2/3 probability of transitioning to “week” and a remaining 1/3 probability of transitioning to “p1_branch_commit”. Once the calculations are completed, the modeled results appear as shown in Figure 2b.
Furthermore, labels and reward structures for the given model are defined. Labels encompass all combinations of tuples. For example, the label “commit” encompasses all states where the “commit” action exists. Referring to Figure 2, the “commit” label encompasses the following states. Here, s represents the variable indicating the state.
label commit = ( s = 1 ) | ( s = 3 ) | ( s = 4 ) | ( s = 6 ) ;
In this paper, various reward structures are employed for model checking. Reward structures essentially use the prefix “r_” added to labels, signifying that upon reaching the state represented by that label, a reward of 1 point is received. For example, “r_pullRequest” implies receiving a reward of 1 point when visiting a state where “pullRequest” exists. Additionally, an additional reward structure named “r_steps” is used. This is used to gain insight into the time steps with each transition, assigning 1 point for each transition.

3.4. Property Specification

Table 1 presents a list of temporal logic based on pCTL that we utilized. With a total of 15 queries, our aim was to conduct model checking for each repository, focusing on features, branch management, and participant analysis. Queries based on temporal logic can be further customized beyond those presented in this study.

3.5. Data Collection and Modeling

This research aims to propose a method for analyzing activities related to contributions on GitHub and demonstrate what insights can be gained from it. To achieve this goal, we chose repositories where members collaborate internally to develop software rather than large open-source projects primarily contributed to by external individuals. Therefore, we selected repositories from the organization called “oslabs-beta”. OSLabs is a nonprofit tech accelerator that contributes to the development of open-source projects [27]. The OSLabs beta program provided here supports the development of ideas for open-source developer tools by enabling small teams to collaborate and develop for approximately three months. To ensure consistency in comparing and analyzing experimental results, we selected repositories based on the following criteria: (1) projects that are already completed, (2) repositories with 4 members, (3) repositories with a minimum of 100 commits, and (4) repositories with at least 50 or more stars. Based on these criteria, we selected the following five repositories:
  • oslabs-beta/DeSolver
  • oslabs-beta/kafkaVision
  • oslabs-beta/Redline
  • oslabs-beta/Sherlogs
  • oslabs-beta/Hearth
To collect data from each repository, we utilized the GitHub REST API [28]. By sending requests through this API, we received responses in JSON format, which we then analyzed and refined. In particular, each commit or pull request has a unique identifier called “sha”, which allowed us to eliminate the risk of duplicates when extracting data. The modeling results generated the states and transitions as shown in Table 2.
Figure 3 shows the state transition graph for the modeling results of Redline. Through this figure, one can examine the transitions and probabilities associated with each state.

4. Experimental Results

4.1. Repository Characteristics

4.1.1. Action Rate

Understanding the rate of actions within a repository provides valuable insight into the overall trends and dynamics of that repository’s development. (1) represents the property specification used for this query.
S = ? [ a c t i o n L a b e l ]
This query uses the S operator to calculate the probability of each action being performed in the long term. The results of the model checking performed on five models are shown in Table 3. Looking at the results, we can see that the probabilities of the actions “accepted” and “merge” are equal. This result follows from the modeling, which ensures that “merge” follows “accepted” in the state transitions. Furthermore, “commit” emerges as the most common action across all repositories, while “rejected” has relatively low probabilities. Further insight can be gained by comparing the probabilities of different actions. For example, the proportion of “create” actions is lower than that of “pull request”. Developers typically create branches for different purposes, such as feature development, bug fixes or testing. When their work is complete, they initiate pull requests. If these processes were one-to-one, the results would be identical. However, this result shows that the pull request rate is higher, which may be related to the development workflow within each repository, or to the pull request approval rate. More specifically, by continuing to work on the same branch and making multiple pull requests, or by rejecting pull requests, there may be a process of modifying and re-requesting the code.
Closer examination reveals that in the case of kafkaVision and Sherlogs, the sum of “accepted” and “rejected” actions is less than the number of “pull request” actions. This indicates the presence of pending or unprocessed pull requests. In contrast, the remaining repositories have the sum of “accepted” and “rejected” actions equal to that of “pull request” actions.

4.1.2. Activity per Week

When collecting data from GitHub, we segmented our analysis into one-week intervals. Let us delve into the significance of this one-week interval.
P = ? [ X ! w e e k ]
Query (2) is used to calculate the probability of performing actions each week. Through the X operator, it calculates the probability of the next step not being in the w e e k state, thus indicating the probability of continued activity in the following week. Hence, the higher this probability, the more it demonstrates the sustainability of development activities. The results are shown in Table 4. Model checking results indicate that Redline and Hearth had a history of weekly activity throughout their projects. In contrast, kafkaVision has the lowest percentage, indicating periods of inactivity during the project’s progression.
R { r _ s t e p s } = ? [ X F w e e k ]
R { r _ p u l l R e q u e s t } = ? [ X F w e e k ]
Having explored the probability of weekly activity, let us now inquire about the extent of activity each week. Query (3) employs the transition reward, r _ s t e p s , to calculate the average cumulative action count per week. Using the X and F operators, it determines the weekly activity until reaching “week” in the future. When applied to five models, the average is found to be 39.63, indicating an average of approximately 40 actions performed per week. Query (4) is a modification of (3), using the transition reward r _ p u l l R e q u e s t . This query calculates how many pull requests were made on average each week.
When computed for five models, the average is found to be 6.35. Figure 4 shows the model checking results for (3) and (4), organized by repository. This reveals that DeSolver exhibited relatively lower activity levels, while Redline showed the highest activity levels. The rate of pull requests to weekly activity averaged around 10–20% overall.

4.2. Branch Management

4.2.1. Development Location

In GitHub, branches are essential for isolating development work, preventing conflicts between various changes, and enabling multiple contributors to maintain the main codebase stably while performing development tasks [29]. Appropriate branching strategies can significantly assist in version control and maintaining stability within a project. The following queries were used to determine which branch actions were performed:
R { r _ m a s t e r } = ? [ C < = 100 ]
R { r _ b r a n c h } = ? [ C < = 100 ]
R { r _ w e e k } = ? [ C < = 100 ]
These queries calculate the average cumulative sum of actions’ branch locations within 100 steps. Query (5) focuses on the master branch using the r _ m a s t e r reward structure, Query (6) calculates actions for branches other than master using the r _ b r a n c h structure, and Query (7) introduces r _ w e e k to compare activity ratios across projects. Since all modeled states include “master”, “branch” and “week” the sum of results for each query always equals 100. Figure 5 shows the results for each repository. Model checking shows that all repositories predominantly performed work on “branch”. Notably, kafkaVision has a very low proportion of activity on “master”, indicating that most development work occurred through “branch”. In contrast, Sherlogs had a relatively higher proportion on “master”. These queries calculate how often specific states occur within 100 steps, so a lower proportion of r _ w e e k suggests higher project activity.

4.2.2. Pull Request Management

After gaining insights into branch management, let us delve into pull request management. Pull requests are used to integrate changes made in branches into other branches, and they require code inspection and approval by reviewers before they can be merged.
f i l t e r ( a v g , P = ? [ X a c c e p t e d | r e j e c t e d ] , p u l l R e q u e s t )
Query (8) is employed to calculate the average probability of immediate processing of pull requests to the next step. This helps examine the responsiveness to pull requests in each repository. The results are shown in Table 5.
f i l t e r ( s t a t e , P = ? [ X p a r t i c i p a n t & ( a c c e p t e d | r e j e c t e d ) ] , p a r t i c i p a n t & p u l l R e q u e s t )
Query (9) expands upon (8) by adding a participant label to investigate the pull request processing probabilities of individual participants. Figure 6 presents a box plot showing the distribution of participants’ pull request processing probabilities for each repository. This reveals that Redline exhibits a considerably fast processing rate for all the participants’ pull requests. In the case of Hearth, there is relatively high variability in pull request processing among individual participants. Sherlogs shows that participants are distributed with relatively low probabilities.
f i l t e r ( a v g , P = ? [ F < = K a c c e p t e d | r e j e c t e d ] , p u l l R e q u e s t )
Now, we look into predicting the future using F instead of the immediate next step X. Query (10) calculates the pull request processing rate within K steps, using the constant K. When K equals 1, it is equivalent to the immediate next step, resulting in the same outcome as (8). The results for K ranging from 1 to 35 are depicted in Figure 7. As expected, Sherlogs takes the longest to process pull requests, but by K = 35 , it approaches a value close to 1, indicating that Sherlogs processes almost 100% of pull requests after 35 steps. An interesting observation from the graph is that each repository has different starting points and slopes. For example, Hearth initially had a lower pull request processing rate than kafkaVision up to K = 4 , but from K = 5 it had a relatively higher processing rate.
This section on pull request analysis provides insights into how promptly project administrators handle pull requests. A rapid processing rate might indicate quick action with minimal review, or it could suggest high interest in promptly reviewing and processing pull requests. Conversely, a slower processing rate might indicate less active management of pull requests, but it could also mean careful review and consideration before processing. Therefore, when interpreting the results of these queries, it is essential to consider the specific characteristics and trends of each project.

4.3. Participant Analysis

4.3.1. Individual Participants

In the context of GitHub, individual contributors are individuals who typically contribute to open-source projects by making various types of contributions to improve and expand the software. These contributions play a significant role in the development and maintenance of the software. Therefore, it is essential to analyze the behavior patterns of each participant over time to gain insights into their activity and contribution patterns and encourage participation. In this section, we analyze the behavioral patterns of participants over time to understand their activity levels and contribution patterns.
R { r _ s t e p s } = ? [ F p a r t i c i p a n t ]
Query (11) calculates the average time steps it takes for each participant to appear in the project using the reward structure. A lower result indicates that a participant joined the project relatively quickly. Figure 8 shows the results for all participants, grouped by repository. DeSolver, kafkaVision, and Redline show minimal differences among participants, while Sherlogs and Hearth exhibit significant variation among participants. Significant differences suggest variations in the timing of participant activity within the project. For example, the distribution for Redline indicates that most participants joined at similar times. With the exception of Hearth, most repositories have lower values for p1, suggesting that early participants were more proactive than later participants.
f i l t e r ( a v g , R { r _ p a r t i c i p a n t _ b r a n c h _ c o m m i t } = ? [ F ( p a r t i c i p a n t ) & ( p u l l r e q u e s t ) ] , ( p a r t i c i p a n t ) & ( c r e a t e ) )
Query (12) calculates the number of commits made by participants from branch creation to pull requests using the r _ p a r t i c i p a n t _ b r a n c h _ c o m m i t reward structure. On average, participants make approximately 3.35 commits before creating a pull request. Figure 9 presents the results for each repository using box plots.
In the case of Redline, participants made the fewest commits before creating pull requests. This type of query provides insights into team development processes, helps evaluate compliance with commit rules and conventions, and may reveal how frequently commits are required for feature development.
P = ? [ F < = K ( p a r t i c i p a n t ) & c o m m i t ]
Query (13) calculates the probability of participants making a “commit” within K steps. Varying values of K allow us to analyze the probability of participants making commits within different timeframes. Figure 10 shows the results for K values ranging from 1 to 50, broken down by repository.
Higher probabilities early in the steps suggest a higher likelihood of participants making commits quickly. This figure enables us to speculate about when and with what probability certain participants are likely to make commits in the project. For example, in Sherlogs, p1 generally has a higher probability of making commits than p2. Another example is Redline’s p1, which initially had a higher probability of making commits than p2 but saw a reversal after K = 13 , indicating that p2 had a higher probability of making commits.

4.3.2. Relationship Analysis

One of the key features of GitHub is its role in facilitating collaboration among software developers and teams. Therefore, it is essential to understand the relationships and dynamics among participants in a project to promote effective collaboration. In this section, we analyze the behavior patterns of participants over time to gain insights into their activity levels, contribution patterns, and collaboration dynamics.
f i l t e r ( a v g , R { r _ s t e p s } = ? [ F ! p a r t i c i p a n t ] , p a r t i c i p a n t )
Query (14) calculates the average time steps it takes for one participant to encounter another. A lower average time step indicates that team members interact and contribute to the project more frequently, while a higher average time step suggests longer intervals between individual contributions. The results are shown in Figure 11. The most frequent range observed falls between 2.0 and 2.5 average time steps, with an overall average of 2.51. This means that, on average, a participant encounters another participant approximately after going through around three time steps.
f i l t e r ( a v g , P = ? [ X p 1 & m e r g e ] , p a r t i c i p a n t & a c c e p t e d )
Query (15) is a query designed to determine the probability of who handled the merge for p1’s merged pull requests. In this query, p1 is fixed as the person who performed the merge. Therefore, it calculates the likelihood of p1 being responsible for merging pull requests submitted by team members. Table 6 presents the results obtained from model checking.
In the case of Sherlogs, p1 managed to merge nearly all of their pull requests, including their own, with a 100% merge rate for their own pull requests. DeSolver’s p1 merged with a probability of 50% or less for all participants’ requests. For kafkaVision and Redline, p1 did not merge their own pull requests but rather allowed other participants to manage them. Hearth’s p1 exhibited the highest probability of managing its own pull requests but did not handle any of p4’s pull requests.

5. Discussion

GitHub repositories collect activity logs from multiple developers over time. Therefore, many studies have conducted time series analyses on GitHub to extract various information aspects from repositories. For instance, Ref. [30] examined the development of communication patterns over time for five open-source projects. The projects were divided into one-month periods to analyze contributors’ interactions through time series analysis. The evolution of contributors’ core-periphery perspective was observed using the k-means algorithm. In a similar study, Ref. [31] utilized LSTM for time series analysis to predict trends based on various events such as fork, create, and pull requests for repository, language, and domain.
Traditional time series analysis typically relies on clustering or neural network algorithms to predict future events based on past data. However, these methods have limitations in terms of their ability to analyze each state change in detail and provide interpretability. To address this issue, we utilized model checking with DTMC and pCTL. DTMC is particularly useful for modeling sequential features because it allows for the explicit modeling of state transitions and provides transparency regarding state transitions and probabilities. By writing a query specification using pCTL, a tense logic, it is possible to establish a relationship between the scenarios or behaviors to be analyzed. The goal is to identify patterns and behaviors, rather than explicitly predicting future events. Model checking with DTMC and pCTL can provide a quantitative measure of time steps or probability. This methodology models GitHub repositories to analyze three aspects: Repository Characteristics, Branch Management, and Participant Analysis. The implications of these aspects are then discussed.

5.1. Repository Characteristics

This section analyzes the activity trends and sustainability in a GitHub repository using queries. Understanding these trends can aid in project planning and resource allocation. Activity trends were observed in (1). Interestingly, Ref. [32] developed a model using a state machine and conducted a time series analysis to examine the project’s sustainability. The project’s activity rate was analyzed by examining the transition probability of each state. A state with minimal commits was defined as ’Running’, a state with no actual contributions from developers but non-coding activities (such as issue creation and comments) was defined as ’Zombie’, and a state with no activity was defined as ’Dead’. In contrast to [32], which created a state machine based on the presence or absence of activities in a given month, our study constructed state transitions for each and every activity. Our study indicates that by modifying the label of (2), it is possible to determine the likelihood of either ’Running’ or ’Dead’.
In software development projects, a team’s velocity is a metric that measures the amount of work the team can accomplish within a specific timeframe [33]. Knowing your team’s velocity can assist in efficiently allocating and managing resources and expenses, as well as planning your project schedule [34]. In today’s fast-paced and small-cycle development processes, such as Agile, it is crucial to comprehend and manage your team’s velocity. To this end, (3) and (4) offer valuable insights into understanding your team’s velocity. (3) provides the average number of activities per week, while (4) provides the average number of pull requests per week.

5.2. Branch Management

Branches are mainly used to implement new functions [29]. A branch that has been implemented with functionality integrates changes through a pull request. Integration through such a pull request is more likely to succeed in the build than in direct commit [35]. Therefore, branch management for projects should be treated as important. This branch management is related to the contribution workflow. GitHub’s open-source projects have guidelines for contributing to their projects. However, there is a lack of research on whether to follow the workflow [36]. Therefore, we analyzed the current status of branches and the amount of activity using (5), (6), and (7). As a result, we found that most of the work was performed on branches other than the master branch. Using these figures is expected to specify the status of branch management in the repository or whether the project will be managed with a specific target figure.
Pull requests offer an opportunity for code review before integrating new changes into the base code. In the case of a pull request, priorities are assigned based on interest or importance [8]. (8) evaluates each pull request on a project-by-project basis to determine if it will be processed immediately. (9) verifies if each participant’s pull request is processed immediately. (10) provides the probability of processing a pull request over time, allowing for observation of each project’s processing speed.

5.3. Participant Analysis

As social coding evolves, project managers often observe contributors and engage them in activities to move the project forward [8]. To conduct this, they analyze a project’s long-term contributors. On GitHub, long-term contributors are developers who have been contributing to a particular project for a long time [37,38]. These contributors remain engaged with the project, not only by contributing code, but also by contributing in a variety of ways, such as issue reporting, code review, and documentation, that contribute to the ongoing development and success of the project. In other words, the ongoing contributions of long-term contributors are key to the successful survival of an open-source project. Therefore, predicting and analyzing long-term contributors is necessary for the ongoing development of a project, and research has been conducted in several directions. To predict long-term contributors, Ref. [39] analyzed the criteria of long-term contributors by specifying that the time interval between the first and last commit to a repository is greater than a certain time. Various classifiers such as naive Bayes, SVM, decision tree, kNN, and random forest were used to predict long-term contributors for 1, 2, and 3 years, respectively, and the AUC of random forest was greater than 0.75. In [40], developers who have contributed to the repository for more than three years are defined as long-term contributors and various types of machine learning models are built to analyze long-term contributors. Their goal was to effectively predict whether a new contributor would become a long-term contributor. Unlike previous studies that focus on a specific year as the threshold for a long-term contributor, we use the transition of each state to find the probability of contributing in the future. In our study, evidence about long-term contributors can be obtained from (11), (13), and (14). (11) tells us how soon a contributor joins a project, and (13) gives us the probability of a contributor’s “commit” over time. (14) tells us the average amount of time each contributor spends on a single activity. If other contributors are working on the activity at roughly the same time, this number will be lower. We expect that these results will help project managers understand how contributors are doing, and adjust strategies to encourage long-term contributions.
The decision to merge a pull request is often influenced by the number of commits it contains [9]. Accordingly, (12) can be used to determine the average number of commits made by each participant before a pull request is made. Since pull requests can be managed by individuals with specific permissions, this feature also allows for the analysis of power dynamics within a group. For example, Ref. [41] used Louvain clustering to explore pull-request interaction graphs in the context of pull requests and commits. Similarly, (15) was used to learn about p1’s management of pull requests in the project. In this way, it is possible to understand the status of p1’s pull request management for five projects. If there is an interest in examining the management status of other participants, simply replacing p1 with another participant’s identifier in the query allows for model checking.

5.4. Limitations

This study has limitations to consider. First, the proposed modeling method may face challenges when repositories have complex branch strategies with multiple hierarchical levels. However, since our focus was on the fundamental goal of version control for the “master” branch and various feature branches, we believe that the method is adequate for this purpose. Second, the state explosion problem, a common challenge in model checking, is a potential limitation [42]. However, we observed that the number of states and transitions does not grow exponentially with an increase in participants, making model checking feasible for repositories with up to 400 participants. We plan to further investigate this issue in future work. It is important to note that this study primarily aimed to explore team dynamics in small to medium-sized team projects rather than large-scale open-source projects.

6. Conclusions

GitHub serves as a platform where developers contribute to projects, collaborate, and shape progress. GitHub encourages collaboration in software development, and contributions are made through specific actions or commands. Data on these activities accumulate over time, and time series analysis can provide insights into the dynamics of open-source development. Unlike popular methods such as K-means clustering or LSTM networks that have been used in previous time series analyses of GitHub, we used DTMC and pCTL for model checking. By doing so, we aimed to analyze the probability of events in the development process and their temporal dynamics by modeling the flow of activity data rather than predicting the future. In particular, the explicit modeling of state transitions and probabilities with DTMC enabled a transparent understanding of sequential features while overcoming the limitations of previous approaches. pCTL also allows us to design different queries for the aspects we want to know about, so we can obtain quantitative numbers by generating different queries and performing model checking beyond what we presented in this study.
We aimed to demonstrate the feasibility and scalability of the proposed method through a case study on five repositories. Analysis of the model checking results shed light on several key factors affecting the overall project dynamics. We were able to explore the long-term probability of various activities occurring over time and make observations about the participation and behavioral patterns of contributors. These findings can potentially help project managers optimize team dynamics and resource allocation. For example, analyzing the level of project activity can help gauge the speed of a team, and individual analysis can provide useful insights for managing team members based on their characteristics.
In conclusion, our analysis provides valuable insights into the characteristics of GitHub repositories, branch management, and contributor behavior. We expect that our findings can provide useful perspectives for project managers and contributors to understand and improve the collaborative software development process. In the future, we plan to apply this approach to larger open-source projects to identify trends among contributors on the unique characteristics of repositories.

Author Contributions

Conceptualization, S.J., R.K. and G.K.; methodology, S.J.; software, S.J. and R.K.; validation, R.K. and G.K.; formal analysis, S.J. and G.K.; writing—original draft preparation, S.J. and R.K.; writing—review and editing, R.K. and G.K.; visualization, S.J.; supervision, G.K. All authors have read and agreed to the published version of the manuscript.

Funding

This work was supported by the Institute of Information & Communications Technology Planning & Evaluation (IITP) grant funded by the Korean government (MSIT) (No. 2021-0-00122, Safety Analysis and Verification Tool Technology Development for High Safety Software Development).

Institutional Review Board Statement

Not applicable.

Informed Consent Statement

Not applicable.

Data Availability Statement

The raw data supporting the conclusions of this article will be made available by the authors on request.

Conflicts of Interest

The funders had no role in the design of the study; in the collection, analyses, or interpretation of data; in the writing of the manuscript; or in the decision to publish the results.

References

  1. Jones, C. Software Project Management Practices: Failure versus Success. CrossTalk J. Def. Softw. Eng. 2004, 17, 5–9. [Google Scholar]
  2. Mandal, A.; Pal, S. Identifying the Reasons for Software Project Failure and Some of Their Proposed Remedial through BRIDGE Process Models. Int. J. Comput. Sci. Eng. 2015, 3, 118–126. [Google Scholar]
  3. Defranco, J.F.; Laplante, P.A. Review and Analysis of Software Development Team Communication Research. IEEE Trans. Prof. Commun. 2017, 60, 165–182. [Google Scholar] [CrossRef]
  4. Whitehead, J. Collaboration in Software Engineering: A Roadmap. In Future of Software Engineering (FOSE’07); IEEE: Piscataway, NJ, USA, 2007; pp. 214–225. [Google Scholar]
  5. Hahn, J.; Moon, J.Y.; Zhang, C. Emergence of New Project Teams from Open Source Software Developer Networks: Impact of Prior Collaboration Ties. Inf. Syst. Res. 2008, 19, 369–391. [Google Scholar] [CrossRef]
  6. Guveyi, E.; Aktas, M.S.; Kalipsiz, O. Human Factor on Software Quality: A Systematic Literature Review. In Proceedings of the Computational Science and Its Applications—ICCSA 2020: 20th International Conference, Cagliari, Italy, 1–4 July 2020; Proceedings, Part IV 20. Springer: Berlin/Heidelberg, Germany, 2020; pp. 918–930. [Google Scholar]
  7. Blischak, J.D.; Davenport, E.R.; Wilson, G. A Quick Introduction to Version Control with Git and GitHub. PLoS Comput. Biol. 2016, 12, e1004668. [Google Scholar] [CrossRef] [PubMed]
  8. Dabbish, L.; Stuart, C.; Tsay, J.; Herbsleb, J. Social Coding in GitHub: Transparency and Collaboration in an Open Software Repository. In Proceedings of the ACM 2012 Conference on Computer Supported Cooperative Work, Seattle, WA, USA, 11–15 February 2012; pp. 1277–1286. [Google Scholar]
  9. Zhang, X.; Yu, Y.; Gousios, G.; Rastogi, A. Pull Request Decisions Explained: An Empirical Overview. IEEE Trans. Softw. Eng. 2022, 49, 849–871. [Google Scholar] [CrossRef]
  10. Anderson, D.K.; Merna, T. Project Management Strategy—Project Management Represented as a Process Based Set of Management Domains and the Consequences for Project Management Strategy. Int. J. Proj. Manag. 2003, 21, 387–393. [Google Scholar] [CrossRef]
  11. Lévárdy, V.; Browning, T.R. An Adaptive Process Model to Support Product Development Project Management. IEEE Trans. Eng. Manag. 2009, 56, 600–620. [Google Scholar] [CrossRef]
  12. Loeliger, J.; McCullough, M. Version Control with Git: Powerful Tools and Techniques for Collaborative Software Development; O’Reilly Media, Inc.: Sebastopol, CA, USA, 2012. [Google Scholar]
  13. Privault, N. Discrete-Time Markov Chains. Understanding Markov Chains: Examples and Applications; Springer: Berlin/Heidelberg, Germany, 2018; pp. 89–113. [Google Scholar]
  14. Ching, W.-K.; Ng, M.K.; Fung, E.S. Higher-Order Multivariate Markov Chains and Their Applications. Linear Algebra Its Appl. 2008, 428, 492–507. [Google Scholar] [CrossRef]
  15. Liu, T. Application of Markov Chains to Analyze and Predict the Time Series. Mod. Appl. Sci. 2010, 4, 162. [Google Scholar] [CrossRef]
  16. Ching, W.-K.; Ng, M.K. Markov Chains. Models, Algorithms and Applications; Springer: Berlin/Heidelberg, Germany, 2006. [Google Scholar]
  17. Murray, G. Modelling Participation in Small Group Social Sequences with Markov Rewards Analysis. In Proceedings of the Second Workshop on NLP and Computational Social Science, Vancouver, BC, Canada, 3 August 2017; pp. 68–72. [Google Scholar]
  18. Andrei, O.; Murray, G. Interpreting Models of Social Group Interactions in Meetings with Probabilistic Model Checking. In Proceedings of the Group Interaction Frontiers in Technology; 2018; pp. 1–7. [Google Scholar]
  19. Gleirscher, M.; Calinescu, R.; Douthwaite, J.; Lesage, B.; Paterson, C.; Aitken, J.; Alexander, R.; Law, J. Verified Synthesis of Optimal Safety Controllers for human–robot Collaboration. Sci. Comput. Program. 2022, 218, 102809. [Google Scholar] [CrossRef]
  20. Zhao, Y.; Rozier, K.Y. Probabilistic Model Checking for Comparative Analysis of Automated Air Traffic Control Systems. In Proceedings of the 2014 IEEE/ACM International Conference on Computer-Aided Design (ICCAD), San Jose, CA, USA, 3–6 November 2014; pp. 690–695. [Google Scholar]
  21. Konur, S. Real-Time and Probabilistic Temporal Logics: An Overview. arXiv 2010, arXiv:1005.3200. [Google Scholar]
  22. Ciesinski, F.; Größer, M. On Probabilistic Computation Tree Logic. In Validation of Stochastic Systems: A Guide to Current Research; Springer: Berlin/Heidelberg, Germany, 2004; pp. 147–188. [Google Scholar]
  23. Kwiatkowska, M.; Norman, G.; Parker, D. PRISM 4.0: Verification of Probabilistic Real-Time Systems. In Proceedings of the Computer Aided Verification: 23rd International Conference, CAV 2011, Snowbird, UT, USA, 14–20 July 2011; Proceedings 23. Springer: Berlin/Heidelberg, Germany, 2011; pp. 585–591. [Google Scholar]
  24. Haverkort, B.R.; Trivedi, K.S. Specification Techniques for Markov Reward Models. Discret. Event Dyn. Syst. 1993, 3, 219–247. [Google Scholar] [CrossRef]
  25. Kwiatkowska, M.; Norman, G.; Parker, D. Stochastic Model Checking. In Proceedings of the Formal Methods for Performance Evaluation: 7th International School on Formal Methods for the Design of Computer, Communication, and Software Systems, SFM 2007, Bertinoro, Italy, 28 May–2 June 2007; pp. 220–270. [Google Scholar]
  26. Kwiatkowska, M.; Norman, G.; Parker, D. Probabilistic Model Checking: Advances and Applications. In Formal System Verification: State-of the-Art and Future Trends; Springer: Berlin/Heidelberg, Germany, 2018; pp. 73–121. [Google Scholar]
  27. OSLabs. Available online: https://www.opensourcelabs.io/ (accessed on 24 November 2023).
  28. GitHub REST API Documentation—GitHub Docs. Available online: https://docs.github.com/en/rest?apiVersion=2022-11-28 (accessed on 24 November 2023).
  29. Zou, W.; Zhang, W.; Xia, X.; Holmes, R.; Chen, Z. Branch Use in Practice: A Large-Scale Empirical Study of 2923 Projects on Github. In Proceedings of the 2019 IEEE 19th International Conference on Software Quality, Reliability and Security (QRS), Sofia, Bulgaria, 22–26 July 2019; pp. 306–317. [Google Scholar]
  30. El Asri, I.; Kerzazi, N.; Benhiba, L.; Janati, M. From Periphery to Core: A Temporal Analysis of GitHub Contributors’ Collaboration Network. In Working Conference on Virtual Enterprises; Springer: Berlin/Heidelberg, Germany, 2017; pp. 217–229. [Google Scholar]
  31. Hu, Y.; Wang, S.; Ren, Y.; Choo, K.-K.R. User Influence Analysis for Github Developer Social Networks. Expert Syst. Appl. 2018, 108, 108–118. [Google Scholar] [CrossRef]
  32. Ait, A.; Izquierdo, J.L.C..; Cabot, J. An Empirical Study on the Survival Rate of GitHub Projects. In Proceedings of the 19th International Conference on Mining Software Repositories, Virtual, 18–20 May 2022; pp. 365–375. [Google Scholar]
  33. Beck, K. Extreme Programming Explained: Embrace Change; Addison-Wesley Professional: Boston, MA, USA, 2000. [Google Scholar]
  34. Albero Pomar, F.; Calvo-Manzano, J.A.; Caballero, E.; Arcilla-Cobián, M. Understanding Sprint Velocity Fluctuations for Improved Project Plans with Scrum: A Case Study. J. Softw. Evol. Process 2014, 26, 776–783. [Google Scholar] [CrossRef]
  35. Vasilescu, B.; Van Schuylenburg, S.; Wulms, J.; Serebrenik, A.; van den Brand, M.G. Continuous Integration in a Social-Coding World: Empirical Evidence from GitHub. In Proceedings of the 2014 IEEE International Conference on Software Maintenance and Evolution, Victoria, BC, Canada, 29 September–3 October 2014; pp. 401–405. [Google Scholar]
  36. Elazhary, O.; Storey, M.-A.; Ernst, N.; Zaidman, A. Do as i Do, Not as i Say: Do Contribution Guidelines Match the Github Contribution Process? In Proceedings of the 2019 IEEE International Conference on Software Maintenance and Evolution (ICSME), Cleveland, OH, USA, 30 September–4 October 2019; pp. 286–290. [Google Scholar]
  37. Zhou, M.; Mockus, A. What Make Long Term Contributors: Willingness and Opportunity in OSS Community. In Proceedings of the 2012 34th International Conference on Software Engineering (ICSE), Zurich, Switzerland, 2–9 June 2012; pp. 518–528. [Google Scholar]
  38. Zhou, M.; Mockus, A. Does the Initial Environment Impact the Future of Developers? In Proceedings of the 33rd International Conference on Software Engineering, Honolulu, HI, USA, 21–28 May 2011; pp. 271–280. [Google Scholar]
  39. Bao, L.; Xia, X.; Lo, D.; Murphy, G.C. A Large Scale Study of Long-Time Contributor Prediction for GitHub Projects. IEEE Trans. Softw. Eng. 2019, 47, 1277–1298. [Google Scholar] [CrossRef]
  40. Eluri, V.K.; Mazzuchi, T.A.; Sarkani, S. Predicting Long-Time Contributors for GitHub Projects Using Machine Learning. Inf. Softw. Technol. 2021, 138, 106616. [Google Scholar] [CrossRef]
  41. Zöller, N.; Morgan, J.H.; Schröder, T. A Topology of Groups: What GitHub Can Tell Us about Online Collaboration. Technol. Forecast. Soc. Chang. 2020, 161, 120291. [Google Scholar] [CrossRef]
  42. Clarke, E.M.; Klieber, W.; Nováček, M.; Zuliani, P. Model Checking and the State Explosion Problem. In LASER Summer School on Software Engineering; Springer: Berlin/Heidelberg, Germany, 2011; pp. 1–30. [Google Scholar]
Figure 1. Example of the branch network.
Applsci 14 01260 g001
Figure 2. DTMC modeling for branch network.
Applsci 14 01260 g002
Figure 3. DTMC model for Redline.
Applsci 14 01260 g003
Figure 4. Results of Query 3 and 4: Average number of cumulative actions and pull requests per week.
Applsci 14 01260 g004
Figure 5. Results of Query 5, 6 and 7: Average cumulative number by branch location.
Applsci 14 01260 g005
Figure 6. Result of Query 9: Probability of processing of pull requests in the next step.
Applsci 14 01260 g006
Figure 7. Result of Query 10: Change in pull request processing probability over time steps.
Applsci 14 01260 g007
Figure 8. Result of Query 11: Average time steps for participant appearance.
Applsci 14 01260 g008
Figure 9. Result of Query 12: Average number of commits on branch before pull request.
Applsci 14 01260 g009
Figure 10. Result of Query 13: Probability of making a commit over time steps.
Applsci 14 01260 g010
Figure 11. Result of Query 14: Average time steps to encounter another participant.
Applsci 14 01260 g011
Table 1. List of query specification.
Repository
Characteristics
(1) S = ? [ a c t i o n L a b e l ]
(2) P = ? [ X ! w e e k ]
(3) R { r _ s t e p s } = ? [ X F w e e k ”]
(4) R { r _ p u l l R e q u e s t } = ? [ X F w e e k ”]
ine (5) R { r _ m a s t e r } = ? [ C < = 100 ]
  Branch
  Management
(6) R { r _ b r a n c h } = ? [ C < = 100 ]
(7) R { r _ w e e k } = ? [ C < = 100 ]
(8) f i l t e r ( a v g , P = ? [ X a c c e p t e d | r e j e c t e d ] , p u l l R e q u e s t ”)
(9) f i l t e r ( s t a t e , P = ? [ X p a r t i c i p a n t & ( a c c e p t e d | r e j e c t e d ) ] ,
p a r t i c i p a n t & p u l l R e q u e s t ”)
(10) f i l t e r ( a v g , P = ? [ F < = K a c c e p t e d | r e j e c t e d ] , p u l l R e q u e s t ”)
ine (11) R { r _ s t e p s } = ? [ F p a r t i c i p a n t ]
  Participant
  Analysis
(12) f i l t e r ( a v g , R { r _ p a r t i c i p a n t _ b r a n c h _ c o m m i t ”}
= ? [ F ( p a r t i c i p a n t ) & ( p u l l r e q u e s t ) ] , ( p a r t i c i p a n t ) & ( c r e a t e ) )
(13) P = ? [ F < = K ( p a r t i c i p a n t ) & c o m m i t ”]
(14) f i l t e r ( a v g , R { r _ s t e p s } = ? [ F ! p a r t i c i p a n t ] , p a r t i c i p a n t )
(15) f i l t e r ( a v g , P = ? [ X p 1 & m e r g e ] , p a r t i c i p a n t & a c c e p t e d ”)
Table 2. Modeling for GitHub repository.
RepositoryStatesTransitions
DeSolver26120
kafkaVision30126
Redline3190
Sherlogs2599
Hearth2975
Table 3. Result of Query 1: Action rate in the long run.
CreateCommitPull RequestAcceptedMergeRejected
DeSolver0.09620.52240.11220.09940.09940.0128
kafkaVision0.12660.41200.15240.13950.13950.0107
Redline0.09620.34710.18560.16840.16840.0172
Sherlogs0.09090.55840.11360.08770.08770.0227
Hearth0.11060.32300.18140.18140.18140.0000
Table 4. Result of Query 2: Activity sustainability in repository.
RepositoryProbability
DeSolver83.33%
kafkaVision66.67%
Redline100.00%
Sherlogs91.67%
Hearth100.00%
Table 5. Result of Query 8: Immediate processing rate of pull requests.
RepositoryProbability
DeSolver64.05%
kafkaVision78.34%
Redline93.30%
Sherlogs30.80%
Hearth68.20%
Table 6. Result of Query 15: Merge probability of p1 for participants’ pull requests.
p1p2p3p4
DeSolver12.50%30.00%50.00%42.86%
kafkaVision-58.33%8.33%26.67%
Redline-6.82%-50.00%
Sherlogs100%100%83.33%100%
Hearth50.00%5.26%3.12%0.00%
Disclaimer/Publisher’s Note: The statements, opinions and data contained in all publications are solely those of the individual author(s) and contributor(s) and not of MDPI and/or the editor(s). MDPI and/or the editor(s) disclaim responsibility for any injury to people or property resulting from any ideas, methods, instructions or products referred to in the content.

