Abstract
During the construction of deep foundation pits in subways, it is crucial to closely monitor the horizontal displacement of the pit enclosure to ensure stability and safety, and to reduce the risk of structural damage caused by pit deformations. With advancements in machine-learning (ML) techniques and correlation analysis in engineering, data-driven methods that combine ML with engineering monitoring data have become increasingly popular. These methods offer benefits such as high prediction accuracy, efficiency, and cost effectiveness. The main goal of this study was to develop a machine-learning method for predicting the enclosure deformation of deep foundation pits. This was achieved by analyzing the factors influencing deep foundation-pit enclosure deformation and incorporating historical cases and monitoring reports. The performance of each machine-learning prediction model was systematically analyzed and evaluated using K-Fold cross validation. The results revealed that the random forest model outperformed the other models. The result of the test data showed that the random forest model achieved an R2 of 0.9905, an MAE of 0.8572 mm, and an RMSE of 1.9119 mm. Feature importance analysis identified the depth of enclosure structure, water level, surface settlement, axial force, and exposure time as the most critical factors for accurate prediction. The depth of the enclosure structure had an especially significant impact on the prediction of enclosure deformation.
1. Introduction
For decades, as China’s urbanization rate continued to rise, the proportion of the country’s urban population reached 64.72% as of 2021. According to a report released by the United Nations Department of Economic and Social Affairs, it is projected that China’s urban population will increase by another 255 million in 2050 [1]. One of the most popular ideas in urban congestion research is the development of subway transportation. It seems to be a common problem that, during the construction of metro pits, surface settlement caused by the destruction of existing geological structures during construction may cause significant damage to existing buildings and infrastructure [2]. Surface settlement is often recognized as a critical factor in assessing the risk of failure and providing early warning. Construction-monitoring management needs to be strengthened during the construction of subway foundation pits to minimize safety accidents caused by excessive deformation of the enclosure structure during pit construction. Without proper monitoring and prediction, there is an increased risk of accidents and safety hazards for workers and anyone in the vicinity of the construction site. This can result in injuries or even fatalities, as well as damage to equipment and property. Moreover, it may lead to the destabilization of the surrounding soil and structures, causing damage to nearby buildings, roads, and utilities [3]. Therefore, it is necessary to predict the estimation of deformation caused by pit excavation with an in-depth understanding of the relevant enclosure deformation-generating mechanisms to minimize the problems caused by the relevant events [4].
Deformation due to earth excavation and engineering vibration caused by subway construction is unavoidable because the soil and rock around the pit are disturbed during construction. Various studies in the past have tried many methods to predict surface settlement, which are usually categorized into three types: empirical formulae [5], numerical simulation [6], and artificial intelligence prediction [7].
The traditional method of surface-settlement prediction, the empirical formula method, is based on observational data of surface settlement at existing deep foundation-pit sites. The method is based on the observation data of the existing tunnel-pit site. With the continuous updating of technical methods of pit construction, such as the application of shield machines, full-section boring machines, etc., and the complex underground infrastructure, the traditional method only applies to modern tunnel-pit projects.
In recent years, numerical analysis models have been used to simulate ground motions using data obtained from the construction site for surface-settlement prediction in the deep foundation-pit construction site [8]. The numerical analysis model is used to predict the ground settlement. However, in actual engineering projects, numerical analysis models are affected by complex factors such as the complexity of geological conditions and changes in actual construction. It is necessary to select appropriate prediction methods according to specific engineering conditions and correct and optimize them with the measured data to solve the many problems that may arise in practical applications. Plett [9] used numerical simulation software, and nonlinear adaptive filtering reduces external environmental interference. Sharghi, to study the effect of grouting performance on surface settlement, completed the numerical simulation of Tabriz Metro Line 2 by the FLAC3D finite difference numerical simulation method [10]. In the process of modeling, improperly selected parameters or poorly processed data may lead to increased errors; meanwhile, the numerical model needs to input a variety of parameters, such as soil mechanics parameters, geotechnical parameters, etc., which are determined with a significant error from the measured values, which also affects the accuracy of the model.
Generally speaking, the monitoring data can supervise the safe construction of the deep foundation pit to some extent, but they cannot effectively predict the deformation pattern of the deep foundation-pit enclosure structure and the surrounding environment. Therefore, a reasonable monitoring data-analysis method can effectively reveal the development law of deformation. Artificial intelligence predictive monitoring deformation data technology is a research field of great interest, and the method uses existing monitoring data as learning objects to predict the development trend of deformation to effectively control the safety risk and guide the engineering practice in the actual project.
Currently, the main machine-learning methods commonly used are random forests, decision trees, gradient growth, multilayer perceptual machines, etc. Dongku Kim [11] classified surface-settlement levels in urban areas using a random forest with data-driven feature selection, and Libin Tang [12] investigated different machine-learning methods with 5-fold cross validation (CV) to estimate the maximum surface settlement of the ground caused by the deep foundation-pit excavation, Yang Cao [13] predicts deep foundation-pit surface settlement from sensor data via an LSTM model with a fully integrated empirical pattern decomposition method with adaptive noise. Mamat [14] uses an SVM algorithm based on four kernel functions, linear, polynomial, sigmoid, and radial basis function (RBF), to predict the significance of maximum ground surface settlement (MGS) for safe operations. In addition, some studies demonstrate the growing interest in applying machine-learning techniques to geotechnical engineering, with a focus on prediction, classification, optimization, and risk assessment in various geotechnical applications [15]. Mitelman [16,17] uses transfer learning to overcome dataset size limitations in geotechnical analysis and combines data-value analysis with machine learning to enhance the decision-making process in observational method projects. Syed [16] used the open-source AutoML framework to construct different ML models for predicting the maximum ground settlement during the construction of soil pressure balance shield tunnels.
Most of the mainstream research directions of artificial intelligence for predicting the deformation of deep foundation-pit enclosure structures directly study the surface settlement generated during the construction [18,19,20,21]. However, many other factors, such as geological environment, stress, and settlement of structures, were not too much involved in the previous deformation prediction study. Incompleteness of the impact factors may lead to poor model accuracy. Therefore, to solve this problem, this paper intends to analyze and summarize the data that was monitored during the construction of the deep-foundation pit to obtain the significant characteristic factors that cause the deformation of the enclosure structure and, based on this, to establish a method of deformation prediction modeling from the mainstream machine-learning methods.
2. Dataset
2.1. Study Area
The database used in this study is from the deep foundation-pit construction project of the main structure of the Mahu Station of Wuhan Rail Transit No. 8 Phase II, with a total length of 552.3 m. The Mahu Station is located at the intersection of two transportation routes, and the current surrounding situation encompasses commercial buildings, office buildings, residential areas, etc., with flat topography, slight topographic undulation, and a ground level generally between 19.35 and 26.08 m. The geomorphological unit of the site belongs to the plain area of the Yangtze River III terrace (the third terrace lakes accumulation area). The stratigraphy of the site can be divided into fill and general clayey soil of the Holocene System of the Quaternary, the Upper Pleistocene System of the Quaternary, the flood sediment, the residual sediment of the Quaternary, the sandstone of the Donghu Group, and the sandy mudstone from the top to the bottom.
Mahu station is an underground two-story island station with a station center mileage at the rail surface elevation of 5.40 m and a station roof cover of 3.77 m. The station’s main structure has a total length of 554.6 m, a total width of 21.3 m (standard section), an adequate length of the platform of 186 m, a platform width of 12 m, and a single-column double-span structure. The center mileage of the station’s effective platform is the right CK33 + 037.611, the main building area is 23,803.22 square meters, and the total construction area is 27,345.14 square meters.
During the excavation and construction of the foundation pit, kinds of monitoring points, including surface monitoring points, building monitoring points, stress monitoring points, etc., were deployed along the route and were monitored with a frequency of 1 day one time.
2.2. Samples Collection
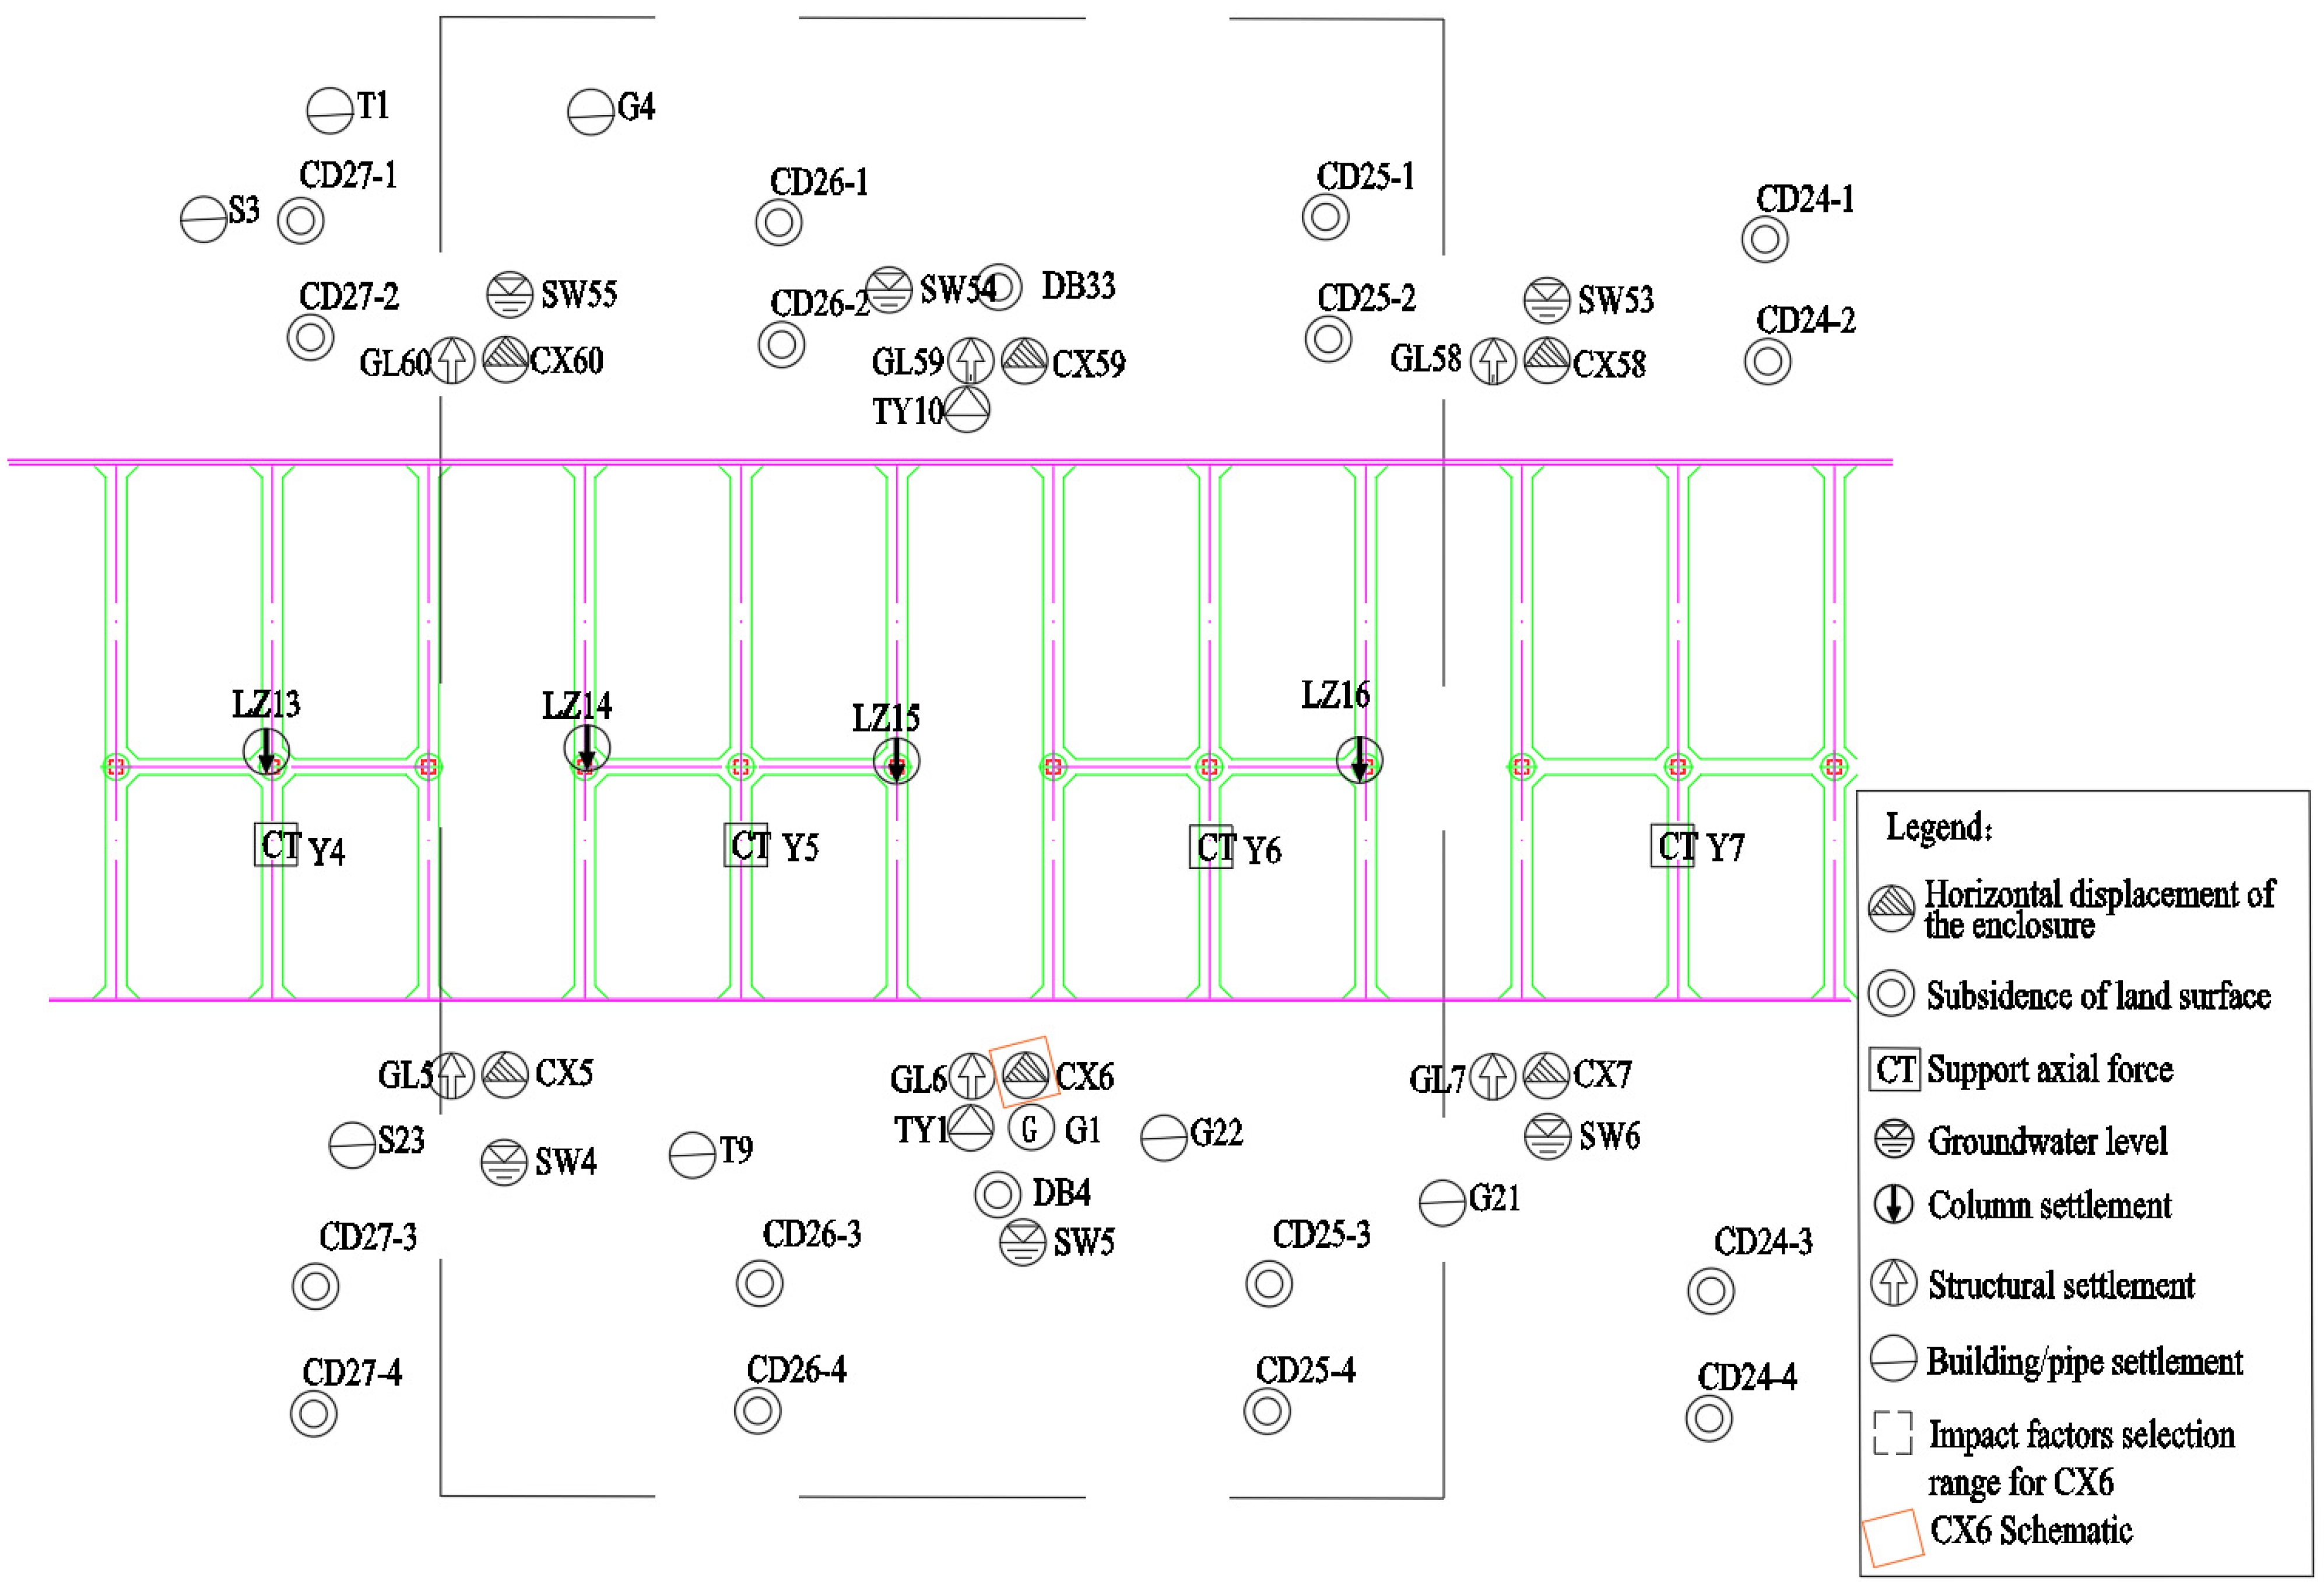
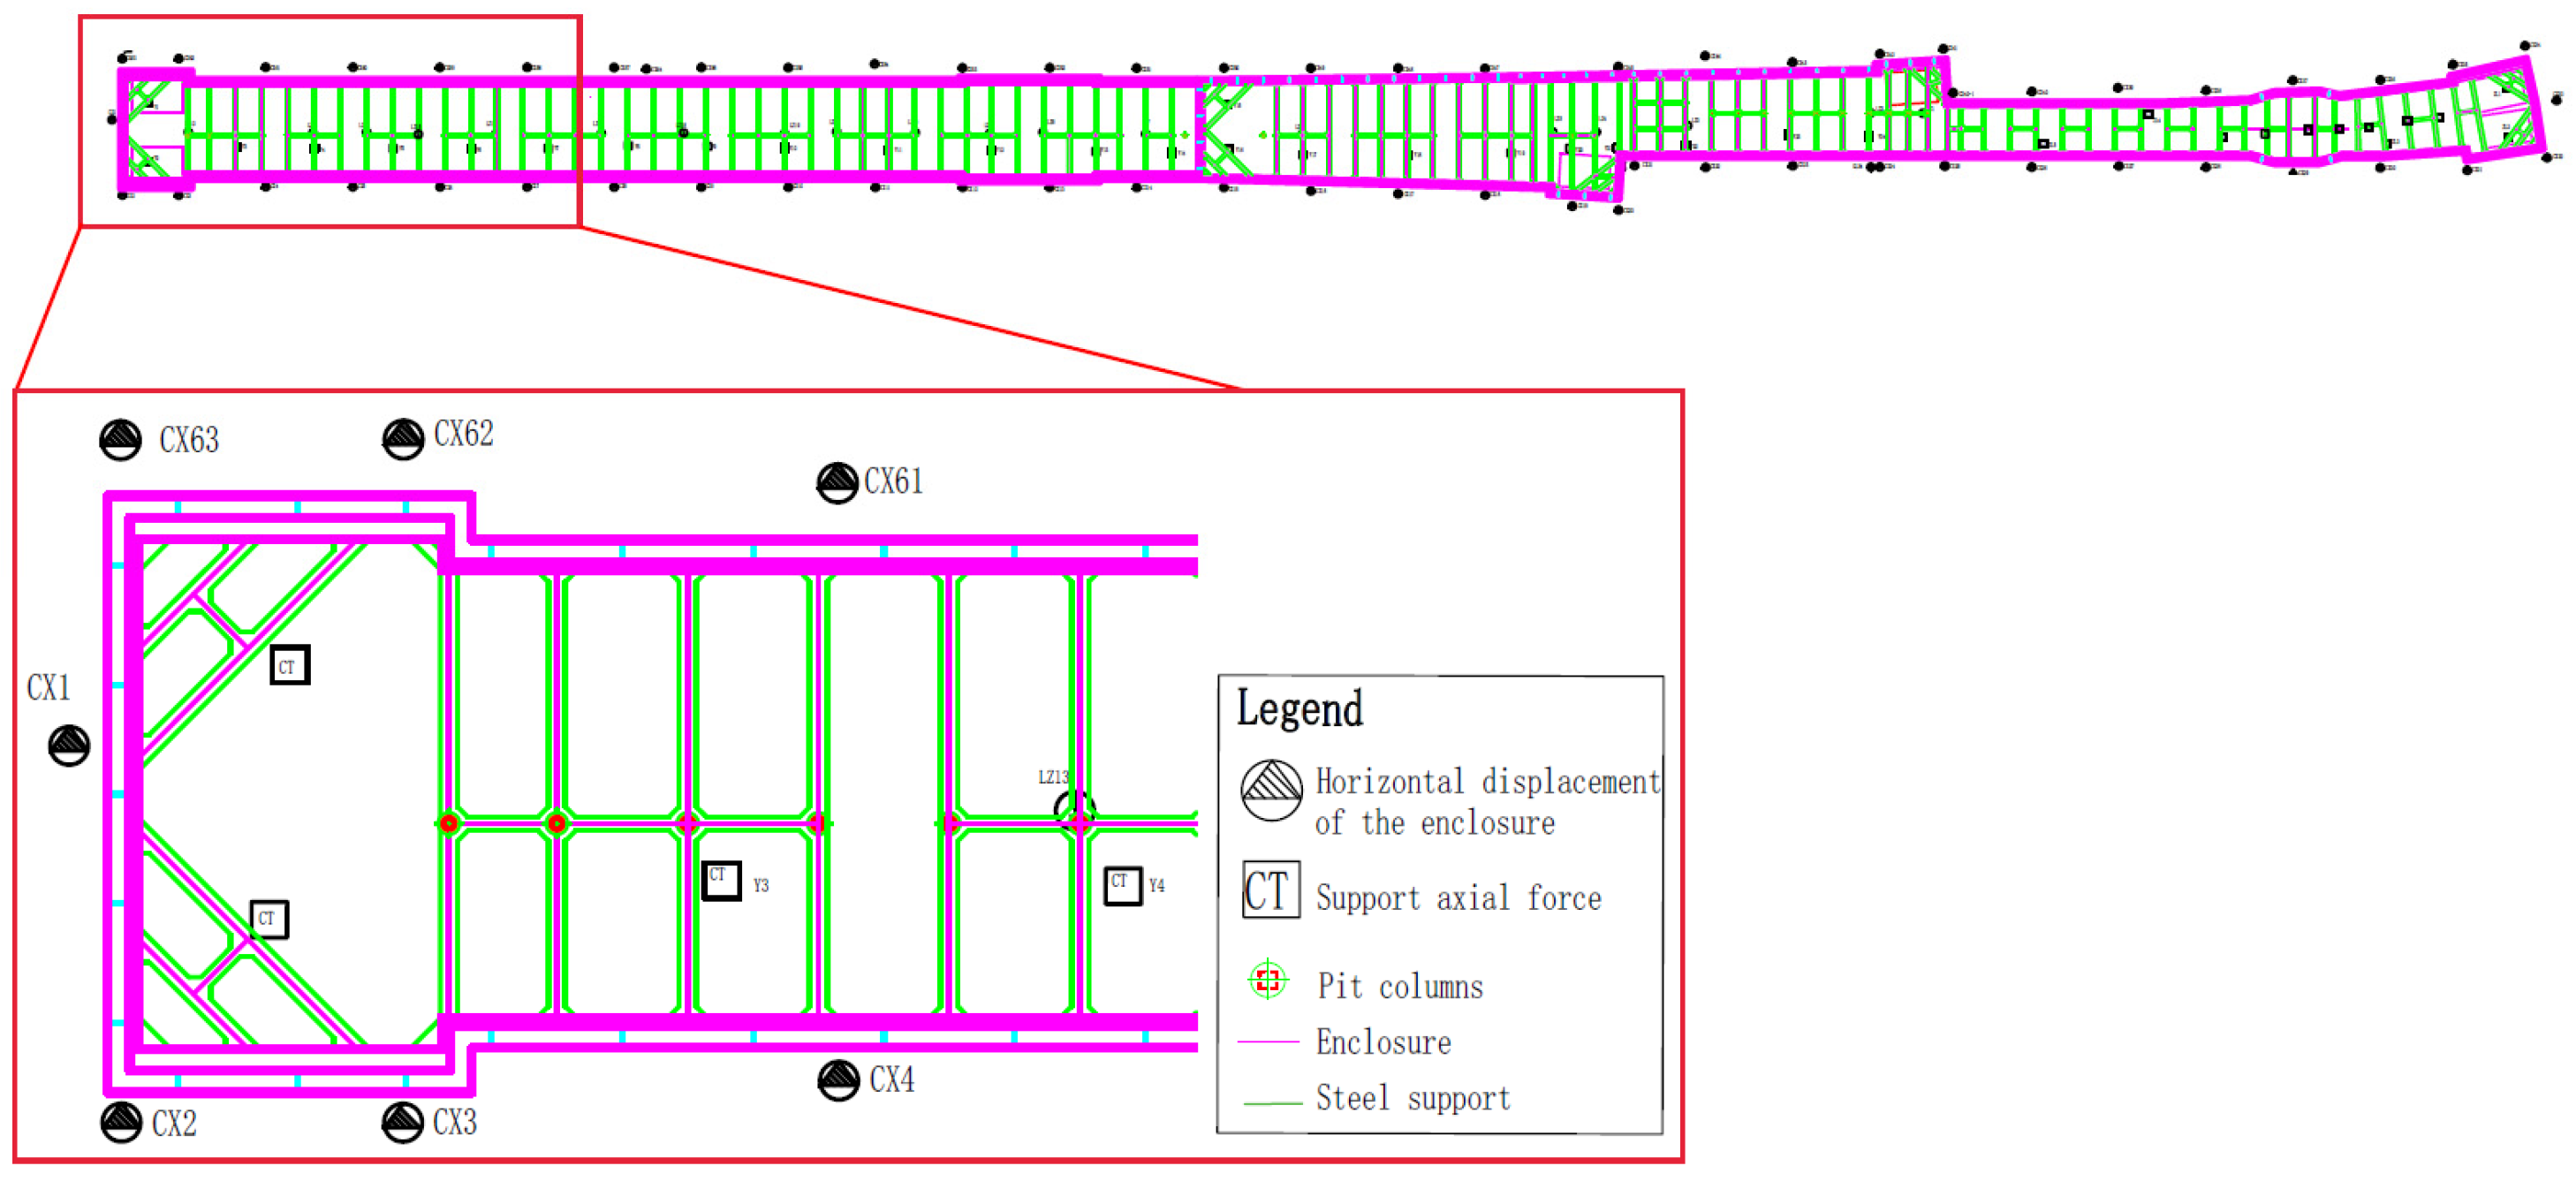
The data used in the study include the hydrogeological parameters of the construction area, settlement of structures, internal stress, etc. These data are summarized based on weekly construction-monitoring reports. The prediction of the enclosure structure’s horizontal displacement is based on the impact factors obtained from regional and global monitoring data. The regional monitoring data consist of regional settlement, stress and water level, etc, while the global monitoring data always reflect the project environment and progress. As shown in Figure 1, CX-6 is an enclosure structure-monitoring point; the regional monitoring data for CX-6 deformation prediction are distributed in a range centered on the point and expanded to both sides by a certain number of bins. In addition, the horizontal displacement of the enclosure structure is always measured at a vertical distance (1 m) interval, so the depth of the regional monitoring data should be consistent with the target point. In this way, at a certain time node, each monitoring-point data in the regional monitoring area, the global feature, and the horizontal displacement of the enclosure structure make up the sample data. Figure 2 shows the distribution of some of the enclosure’s horizontal displacement-monitoring points in the area of the enclosure section.
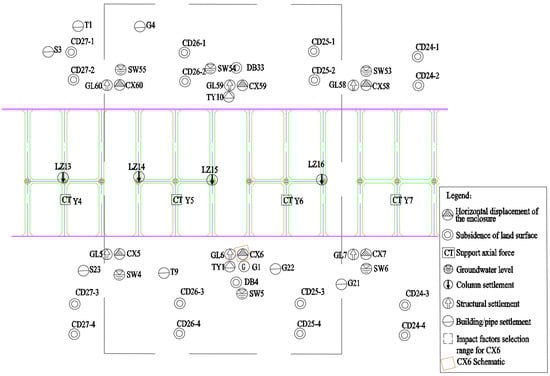
Figure 1.
Plane distribution of monitoring points around the enclosure monitoring points.
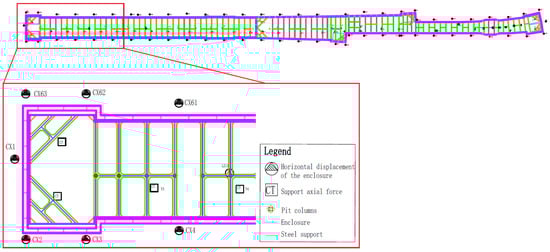
Figure 2.
Distribution of horizontal displacement-monitoring points of the enclosure structure in the area of the enclosure structure section.
2.3. Description of Deformation Characteristic Factors of the Foundation Pit
The factors that characterize the deformation of the pit enclosure are complex; it is necessary to analyze the influencing factors before constructing the dataset [22]. In this paper, the horizontal displacement of the enclosure structure is obtained by inclination measurement of the inclined pipe, which is an important parameter used to assess the stability of the pit slopes and the enclosure structure, as well as the potential impact on the surrounding environment. When the horizontal displacement of the enclosure structure changes and exceeds the warning value, this may cause tilting, deformation, cracking, or even partial or complete collapse of the structure, thus jeopardizing the safety of the metro stations, tunnels, surrounding buildings, and personnel. Therefore, the settlement of the soil and structure around the pit is a direct consequence that can deduce the trend and range of horizontal displacement of the pit enclosure. At the same time, other characteristics of the enclosure structure, namely the scientific nature of the material, the overall strength, the state of instability, the soil, the underground water level, and the environment around the building, etc., also should be taken into consideration to comprehensively analyze the risks related to the horizontal displacement of the enclosure structure [23].
2.3.1. Impact of the Geological Environment
The influence of the geological environment on the foundation pit’s retaining structure can be assessed by analyzing the physical–mechanical properties of the rock and soil at the construction site and the water table. The physical–mechanical properties of rock and soil are the most fundamental causes that determine the pressure difference between the two sides of the retaining structure and the change of soil stress state, causes such as the strength index (compressive strength, tensile strength), compression index (compression modulus, and Poisson’s ratio), and mechanical parameters (plasticity index and deformation modulus). In addition, groundwater hazards to foundation pits include the effects of infiltration pressure and pore water pressure on pit stability, soil liquefaction problems, and corrosion under hydrodynamic pressure. Therefore, lowering the groundwater level is often used to reduce the impact of static and dynamic groundwater bodies on the pit enclosure structure, to increase the strength of the soil, and to effectively ensure the stability and safety of the pit enclosure structure. However, lowering the groundwater level of the pit by pumping will significantly reduce the pore water pressure and increase the effective stress of the soil, which in turn will cause the settlement of the soil around the pit and ultimately lead to uneven settlement of the surrounding pipelines, structures, and roads.
2.3.2. Impact of the Construction Progress
The length of the exposure time of the pit floor directly affects the degree and scope of structure deformation; if the exposure time of the pit floor is too long, the destabilized soil layer caused by construction vibration may not be able to withstand the weight of the soil above, increasing the pressure on the pit enclosure structure. During exposure to the pit floor, oxygen and water can penetrate the deep layers of the soil body, further leading to the loosening and flow of the soil body, and increasing the risk of foundation-pit deformation. The influence of the excavated length on the foundation-pit deformation has a cumulative effect. As the soil layer below the surface is subjected to the continuous action of the subway foundation-pit excavation vibration, the soil layer is gradually loosened and settled, which increases the depth and extent of the surface settlement. With the deepening of the pit excavation, the constraints on the soil body are reduced, which leads to an increase in the settlement and deformation of the soil body. The increase in the excavated length will cause the collapse of the slopes and settlement of the base of the pit, which may lead to the uneven settlement of buildings, pipelines, and roads around the pit. The vibration of the foundation-pit construction works on the surrounding soil in case of imperfect bottom-slab casting will affect the stability of the bottom soil, which will further aggravate the deformation. In addition, different pit support methods and construction methods adopted at different stages of the construction process will impact the deformation of the enclosing structure.
2.3.3. Impact of the Stress Monitoring Programs
The support axial force is generated by the support and restraint of the soil body by the support structure during the foundation pit’s construction, reflecting the mechanical characteristics and stability of the soil body around the pit. Earth pressure is one of the essential causes of the deformation of the enclosure structure. When the excavation depth of the pit increases, the constraint of the soil body decreases, and the effect of earth pressure on the pit enclosure structure increases. The size and distribution of earth pressure will directly affect the soil body’s stress state and deformation characteristics around the pit, affecting the stability of nearby buildings, pipelines, and roads. Based on the distribution and size of earth pressure, the impact of deformation of the enclosure structure can be effectively reduced by adopting corresponding earth-pressure control measures, such as setting up reasonable support structures, adopting methods of reinforcing the soil body and reducing the groundwater level to ensure the safety of the foundation-pit construction and the stability of the surrounding environment.
2.3.4. Impact of the Displacement-Monitoring Results
Structural settlement during subway construction is the vertical downward displacement of a structure’s foundation caused by soil excavation, consolidation, and changes in the water table. This settlement affects the surrounding environment, causing problems such as building damage, pipeline rupture and deformation, ground subsidence, and vibration of neighboring buildings [24,25]. The data can be observed and analyzed promptly. Certain connections or associations between pipelines and the ground will also affect the surface somewhat [26]. Column settlement is the phenomenon of sinking of columns or other building foundations. When the soil beneath the ground deforms or settles, the soil on which the columns are located is also affected, causing the columns to sink [26,27]. Column settlement is one of the manifestations of envelope deformation.
In summary, during the construction of foundation pits, land is excavated and moved, resulting in structure deformation. Some deformation can be obtained directly from the main structure of the foundation pit, such as the crown beam and the column, while others can be indirectly obtained from the surface around the foundation pit, structures, and underground pipelines. There is a link between the deformation phenomena and the enclosure deformation of the foundation pit.
2.4. Analysis of Dataset
After analyzing the hydrogeological conditions, weekly construction reports, on-site monitoring data, and the surrounding environment, the target value (horizontal displacement of the enclosure) and the critical characteristic factors are described in Table 1. They were derived to assess the stability and deformation of the pit enclosure. The characteristic factors were generally divided into two categories: dynamic and static factors.

Table 1.
Summary table of characterization factor.
Table 2 shows the following statistical metrics for the dataset: mean, standard deviation (Std.), minimum value (Min.), maximum value (Max.), and three percentiles associated with the data samples in the training set (25%, 50%, and 75%).
Table 2.
Statistical description of the dataset.
For HD, the mean is small, the standard deviation is large, and the range between the minimum and maximum values is large, meaning that the distribution of the data may be relatively spread out and there may be outliers or anomalies. The 25th percentile is 0.21, the 50th percentile is 6.37, and the 75th percentile is 26.99. Most of the data is concentrated between 0.21 and 26.99, but some relatively large values make the mean deviate, and the overall statistical results are consistent with the HD data obtained from multiple enclosure horizontal displacement-monitoring sites. The mean values deviate, and the overall statistics are consistent with the HD data. The ACT has a low mean but a large standard deviation, which could mean that there are some data points with relatively high values. The ST is relatively stable, with the mean close to the median and a small standard deviation. The data is relatively stable with most of the values around two indicating that the geotechnical classification of the area where the pit was constructed is mostly clay. There is a large variation between the mean and standard deviation of the AF, which may have extreme values or be unevenly distributed. The statistics of the support axial forces were collected continuously from the construction process, and the gradual increase of the support axial forces at each monitoring point is consistent with the results of the analysis based on the statistical data. For SS2 (mm), BS (mm), SS1 (mm), and PS (mm), the mean and median of these indicators are relatively close to each other. But, the standard deviation is large, and there may be unevenness in the distribution of the data. The quartiles of these indicators show that the data are relatively dispersed, with no clear tendency to concentrate, but no extreme differences either.
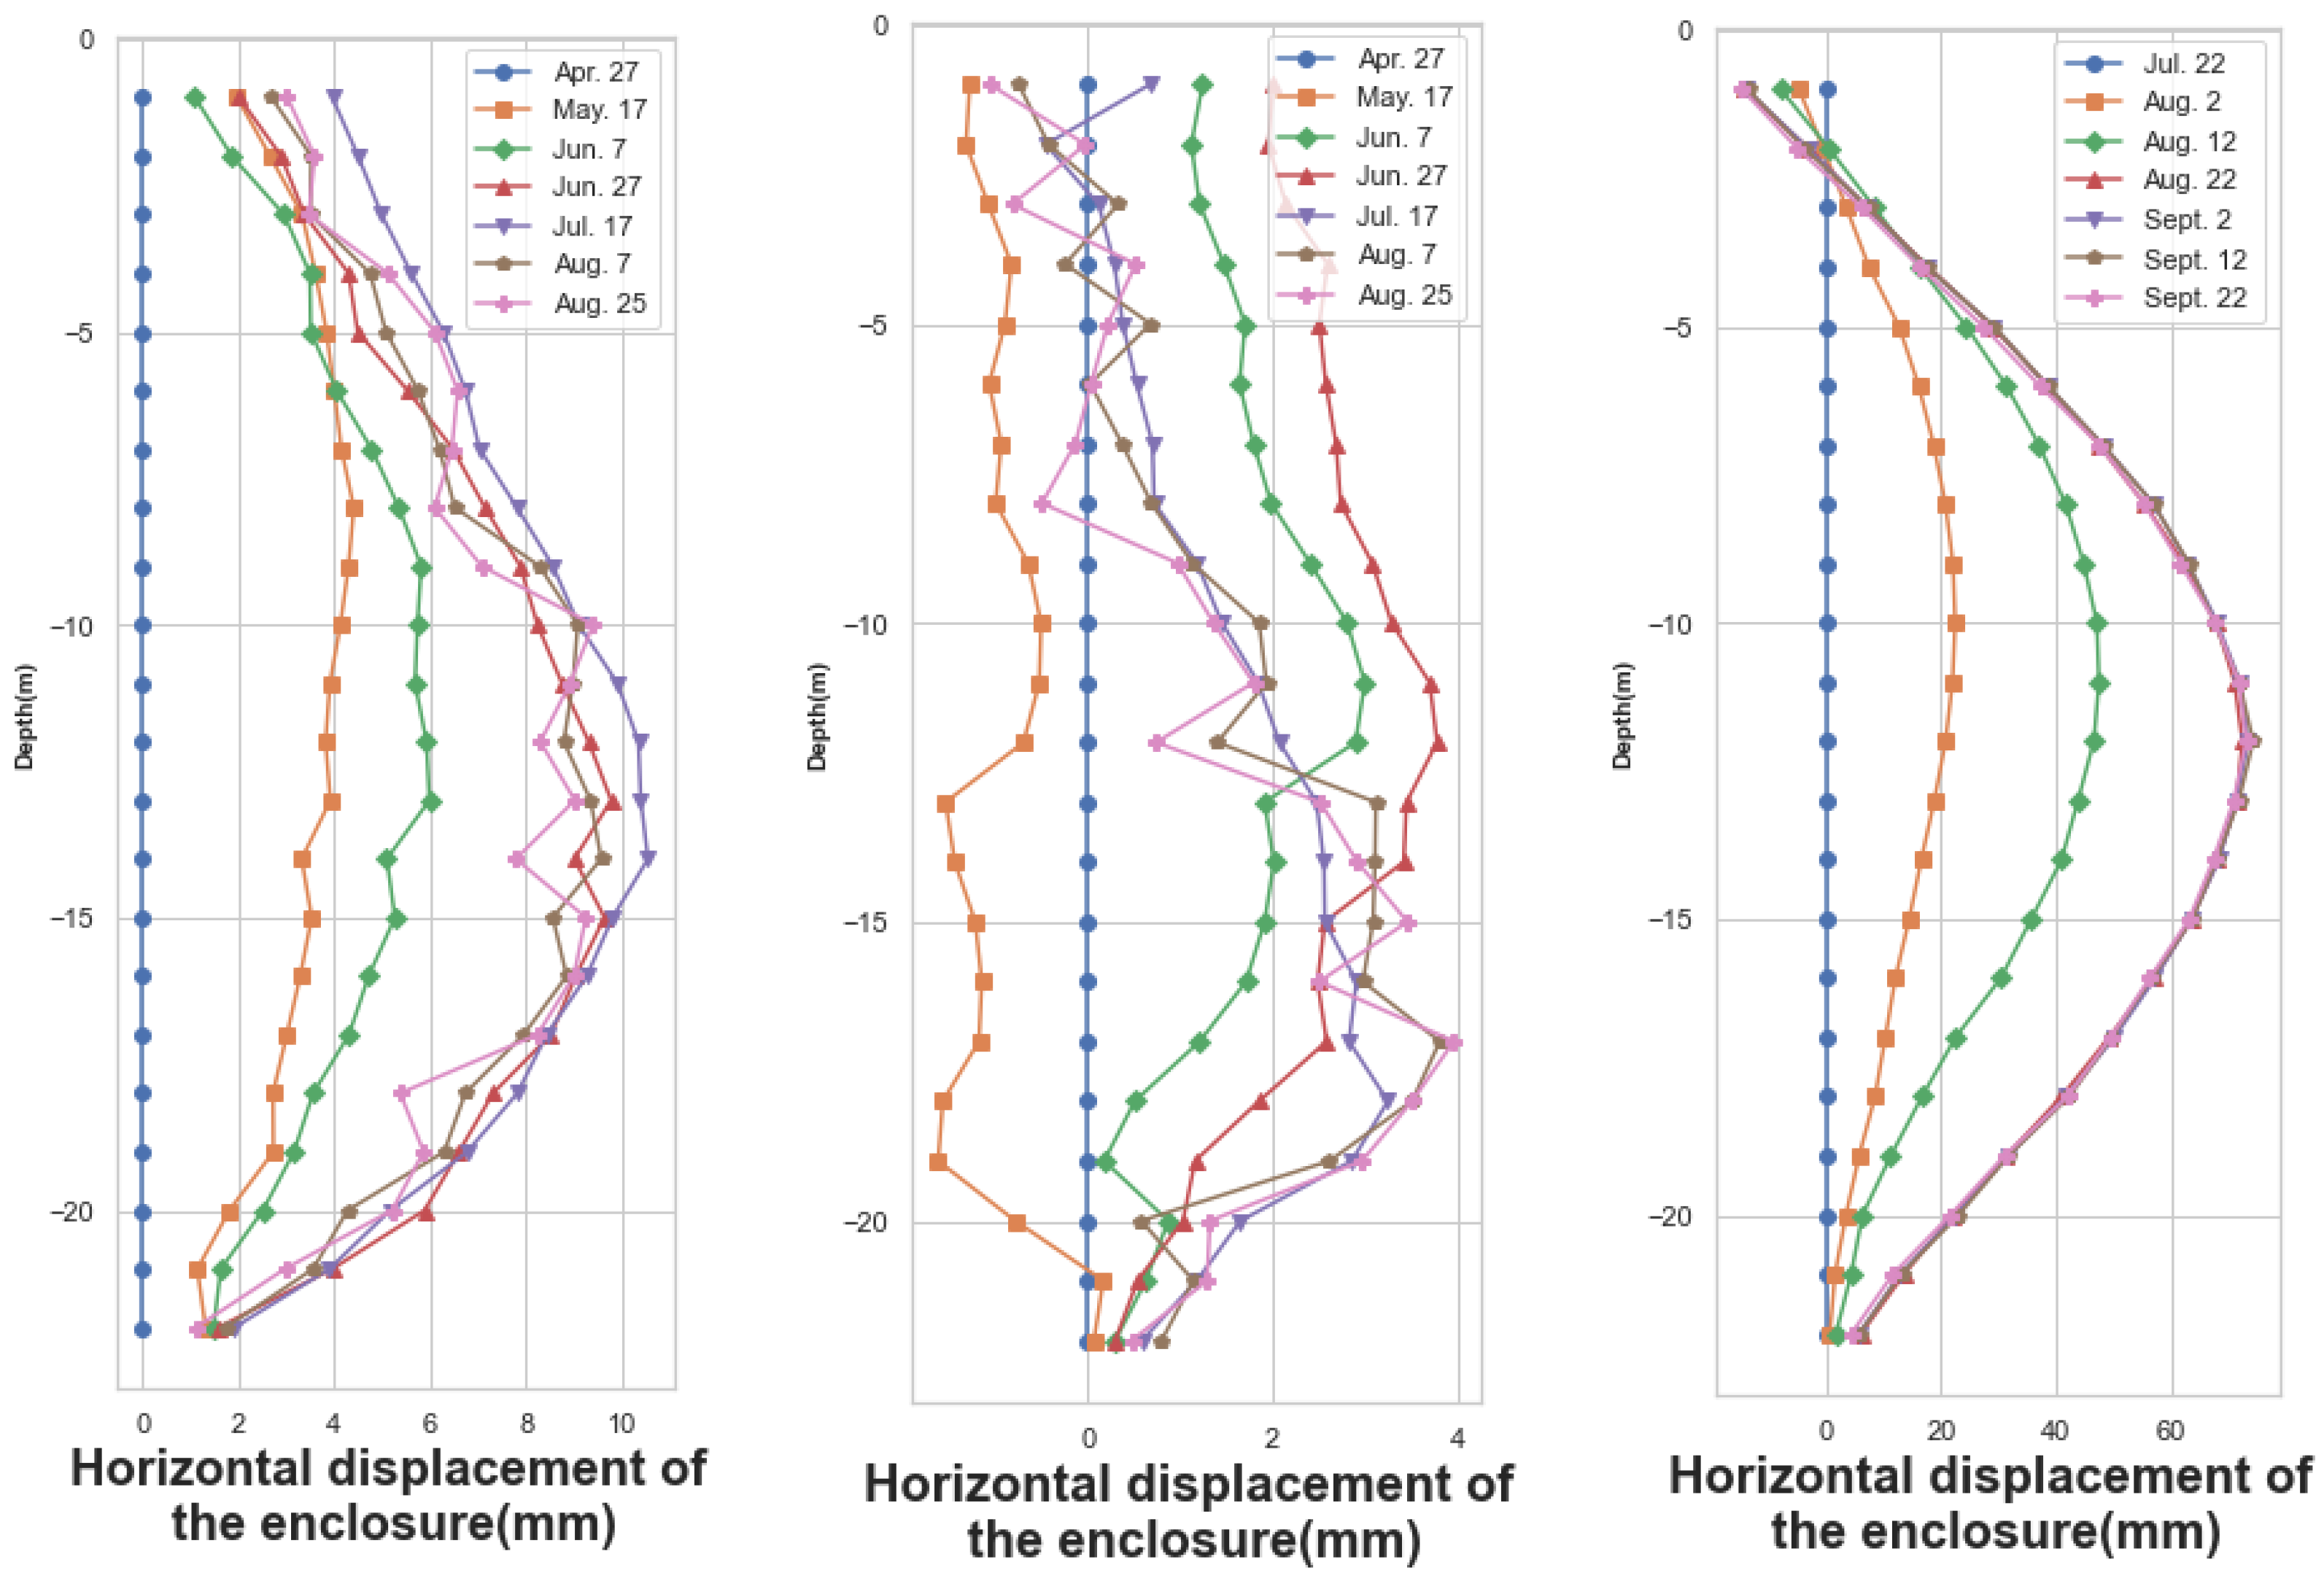
The deep foundation-pit enclosure structure was an essential component of subway construction. The horizontal displacement of the enclosure structure was monitored to track the relative movement or offset of the enclosure structure elements, such as supporting walls and supporting frames, in the horizontal direction. This monitoring held great significance in ensuring the safety and stability of the foundation-pit construction. Any changes in the horizontal displacement of the enclosure structure indicated that the surrounding soil might have undergone displacement or deformation. The monitoring points for measuring the enclosure structure’s horizontal displacement were mainly situated on the ground-connected wall. Monitoring data from specific dates for three monitoring points, namely CX-1, CX-2, and CX-58, were selected, and the line graphs were plotted, as shown in Figure 3. The enclosures show a consistent deformation pattern over time.
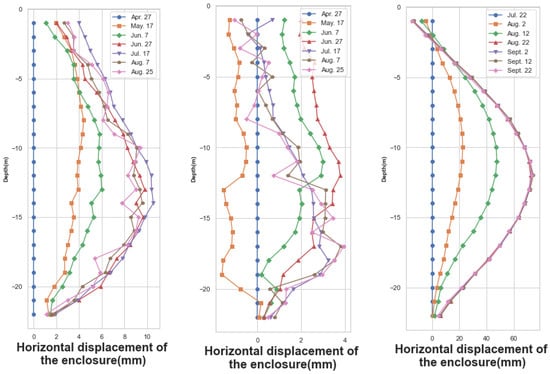
Figure 3.
Horizontal displacements of the envelope on selected dates at monitoring points CX-1, CX-2, and CX-58.
3. Methodology
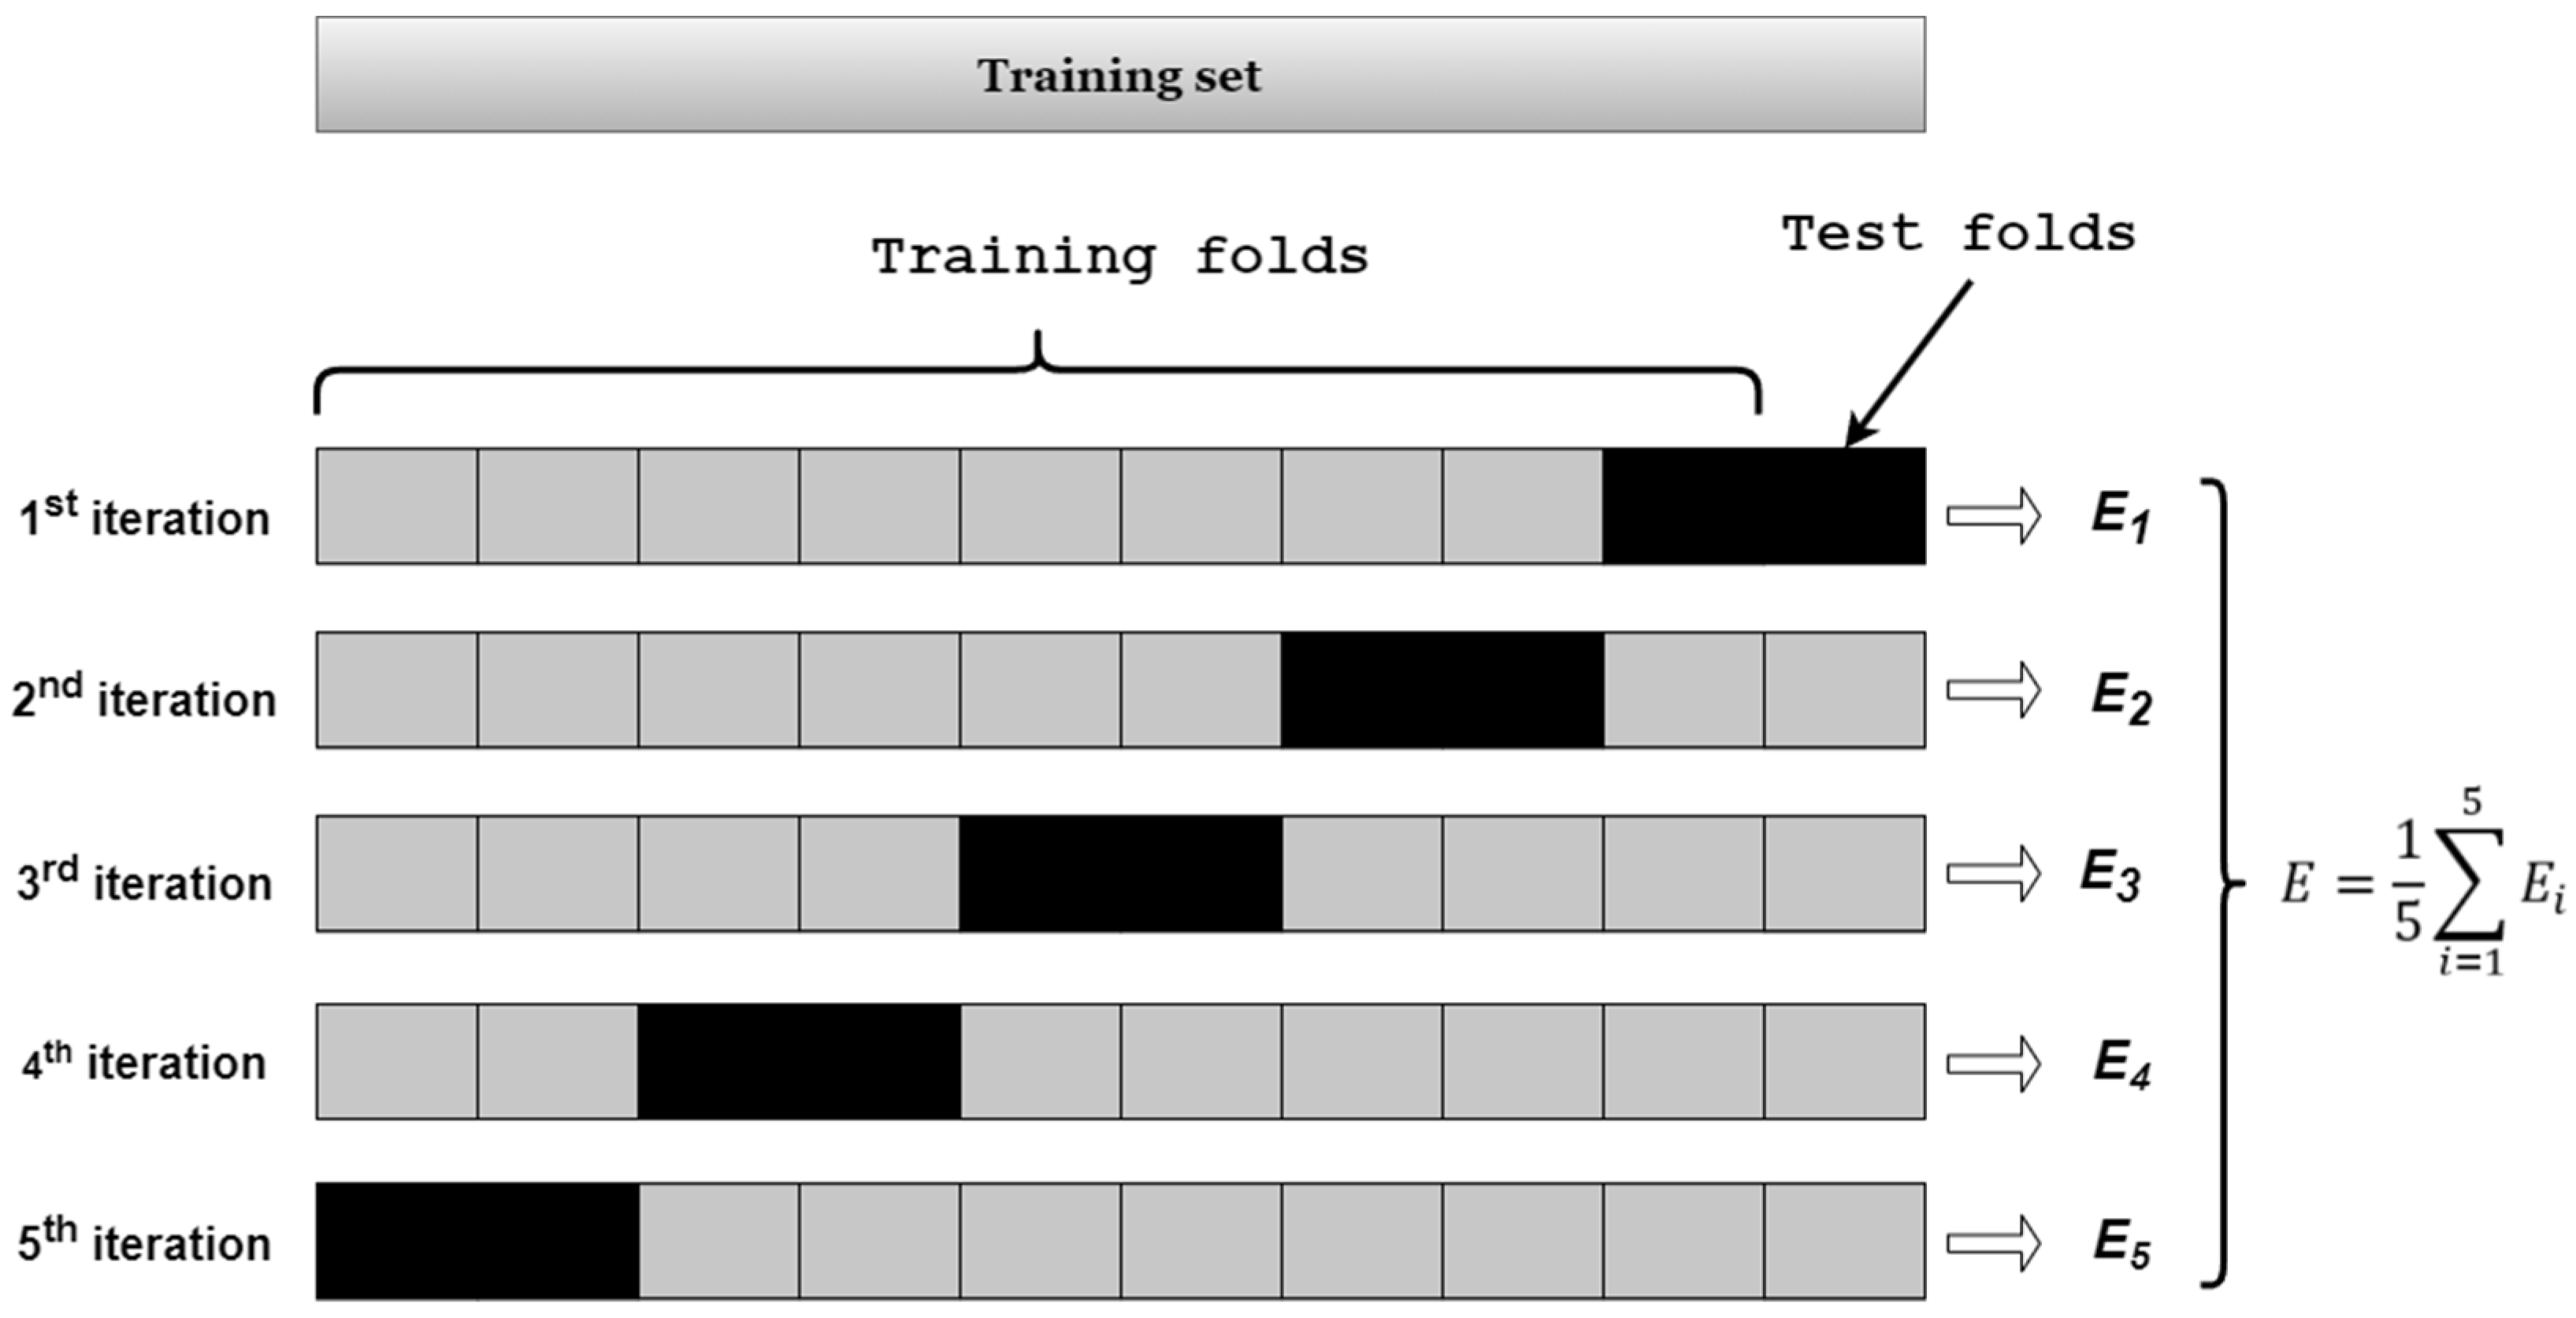
In this study, first, data preprocessing was carried out, characteristic factors were selected to establish the dataset. Then, the dataset was divided into training data and test data, and a 5-fold cross-validation was employed to identify the optimal prediction model. In the 5-fold cross-validation schematic, hollow circles are used to represent the training set data and blue solid circles are used to represent the test set data; according to the 5-fold cross-validation, 8 hollow circles are used as the training set and 2 solid circles are used as the test set. Finally, the optimal model was used on the test data. The specific experimental flow chart is displayed in Figure 4.
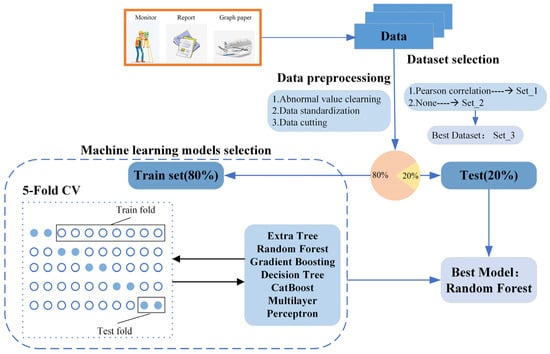
Figure 4.
Flow chart of the experiment.
3.1. Data Preprocessing
A major problem encountered with machine-learning predictive models was the difficulty in converging the learning curve due to issues such as overfitting and underfitting. The dataset needed to be preprocessed to mitigate data inconsistencies and enhance the likelihood of curve convergence [22].
Dealing with outliers in a dataset was one of the critical preprocessing steps in machine-learning prediction, as outliers could lead to problems in model training and prediction. The approach employed in this paper was outlier identification based on the Z-score (standardized score) method. This approach was a standardized metric used to measure the degree of deviation of a data point from the mean. The relative position of a data point in the overall data distribution was determined by comparing the differences between different samples. Specifically, the score quantified the amount of deviation.
where is the score, is the data point’s value, is the dataset’s mean, and is the dataset’s standard deviation.
Through the -score method for the target value of each characteristic factor for the outlier test, in addition to the horizontal displacement of the enclosure structure, support axial force, building settlement, and column settlement of a small portion of the data existing data (about 0.37% of the total number of residents), and through the analysis of this part of the data, the deviation belongs to the standard data fluctuation, and did not reach the extreme deviation. So, do not deal with it.
When dealing with missing values in the past, interpolation was employed to fill in sporadically distributed missing values, while the nearest valid value to the missing value was used to fill in continuously distributed values, especially those located at the beginning and end parts of the data. Nevertheless, the cleaned data often exhibited variations that could impact machine-learning outcomes. Data standardization was necessary to mitigate this effect and enhance the convergence speed to some extent. Data standardization, also known as feature scaling, converts data with dissimilar scales or ranges into a standard form with similar scales for improved application in machine-learning algorithms.
In practice, different features typically possessed varying units of measurement and value ranges. These inconsistent scales and value ranges could have adverse effects on the predictions made by machine-learning prediction algorithms. Data normalization aimed to eliminate scale differences between features, making them more suitable for comparison and analysis.
The range-scaling method, specifically min–max normalization, used in this study, involved scaling the range of feature values to a fixed interval, typically in the range [0, 1]. The formula used was as follows:
represents the scaled values, denoted the original values, and and are the minimum and maximum values of the features, respectively. This method preserves the distribution information of the original data and is suitable for cases where the data did not follow a normal distribution.
After the preprocessing, the dataset was divided into training and test data in an 8:2 ratio. The training set was utilized for constructing and training the machine-learning model, enabling it to learn patterns, regularities, and associations from the training data. The test set, on the other hand, was employed to assess the performance of the machine-learning model.
3.2. Machine-Learning Methods
Machine-learning methods have gained wide application in various prediction tasks in recent years. To predict the enclosure structure’s horizontal displacement, six mainstream machine-learning algorithms were selected to test the ability of prediction shown in Table 3.
Table 3.
Brief description of machine-learning algorithms.
The extra trees algorithm builds upon the conventional decision trees approach. In the traditional decision tree algorithm, data objects are segregated into different branches based on their attribute values. The critical aspect lies in selecting the most suitable data features and their splitting points to facilitate decision making [34]. Pierre et al. [35] ingeniously introduced additional steps to the traditional decision tree algorithm to enhance its randomness. This augmentation not only improves the accuracy of suboptimal solutions but also enhances the flexibility of solution computation. This refinement yields particularly notable benefits in classification problems.
The random forest (RF) algorithm combines the bagging method with CART decision trees and creates a novel classification algorithm [36]. RF, in essence, constitutes numerous randomly constructed decision trees. In the creation of each tree, a sample set is generated through randomized extraction, and the node set is also formed by random extraction, leading to distinct trees. When a new sample enters the forest, each decision tree makes a classification judgment, culminating in an outcome based on the majority rule. Specifically, the random forest formation exhibits the following characteristics:
- Bootstrap sampling method:
A new set of samples is created by randomly selecting N samples out of all N samples in a back-and-forth manner, facilitating the generation of a decision tree;
- 2.
- Random selection of features:
During each node’s split while growing the decision tree, m features (where m << M) are randomly chosen from the total M features. The best-performing feature from the selected m is used as the basis for splitting;
- 3.
- Formation of diverse decision trees:
A multitude of unique decision trees are generated following the aforementioned steps to construct a random forest.
The gradient boosting regression [37,38] (GBR), akin to a collaborative learning technique, combines multiple weaker learning algorithms in an attempt to learn from errors. It functions by iteratively creating numerous weak learners, each aiming to fit the negative gradient of the previous cumulative model’s loss function. The primary notes are:
- Weak learners integration:
Individual learning algorithms might not be highly accurate, but their integration yields higher accuracy when combined;
- 2.
- Sequential application:
These learning algorithms are applied sequentially, with each learning from the errors of its predecessor.
The decision tree algorithm, often depicted as a tree-like flowchart, presents various outcomes of sequential decisions. It aids in classification, decision making, and analysis by representing potential decisions, outcomes, or reactions. The tree structure comprises three main elements: the root node, leaf nodes, and branches. The root node serves as the starting point, with both root and leaf nodes featuring a categorization criterion. Branches link the nodes, indicating different category paths. During tree formation, each node’s split tends to enhance the order and purity of information within the subset. Purity can be quantitatively measured by three mainstream methods, namely information gain-based trees (ID3 algorithm), information gain ratio-based trees (C4.5 algorithm), and Gini index-based trees (CART algorithm).
The CatBoost [39] is a novel classification learning algorithm within the Boosting family. It stands alongside XGBoost [40] and LightGBM [41] as optimizations of the GBDT [42] framework. While XGBoost remains widely prevalent in general applications, LightGBM notably enhances computational efficiency. Conversely, CatBoost excels by addressing issues like gradient bias, prediction shift, and effectively preventing overfitting. This innovative solution significantly improves classification accuracy while concurrently enhancing generalization capabilities. CatBoost’s prowess in mitigating these challenges positions it as a compelling choice for algorithmic comparisons, making it a pivotal consideration in this study.
The multilayer perceptron (MLP), a type of artificial neural network (ANN), comprises an input layer, multiple hidden layers, and an output layer. In this architecture, the input layer vector is X, and the output of the hidden layer is calculated using , while signifies the weight of the fully connected layer, denotes the bias, and stands for the chosen activation function. Typically, nonlinear functions such as the sigmoid, tanh, or ReLU functions are preferred as activation functions. Linear functions are unsuitable as activation functions as they result in a linear combination of vectors, irrespective of the number of hidden layers. Among these, the ReLU function is commonly chosen in practice due to its effectiveness, while the output values of other activation functions have certain range limitations.
To obtain optimal values, a gradient-descent approach is commonly employed. Initially, all weights and biases are initialized, followed by iterative training that stops upon reaching a maximum number of iterations or when the error becomes sufficiently small. The gradient is computed, and subsequent updates are made to the weights and biases to converge towards the optimal values.
3.3. Model Selection Methods
Cross validation is a commonly used method for model selection and parameter tuning [43]. The primary methods included simple cross validation (HoldOut test), K-fold cross validation, and an autonomous method. In this study, K-Fold cross validation was employed (as illustrated in Figure 5):

Figure 5.
Example of 10-fold Cross-Validation Calculation.
- First, the total sample was divided into k equal-sized subsets of samples;
- Second, these k subsets were sequentially traversed, with each iteration using the current subset as the validation set and all the remaining samples as the training set for model training and evaluation;
- Finally, the average of the k evaluation metrics was computed as the final evaluation.
3.4. Evaluation Metrics
The statistical evaluation parameters commonly used in this analysis, namely the coefficient of determination (), mean absolute error (MAE), and root mean square error (RMSE), are used to assess the accuracy of the computational results produced by the intelligent method, as shown below.
where is the actual value-predicted value in the test set, denotes the mean of all predicted values; represents the test deformation data serial number; and is the total number of generated test deformation data.
4. Results and Discussion
4.1. Prediction Model Selection
The feature factors obtained after completing the data preprocessing were sequentially input into six machine-learning models. The initial hyperparameter adjustment was performed for the training set, followed by hyperparameter optimization through 5-fold cross validation. The accuracy assessment results are presented in Table 4 below. The result shows that the RF algorithm achieved the highest value and the lowest MAE/RMSE among the algorithms.
Table 4.
Accuracy assessment metrics for 5-fold cross validation for each machine-learning model training set.
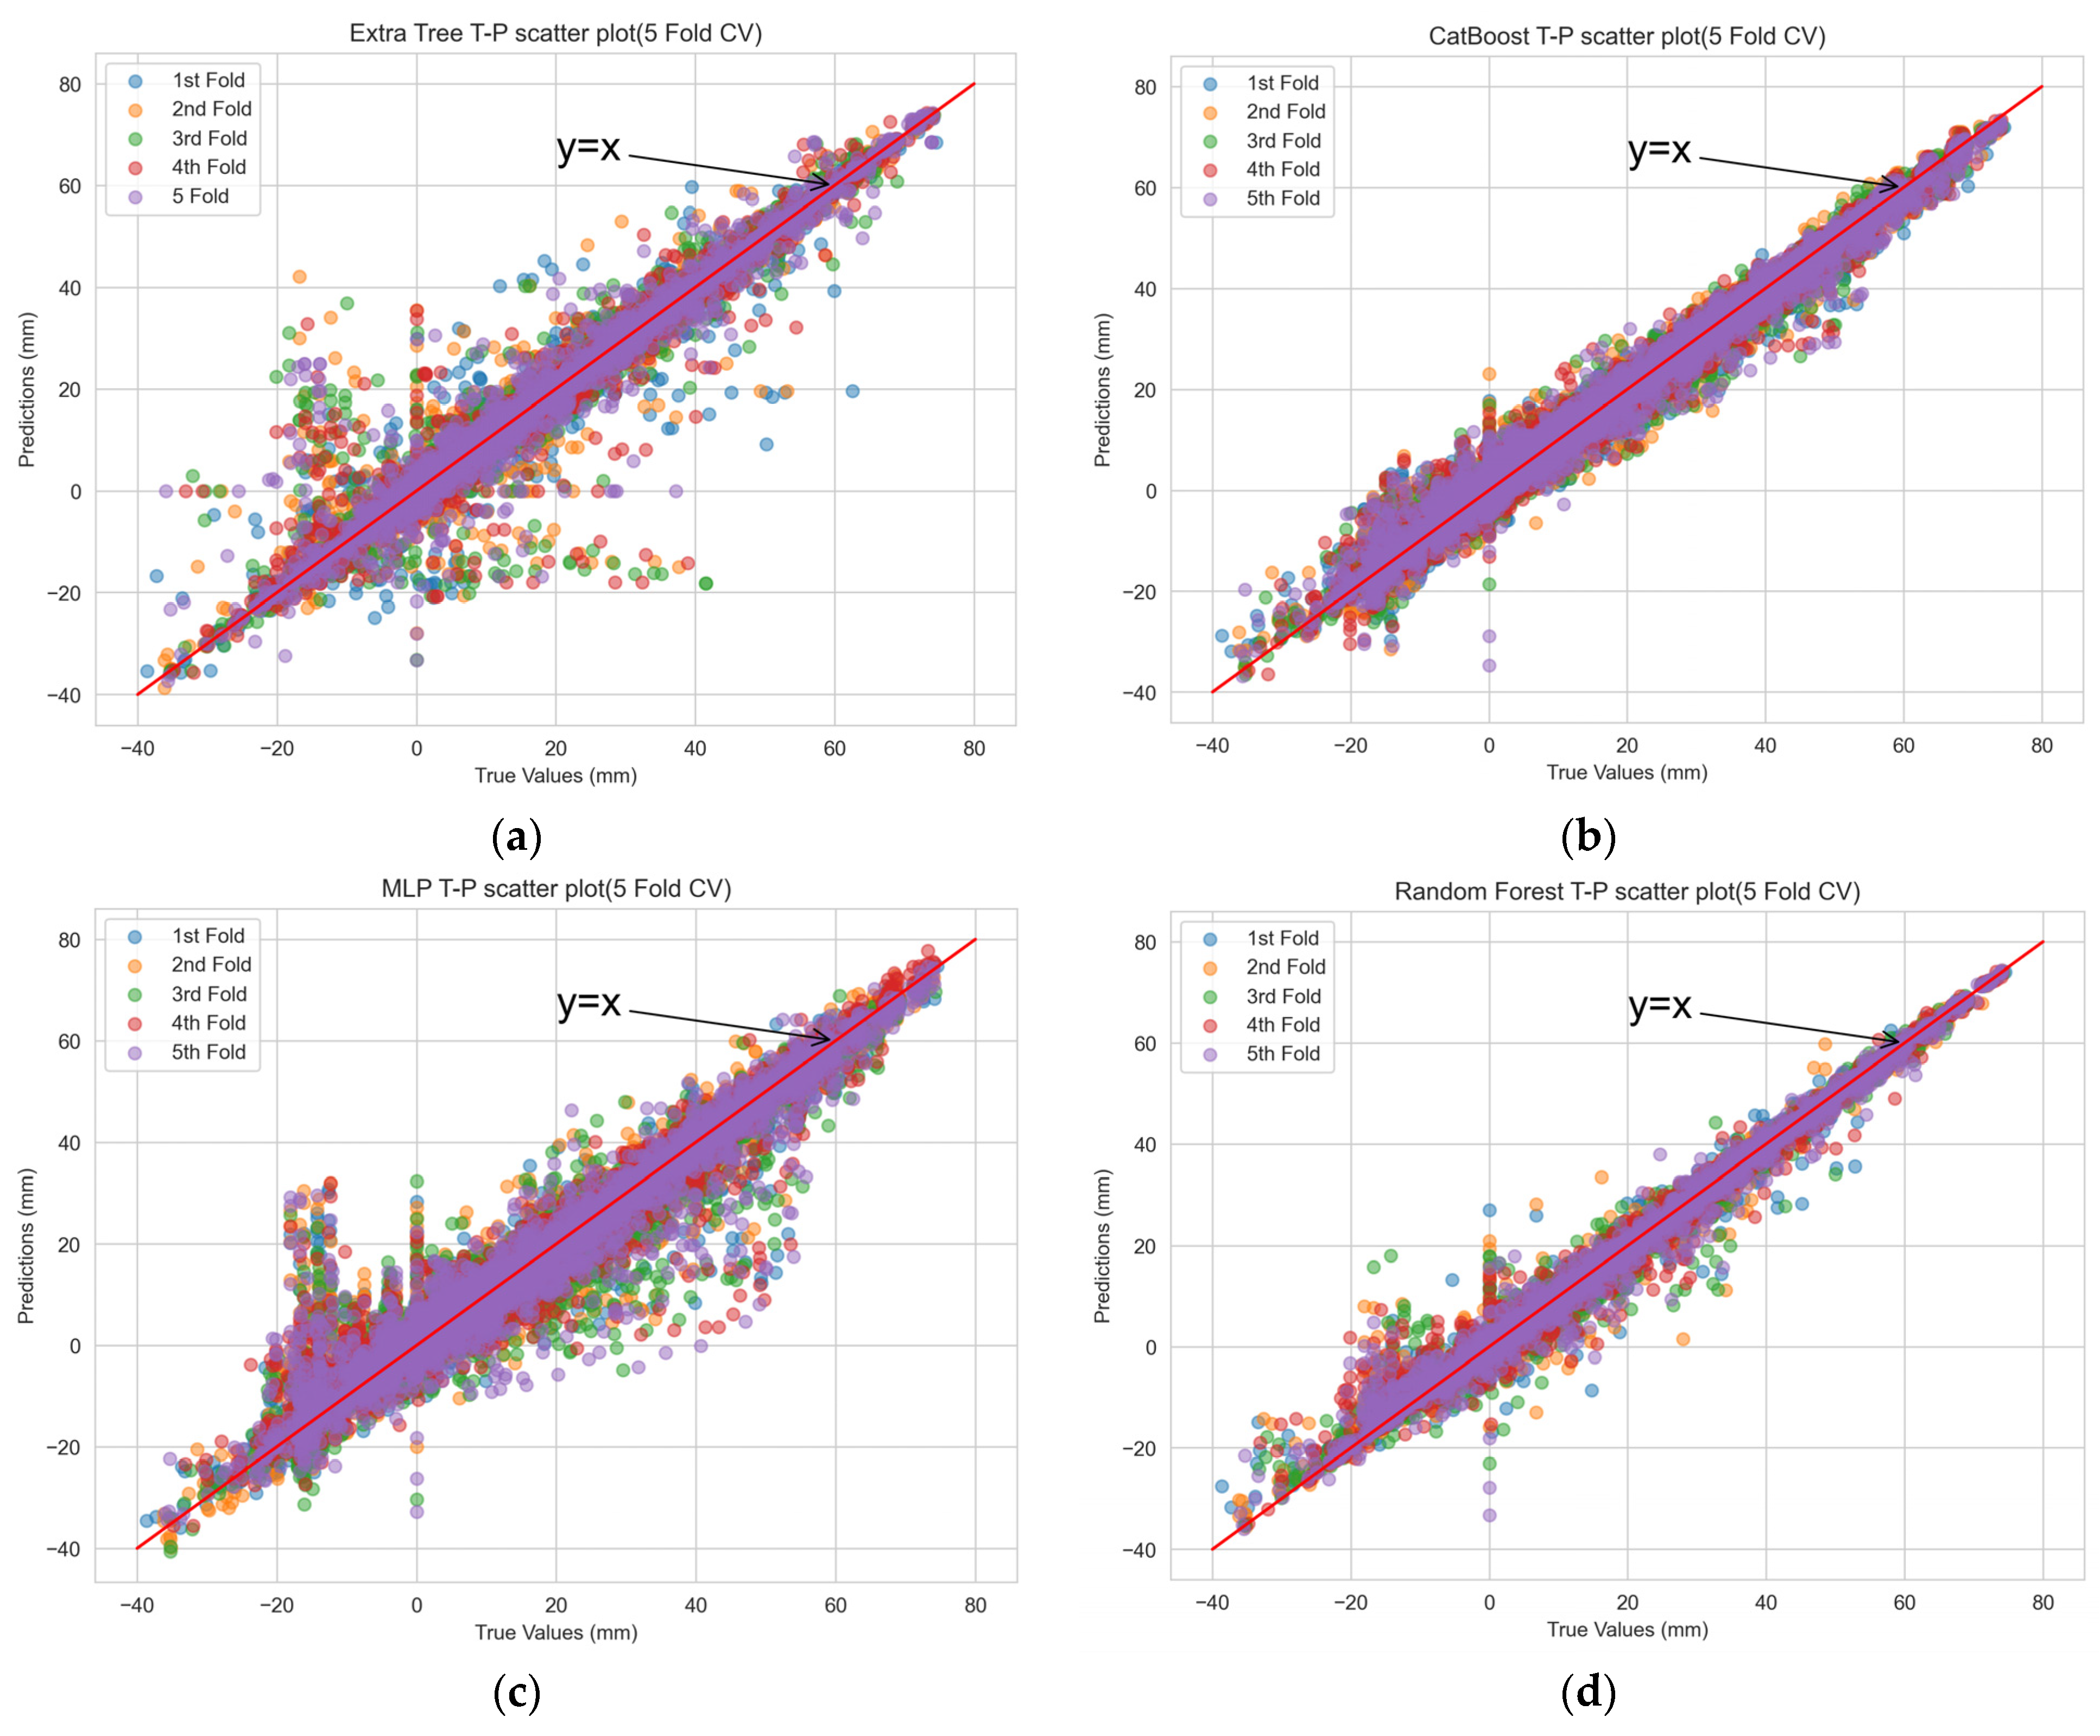
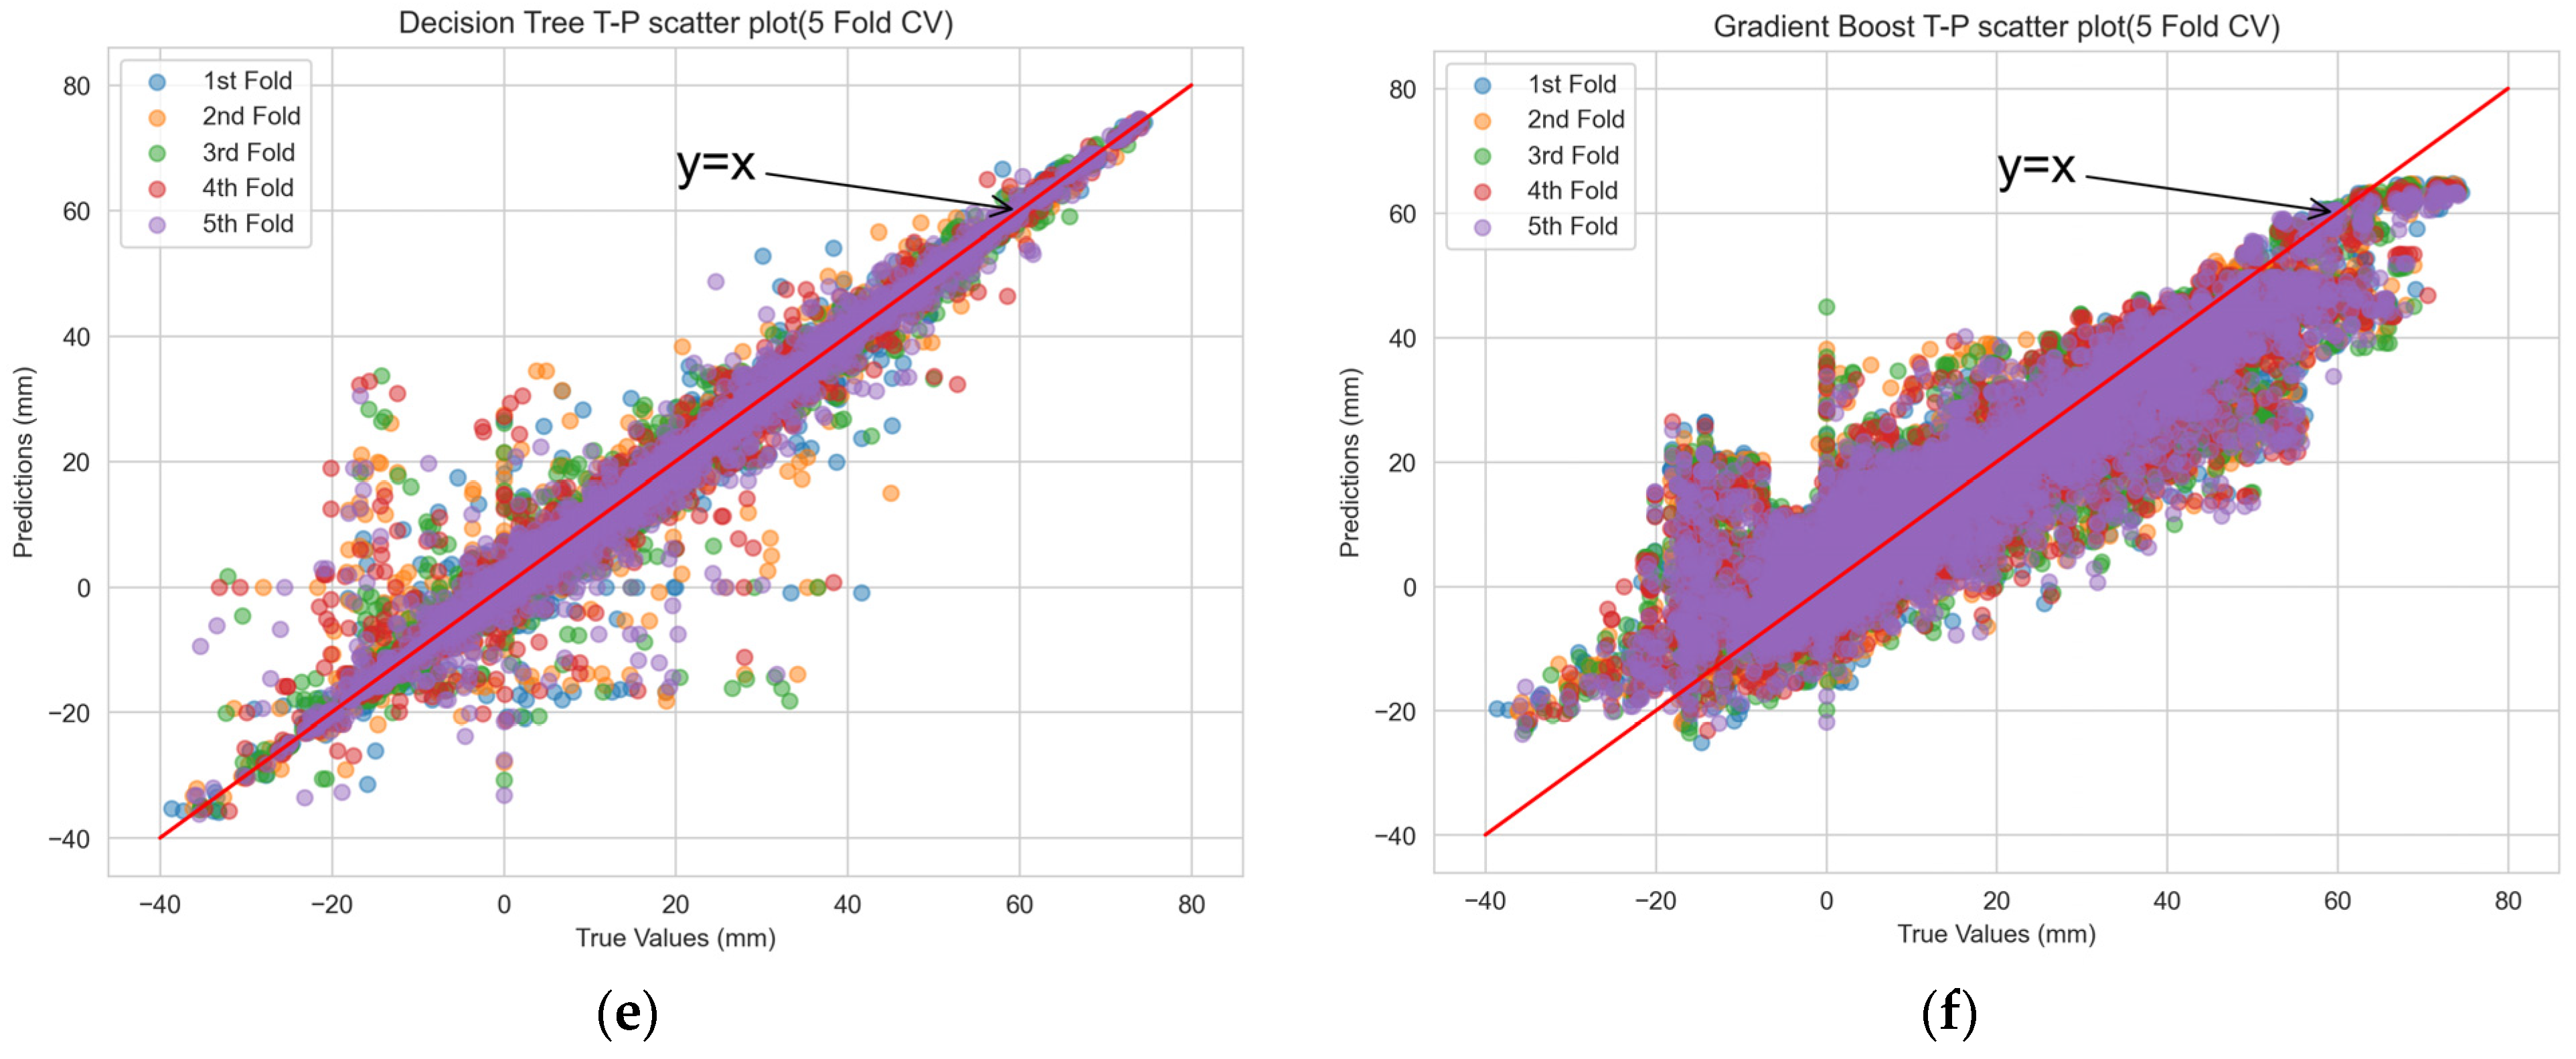
The scatterplot of the actual versus predicted values obtained from the machine-learning model’s training set through 5-fold cross validation is depicted in Figure 6. The distribution of points from RF in the scatterplot closely resembled a straight line, indicating a strong correlation between the predicted and actual values and high prediction accuracy. In contrast, for the other machine-learning prediction models, the scatterplot patterns revealed systematic deviations from the ideal straight line, suggesting potential issues of underfitting or overfitting.
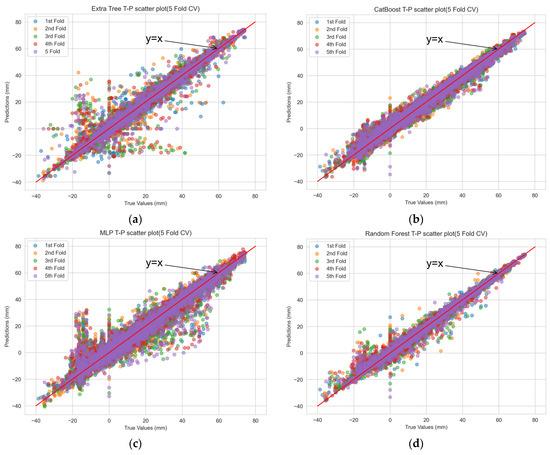
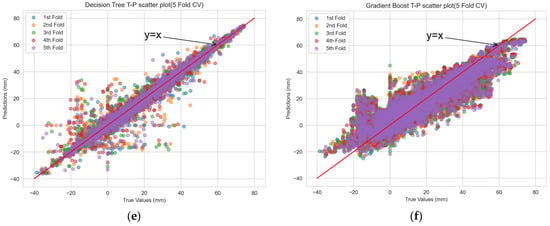
Figure 6.
Scatterplot of CV true-predicted values for each machine-learning model. (a) extra tree; (b) CatBoost; (c) multilayer perceptron; (d) random forest; (e) decision tree; and (f) gradient boost.
4.2. Enclosure Deformation Prediction
To assess the selected optimal model’s generalization ability in a real-world context, which allowed for an evaluation of its predictive capability and effectiveness, the test set was applied to the RF model to obtain an accuracy assessment.
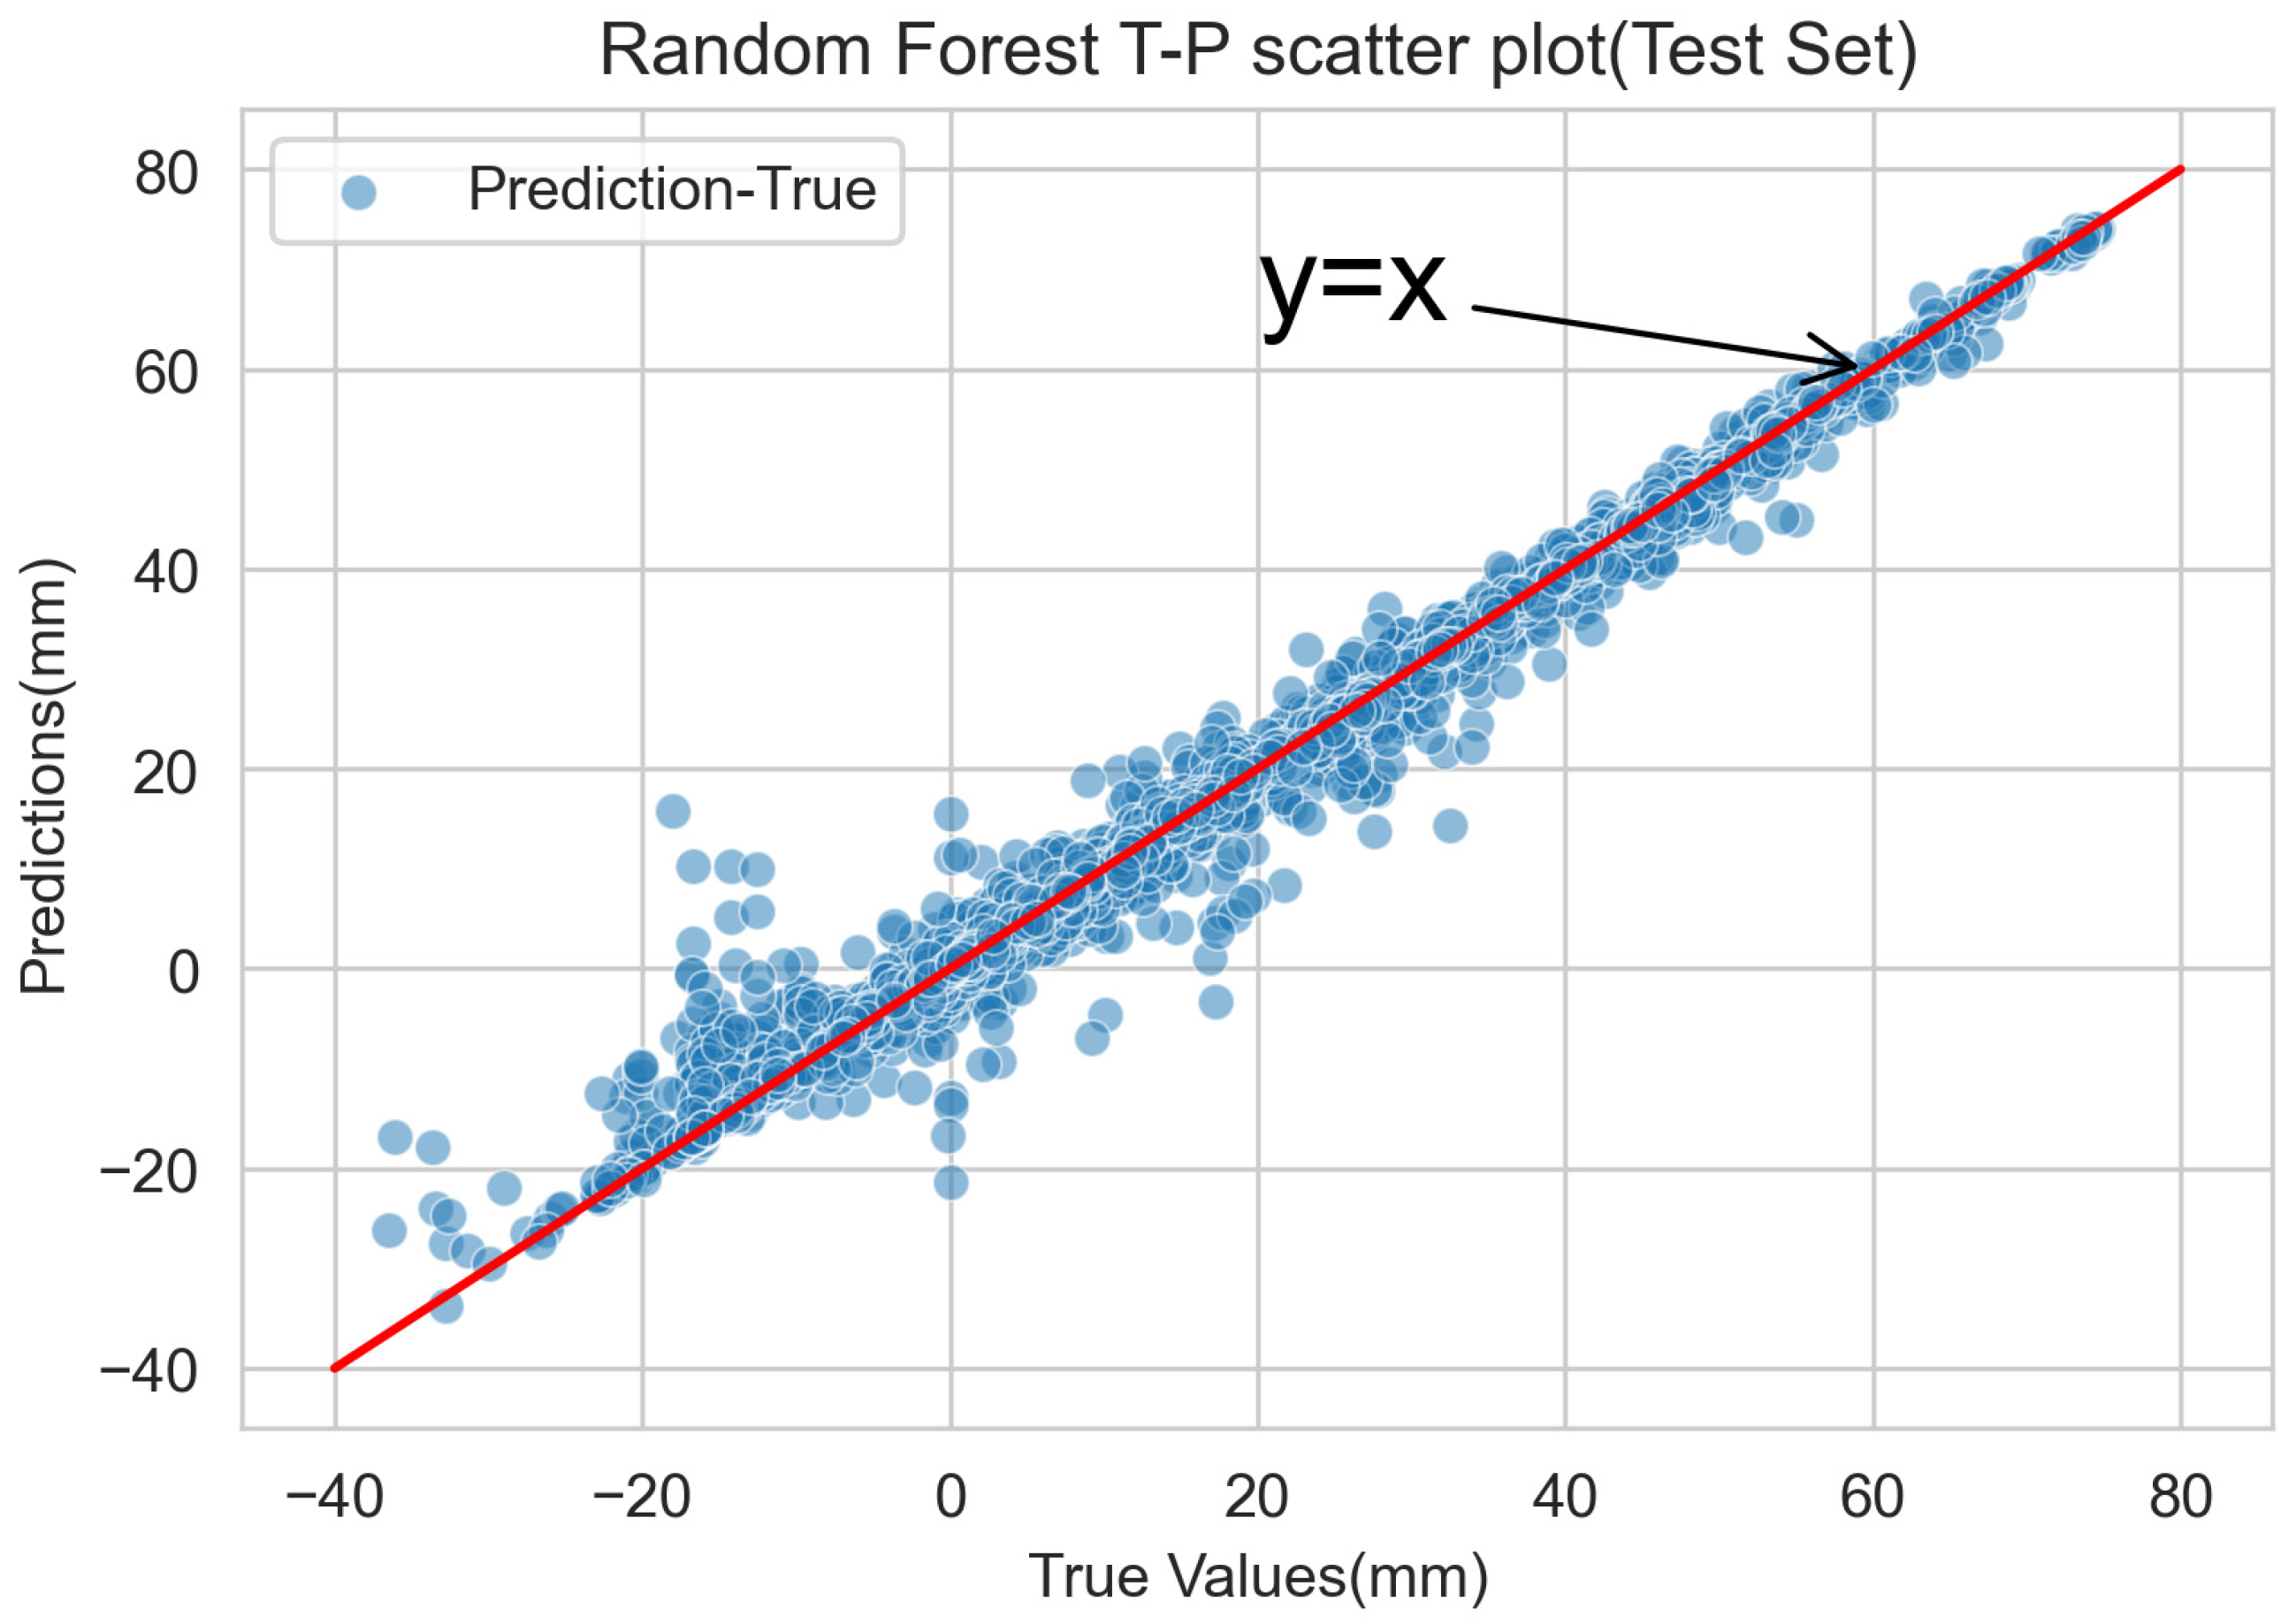
The results of the accuracy assessment of the test set’s predictions are shown in Table 5. The results show that R2 is 0.9905, MAE is 0.8572 mm, and RMSE is 1.9119 mm; the accuracy of the prediction results of the test set with unknown data is in close agreement with the prediction accuracy of the training data. The scatterplot of true versus predicted values is illustrated in Figure 7; the dots are the mapping of the true values in the dataset to the corresponding predicted values. The plot reveals that the prediction results are concentrated in the vicinity of a straight line representing a satisfied fitting. These outcomes indicate that the model’s predictive performance is not only acceptable but also satisfactory for the specific project. Based on the statistical findings and graphical representations, the model generated by the RF prediction model can be effectively employed for predicting the horizontal displacement of the enclosure structure.
Table 5.
The performance of the RF prediction models on test data.
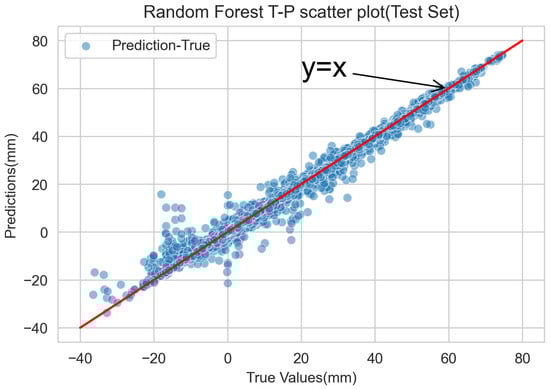
Figure 7.
Scatter plot of the RF true value-predicted value on test data.
4.3. Analysis of Feature Importance
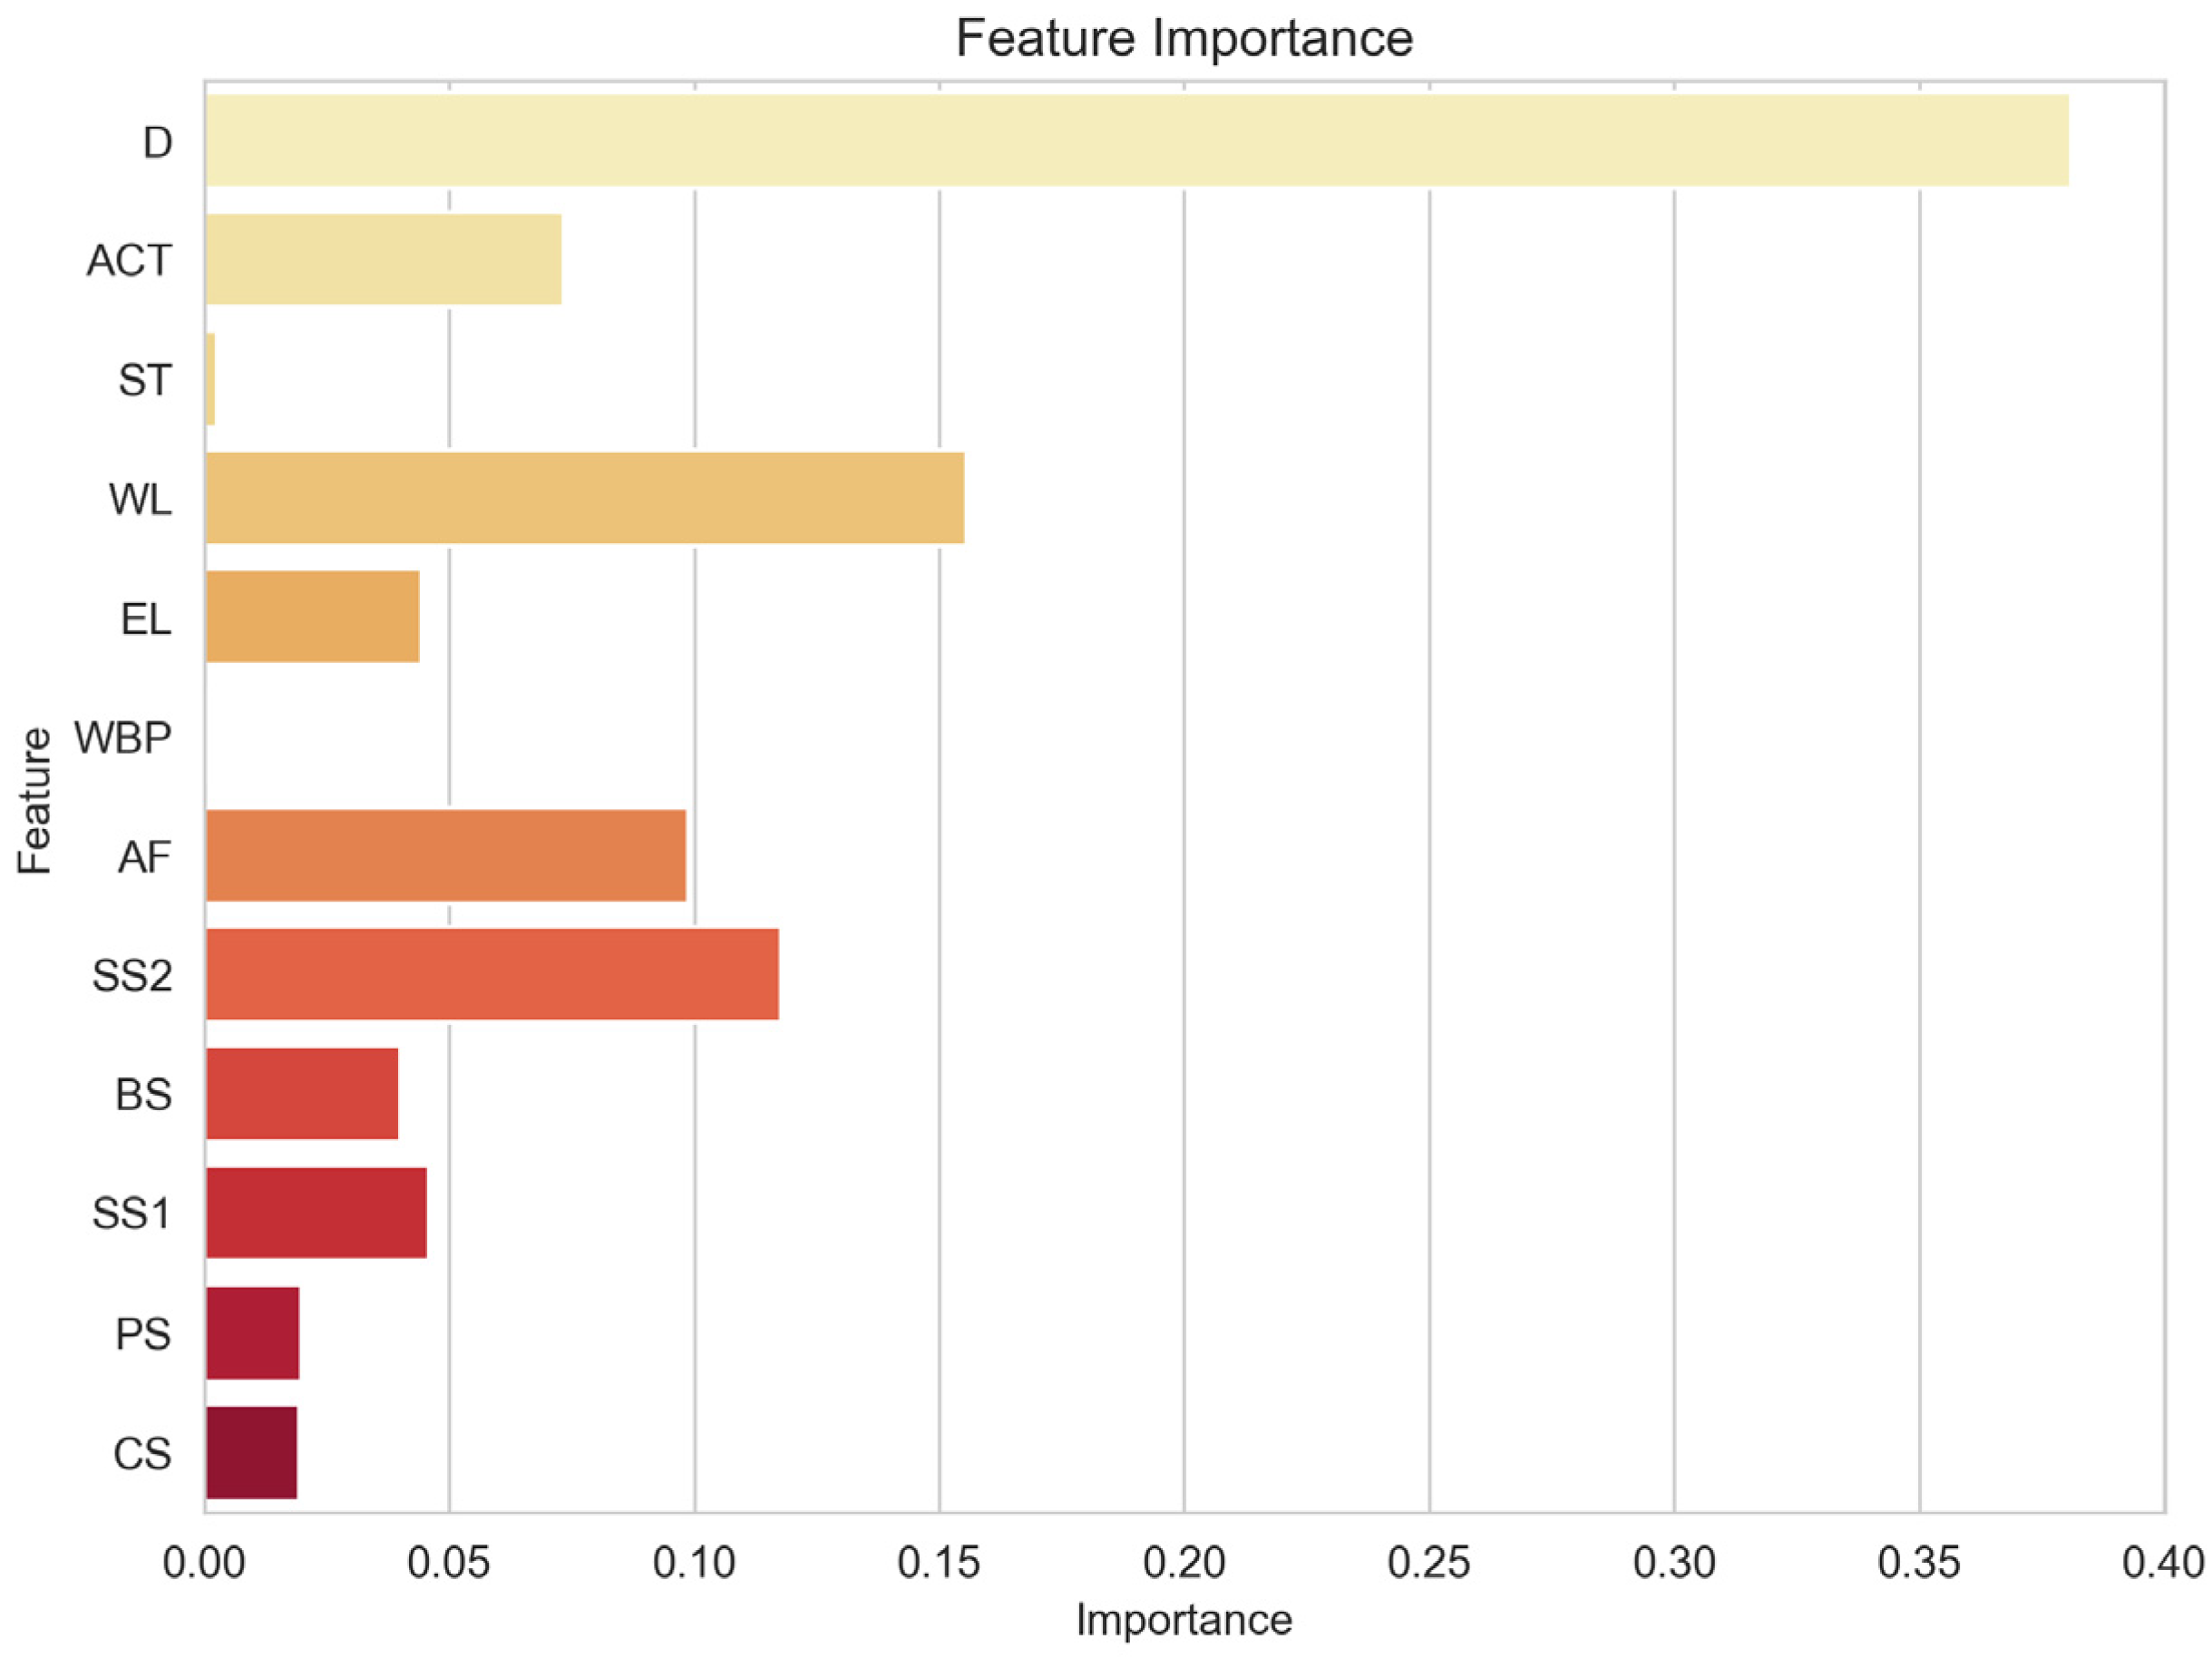
RF is an ensemble learning model composed of multiple decision trees. Its feature importance is measured by calculating the reduction in impurity based on the decision trees. Impurity reduction refers to the decrease in impurity caused by using a specific feature for splitting when constructing the decision tree. For every feature, RF averages the impurity reduction across all decision trees and normalizes it to obtain the feature’s importance. A higher feature importance indicates a greater contribution of that feature to predicting the target variable within the RF. The obtained feature importance is illustrated in Figure 8, with the characteristic importance of each characteristic factor of the validation set. Features such as D, WL, SS2, AF, and ACT demonstrate prominent importance in the feature ranking, suggesting their relatively significant roles in the predicting task. Factor D especially has the most significant impact in the case. In the construction process, under the comprehensive action of supporting the axial force, soil pressure, and other factors, the enclosures show a consistent deformation pattern over time, which is illustrated in Figure 3. This pattern is correlated to the depth of enclosure of the foundation pit. The WL plays a crucial role in influencing the saturation degree of the soil and the effective stress it experiences. The fluctuation in groundwater level directly impacts the drainage efficiency of the soil; a higher groundwater level may impede proper drainage, increasing the saturation degree and potentially impacting the horizontal displacement of enclosure structures. Additionally, the water level is closely tied to soil drainage, which further affects the enclosure’s stability. AF directly reflects the deformation of the pit’s support structure, serving as an indicator of the binding force between the support structure and the soil. The magnitude of the support axial force demonstrates the structural integrity of the support system. SS2 causes vertical compression of the soil, leading to lateral movement. This lateral movement exerts a force on the support structure, potentially resulting in horizontal displacement. Simultaneously, SS2 compresses the soil, reducing its volume and compromising its strength and stability. This reduction in soil strength increases the risk of horizontal displacement. The ACT factor, the timing of pouring the pit floor, is a critical consideration for minimizing the horizontal displacement of the enclosure structure. The pouring time directly influences the overall stability and deformation behavior of the pit support system, making it an essential engineering parameter to be carefully managed.
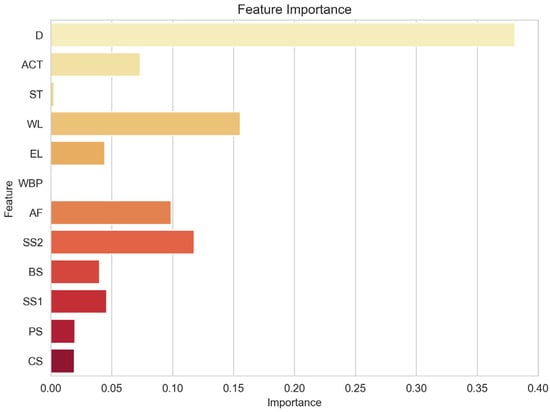
Figure 8.
Characteristic importance of each characteristic factor of the validation set.
Notably, the feature importance of factors like WBP and ST appears relatively weak, implying their minor impact on predicting the target variable. Civil engineering issues are often influenced by complex factors. Feature importance is a relative metric calculated based on the reduction in impurity from decision trees. When features are highly correlated, their importance might offset each other, resulting in lower importance values for specific features. Moreover, as the random forest is a nonlinear model, feature importance reflects the influence of nonlinear relationships. Even if a feature has low importance, it might still exhibit nonlinear relationships with the target variable.
4.4. Analysis of Factors Screening
Feature selection plays an important role in machine learning, as it manually or automatically selects input features that contribute significantly to the target variable. This selection is an important step to be considered while constructing ML models [44]. After the initial selection of input parameters in predicting horizontal displacements of the enclosure, to avoid the occurrence of dimensional catastrophe and overfitting and, at the same time, to improve the model’s accuracy, it is necessary to rely on feature selection for further screening of the input parameters.
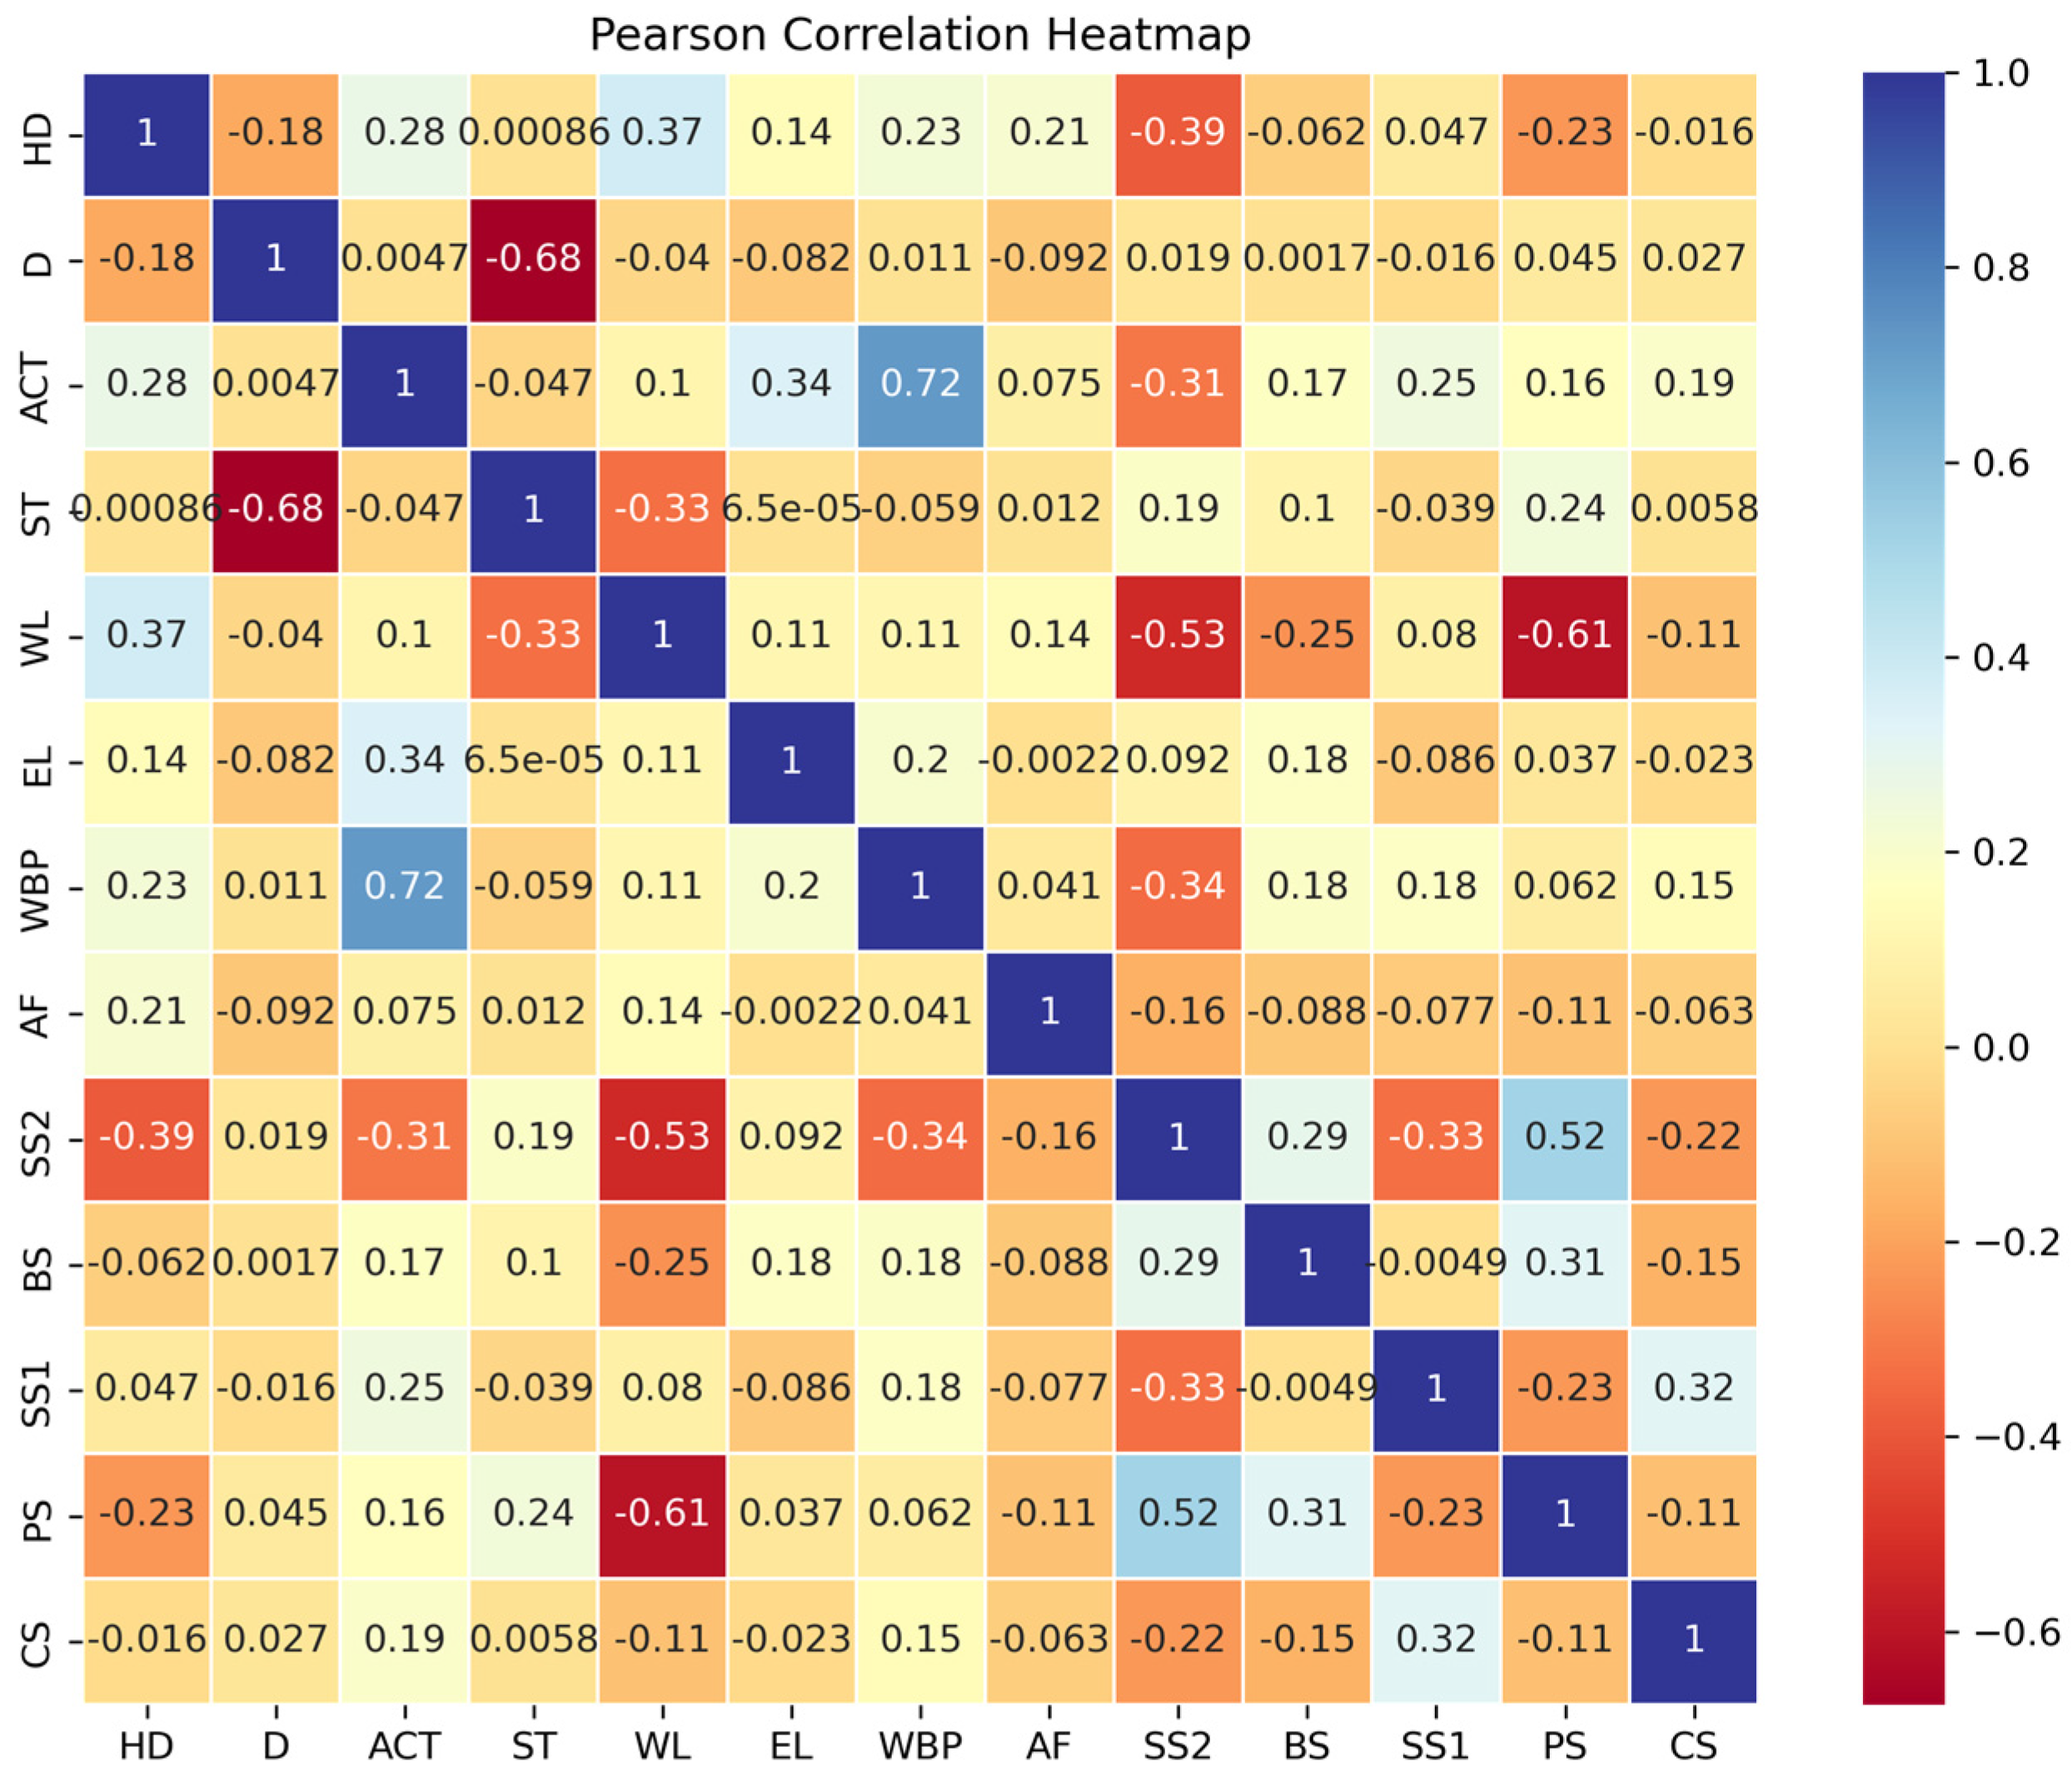
The Pearson correlation coefficient [45] was used to calculate the linear correlation between the horizontal displacement of the envelope and each eigenvector. The Pearson correlation coefficient was used to calculate the linear correlation between the horizontal displacement of the enclosure and each eigenvector. The calculated formula is as follows:
where r denotes the Pearson correlation coefficient, denote the values of the x and y variables, and denote the mean of the variables in the sample, respectively. The Pearson’s correlation coefficient lies between −1 and 1. The greater the absolute value of the coefficient (||), the stronger the correlation between the variables.
According to the Pearson correlation coefficient heatmap illustrated in Figure 9, the correlation results of each feature factor do not meet the conditions for achieving a high or strong correlation. Here, only feature factors with || > 0.1, indicating at least a weak correlation with the target value, are considered for selection. The feature factors in the dataset Set_1 comprise D, ACT, EL, WBP, AF, SS1, SS2, and PS. The target value is HD. In contrast, Set_2 comprises all feature factors.

Figure 9.
Heat map of correlation coefficients of characterization factors.
Table 6 shows the specific composition of the formed Set_1 and Set_2 datasets. These different datasets were fed into the optimal RF for model training and then evaluated. The precision assessment for each result is shown in Table 7. The 5-fold cross validation and the test set result all indicate that the performance of Set_2 is better than Set_1.
Table 6.
Composition of different datasets.
Table 7.
Accuracy ratings of RF’s prediction results for the three datasets.
4.5. Actual Predictions for Selected Monitoring Sites
To further validate the validity of this method, data from different periods of several monitoring sites in the field were selected for validation. Figure 10 shows the measured and predicted horizontal displacements of the enclosure structure at the HD measurement points CX-1 and CX-58. The dashed line is the predicted value, and the measured value is the actual value. It can be seen that the predicted values obtained by the RF prediction model are consistent with the actual values in terms of numerical values and overall trends. As shown in Table 8, the accuracy assessment achieves an R2 of 0.9646, an MAE of 0.5625 mm, and an RMSE of 3.6403 mm, which proves the feasibility of machine learning in HD prediction.
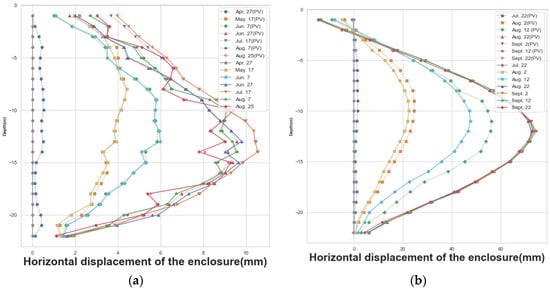
Figure 10.
Horizontal displacement of the enclosure at CX-1 and CX-58; (a) CX-1; (b) CX-58.
Table 8.
Accuracy assessment of predicted values at CX-1 and CX-58 monitoring sites.
5. Conclusions
This study systematically outlines the application process of a machine-learning-based method for accurately predicting the horizontal displacement of the foundation pit’s enclosure structure. Several related factors, including geological environment, construction progress, stress, and displacement, were employed for the HD prediction task. Six mainstream machine-learning algorithms were selected to test the ability of HD prediction. Based on a dataset of 38,966, the random forest prediction model proved to be the best choice after 5-fold cross validation. The test results showed that the R2 exceeded 0.99, and the MAE was less than 1, indicating the model’s acceptable and satisfactory predictive performance for the specific project. In the prediction task, parameter D (depth) has the greatest influence on the prediction, the enclosures show a consistent deformation pattern over time, and the pattern is correlated to the depth of enclosure of the foundation pit. In addition to the water level, the surface settlement and support axial force have less influence on the machine-learning prediction.
Moreover, the study applied the Pearson correlation coefficient to analyze the factor correlation and screen a new dataset. However, compared with the original datasets, the screened features could not reach the accuracy of the original data.
Finally, to further validate the validity of this method, data from different periods of several monitoring sites in the field were selected for validation. The result proves the feasibility of machine learning in HD prediction as well.
By fully considering the influence factor of deformation of a deep foundation-pit enclosure, machine learning can predict the deformation of foundation-pit enclosure in construction, which is of great significance for construction safety. This method can be extended in the construction of deep foundation pits in a similar environment.
Research Limitations
Due to the irregularities in the amount of data and the quality of the engineering data from the construction site of the project, some of the characterization factors, such as building inclination and earth pressure, which are supposed to play an essential role in the deformation mechanism of the enclosure structure, could not be echoed with the rest of the data due to the incomplete data of the individual compiled dataset. More work should be done to collect similar data and create a database to provide more characterization factors.
Author Contributions
Conceptualization, Y.X. and J.S.; methodology, Y.Z.; software, Q.J.; validation, W.J., C.T. and Q.J.; formal analysis Y.Z.; resources, Y.Z.; data curation, Y.Z.; writing—original draft preparation, Y.X.; writing—review and editing, J.S.; supervision, J.S.; project administration, J.S.; funding acquisition, Y.X. All authors have read and agreed to the published version of the manuscript.
Funding
The APC was funded by China Coal Technology and Industry Group Co., Ltd. Science and Technology innovation start-up capital.
Institutional Review Board Statement
Not applicable.
Informed Consent Statement
Not applicable.
Data Availability Statement
The data presented in this study are available on request from the corresponding author. The data are not publicly available due to privacy. The dataset used is available on GitHub at https://github.com/Arnold0624/My-Database.
Conflicts of Interest
Authors Yangqing Xu, Qiangqiang Jiang and Wei Jiang were employed by the company Wuhan Design & Research Institute Co., Ltd. of China Coal Technology & Engineering Group. The remaining authors declare that the research was conducted in the absence of any commercial or financial relationships that could be construed as a potential conflict of interest.
References
- Ning, Y.; Liu, S.G.; Zhao, S.Q.; Liu, M.C.; Gao, H.Q.; Gong, P. Urban growth rates, trajectories, and multi-dimensional disparities in China. Cities 2022, 126, 103717. [Google Scholar] [CrossRef]
- Jin, D.; Yuan, D.; Li, X.; Zheng, H. Analysis of the settlement of an existing tunnel induced by shield tunneling underneath. Tunn. Undergr. Space Technol. 2018, 81, 209–220. [Google Scholar] [CrossRef]
- Ramirez, R.A.A.; Lee, G.; Choi, S.; Kwon, T.; Kim, Y.; Ryu, H.; Kim, S.; Bae, B.; Hyun, C. Monitoring of construction-induced urban ground deformations using Sentinel-1 PS-InSAR: The case study of tunneling in Dangjin, Korea. Int. J. Appl. Earth Obs. Geoinf. 2022, 108, 102721. [Google Scholar] [CrossRef]
- Mahmoodzadeh, A.; Mohammadi, M.; Daraei, A.; Farid Hama Ali, H.; Kameran Al-Salihi, N.; Mohammed Dler Omer, R. Forecasting maximum surface settlement caused by urban tunneling. Autom. Constr. 2020, 120, 103375. [Google Scholar] [CrossRef]
- Pal, A.; Rošer, J.; Vulić, M. Surface Subsidence Prognosis above an Underground Longwall Excavation and Based on 3D Point Cloud Analysis. Minerals 2020, 10, 82. [Google Scholar] [CrossRef]
- De Caro, M.; Crosta, G.B.; Previati, A. Modelling the interference of underground structures with groundwater flow and remedial solutions in Milan. Eng. Geol. 2020, 272, 105652. [Google Scholar] [CrossRef]
- Li, X.; Zhou, T.; Wang, Y.; Han, J.; Wang, Y.; Tong, F.; Li, D.; Wen, J. Response Analysis of Deep Foundation Excavation and Dewatering on Surface Settlements. Adv. Civ. Eng. 2020, 2020, 8855839. [Google Scholar] [CrossRef]
- Ali, H.; Choi, J. Risk Prediction of Sinkhole Occurrence for Different Subsurface Soil Profiles due to Leakage from Underground Sewer and Water Pipelines. Sustainability 2020, 12, 310. [Google Scholar] [CrossRef]
- Plett, G.L. Adaptive inverse control of linear and nonlinear systems using dynamic neural networks. IEEE Trans. Neural Netw. 2003, 14, 360–376. [Google Scholar] [CrossRef] [PubMed]
- Sharghi, M.; Chakeri, H.; Ozcelik, Y. Investigation into the effects of two component grout properties on surface settlements. Tunn. Undergr. Space Technol. 2017, 63, 205–216. [Google Scholar] [CrossRef]
- Kim, D.; Kwon, K.; Pham, K.; Oh, J.; Choi, H. Surface settlement prediction for urban tunneling using machine learning algorithms with Bayesian optimization. Autom. Constr. 2022, 140, 104331. [Google Scholar] [CrossRef]
- Tang, L.; Na, S. Comparison of machine learning methods for ground settlement prediction with different tunneling datasets. J. Rock Mech. Geotech. Eng. 2021, 13, 1274–1289. [Google Scholar] [CrossRef]
- Cao, Y.; Zhou, X.; Yan, K. Deep Learning Neural Network Model for Tunnel Ground Surface Settlement Prediction Based on Sensor Data. Math. Probl. Eng. 2021, 2021, 9488892. [Google Scholar] [CrossRef]
- Mamat, R.C.; Ramli, A.; Omar, M.B.H.C.; Samad, A.M.; Sulaiman, S.A. Application of machine learning for predicting ground surface settlement beneath road embankments. Int. J. Nonlinear Anal. Appl. 2021, 12, 1025–1034. [Google Scholar] [CrossRef]
- Phoon, K.; Zhang, W. Future of machine learning in geotechnics. Georisk Assess. Manag. Risk Eng. Syst. Geohazards 2023, 17, 7–22. [Google Scholar] [CrossRef]
- Mitelman, A.; Urlainis, A. Investigation of Transfer Learning for Tunnel Support Design. Mathematics 2023, 11, 1623. [Google Scholar] [CrossRef]
- Mitelman, A.; Yang, B.; Urlainis, A.; Elmo, D. Coupling Geotechnical Numerical Analysis with Machine Learning for Observational Method Projects. Geosciences 2023, 13, 196. [Google Scholar] [CrossRef]
- Wang, Z. Numerical Analysis of Deformation Control of Deep Foundation Pit in Ulanqab City. Geotech. Geol. Eng. 2021, 39, 5325–5337. [Google Scholar] [CrossRef]
- Yang, J.; Kong, D. Deformation of deep and large foundation pit in soft soil of Fuzhou Subway. Arab. J. Geosci. 2020, 13, 36. [Google Scholar] [CrossRef]
- Li, H.; Zhao, Z.; Du, X. Research and Application of Deformation Prediction Model for Deep Foundation Pit Based on LSTM. Wirel. Commun. Mob. Comput. 2022, 2022, 9407999. [Google Scholar] [CrossRef]
- Ji, Z.; Wang, B.; Deng, S.; You, Z. Predicting dynamic deformation of retaining structure by LSSVR-based time series method. Neurocomputing 2014, 137, 165–172. [Google Scholar] [CrossRef]
- Sun, Y.Y.; Xiao, H.J. Wall Displacement and Ground-Surface Settlement Caused by Pit-in-Pit Foundation Pit in Soft Clays. Ksce J. Civ. Eng. 2021, 25, 1262–1275. [Google Scholar] [CrossRef]
- Lai, J.; Zhou, H.; Wang, K.; Qiu, J.; Wang, L.; Wang, J.; Feng, Z. Shield-driven induced ground surface and Ming Dynasty city wall settlement of Xi’an metro. Tunn. Undergr. Space Technol. 2020, 97, 103220. [Google Scholar] [CrossRef]
- Song, J.; Ye, G.L.; Xu, Y.F.; Sun, D.A. Numerical simulation of long-term settlement of structural soft soil subgrade considering consolidation history. Rock Soil Mech. 2018, 39, 1037–1046. [Google Scholar]
- Xue, L.Y.; He, C.K. Prediction algorithm for settlement amplitude of Taizhou’s building foundation. J. Discret. Math. Sci. Cryptogr. 2018, 21, 233–237. [Google Scholar] [CrossRef]
- Wu, M.X. Analysis of the influence of pile foundation settlement of high-rise buildings on surrounding buildings. Arab. J. Geosci. 2020, 13, 822. [Google Scholar] [CrossRef]
- Castro, J.; Karstunen, M.; Sivasithamparam, N. Influence of stone column installation on settlement reduction. Comput. Geotech. 2014, 59, 87–97. [Google Scholar] [CrossRef]
- Tran, Q.H.; Nguyen, H.; Bui, X.N. Novel Soft ComputingModel for Predicting Blast-Induced Ground Vibration in Open-Pit Mines Based on the Bagging and Sibling of Extra Trees Models. CMES-Comp. Model. Eng. Sci. 2023, 134, 2227–2246. [Google Scholar]
- Schonlau, M.; Zou, R.Y. The random forest algorithm for statistical learning. Stata J. 2020, 20, 3–29. [Google Scholar] [CrossRef]
- Li, X.Y.; Li, W.D.; Xu, Y. Human Age Prediction Based on DNA Methylation Using a Gradient Boosting Regressor. Genes 2018, 9, 424. [Google Scholar] [CrossRef]
- Luo, H.R.; Cheng, F.; Yu, H.; Yi, Y.Q. SDTR: Soft Decision Tree Regressor for Tabular Data. IEEE Access 2021, 9, 55999–56011. [Google Scholar] [CrossRef]
- Ben Jabeur, S.; Gharib, C.; Mefteh-Wali, S.; Ben Arfi, W. CatBoost model and artificial intelligence techniques for corporate failure prediction. Technol. Forecast. Soc. Chang. 2021, 166, 120658. [Google Scholar] [CrossRef]
- Dutt, M.I.; Saadeh, W. A Multilayer Perceptron (MLP) Regressor Network for Monitoring the Depth of Anesthesia. In Proceedings of the 2022 20th IEEE Interregional NEWCAS Conference (NEWCAS), Quebec City, QC, Canada, 19–22 June 2022; pp. 251–255. [Google Scholar]
- Quinlan, J.R. Induction of Decision Trees. Mach. Learn. 1986, 1, 81–106. [Google Scholar] [CrossRef]
- Geurts, P.; Ernst, D.; Wehenkel, L. Extremely randomized trees. Mach. Learn. 2006, 63, 3–42. [Google Scholar] [CrossRef]
- Breiman, L. Random Forests. Mach. Learn. 2001, 45, 5–32. [Google Scholar] [CrossRef]
- Hoang, N.; Thanh, V.; Vo, T.P.; Huu-Tai, T. Efficient machine learning models for prediction of concrete strengths. Constr. Build. Mater. 2021, 266, 120950. [Google Scholar] [CrossRef]
- Manzoor, U.; Ehsan, M.; Radwan, A.E.; Hussain, M.; Iftikhar, M.K.; Arshad, F. Seismic driven reservoir classification using advanced machine learning algorithms: A case study from the Lower Ranikot/Khadro sandstone gas reservoir, Kirthar Fold Belt, Lower Indus Basin, Pakistan. Geoenergy Sci. Eng. 2023, 222, 211451. [Google Scholar] [CrossRef]
- Ostroumova, L.; Gusev, G.; Vorobev, A.; Dorogush, A.V.; Gulin, A. CatBoost: Unbiased boosting with categorical features. In Proceedings of the 31st International Conference on Neural Information Processing Systems, Long Beach, CA, USA, 4–9 December 2017. [Google Scholar]
- Chen, T.; Guestrin, C. XGBoost: A Scalable Tree Boosting System. In Proceedings of the 22nd ACM SIGKDD International Conference on Knowledge Discovery and Data Mining, San Francisco, CA, USA, 13–17 August 2016. [Google Scholar]
- Ke, G.; Meng, Q.; Finley, T.; Wang, T.; Chen, W.; Ma, W.; Ye, Q.; Liu, T. LightGBM: A Highly Efficient Gradient Boosting Decision Tree. In Proceedings of the 31st International Conference on Neural Information Processing Systems, Long Beach, CA, USA, 4–9 December 2017. [Google Scholar]
- Friedman, J.H. Greedy function approximation: A gradient boosting machine. Ann. Stat. 2001, 29, 1189–1232. [Google Scholar] [CrossRef]
- Duarte, E.; Wainer, J. Empirical comparison of cross-validation and internal metrics for tuning SVM hyperparameters. Pattern Recognit. Lett. 2017, 88, 6–11. [Google Scholar] [CrossRef]
- Zhou, J.; Shi, X.Z.; Du, K.; Qiu, X.Y.; Li, X.B.; Mitri, H.S. Feasibility of Random-Forest Approach for Prediction of Ground Settlements Induced by the Construction of a Shield-Driven Tunnel. Int. J. Geomech. 2017, 17, 04016129. [Google Scholar] [CrossRef]
- Averko, Z.; Vrankić, M.; Vlahinić, S.; Rogelj, P. Complex Pearson Correlation Coefficient for EEG Connectivity Analysis. Sensors 2022, 22, 1477. [Google Scholar]

Disclaimer/Publisher’s Note: The statements, opinions and data contained in all publications are solely those of the individual author(s) and contributor(s) and not of MDPI and/or the editor(s). MDPI and/or the editor(s) disclaim responsibility for any injury to people or property resulting from any ideas, methods, instructions or products referred to in the content. |
© 2024 by the authors. Licensee MDPI, Basel, Switzerland. This article is an open access article distributed under the terms and conditions of the Creative Commons Attribution (CC BY) license (https://creativecommons.org/licenses/by/4.0/).