Article

Effects of Epoxy Resin Value on Waterborne-Epoxy-Resin-Modified Emulsified Asphalt Mixture Performance

1
Zhejiang Huadong Engineering Consulting Co., Ltd., Hangzhou 310030, China
2
College of Civil Engineering, Hunan University, Changsha 410082, China
*
Author to whom correspondence should be addressed.
Appl. Sci. 2024, 14(4), 1353; https://doi.org/10.3390/app14041353
Submission received: 30 November 2023 / Revised: 29 January 2024 / Accepted: 1 February 2024 / Published: 6 February 2024

Abstract

:
Although research shows that waterborne epoxy resin emulsified asphalt (WER-EA) is an environmental protection material with potential high resistance to multiple types of pavement distress, its performance is rather complicated and much affected by the curing agent and epoxy resin value. This paper serves as a follow-up study to the preliminary published research on evaluating the impact of the epoxy value and common curing agents on the performance of asphalt mixtures. Four groups of emulsified asphalt were filtered out to prepare mixture samples, and laboratory tests on mixture performance under high and low temperatures were conducted. Specifically, Marshall and rutting tests were conducted for evaluating mixture resistance to rutting under high temperatures, and indirect tensile tests were conducted to indicate resistance to cracking at low temperatures. Water stability performance was also assessed by comparing the mixture properties before and after water absorption. The results showed that the mixture with an epoxy value of 20 and curing agents using triethylenetetramine (TETA) had the best overall performance among the investigated mixtures, with the highest resistance to high-temperature deformation and water damage. However, more research should be conducted to improve the low-temperature resistance to cracking for WER-EA mixtures.

1. Introduction

1.1. Research Background

Pavement infrastructure is facing the demands raised by increasing traffic flow, heavier wheel loads, and the changing environment [1,2,3]. Additionally, governments around the world have published (or are publishing) their plans for achieving carbon neutrality before or around 2050 [4,5]. These industrial changes and policy requirements are urging researchers to develop sustainable pavement engineering, especially with high-performance materials and low-carbon-emission construction methods [6,7]. Previous studies have shown that emulsified asphalt can offer benefits such as improved workability, reduced energy consumption, enhanced resistance to cracking and rutting, and an extended service life [8,9].

1.2. Research Scope

Emulsified asphalt, which initially appeared in the 1930s as an anionic emulsion and has developed rapidly since the 1950s thanks to cationic asphalt emulsions solving the poor adhesion between anionic emulsions and aggregates [10], has been widely used in pavement construction and maintenance due to its favorable viscosity while compacting mixtures at lower temperatures than hot mixes [8]. This means that the construction process requires less energy consumption and seldom produces poisonous asphalt smoke [11].
The problems of emulsified asphalt, namely its fast aging, weak adhesion, and unremarkable high- and low-temperature performance, can be overcome by modifiers such as styrene butadiene styrene (SBS) and styrene–butadiene rubber (SBR) [12]. Nevertheless, investigations show that although the addition of SBS dramatically improves the mixture performance, SBS emulsified asphalt is hard to produce and store with high reliability. SBR emulsified asphalt, on the other hand, can improve the mixture performance at low temperatures but fails to meet the performance requirements in high-temperature zones [13].
In recent years, researchers introduced the water epoxy resin system to modify emulsified asphalt [14]. The water epoxy resin system changes the dissolution state of epoxy resin through physical and chemical methods, resulting in a continuous phase of waterborne emulsion. When needed, curing agents are added to the waterborne emulsion, and the curing reactions in the system produce a solidification product with a linear or three-dimensional network structure, depending on the type and content of curing agents [15]. Waterborne epoxy resins have several advantages: (1) they are environmentally friendly, non-toxic, and have no risk of combustion or explosion; (2) they are low-cost because they use water as a solvent; (3) they have the ability to cope with a wide range of external environments to cure at room temperature, under high humidity, and even at low temperatures; and (4) the cured material has suitable bonding properties [16].
Initially, the system was mainly applied in the coatings industry. Its advantages and performance in recent applications for modifying emulsified asphalt have attracted many researchers [17,18]. However, waterborne epoxy resin emulsified asphalt and its mixture performance are complicated because the formation and breakage of emulsification, the emulsion and curing of water epoxy resin, the evaporation of water, the modification of asphalt, the bonding between asphalt and aggregates, the possible addition of cement, and the interactions between all these physical and chemical reactions must be considered [8]. Specifically, the curing agents and epoxy value are two significant factors that greatly impact the performance of WER-EA. Preliminary research has been published investigating the impact of three curing agents (TETA\DETA\593) with obvious differences in the molecular chain length and number of active groups [19]. However, more research should be conducted considering the potential benefits and complexity of WER-EA, especially the performance of asphalt mixtures.

1.3. Preliminary Research

In the preliminary study, WER emulsified asphalts at 0%, 5%, 15%, and 20% of the mass of the emulsified asphalt were prepared with three different curing agents (TETA/DETA/593) [19]. The effects of the curing agents on the high-temperature and low-temperature rheological properties of WER-EA were studied by conventional properties tests (permeability, ductility, and softening point); a DSR (Dynamic Shear Rheometer); and a BBR (Bending Beam Rheometer). In addition, the microstructure of the WER-EA evaporation residue was studied by SEM (Scanning Electron Microscopy) and FTIR (Fourier Transform Infrared Spectroscopy).
The research found that the addition of the WER system made the emulsified asphalt produce a three-dimensional network structure, which significantly improved the high-temperature performance and decreased the temperature sensitivity of the emulsified asphalt. Conversely, the low-temperature performance of the WER emulsified asphalt deteriorated. This indicates that the high performance of WER emulsified asphalt makes it more suitable as an adhesive for micro-surfacing or cold-mix asphalt used under heavy-load traffic in medium- and high-temperature areas. The curing agent TETA had the greatest impact on WER emulsified asphalt at a high temperature, while 593 had the least adverse influence on the low-temperature performance.
The results in the preliminary research demonstrated that the more active groups in the curing agent, the higher the crosslinking degree and complexity of the three-dimensional network structure in the WER emulsified asphalt, leading to better high-temperature performance. The longer the molecular chain of the curing agent, the more flexible chains in the WER emulsified asphalt, leading to better flexibility.

1.4. Research Purpose

This study serves as a follow-up to the published preliminary research and completes this research series at the asphalt mixture level. It was implemented by designing and conducting laboratory experiments to evaluate the impact of the epoxy value and curing agents on the performance of asphalt mixtures. The laboratory experiments involved the Marshall stability test and rutting test for mixture performance evaluation under high temperatures, the indirect tensile test for evaluation under low temperatures, and the immersion Marshall test and freeze–thaw splitting test for evaluation of water stability. The results of this study may help in understanding the mechanisms of WER-EA mixtures and provide a reference for the design and construction of water epoxy resin emulsified asphalt mixtures.

2. Methodology

This study was conducted according to the procedure illustrated in Figure 1. The whole procedure consisted of two parts: the investigation of asphalt properties (in green-dash box) and mixture properties (in the blue-dash box). The investigation of asphalt properties was conducted following Ref. [19]. This paper concentrates on the second part of this study—the investigation of selected groups of mixtures.
The published research on asphalt properties recommends that WER-EA is applied in high temperature zones. However, before application, a validation of mixture properties is necessary. Thus, this study investigated WER-EA mixture performance in the recommended high-temperature zones. According to the performance analysis in previously published research, the use of the curing agent TETA improves WER-EA comprehensive performance; therefore, we selected E20-T, E44-T, and E51-T for preparing the mixtures, using the unmodified emulsified asphalt mixture as a control group, and conducted a series of laboratory tests to investigate the road performance of various mixtures under the optimum asphalt dosage. According to the results of the performance tests in previous research, the dosages of the three WER systems in the WER-EA mixtures were all controlled at 15% of the emulsified asphalt mass.

2.1. Materials

2.1.1. Asphalt Matrix

The asphalt matrix in this study contained 70# petroleum asphalt (abbreviated as 70#), and its performance indicators are presented in detail in Table 1.
Cationic emulsified asphalt was used for the test. The emulsified asphalt was made from the 70# asphalt matrix. Table 2 shows the physical properties of the emulsified asphalt.

2.1.2. WER and Curing Agents

At present, the most widely used waterborne epoxy resin (hereinafter referred to as WER in road engineering is bisphenol A. In this paper, three commonly used WERs with epoxy values of 0.2 eq/100 g, 0.44 eq/100 g, and 0.51 eq/100 g were selected to prepare modified emulsified asphalt, which were named E20, E44, and E51, respectively. The WER used in this paper was produced by ChemChina (Beijing, China), and the performance of the three WERs is provided in Table 3.
Aliphatic amine curing agents have the advantages of good miscibility with WER, a simple curing process, and high-performance curing products, and they are the most widely used curing agents in road engineering. Diethylenetriamine (DETA), modified diethylenetriamine (593), and triethylenetetramine (TETA) are commonly used aliphatic amine curing agents that can impart good mechanical, heat, and water resistance to WER-EA cured products. These three curing agents have similar functional groups, but the three-dimensional structure of the molecule and the number of active groups are significantly different. The curing agents used in this study were produced by ChemChina, and the properties of the three curing agents are shown in Table 4.

2.1.3. Aggregates

The aggregates used in this study can be divided into coarse and fine aggregates, both procured from the Bauhinia Factory of Yunzhong Science and Technology in Changsha, China. These aggregates underwent testing in accordance with the relevant test specifications, and the corresponding test results and index requirements are presented in Table 5, Table 6, Table 7 and Table 8.

2.2. Mix Design

2.2.1. Asphalt Mixture Grading

WER-EA is mostly used for cold patching. The potholes in China’s highways are generally at a depth of 3–5 cm, and according to experience, they are more suitable for aggregates with a maximum nominal particle size of 13.2 mm. A high proportion of coarse aggregate can better improve the high-temperature performance of the mixture, but at the same time, it brings the problem of high porosity and poor resistance to water damage. Mixtures with a high content of fine aggregates have better water resistance, but their resistance to rutting is weakened to a certain extent. Therefore, to obtain a WER-EA mixture with higher internal friction and higher overall strength, its gradation needs to be optimized.
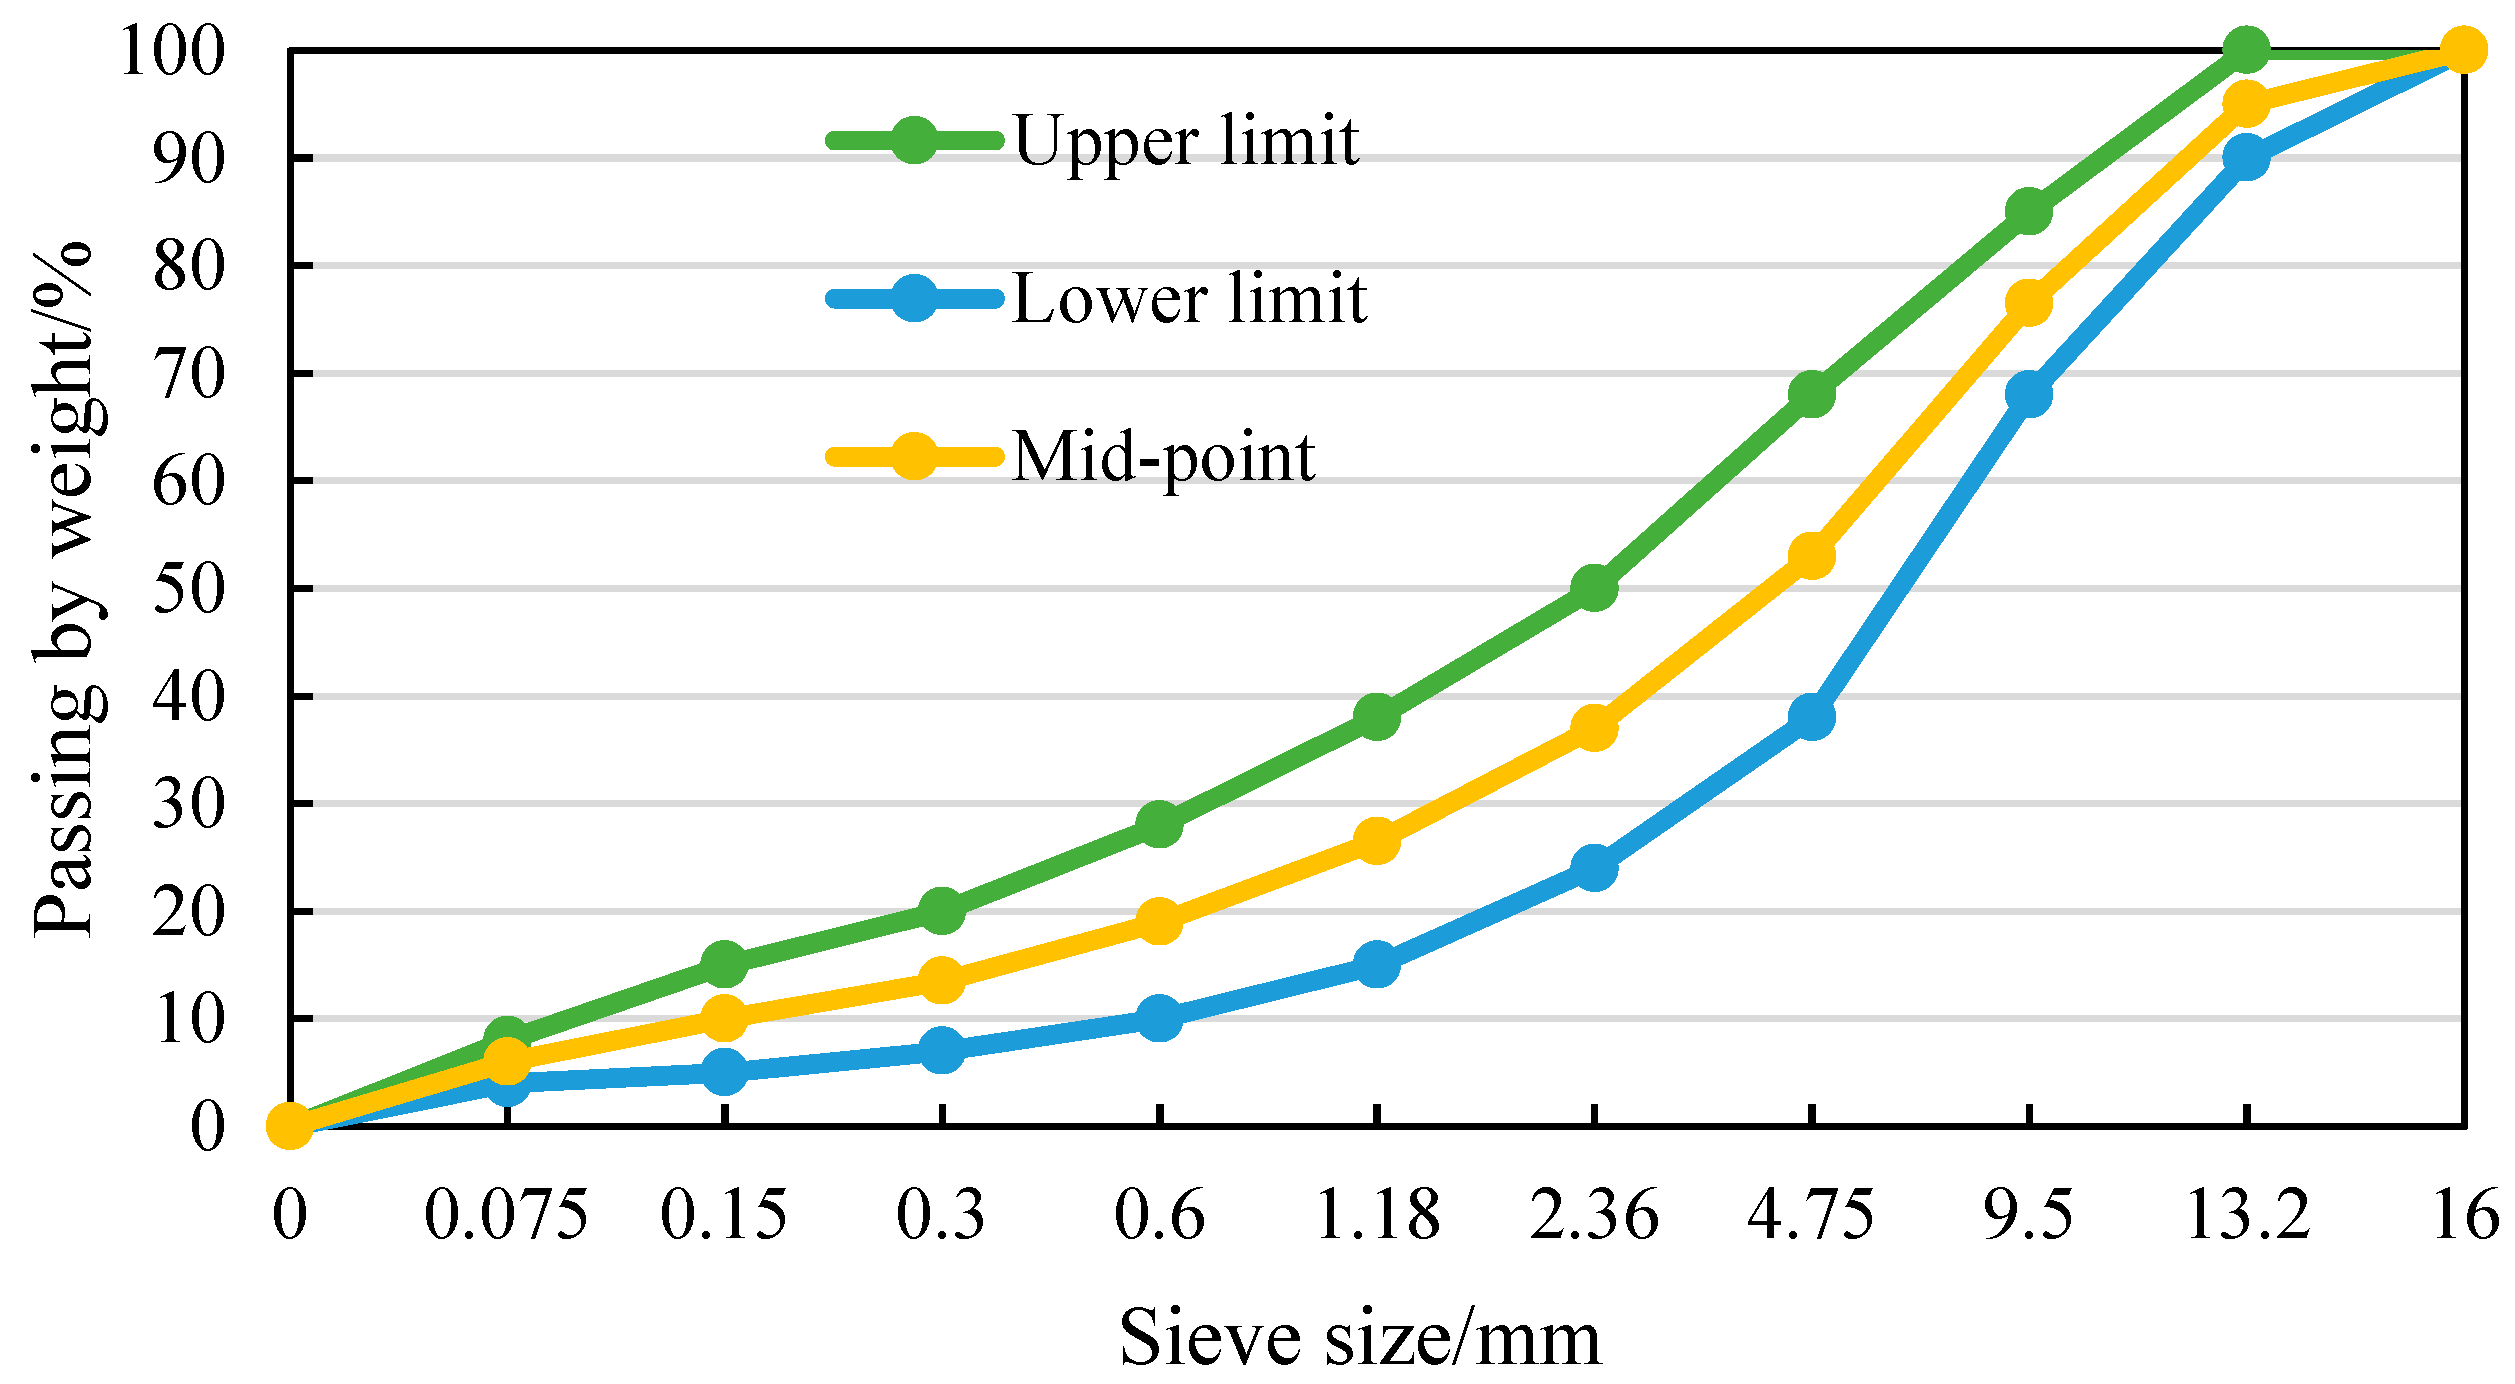
In this study, an AC-13 mixture featuring a dense gradation suspension structure was selected. The design of the aggregate gradation curve adhered to the median gradation values as specified in AASHTO M 323 Ref. [40]. Table 9 presents these median values of the design gradation. Figure 2 provides a schematic representation of the design gradation curve utilized in our research.

2.2.2. Determination of Optimal Water Consumption

The addition of water plays a very important role in the mixing process of emulsified asphalt mixtures. Soaking the aggregate before adding the emulsified asphalt is conducive to the uniform mixing of the mixture. The amount of water added affects the coating of the emulsified asphalt and ultimately impacts the strength of the mixture. In this study, the optimal water consumption was determined by analyzing the appearance of the mixture under different amounts of applied water.
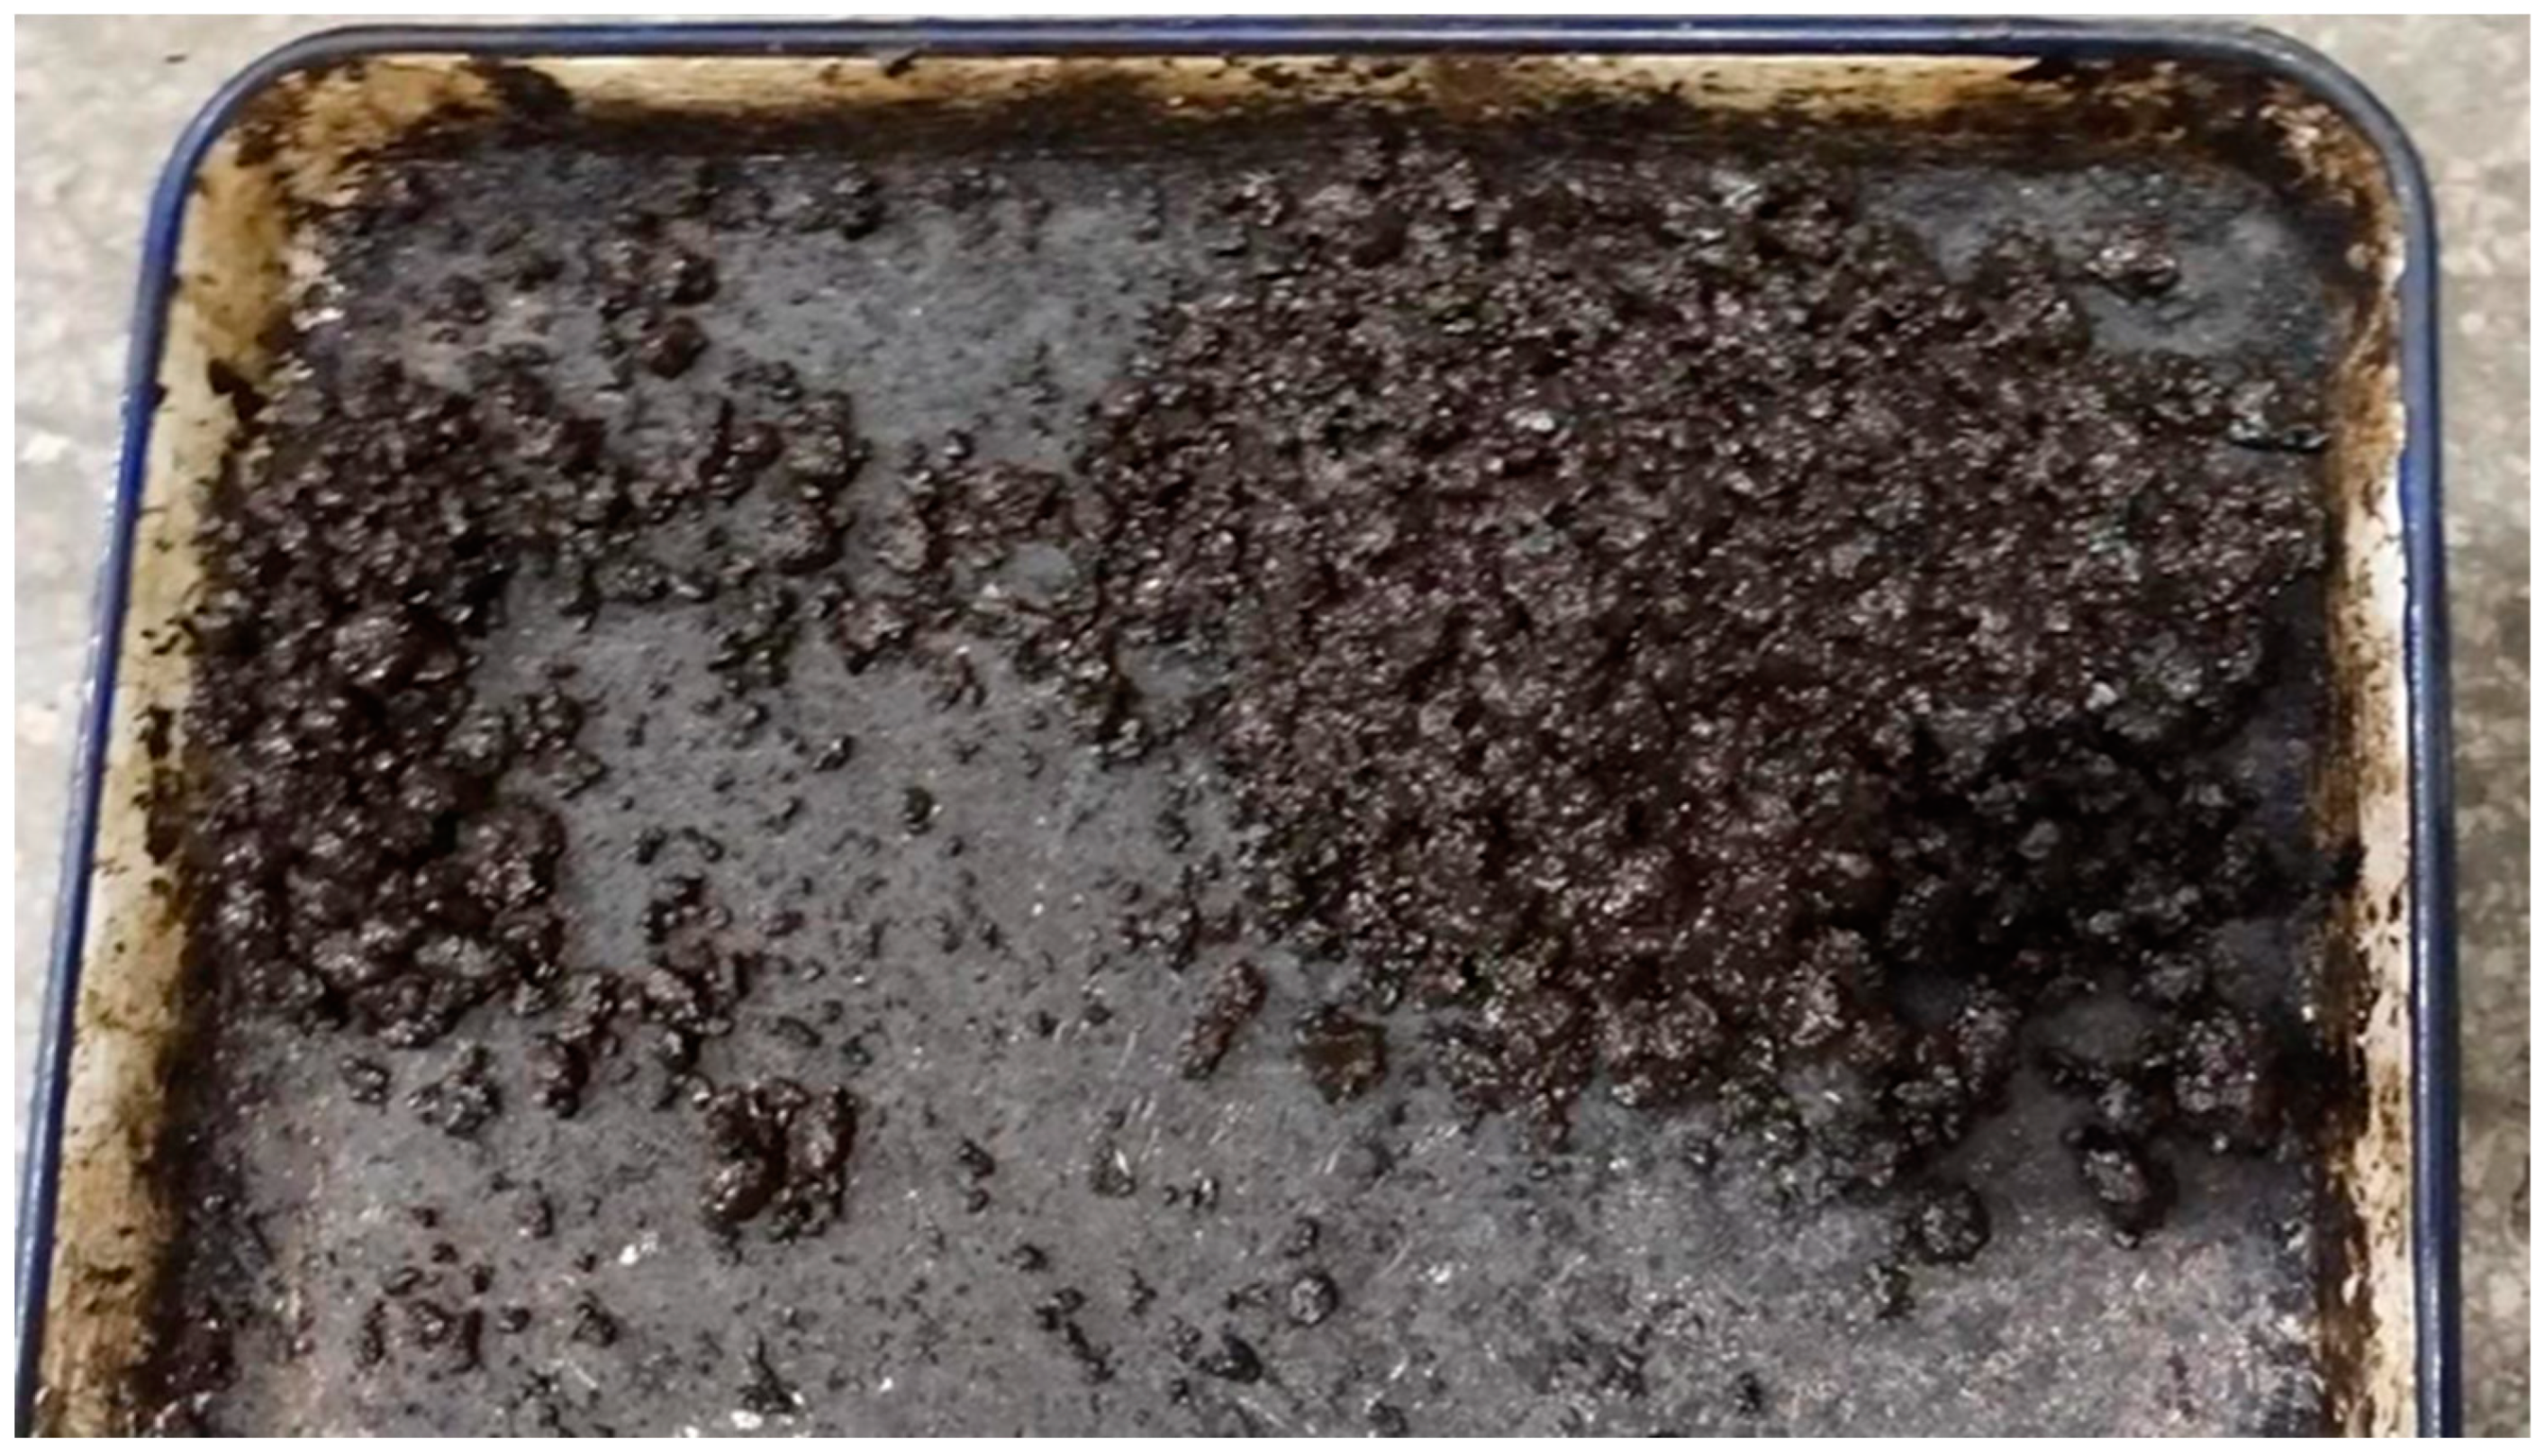
As shown in Figure 3, when the amount of external water was appropriate, the aggregate was uniformly coated with (modified) emulsified asphalt, the mixture appeared uniformly black without the primary color aggregate exposed, and there was no agglomeration. In addition, the mixture exhibited a moist sheen, but no moisture or emulsion escaped. After several cycles of trial tests, the optimal water consumption was determined at 3–3.5% of the aggregate mass.

2.2.3. Determination of the Optimal Amount of Asphalt

The appropriate amount of asphalt is crucial for the mixture’s strength. In this study, the initial emulsion dosage was determined based on the optimal fluid volume analysis formula for the emulsified asphalt mixture, as recommended by the Cationic Emulsified Asphalt Project Collaboration Group of AASHTO.
P = 0.06 A + 0.12 B + 0.2 C
where P stands for the percentage of the mass of the emulsion and the (dry) ore; A represents the percentage of ore and total ore with a particle size of more than 2.36 mm; B indicates the percentage of 2.36~0.075 mm particle size in the total amount of ore; and C stands for the percentage of the rest of the ore in the total amount of ore.
After calculation, the initial emulsion dosage was set at 8.7%. Since this dosage was not the actual optimal dosage of emulsion, four groups of emulsion dosages were designed with a difference of 0.5% on the basis of the 8.7% value, namely 7.7%, 8.2%, 8.7%, and 9. Five groups of emulsion dosages of 0.2% and 9.7% were tested, and the optimal emulsion dosage was determined by the Marshall test. For each mixture with the same amount of emulsion, three parallel specimens were prepared at the same time to reduce the error caused by the test.
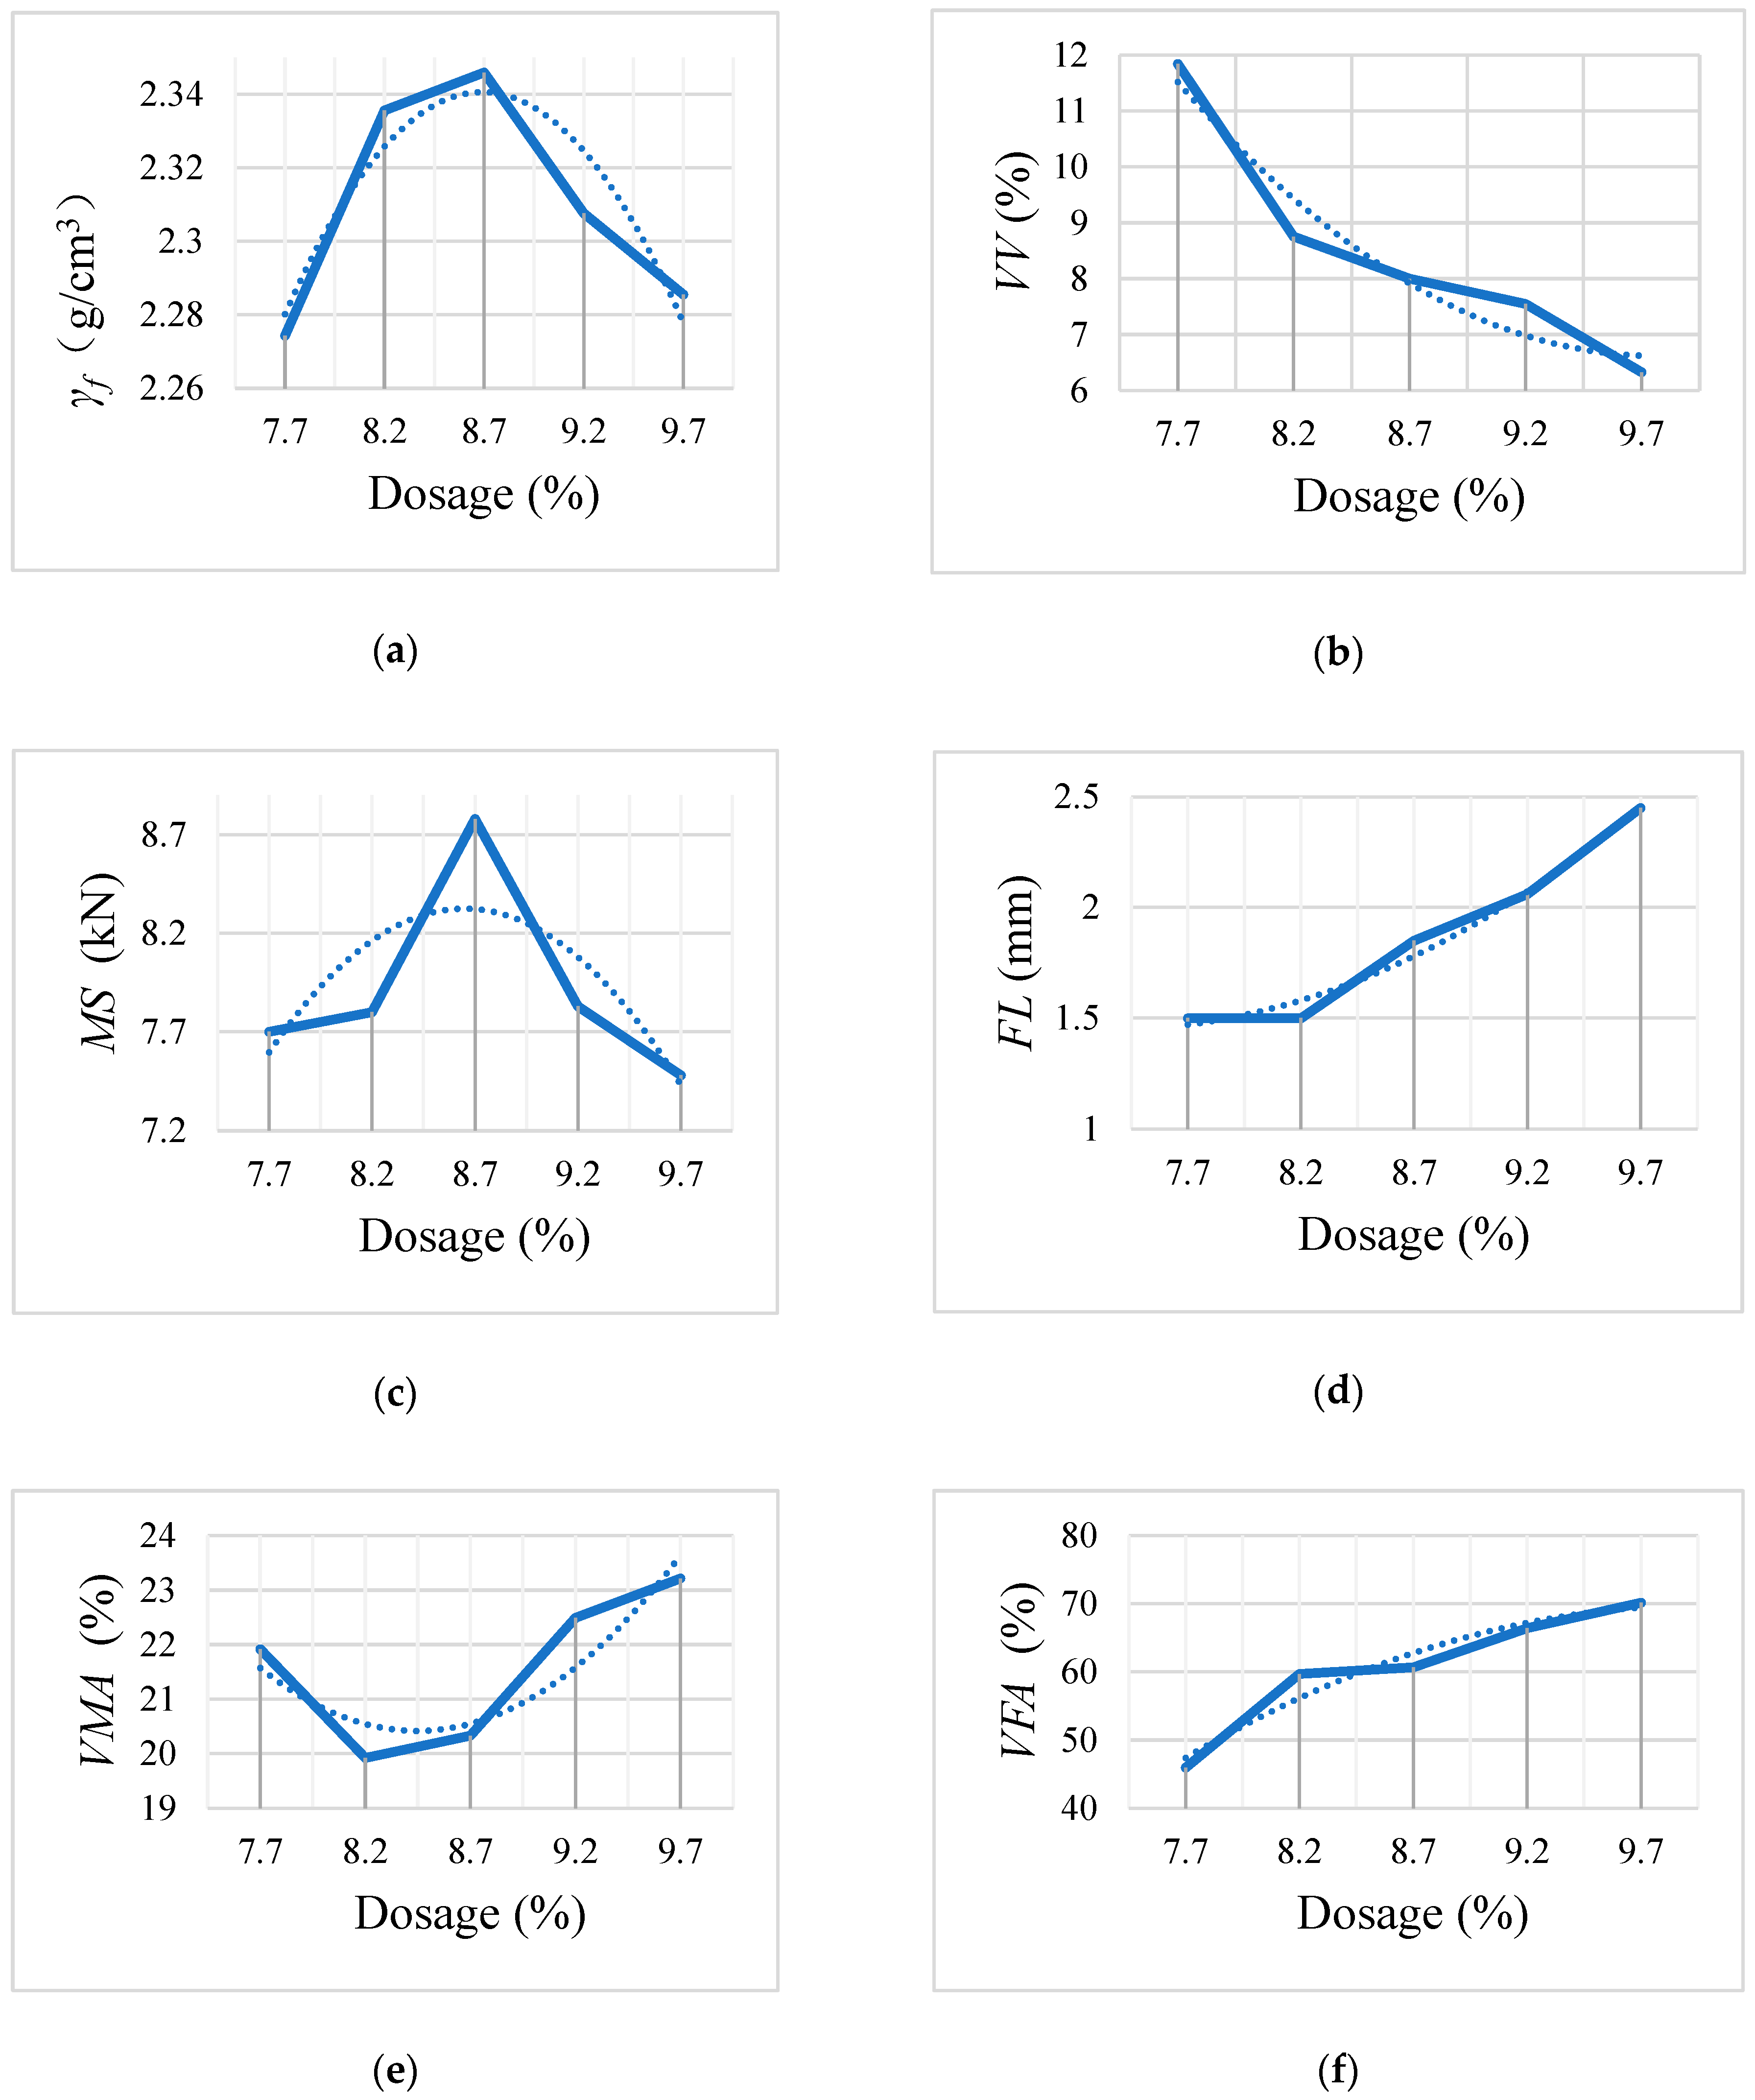
Taking the E20-T mixture as an example, Figure 4 shows the relative density ( γ f ), Marshall stability (MS), flow value (FL), volume of void space (VV), voids in mineral aggregates (VMA), and voids filled with asphalt (VFA).
The optimal asphalt content (OAC) was calculated based on the test data of γ f , MS, VV, and VFA, and the calculation formula is shown as follows:
O A C 1 = a 1 + a 2 + a 3 + a 4 / 4
O A C 2 = ( O A C m i n + O A C m a x ) / 2
where a 1 , a 2 , a 3 , and a 4 are the emulsion dosages corresponding to the maximum value of γ f , the maximum value of MS, the median value of VV, and the median value of VFA, respectively.
In this study, a 1   = 8.7%, a 2   = 8.7%, and a 3   = 8.1%. Since the specification requires the VFA to be larger than 65%, the a 4 value was the median value after VFA ≥ 65%, corresponding to the emulsion dosage of 9.35%. After calculation, the O A C 1 value was 8.71%. To calculate O A C 2 , it is first necessary to make sure that the MS value, FL value, VV value, and VFA value are within the requirements of the specification. Under this premise, the emulsion dosages corresponding to the minimum and maximum values of the four indicators are O A C m i n and O A C m a x , respectively. The maximum values of the four indicators obtained from Figure 4 are shown in Table 10. The final O A C m i n = 8.95% and O A C m a x = 9.7%, so the O A C 2 value was (8.95%+9.7%)/2 = 9.33%. The OAC of the E20-T mixture obtained from the equation was O A C 1 + O A C 2 2 = 9.02%.
Following the same steps, the optimal emulsion dosages of the EA, E-44-T, and E51-T mixtures were calculated with results of 9.07%, 8.97%, and 9.00%, respectively. Considering the small differences and accuracy during the experiments, all Marshall specimens were prepared at an optimal emulsion dosage of 9% for the four mixtures. The corresponding parameters were analyzed, and the results are shown in Table 11. The indexes of the four mixtures met the requirements of the corresponding regulations.

2.3. Mixture Preparation Process

2.3.1. Mixing Procedure

The specific mixing process adopted in this study was conducted as follows: 1. pour the coarse and fine aggregates into the mixing pot for preliminary stirring; 2. add a small amount of water that just wets the surface of the aggregate and mix evenly; 3. add the pre-weighed emulsified asphalt or WER-EA and mix evenly (for 60–90 s); 4. finally, add the mineral powder and mix evenly. In order to avoid the demulsification of the emulsified asphalt and the scrapping of the specimen, the total mixing time of the mixture was controlled at 2–3 min.

2.3.2. Molding Method

After the mixing was completed, the preparation of the corresponding performance test specimens was carried out immediately. In terms of rutting plates, the specimen was prepared following the procedure in AASHTO T 324 [41], as the temperature was moderate and the curing time was sufficiently long.
In terms of the Marshall specimens, in contrast to the hot-mix asphalt mixture, the WER-EA mixture required demulsification and curing before developing stable performance; furthermore, the compaction method of ordinary hot-mix asphalt mixtures is prone to the problems of looseness and slightly insufficient cohesion, and the existing standard Marshall specimen forming scheme was not applicable. In this study, according to the specimen molding method provided by the project collaboration group “Research on cationic emulsified asphalt and its road performance research” within the Ministry of Communications, the compaction molding method was as follows: 50 compactions on both sides of the mixture, and then 25 secondary double-sided compactions after a period of health under certain conditions.

2.3.3. Marshall Specimen Health Conditions

The results showed that the high temperature caused the emulsified asphalt to quickly separate into water and oil and the water to evaporate, and the WER system became deformed due to the evaporation of the water wrapped in it during the curing process, which eventually caused more holes in the WER-EA mixture. WER-EA mixtures are usually applied in cold-mix construction, but their performance is stable at room temperature and takes a long time, so room-temperature curing is not fully suitable for laboratory conditions. In view of the curing temperature used in the forming of the rut plate and previous research experience, this study finally determined the following Marshall specimen forming method: 1. compaction of the mixture on both sides 50 times; 2. curing at a healthy temperature of 60 °C for 24 h; 3. compaction on both sides 25 times; 4. demolding after 12 h at room temperature; 5. Marshall test can be carried out after maintaining the temperature at room temperature for no less than 48 h.

2.4. Mixture Performance Testing Methods

2.4.1. High-Temperature Performance Tests

In this study, Marshall and rutting tests were used to evaluate the high-temperature performance of WER-EA mixtures. Standard Marshall specimens were prepared and cured according to the molding method in Section 2.3.2. According to the requirements of ASTM D6927 [42], the specimen should be allowed to stand for 30~40 min in a 60 °C constant-temperature water bath before measuring the Marshall stability of the specimen. The loading speed of this test was 50 mm/min ± 5 mm/min.
The rutting specimen was rolled according to ASTM D2041 [43], and the height of the formed rutting plate was 5 cm, with the length and width both at 30 cm. After curing at room temperature for 48 h, the rutting plate could be cured at a constant temperature of 60 °C for 5 h or more according to AASHTO T 324 [41]. The wheel pressure was 0.7 MPa, the round-trip rolling rate was 42 times/min ± 1 time/min, and the rolling time was 60 min.

2.4.2. Low-Temperature Performance Tests

Indirect tensile tests were conducted to evaluate the low-temperature properties of WER-EA mixtures. The test procedure was carried out according to ASTM D6931 [44]. The specimen was kept incubated in a constant-temperature airbox at −10 °C ± 0.5 °C for 6 h or more, and the load loading rate was 1 mm/min.

2.4.3. Asphalt Mixture Water Stability Performance Test

The water stability of WER-EA mixtures was characterized by the index of retained strength (IRS) and freeze–thaw tensile strength ratio (TSR) obtained by immersion Marshall and freeze–thaw splitting tests.
Before the immersion Marshall test, the standard Marshall specimens were divided into two groups, which were placed in a 60 °C constant-temperature water bath for 48 h or 30~40 min. After the insulation of the specimen was completed, the stability of the specimen was measured by a Marshall stability meter, and the IRS value was calculated.
To carry out the freeze–thaw splitting test, the specimens needed to be divided into two groups, A and B. Group A was cured at room temperature, and group B was cured according to AASHTO T283. After the curing was completed, the specimens A and B were placed in a water bath at 25 °C ± 0.5 °C for 2 h. Then, the indirect tensile splitting test was carried out, and the TSR values were calculated.

3. Results and Discussion

3.1. High-Temperature Performance

3.1.1. Marshall Stability Test

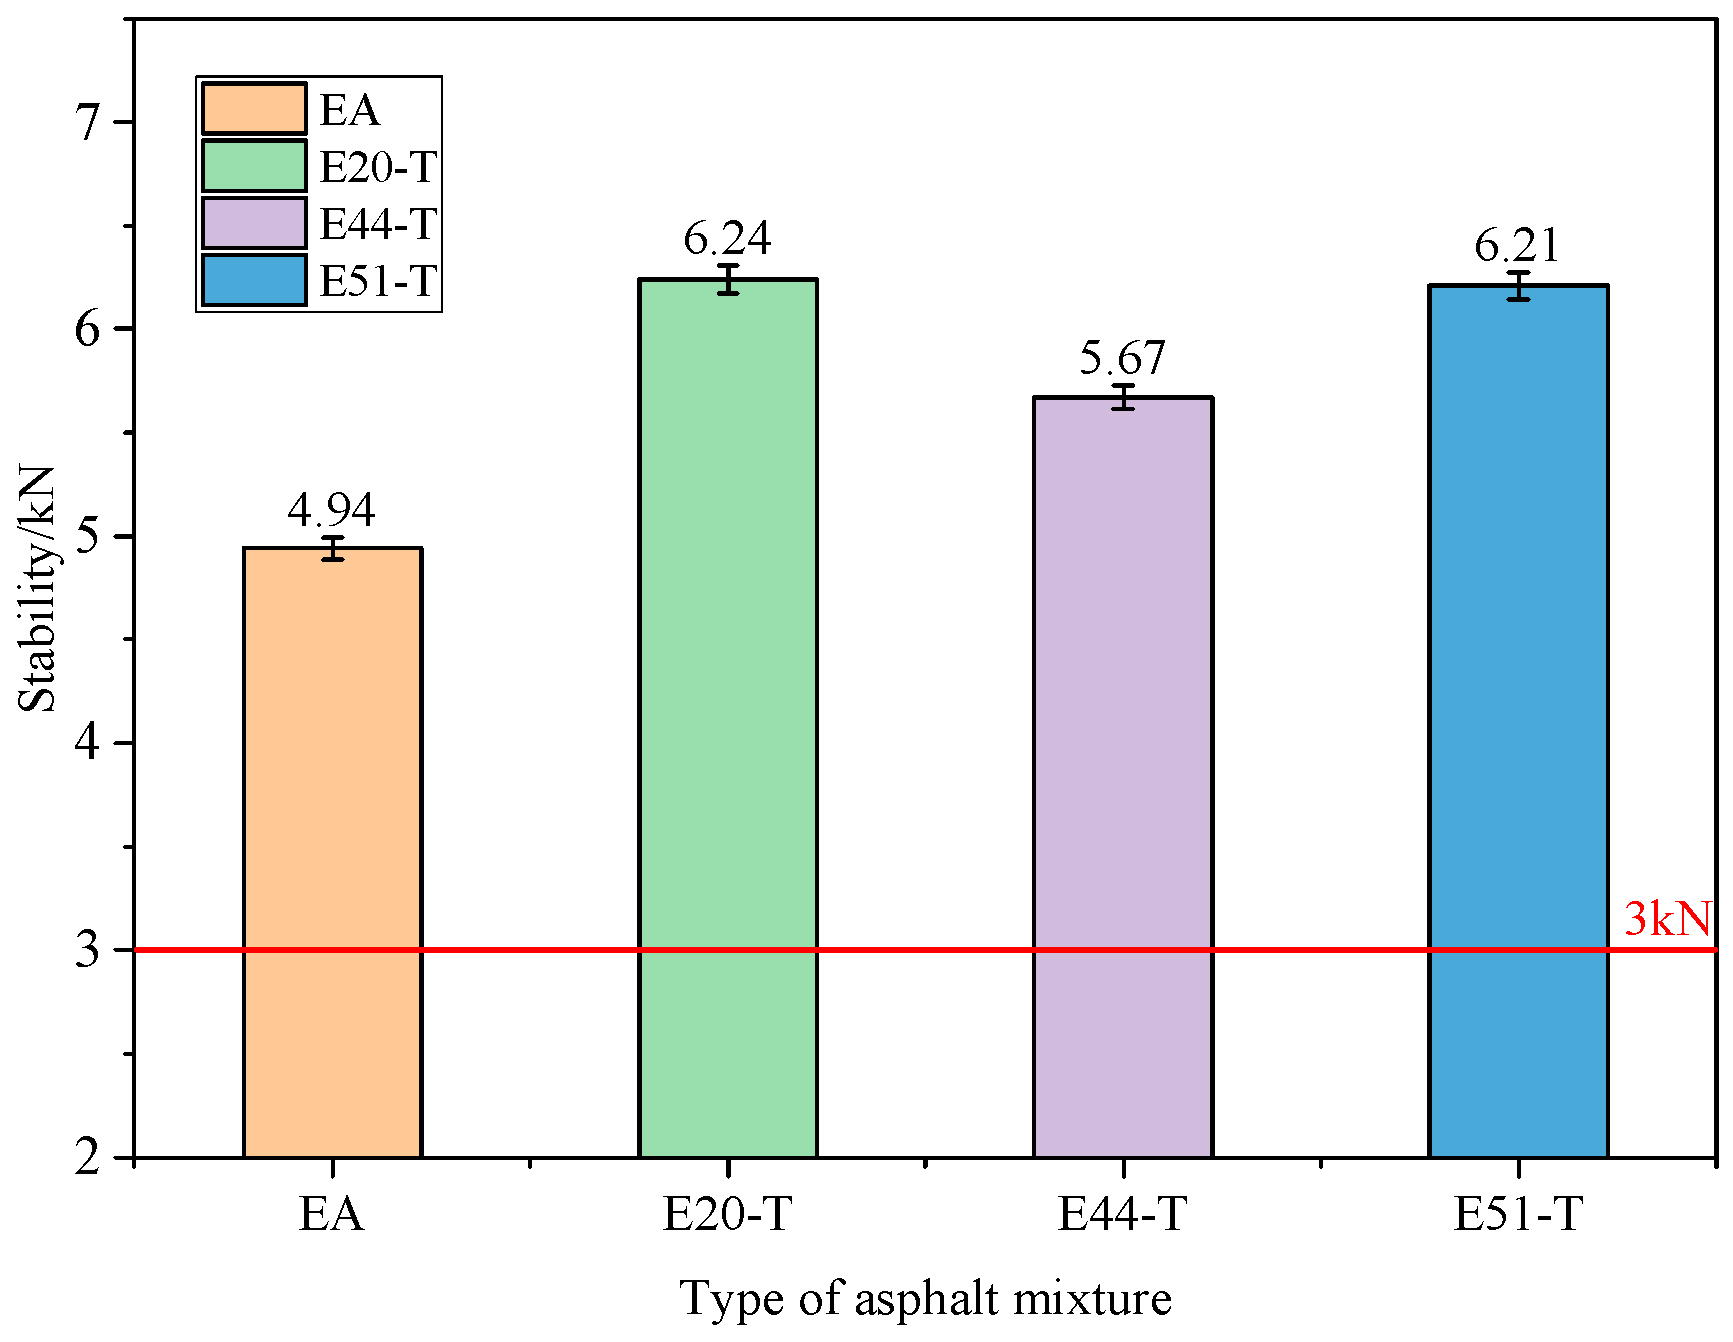
The Marshall stability (MS) test results for the four types of mixtures are shown in Figure 5. The MS values in all four groups were greater than 3 kN, which is the requirement of the specification. The MS values of the three WER-EA mixtures were higher than that of the pure emulsified asphalt mixture. The MS values of E20-T, E44-T, and E51-T increased by 26.32%, 14.78%, and 25.71%, respectively, based on the MS values of the emulsified asphalt. Among the WER-EA mixtures, the MS value of E20-T was the largest, and the MS value of E44-T was the smallest. The MS of the E20-T group was 10.01% higher than that of the E44-T group. This indicates that given the curing agent TETA, the WER system can improve the strength of the emulsified asphalt mixture, and the improvement effect is most obvious when the epoxy value is set at 20.
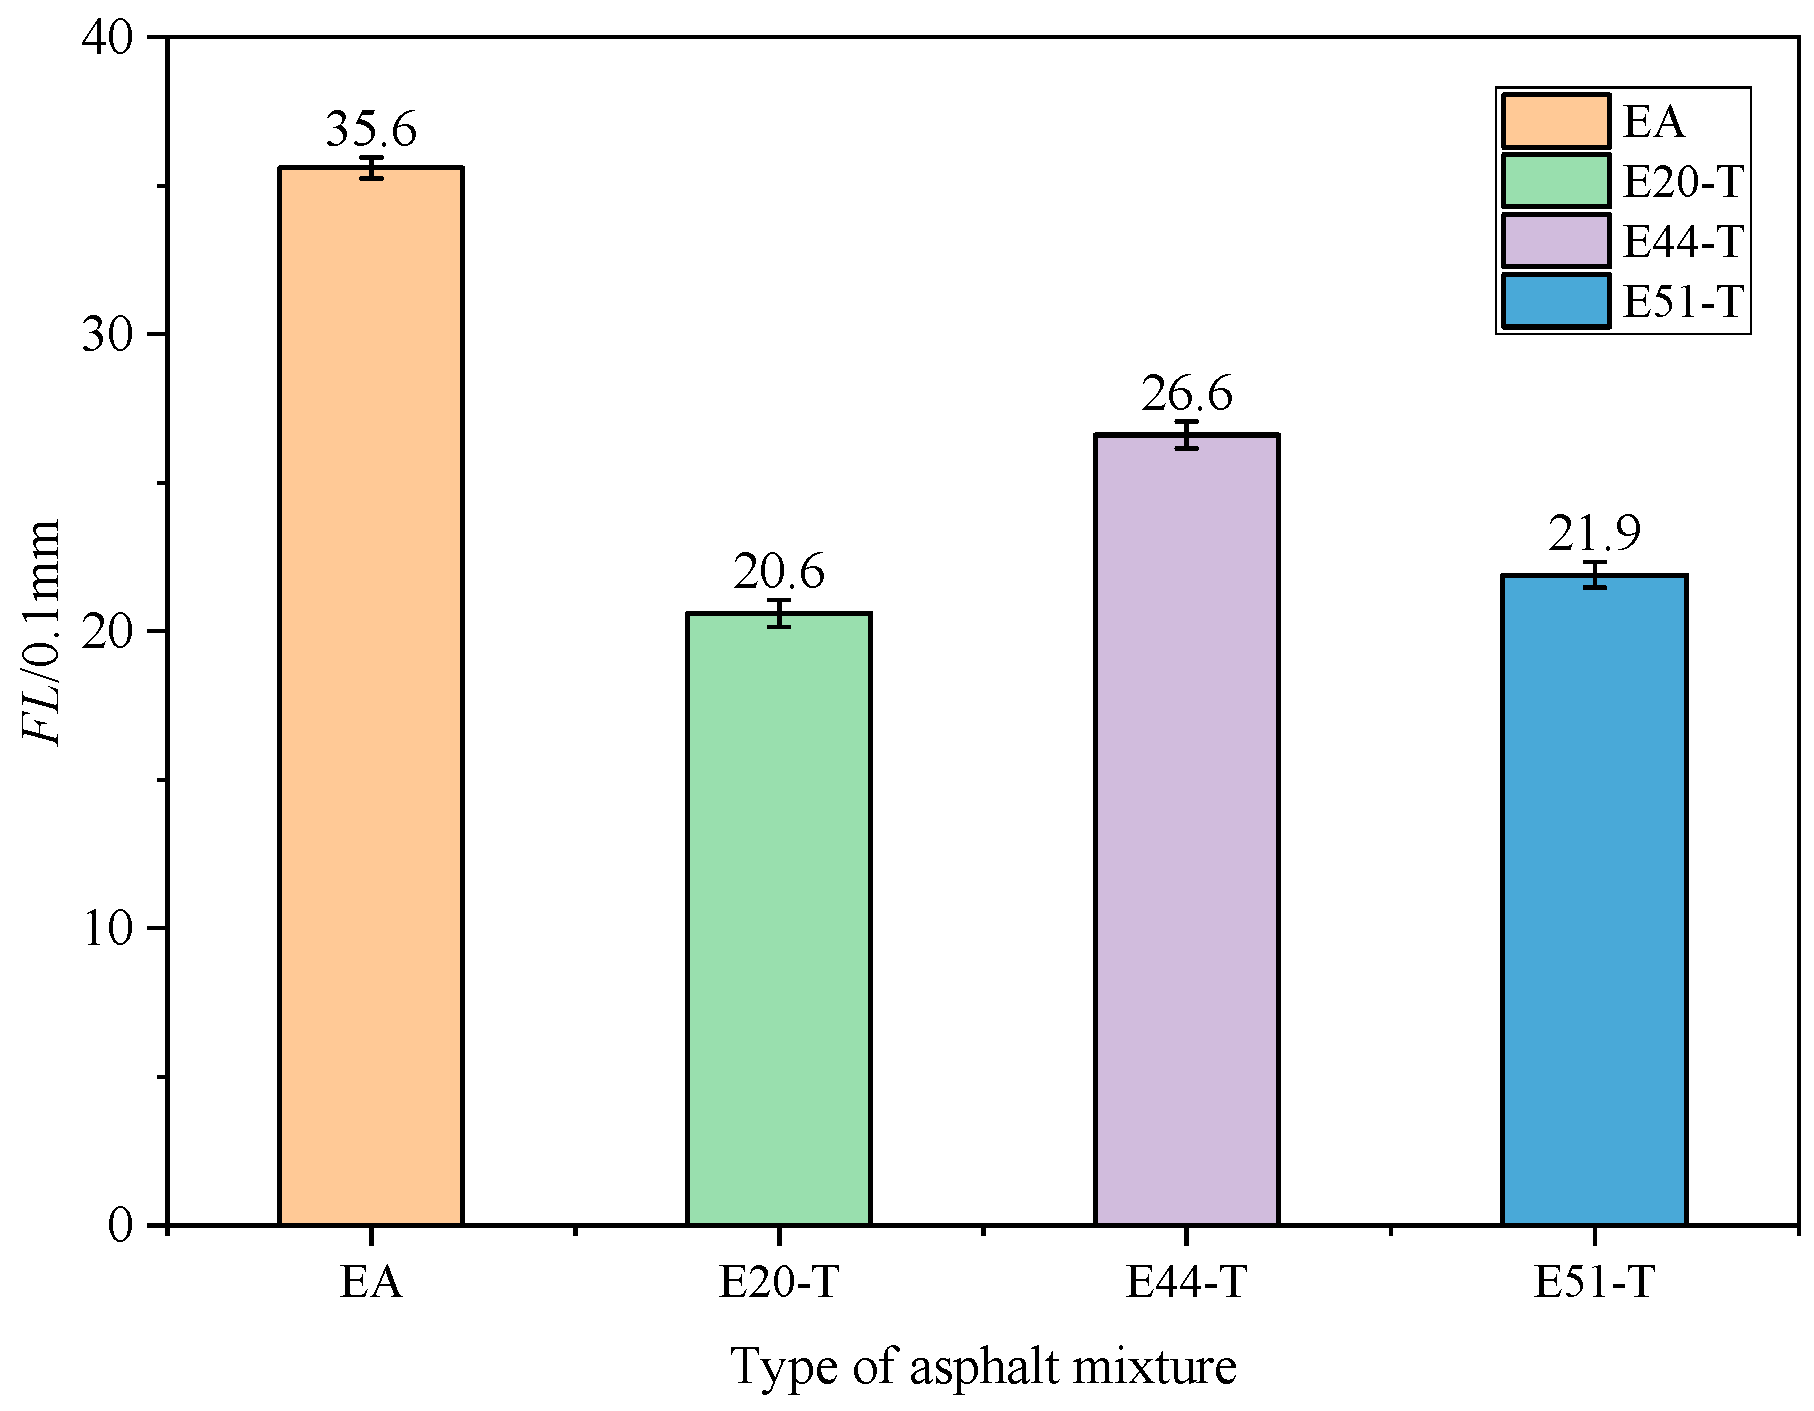
As shown in Figure 6, the flow (FL) values of the four emulsified asphalts were all in the range of 1.5–4 mm. Compared with the FL value of EA, the FL value of WER-EA was reduced to varying degrees, and the four FL values were within the specification limit. Compared with EA, the FL values of E20-T, E44-T, and E51-T were reduced by 42.13%, 25.28%, and 38.48%, respectively. Among them, the FL value of E20-T was the smallest, being 29.13% lower than that of E44-T. Previous studies indicate that the larger the MS value of the specimen, the smaller the FL value. Combining Figure 5 and Figure 6 indicates that the results in this study obeyed the same patterns observed in previous studies.
Compared with other Marshall test indexes, the Marshall modulus (T, kN/mm) can clearly characterize the high-temperature performance of WER-EA mixtures, and the results are calculated as follows:
T = M S / F L
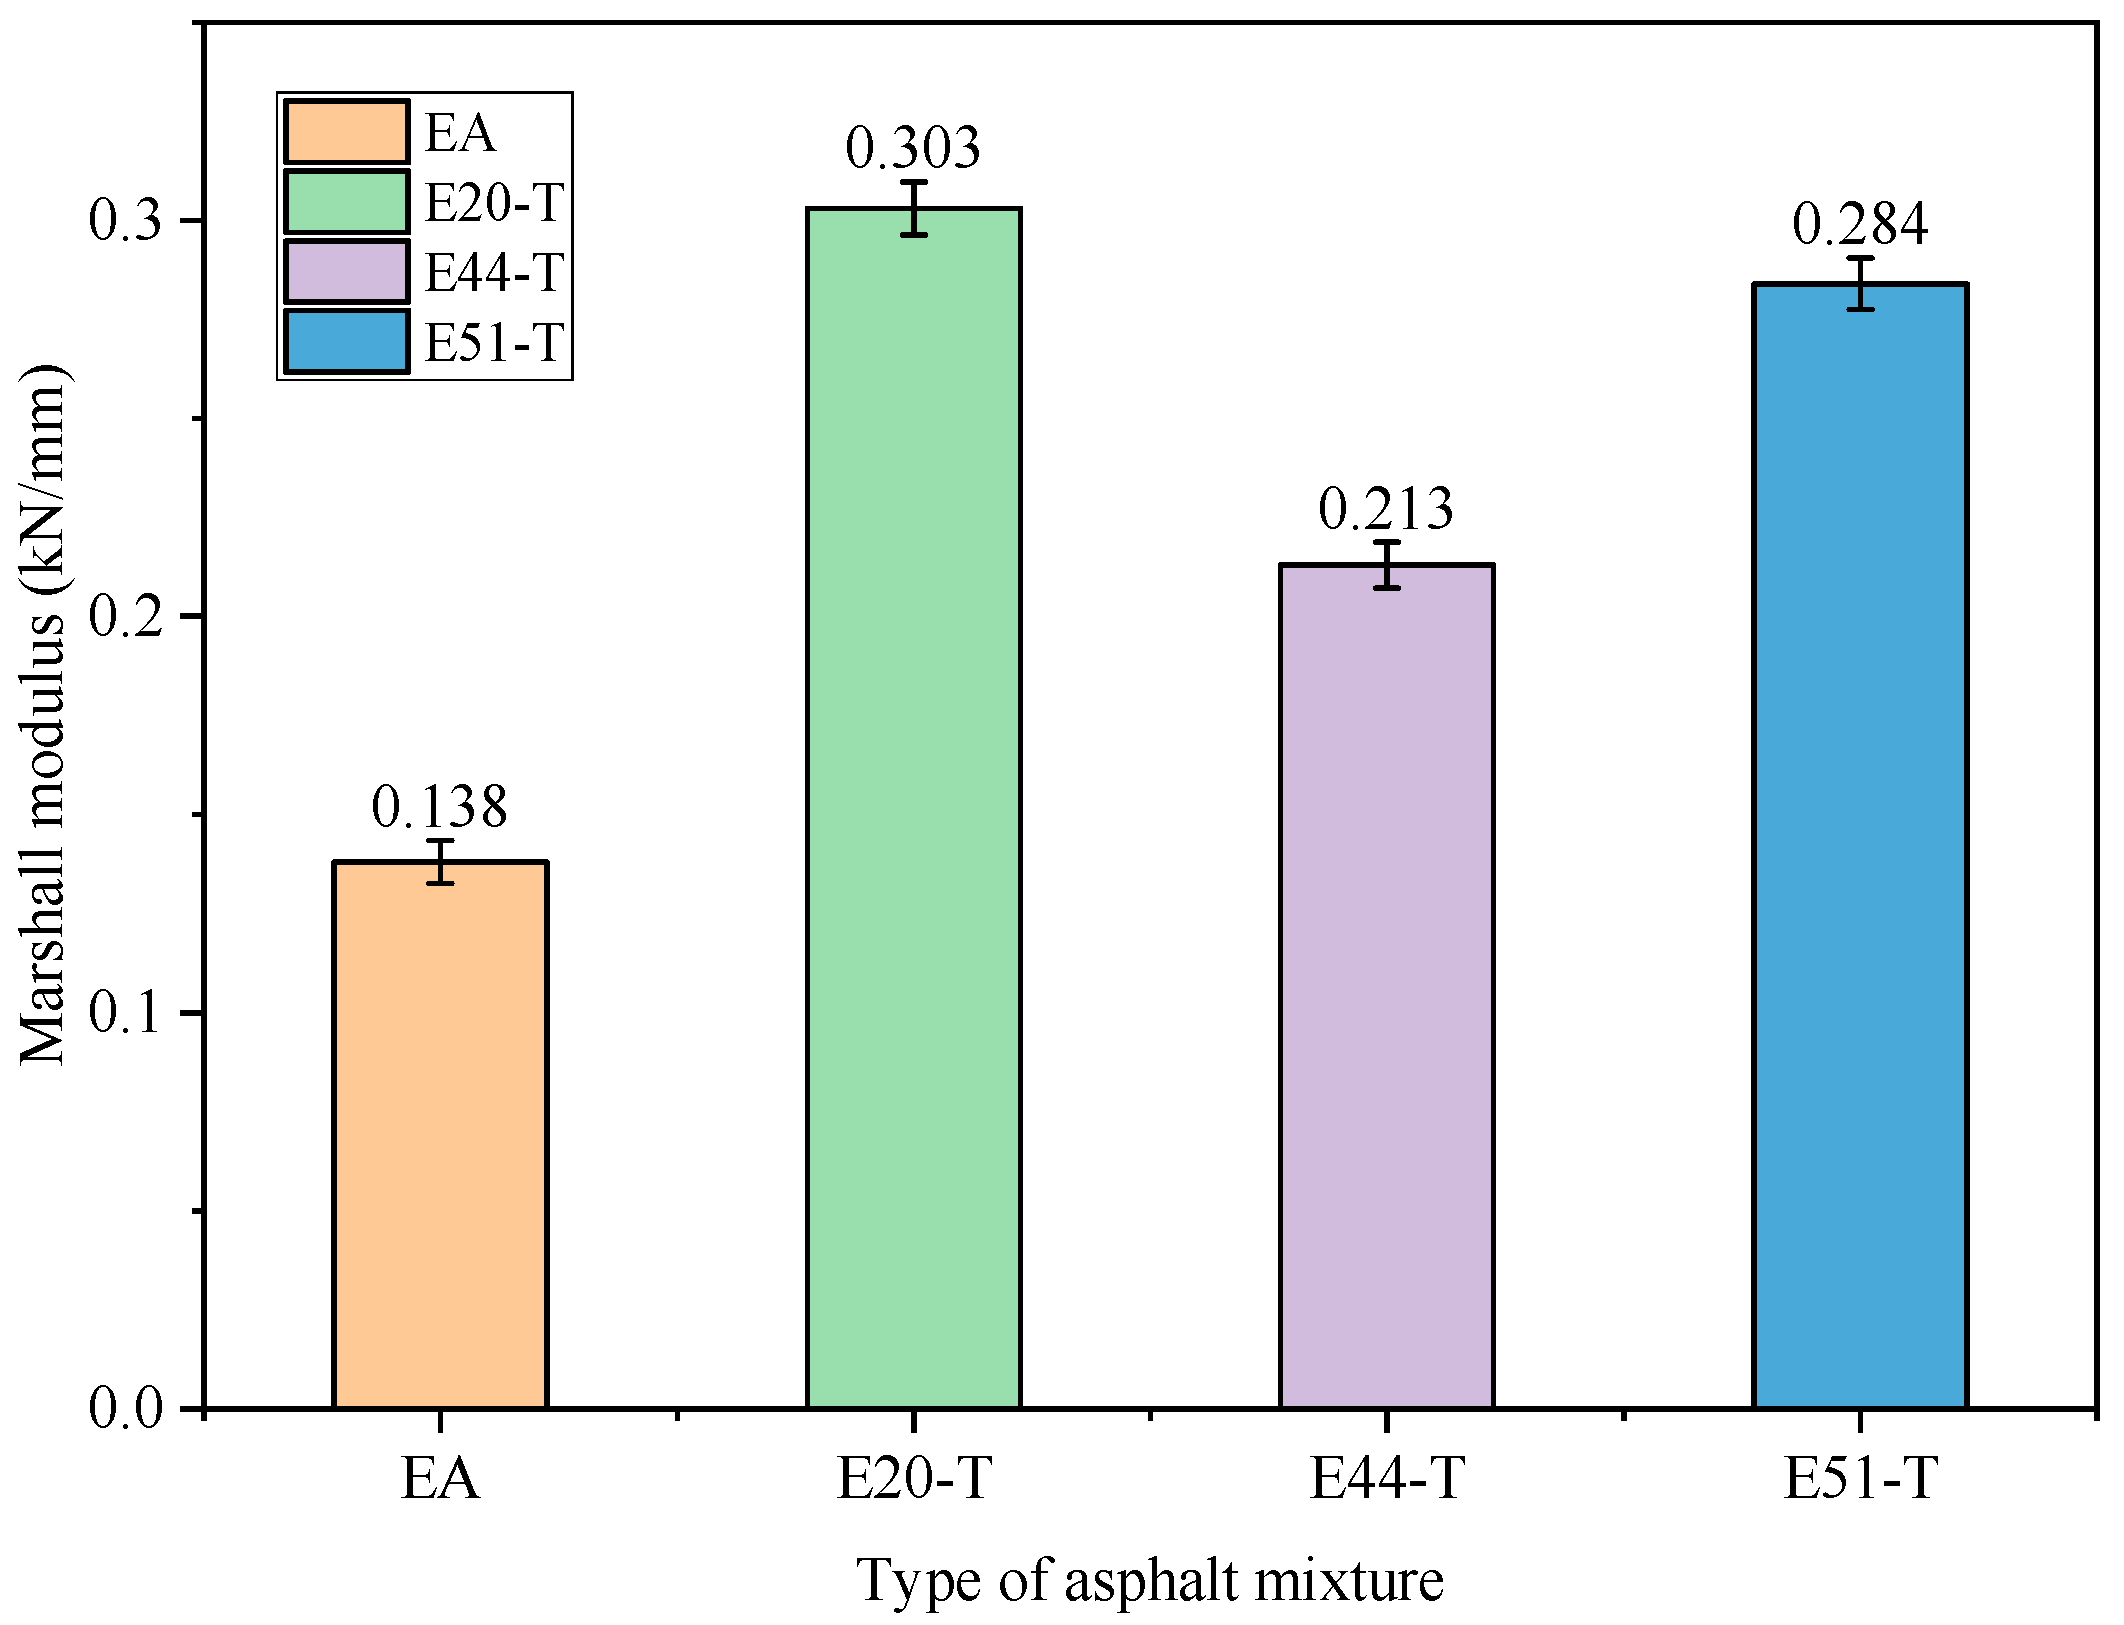
The results were calculated and are presented in Figure 7. It is observed that the Marshall modulus of the pure EA mixture was significantly smaller than that of the WER-EA mixture. The Marshall modulus of TE20-T was close to that of TE51-T, with a difference of only 0.019 kN/mm, and both were larger than that of TE44-T. The T value of the E20-T mixture was 42.25% higher than that of the E51-T mixture, but 119.57% higher than that of the EA mixture. A larger T value reflects lower mixture deformation under the same load, or a higher load under the same deformation. That is, a larger T value means the mixture has higher strength.
Based on the MS value, FL value, and T value, the WER system could significantly improve the strength of the emulsified asphalt mixture, and E20 was more suitable for improving the strength of the WER-EA mixture than the other WERs. This observation is consistent with the asphalt properties shown in the published research, with the E20 group showing higher viscosity under a high temperature.

3.1.2. Rutting Test

In comparison with the Marshall test, the rutting test can better simulate the wheel loads and is closer to the actual service environment. Therefore, the high-temperature performance of the four mixtures was further evaluated by the rutting test, and the main reference indexes included the test parameters’ dynamic stability (DS) and rutting depth (RD). The DS selected in this study was determined by the deformation of the specimen and calculated as follows:
D S = t 2 t 1 × N d 2 d 1 × C 1 × C 2
where D S stands for dynamic stability, times/mm; d 1 represents the deformation (mm) at t 1 = 45 min; d 2 represents the deformation (mm) at t 2 = 60 min; C 1 refers to the type coefficient of the testing machine, which was 1.0; and C 2 indicates the size coefficient of the specimen, which was 1.0.
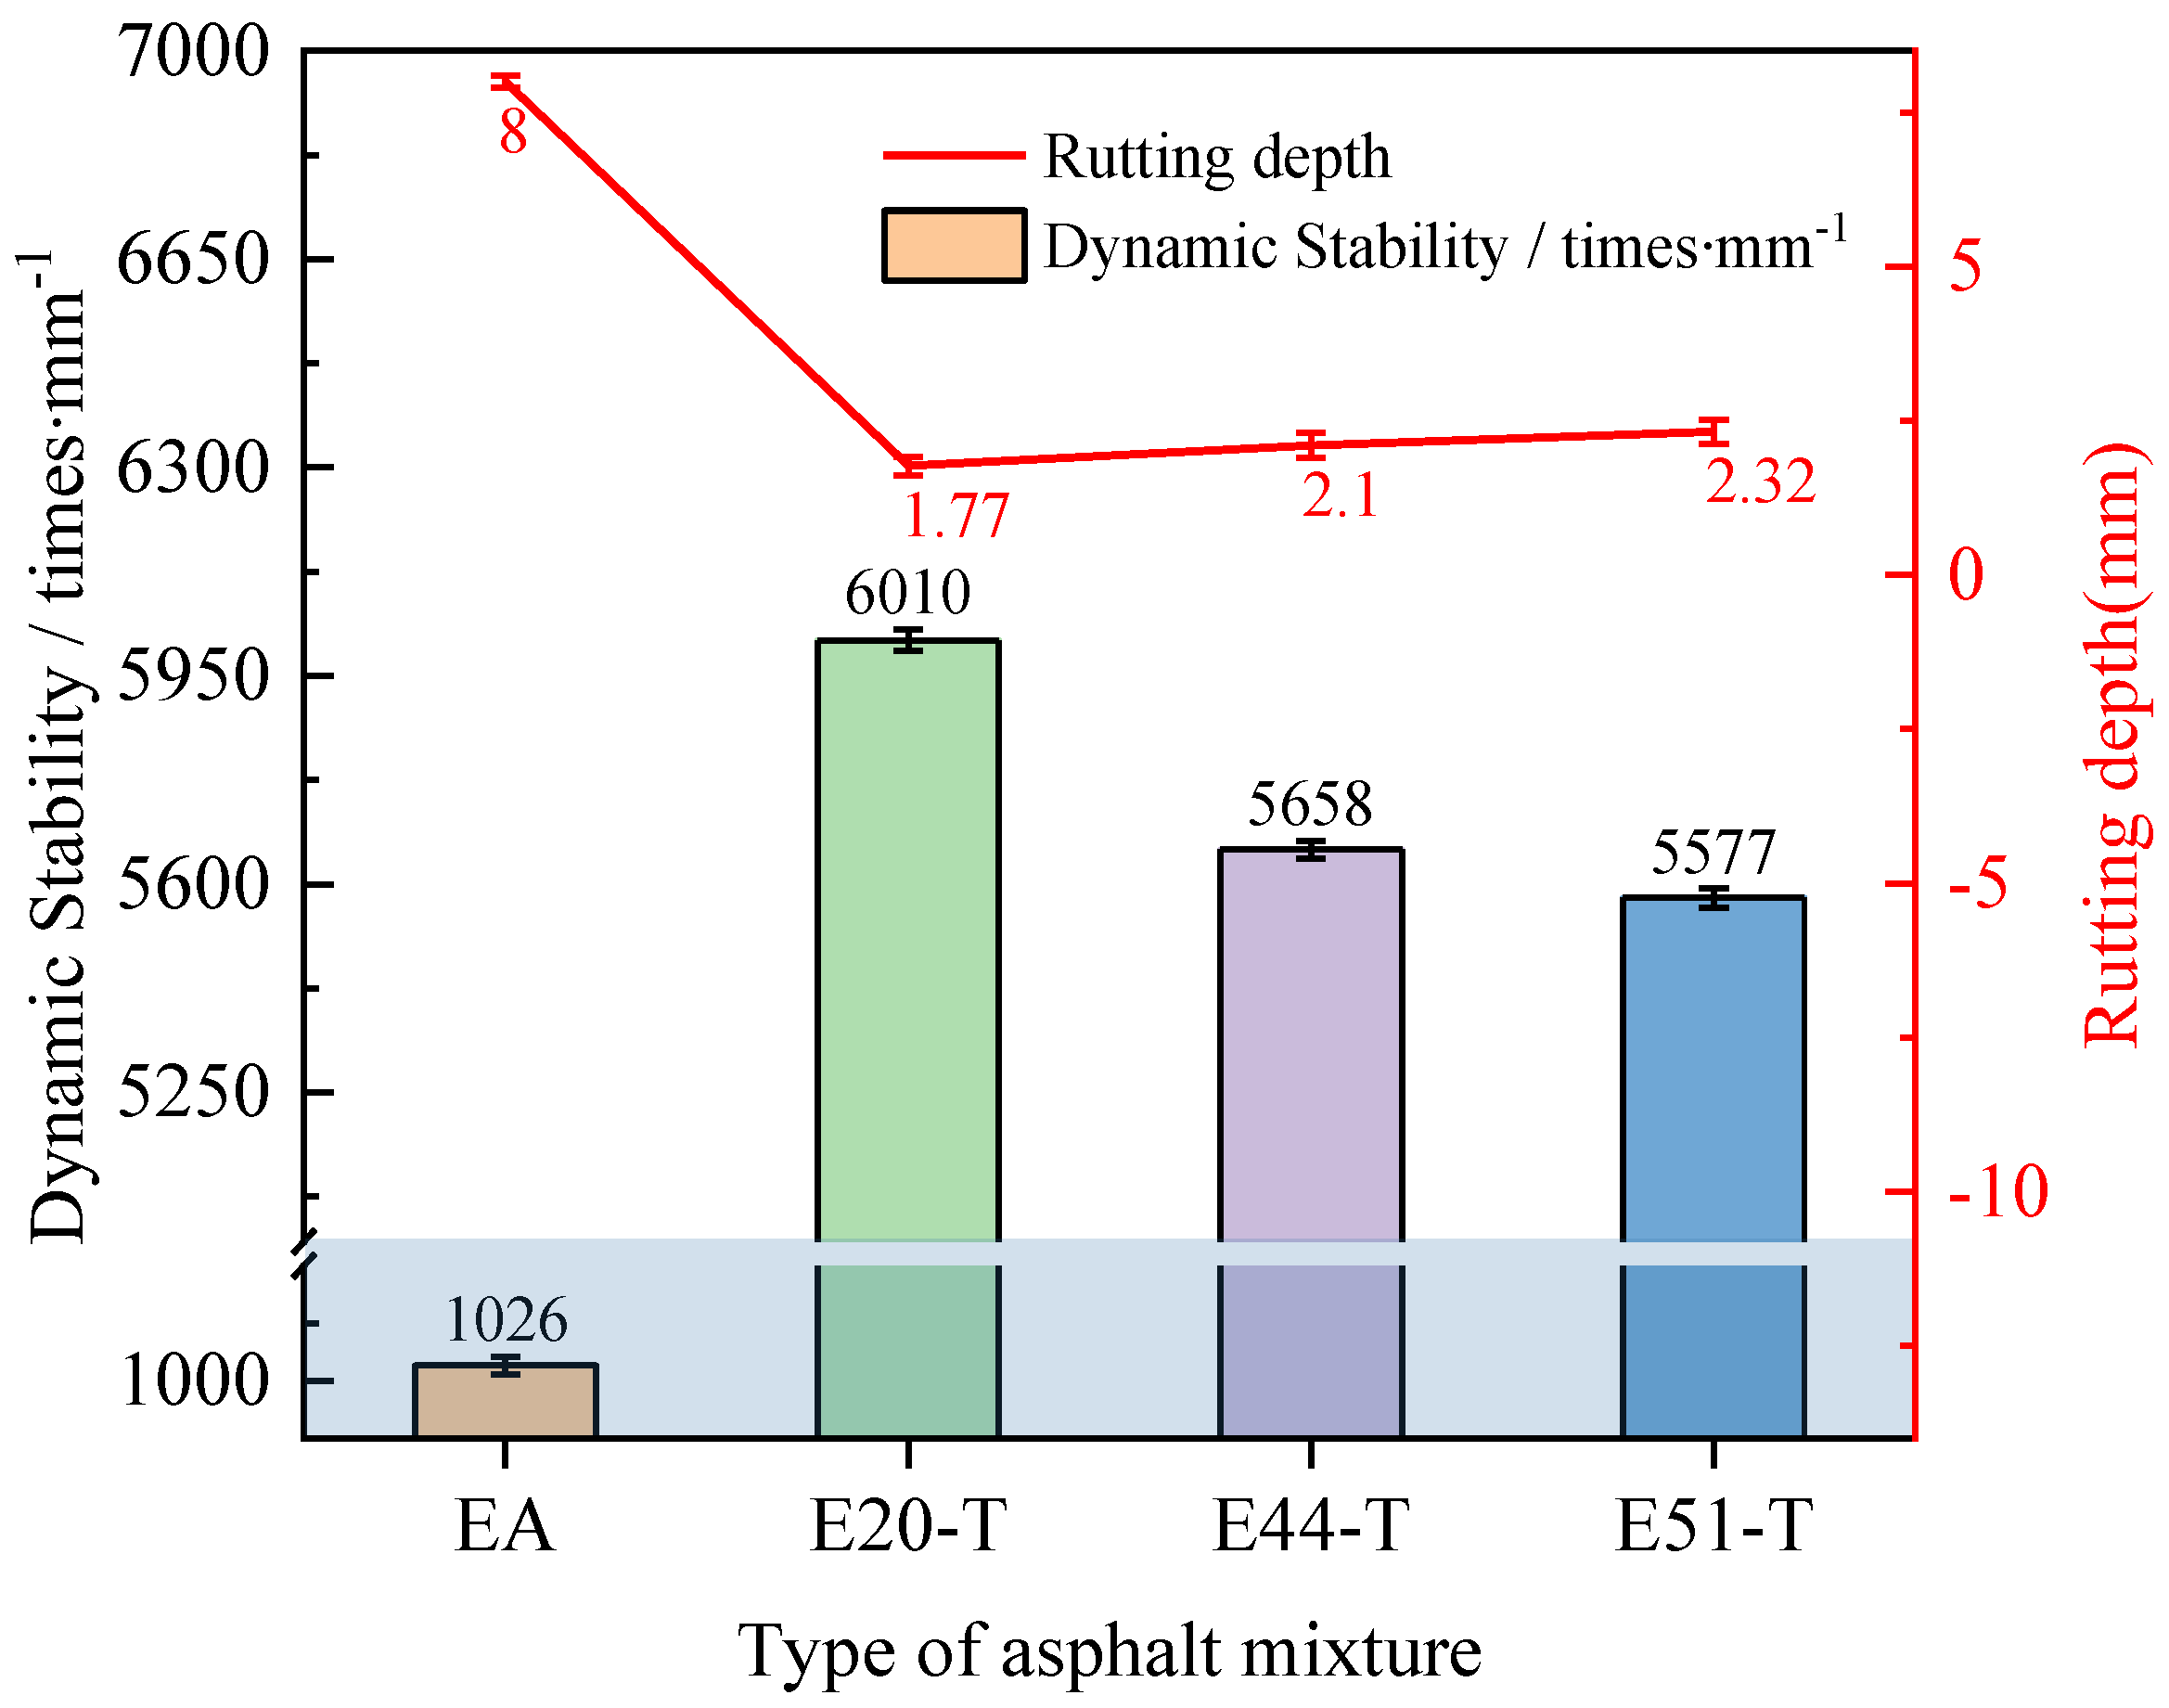
As seen from Figure 8, the DS values of the three WER-EA mixtures were much larger than those of the pure EA mixtures. DSE20-T, DSE20-T, and DSE20-T were 446%, 414%, and 407% higher than DSEA, respectively. At the same time, DSE20-T was significantly larger than the other two and was 433 times/mm higher than the minimum DS value of 5577 times/mm. Meanwhile, the minimum value of DSE20-T was 1026 times/mm, which is greater than the minimum value of 1000 times/mm required by the specification. That is, these four types of mixtures all met the specification requirements in terms of DS value.
The RD values of the three WER-EA mixtures were reduced by 71–78% compared with those of the EA mixture, which showed that the WER system could significantly improve the high-temperature rutting resistance of the emulsified asphalt mixtures. The RDE20-T ratio was 18.6 and 31.1% lower than the RDE44-T and RDE51-T ratios, respectively, indicating that WER with a low epoxy value is more conducive to improving the high-temperature performance of WER-EA mixtures.
In summary, the three WER systems can significantly improve the high-temperature performance of emulsified asphalt mixtures. This is because the WER system generates a dense three-dimensional skeleton structure in the mixture after curing, and the skeleton structure can tightly wrap the asphalt so that its fluidity will not change much even at high temperatures, thus forming a high-performance whole with the mixture. In addition, the E20-T mixture was better than the other two WER-EA mixtures in all indexes. This observation is consistent with the published investigation on asphalt performance analysis [19], which indicates that WER with a low epoxy value is more conducive to improving the high-temperature deformation resistance of WER-EA mixtures.

3.2. Low-Temperature Performance

Prior research on asphalt properties showed that the low-temperature performance of emulsified asphalt is weakened at varying degrees by WER systems [19]. Other studies also revealed that WER-EA mixtures are more prone to temperature shrinkage cracks in cold environments, which reduce the bearing capacity of asphalt pavements and ultimately lead to various problems in the pavements.
In this study, a low-temperature indirect tensile test at −10 °C was conducted to explore the influence of different epoxy values on the low-temperature properties of WER-EA mixtures and design a scheme to reduce the negative impact of the WER system on the low-temperature properties of the mixtures. The relevant indexes of splitting tensile strength ( R T ), failure tensile strain ( ε T ), and failure stiffness modulus ( S T ) were calculated as follows:
R T = 0.006287 P T / h
ε T = X T × 0.0307 + 0.0836 μ / 1.35 + 5 μ
S T = P T × 0.27 + 1.0 μ / h × X T
X T = Y T × 0.135 + 0.5 μ / 1.794 0.0314 μ
where R T represents the splitting tensile strength (MPa); P T stands for the maximum load value of the test (N); ε T represents the destruction of tensile strain; S T indicates the modulus of breaking stiffness (MPa); h stands for the height of the specimen (mm); μ indicates the Poisson ratio, which took a value of 0.25 in this study; and X T , Y T are the total horizontal and vertical deformation, respectively, of the specimen corresponding to the maximum test load (mm).
The relevant indexes of splitting tensile strength ( R T ) for the four WER-EA mixture samples are shown in Figure 9. Although the current regulations in China do not limit the R T value exactly, a higher R T value is used to characterize the superior low-temperature stress bearing capacity of an asphalt mixture. Figure 9 shows that the cleavage strength of the E20-T mixture was 0.37 MPa, 0.15 MPa, and 0.26 MPa lower than that of the EA mixture, respectively, indicating that the low-temperature performance of the WER-EA mixtures was worse than that before modification. The RT value of the E20-T mixture was the smallest, but the difference between the RT value of the E51-T mixture and that of the E51-T mixture was small, and the splitting strength of the E44-T mixture was 12.36% higher than that of the E20-T mixture. It can be seen that the use of E44 was beneficial for the asphalt mixture in withstanding higher-temperature stress before low-temperature cracking.
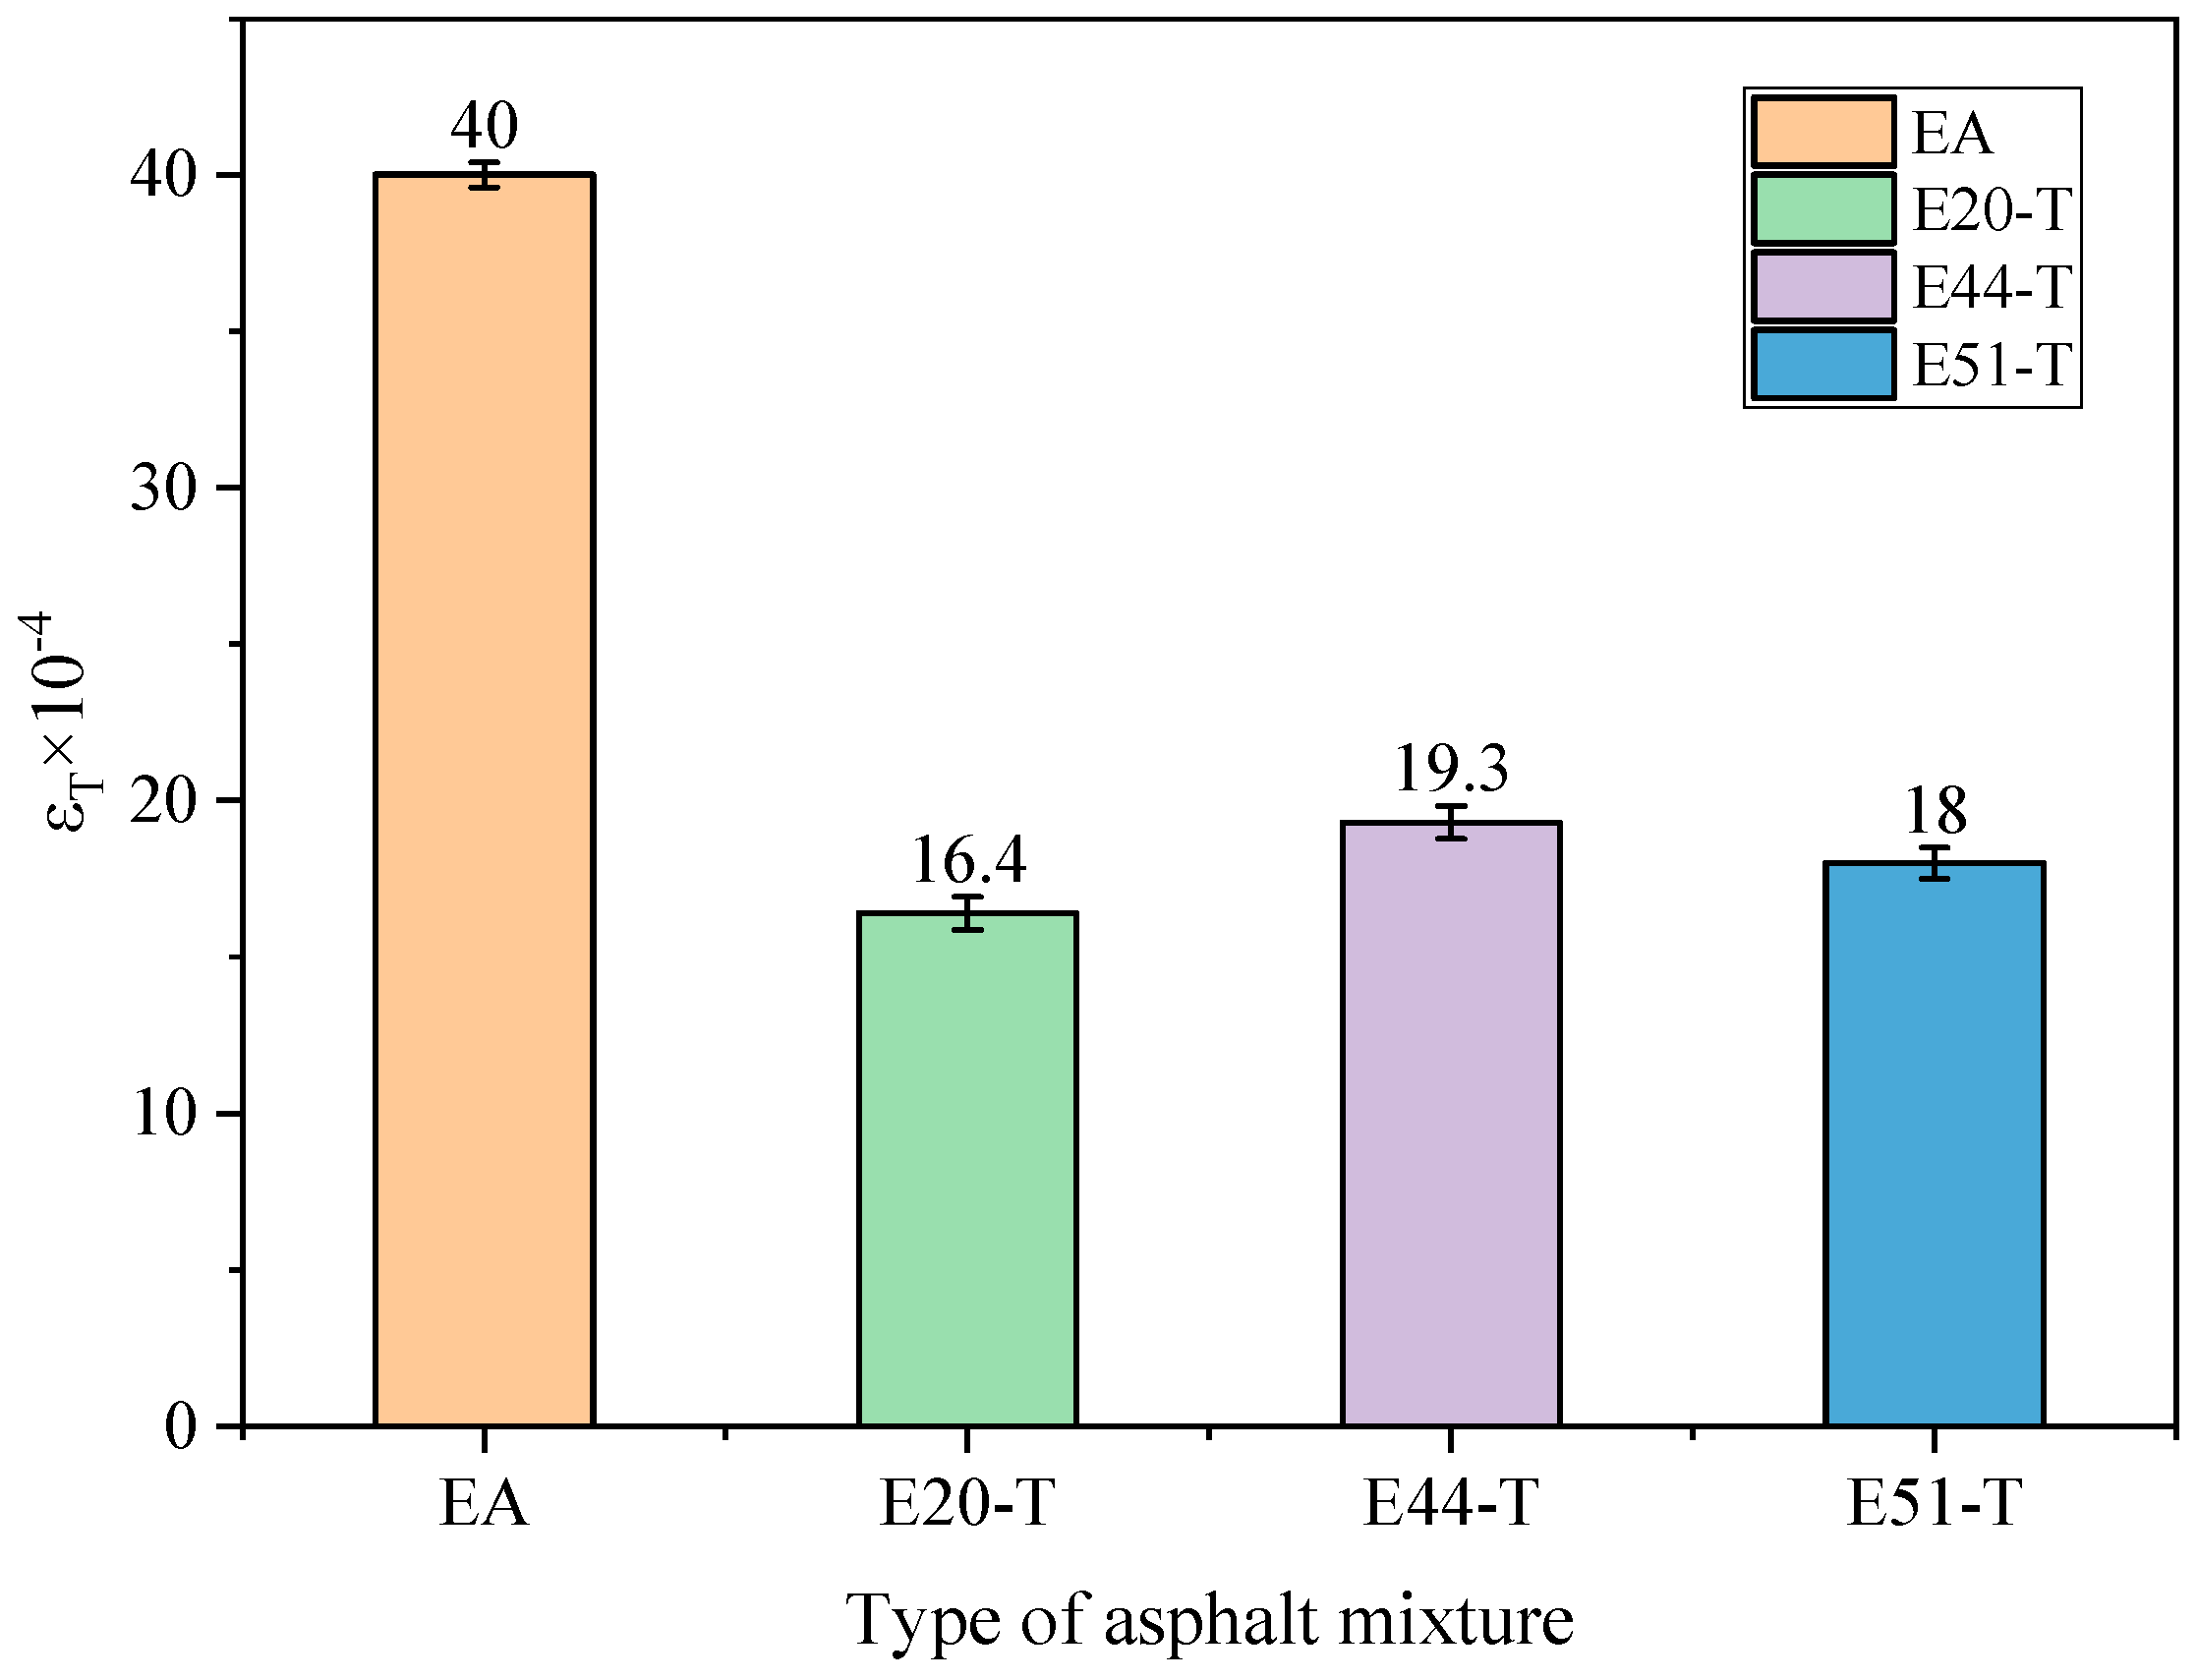
Figure 10 shows the ε T test results for each asphalt mixture. It was found that the tensile strain of the three WER-EA mixtures was significantly reduced compared to the blank control group. The ε T value difference between the E44-T and E51-T mixtures was small, but the ε T value difference between the E20-T and E44-T mixtures reached 17.68%, indicating that the E20-T mixture had more room for improvement in resistance to low-temperature cracking. The ε T value of the E44-T mixture was larger, indicating that its shrinkage deformation ability was less affected by the low temperature, and its low-temperature cracking resistance was stronger.
Figure 11 shows the ST values for the four mixtures. It can be seen from the figure that the three WER-EA mixtures had a larger stiffness modulus. The ST(E44-T) was smaller than the ST(E20-T) and the ST(E51-T), but the ST(E44-T) and ST(E51-T) were only 70 MPa, 16.07% lower than the ST(E20-T). The E20-T mixtures had the highest ST value, i.e., they were more brittle and had the worst low-temperature properties. ST is directly related to ε T , and when an asphalt mixture was subjected to the same temperature stress, the larger the ST value, the smaller the ε T value, which is consistent with the law shown by the test results of the two asphalt mixtures.
Combined with the three indexes, the RT and ε T values of the E44-T mixture were larger than those of the other mixtures, while the ST value was the smallest. The performance of the E20-T mixture was opposite to that of the E44-T mixture, that is, E44 had the least negative impact on the low-temperature performance of the WER-EA mixtures, while E20 caused the greatest weakening of the low-temperature crack resistance of the WER-EA mixtures. This corroborates the conclusion that asphalt exhibits a maximum λ value due to the smaller stiffness modulus and greater stress relaxation capacity in the BBR test.
Previous studies mentioned that the addition of a WER system could reduce the low-temperature performance of emulsified asphalt, but in the case of mixtures, the low-temperature performance of WER-EA mixtures was better. This test verified that the addition of a WER system reduced the low-temperature performance of the emulsified asphalt and its mixture, and the low-temperature crack resistance of the WER-EA mixture was weakened by E20.

3.3. Water Stability Performance

In addition to high-temperature rutting and low-temperature cracking, water damage is also a common problem in asphalt pavements. As a commonly used cold patch, (modified) emulsified asphalt mixtures are prone to water seepage into the interior when repairing a pit, producing vacuum negative pressure or hydrodynamic pressure inside and continuously washing the mixture. This can eventually lead to spalling, raveling, or more serious distress in the asphalt pavement. Based on the importance of water stability, the four mixtures were analyzed by water-immersion Marshall and freeze–thaw splitting tests.

3.3.1. Immersion Marshall Test

The Immersion Residual Stability (IRS) is calculated as follows:
I R S = M S 1 M S × 100
where I R S stands for Immersion Residual Stability (%), and M S 1 and M S represent the Marshall stability of the specimen (kN) after immersion for 30~40 min and 48 h, respectively.
The IRS values of the four WER-EA mixture specimens are shown in Figure 12. The current code does not limit the IRS value of an emulsified asphalt mixture, but the AASHTO specification requires the IRS value of an asphalt matrix mixture to be larger than 80%. As can be seen from Figure 12, the IRS values of all WER-EA mixtures met the requirements except for the emulsified asphalt mixture.
Compared with the IRS value of EA, the IRS value of the WER-EA mixture was closer to 100%, which means that the WER system could improve the resistance of the mixture to water damage. IRSE20-T increased by 24.65%, 13.03%, and 21.85% compared with IRSEA. Among the mixtures, the E20-T mixture had the largest IRS value, which was 10.3% higher than the lowest of 80.7%.

3.3.2. Freeze–Thaw Splitting Test

The implementation of the freeze–thaw splitting test requires more stringent conditions—freeze–thaw cycles—than the implementation of the immersion Marshall test. In this study, in order to comprehensively evaluate the water damage resistance of the WER-EA mixtures, the freeze–thaw splitting strength ratio (TSR) was selected as a supplementary index, and its calculation method is shown in following equations:
R T 1 = 0.006287 P T 1 / h 1
R T 2 = 0.006287 P T 2 / h 2
T S R = R T 2 R T 1 × 100
where R T 1 represents the splitting tensile strength of the specimens at room temperature, MPa; R T 2 stands for the splitting tensile strength of the freeze–thaw specimens, MPa; P T 1 represents the test load value of the specimens at room temperature, N; P T 2 stands for the test load value of the freeze–thaw group specimens, N; h 1 indicates the height of the specimens at room temperature, mm; h 2 represents the height of the specimens in the freeze–thaw group, mm; and T S R represents the freeze–thaw splitting strength ratio, %.
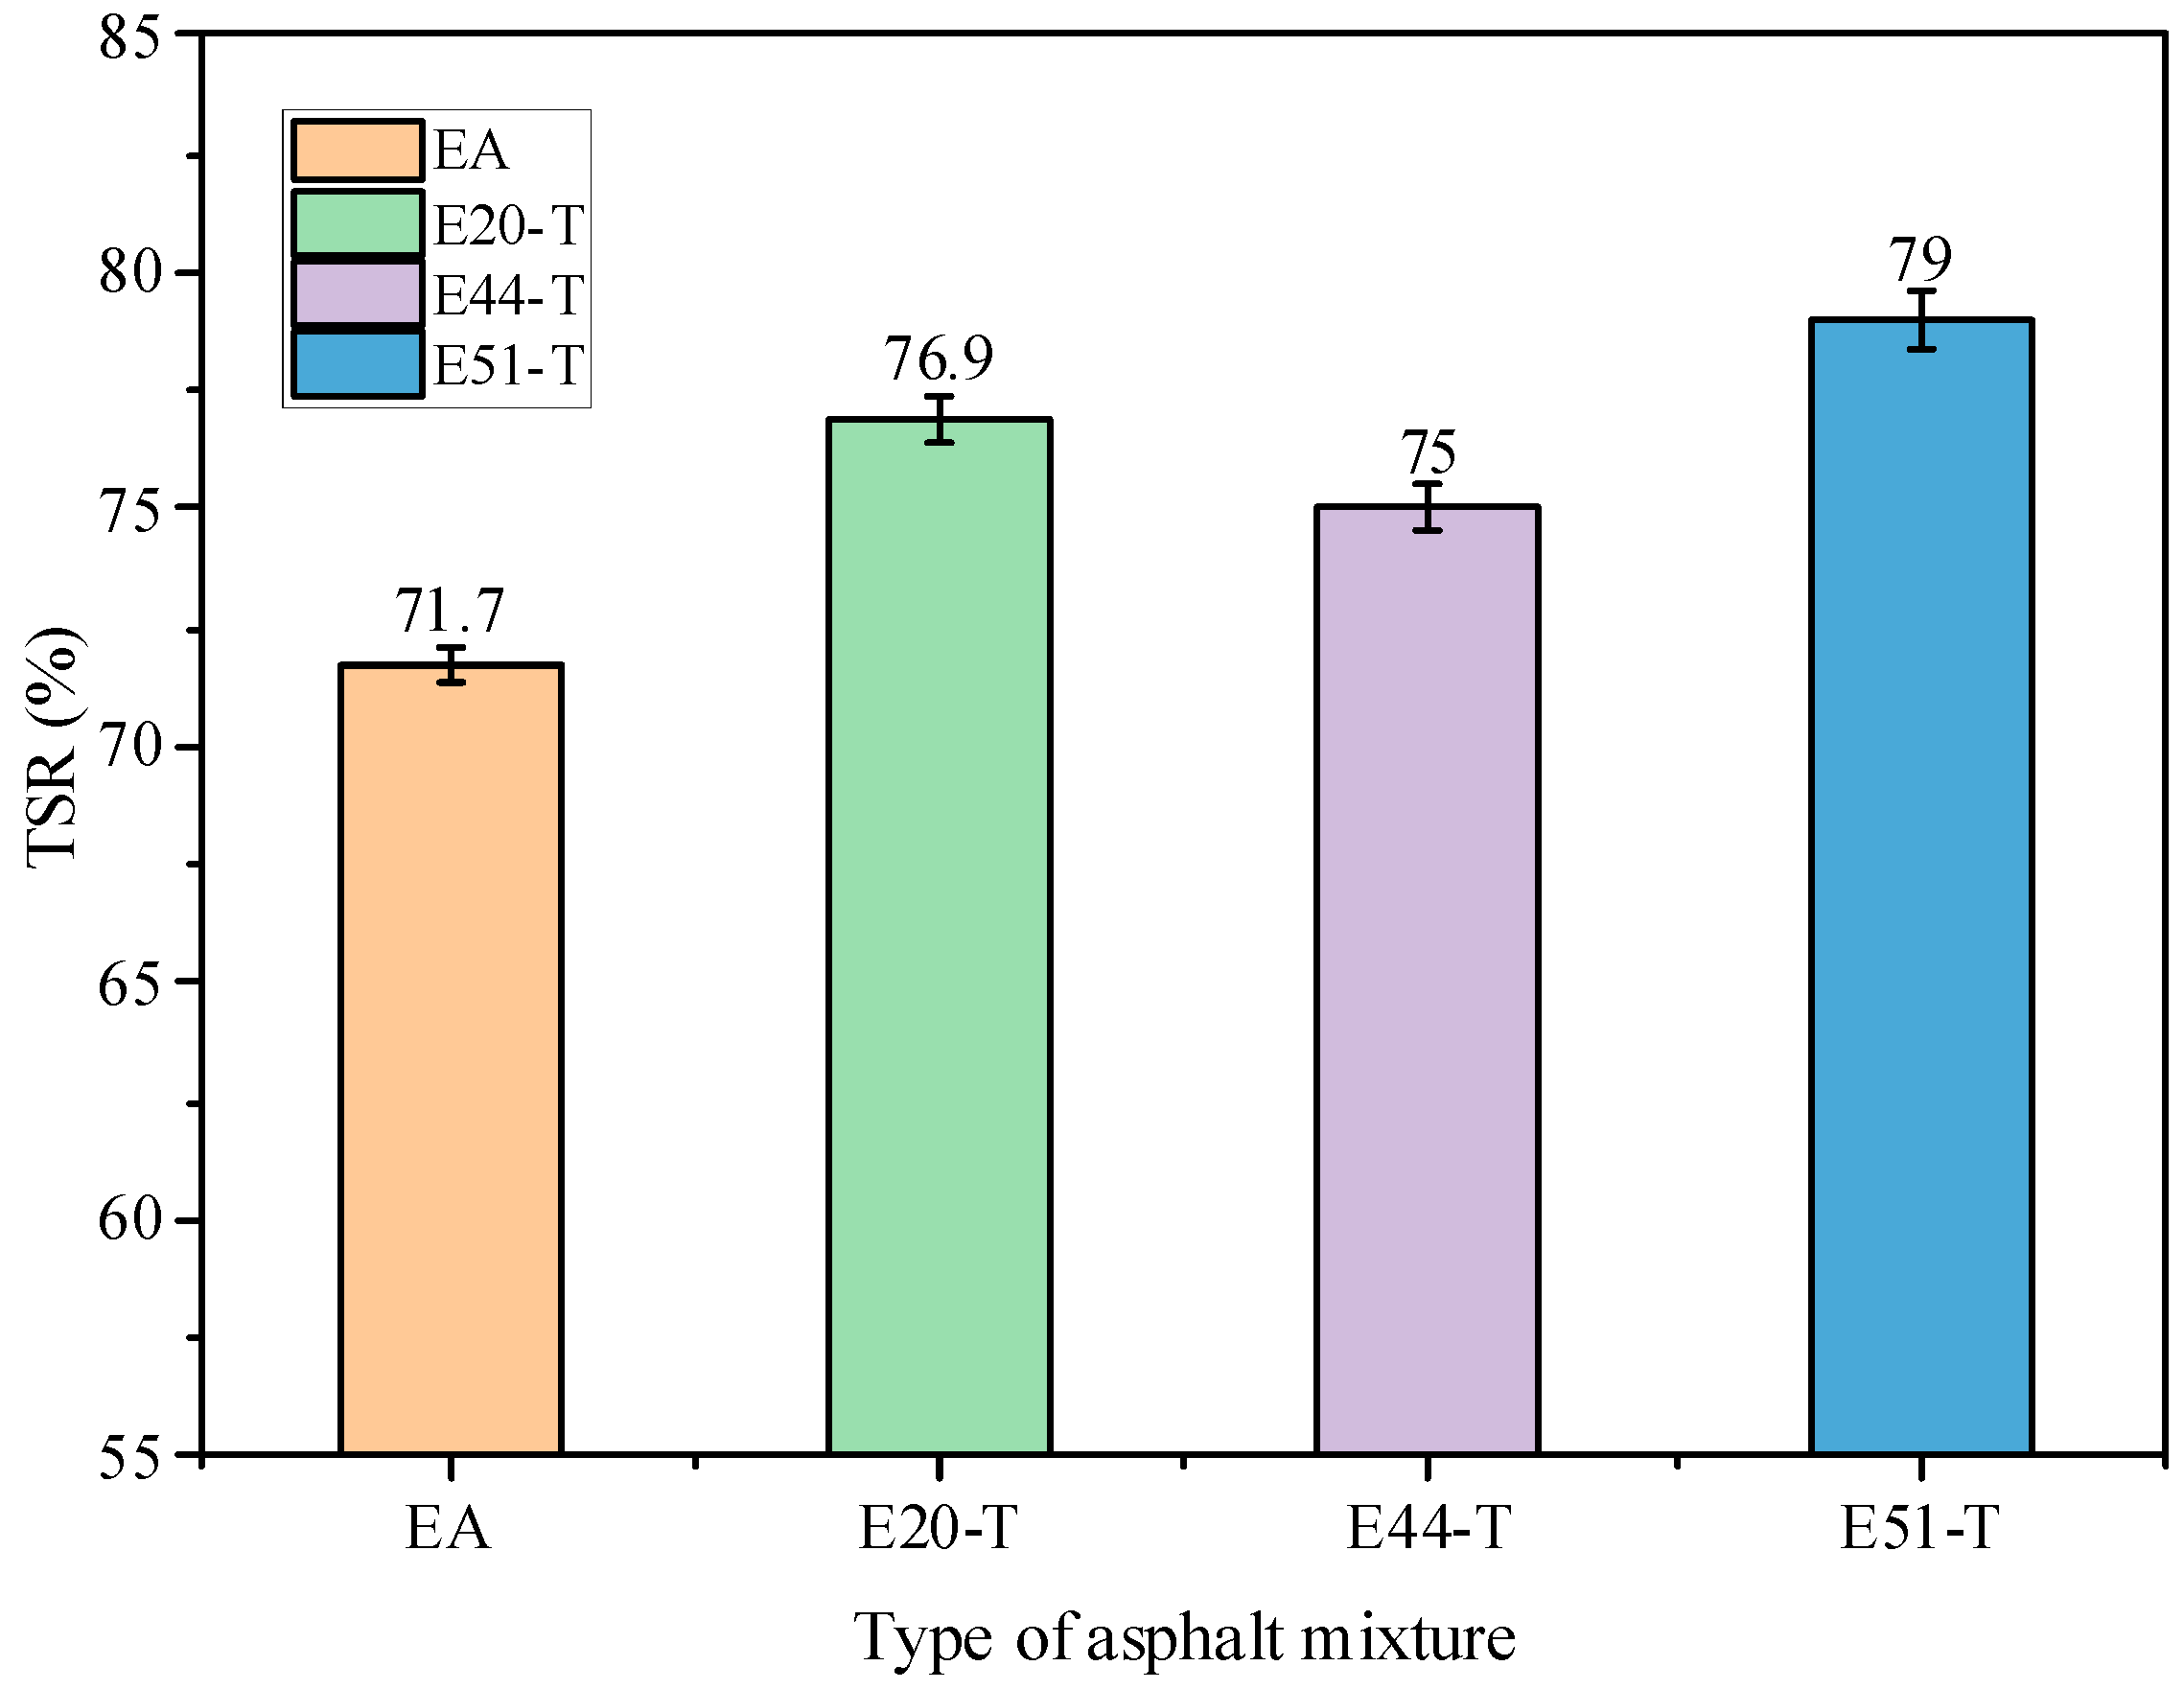
The TSR values of the four WER-EA mixture specimens are shown in Figure 13. The characterization of the water damage resistance of the mixtures was similar to that of the IRS value, that is, the better the water damage resistance of the specimen, the higher the IRS value. The AASHTO specification set the limits that the TSR for 70# should be larger than 75%. According to the results, the addition of the WER system could alter the TSR value of the emulsified asphalt mixture such that it changes from not meeting the limit of the specified value to meeting the requirements of the specified value.
As can be seen in Figure 13, the TSR value of the emulsified asphalt mixtures was increased by 4–10% in the three WER systems, and the TSR value of E44 was the lowest among the mixtures, at only 4.61%. The TSR value of the E20-T and E51-T mixtures differed by only 2.1%.
Based on the results of the two experiments, the IRS value and TSR value of the WER-EA mixtures were significantly higher than those of the control group, which was consistent with the corresponding VV values in Table 11. This phenomenon is related to the presence of highly stable, highly cross-linked, three-dimensional interpenetrating polymer networks (IPNs) in WER-EA mixtures, which allow the components of the mixture to interlock with each other and make the mixture more resistant to the pressure generated by the ingress of moisture.
In addition, the TSR value and IRS value of the E20-T mixture were higher, that is, E20-T had a better comprehensive effect on the improvement of water damage resistance in the emulsified asphalt mixture. Thus, the use of WER with a low epoxy value is more conducive to the formation of a more stable and cross-linked interpenetrating polymer network in a WER-EA mixture, which can resist the damage caused by a rainy environment in summer.

4. Conclusions and Recommendations

Prior research showed that the epoxy value has an obvious and regular effect on the performance of WER-EA, and, compared with other curing agents, WER-EA using the curing agent TETA has better comprehensive performance. In this continuous study, the AC-13 graded mixture was prepared using E20-T, E44-T, and E51-T, and the high- and low-temperature and water stability properties of the mixtures were analyzed with an EA mixture as the control group. The main conclusions were as follows:
(1)
In the mix design, the water consumption of the selected additive was 3–3.5%, and the optimal emulsion dosage of the four mixtures was 9%. It was verified that the volume indexes of the Marshall specimens of the EA, E20-T, E44-T, and E51-T mixtures prepared according to the gradation in this paper met the requirements of the specification.
(2)
The three WER systems can significantly improve the high-temperature performance and water stability of emulsified asphalt mixtures. This is because after the WER system is cured, a dense three-dimensional skeleton structure is generated in the mixture, which can tightly wrap the asphalt so that its fluidity will not change too much even at a high temperature or in the presence of water pressure, thus forming a high-performance whole with the mixture.
(3)
In terms of high-temperature performance, the E20-T mixture was better than the other two WER-EA mixtures, showing the highest MS value, T value, and DS value, and the smallest FL value and RD value. This is consistent with the conclusions of the asphalt performance analysis, which indicated that WER with a low epoxy value is more conducive to improving the high-temperature deformation resistance of WER-EA mixtures.
(4)
In terms of low-temperature performance, the RT value and ε T value of the E44-T mixture were larger than those of the other mixtures, while its ST value was the smallest. The performance of the E20-T mixture was opposite to that of the E44-T mixture, that is, E44 had the least negative impact on the low-temperature performance of the WER-EA mixture, while E20 caused the greatest weakening of the low-temperature crack resistance of the WER-EA mixture. This indicates that WER with a medium epoxy value can reduce the low-temperature performance of WER-EA mixtures.
(5)
The TSR value and IRS value of the E20-T mixture were higher, that is, the comprehensive effect of E20-T on improving the water damage resistance of the emulsified asphalt mixture was better. This is because the use of WER with a low epoxy value is more conducive to the formation of a more stable and cross-linked interpenetrating polymer network in a WER-EA mixture.
In summary, while our results indicate that the mixture with an epoxy value of 20 and the curing agent TETA exhibited the best overall performance in terms of high-temperature deformation and water damage resistance, there is a clear need for further research to enhance the low-temperature crack resistance of WER-EA mixtures. Future studies should focus on exploring alternative curing agents or modifying the epoxy formulation to improve the flexibility and resilience of WER-EA mixtures at low temperatures. Furthermore, investigating the microstructural characteristics of these mixtures under varying temperature conditions could provide valuable insights into optimizing their composition for better low-temperature performance. Additionally, we also recommend implementing field trials to observe the real-world performance of modified WER-EA mixtures in low-temperature environments, coupled with long-term durability studies.

Author Contributions

Conceptualization, W.L. and K.Y.; methodology, W.L. and K.Y.; validation, L.W., M.W. and Z.Z.; formal analysis, L.W.; investigation, L.W. and J.S.; resources, K.Y.; writing—original draft preparation, L.W., J.S. and W.L.; writing—review and editing, Z.Z. and W.L.; visualization, J.S. and Z.Z.; supervision, K.Y.; funding acquisition, K.Y. All authors have read and agreed to the published version of the manuscript.

Funding

This research was funded by the National Natural Science Foundation of China (NSFC, No. 51778224).

Institutional Review Board Statement

Not applicable.

Informed Consent Statement

Not applicable.

Data Availability Statement

The data are presented in the tables and figures within the paper.

Acknowledgments

The authors would like to express their gratitude for the financial support and the support from the Key Laboratory for Green & Advanced Civil Engineering Materials and Application Technology of Hunan Province, College of Civil Engineering, Hunan University, Changsha, China.

Conflicts of Interest

Authors Lieguang Wang, Zirui Zhang and Mingfei Wu were employed by the company Zhejiang Huadong Engineering Consulting Co., Ltd. The remaining authors declare that the research was conducted in the absence of any commercial or financial relationships that could be construed as a potential conflict of interest.

Abbreviations

ACAsphalt concrete
BBRBending Beam Rheometer
DETADiethylenetriamine
DSDynamic stability
DSRDynamic Shear Rheometer
EAEmulsified asphalt
FLFlow value
FTIRFourier Transform Infrared Spectroscopy
IRSIndex of retained strength
MSMarshall stability
OACOptimal asphalt content
RDRutting depth
RTRelevant indexes of splitting tensile strength
SBRStyrene-butadiene rubber
SBSStyrene-butadiene-styrene
SEMScanning Electron Microscopy
STFailure stiffness modulus at tensile test
TETATriethylenetetramine
TSRTensile strength ratio
VFAVoids filled with asphalt
VMAVoids in mineral aggregates
VVVolume of void space
WERWaterborne epoxy resin
AASHTOThe American Association of State Highway and Transportation Officials

References

  1. Qiao, Y.; Dawson, A.R.; Parry, T.; Flintsch, G.; Wang, W. Flexible Pavements and Climate Change: A Comprehensive Review and Implications. Sustainability 2020, 12, 1057. [Google Scholar] [CrossRef]
  2. Pereira, P.; Pais, J. Main Flexible Pavement and Mix Design Methods in Europe and Challenges for the Development of an European Method. J. Traffic Transp. Eng. Engl. Ed. 2017, 4, 316–346. [Google Scholar] [CrossRef]
  3. Maadani, O.; Shafiee, M.; Egorov, I. Climate Change Challenges for Flexible Pavement in Canada: An Overview. J. Cold Reg. Eng. 2021, 35, 03121002. [Google Scholar] [CrossRef]
  4. Wei, Y.-M.; Chen, K.; Kang, J.-N.; Chen, W.; Wang, X.-Y.; Zhang, X. Policy and Management of Carbon Peaking and Carbon Neutrality: A Literature Review. Engineering 2022, 14, 52–63. [Google Scholar] [CrossRef]
  5. Chen, L.; Msigwa, G.; Yang, M.; Osman, A.I.; Fawzy, S.; Rooney, D.W.; Yap, P.-S. Strategies to Achieve a Carbon Neutral Society: A Review. Env. Chem. Lett. 2022, 20, 2277–2310. [Google Scholar] [CrossRef] [PubMed]
  6. Dawson, A. Anticipating and Responding to Pavement Performance as Climate Changes. In Climate Change, Energy, Sustainability and Pavements; Green Energy and Technology; Gopalakrishnan, K., Steyn, W.J., Harvey, J., Eds.; Springer: Berlin/Heidelberg, Germany, 2014; pp. 127–157. ISBN 978-3-662-44718-5. [Google Scholar]
  7. Almeida, A.; Picado-Santos, L. Asphalt Road Pavements to Address Climate Change Challenges—An Overview. Appl. Sci. 2022, 12, 12515. [Google Scholar] [CrossRef]
  8. Meng, Y.; Chen, J.; Kong, W.; Hu, Y. Review of Emulsified Asphalt Modification Mechanisms and Performance Influencing Factors. J. Road Eng. 2023, 3, 141–155. [Google Scholar] [CrossRef]
  9. Jiang, S.; Li, J.; Zhang, Z.; Wu, H.; Liu, G. Factors Influencing the Performance of Cement Emulsified Asphalt Mortar—A Review. Constr. Build. Mater. 2021, 279, 122479. [Google Scholar] [CrossRef]
  10. Wada, Y.; Izaiku, H.; Koike, M. Studies on Asphalt Emulsion.I. J. Jpn. Oil Chem. Soc. 1967, 16, 23–29. [Google Scholar] [CrossRef]
  11. Umar, H.A.; Zeng, X.; Lan, X.; Zhu, H.; Li, Y.; Zhao, H.; Liu, H. A Review on Cement Asphalt Emulsion Mortar Composites, Structural Development, and Performance. Materials 2021, 14, 3422. [Google Scholar] [CrossRef]
  12. Jain, S.; Singh, B. Cold Mix Asphalt: An Overview. J. Clean. Prod. 2021, 280, 124378. [Google Scholar] [CrossRef]
  13. Liu, B.; Liang, D. Influence of SBS and SBR on the Properties of Emulsified Asphalt. Pet. Sci. Technol. 2017, 35, 1008–1013. [Google Scholar] [CrossRef]
  14. Zhou, Q.; Ling, T.; Hao, Z.; Wu, X.; Li, L.; Xu, G. Feature Analysis of Waterborne Epoxy Resin-Emulsified Asphalt Blend. J. Build. Mater. 2018, 21, 414–419. [Google Scholar] [CrossRef]
  15. Zhang, L.; Shu, W. Development and Progress of Waterborne Epoxy Resin System. Paint Coat. Ind. 2002, 32, 28–30. [Google Scholar]
  16. Yang, G.; Wang, C.; Fu, H.; Yan, Z.; Yin, W. Waterborne Epoxy Resin–Polyurethane–Emulsified Asphalt: Preparation and Properties. J. Mater. Civ. Eng. 2019, 31, 04019265. [Google Scholar] [CrossRef]
  17. Liu, F.; Zheng, M.; Liu, X.; Ding, X.; Wang, F.; Wang, Q. Performance Evaluation of Waterborne Epoxy Resin-SBR Composite Modified Emulsified Asphalt Fog Seal. Constr. Build. Mater. 2021, 301, 124106. [Google Scholar] [CrossRef]
  18. Li, R.; Leng, Z.; Zhang, Y.; Ma, X. Preparation and Characterization of Waterborne Epoxy Modified Bitumen Emulsion as a Potential High-Performance Cold Binder. J. Clean. Prod. 2019, 235, 1265–1275. [Google Scholar] [CrossRef]
  19. Kezhen, Y.; Junyi, S.; Kaixin, S.; Min, W.; Goukai, L.; Zhe, H. Effects of the Chemical Structure of Curing Agents on Rheological Properties and Microstructure of WER Emulsified Asphalt. Constr. Build. Mater. 2022, 347, 128531. [Google Scholar] [CrossRef]
  20. ASTM D5; Test Method for Penetration of Bituminous Materials. ASTM International: West Conshohocken, PA, USA, 2020.
  21. ASTM D113; Test Method for Ductility of Asphalt Materials. ASTM International: West Conshohocken, PA, USA, 2017.
  22. ASTM D36; Test Method for Softening Point of Bitumen (Ring-and-Ball Apparatus). ASTM International: West Conshohocken, PA, USA, 2020.
  23. ASTM D4402; Test Method for Viscosity Determination of Asphalt at Elevated Temperatures Using a Rotational Viscometer. ASTM International: West Conshohocken, PA, USA, 2023.
  24. ASTM D7402; Practice for Identifying Cationic Emulsified Asphalts. ASTM International: West Conshohocken, PA, USA, 2017.
  25. ASTM D244; Standard Test Methods and Practices for Emulsified Asphalts. ASTM International: West Conshohocken, PA, USA, 2020.
  26. ASTM D6933; Test Method for Oversized Particles in Emulsified Asphalts (Sieve Test). ASTM International: West Conshohocken, PA, USA, 2022.
  27. ASTM D6934; Test Method for Residue by Evaporation of Emulsified Asphalt. ASTM International: West Conshohocken, PA, USA, 2022.
  28. ASTM D6930; Test Method for Settlement and Storage Stability of Emulsified Asphalts. ASTM International: West Conshohocken, PA, USA, 2019.
  29. ASTM C131; Test Method for Resistance to Degradation of Small-Size Coarse Aggregate by Abrasion and Impact in the Los Angeles Machine. ASTM International: West Conshohocken, PA, USA, 2020.
  30. ASTM C136; Test Method for Sieve Analysis of Fine and Coarse Aggregates. ASTM International: West Conshohocken, PA, USA, 2019.
  31. ASTM C88; Test Method for Soundness of Aggregates by Use of Sodium Sulfate or Magnesium Sulfate. ASTM International: West Conshohocken, PA, USA, 2018.
  32. ASTM C142; Test Method for Clay Lumps and Friable Particles in Aggregates. ASTM International: West Conshohocken, PA, USA, 2017.
  33. ASTM D4791; Test Method for Flat Particles, Elongated Particles, or Flat and Elongated Particles in Coarse Aggregate. ASTM International: West Conshohocken, PA, USA, 2019.
  34. ASTM C117; Test Method for Materials Finer than 75-Um (No. 200) Sieve in Mineral Aggregates by Washing. ASTM International: West Conshohocken, PA, USA, 2023.
  35. ASTM C128; Test Method for Relative Density (Specific Gravity) and Absorption of Fine Aggregate. ASTM International: West Conshohocken, PA, USA, 2022.
  36. ASTM D2419; Test Method for Sand Equivalent Value of Soils and Fine Aggregate. ASTM International: West Conshohocken, PA, USA, 2022.
  37. ASTM D854; Test Methods for Specific Gravity of Soil Solids by Water Pycnometer. ASTM International: West Conshohocken, PA, USA, 2023.
  38. ASTM D2216; Test Methods for Laboratory Determination of Water (Moisture) Content of Soil and Rock by Mass. ASTM International: West Conshohocken, PA, USA, 2019.
  39. ASTM D4318; Test Methods for Liquid Limit, Plastic Limit, and Plasticity Index of Soils. ASTM International: West Conshohocken, PA, USA, 2017.
  40. AASHTO M 323; Standard Specification for Superpave Volumetric Mix Design. American Association of State Highway and Transportation Officials (AASHTO): Washington, DC, USA, 2017.
  41. AASHTO T 324; Standard Method of Test for Hamburg Wheel-Track Testing of Compacted Asphalt Mixtures. American Association of State Highway and Transportation Officials (AASHTO): Washington, DC, USA, 2019.
  42. ASTM D6927; Test Method for Marshall Stability and Flow of Asphalt Mixtures. ASTM International: West Conshohocken, PA, USA, 2022.
  43. ASTM D2041; Test Method for Theoretical Maximum Specific Gravity and Density of Bituminous Paving Mixtures. ASTM International: West Conshohocken, PA, USA, 2019.
  44. ASTM D6931; Standard Test Method for Indirect Tensile (IDT) Strength of Asphalt Mixtures. ASTM International: West Conshohocken, PA, USA, 2017.
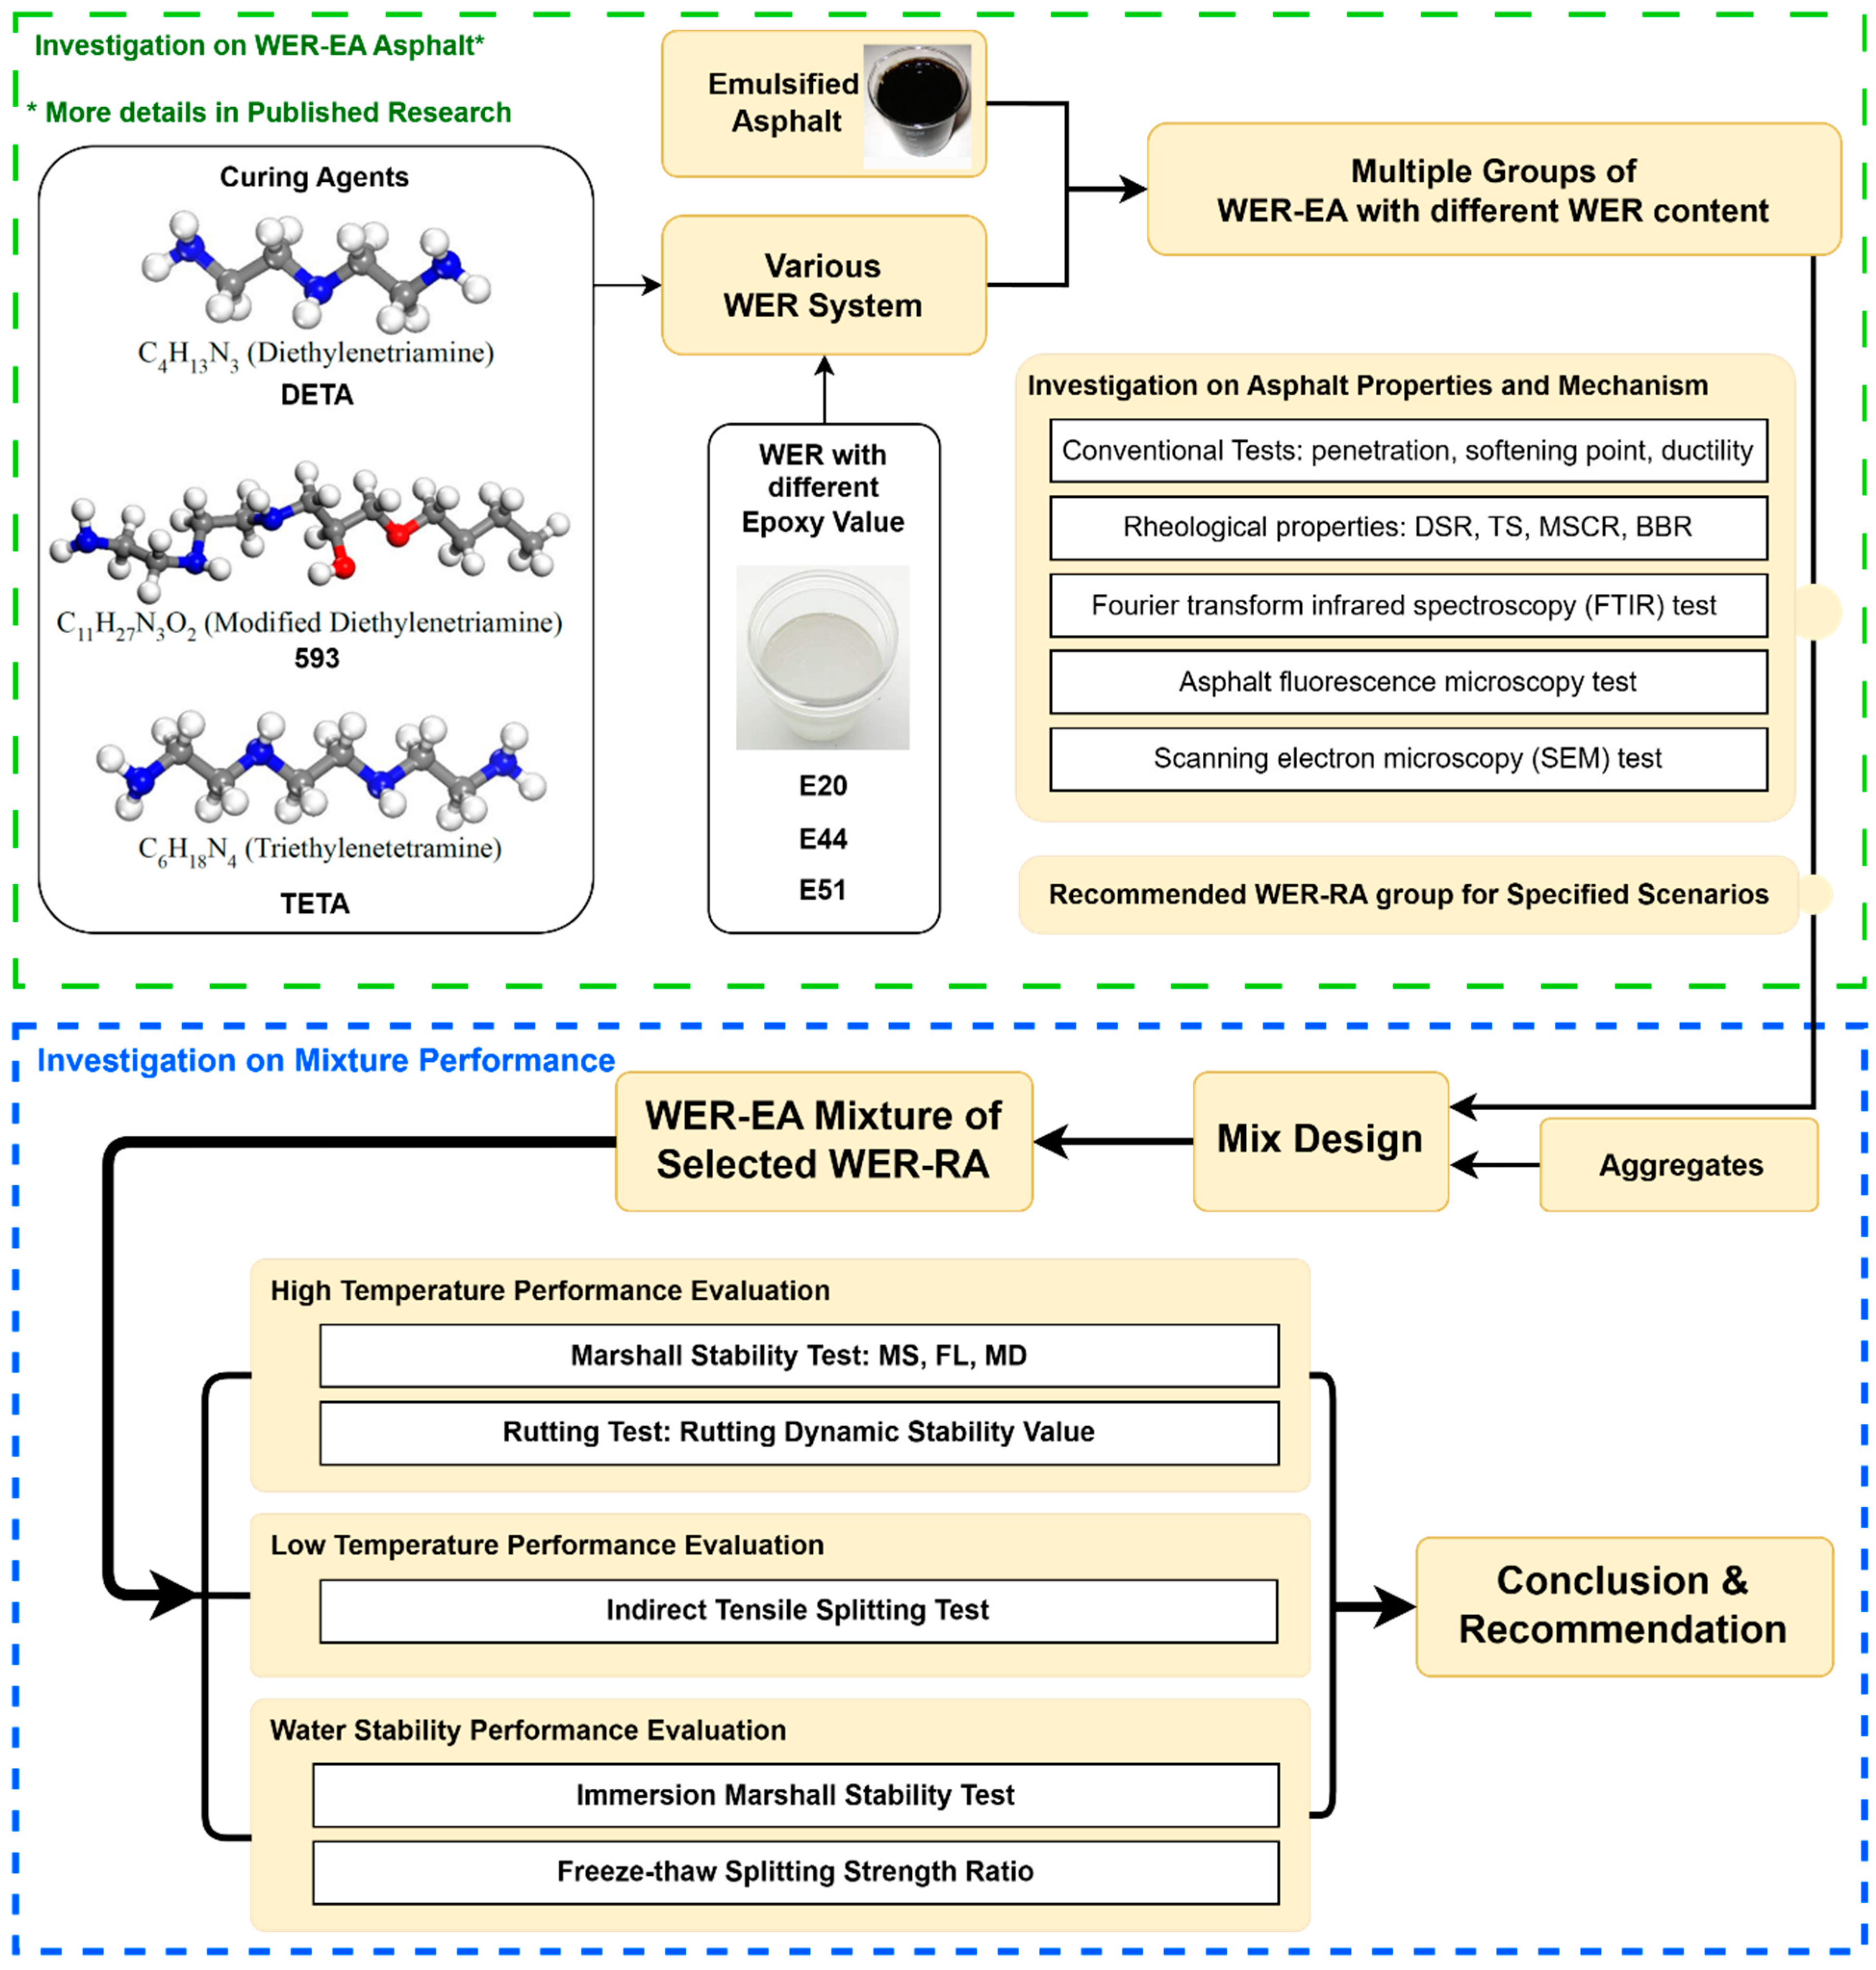
Figure 1. Experimental procedure.
Applsci 14 01353 g001
Figure 2. Grading curve of AC-13 mixture.
Applsci 14 01353 g002
Figure 3. Appearance of mixture at optimal water consumption.
Applsci 14 01353 g003
Figure 4. Marshall test indexes under different emulsion dosages. (a). the relative density ( γ f ), (b). Marshall stability (MS), (c). flow value (FL), (d). volume of void space (VV), (e). voids in mineral aggregates (VMA), and (f). voids filled with asphalt (VFA). Solid line: connected line; Dotted line: Trend curve.
Applsci 14 01353 g004
Figure 5. Stability results of asphalt mixture.
Applsci 14 01353 g005
Figure 6. Flow value results of asphalt mixtures.
Applsci 14 01353 g006
Figure 7. Marshall modulus results of asphalt mixtures.
Applsci 14 01353 g007
Figure 8. Dynamic stability results of asphalt mixtures.
Applsci 14 01353 g008
Figure 9. Results of low-temperature splitting strength of asphalt mixtures.
Applsci 14 01353 g009
Figure 10. Failure tensile strain results of asphalt mixtures.
Applsci 14 01353 g010
Figure 11. Modulus of breaking stiffness of asphalt mixtures.
Applsci 14 01353 g011
Figure 12. Marshall residue stability results of asphalt mixtures immersed in water.
Applsci 14 01353 g012
Figure 13. Freeze–thaw splitting strength ratio of asphalt mixtures.
Applsci 14 01353 g013
Table 1. Properties of 70# asphalt.
PropertyUnitTest ResultsSpecification
Requirements
Testing
Method
Penetration (25 °C, 100 g, 5 s)0.1 mm6960–80ASTM D5 [20]
Ductility (15 °C)cm124>100ASTM D113 [21]
Softening point°C46.6>46ASTM D36 [22]
Viscosity (135 °C)Pa·s0.50<3ASTM D4402 [23]
Table 2. Properties of emulsified asphalt matrix.
PropertyUnitTest ResultsSpecification
Requirements
Testing
Method
Particle charge-++ASTM D7402 [24]
Demulsification speed-Slow crackingSlow crackingASTM D244 [25]
Residue on sieve (1.18 mm sieve)%0.04≤0.1ASTM D6933 [26]
Solid content%63≥55ASTM D6934 [27]
Mixing test with coarse and fine aggregates-UniformUniform
Storage stability at room temperature (1 day)%0.55≤1ASTM D6930 [28]
Storage stability at room temperature (5 days)%3.17≤5
Evaporation residue penetration (25 °C)0.1 mm64.245–150ASTM D5 [20]
Evaporation residue softening point°C48.5-ASTM D36 [22]
Evaporation residue ductility (15 °C)cm80.3≥40ASTM D113 [21]
Table 3. Properties of WER.
PropertyUnitTest Results
E20E44E51
Appearance-Milky white homogeneous liquid
Epoxy valueeq/100 g0.210.440.51
Epoxy equivalentg/mol456227196
Solid content%50 ± 2
Table 4. Properties of curing agents.
PropertyUnitTest Results
DETA593TETA
Appearance-Light yellow
transparent liquid
Light-colored
transparent liquid
Light yellow
viscous liquid
Molecular weight-103.17217.13146.23
Amine valuemg KOH/g1617.8603.51498.0
Solid content%>99>99>99
Densityg/cm30.9600.9850.982
Boiling point°C207170278
Table 5. Properties of coarse aggregates.
PropertyTest ResultsSpecification
Requirements
Test Method
Los Angeles wear loss17.0%≤30%ASTM C131 [29]
Crush value19.9%≤28%ASTM C136 [30]
Soundness4.0%≤12%ASTM C88 [31]
Soft stone content1.2%≤3.0%ASTM C142 [32]
Needle flake content9.9%≤15%ASTM D4791 [33]
Particle size ≥ 9.5 mm10.0%≤12%ASTM D4791 [33]
Particle size ≤ 9.5 mm11.9%≤18%ASTM D4791 [33]
Table 6. Properties of fine aggregates.
PropertyTest ResultsSpecification
Requirements
Test Method
Sludge content (≤0.075 mm)1.9%≤3%ASTM C117 [34]
Apparent relative density2.701≥2.50ASTM C128 [35]
Sand equivalent77.6%≥30%ASTM D2419 [36]
Soundness5.1%≤12%ASTM C88 [31]
Table 7. Properties of mineral fines.
PropertyTest ResultsSpecification
Requirements
Test Method
AppearanceNo clumpingNo clumping-
Apparent density2810 kg/m3≥2500 kg/m3ASTM D854 [37]
Hydrophilic coefficient0.69<1ASTM D2419 [36]
Moisture content0.19%≤1%ASTM D2216 [38]
Plasticity index2.8%<4%ASTM D4318 [39]
Table 8. Aggregate density indexes for each grade.
Property10–20 Gears5–10 GearsStone Chips
Apparent relative density2.6912.7792.656
Gross volume relative density2.6022.6982.599
Water absorption0.29%0.70%0.50%
Table 9. Design gradation of AC-13 asphalt mixture.
Aggregate Mass Percentage (%) Passing the Following Sieve Holes (mm)
1613.29.54.752.361.180.60.30.150.075
Upper Limit100100856850382820158
Lower limit100906838241510754
Median gradation1009576.5533726.51913.5106
Table 10. O A C m i n and O A C m a x values of different indicators.
PropertiesVVVFAMSFL
Specification requirements4~6%65~75%≥3 kN1.5~4 mm
O A C m i n 7.7%8.95%7.7%7.7%
O A C m a x 9.7%9.7%9.7%9.7%
Table 11. Marshall indicators at optimal asphalt dosage.
PropertyEAE20-TE44-TE51-TSpecification
Requirements
γ f 2.022.242.392.12/
VV/%11.857.558.008.01/
MS/kN4.946.245.676.21≥3
FL/mm3.562.062.662.191.5~4
VMA/%22.1919.2721.0520.20≥14
VFA/%65.0272.9166.2666.7865~75
Disclaimer/Publisher’s Note: The statements, opinions and data contained in all publications are solely those of the individual author(s) and contributor(s) and not of MDPI and/or the editor(s). MDPI and/or the editor(s) disclaim responsibility for any injury to people or property resulting from any ideas, methods, instructions or products referred to in the content.