Article

Mechanism of Stratum Instability and Dynamic Deformation under Discontinuous Boundary Conditions

1
School of Resource, Environment and Safety Engineering, Hunan University of Science and Technology, Xiangtan 411201, China
2
Hunan Provincial Key Laboratory of Safe Mining Techniques of Coal Mines, Hunan University of Science and Technology, Xiangtan 411201, China
3
College of Mining, Guizhou Institute of Technology, Guiyang 550003, China
*
Author to whom correspondence should be addressed.
Appl. Sci. 2024, 14(4), 1441; https://doi.org/10.3390/app14041441
Submission received: 18 December 2023 / Revised: 31 January 2024 / Accepted: 6 February 2024 / Published: 9 February 2024

Abstract

:
A fault disrupts the continuity of the rock strata in a mining area. To study the law governing the fracture of overlying strata in mining areas under discontinuous boundary conditions, the overlying strata were redefined and grouped based on the activity characteristics of each rock layer during the overall movement of the overlying strata. The activity patterns of different layers of the fault were obtained through the movement and failure forms of each group of rock layers. The relationship among the size of the coal pillar at the boundary of the fault, the dip angle of the fault, and the movement angle of the rock strata was considered. A model of the spatial relationship between the overlying rock movement zone of the quarry and the fault surface was established. The limit equilibrium equations of the key layer in the fault zone before breaking were established based on the tensile strength of the rock layer. In addition, the mechanical slip instability criterion and the deflection instability criterion of the discontinuous-boundary rock mass are given herein. Based on a field case, a double criterion was used to determine the initiating activated rock layers of the fault in the cases where the fault dip was smaller than the rock movement angle. Rock movement during excavation was simulated by similar simulation tests, and different levels of rock movement patterns in the boundary fault zone were focused on monitoring and analyzing. The stress and displacement changes in different rock layers in the fault zone were analyzed with numerical simulation results. The results show the following: if the dip angle of the fault is smaller than the movement angle of the rock layer, the delamination space of the fault surface is mainly distributed in the bending and sinking zone of the overlying rock; with an increase in the working-face advancement distance, the vertical pressure of the upper part of the fault gradually decreases, and the stress-concentration area in the middle and lower part of the fault gradually increases; the rock layer of the upper part of the fault, which is mainly composed of the key stratum, is the main area of activation of the fault.

1. Introduction

Faults, as a common geological structure in mining, are often involved in the activities of overburden in the quarry. The discontinuous structure of faults severely restricts the orderly and regular activity of the overburden in the quarry. The instability of the fault structure and the fragmentation of the surrounding rock will change the pressure step of the overlying rock, the stability of the masonry beam structure and the stress distribution of the surrounding rock, etc. [1,2,3,4]. The theories of structural modeling, destabilization criteria, energy transfer criteria, and stability control of surrounding rock for independent faults have been gradually improved. Li et al. [5] studied the disaster control mechanism through which multiple factors such as faults, coal seams, and the roof and floor surrounding rocks affect the formation of rockburst based on the mechanism of faults acting on rockburst. Jiao et al. [6] derived the law governing the evolution of mining-induced fault damage slip by on-site microseismic monitoring and constructing a fault slip evaluation method with fault damage variables as indicators. Dou et al. [7] analyzed the similar tests and field data, and concluded that: the different directions of the working surface advancing towards the fault, the damage to the stability of the fault is different. Jiang et al. [8,9] modeled a three-dimensional working face advancing along a positive fault and concluded that the fault destroys the integrity of the working-face roof plate; most of the stresses migrate to the coal and rock body where the working face intersects the fault line. Liu et al. [10] investigated the law governing the instability of fault slip under different lateral pressures and fault dip angles through direct shear friction sliding tests. Pan et al. [11] summarized the distribution pattern of rockburst and proposed three new basic characteristics: fault displacement, coal compression, and top fault. The research results of many scholars at home and abroad show that mining-induced fault destabilization is the direct cause of fault impact ground pressure, and the dynamic and static loading effects of mining coal on the rock body can easily induce coal-mine impact ground pressure [12,13,14,15]. Jiang et al. [16] monitored the mining activities of Huafeng Coal Mine in Shandong Province using their self-developed explosion-proof microseismic positioning and monitoring (MS) system. They found that the occurrence of rockburst pressure is closely related to rock fracture, determined the safe distance between the working face and the fault, and proposed measures to eliminate the impact pressure caused by fault zones. Wang et al. [17] took the Laohutai Mine in Fushun as an example and determined the impact-tendency criterion based on 3 g acceleration through numerical calculations. The area with an acceleration greater than 3 g was defined as the significant area of rockburst, while the area with an acceleration less than 3 g is defined as the nonsignificant area of rockburst. Based on this, the hazardous areas for rockburst disasters were classified. Stewart et al. [18] found that faults can cause mine tremors, of which there are two types: sudden failure of surrounding rock and sliding of rock blocks along faults. Myer et al. [19] discussed and analyzed the mining seismic parameters by calculating the deformation and fracture mechanics models of fractured rock masses under loading. Krzysztof et al. [20] found through experiments and numerical simulations that a reasonable support method can effectively improve the stability of the fault area and the rock surrounding the roadway. Zhu et al. [21,22] studied the mechanical characteristics of fractured surrounding rock in damaged tunnels and analyzed the mechanical deformation and failure characteristics of fractured surrounding rock through rock mechanics experiments. Yu et al. [23,24] carried out three-dimensional geological modeling of a quarry containing close-range double faults based on the site, and through similar simulation experiments and three-dimensional numerical simulation analysis, they derived the form of mutual transformation of the energy and stress of the two faults in the whole mining process of the quarry, the overall joint control mechanism of the faults on the regional peripheral rock structure, and the law of the mutual influence of the faults, and, moreover, they gave a map of the joint action of the two faults in the whole mining process. Wu et al. [25] analyzed the occurrence mechanism of impact ground pressure in the graben tectonic zone formed by two faults by establishing mechanical models and numerical simulations. Wang et al. [26] analyzed the role relationship between the damage characteristics of overburden rock and anchor loads in a double fault zone through similar simulation tests.
In terms of fault slip mechanics models, a micro-element fault plane mechanics model based on the Anderson fracture mechanism has been established [27]. A fault mechanics instability model based on the fault mechanics model has been established for the study of key layers in the working face [28]. The above model is based on the overlying rock structure after the key layer is broken. For small coal pillars and a hard, thick roof, fault instability is more likely to occur before the key layer is broken. To this end, a fault mechanics instability model under the ultimate tensile stress before the critical layer fracture was derived, and the horizontal sliding criterion and rotational instability criterion were established in this model. A dual criterion calculation was conducted on specific cases to determine the failure and instability mode of the interruption layer in the case model, which was verified through numerical simulation analysis.

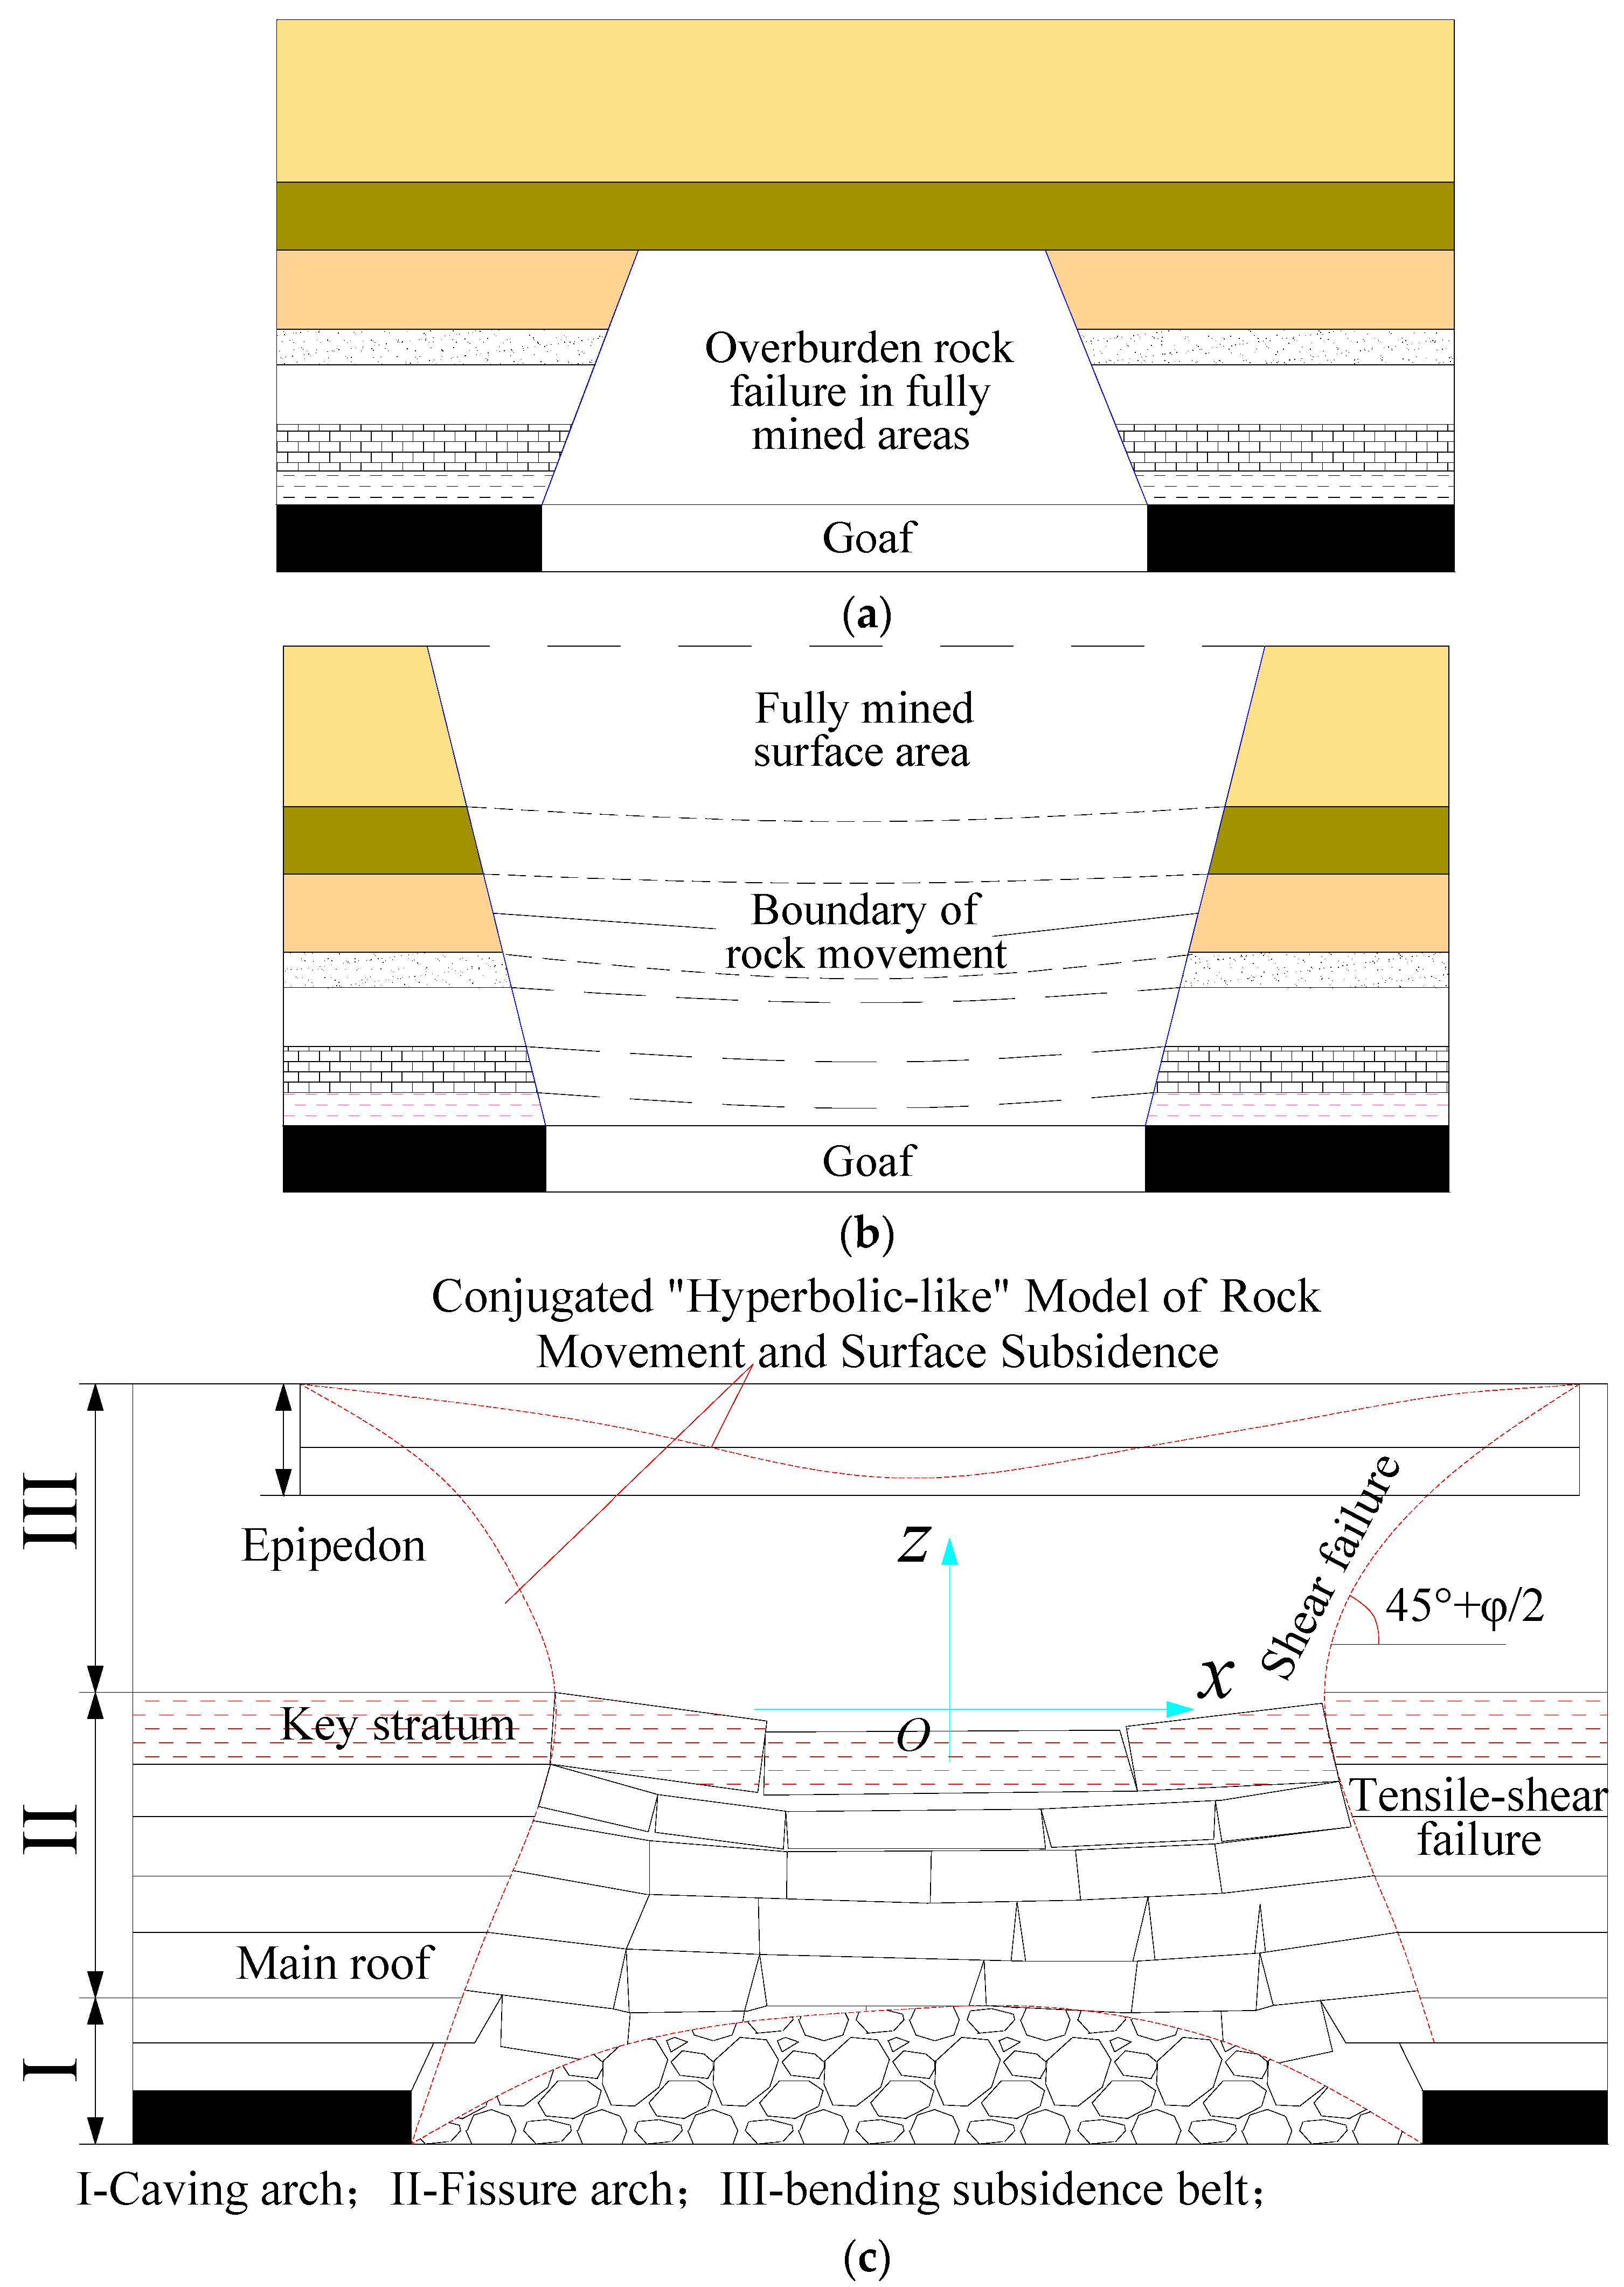
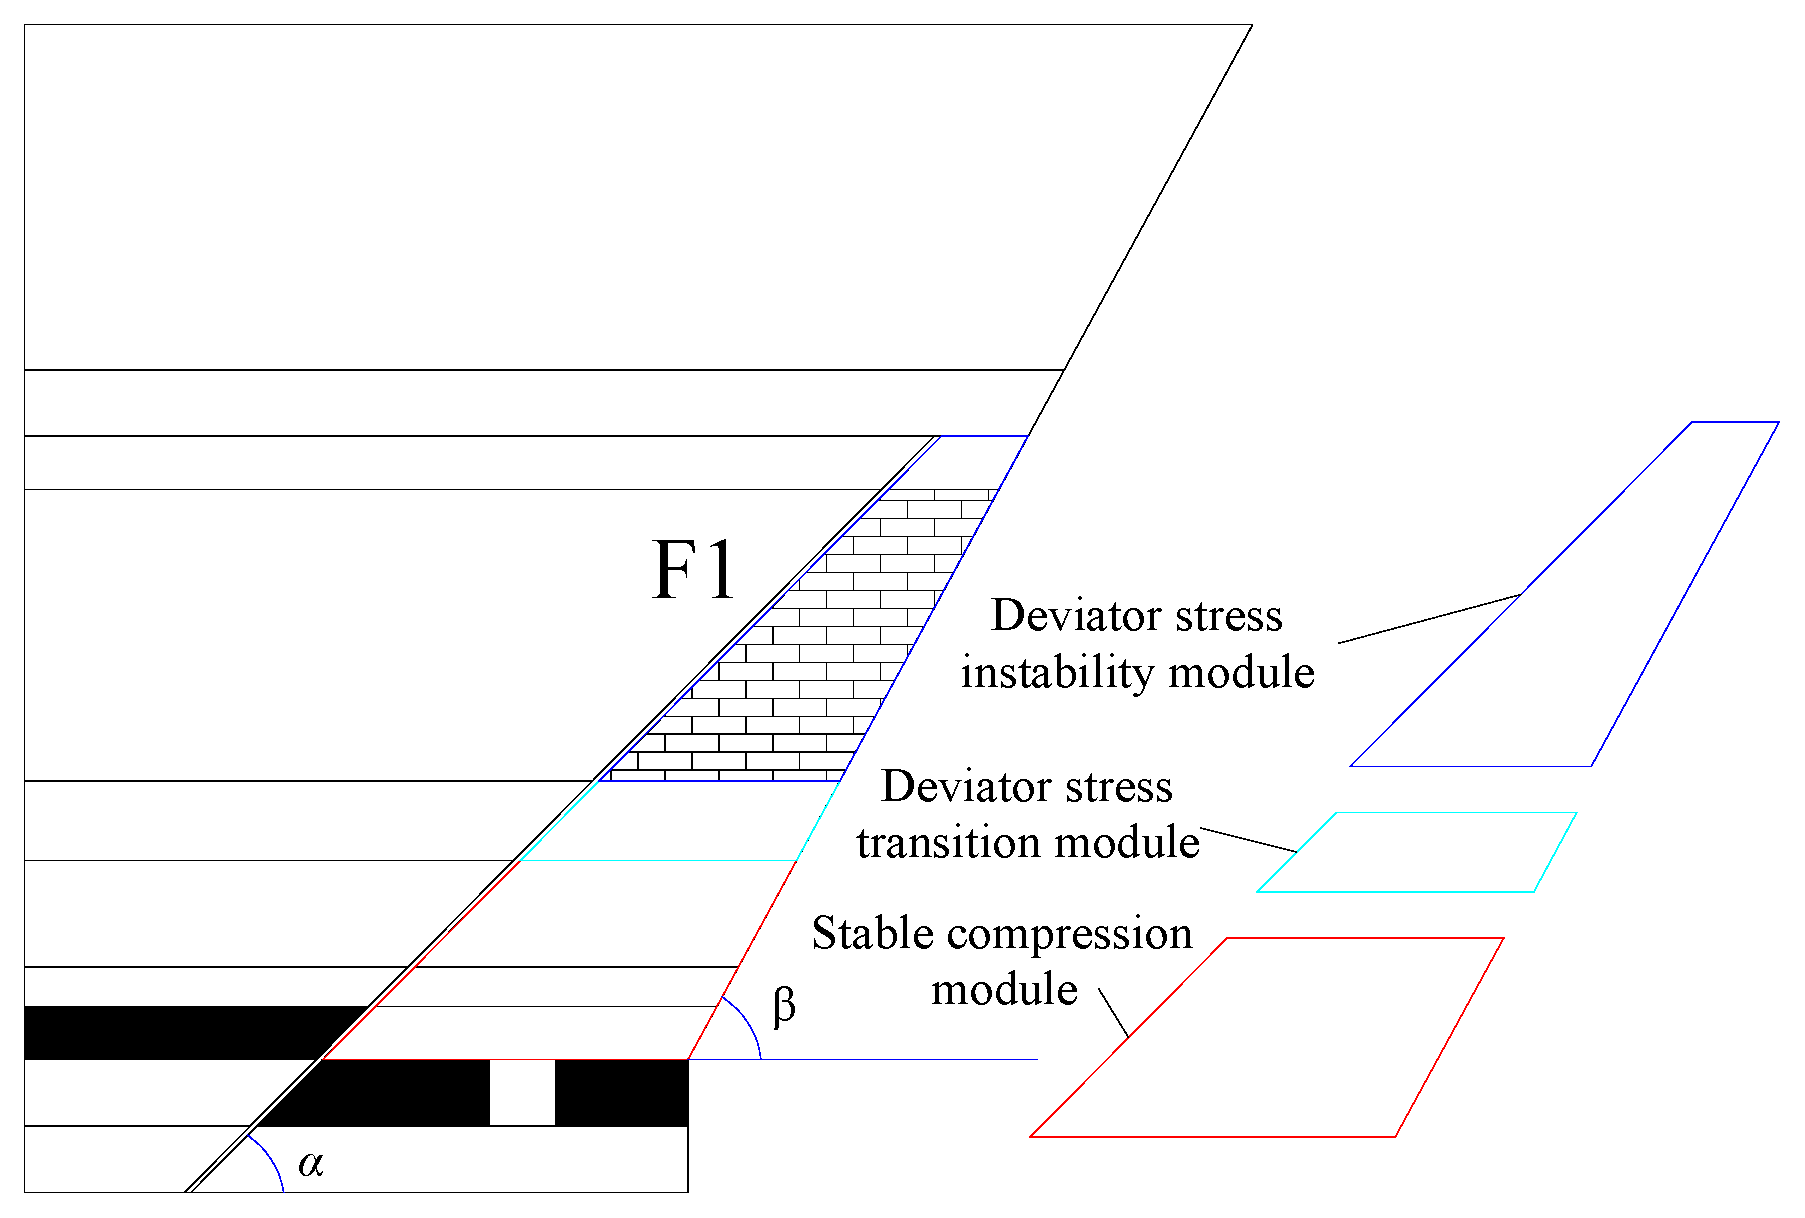
2. Characteristics of Rock Movement in the Fault Zone

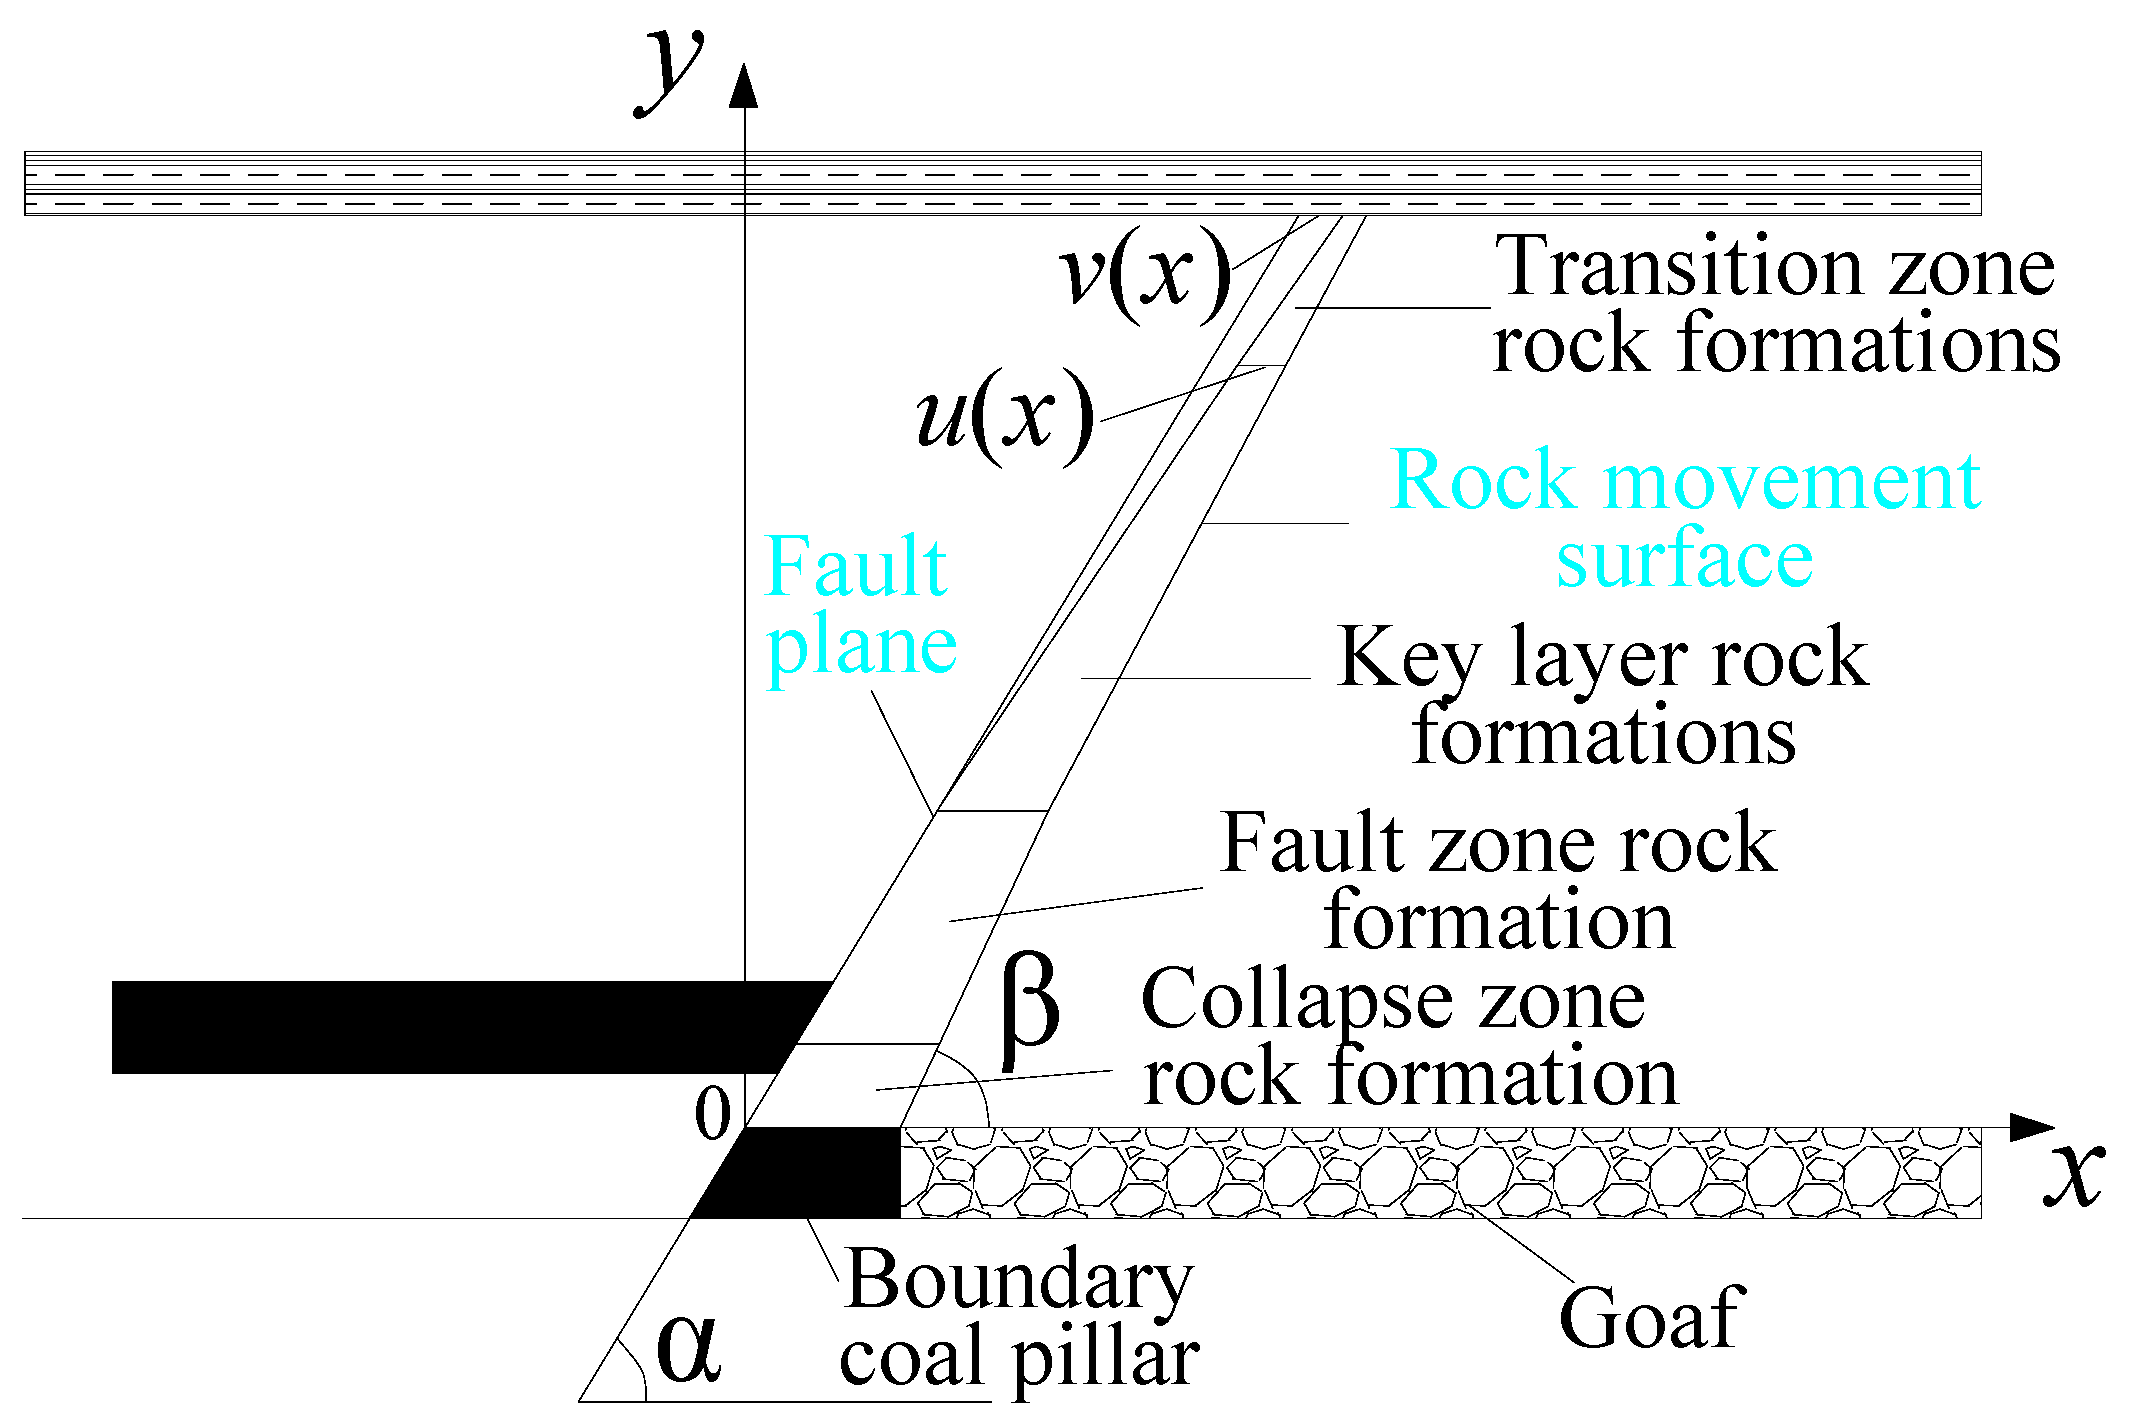
2.1. Characterization of Rock Movement

According to factors such as mining depth, overlying rock structure, and height of goaf, rock layer movement can be divided into the following three situations: (1) a mining layer movement model having multiple key layers and forming a stable three-zone structure, as shown in Figure 1a; (2) a surface subsidence rock movement model with few key layers and unstable overlying strata in goaf, as shown in Figure 1b; and (3) an internal and external hyperbolic overall movement model of rock strata movement and surface subsidence, as shown in Figure 1c.

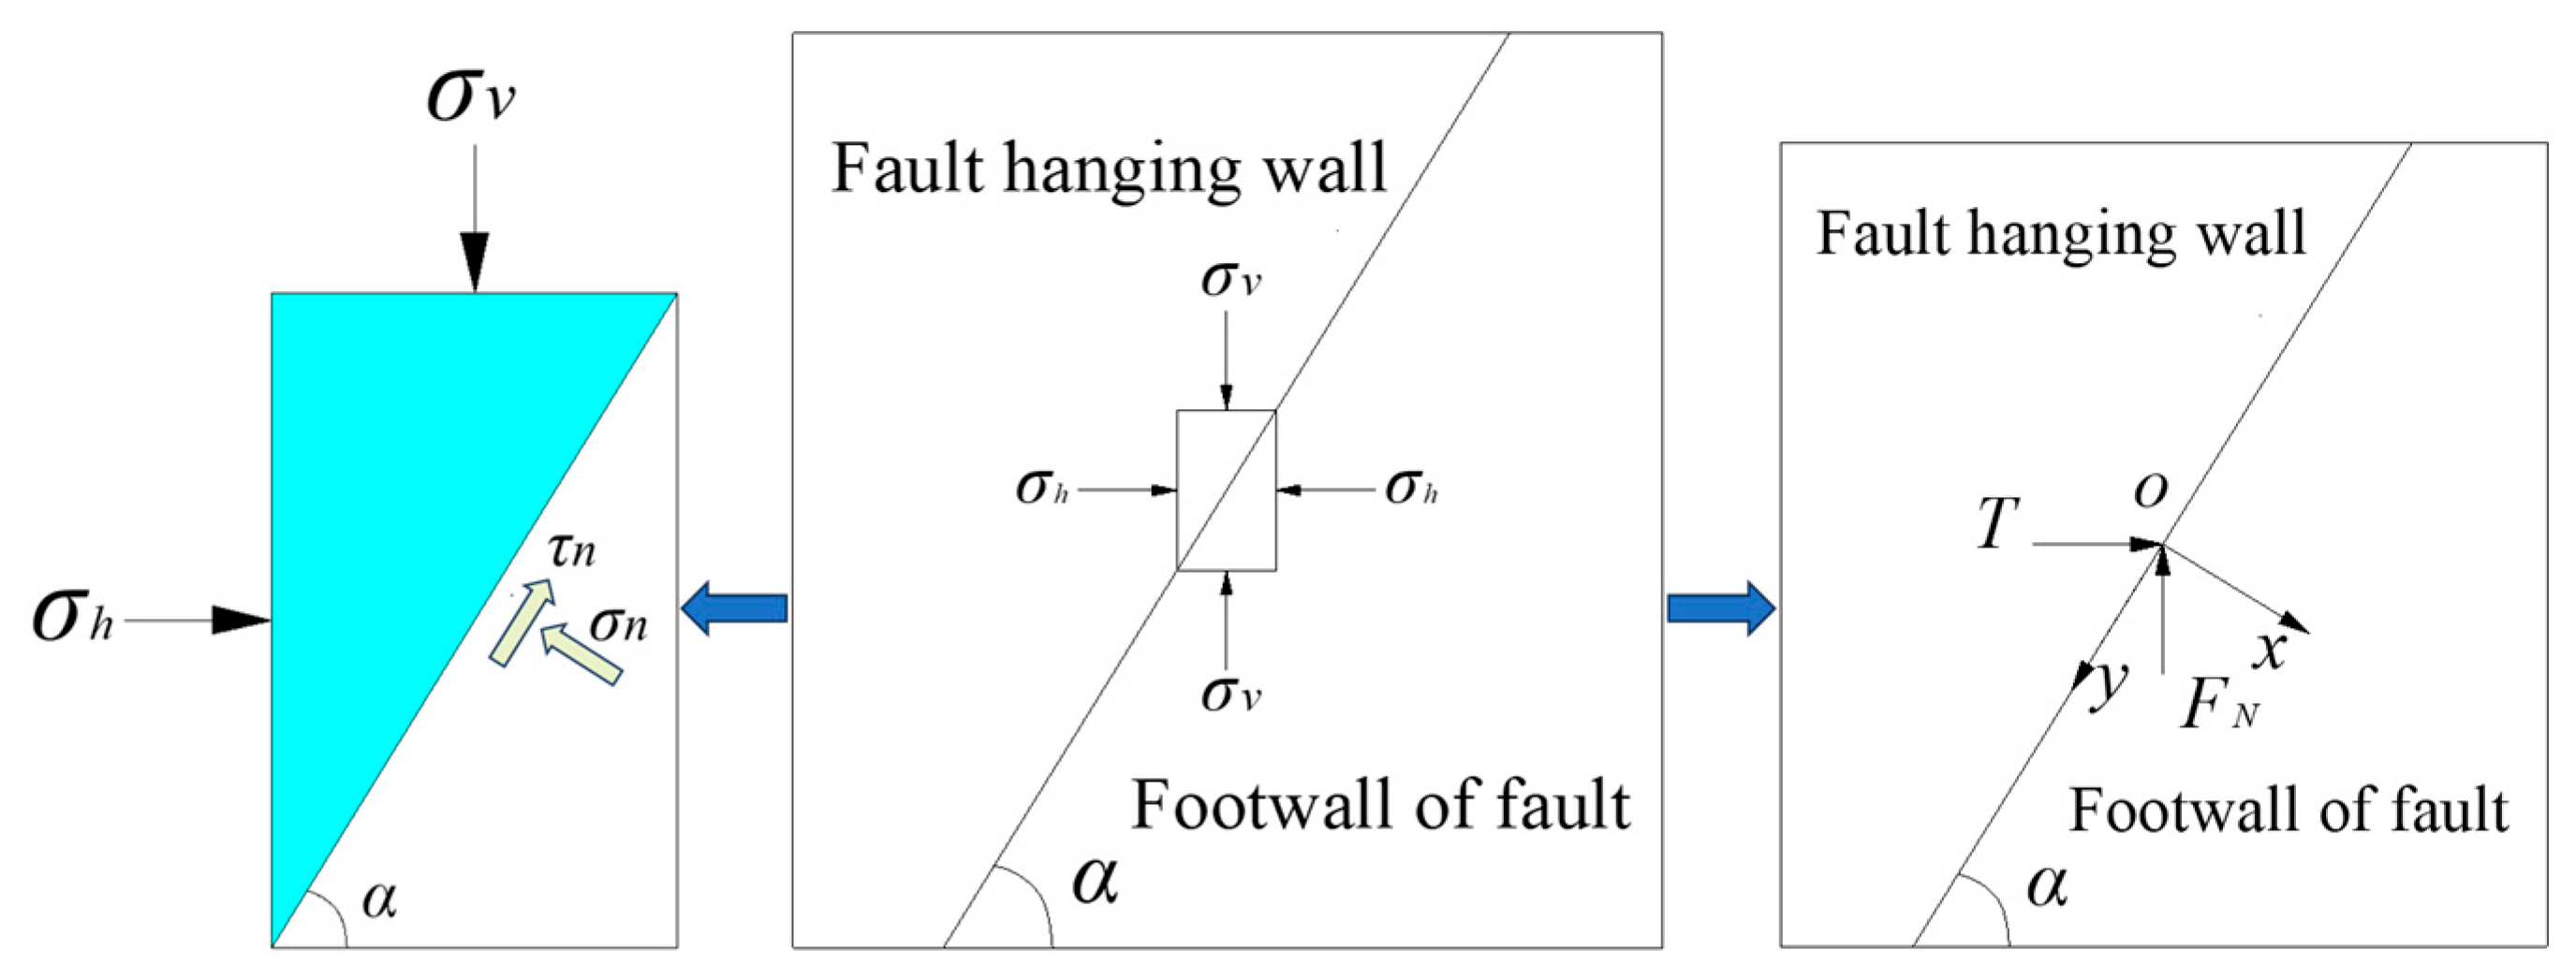
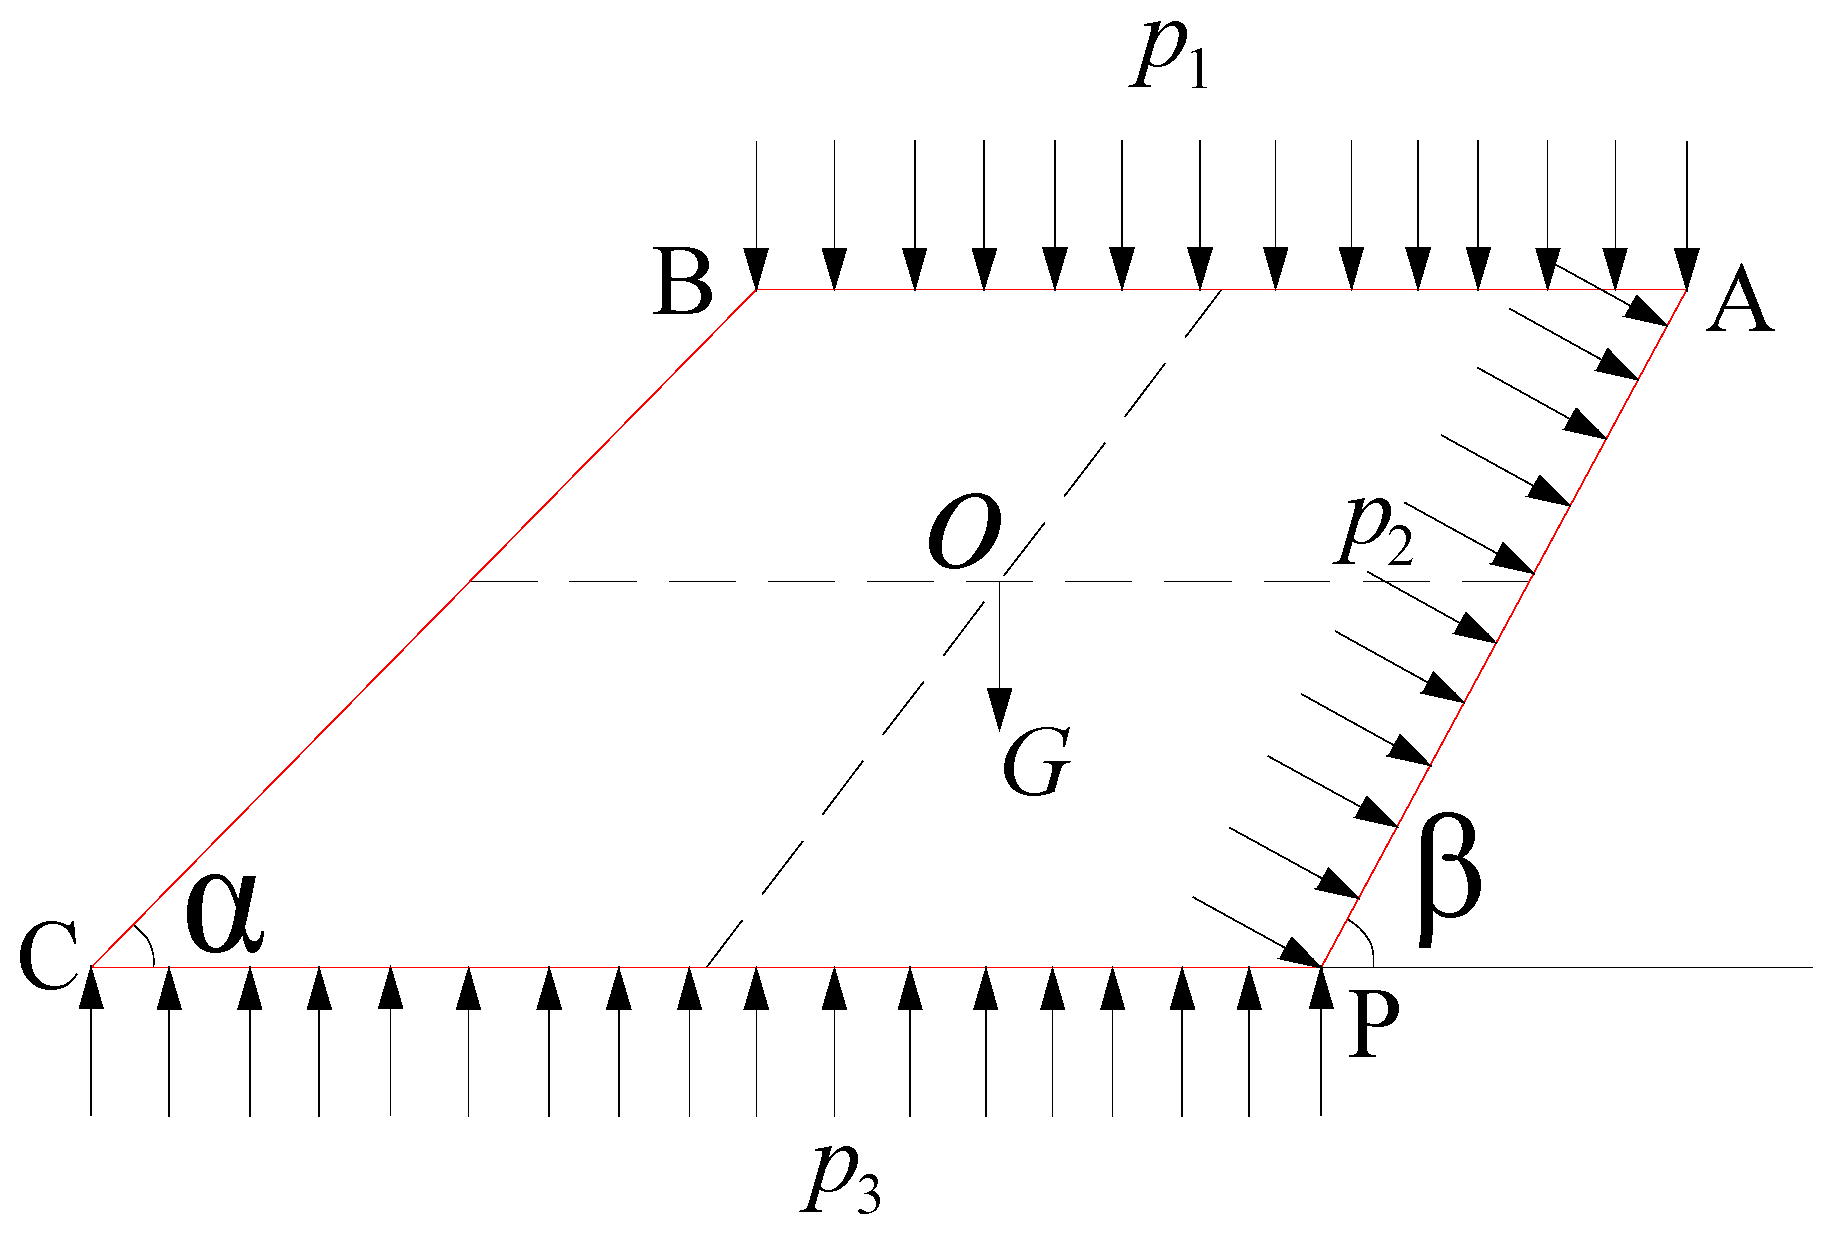
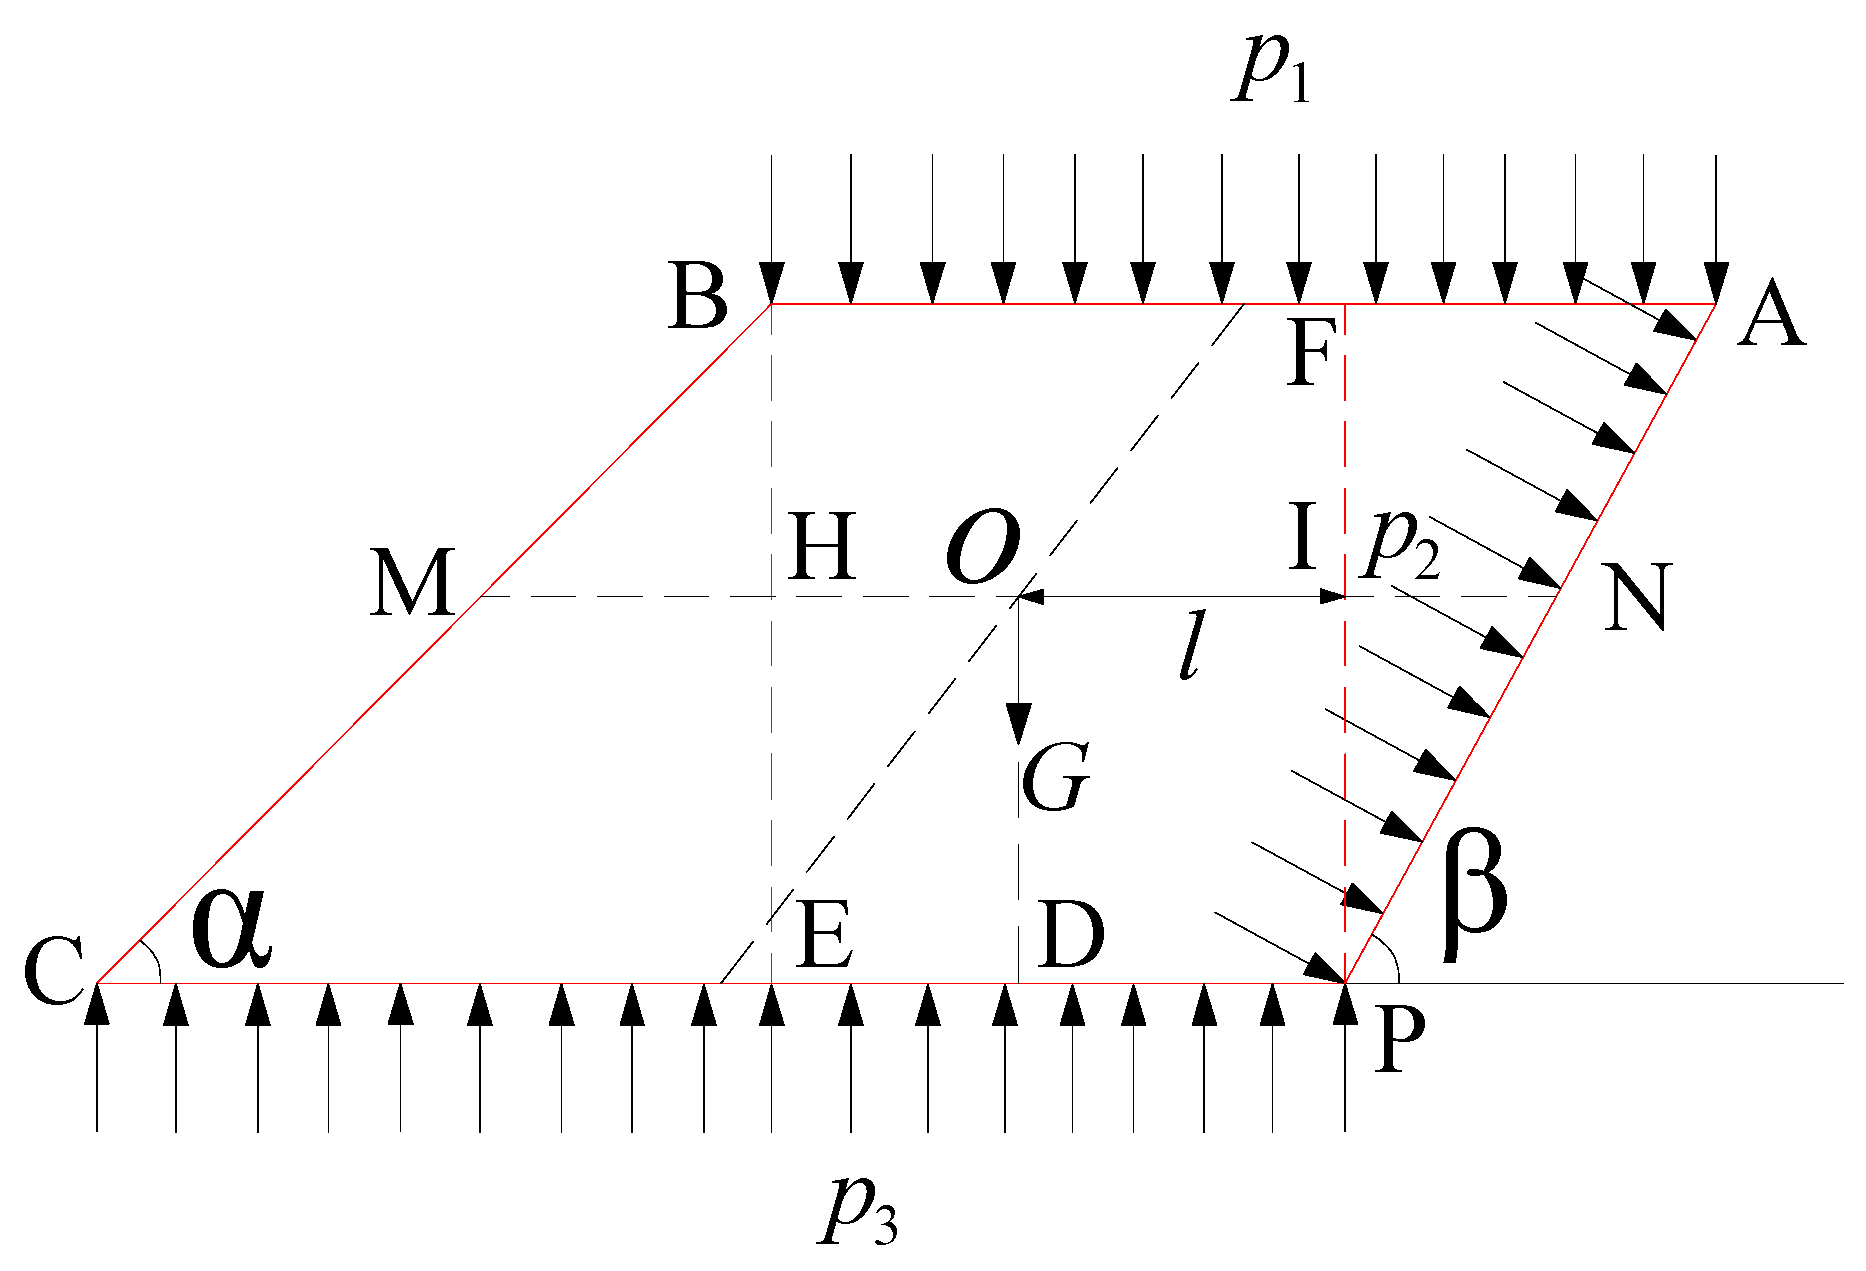
2.2. Fault Mechanics Model

A micro-element fault plane mechanical model based on the Anderson fracture mechanism has been established for the mechanical instability model of fault plane slip [27]. The micro-element mechanical model of the fault is shown in Figure 2. Take a micro-element in a two-dimensional fault section with the fault line as the diagonal; the fault plane where the fault line is located is the weak structural plane inside the micro-element. The normal stress on this weak structural plane (σn) and shear stress (τn) can be expressed as follows:
σ n = 1 2 ( σ h + σ v ) 1 2 ( σ h σ v ) cos 2 α τ n = 1 2 ( σ h σ v ) sin 2 α
where α is the fault dip angle, in °; σh is the horizontal stress received by the micro-element, in MPa; and σv is the vertical stress received by the micro-element, in MPa.
If the micro-element in the fault plane slips along the weak structural plane, the shear stress on the weak structural plane should be greater than the sum of the maximum static friction force generated by the normal stress on the structural plane and the cohesion of the structural plane itself. According to the Mohr–Coulomb strength theory, the ultimate shear stress of the weak structural plane in the fault plane micro-element is as follows:
τ f = σ n tan φ f + c f
where τf is the limit shear stress under the normal stress of the fault plane, in MPa; τn is the internal friction angle of the fault plane, in °; and cf is the fault plane cohesion, in MPa.
Meanwhile, a macroscopic mechanical instability model of the fault was obtained; the mechanical model of the fault is shown in Figure 2. The support stress FN and horizontal stress T on the fault plane are decomposed along the fault:
F x = T sin α F N cos α F y = T cos α + F N sin α
where FN is the support force of the footwall of the fault to the fault plane, in kN; t is the horizontal extrusion force of the hanging wall of the fault on the fault surface, in kN; α is the fault dip angle, in °; Fx is the force in the x direction of the fault plane, in N; and Fy is the force in the y direction at the fault plane, in N.
The instability criterion of fault slip is as follows:
F x tan φ = F y
where φ is the internal friction angle of the rock mass in the fault zone, in °.
In the process of coal mining, due to the existence of goaf and the movement of overlying strata, the abovementioned fault slip instability model can no longer meet and accurately describe the failure instability mode of stope faults. The difference in the layered structure and lithology of the overlying strata in goaf determines the diversity of the vertical stratum movement mode of overlying strata in the stope. Therefore, the mechanisms and mechanical models of fault instability in different stratum movement models are different. Aiming at the stratum movement model of the stope without the surface subsidence area, considering that the movement state of the key stratum plays a leading role in the overlying stratum activity of the stope, the fault slip model and mechanical instability criterion after the key stratum is broken are given [28]. Based on the fault mechanics model, the model takes the key layer as the research object and considers the horizontal force T and vertical force R [30] between the broken rock blocks in the structure of the ‘masonry beam’ after the key layer is broken. At the same time, the advanced abutment pressure F1(x) and the original rock abutment pressure function F2(x) [31] are introduced. The mechanical instability model of the fault at the key layer of the upper and lower mining is shown in Figure 3. In the figure, M is the thickness of coal the seam, in m; H is the key layer’s thickness, in m; h is the thickness of the rock layer above the key layer, in m; h1 is the thickness of the weak rock layer under the key stratum, in m; L1 is the width of the limit equilibrium zone of the fault coal pillar, in m; L2 is the width of the elastic zone of the fault coal pillar, in m; L3 is the distance from the original rock stress zone to the fault, in m; A and B are the fractured rock blocks of the key strata; θ is the fault dip angle, in °; ψ is the span angle of the lower rock mass of the key stratum, in °; and θ1 is the rotation angle of the key block A, in °.
The above model is established under the condition of the key stratum breaking, but under the condition of a small coal pillar and a thick and hard roof, the possibility of fault instability before the key stratum breaks is much greater than that after the key stratum breaks. The instability mode before the fracture of the key strata is often the structural instability of the roof strata. Due to the limitation of fault-protection coal pillars, fault slip instability mainly leads to stress concentration and impaction of the coal pillars. In contrast, structural failure of the fault is more harmful.

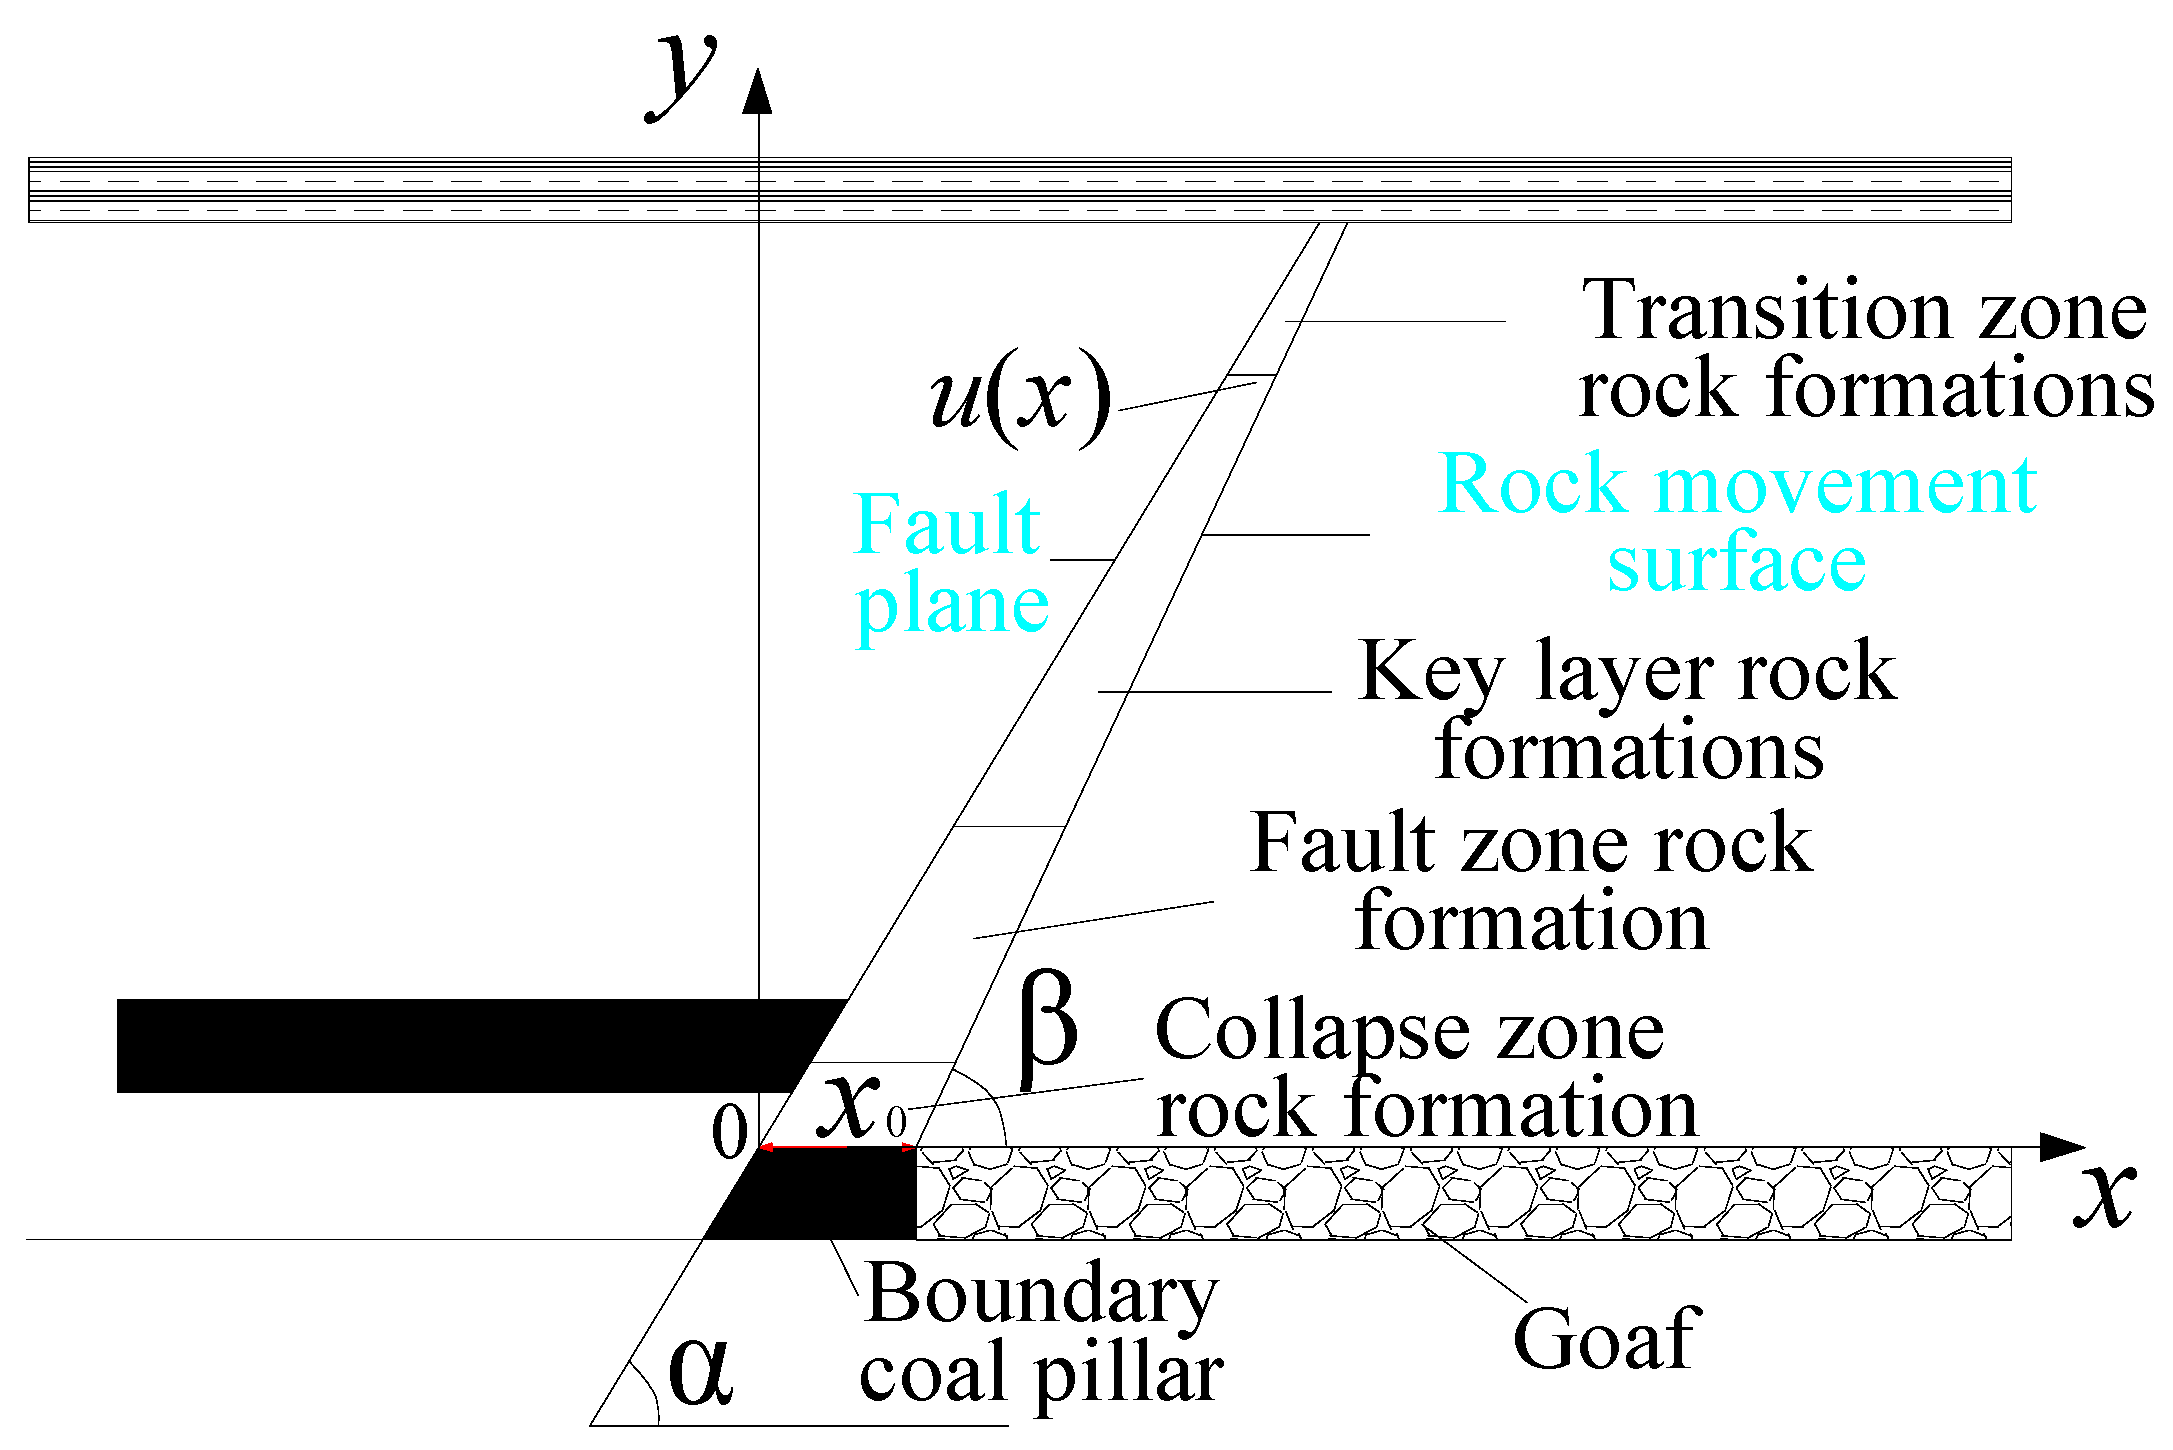
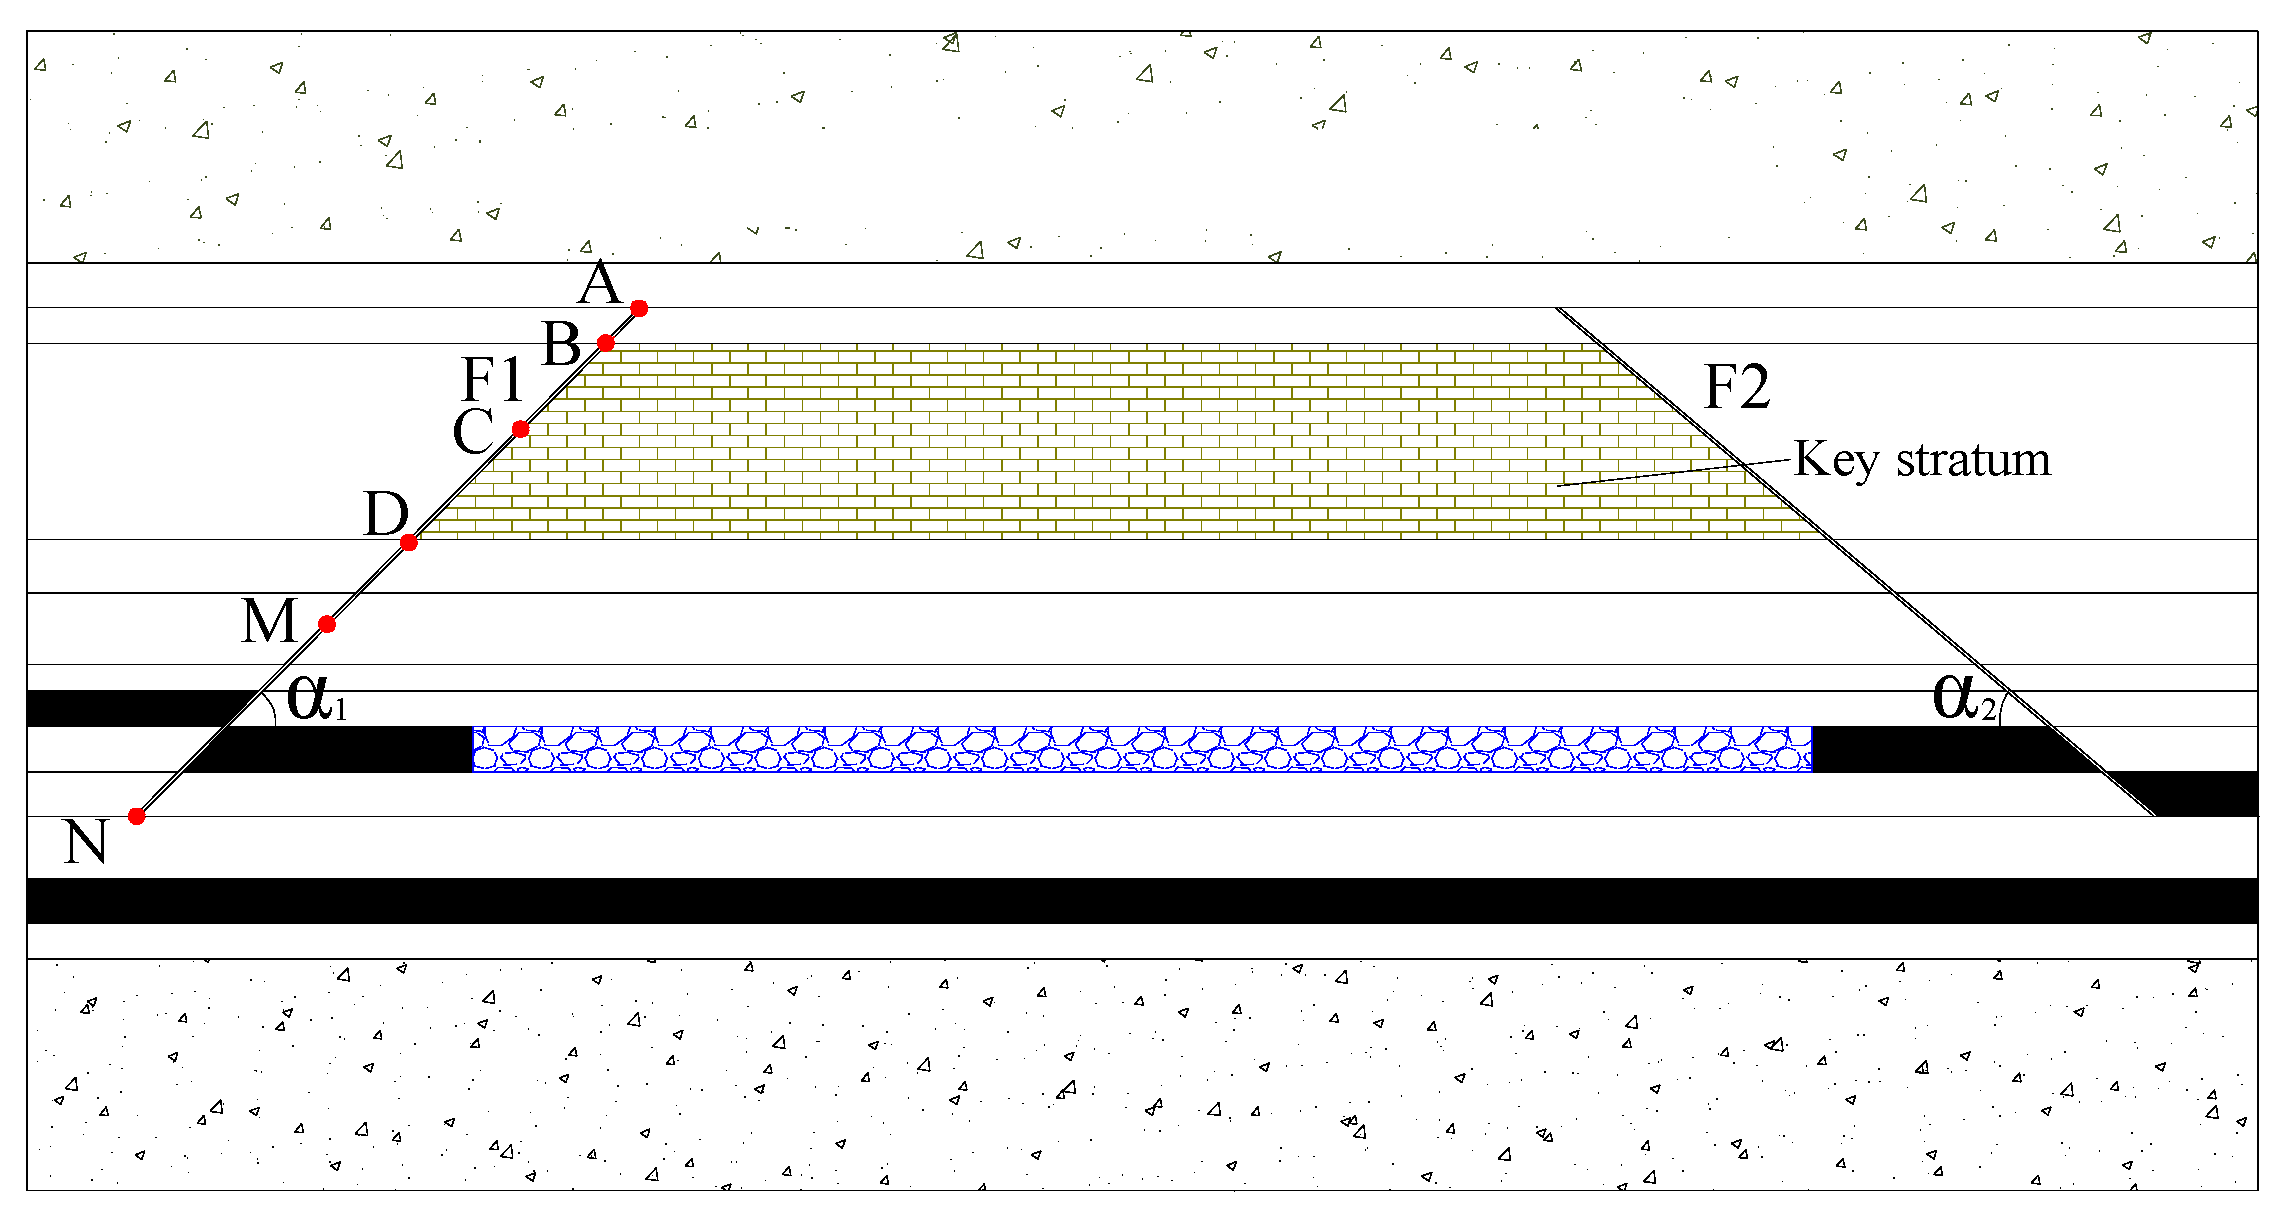
3. Model of Relationship between Fault Plane and Stratum Movement Line

The range of stratum movement angles in a stope is 60–80° [32]. When the dip of the fault plane is the same as that of the stratum movement line and the dip angle of the fault is less than 60°, the stratum movement line will gradually approach the fault plane. The adjacent rock strata with similar mechanical properties and similar rock movement angles are grouped. Therefore, the consistent stratum movement angle of the same group can be approximated. The model of the fault plane and rock movement line is shown in Figure 4. The moving line coefficient of rock strata in different groups is as follows:
K 1 = h 11 k 11 + h 12 k 12 + + h 1 n k 1 n h 11 + h 12 + + h 1 n
K n = h n 1 k n 1 + h n 2 k n 2 + + h n n k n n h n 1 + h n 2 + + h n n
k n n = tan β n n
where hnn is the thickness of the nth rock layer in the nth group, in m; knn is the nth stratum movement line coefficient in the nth group; and βnn is the movement angle of different strata in different groups, in °.
The stope rock movement line function is as follows:
f x = K 1 x x 0 x 0 x x 0 + h 1 K 1 K 2 x + H 1 K 1 x 1 x 0 + h 1 K 1 x x 0 + h 1 + h 2 K 2 K n x + H n 1 K n 1 x n 1 x 0 + h 1 + h 2 + + h n 1 K n 1 x x 0 + h 1 + h 2 + + h n K n
where
x = x 0 + h 1 + h 2 + + h n 1 + h n 1 ~ n K n
H n   =   h 1   +   h 2   + + h n
where hn is the thickness of the nth stratum group, in m; hn−1~n represents the height range of the nth layer, in m; and x0 is the distance between the working face and the upper boundary of the protective coal pillar of the fault, in m.
The horizontal distance between different horizontal fault lines and stratum movement lines is as follows:
u x = x f x tan α ( x x 0 )
where α is the fault dip angle, in °.
Equation (8) can be substituted into Equation (11) to obtain the following:
u x = x K 1 x x 0 tan α x 0 x x 0 + h 1 K 1 x K 2 x x 0 tan α x 0 + h 1 K 1 x x 0 + h 1 + h 2 K 2 x K n x x 0 tan α x 0 + h 1 + h 2 + + h n 1 K n 1 x x 0 + h 1 + h 2 + + h n K n
According to Equation (12):
u x = 1 K 1 tan α x + K 1 x 0 tan α x 0 x x 0 + h 1 K 1 1 K 2 tan α x + K 2 x 0 tan α x 0 + h 1 K 1 x x 0 + h 1 + h 2 K 2 1 K n tan α x + K n x 0 tan α x 0 + h 1 + h 2 + + h n 1 K n 1 x x 0 + h 1 + h 2 + + h n K n
According to Equation (13), it can be inferred that the function u(x) is a univariate linear equation. From Equation (14), the following can be inferred:
tan β min K n = h n 1 tan β n 1 + h n 2 tan β n 2 + + h n n tan β n n h n 1 + h n 2 + + h n n tan β max
Therefore, when the strata movement angle β is greater than the fault dip angle α, it can be concluded that u(x) is a linear inverse proportional function. As the distance x of the working face increases, the horizontal distance u(x) between the rock movement line and the fault plane gradually decreases, and the range of rock activity gradually approaches the fault’s affected area. When u(x) decreases to a certain value, the fault begins to activate, and a fault separation space appears.
From Figure 5, it can be concluded that the horizontal separation width v(x) of the fault is negatively correlated with the value of u(x). According to material mechanics [33,34,35], it is known that when the bending moment of the rock mass is less than or equal to the maximum bending moment of the rock mass, the rock mass only bends and does not break. For the discontinuous boundary of double faults, the lateral separation distance v(x) of the fault causes the overlying rock layer on the goaf to enter the curved subsidence zone sooner. The originally fractured fracture space is transferred to the fault separation space at both ends. Therefore, it can be concluded that the double faults make the overlying rock mass of the goaf transition to the bending subsidence area earlier, and the bending zone is more closely combined. The increase in the spatial transfer coefficient makes the bending zone and the upper hard rock layer form a larger separation space. The increase in the upper space further increases the height of the overlying strata. For shallow coal seams, subsidence areas on the surface result easily. At the same time, the bottom of the separation zone has greater tightness and easily forms a gas and liquid accumulation zone.

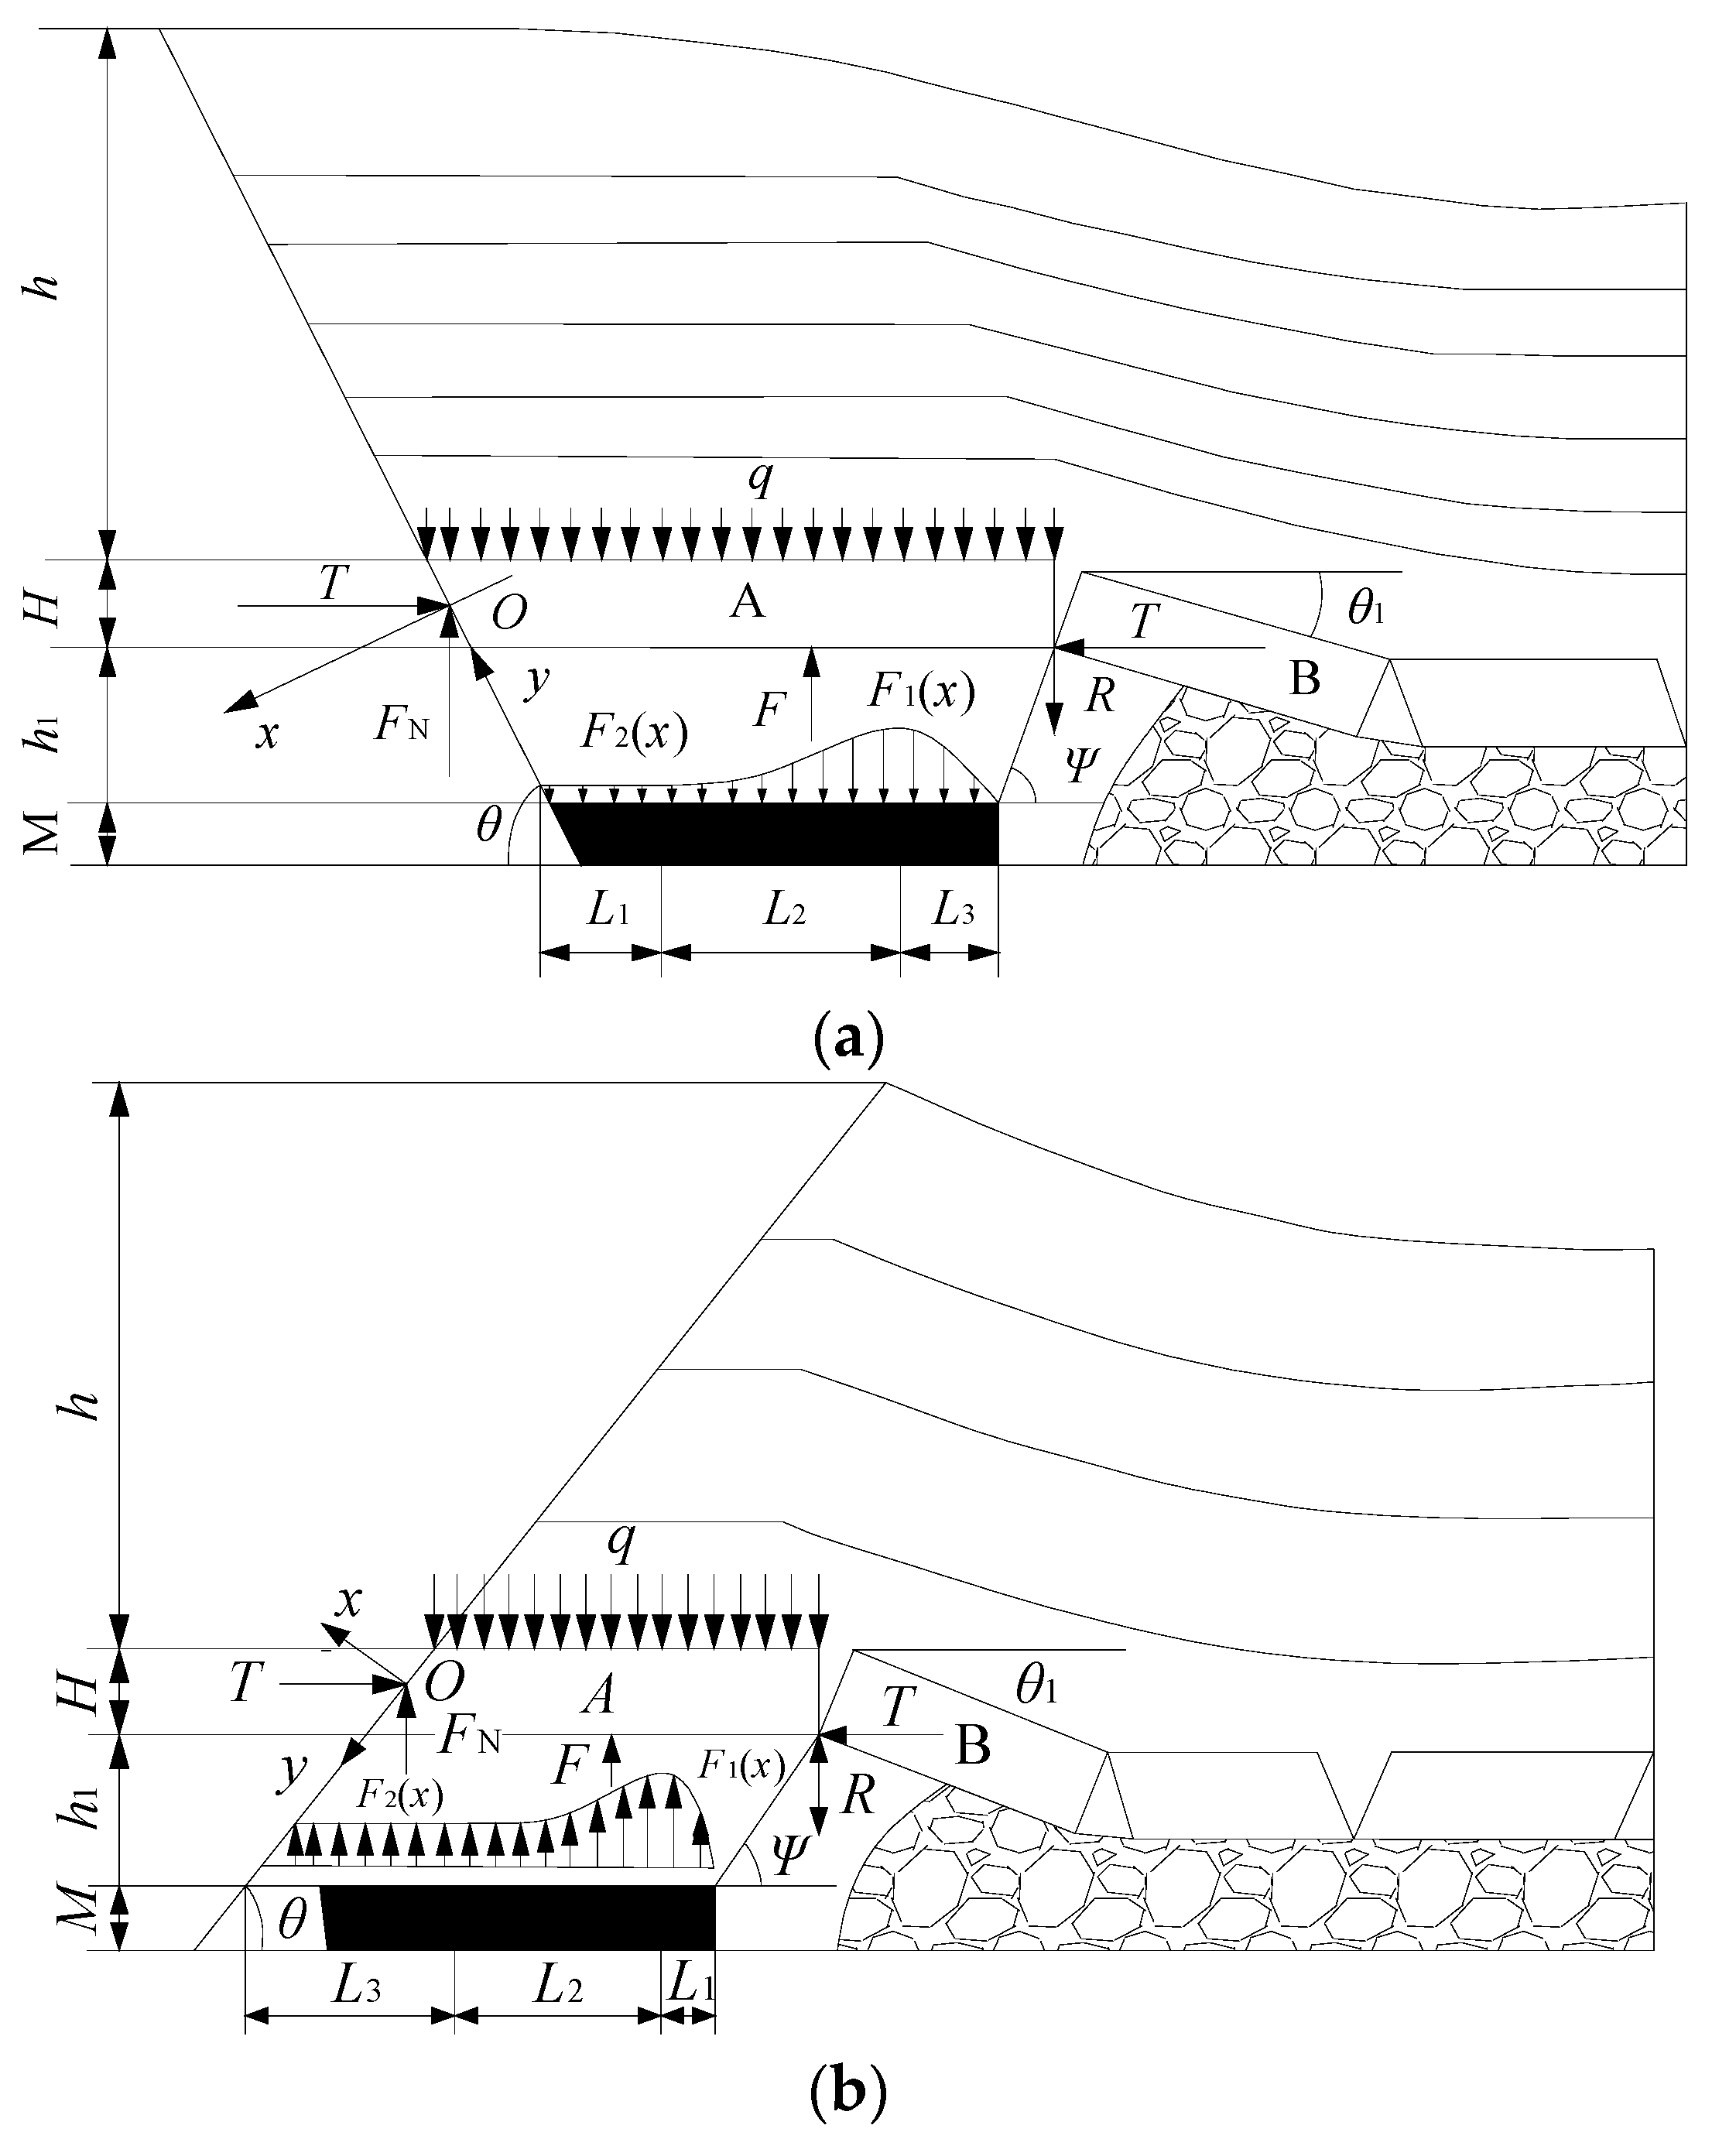
4. Existence Analysis of Separation Space

According to the above functional relationship, it can be seen that when the dip angle of the fault is smaller than the movement angle of each rock layer, as the height increases, the width of the boundary modules of different rock layers gradually decreases. At the same time, the center of gravity of the boundary rock mass gradually shifts to the goaf. The ability of the boundary modules to resist deformation is poorer, the stability is lower, and the possibility of movement deformation is greater. The partition of discontinuous-boundary support modules is shown in Figure 6. In the Figure, α is the fault dip angle, in °; β is the span angle of the lower rock mass of the key stratum, in °.

4.1. Mechanical Determination of Critical Layer Slip Instability

The stable compression module, deviatoric stress transition module and deviatoric stress instability module defined in Figure 6 were divided into rock strata and analyzed using a mechanical model. Combined with the three-zone division of the stope, the key stratum theory and the basic lithology of the rock strata, the rock strata in the three module areas are divided. The stable compression module is basically composed of the caving-zone rock layer and the fracture rock layer. The deviatoric stress transition module can be the fracture zone or the bending subsidence zone. The deviatoric stress instability module is composed of the key layer and its weak upper rock layer. The above theoretical division can only infer the approximate positions of the three modules and cannot accurately determine them. Therefore, it is necessary to use the mechanical model to determine the positions of the modules. The slip instability model of the key-layer support module is shown in Figure 7. The model can be used to analyze the slip instability of the fault boundary module rock working face when the fault dip angle is consistent with the direction of the rock movement angle and the fault dip angle α is less than the rock movement angle β.
p2 is the maximum tensile stress at the fracture limit of the rock stratum. When the rock stratum reaches the ultimate tensile strength and the rock mass does not deflect and displace, the rock stratum in this area breaks, and the fault surface does not produce separation space. On the contrary, the rock layer and the fault surface produce separation space.
The horizontal force balance condition of the rock stratum is as follows: f 1 + f 2 = F In the Equation:
p 3 u ( x 2 ) = p 1 u ( x 1 ) + G + p 2 l cos β
p 2 = p sin β
l = h sin β
F x = f 1 + f 2
From the above equation:
F x = f 1 + f 2 = μ p 1 u x 1 + μ p 1 u x 1 + G + p 2 h tan β = F x 1
By combining Equations (13) and (19):
F x 1 = 2 μ p 1 1 K 1 tan α x 1 + μ 2 p 1 K 1 x 0 tan α + G + p 2 h tan β x 0 x 1 x 0 + h 1 K 1 2 μ p 1 1 K 2 tan α x 1 + μ 2 p 1 K 2 x 0 tan α + G + p 2 h tan β x 0 + h 1 K 1 x 1 x 0 + h 1 + h 2 K 2 2 μ p 1 1 K n tan α x 1 + μ 2 p 1 K n x 0 tan α + G + p 2 h tan β x 0 + h 1 + h 2 + + h n 1 K n 1 x 1 x 0 + h 1 + h 2 + + h n K n
where μ is the friction coefficient of rock strata; h is the thickness of rock, in m; p1 and p3 are uniformly distributed loads on and below the end rock mass, in kN/m2; p is the tensile strength of the rock stratum, in MPa; β is the rock movement angle, in °; and u(x1) and u(x2) are the horizontal distance between the fault line and the rock movement line, in m.
When the fault dip angle is less than the rock movement angle, 2 μ p 1 1 K n tan α 2 μ p 1 1 tan β min tan α < 0 . Therefore, as x1 increases, F(x1) decreases gradually. When F x = F x 1 < F = p 2 h , u(x) corresponds to the horizontal displacement of the end of the rock layer, which forms a separation space with the fault plane. It can be seen from the formula that before the rock layer reaches the tensile strength, the rock layer moves horizontally when the upper and lower frictions of the rock layer are less than the horizontal tension, and the fault surface produces a separation space. In the opposite scenario, the rock stratum breaks and does not produce horizontal displacement.

4.2. Mechanics Determination of Deflection Instability of Key Stratum

The moment analysis is carried out with point P as the rotation center; the force is positive when the object rotates counterclockwise around the center of the moment, and vice versa. Therefore, when the sum of the moments of each force to point P is positive, the rock mass rotates around point P. The key stratum support module offset instability model is shown in Figure 8.
The torque of p1 to point P is M P p 1 = 0 l BF p 1 x d x = 1 2 p 1 l BF 2 , turning counterclockwise.
The torque of p1 to point P is M P p 1 = 0 l F A p 1 x d x = 1 2 p 1 l F A 2 , turning clockwise.
The moment of G to point P is M O G = G l , and the center of gravity O turns counterclockwise if it is on the left side of point P; otherwise, it turns clockwise.
The torque of p2 to point P is M P p 2 = 0 l PA p 2 x d x = 1 2 p 2 l PA 2 , turning clockwise.
M P = 1 2 p 1 l BF 2 1 2 p 1 l FA 2 + G l 1 2 p 2 l PA 2 1 2 p 1 l BF 2 1 2 p 1 l FA 2 G l 1 2 p 2 l PA 2
where
l = l MN 2 h O D tan β
u x A = l BA
h O D = h 2 u x A + u x P 3 u x A + u x P
l BF = l BA l FA = u x A h tan β
G = ρ V = ρ u x A + u x P h 2
where ρ is the rock density, in kg·m−3; the thickness of the rock layer is 1.
With the advancement of the working face, u(xA) and u(xP) decrease continuously, and 1 2 p 1 l BF 2 + G l decreases continuously. When MP > 0, the rock mass rotates counterclockwise around point P. Due to the limitation of the hanging wall of the fault, the rock layer does not move and does not separate from the fault plane. When MP < 0, the rock mass rotates clockwise around point P, and the rock layer and the fault plane generate a deflection separation space.

5. Analysis of Discontinuous-Boundary Fault Plane Abscission Layer under the Influence of Mining

The model is based on the geological conditions of a mine in Liupanshui City, Guizhou Province, and the model size is 2.5 m × 0.3 m × 1.6 m. The burial depth of the #1 coal seam is 453 m, and the average thickness is 5 m. The distance between the #2 coal seam and the #1 coal seam is 17 m, and the average thickness is 4.2 m. The reverse fault F1, with a dip angle of 45° and a drop of 5 m, and the normal fault F2, with a dip angle of 40° and a drop of 5 m, penetrate the #1 coal seam. The two faults are 215 m apart in the #1 coal seam, and the boundary coal pillars on the left and right sides are 30 m. Among them, 21 m above the #1 coal seam, there is a thick and hard siltstone roof rock layer with a thickness of 22 m. The geological model of the stope is shown in Figure 9.

5.1. Fault Activation Analysis and Mechanical Judgment of Coal Seam Mining

It can be seen from the similar simulation experiment that the fault-initiation-activated rock layer in this test is a siltstone key stratum with a thickness of 22 m at 21 m from the roof of the goaf. The double criterion was used to verify the test data. The discontinuous-boundary key stratum support module model is shown in Figure 10.

5.2. Key Layer Sliding Verification

The data of the left boundary F1 fault are verified, and the known fault F1 dip angle α1 is 45°; the width of the left boundary coal pillar a is 30 m; the upper boundary x0 of the boundary coal pillar is 27.5 m; the thickness h of the key stratum of the cracked rock stratum is 22 m. The height H from the upper boundary of the goaf is 21 m. The rock movement angle β1 of the lower strata group of the key strata is 58°. The key strata movement angle β2 is 67°; the overlying pressure P1 of the key layer is 10 MPa; the tensile strength P2 of the key layer is 43 MPa; the friction coefficient of sandy mudstone is 0.2~0.25; the friction coefficient of siltstone is 0.43~0.48; The density ρ of key strata is 2460 kg·m−3.
According to Formula (12), the length u(x)1 of the lower boundary of the end block is 19.62 m; The upper boundary length u(x)2 of the end block is 6.96 m; The gravity of the rock block G is 0.72 × 10³ KN; The pressure of the upper rock layer is 10 × 103 KN. The upper pressure of the end rock block is 69.6 × 10³ KN; The tensile stress component of the end rock layer is 22.42 × 10³ KN; The lower pressure of the end rock block is 92.74 × 10³ KN. When objects with different friction coefficients slide relative to each other, the friction coefficient is taken as the minimum value, therefore the friction coefficient μ1 = μ2 = 0.25 [36,37].
By substituting the above data into formula (20), the maximum static friction force Fmax at the end of the rock layer is 40.59 × 10³ KN; The ultimate tensile stress F at the end of the rock layer is 57.39 × 10³ KN. Therefore, the ultimate tensile stress F > Fmax at the end of the rock layer, the overlying rock layer slides at the discontinuous-boundary module at the key layer, and the separation space appears on the fault plane.

5.3. Critical Layer Deflection Verification Calculation

The instability criterion of rock mass at the end of the key stratum was calculated. According to the experimental data, the counterclockwise moment MP(p1) of p1 to point P of the end rock mass is 0 KN·m, the clockwise moment MP(p1) of p1 to point P of the end rock mass is 407.856 × 10³ KN·m, the counterclockwise moment MP(G) of G to point P of the end rock mass is 2.32 × 10³ KN·m, the clockwise moment MP(p2) of point P of the end rock mass is 685.45 × 10³ KN·m, and the sum of moments acting on point P (MP) is −1090.99 × 103 KN·m. The bending moment of the rock mass at the end of the key stratum at the P point is shown in Table 1. Therefore, the sum of the moments of point P MP < 0, the end rock block will rotate clockwise around point P, and the end rock block will produce a deflection separation layer on the fault plane. At the same time, according to the mechanics of materials, the ultimate deflection Wmax of the key stratum rock beam is 67.459 mm. Therefore, when the bending deflection of the key stratum rock beam in the fault zone reaches 67.459 mm, the key stratum begins to break.

6. Numerical Simulation Analysis of Discontinuous-Boundary Fault Activation

This study conducted numerical model calculations on the mining area based on existing geological data and mechanical parameters of each rock layer. The mechanical parameters of each rock layer in the working face are shown in Table 2. The model size is 300,200,128.2 m, and the upper interface of the model is a free interface, while the other interfaces are fixed constraints. The fault zone is formed by secondary cementation of mylonite, gravel, and other rocks. Therefore, the strain softening criterion is used to assign individual values to the fault-zone modules, while the Mohr–Coulomb criterion is used for the failure of other rock layers. During simulated excavation, a 30 m protective coal pillar was left between the cutting hole and the F1 fault, and a 30 m protective coal pillar was left between the limit of mining activity and F2. Programming based on FLAC3D’s built-in FISH language, six stress monitoring points, namely, A (70, 100, 99), B (67, 100, 93), C (55, 100, 82), D (45, 100, 71), M (35, 100, 64), and N (13, 100, 42), were arranged at the upper end of the fault zone, the key layer, the middle area between the coal seam and the key layer, and the lower part of the fault zone. The stress values of each monitoring point were obtained when the hanging-wall mining face advanced 0, 30, 60, 90, 120, and 150 m. The numerical model is shown in Figure 11.
As shown in Figure 12a,b, with the continuous advancement of the working face, the pressure-relief zone at the upper end of the F1 fault gradually increases. When the rock movement line at the front end of the working face intersects with the F2 fault plane, the area of the pressure-relief zone at the upper end of the F2 fault suddenly increases. The pressure relief areas of F1 and F2 faults are located in the key strata, indicating that the fault is activated at the key position, and the results of the theoretical model are verified. The discontinuous boundary of the working face separates the stress transmission of the surrounding rock, and the activation of faults changes the movement pattern of the overlying rock in the mining area. The stress-concentration area of the surrounding rock in the working face is mainly distributed in the hanging-wall area of the fault and near the boundary protection coal pillars. The maximum stress is mainly distributed in the middle of the boundary-protection coal pillar and the lower part of the fault. As shown in Figure 13, the plastic zone of the end module of the critical layer at the discontinuous boundary is mainly distributed on the adjacent fault plane, as well as the upper and lower contact surfaces of the critical-layer boundary module. The distribution of the plastic zone and pressure-relief zone indicates that the key layer has experienced slip and deflection near both ends of the fault plane, forming an unstable spatial structure. Therefore, the numerical simulation results and the theoretical calculation results are mutually validating.
As shown in Figure 14 and Figure 15, as the advancing distance increases, the suspended area of the goaf gradually increases, and the supporting area of the lower part of the rock layer on the inner side of the fault zone decreases, leading to the occurrence of pressure-relief zones and stress-concentration zones in the surrounding rock of the fault zone. According to Figure 15a,b, it can be seen that the vertical stress at measurement point A of the surrounding rock in the upper part of the fault zone has decreased from 8.76 to 4.88 MPa, and the vertical stress at measurement point B has decreased from 8.41 to 3.14 MPa. The monitoring results indicate that as the working face advances, the vertical stress in the hanging-wall area of the fault zone decreases, and a pressure-relief zone appears in the upper part of the fault zone. From Figure 15c, it can be seen that the vertical stress value of measuring point C in the middle of the fault zone changes from 8.76 to 5.53 to 6.19 to 5.53 MPa. The vertical stress value of this measuring point undergoes a process of decreasing, then rising, then decreasing. The stress decrease is caused by the activation of the upper fault surrounding rock, and the intermediate stress-increase stage is caused by the increase in the advanced support pressure of the working face. The overall vertical stress shows a downward trend. According to Figure 15d, it can be seen that the vertical stress value of measuring point D in the middle of the fault zone changes from 7.09 to 5.63 to 9.52 MPa. The vertical stress value of this measuring point undergoes a process of decreasing and increasing. The stress decrease is caused by the activation of the upper fault’s surrounding rock, and the later stage of stress increase is caused by the increase in advanced support pressure of the working face. According to Figure 15e,f, it can be seen that the vertical stress at measuring point M in the upper surrounding rock of the fault zone increases from 7.65 to 13.12 MPa, and the vertical stress at measuring point N increases from 14 to 19.67 MPa. The monitoring results indicate that as the working face advances, the vertical stress in the footwall area of the fault zone shows a decreasing trend, and a stress-concentration area appears in the lower part of the fault zone.
According to a comprehensive analysis, the vertical stress in the hanging wall of the fault zone shows a decreasing zone; the stress in the middle of the fault zone decreases in the early stage due to the activation of the upper fault, and in the later stage, the stress value gradually increases due to the concentration of protective coal pillars, showing an upward trend; the lower part of the fault zone is an important support point for the rock structure of each normal fault zone. The force of the overlying rock layer on the goaf under gravity gradually concentrates towards this area, and the stress value in this area gradually increases. The stress changes at the upper monitoring points indicate that a pressure-relief zone has appeared in the hanging wall area of the fault, and the fault in this area has become active.

7. Conclusions

(1)
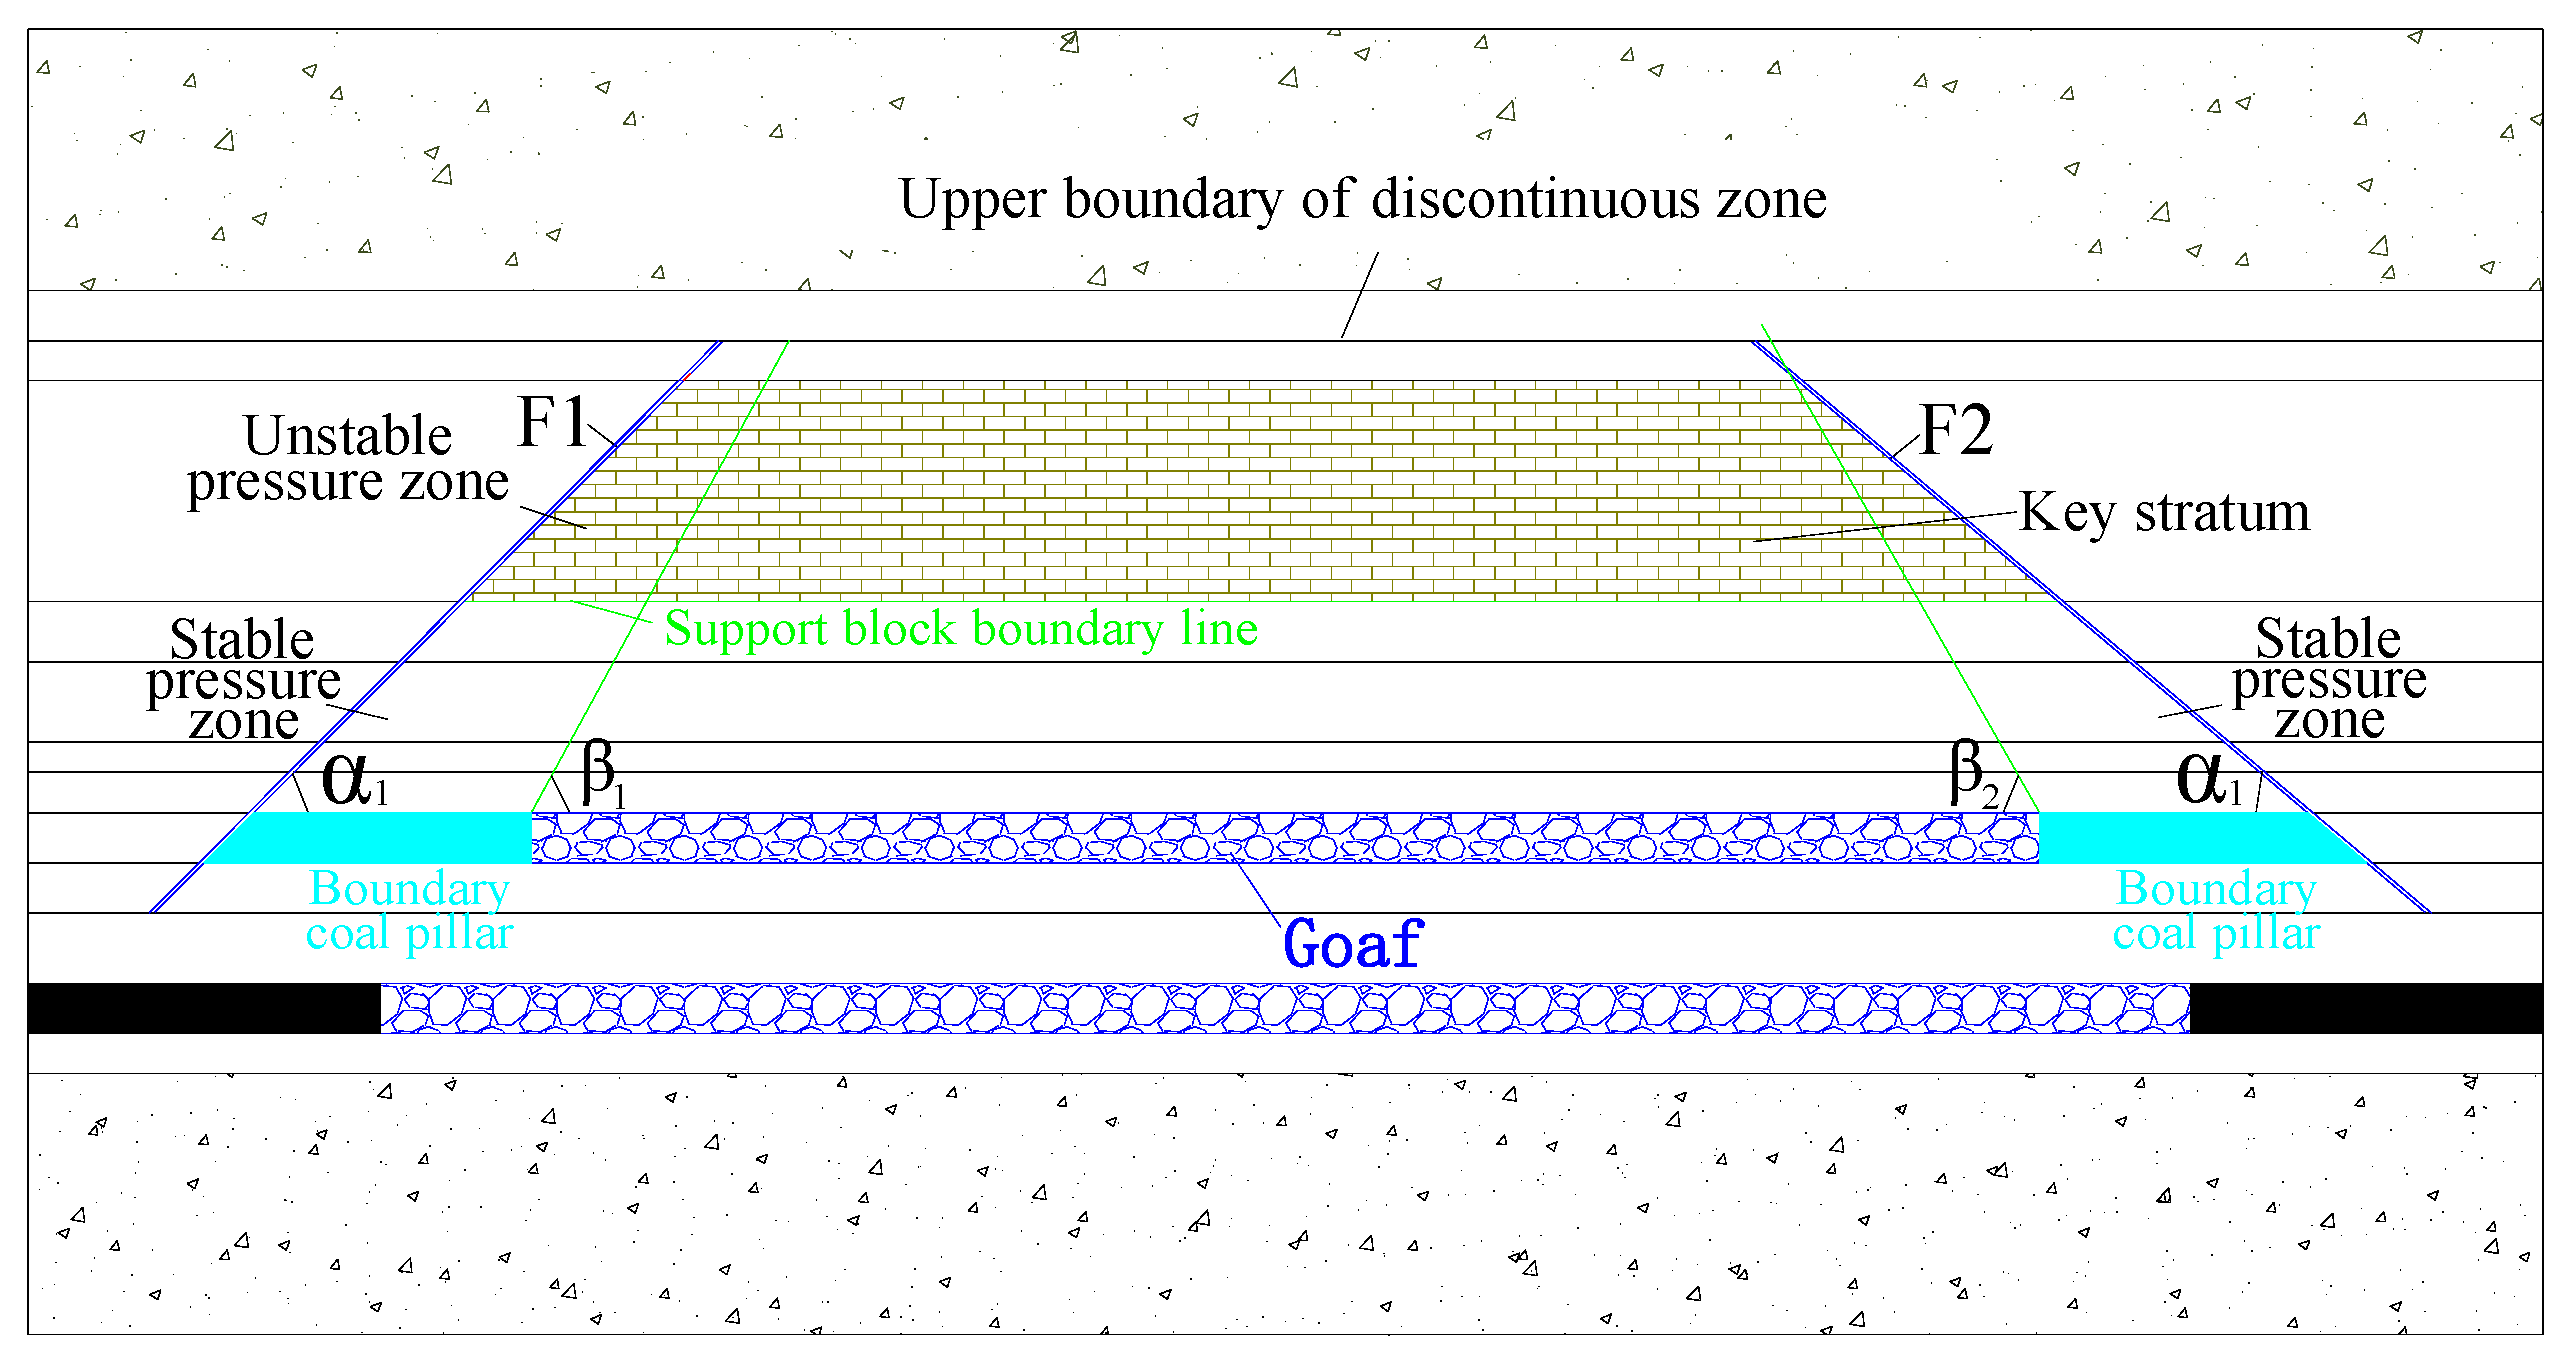
The expression of the rock movement line and the distance u(x) from different horizontal heights of the rock movement line to the fault plane were obtained using the dip angle of the fault and the angle of rock movement.
(2)
The criterion for the activity instability of rock layers in the fault zone was obtained through material mechanics analysis, and the mechanical criterion at the end of the rock layer can determine the range of bending and sinking zones.
(3)
Data validation was conducted on the key layer slip mechanics model and the key layer displacement instability model through on-site cases.
(4)
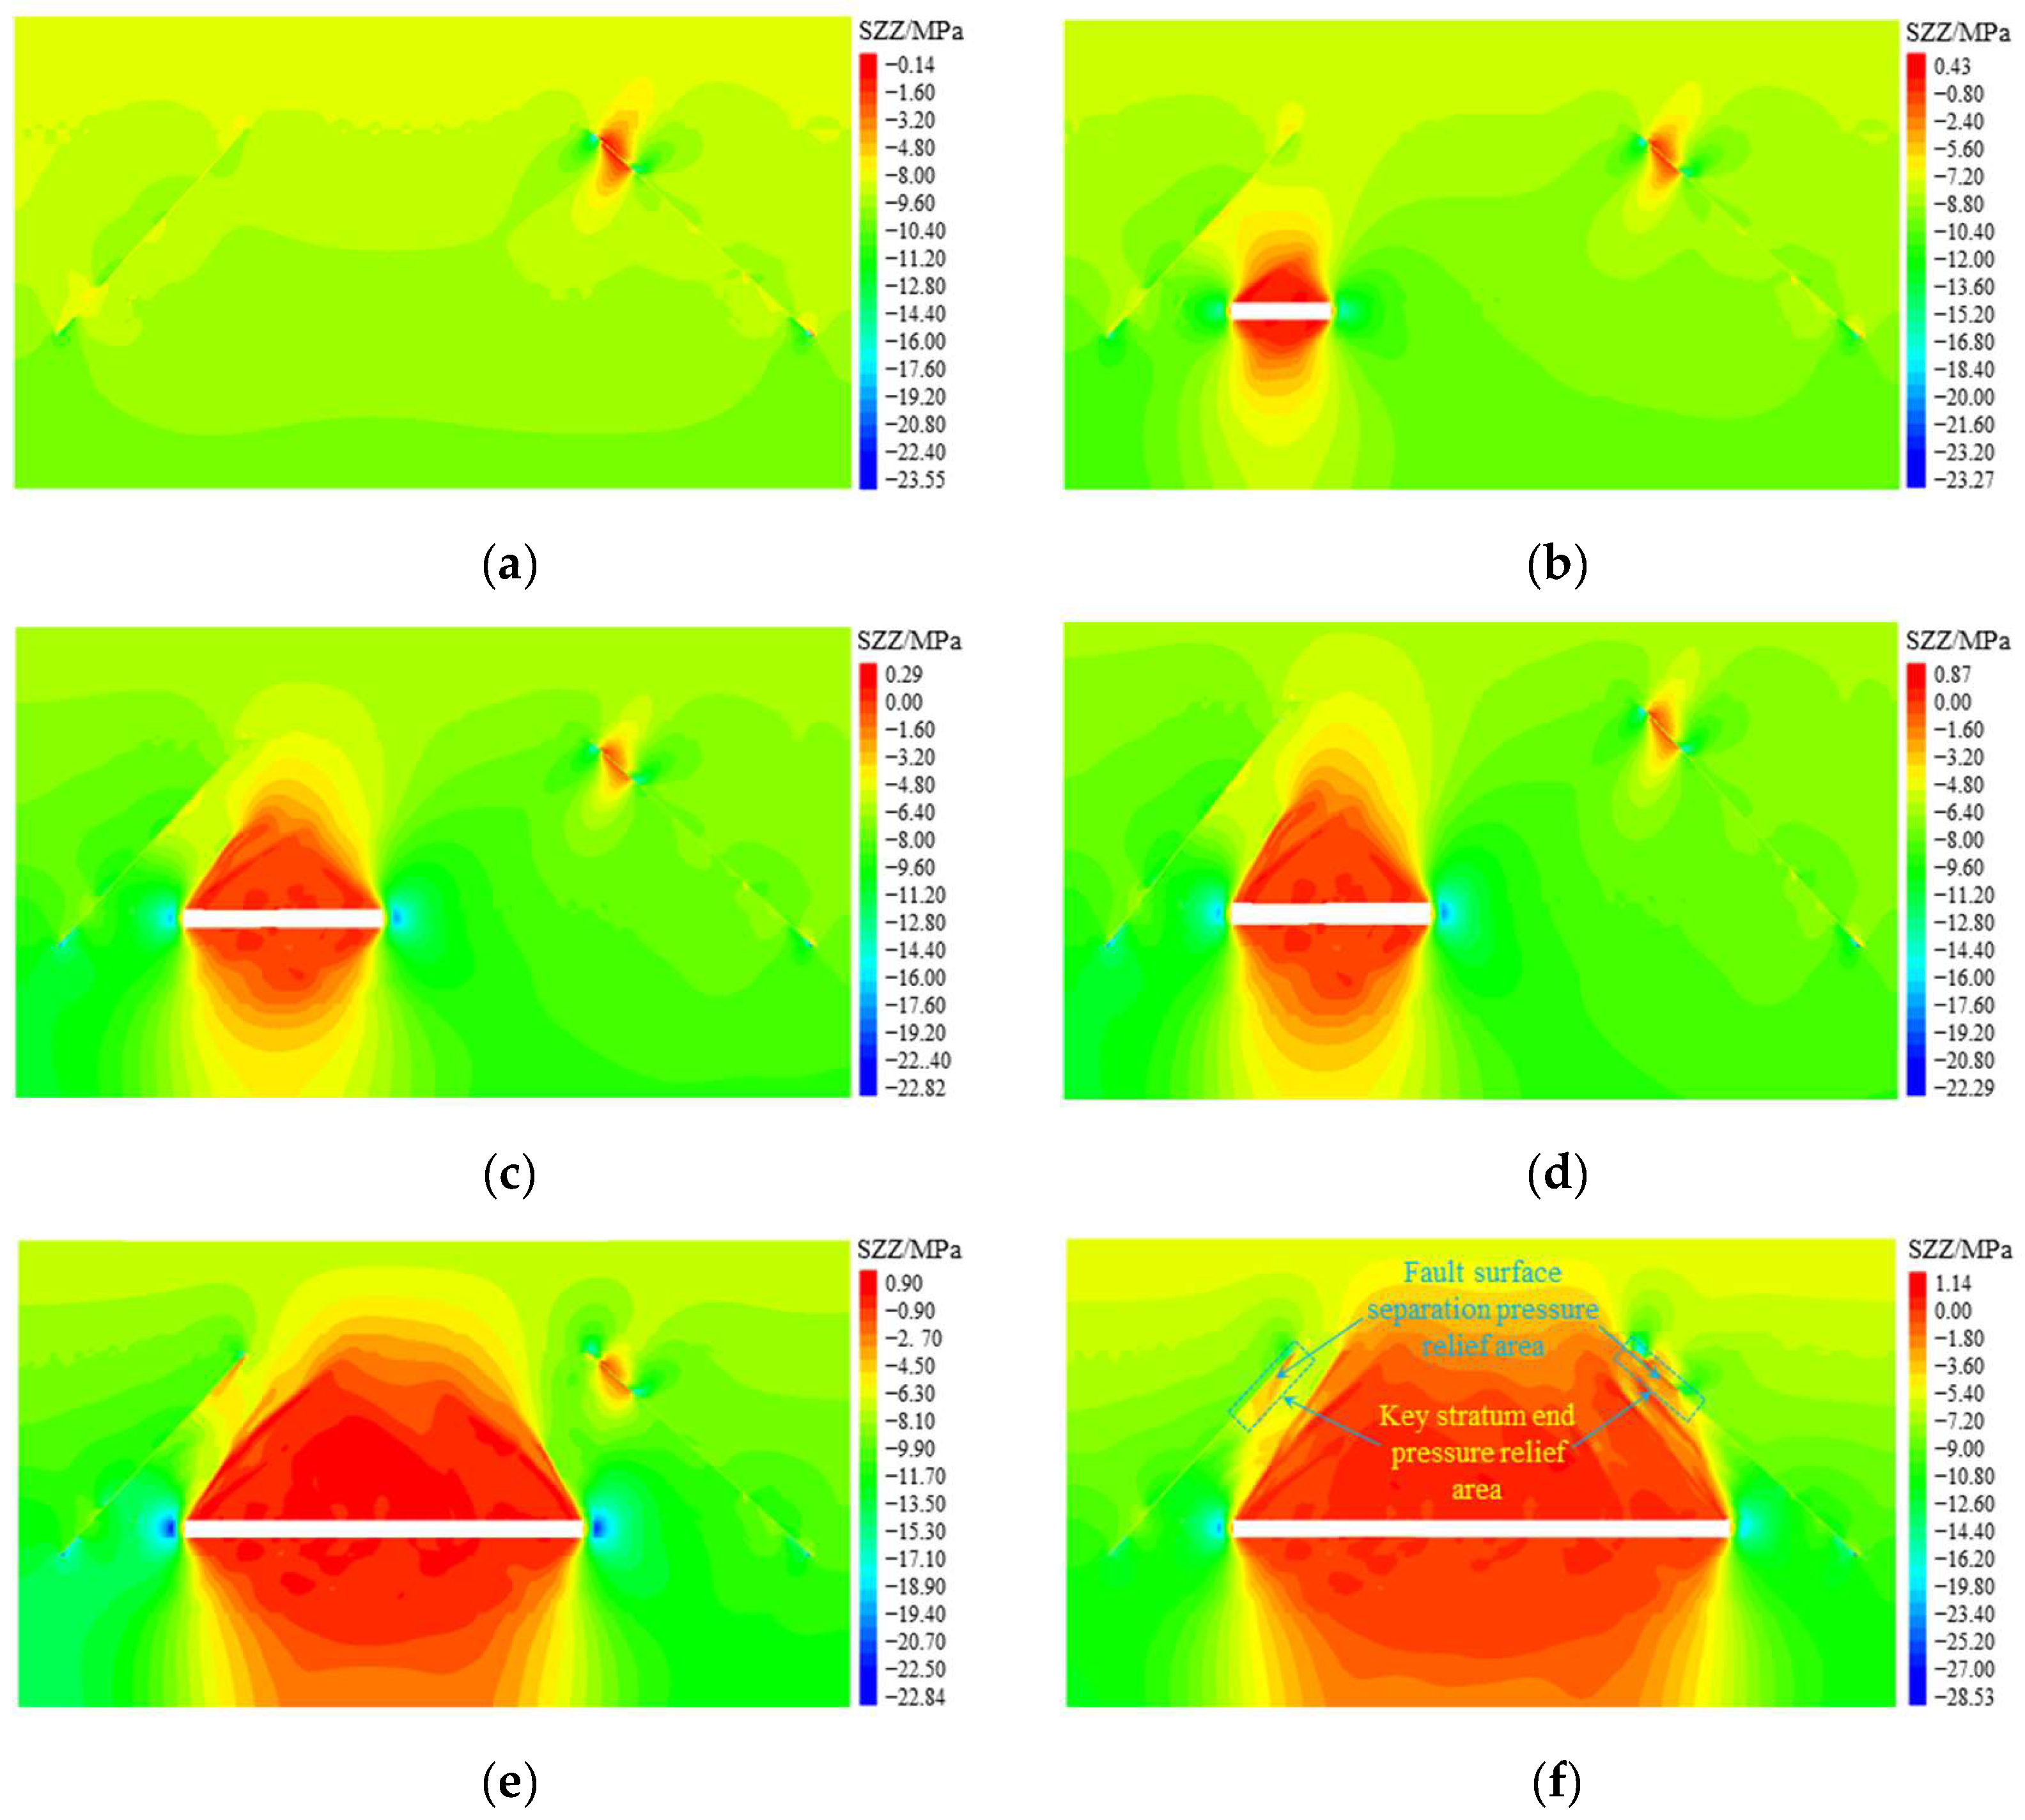
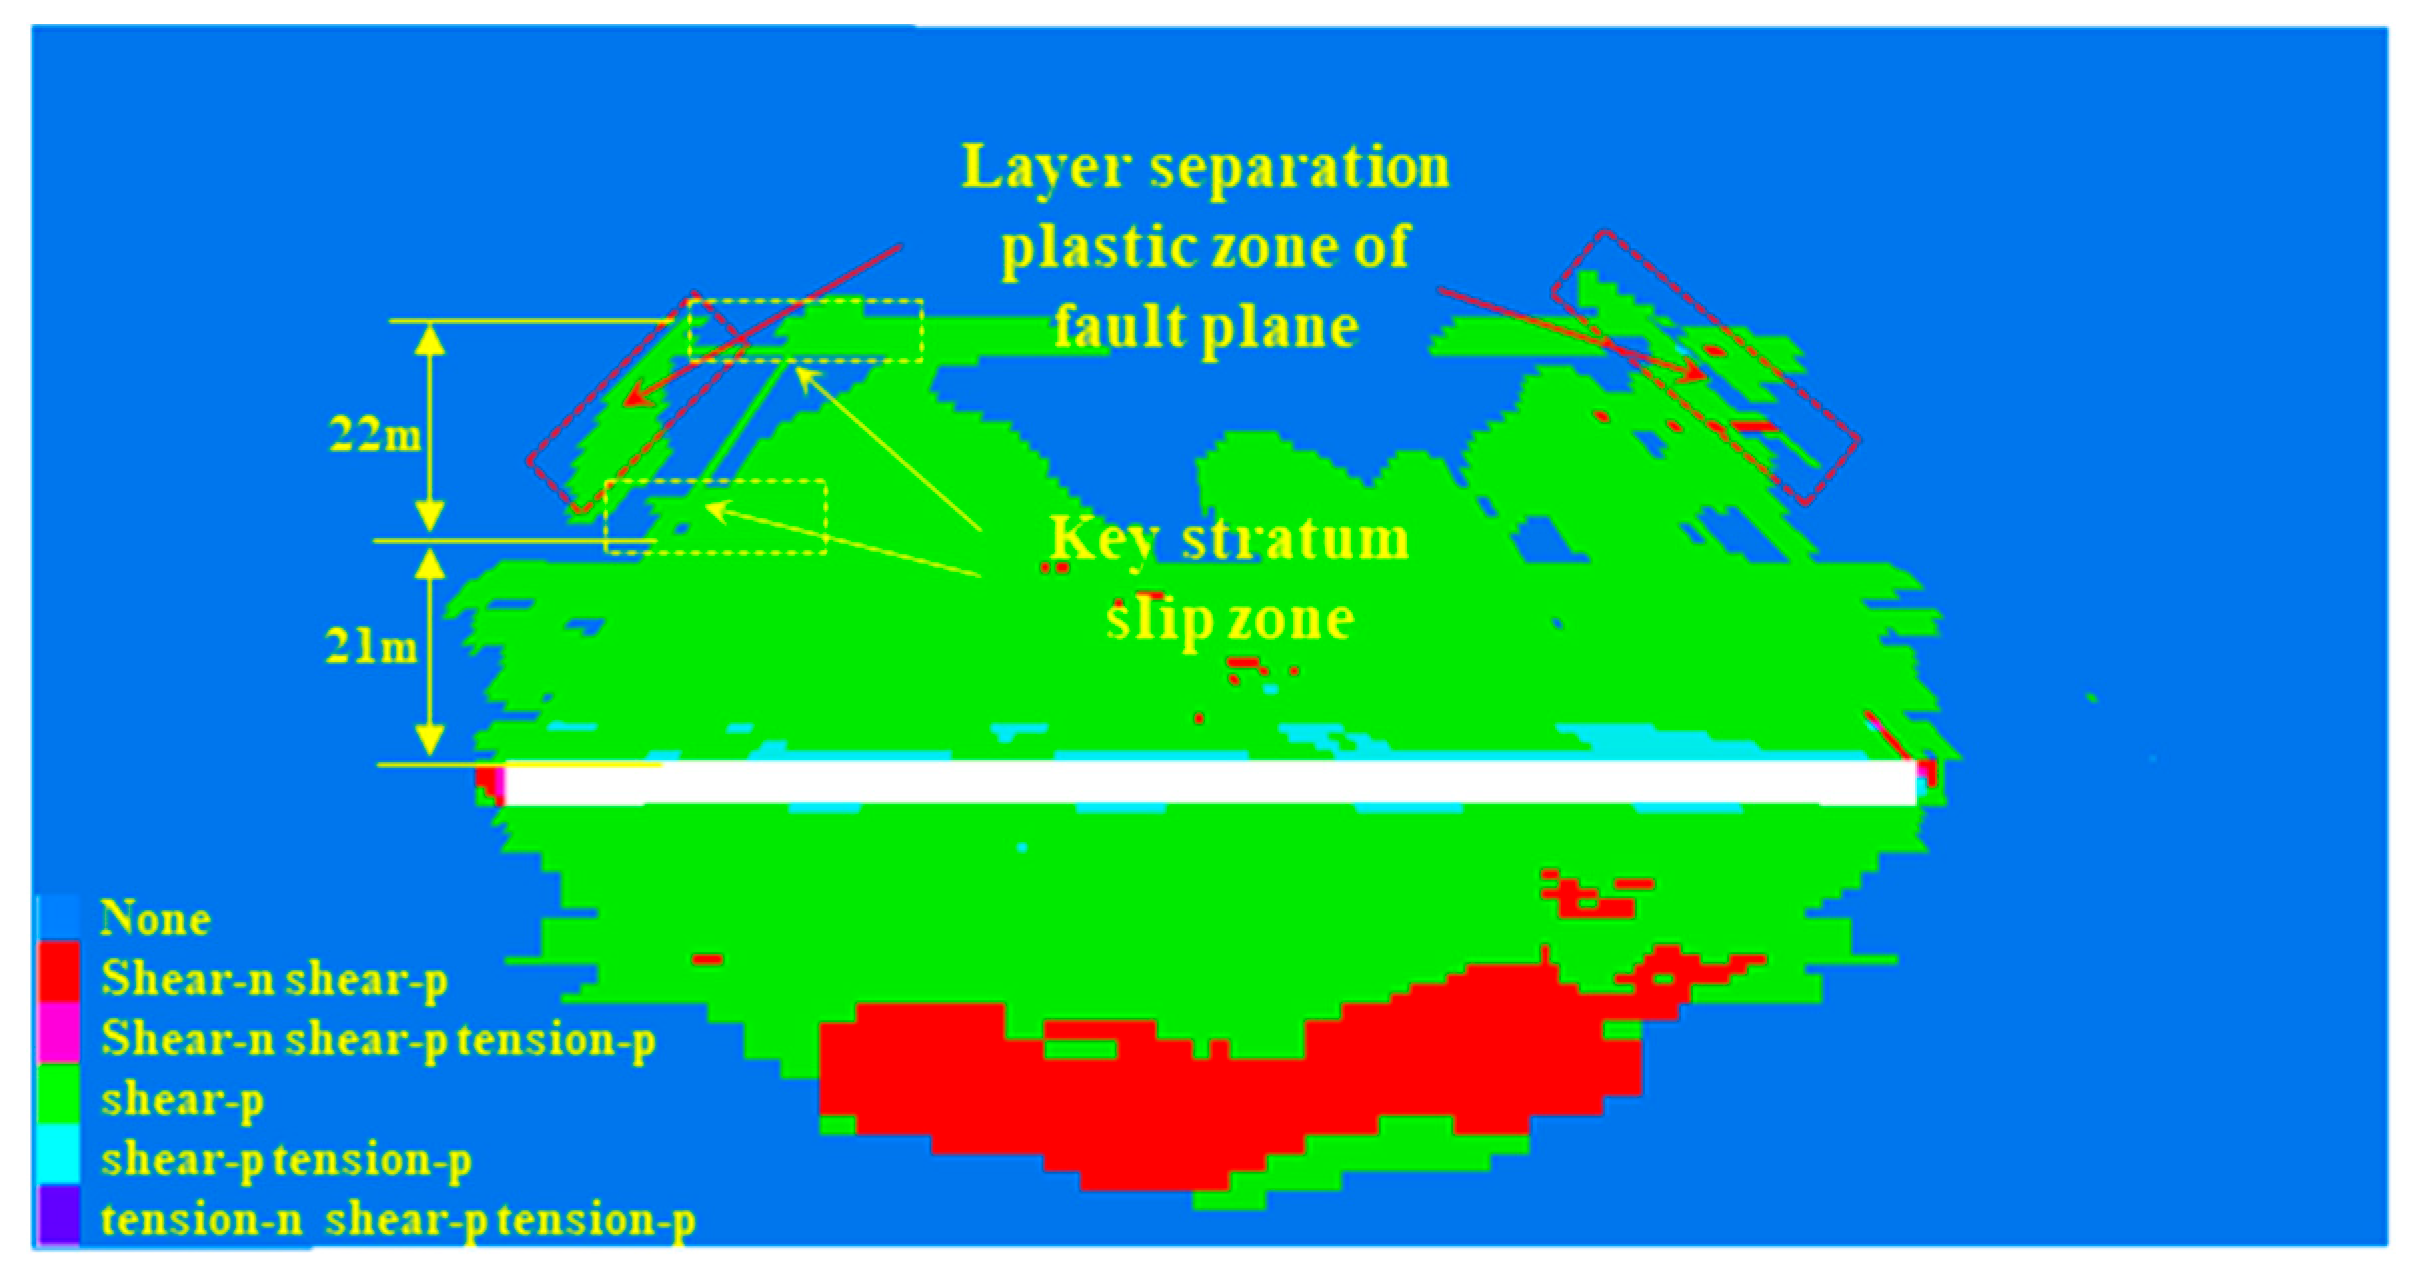
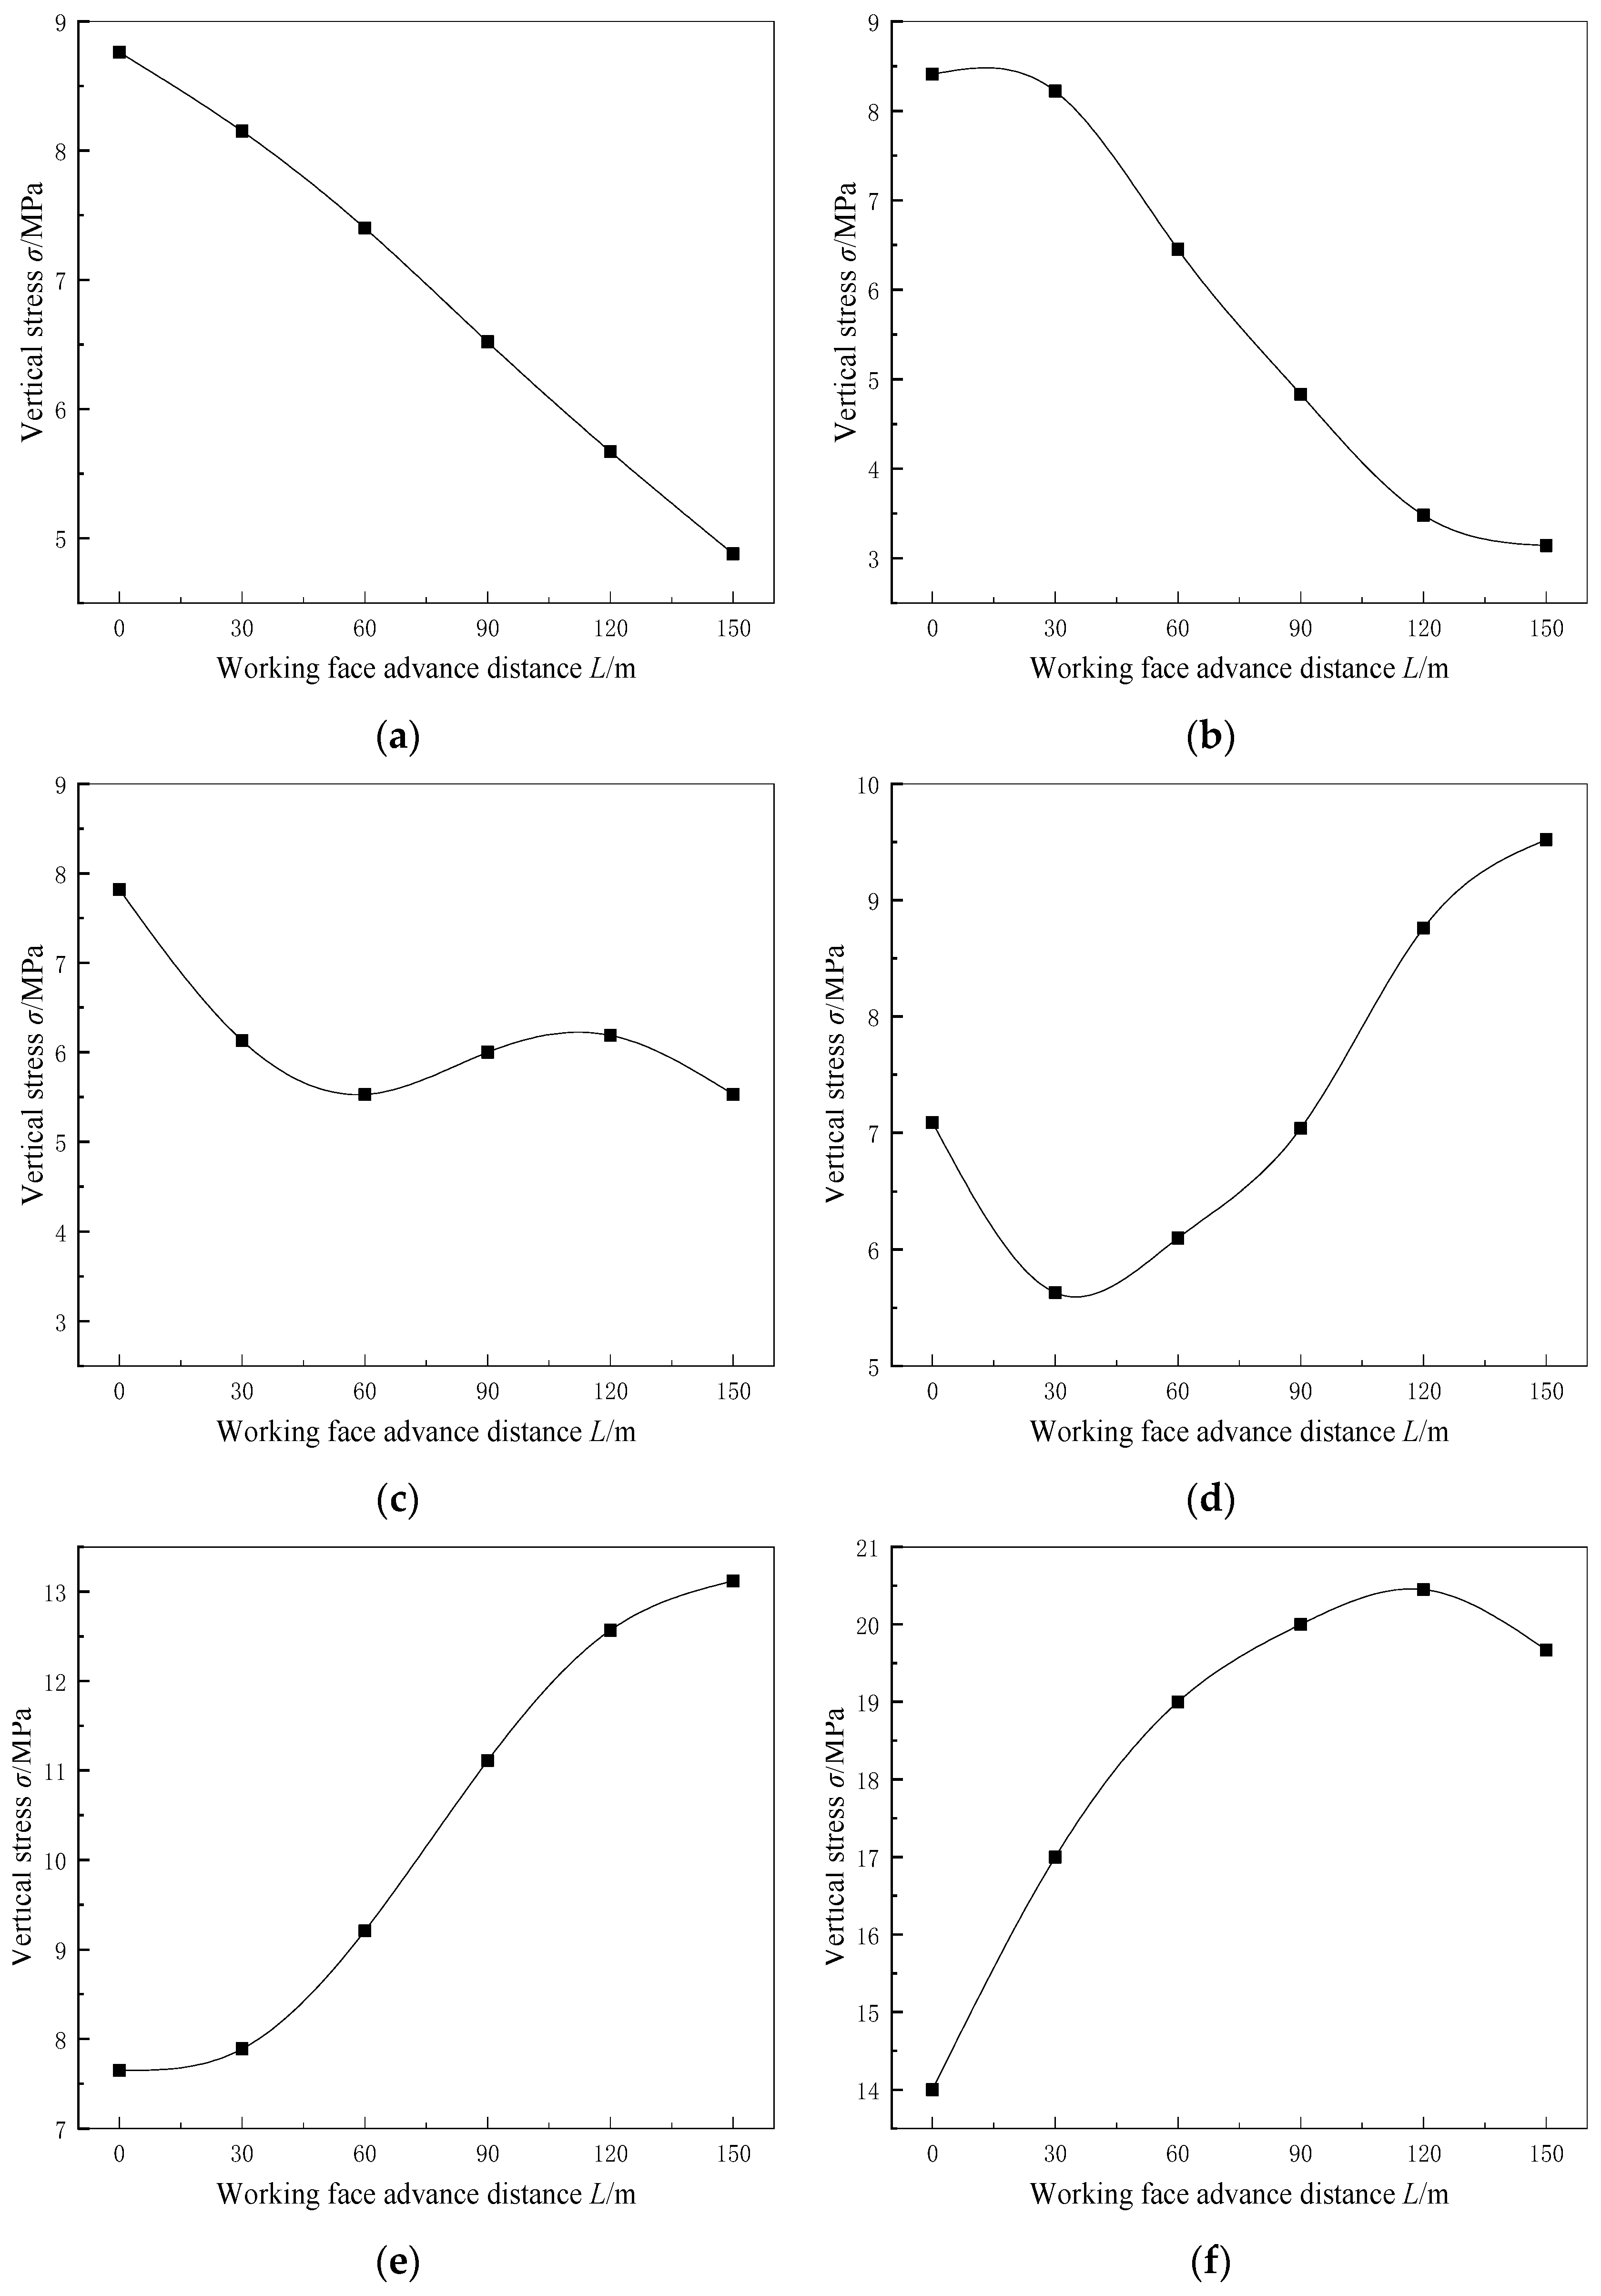
Through numerical simulation and zoning monitoring of vertical stress on the upper, middle, and lower parts of the fault, combined with the vertical stress distribution map and plastic zone distribution map of the mining area, it was found that the upper rock layer of the fault has been activated, and the middle rock layer of the fault zone is affected by the joint action of the upper rock layer’s unloading zone and the protective coal pillar’s stress-concentration zone. The surrounding rock of the lower part of the fault zone is always in the stress-concentration zone.
(5)
Through the double-criterion mechanical model, it can be seen that increasing the width of the fault-protection coal pillar is the most effective means for the influence of smaller faults on overlying strata. At the same time, the stability of the surrounding rock near the goaf can be increased by grouting. It is also necessary to drill anchor cables in the vertical fault direction of the rock strata above the open-off cut to prevent the collapse of the boundary’s surrounding rock.

Author Contributions

Conceptualization, H.G.; Methodology, H.G. and W.Y.; Software, H.G.; Validation, Z.L.; Formal analysis, H.G.; Investigation, K.L.; Resources, W.Y.; Data curation, G.W., K.L. and Z.L.; Writing—original draft, H.G.; Writing—review & editing, H.G.; Supervision, W.Y. and G.W.; Project administration, W.Y.; Funding acquisition, W.Y. All authors have read and agreed to the published version of the manuscript.

Funding

This study was supported by the National Natural Science Foundation of China (Grant Nos. 52174076 and 51974117), the Hunan Provincial Natural Science Foundation of China (Grant No. 2023JJ30261), the Postgraduate Scientific Research Innovation Project of Hunan Province (Grant No. CX20210984), and the Open Fund for Hunan Province Key Laboratory of Coal Resources Clean-utilization and Mine Environment Protection (No. E22235). The financial support is greatly appreciated.

Institutional Review Board Statement

Not applicable.

Informed Consent Statement

Not applicable.

Data Availability Statement

Data are contained within the article.

Conflicts of Interest

The authors declare no conflict of interest.

References

  1. Mu, C.; Yu, X.; Zhao, B.; Zhang, D.; Mao, X.; Zhu, J. The Formation Mechanism of Surface Landslide Disasters in the Mining Area under Different Slope Angles. Adv. Civ. Eng. 2021, 2021, 6697790. [Google Scholar] [CrossRef]
  2. Yu, W.; Pan, B.; Zhang, F.; Yao, S.; Liu, F. Deformation Characteristics and Determination of Optimum Supporting Time of Alteration Rock Mass in Deep Mine. KSCE J. Civ. Eng. 2019, 23, 4921–4932. [Google Scholar] [CrossRef]
  3. Yu, W.; Wu, G.; Pan, B.; Wang, C.; Li, K.; Liao, Z. Laboratory and field investigations of different bolting configurations for coal mine roadways in weak coal strata. Bull. Eng. Geol. Environ. 2021, 80, 8995–9013. [Google Scholar] [CrossRef]
  4. Wang, L.; Cheng, Y.; Xu, C.; An, F.-H.; Jin, K.; Zhang, X.-L. The controlling effect of thick-hard igneous rock on pressure relief gas drainage and dynamic disasters in outburst coal seams. Nat. Hazards 2013, 66, 1221–1241. [Google Scholar] [CrossRef]
  5. Li, Z.; Dou, L.; Cai, W.; Wang, G.; He, J.; Gong, S.; Ding, Y. Investigation and analysis of the rock burst mechanism induced within fault–pillars. Int. J. Rock Mech. Min. Sci. 2014, 70, 192–200. [Google Scholar] [CrossRef]
  6. Jiao, Z.; Zhao, Y.; Jiang, Y.; Wang, H.; Lu, Z.G.; Wang, X.Z. Fault damage induced by mining and its sensitivity analysis of influencing factors. J. China Coal Soc. 2017, 42, 36–42. [Google Scholar]
  7. Dou, L.; Mu, Z.; Li, Z.; Cao, A.Y.; Gong, S.Y. Research progress of monitoring, forecasting, and prevention of rockburst in underground coal mining in China. Int. J. Coal Sci. Technol. 2014, 1, 278–288. [Google Scholar] [CrossRef]
  8. Jiang, J.; Wu, Q.; Qu, H. Evolutionary characteristics of mining stress near the hard-thick over-burden normal faults. J. Min. Saf. Eng. 2014, 31, 881–887. [Google Scholar]
  9. Pan, L.; Zhang, L.; Liu, X. Practical Technology of Rock Burst Prediction and Prevention; China University of Mining and Technology Press: Xuzhou, China, 2006; pp. 132–143. [Google Scholar]
  10. Pan, Y.; Li, Z.; Zhang, M. Distribution, type, mechanism and prevention of rockburst in China. Chin. J. Rock Mech. Eng. 2003, 22, 1844–1851. [Google Scholar]
  11. Liu, Y.; Jin, G.; Zhao, Y. Experimental study on fault rockburst instability by loading rate and fault dip. Rock Soil Mech. 2022, 43, 35–45. [Google Scholar]
  12. Wang, Y.; Liu, X.; Zhang, M.; Bai, X. Effect of Roughness on Shear Characteristics of the Interface between Silty Clay and Concrete. Adv. Civ. Eng. 2020, 2020, 8831759. [Google Scholar] [CrossRef]
  13. Yang, Z.; Wang, H.; Sun, D.; Ma, X.J.; Xu, M.B.; Si, N.X. Study on Occurrence Mechanism of Coal Pillar in L-Shaped Zone during Fully Mechanized Mining Period and Prevention Technology. Shock. Vib. 2021, 2021, 6638009. [Google Scholar] [CrossRef]
  14. YU, W.; Li, K.; Liu, Z.; An, B.; Wang, P.; Wu, H. Mechanical Characteristics and Deformation Control of Surrounding Rock in Weakly Cemented Siltstone. Environ. Earth Sci. 2021, 80, 1–15. [Google Scholar] [CrossRef]
  15. Zhou, K.; Dou, L.; Gong, S.; Li, J.; Zhang, J.; Cao, J. Study of Rock Burst Risk Evolution in Front of Deep Longwall Panel Based on Passive Seismic Velocity Tomography. Geofluids 2020, 2020, 8888413. [Google Scholar] [CrossRef]
  16. Jiang, F.; Yang, S.; Cheng, Y.; Zhang, X.M.; Mao, Z.; Xu, F.J. A study on microseismic monitoring of rockburst incoal mine. Chin. J. Geophys. 2006, 49, 1511–1516. [Google Scholar]
  17. Wang, J.; Liu, H.; Li, T. Study on numerical simulation of dynamic risk regionalization during exploitation approaching to faults. Chin. J. Rock Mech. Eng. 2007, 26, 28–35. [Google Scholar]
  18. Stewart, R.; Reimold, W.; Charlesworth, E.; Ortlepp, W. The nature of a deformation zone and fault rock related to a recent rockburst at Western Deep Levels Gold Mine. Tectonophysics 2001, 337, 173–190. [Google Scholar] [CrossRef]
  19. Myer, L.R. Fractures as collections of cracks. Int. J. Rock Mech. Min. Sci. 2000, 37, 231–243. [Google Scholar] [CrossRef]
  20. Skrzypkowski, K.; Zagórski, K.; Zagórska, A.; Apel, D.B.; Wang, J.; Xu, H.; Guo, L. Choice of the Arch Yielding Support for the Preparatory Roadway Located near the Fault. Energies 2022, 15, 3774. [Google Scholar] [CrossRef]
  21. Zhu, Y.; Li, P.; Wang, P.; Mei, C.; Ren, H.; Wang, X. Mechanical Characteristics of Pre-Peak Unloading Damage and Mechanisms of Reloading Failure in Red Sandstone. Appl. Sci. 2022, 12, 13046. [Google Scholar] [CrossRef]
  22. Li, P.; Zhu, Y.; Wang, P.; Mei, C. Radial Depth Damage Properties of Coal Tunnels Surrounded by Rock under Excavation and Unloading. KSCE J. Civ. Eng. 2023, 27, 2287–2296. [Google Scholar] [CrossRef]
  23. Guo, H.; Yu, W.; Liu, Y.; Zhang, Z.; Kang, X. Study on the Dynamic Instability Mechanism of the Rock Formation in the Multifault Structure Zone of the Stope. Geofluids 2022, 2022, 8382493. [Google Scholar] [CrossRef]
  24. Qi, Y.; Yu, W.; Yu, D.; Guo, H.; Pan, B. Research on the Deformation Law and Stress Distribution Characteristics of Overburden under the Influence of Multiple Faults. Adv. Civ. Eng. 2023, 2023, 9919993. [Google Scholar] [CrossRef]
  25. Wu, Z.; Pan, P.; Pan, J. Analysis of mechanism of rock burst and law of mining induced events in graben structural area. Rock Soil Mech. 2021, 42, 2225–2238. [Google Scholar]
  26. Wang, H.; Jiang, Y.; Jiang, C.; Di, J.H.; Liu, Y.Y. Characteristics of overlying strata movement in double fault area under the dynamic pressure. J. Min. Saf. Eng. 2019, 36, 513–518. [Google Scholar]
  27. Tang, C.; Wang, J.; Zhang, J. Preliminary engineering application of microseismic monitoring technique to rockburst prediction in tunneling of Jinping II project. J. Rock Mech. Geotech. Eng. 2010, 2, 193–208. [Google Scholar] [CrossRef]
  28. Han, K.; Yu, Q.; Zhang, H.; Li, F.M. Mechanism of fault activation when mining on hang-ing-wall and foot-wall. J. China Coal Soc. 2020, 45, 1327–1335. [Google Scholar]
  29. Zuo, J.; Wu, G.; Sun, Y.; Yu, M. Investigation on the inner and outer analogous hyperbola model (AHM) of strata movement. J. China Coal Soc. 2021, 46, 333–343. [Google Scholar]
  30. Qian, M.; Liao, X.; He, F. Key block analysis of ‘masonry beam’ structure in stope. J. China Coal Soc. 1994, 6, 557–563. [Google Scholar]
  31. Yu, Q.; Zhang, H.; Deng, W.; Bai, Z.; Zhang, G.; Zou, Y. Study on the Setting Method of Fault Protection Coal Pillar with Different Dip Angles. In Proceedings of the 11th National Coal Industry Production Frontline Youth Technical Innovation Collection; China Coal Industry Publishing House: Beijing, China, 2018; pp. 1–5. [Google Scholar]
  32. Qian, M. Control of Mine Pressure and Rock Strata; China University of Mining and Technology Press: Xuzhou, China, 2010. [Google Scholar]
  33. Liu, H. Mechanics of Materials; Higher Education Press: Beijing, China, 2011. [Google Scholar]
  34. Norris, A. The isotropic material closest to a given anisotropic material. J. Mech. Mater. Struct. 2005, 1, 223–238. [Google Scholar] [CrossRef]
  35. Hong, S.I.; Park, J.W.; Jung, Y.H.; Ann, K.Y. Modelling Pore Structure of Cement Based Material According to Continuous Network System. Appl. Mech. Mater. 2014, 578–579, 1531–1537. [Google Scholar] [CrossRef]
  36. Cai, M. Rock Mechanics and Engineering; Science Press: Beijing, China, 2013. [Google Scholar]
  37. Buyanovskii, I.A.; Tatur, I.R.; Strelnikova, S.S.; Samusenko, V.D.; Kal’yanova, O.A. Investigation of the Destruction of Lubricating Layers of Sulfonate Greases under Friction and Corrosion. J. Frict. Wear 2023, 44, 229–233. [Google Scholar] [CrossRef]
Figure 1. Rock stratum movement model in goaf. (a) Strata movement model. (b) Ground surface settlement model. (c) The overall movement models of rock strata movement and surface subsidence [29].
Applsci 14 01441 g001
Figure 2. Fault micro-element and macro-mechanical model.
Applsci 14 01441 g002
Figure 3. Movement of key strata when mining on a hanging wall and a footwall [22]. (a) Movement state of key strata in hanging-wall mining. (b) Movement state of key strata in footwall mining.
Applsci 14 01441 g003
Figure 4. Diagram of fault surface and rock movement line.
Applsci 14 01441 g004
Figure 5. Diagram of fault separation space.
Applsci 14 01441 g005
Figure 6. Non-boundary support module partition.
Applsci 14 01441 g006
Figure 7. Model of key-stratum support module slip instability.
Applsci 14 01441 g007
Figure 8. Model of key-stratum support module offset instability.
Applsci 14 01441 g008
Figure 9. Diagram of non-continuous boundary stope overburden partition.
Applsci 14 01441 g009
Figure 10. Critical layer support module for discontinuous boundaries.
Applsci 14 01441 g010
Figure 11. Numerical model of fault zone.
Applsci 14 01441 g011
Figure 12. Vertical stress distribution of rock strata in goaf with discontinuous boundary. (a) Working face advancing 0 m. (b) Working face advancing 30 m. (c) Working face advancing 60 m. (d) Working face advancing 90 m. (e) Working face advancing 120 m. (f) Working face advancing 150 m.
Applsci 14 01441 g012
Figure 13. Distribution of plastic zone of rock strata in discontinuous-boundary goaf.
Applsci 14 01441 g013
Figure 14. Layout diagram of measuring points.
Applsci 14 01441 g014
Figure 15. Vertical stress variation curves of each monitoring point during the advancement of the working face. (a) Vertical stress at point A. (b) Vertical stress at point B. (c) Vertical stress at point C. (d) Vertical stress at point D. (e) Vertical stress at point M. (f) Vertical stress at point N.
Applsci 14 01441 g015
Table 1. Moment of the rock mass at the end of key stratum at point P.
MP(p1) (KN·m)MP(p1) (KN·m)MP(G) (KN·m)MP(p2) (KN·m)MP (KN·m)
0−407.856 × 1032.32 × 103685.45 × 103−1090.99 × 103
Table 2. Rock mechanics parameters of each rock stratum.
Rock NameThickness (m)Bulk (GPa)Shear (GPa)σtension (MPa)Fric. (°)Coh. (MPa)
Siltstone269.946.53.2352.4
Fine sandstone59.826.71.6322.5
Sandy mudstone48.165.80.7261.7
Siltstone223.683.10.56202.4
Sandy mudstone68.165.80.7261.7
Fine sandstone810.69.12.2322.0
Siltstone39.946.53.2302.4
Silty mudstone48.165.80.7261.7
#1 coal seam53.221.00.6250.2
Silty mudstone58.165.80.7261.7
Fine sandstone79.826.71.6322.0
#2 coal seam3.23.221.00.6250.23
Sandy mudstone48.165.80.7261.7
Siltstone269.946.53.2352.4
Fault zone1.20.00830.00380.002150.30
Disclaimer/Publisher’s Note: The statements, opinions and data contained in all publications are solely those of the individual author(s) and contributor(s) and not of MDPI and/or the editor(s). MDPI and/or the editor(s) disclaim responsibility for any injury to people or property resulting from any ideas, methods, instructions or products referred to in the content.

