Abstract
Slate typically possesses a pronounced layered structure and tends to soften when exposed to water, leading to numerous detrimental effects on the construction of related underground projects. In this study, X-ray diffraction (XRD) analysis was first performed to investigate the mineral composition of the typical slate from Changsha, China. Then, uniaxial and triaxial compression tests under varying bedding angles (i.e., 0°, 30°, 45°, 60°, and 90°) and moisture levels (i.e., dry state, natural state, and saturated state) were conducted to explore the anisotropy characteristics and susceptibility to water-induced softening of the slate. The results reveal that: (1) The exposure of slate to water exacerbates the deterioration of its layered structure, making it more prone to shear failure along the bedding planes. Furthermore, the energy released during shear-slip damage is reduced, which is macroscopically manifested by the decrease in slate brittleness and the increase in plasticity. (2) The slate’s compressive strength, elastic modulus, and cohesion vary in a U-shaped pattern with the increase in bedding angles. However, Poisson’s ratio and internal friction angle are slightly affected by the bedding angle and water content, which do not exhibit a clear variation pattern. (3) In addition, the formulations for strength and stiffness predictions of slate were also discussed in this study. The results show that the modified Hoek–Brown criterion characterizes the uniaxial and triaxial compressive strengths of slate more accurately, and the generalized Hooke’s Law more effectively predicts the elastic modulus.
1. Introduction
Slate is a typical foliated rock, which usually has dense slab cleavage and belongs to regional metamorphic rock. Its physical and mechanical properties exhibit remarkable anisotropy in directions parallel and perpendicular to the bedding, and it is prone to significant softening and deterioration when exposed to water. With the continuous growth of the national economy, underground engineering construction has also developed rapidly in recent years, and constructions passing through slate strata are often encountered in engineering practice. Accidents involving large deformation of slate foundation pits and partial collapse of running tunnels in slate strata sometimes occur due to a lack of understanding of the slate’s mechanical properties. Therefore, conducting relevant experimental research on the anisotropy of slate and its deterioration characteristics when exposed to water is essential.
Scholars have studied the anisotropic properties of various types of foliated rocks. Kuila et al. [1], Attewell et al. [2], and Homand et al. [3] tested the propagation speed of ultrasonic waves in anisotropic rocks in all directions, noting that the wave speed is highest parallel to the bedding and lowest perpendicular to it. Cho et al. [4], through uniaxial compression and Brazilian splitting tests on rocks with three different bedding angles, reported that when the bedding plane is tilted relative to the loading direction, the influence of weak planes becomes more evident, and the strength anisotropy exceeds the elastic modulus anisotropy. Wu et al. [5] conducted a dynamic compression test on anisotropic rock masses and discovered that under the same strain rate, the dynamic compressive strength of the anisotropic rock masses varies in a U-shaped pattern with the increase in bedding angle; the trend becomes more pronounced with higher strain rates. Debecker [6] monitored the slate fracture process, identifying that the bedding angle and microscopic strength anisotropy in the bedding direction are key factors affecting the macroscopic strength anisotropy of the sample. Tavallali et al. [7] focused on the microscale parameters of sandy slate, highlighting that the number of bedding planes, weak mineral content, and polycrystal grain size are the main factors influencing the macro-mechanical properties of slate. Li et al. [8], Liu et al. [9], and Hao et al. [10] indicated that slate bedding planes significantly impact the deformation characteristics, failure mode, and strength parameters of rock based on a mechanical test of slate. These studies primarily explore the anisotropic properties of foliated rocks and slates from different bedding directions, elucidating relevant physical and mechanical properties. However, most studies focus on a single variable, with few examining the changes in failure modes and anisotropic properties of foliated rocks.
Under water-rich conditions, foliated anisotropic rocks’ physical and mechanical properties are greatly affected, resulting in noticeable softening and deterioration. Li et al. [11], based on ultrasonic velocity measurement results of shale, reported that with increasing water content, the transverse and longitudinal wave speeds decrease, and the anisotropy increases. Wasantha [12] analyzed the acoustic energy, showing that in any bedding direction, the energy release of saturated samples is significantly below that of dried samples. Mashhadiali et al. [13], Cheng et al. [14], and Zhang et al. [15] conducted uniaxial and triaxial tests on shale, highlighting that the strength and Young’s modulus of the shale gradually decreased with the increase in water content. Zhang et al. [16] noted that the m and K values of slate under uniaxial and triaxial compression conditions first decrease and then increase with the rise in bedding angle, and they decrease as the number of freeze-thaw cycles increases. Li et al. [17], based on uniaxial and triaxial test results of sandstone with prominent bedding characteristics, found that cohesion is directly proportional to water content, while the friction angle is inversely proportional. These studies mainly explore the changes in the macroscopic mechanical properties of shale or sandstone in dry, wet, or freeze–thaw states. However, a few focus on slate and its evolution law of anisotropic properties under different water contents.
Until now, scholars have carried out relevant research on the anisotropy properties of different types of foliated rock mass, most of which are shale. Both slate and shale are layered rock masses, but shale is a sedimentary rock with a thin sheet or lamellar joints, mainly formed by clay deposition under pressure and temperature, and easy to break into fragments when hit by hard objects. While slate is an epimetamorphic rock, the possible protolith is mainly shale, mudstone, or tuff. Generally, the slab joints of slate are thicker than the thin foliated joints of shale, thus having denser lithology and higher hardness.
In summary, although there are a number of studies on the hydration-mechanical properties and instability mechanism of shale, current research on the failure mode of slate and its changing characteristics of anisotropic mechanical properties under the joint influence of bedding angle, water content, and confining pressure lacks depth. Therefore, it is necessary to conduct in-depth mechanical experimental research to reveal the influence of these three factors on the mechanical behaviors and anisotropic properties of slate, providing references and guidance for the design and construction of underground engineering projects that pass through slate strata.
2. Test Preparation and Plan
2.1. Sample Preparation
The rock mass tested was obtained from the Proterozoic Banxi Group slate in Changsha City, China. The slates of the Banxi Group belong to the slight-marine sedimentary sediment series, which are formed by the slight metamorphism of clayey silty sedimentary rocks, medium acid tuffaceous rocks, and caittuff.
XRD test was performed to investigate the types and contents of minerals of the slate, and Figure 1 presents the result. It can be seen that these slate specimens mainly contain mica, quartz, albite, siderite, and clay. The content of clay minerals in the slate is low, and only small amounts of chlorite have been detected. The proportion of quartz and mica is 71.28%, which is a large part of the mineral composition, indicating the high brittleness of these slate specimens.
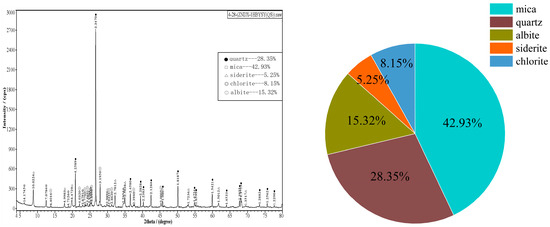
Figure 1.
Mineral composition and proportion.
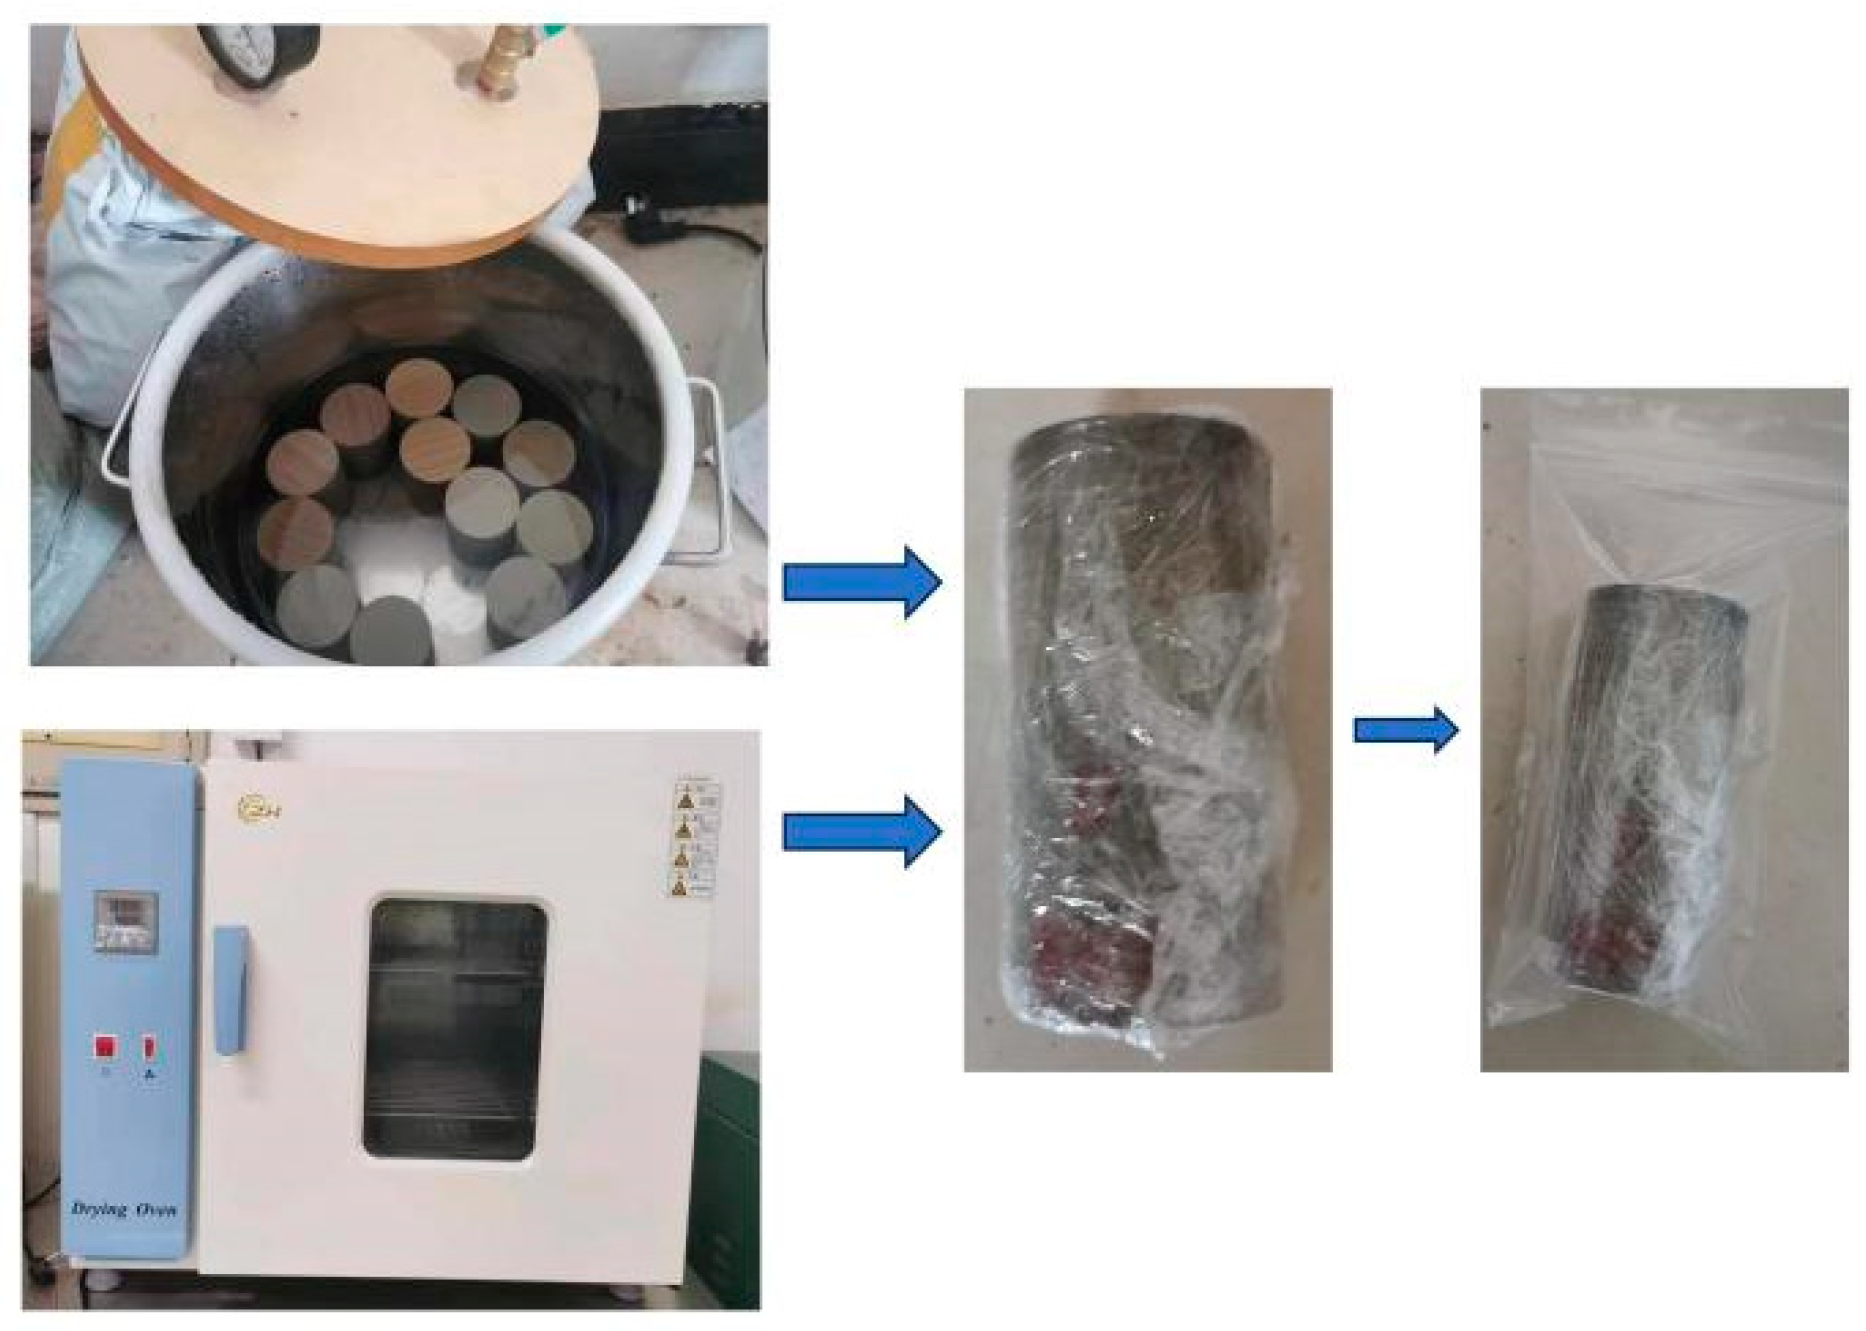
By adjusting the placement angle of the rock block, cores were drilled in various bedding directions, which were then cut and polished to create standard cylindrical samples measuring 100 mm in height and 50 mm in diameter. This study defines the bedding angle β as the angle between the slate’s bedding direction and the horizontal plane. The bedding angles of the samples include 0°, 30°, 45°, 60°, and 90°, as illustrated in Figure 2. The water contents of the slate samples vary, encompassing natural, dry, and saturated states. The density of the sample in its natural state is approximately 2.7 g/cm3, with a water content of around 0.73%. The preparation of dried and saturated slate samples is shown in Figure 3.
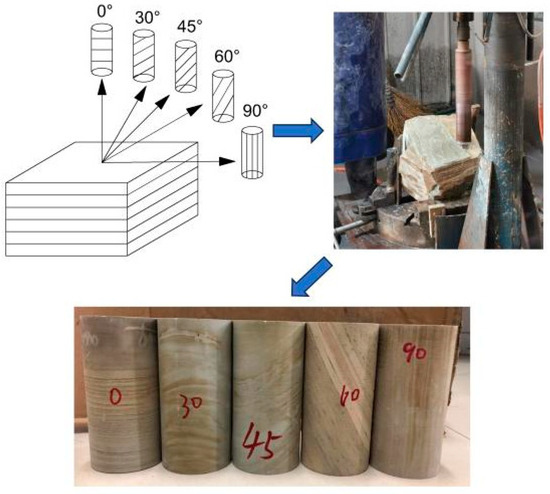
Figure 2.
Schematic diagram of slate specimen drilling.

Figure 3.
Dried and saturated sample production.
2.1.1. Dried Sample Production
Based on the “Standard for Test Methods of Engineering Rock Mass” in China [18], the procedure was as follows: The sample was placed in a drying oven and heated at 105 °C for 24 h. Subsequently, the sample was removed and cooled in a desiccator.
Slate samples were wrapped in cling film and stored in a sealed bag to prevent desiccation of the specimen due to exposure to air, further protected by a foam bag to prevent collision damage during transportation. The density of the dried sample is approximately 2.68 g/cm3.
2.1.2. Saturated Sample Preparation
The steps of our production of saturated samples were fully in accordance with the specifications in the “Standard for Test Methods of Engineering Rock Mass” of China.
The sample was placed in vacuum pumping equipment. Water was added to the equipment until the water surface rose above the sample’s top. Then, the air was pumped out for more than 4 h until the air pressure in the container stabilized and no bubbles escaped. The sample was put in the container for soaking for more than 24 h to ensure complete saturation. It is widely accepted that rock samples produced in accordance with the specifications of the standard would reach a fully saturation or nearly a fully saturation condition. In order to verify whether the sample reached saturation, this paper took part of the samples that had completed the saturation test and soaked them in water for 45 days. After 45 days, the sample was weighed. It was found that the weight of the sample did not increase, which proved that the sample was basically close to saturation before this.
The sample was sealed as in step 2 for preparing dried samples. The density of the saturated sample is approximately 2.72 g/cm3, and its water content is about 1.67%.
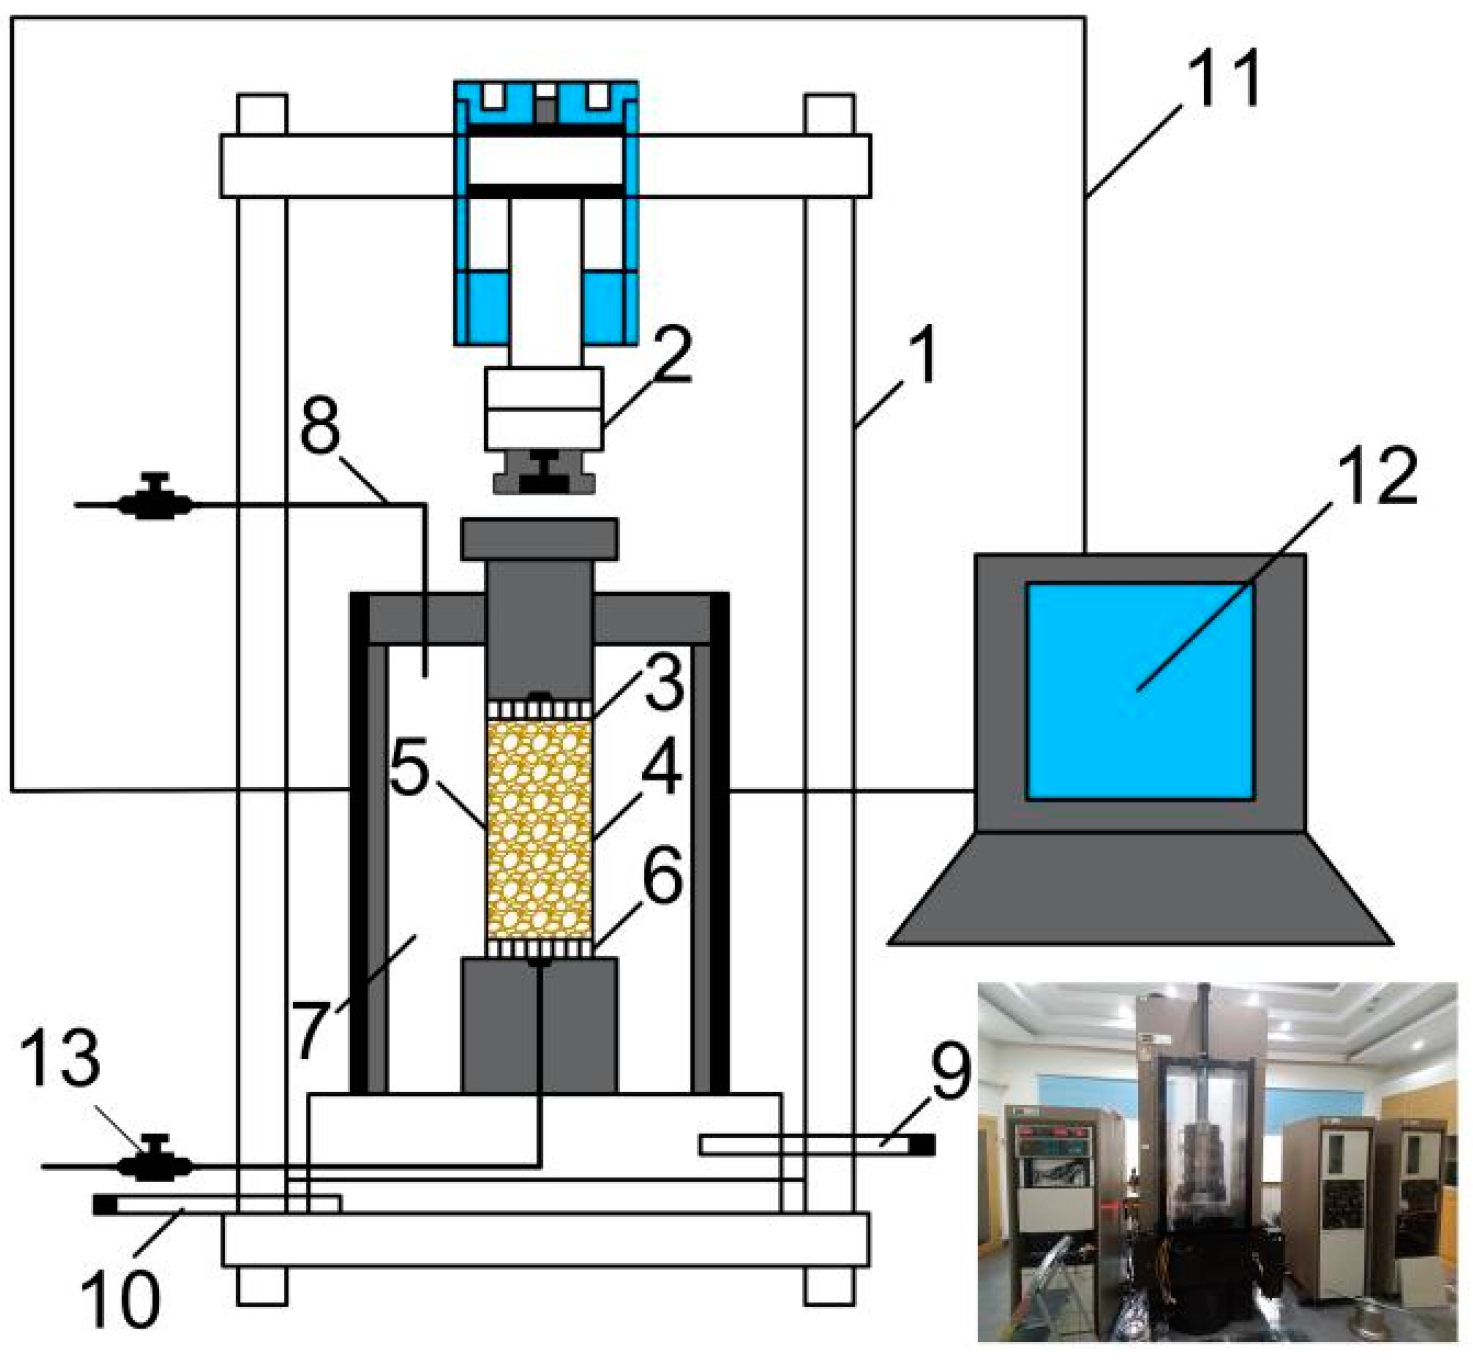
2.2. Test Equipment
The equipment used in the uniaxial and triaxial compression tests of slate is the MTS 815 rock triaxial test system, as shown in Figure 4. The MTS 815, an electro-hydraulic servo-controlled stiff testing machine for rock mechanics, was produced by the American company MTS. It comprises a control system, oil source, loading frame, confining pressure system, and various test fixtures and sensors. It can conduct uniaxial and triaxial compression tests of rocks using stress, displacement, and other loading control methods.
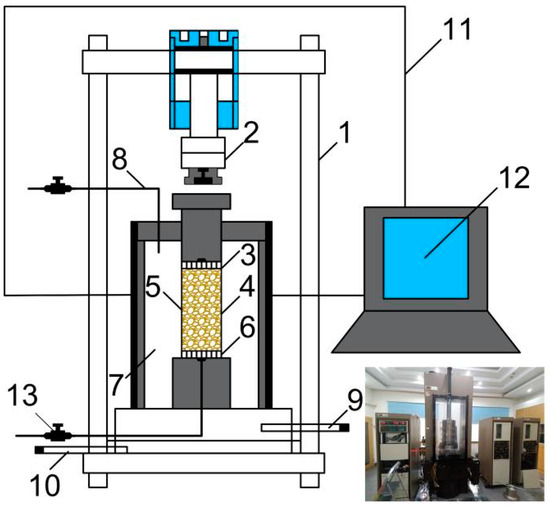
Figure 4.
MTS 815 triaxial rock testing system. 1, reaction frame; 2, normal loading chuck; 3 and 6, washer; 4, heat-shrink tube; 5, sample; 7, triaxial pressure chamber; 8, exhaust pipe; 9, oil inlet; 10, oil outlet; 11, signal transmission line; 12, test data acquisition system; 13, valve.
2.3. Test Plan
The confining pressure in this test was set to 0, 5, 10, and 15 MPa. The specimen was placed between the top and bottom pressure shafts. A thermally shrunken pipe was then put on to cover the specimen and two pressure shafts. This pipe was heated using a hairdryer so that it closely contacted the specimen wall and both ends of the pressure shafts. The thermally shrunken pipe was then tightened by metal hoops at both ends of the pressure shafts. A circumferential extensometer, for measuring the circumferential deformation, was then installed in the middle of the specimen, and an axial extensometer, for measuring the axial deformation, was installed at both ends of the specimen. When the trial began, first, the confining pressure was increased at a constant rate of 0.05 MPa/s to the desired value to ensure that the specimen was under uniform hydrostatic stress. Then, the axial stress test was conducted at a loading rate of 0.12 mm/min until the specimen failed [19]. When the specimens completely lost their carrying capacities, the loading was stopped and the experiment ended. Before the test, the apparent characteristics of the sample were presented; after the test, the failure pattern of the sample was documented, and the axial compressive strength was recorded.
3. Experimental Results and Analysis
3.1. Stress–Strain Curve Characteristics
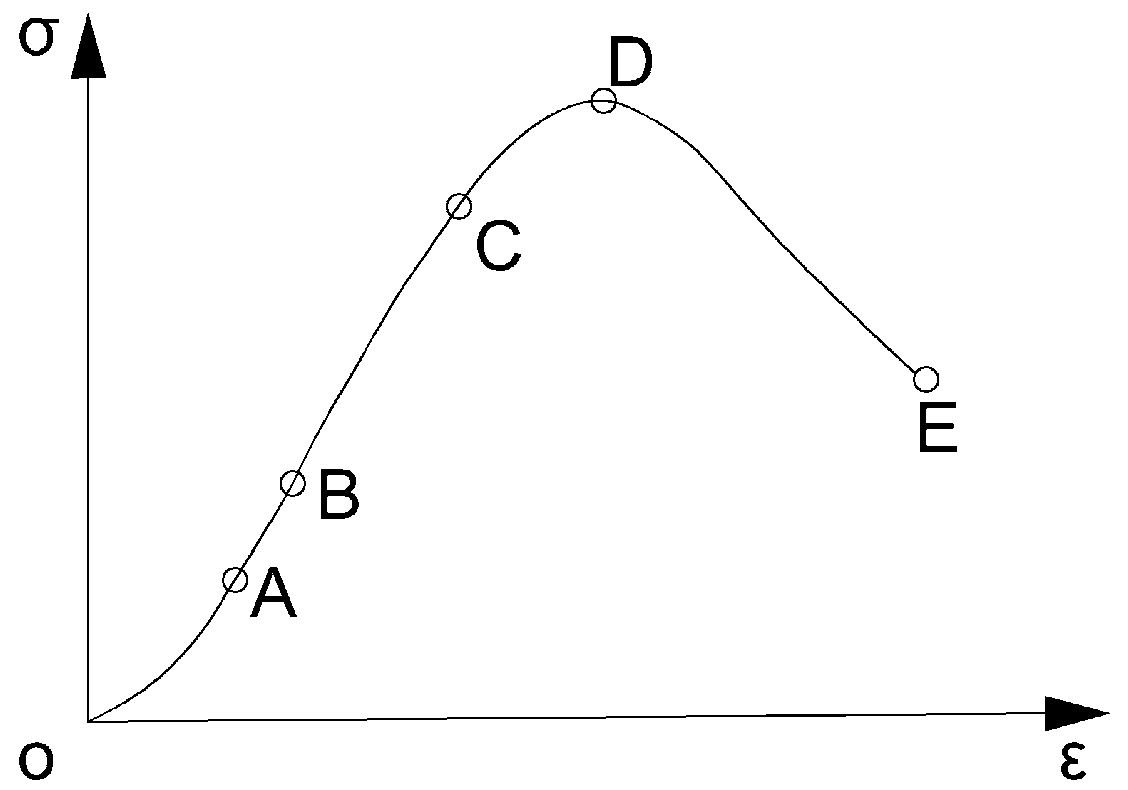
In rock mechanics, the stress–strain curve of a rock typically describes the material’s deformation characteristics, with relevant parameters calculated from it. The standard rock stress–strain full-process curve divides into five distinct stages (as shown in Figure 5) [20,21,22]: the compaction stage of pores and fractures (OA section), the elastic deformation stage (AB section), the stable development stage of microplastic fractures (BC section), the unstable cracking stage (CD section), and the post-failure stage (DE section). Figure 5, Figure 6 and Figure 7 show the stress–strain curves of dried, natural, and saturated samples from these tests, respectively. These curves generally represent the five stages mentioned. In these figures, the positive half-axis of x indicates axial strain, and the negative half-axis represents hoop strain.
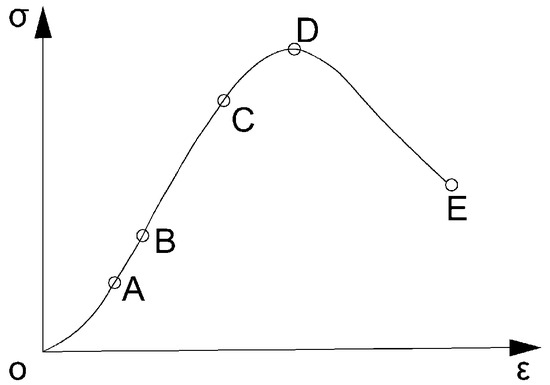
Figure 5.
Typical stress–strain curve of rock.
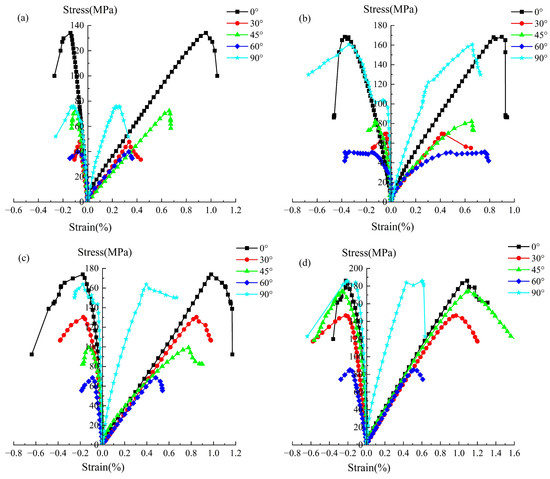
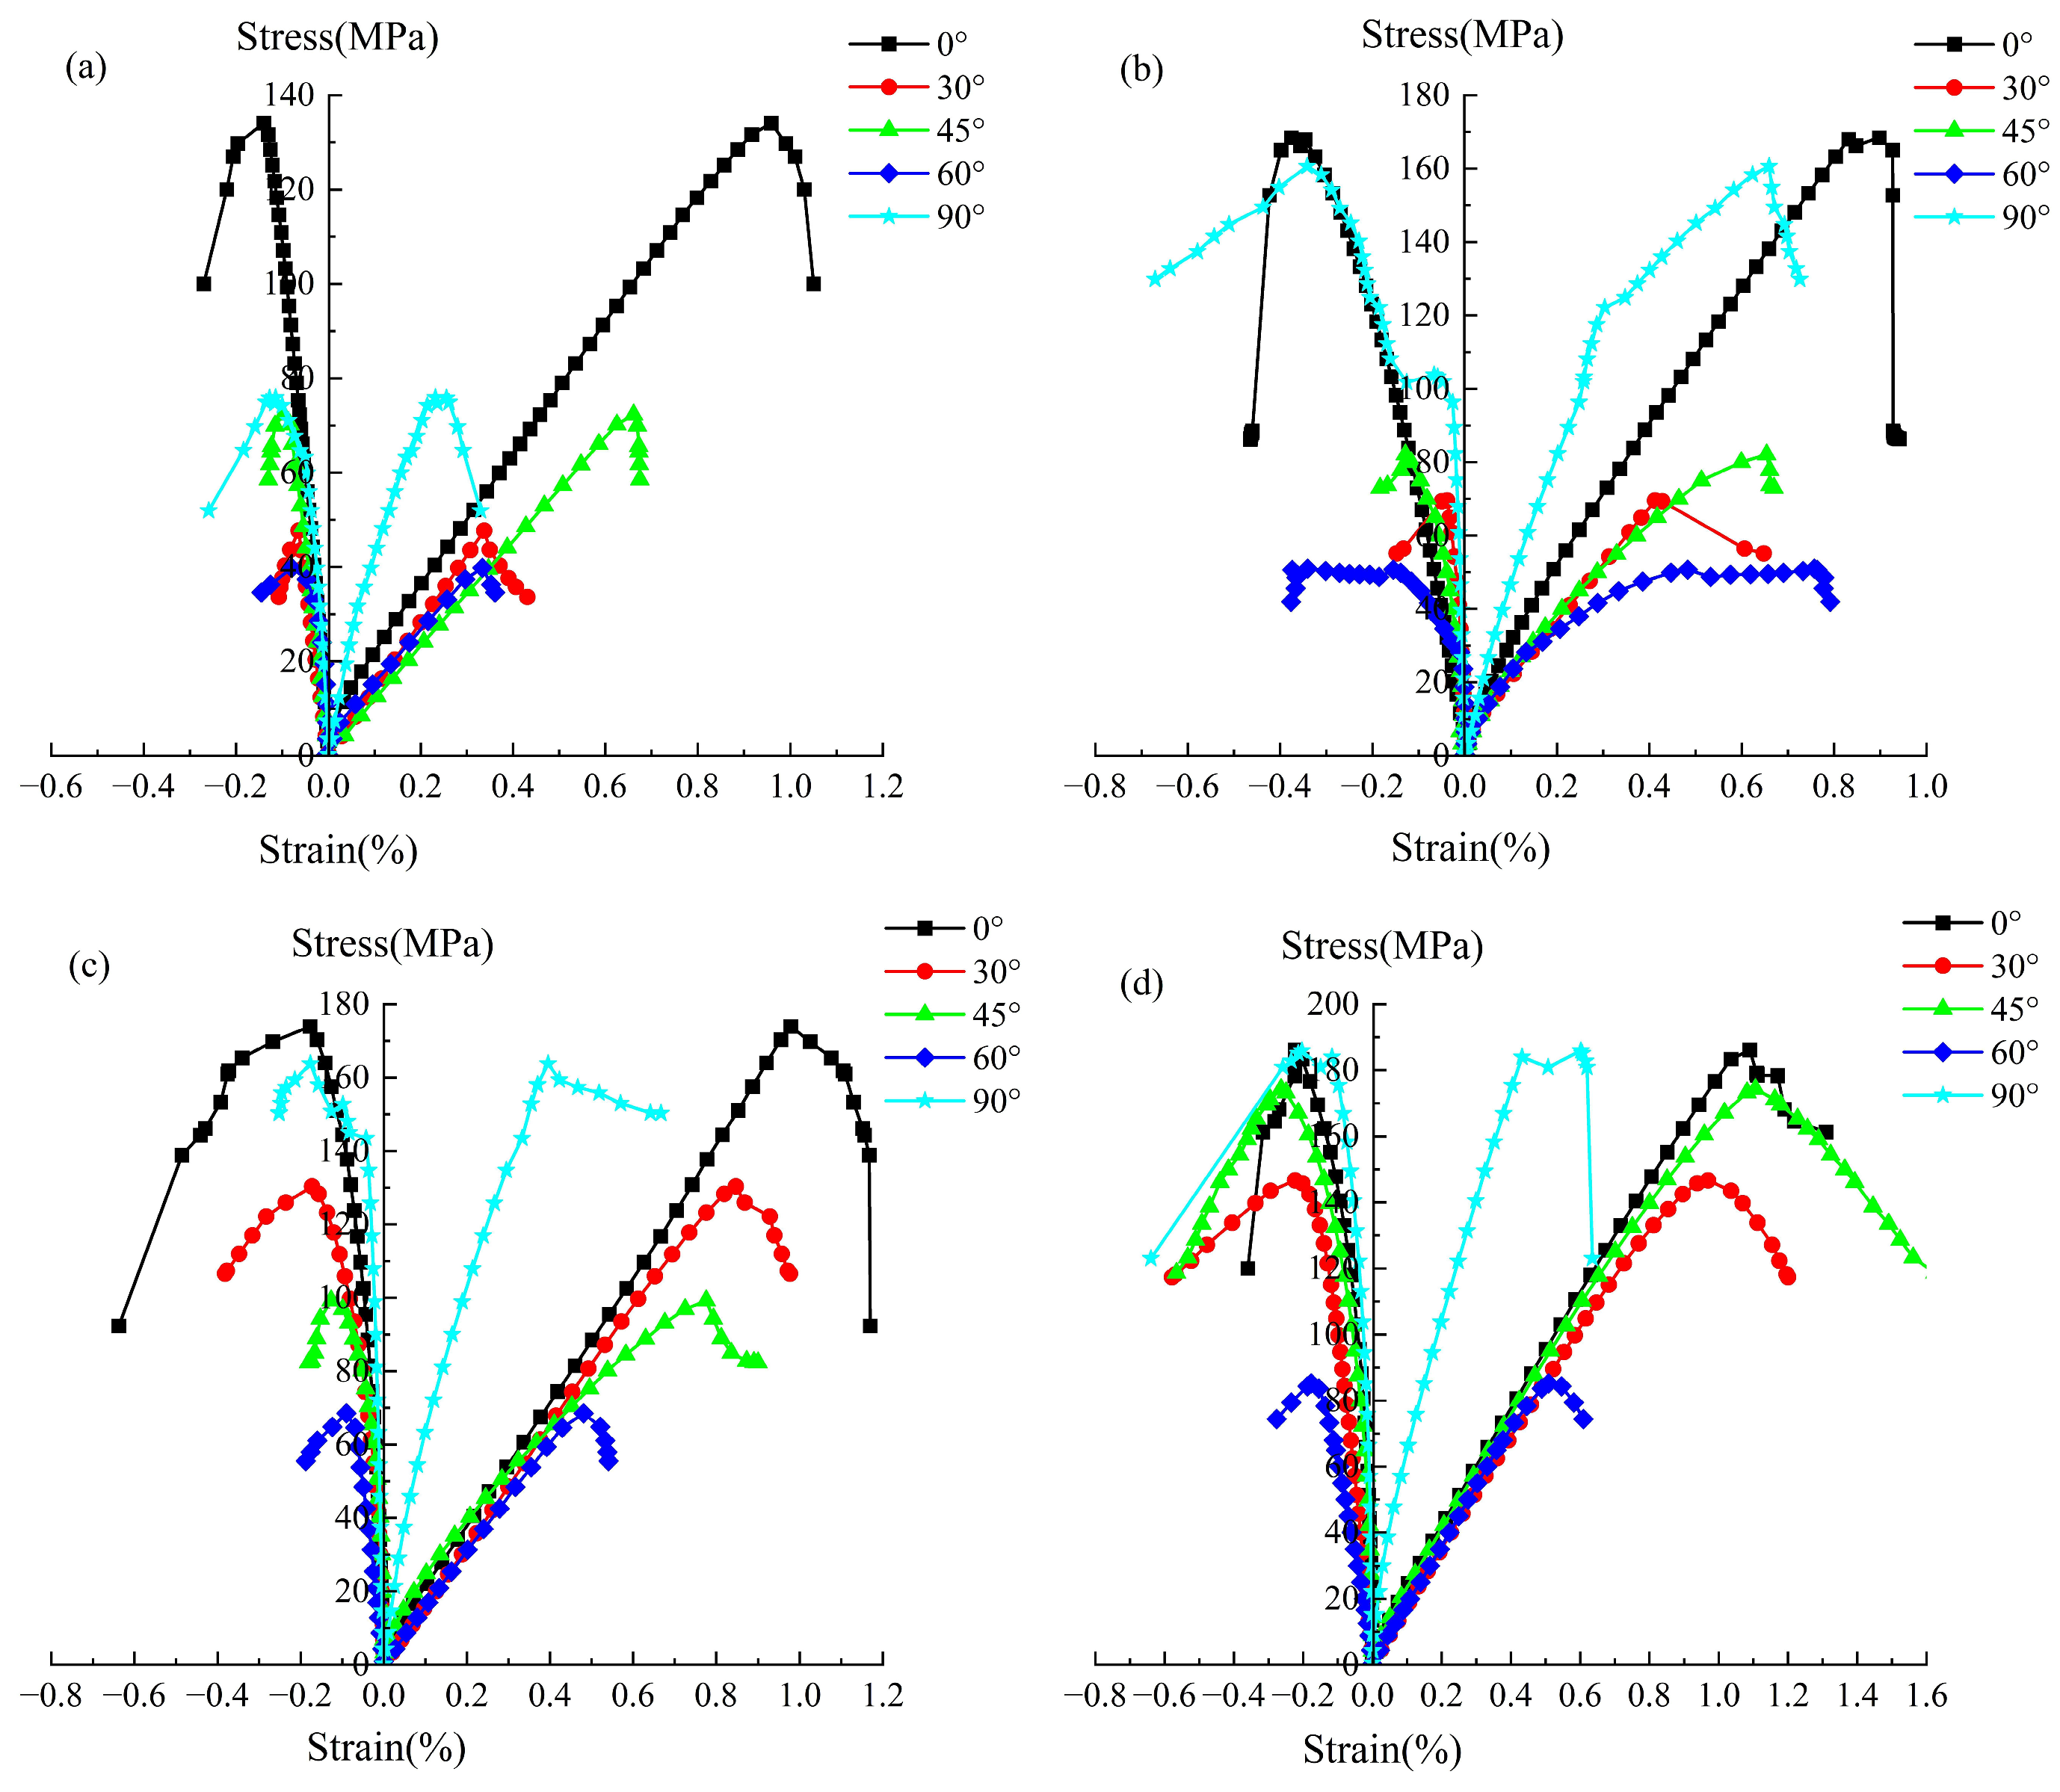
Figure 6.
Stress–strain curve of the slate sample in a dry state. (a) σ3 = 0 MPa; (b) σ3 = 5 MPa; (c) σ3 = 10 MPa; (d) σ3 = 15 MPa.
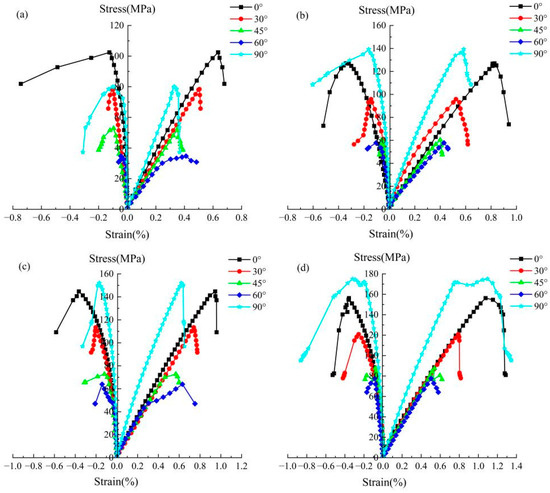
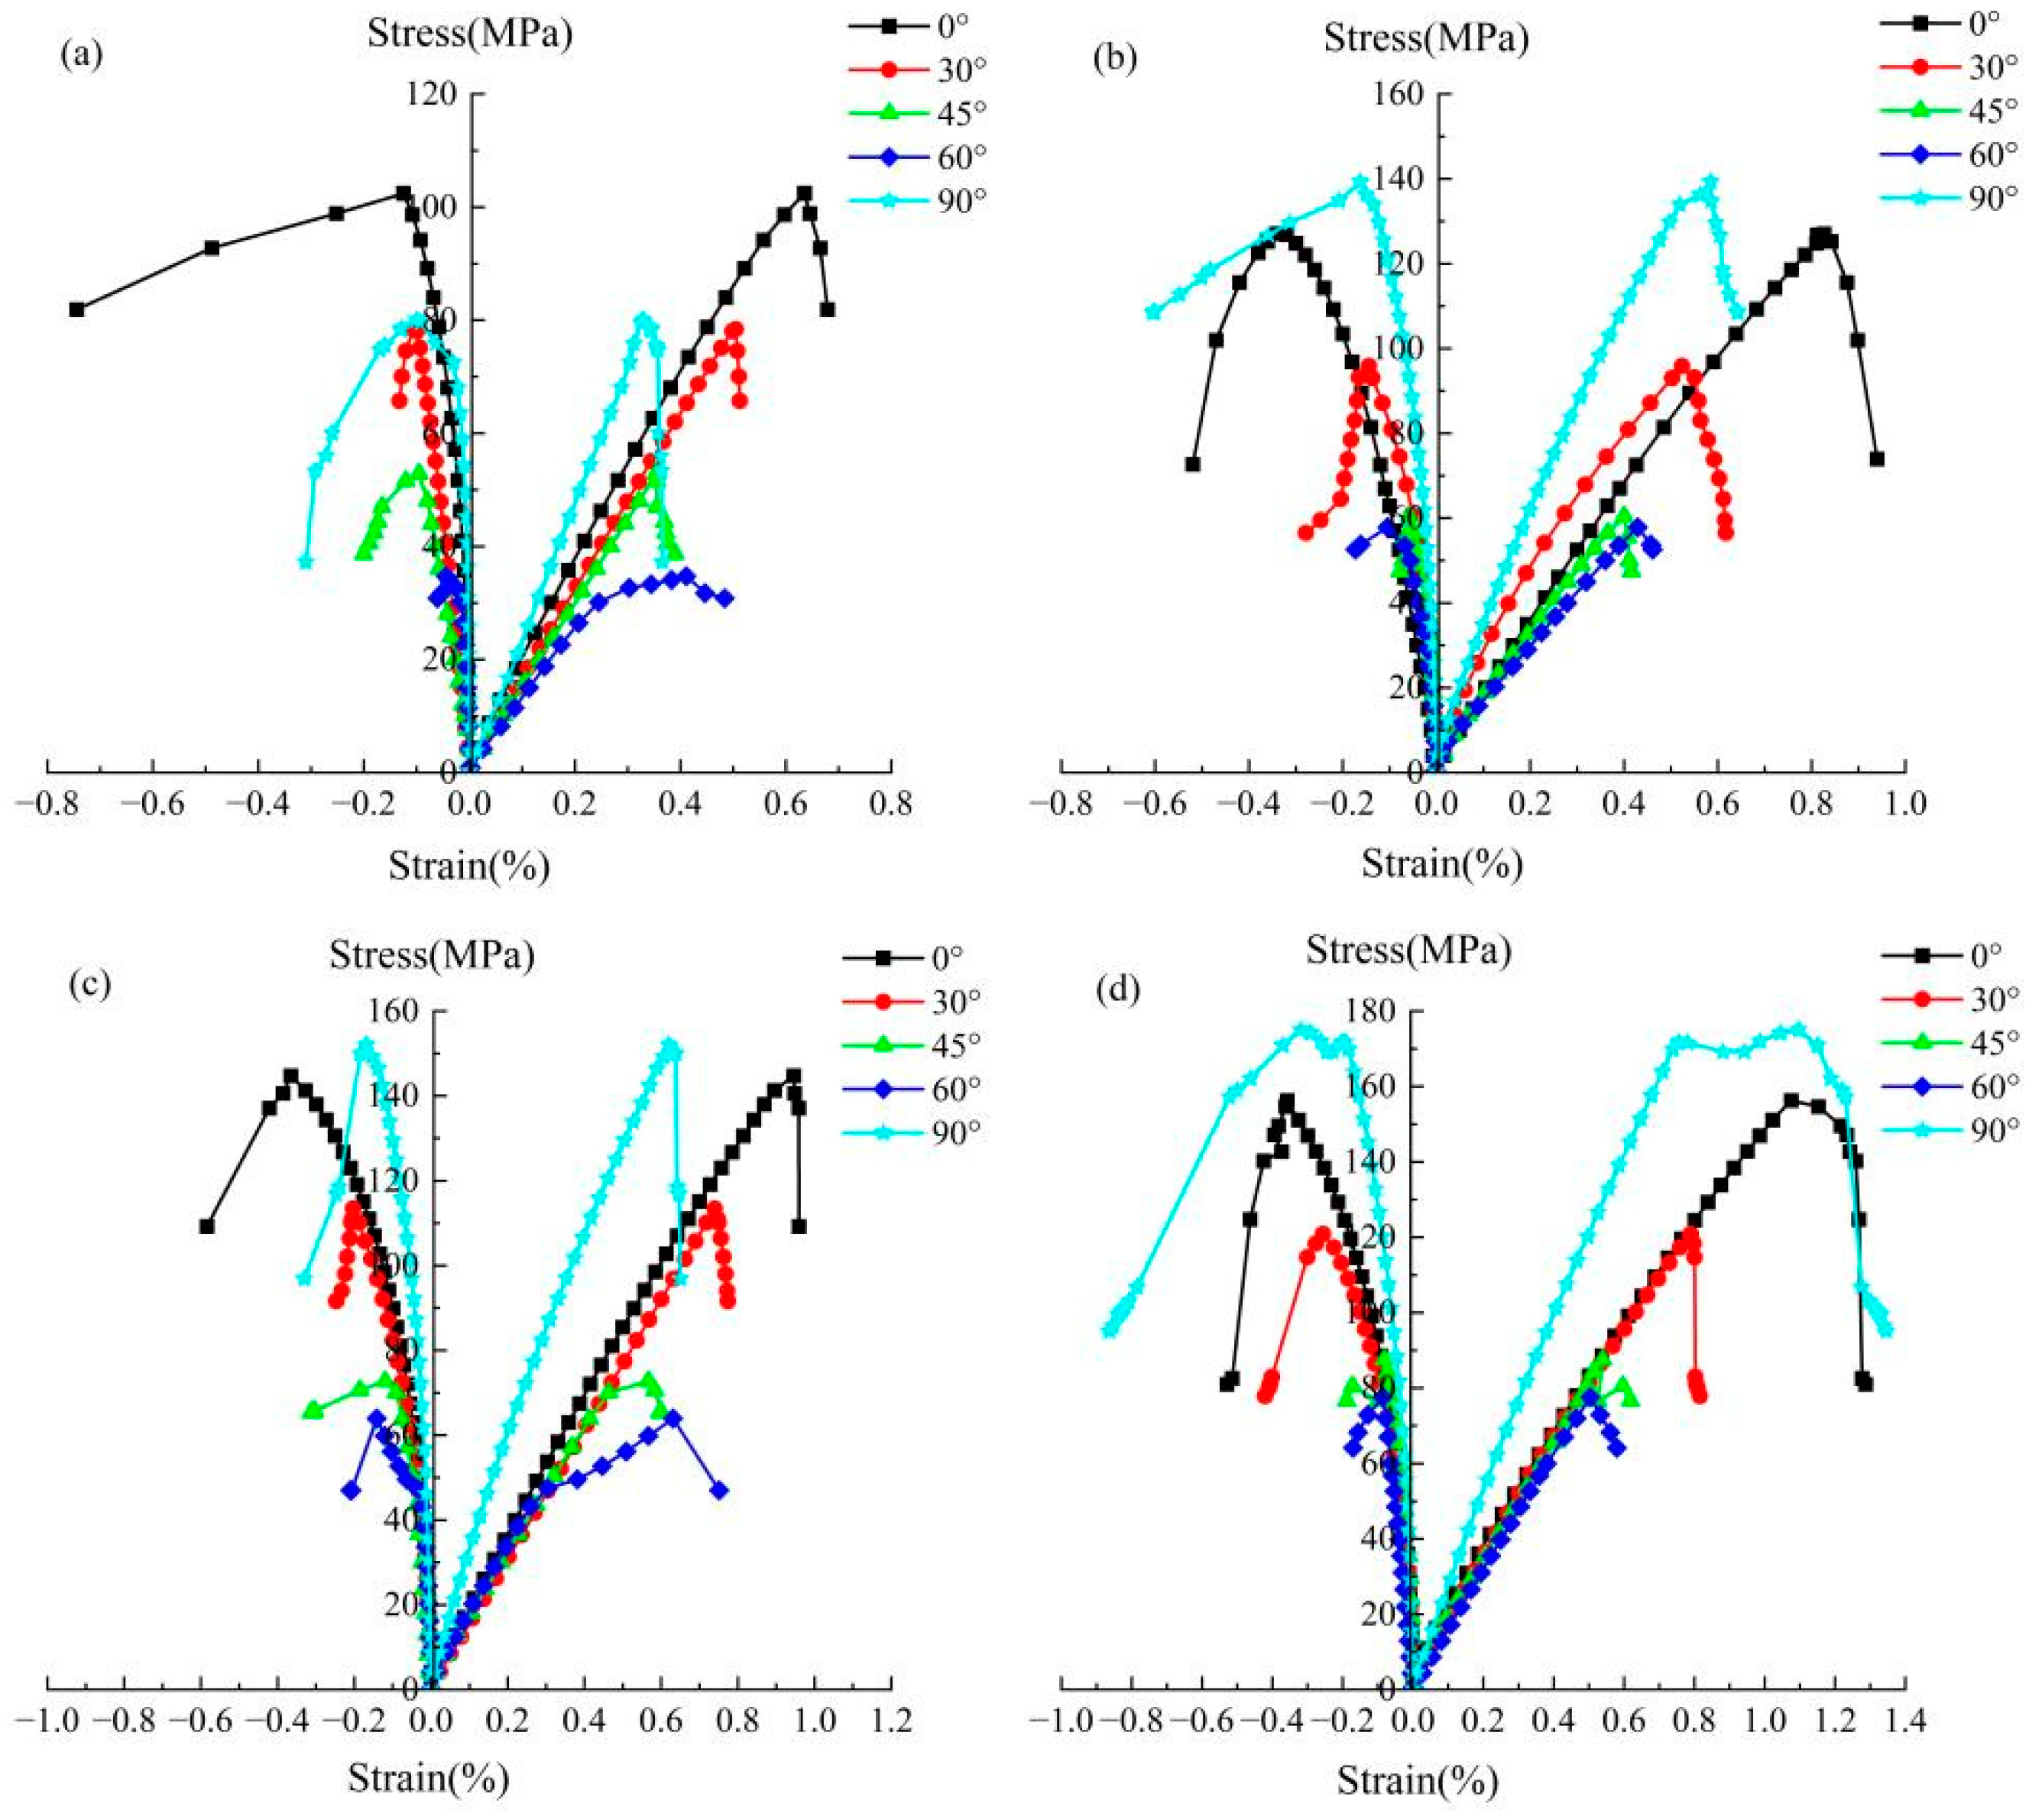
Figure 7.
Stress–strain curves of the slate samples in a natural state. (a) σ3 = 0 MPa; (b) σ3 = 5 MPa; (c) σ3 = 10 MPa; (d) σ3 = 15 MPa.
Under uniaxial compression conditions, as depicted in Figure 6a, Figure 7a and Figure 8a, the hoop and axial stress–strain curves of the slate samples initially exhibit a pronounced linear elastic trend. The microelastic fracture stable development stage is brief. Without confining pressure, internal defects in the slate evolve and merge rapidly. At peak strength, fractures are fully developed, and the sample quickly disintegrates, with a sharp stress drop, demonstrating typical brittle destructive deformation.
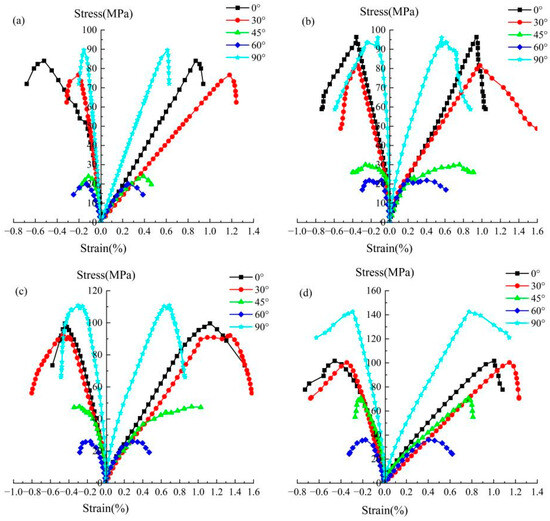
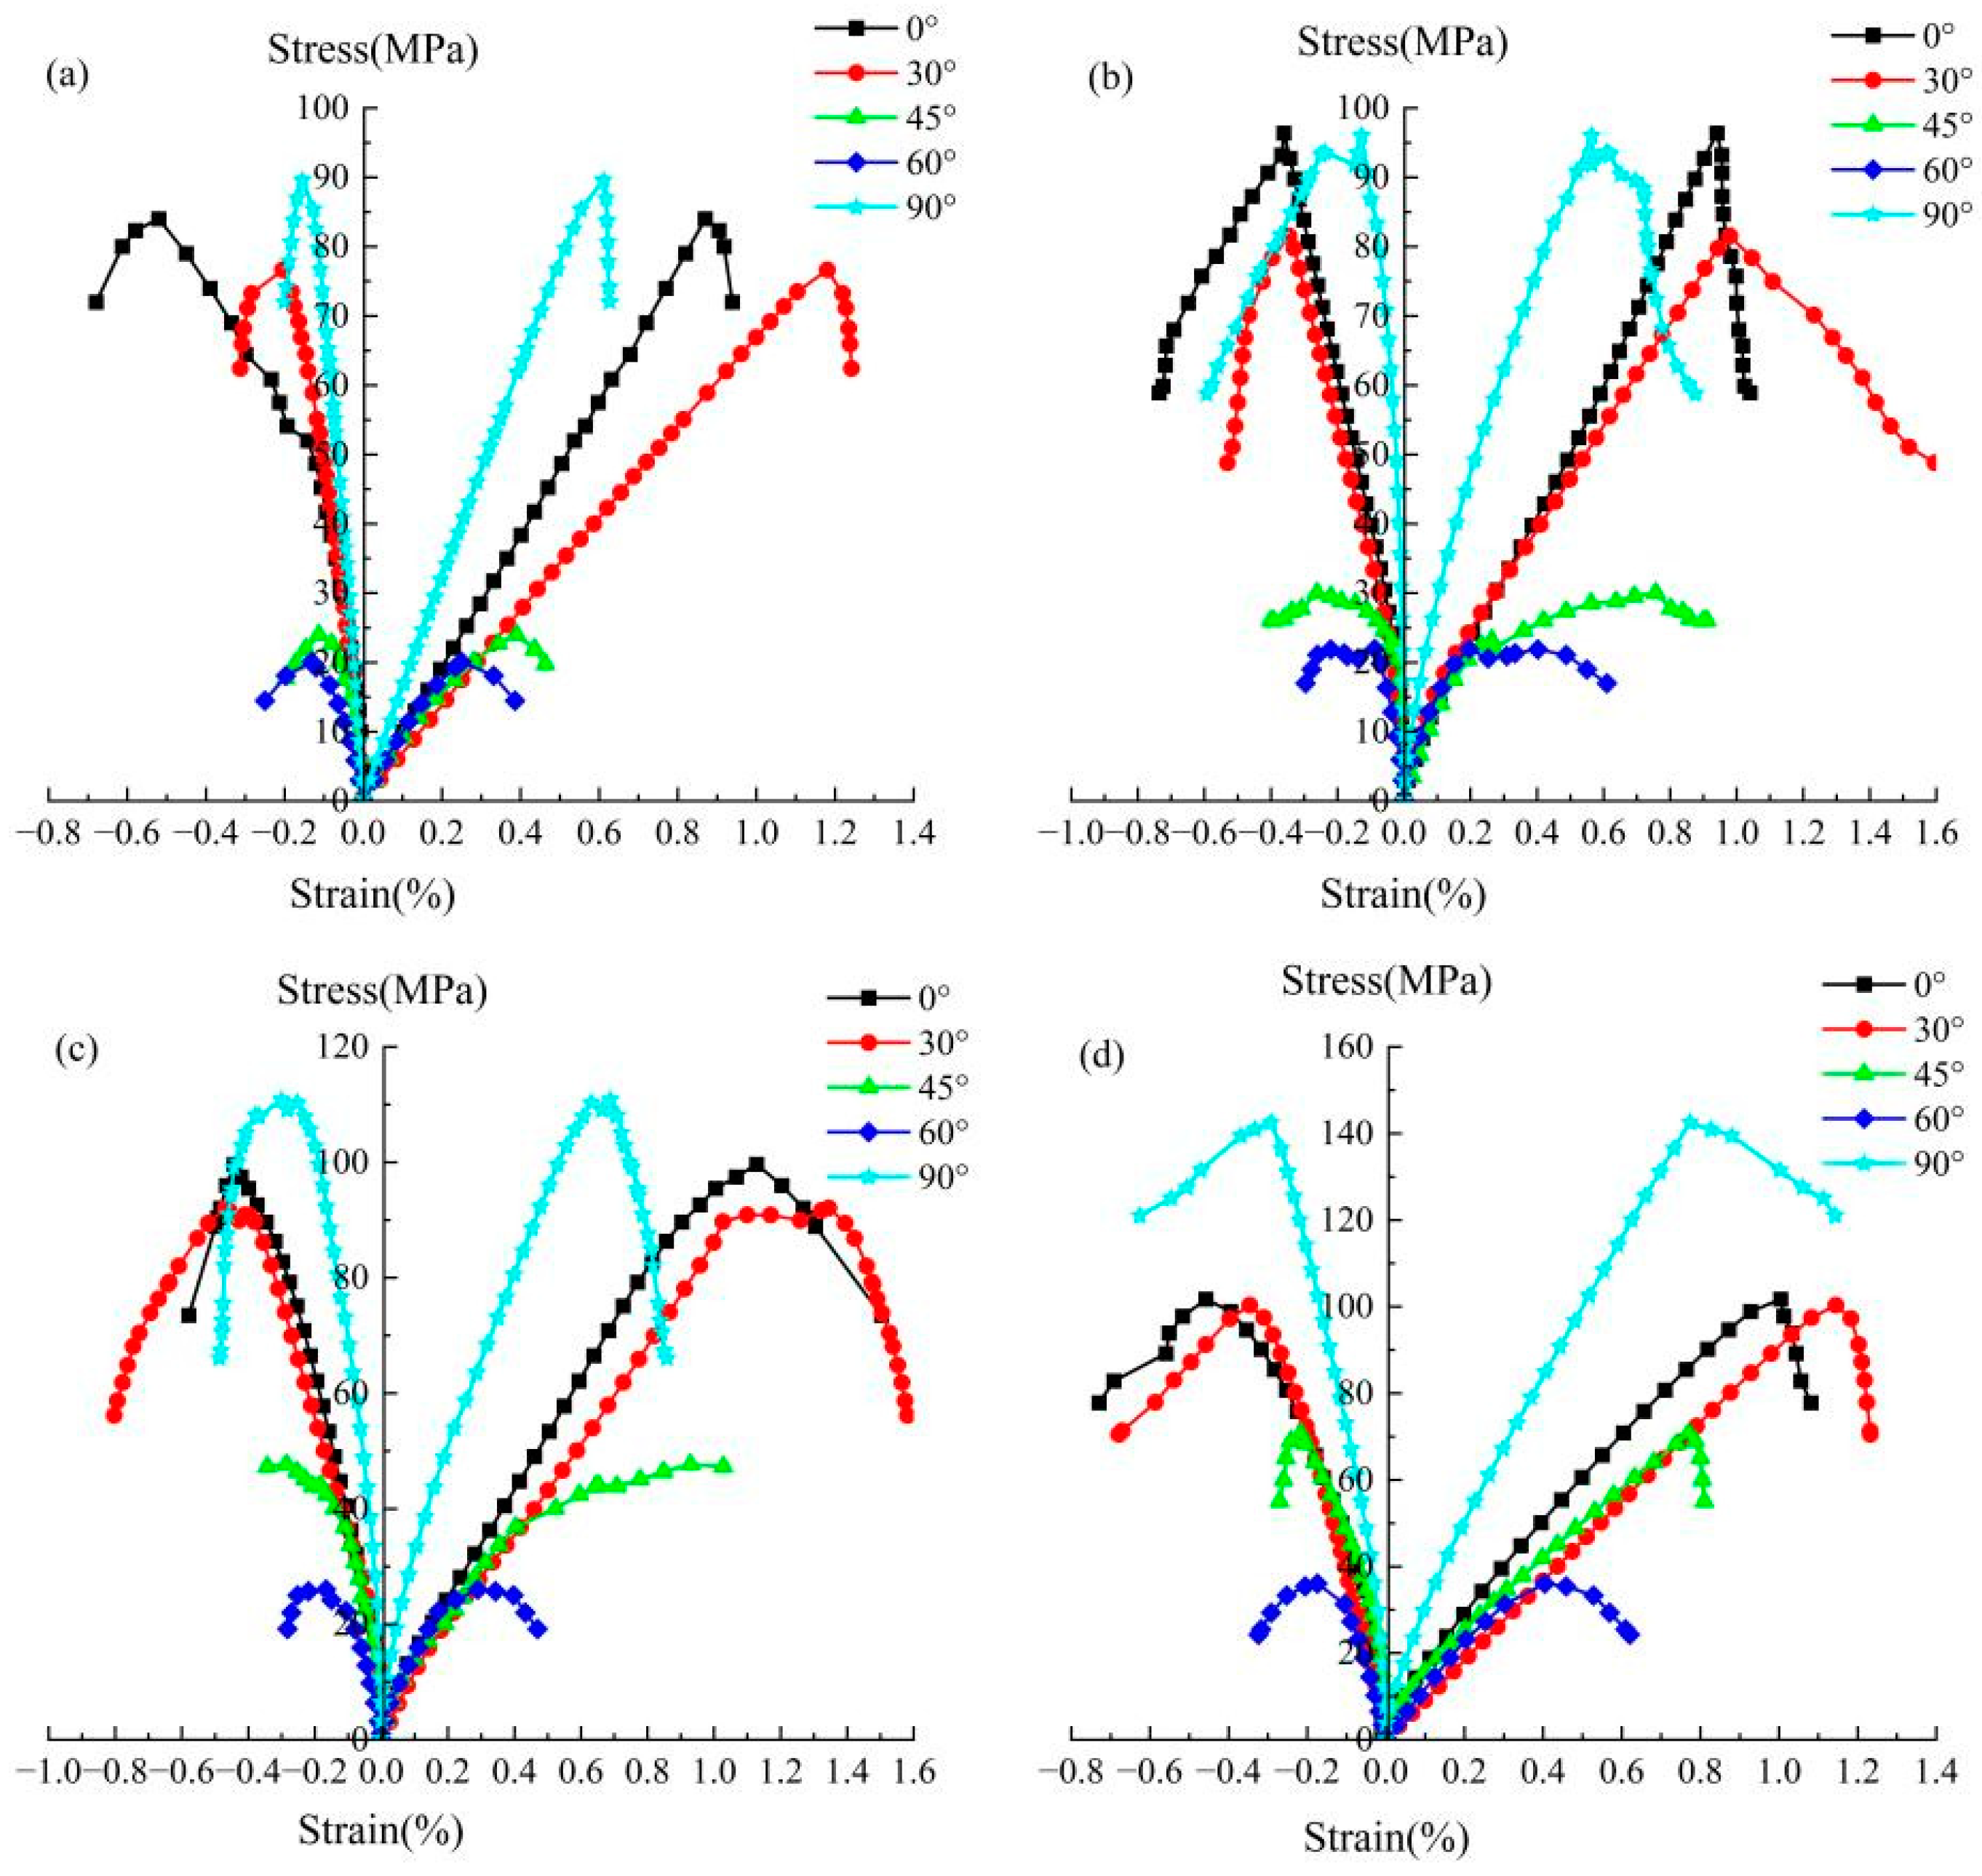
Figure 8.
Stress–strain curves of the slate samples in a saturated state. (a) σ3 = 0 MPa; (b) σ3 = 5 MPa; (c) σ3 = 10 MPa; (d) σ3 = 15 MPa.
Samples with identical bedding angles show similar curve shapes in triaxial compression conditions. Increasing confining pressure restricts slate deformation and postpones failure. The stress decline at peak values in most samples becomes more gradual and pronounced in the post-peak stage. Brittle failure characteristics diminish, while plastic failure traits intensify. Additionally, as confining pressure rises, the peak strength of the slate increases. If the natural state specimen is considered an example (Figure 6), a 5 MPa increase in confining pressure on average boosts the compressive strength of 0°, 30°, 45°, 60°, and 90° samples by 17.93, 14.17, 11.6, 14.15, and 31.54 MPa, respectively. The 45° and 60° samples are more notably influenced by the bedding plane, which has weaker mechanical properties. After compression, the slate is prone to significant plastic deformation, and the energy release rate decreases, making the yield stage more apparent and the post-peak stress reduction rate slower, as seen in Figure 6a and Figure 8b,c.
Under varying water content conditions, the peak strength of samples typically follows the pattern: dry > natural > saturated. For example, at the same confining pressure, the average compressive strength of dry 0° samples is 1.26 times that of natural state samples, and the saturated samples’ average compressive strength is 0.73 times that of the natural state. Water immersion in slate leads to mineral dissolution along the bedding direction, increasing the number and size of micro-fractures and making shear failure along the bedding plane more likely. The failure of loaded slate is fundamentally an energy absorption and release process. Shear slip along the bedding plane causes energy loss, reducing energy released during failure. The 60° sample curves in Figure 6d, Figure 7d and Figure 8d reveal that the elastic–brittle characteristic of slate gradually changes to an elastic–plastic (ductile) characteristic with increasing moisture content.
3.2. Failure Modes and Characteristics
The failure mode of slate is typically influenced by factors, such as bedding angle, confining pressure, and water content. Different states of the same rock type can exhibit considerable variation in failure mode. As illustrated in Figure 9, the samples are categorized into five groups based on the β value. Each group consists of samples in three distinct states: dry, natural, and saturated. The samples are organized from left to right within each state according to increasing confining pressures: 0, 5, 10 and 15 MPa.
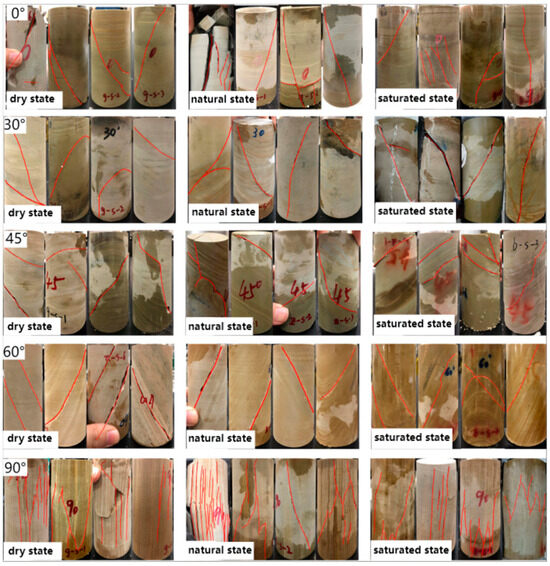
Figure 9.
Slate samples failure modes for different β values.
When β = 0°, the compression direction of the sample aligns perpendicularly to the bedding direction, resulting in a predominantly splitting shear failure that intersects the bedding plane. The angle between the sample’s fracture surface and the axial direction diminishes as confining pressure increases but expands with higher water content. Here, the mechanical properties of the slate are primarily influenced by water content and minimally by the bedding plane. The rock’s strength largely depends on its inherent properties.
At a β of 30°, the samples typically exhibit shear failure that cuts through the matrix, with a minority showing shear slip failure along the bedding’s weak plane. The fracture surface’s development direction is affected by this weak plane, as is the sample’s strength. Furthermore, the failure fracture widths are notably narrower in dry and natural states than in saturated states.
When β = 45°, the quantity of fractures in saturated samples notably exceeds those in dry and natural states, leading to more fragmented rock masses. The dry sample’s failure mode involves partial shear failure along the bedding plane. The natural sample displays complete and partial shear failure along the bedding plane, while the saturated sample’s failure predominantly follows the bedding plane. As confining pressure increases, the angle between the fracture surface and axial direction generally enlarges in most samples. This suggests that the bedding’s weak plane influence intensifies with water content but diminishes with increasing confining pressure.
When β = 60°, samples with different water contents and varying confining pressures all slip along the bedding plane’s direction under compression, forming a shear failure surface in the same direction. Compared to water content and confining pressure, the bedding’s weak plane exerts the greatest influence on the 60° sample, with its fracture surface primarily controlled by this weak plane.
At β of 90°, most samples exhibit a splitting tension failure mode. The load is primarily borne by either the matrix or a combination of the matrix and the weak plane. Hence, the fracture surface typically forms a complex pattern, partially along the weak plane and partially through the matrix. Here, the loading direction aligns with the bedding direction, facilitating the development and coalescence of fractures, especially under load and water-induced softening. However, increased confining pressure compacts the fractures and bedding surfaces within the rock, thereby constraining the sample’s splitting failure to some extent. Macroscopically, the number and size of fractures in the sample decrease with rising confining pressure and increase with water content.
Accordingly, the bedding’s weak plane can significantly affect the failure behavior of slate specimens. As the angle between the axial compression direction and bedding direction narrows, the sample’s failure mode transitions from shear to splitting failure along the bedding plane. Water content amplification heightens the bedding’s weak plane influence on failure mode, while increased confining pressure mitigates this effect. Simultaneously, the number and size of fractures resulting from sample failure escalate with water content and decrease with confining pressure.
4. Analysis of Anisotropic Properties of Slate Parameters
4.1. Compressive Strength Anisotropy
Predicting strength using rock mass strength criteria ranks among the most crucial issues in engineering. An essential standard for testing the strength theory’s applicability is whether the predicted strength corresponds to the actual strength [23]. Hoek and Brown introduced the Hoek–Brown strength criterion in 1980 [24,25], but this criterion shows limited applicability to anisotropic rock masses. Various scholars have enhanced and refined it by incorporating the anisotropic parameter [26,27], which accounts for the effects of stress and fabric tensors’ relative orientations. This enhancement better represents the failure strength of foliated rock masses when combined with the Hoek–Brown criterion. The improved formula requires only a few known parameters to yield results consistent with actual measurements, offering broad applicability.
The layered structure’s variation within the structure is expressible via the fabric tensor. When material coordinate axes do not align with the principal value components, the fabric tensor F is representable as follows:
where Qij is the cosine of the angle between ei and ej, e′i is the i-th base vector of the original coordinate system, and ej is the j-th base vector of the transformed coordinate system. Let b = (σ22 − σ33)/(σ11 − σ33), then σ22 = bσ11 + (1 − b)σ33, p = σii/3 = [(1 + b)σ11 + (2 − b)σ33], deviatoric stress sij = σij − p; after a series of derivation, the unit deviatoric stress tensor n can be obtained.
Based on n, the anisotropy parameter can be defined as A = Fijnij = Fπijnij, where Fπij = Fij–Fkkδij/3. For the torsion test, the expression of A can be derived based on the same coordinate system of σ11, σ22, and σ33, combined with Equations (1)–(3), after defining the parameter D, where θ is the rotation angle of the maximum principal stress, and Δ is the rock’s degree of anisotropy. When the rock mass is isotropic, Δ = 0.
The uniaxial compressive strength fc of foliated rock mass, as a function of parameter A, can be formulated as follows:
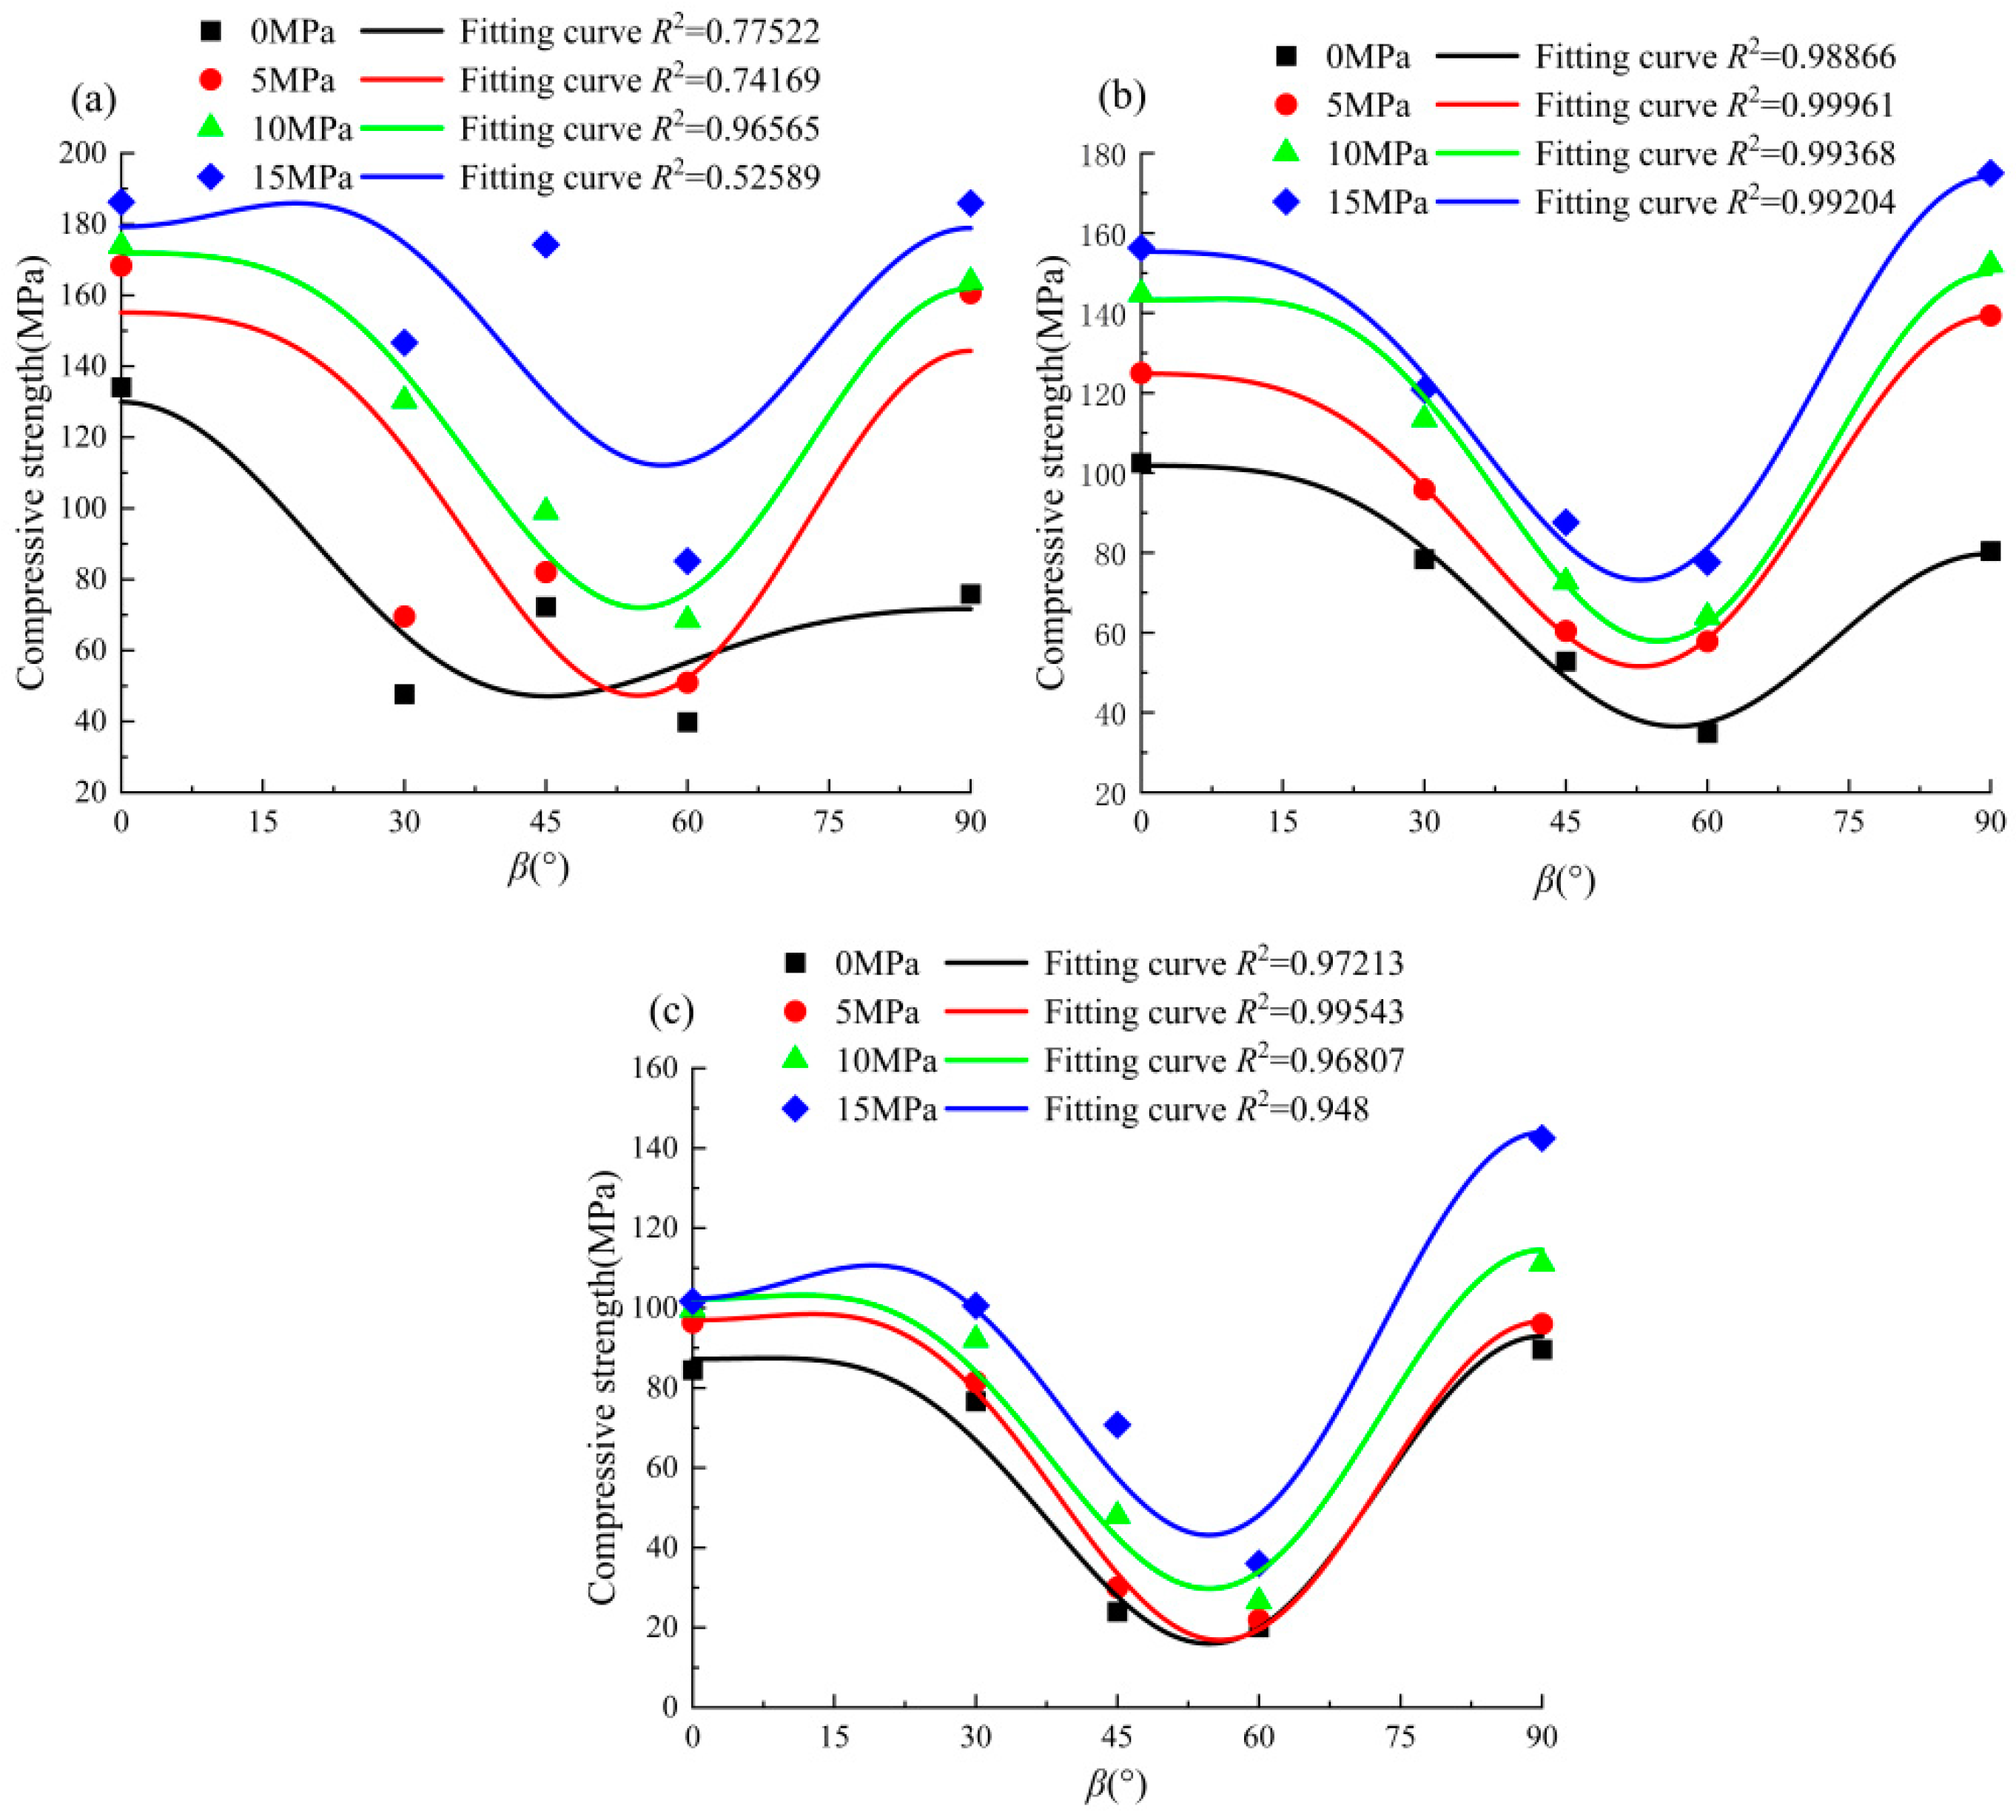
where f′, d1, d2, …, dm are undetermined coefficients. The compressive strength of each sample is given in Table 1. This experimental research tested the uniaxial compressive strength of slates with five distinct bedding angles. Adhering to the solution principle that undetermined coefficients should not surpass known parameters, a third-power polynomial was chosen to predict test values to ensure result convergence. The resultant relationship curve between the slate’s compressive strength and the changing bedding angle appears in Figure 10, where R2 is the correlation coefficient indicating the experimental data’s conformity level with the fitting function. An R2 value closer to 1 signifies higher agreement.

Table 1.
Compressive strength of samples.
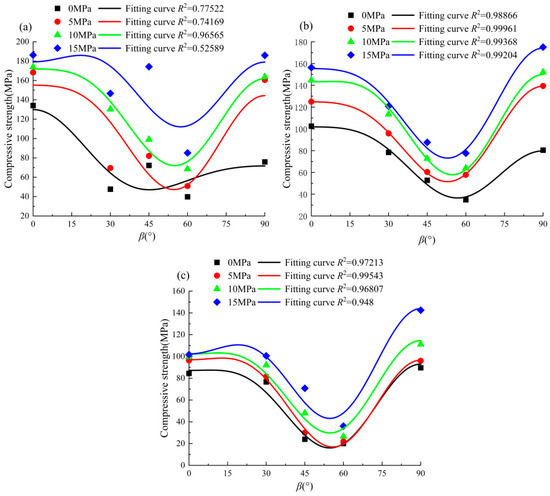
Figure 10.
Compressive strength of slate at different bedding angles: (a) dry state, (b) natural state, and (c) saturated state.
Figure 10 shows that the compressive strength of slate in natural, saturated, and dry states generally exhibits a U-shaped trend, initially decreasing and then increasing with the bedding angle’s growth. Specifically, it reaches its maximum at 0° or 90° and its minimum around 60°. Based on the R2 value, the data suggest that, aside from the relatively dispersed test data of dry slate leading to moderate prediction accuracy, the uniaxial and triaxial prediction results for the slate in natural and saturated states from Equation (5) align well with the experimental outcomes. This indicates the formula’s suitability for describing uniaxial and triaxial compressive strength.
Based on the research in the literature [28,29], the degree of anisotropy in compressive strength for this study was defined as follows:
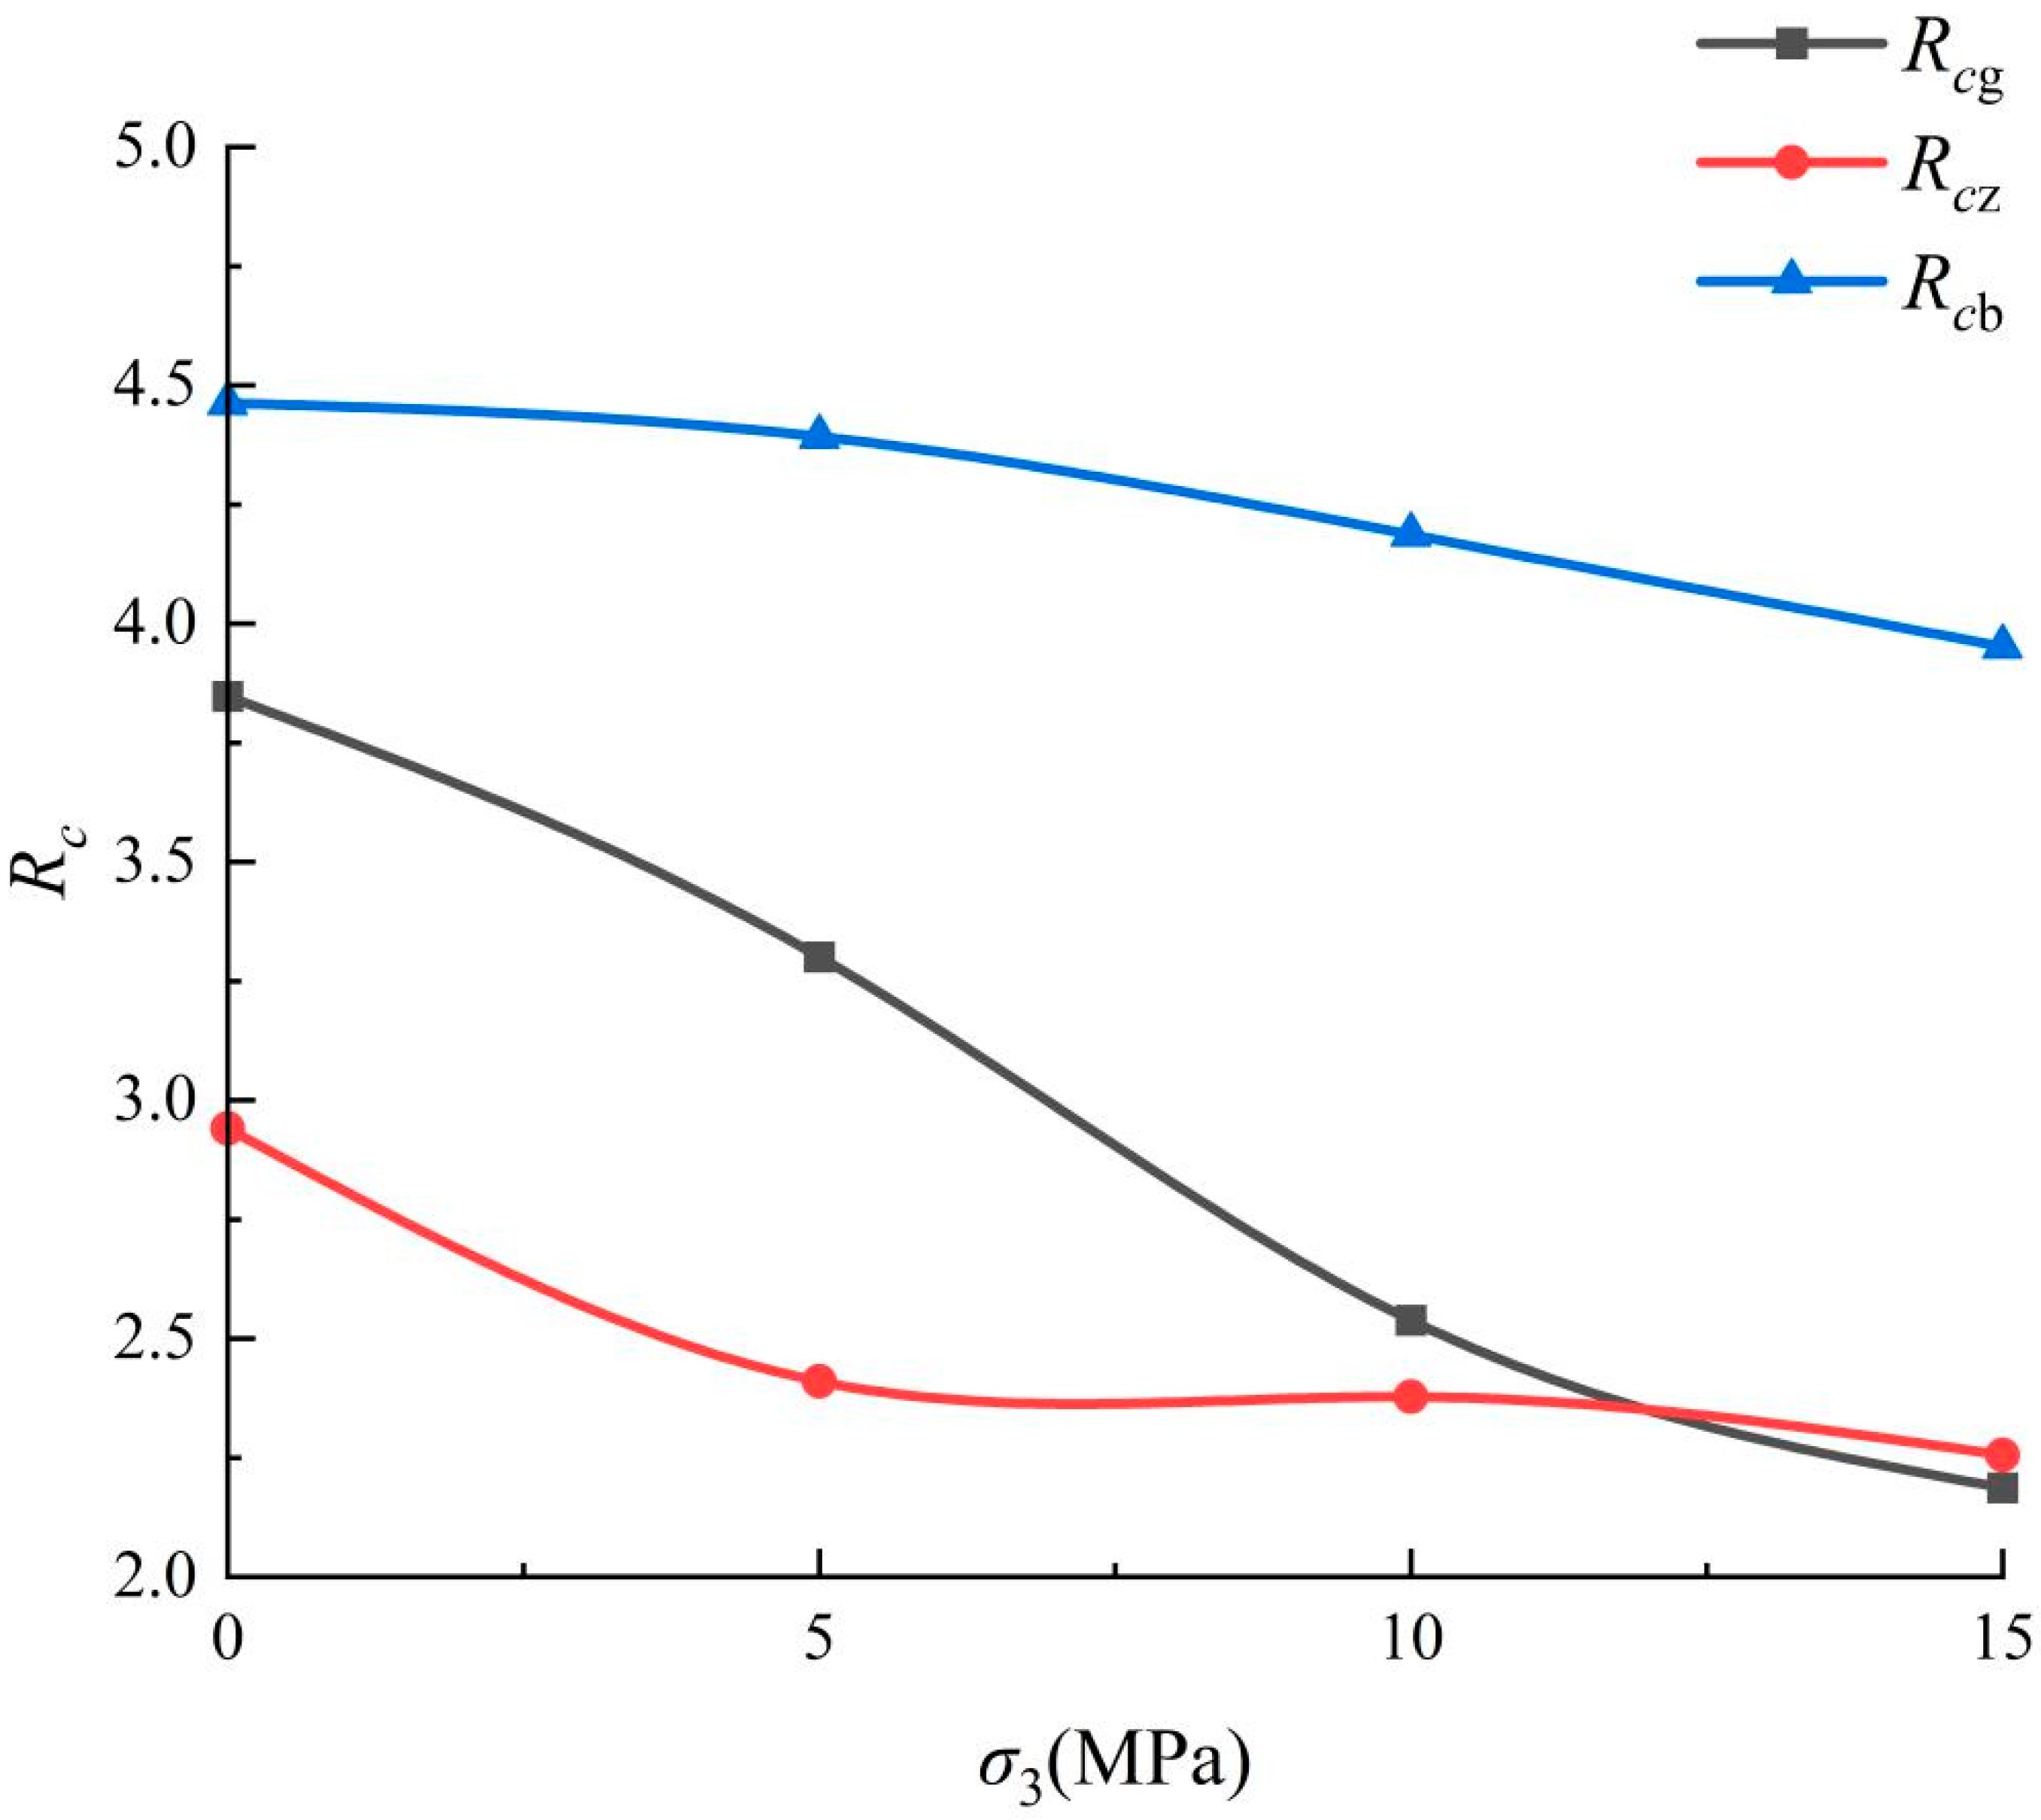
where Rc is the degree of anisotropy of compressive strength. Singh [30] believes that Rc is the ratio of the uniaxial compressive strength of the rock at β = 90° to its minimum at other bedding angles. In contrast, in this study, the maximum uniaxial compressive strength appears in both 0° and 90° samples, so Rc should be defined as the ratio of the maximum value to the minimum value of uniaxial compressive strength at a bedding angle of 0°–90°. Therefore, σcmax and σcmin are the maximum and minimum compressive strength values under the same water content and confining pressure. Rcg, Rcz, and Rcb are the anisotropy degrees in dry, natural, and saturated states.
Figure 11 indicates that the fracture joints along the bedding direction in slate become compacted under confining pressure, diminishing the displayed anisotropy. Thus, as confining pressure increases, the anisotropy degree gradually decreases. Under varying water contents, the order of anisotropy degrees is Rcb > Rcg > Rcz. This phenomenon may stem from the increased likelihood of water infiltration along fractures and pores between rock beddings in a saturated state, leading to the dissolution of some soluble minerals, an increase in microfractures, and pore enlargement, thereby enhancing the slate’s anisotropic properties. In line with the classification standard of anisotropy degrees for compressive strength of rock materials, the anisotropy degree of slate’s compressive strength in this study ranges from 2 to 5, indicating medium to high anisotropy.

Figure 11.
Compressive strength anisotropy curve.
4.2. Elastic Modulus Anisotropy
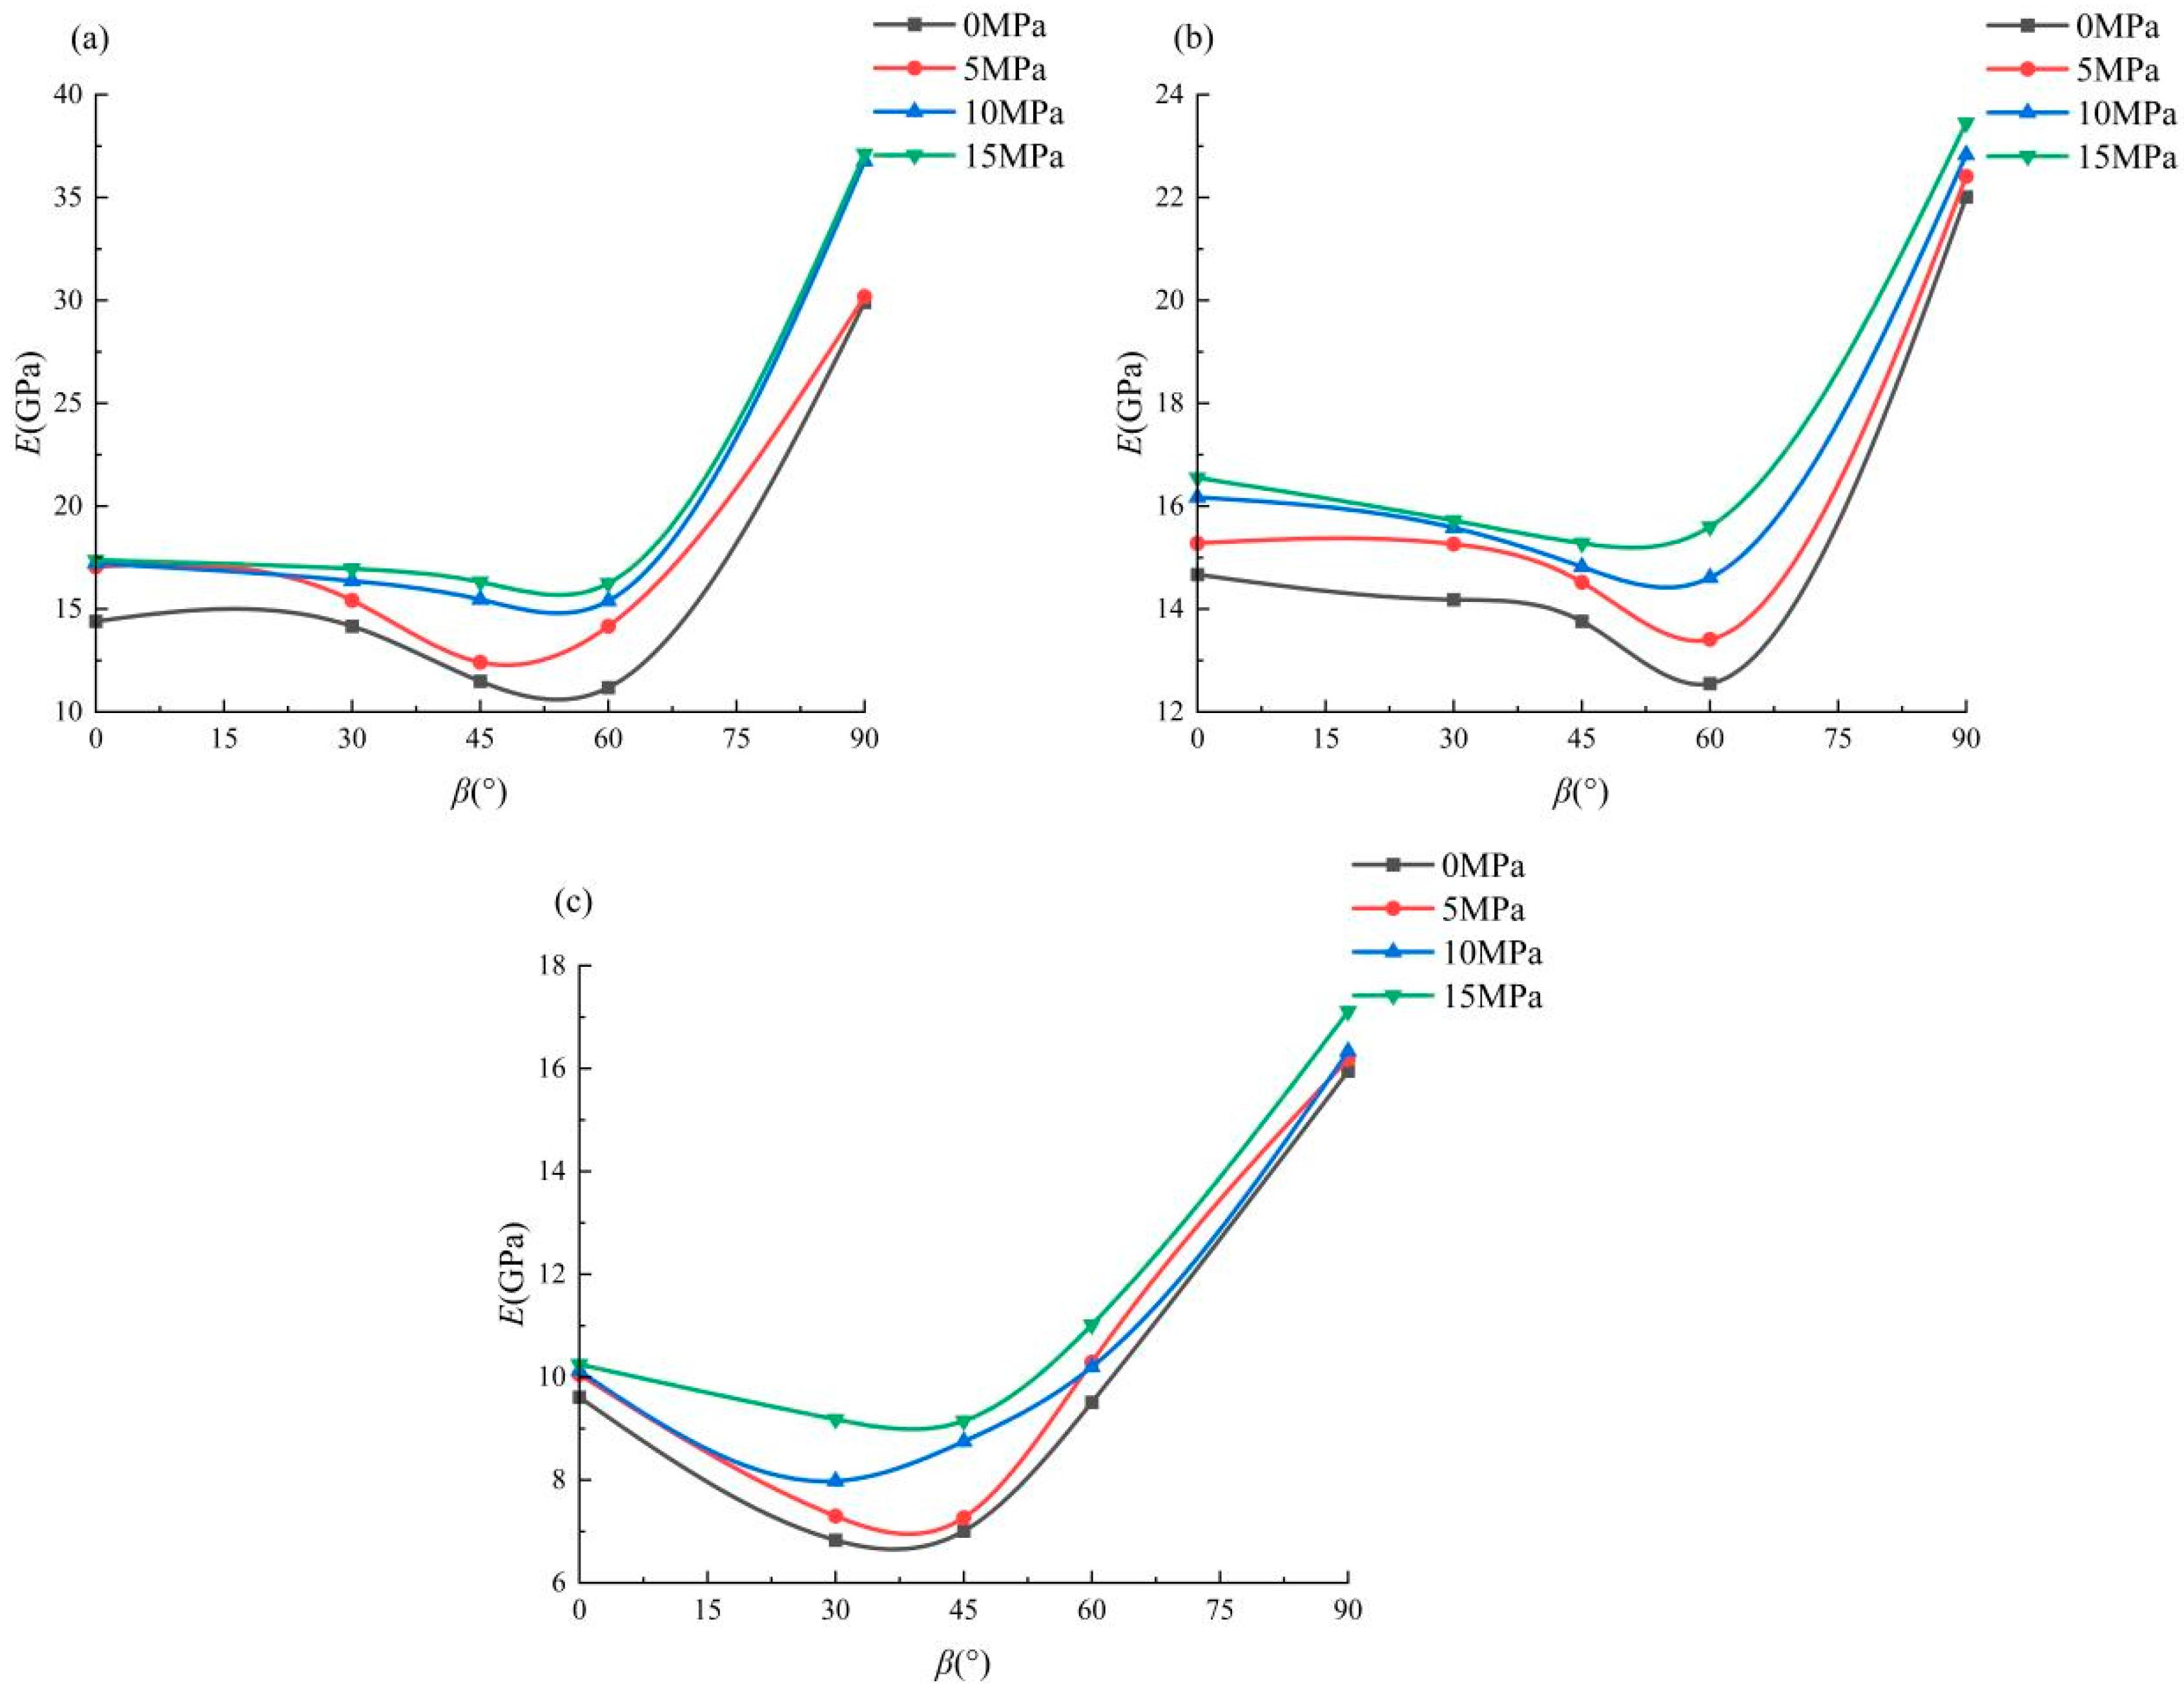
Figure 12 depicts the elastic modulus variation with bedding angle under different water contents and confining pressures. It illustrates that the elastic modulus’s variation curves with the bedding angle form a U shape. When the bedding angle is between 30° and 60°, the elastic modulus of the slate reaches a minimum, but the overall change in amplitude remains small. However, as the bedding angle nears 90°, the elastic modulus of slate increases sharply. The elastic modulus rises with confining pressure and falls with water content. This is because the increase in confining pressure compacts the bedding’s weak plane, enhancing the slate’s resistance to deformation. Conversely, exposure to water dissolves some mineral particles, and the lubrication from the water film between grains reduces friction, resulting in slate softening and a diminished resistance to deformation.
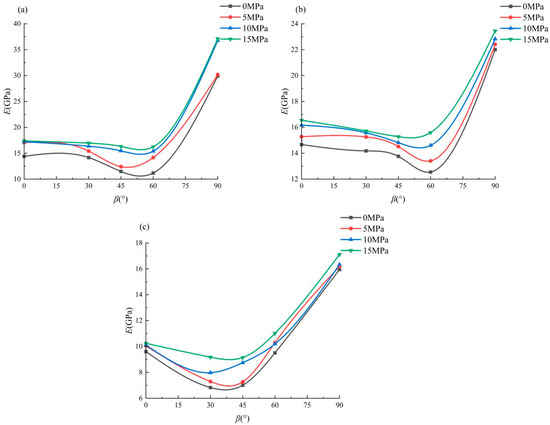
Figure 12.
Elastic modulus of slate with different bedding angles: (a) dry state, (b) natural state, and (c) saturated state.
Researchers lack a unified understanding of the trend in the variation of the elastic modulus of anisotropic rock masses with β. Some scholars [28,31,32] observe that the rock masses’ elastic modulus increases with β; others [10,33] note that the elastic modulus of slate varies in a U-shaped pattern with increasing β, akin to the findings from the tests in this study. From a microscopic perspective, this can relate to the mineral composition and the arrangement of microfractures between slate beddings. Macroscopically, the former group attributes the change in elastic modulus to the compaction effect: The bedding plane of the 0° sample is perpendicular to the axial compression direction, causing significant compaction of the fractures between bedding planes and large rock deformation; the 30°, 45°, and 60° samples exhibit partial compaction of fractures; the axial pressure exerts the least compacting effect on the 90° sample, so as the compaction effect weakens, the elastic modulus gradually increases. The latter group argues that although the axial compaction of the 0° sample is the most substantial, the strength of the 30°, 45°, and 60° samples at failure is lower than that of the 0° and 90° samples, resulting in a relatively small elastic modulus; the 90° sample supports the load through both the matrix and the bedding plane, thereby improving resistance to deformation. In this scenario, the strain caused by axial pressure is minimal, and the elastic modulus is at its highest.
The depiction of a transversely isotropic body within the global coordinate system is illustrated in Figure 13. In this representation, the z-axis is perpendicular to the bedding plane, while the x′-y′-z′ coordinate system results from rotating the x-y-z coordinate system clockwise by an angle β, using the y-axis as the axis of rotation. According to the generalized Hooke’s law, the stress–strain relationship for a transversely isotropic body is articulated in Equation (7). Here, σ and ε represent normal stress and strain, respectively, while τ and γ denote shear stress and strain. The elastic compliance matrix comprises five independent parameters. E1 and ν1 are the elastic modulus and Poisson’s ratio in the transversely isotropic plane, respectively. E2 and ν2 similarly represent the elastic modulus and Poisson’s ratio in the plane perpendicular to the transversely isotropic plane. G12 is the shear modulus on this perpendicular plane [34].
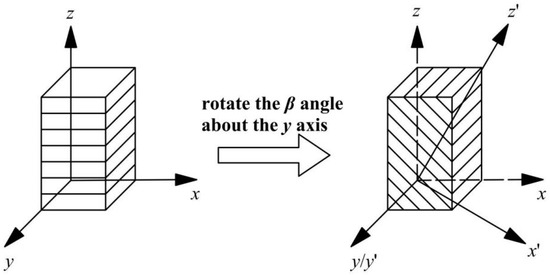
Figure 13.
Transversely isotropic body in the coordinate system.
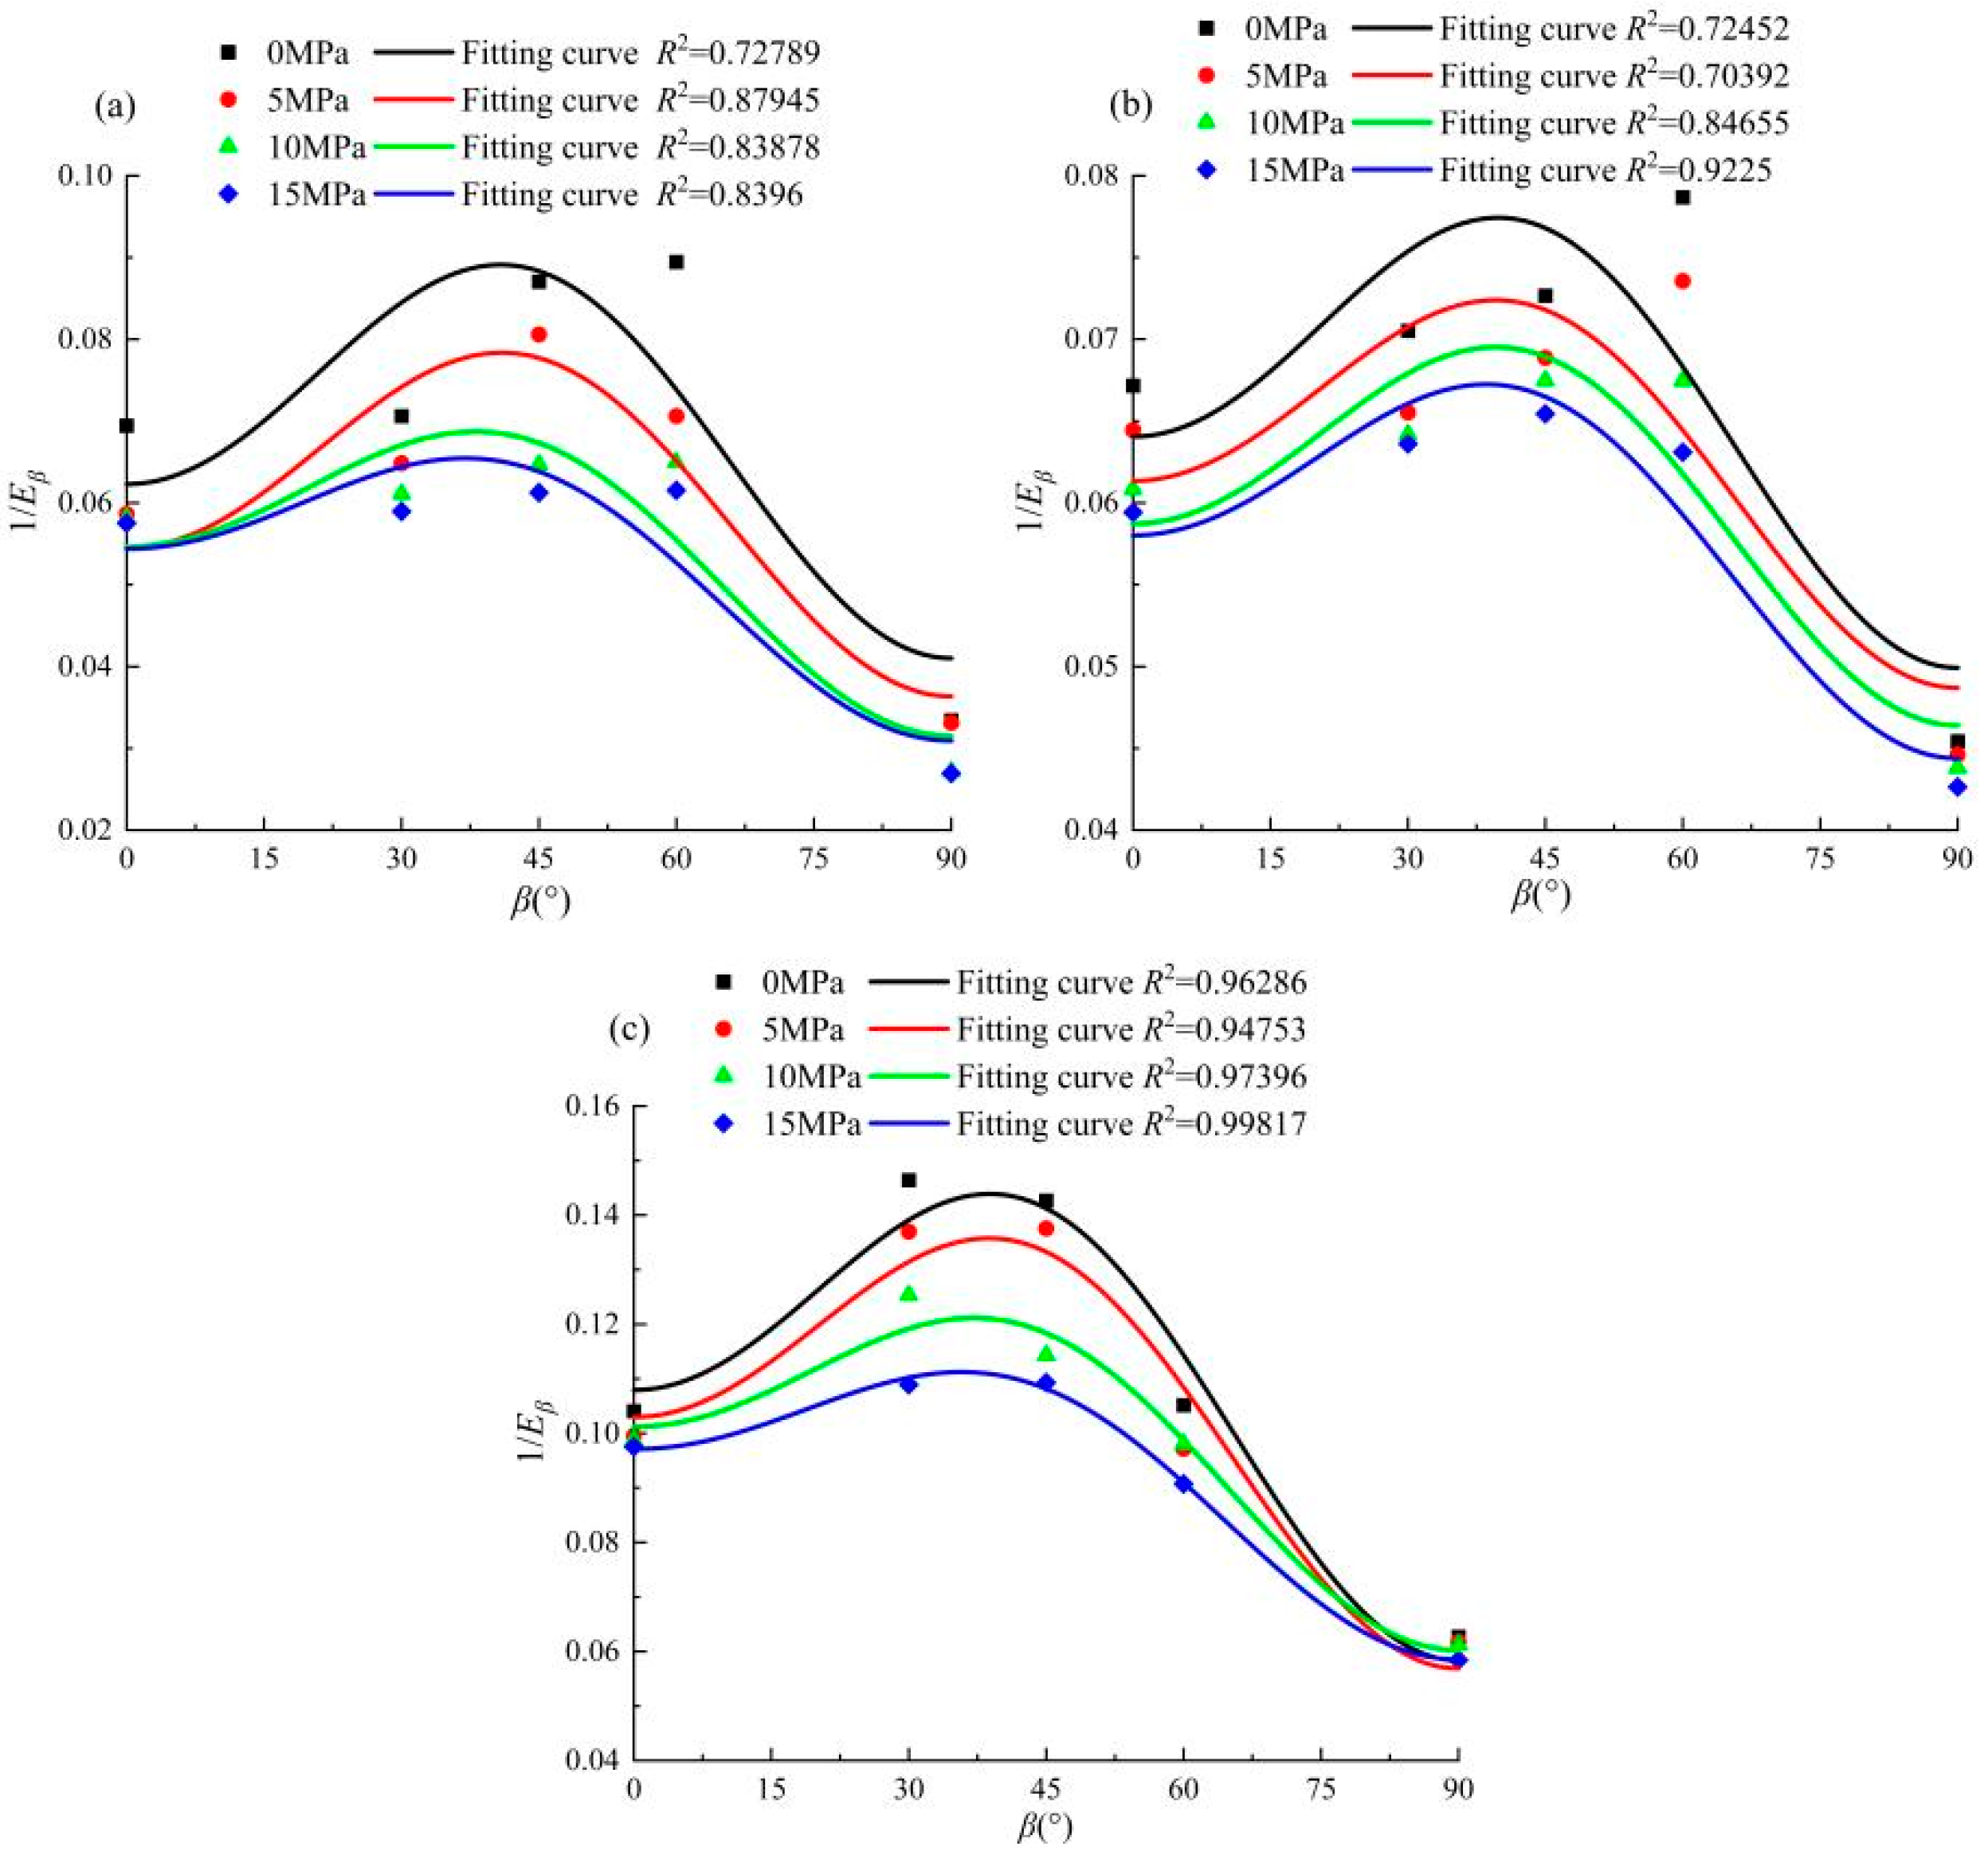
Equation (8) can be obtained by performing the coordinate transformation, where Eβ is the elastic modulus under the bedding angle β:
Simplification of Equation (8) yields Equation (9). S1 and S2 are both constants.
Based on these equations and the integration of test results, a relationship curve for the elastic modulus versus the bedding angle is predicted, as depicted in Figure 14. These results suggest that the curve more accurately describes the saturated slate. Observations of R2 under varying confining pressures reveal that, although R2 exhibits fluctuations, its overall trajectory is upward.
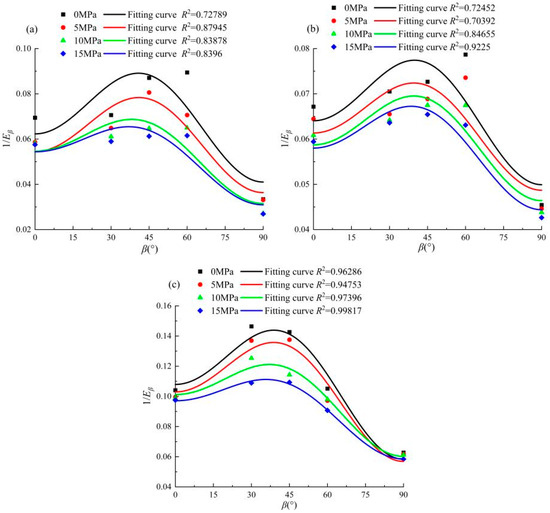
Figure 14.
Relationship curve between elastic modulus and bedding angle: (a) dry state, (b) natural state, and (c) saturated state.
This study defines the degree of anisotropy in the elastic modulus as RE = Emax/Emin, where Emax and Emin are the maximum and minimum elastic modulus values of the sample under identical conditions. The degrees of anisotropy in the elastic modulus for dry, natural, and saturated states are denoted as REg, REz, and REb, respectively. Calculations indicate that REg > REz > REb, with RE diminishing as confining pressure increases. This suggests that a lower anisotropy degree in slate correlates with greater consistency between measured and predicted elastic modulus values.
4.3. Poisson’s Ratio Anisotropy
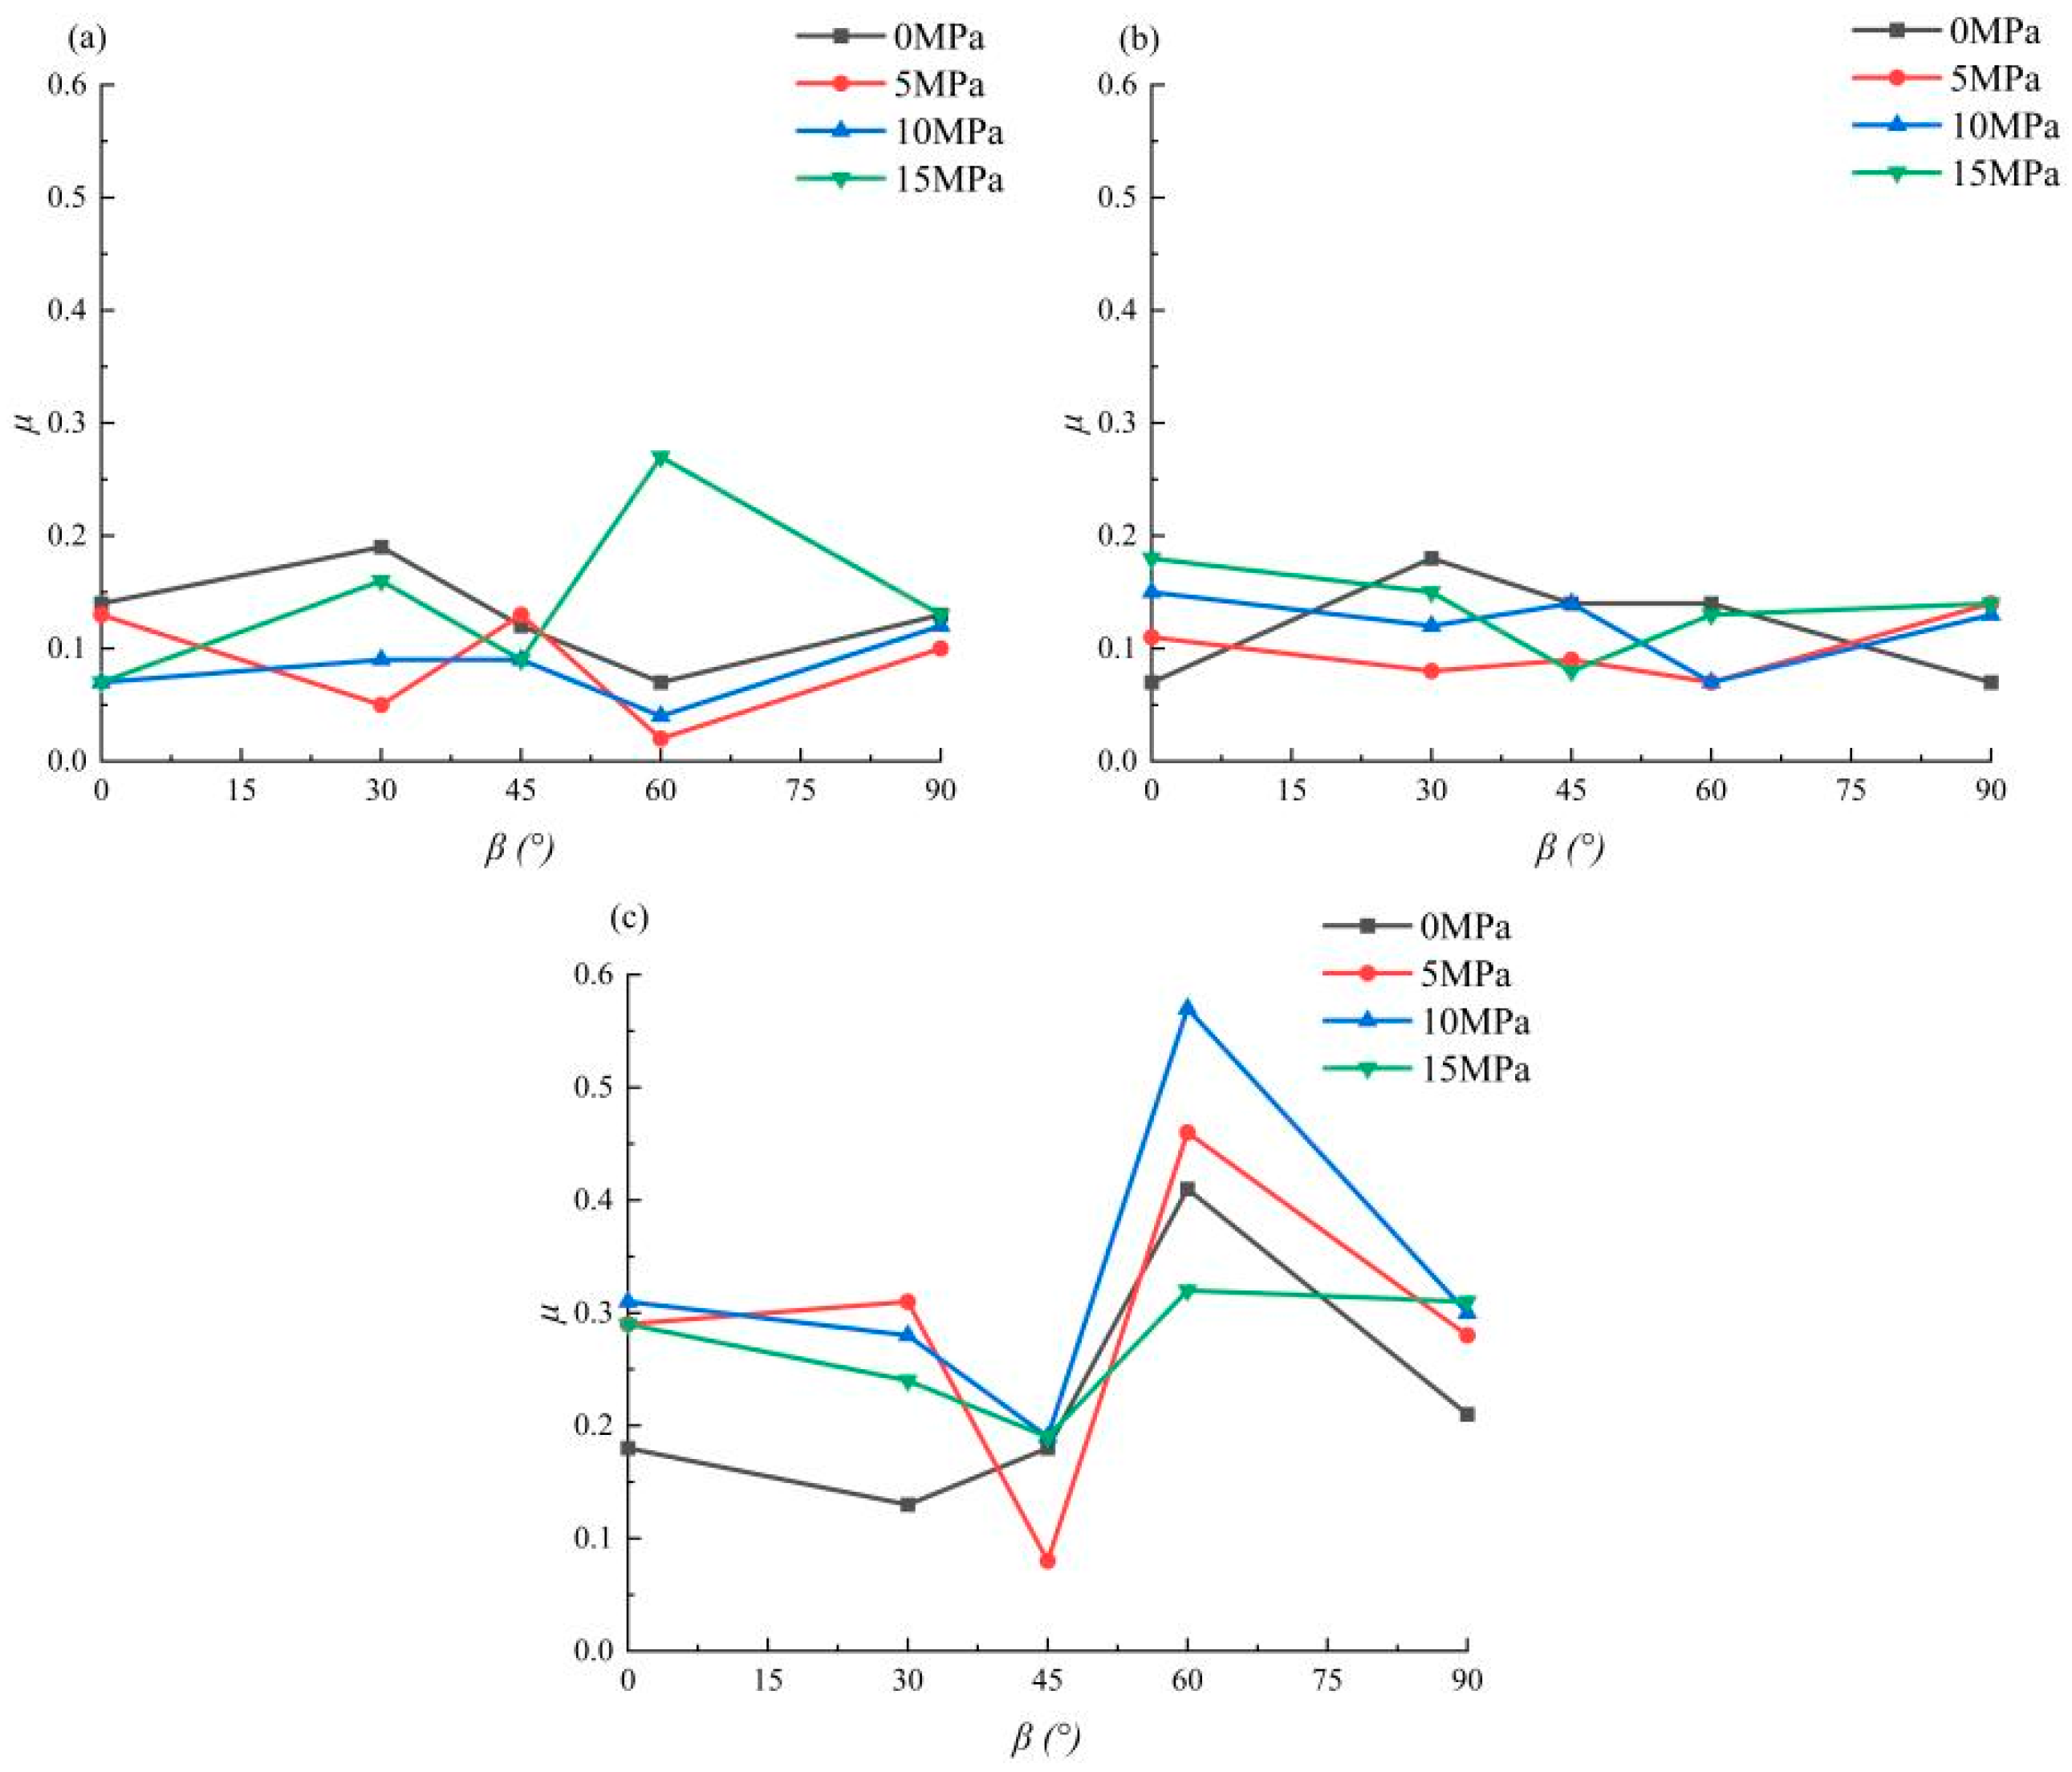
Figure 15 displays the variation in Poisson’s ratio with bedding angle. It shows that the Poisson’s ratio for slate alters with increasing bedding angle and confining pressure, although no distinct pattern emerges. Comparing different water contents reveals that the Poisson’s ratio in natural and dry states is relatively low, approximately 0.1, whereas in the saturated state, it is significantly higher, about 0.28. This difference indicates that water exposure deteriorates slate, diminishing its deformation resistance. Macroscopically, this is evidenced by increased hoop strain and a corresponding rise in Poisson’s ratio.
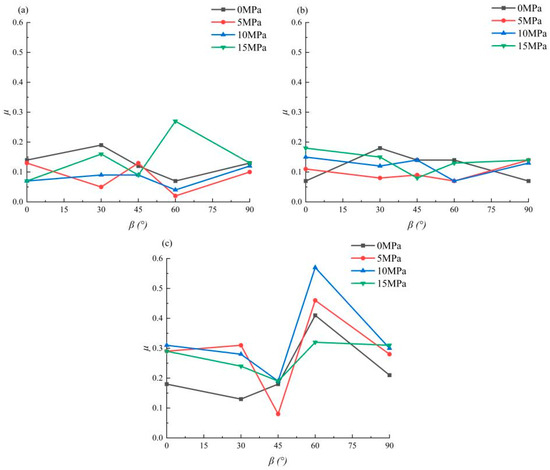
Figure 15.
Poisson’s ratio of slates with different bedding angles: (a) dry state, (b) natural state, and (c) saturated state.
4.4. Cohesion and Internal Friction Angle Anisotropy
Applying the Mohr–Coulomb criterion, the regression equation σ1 = b + mσ3 is derived. Constants m and b are determined by fitting test data to this equation. Substituting these values into Equation (10) allows for calculating the cohesion (c) and internal friction angle (φ) of the slate under different bedding angles and water contents.
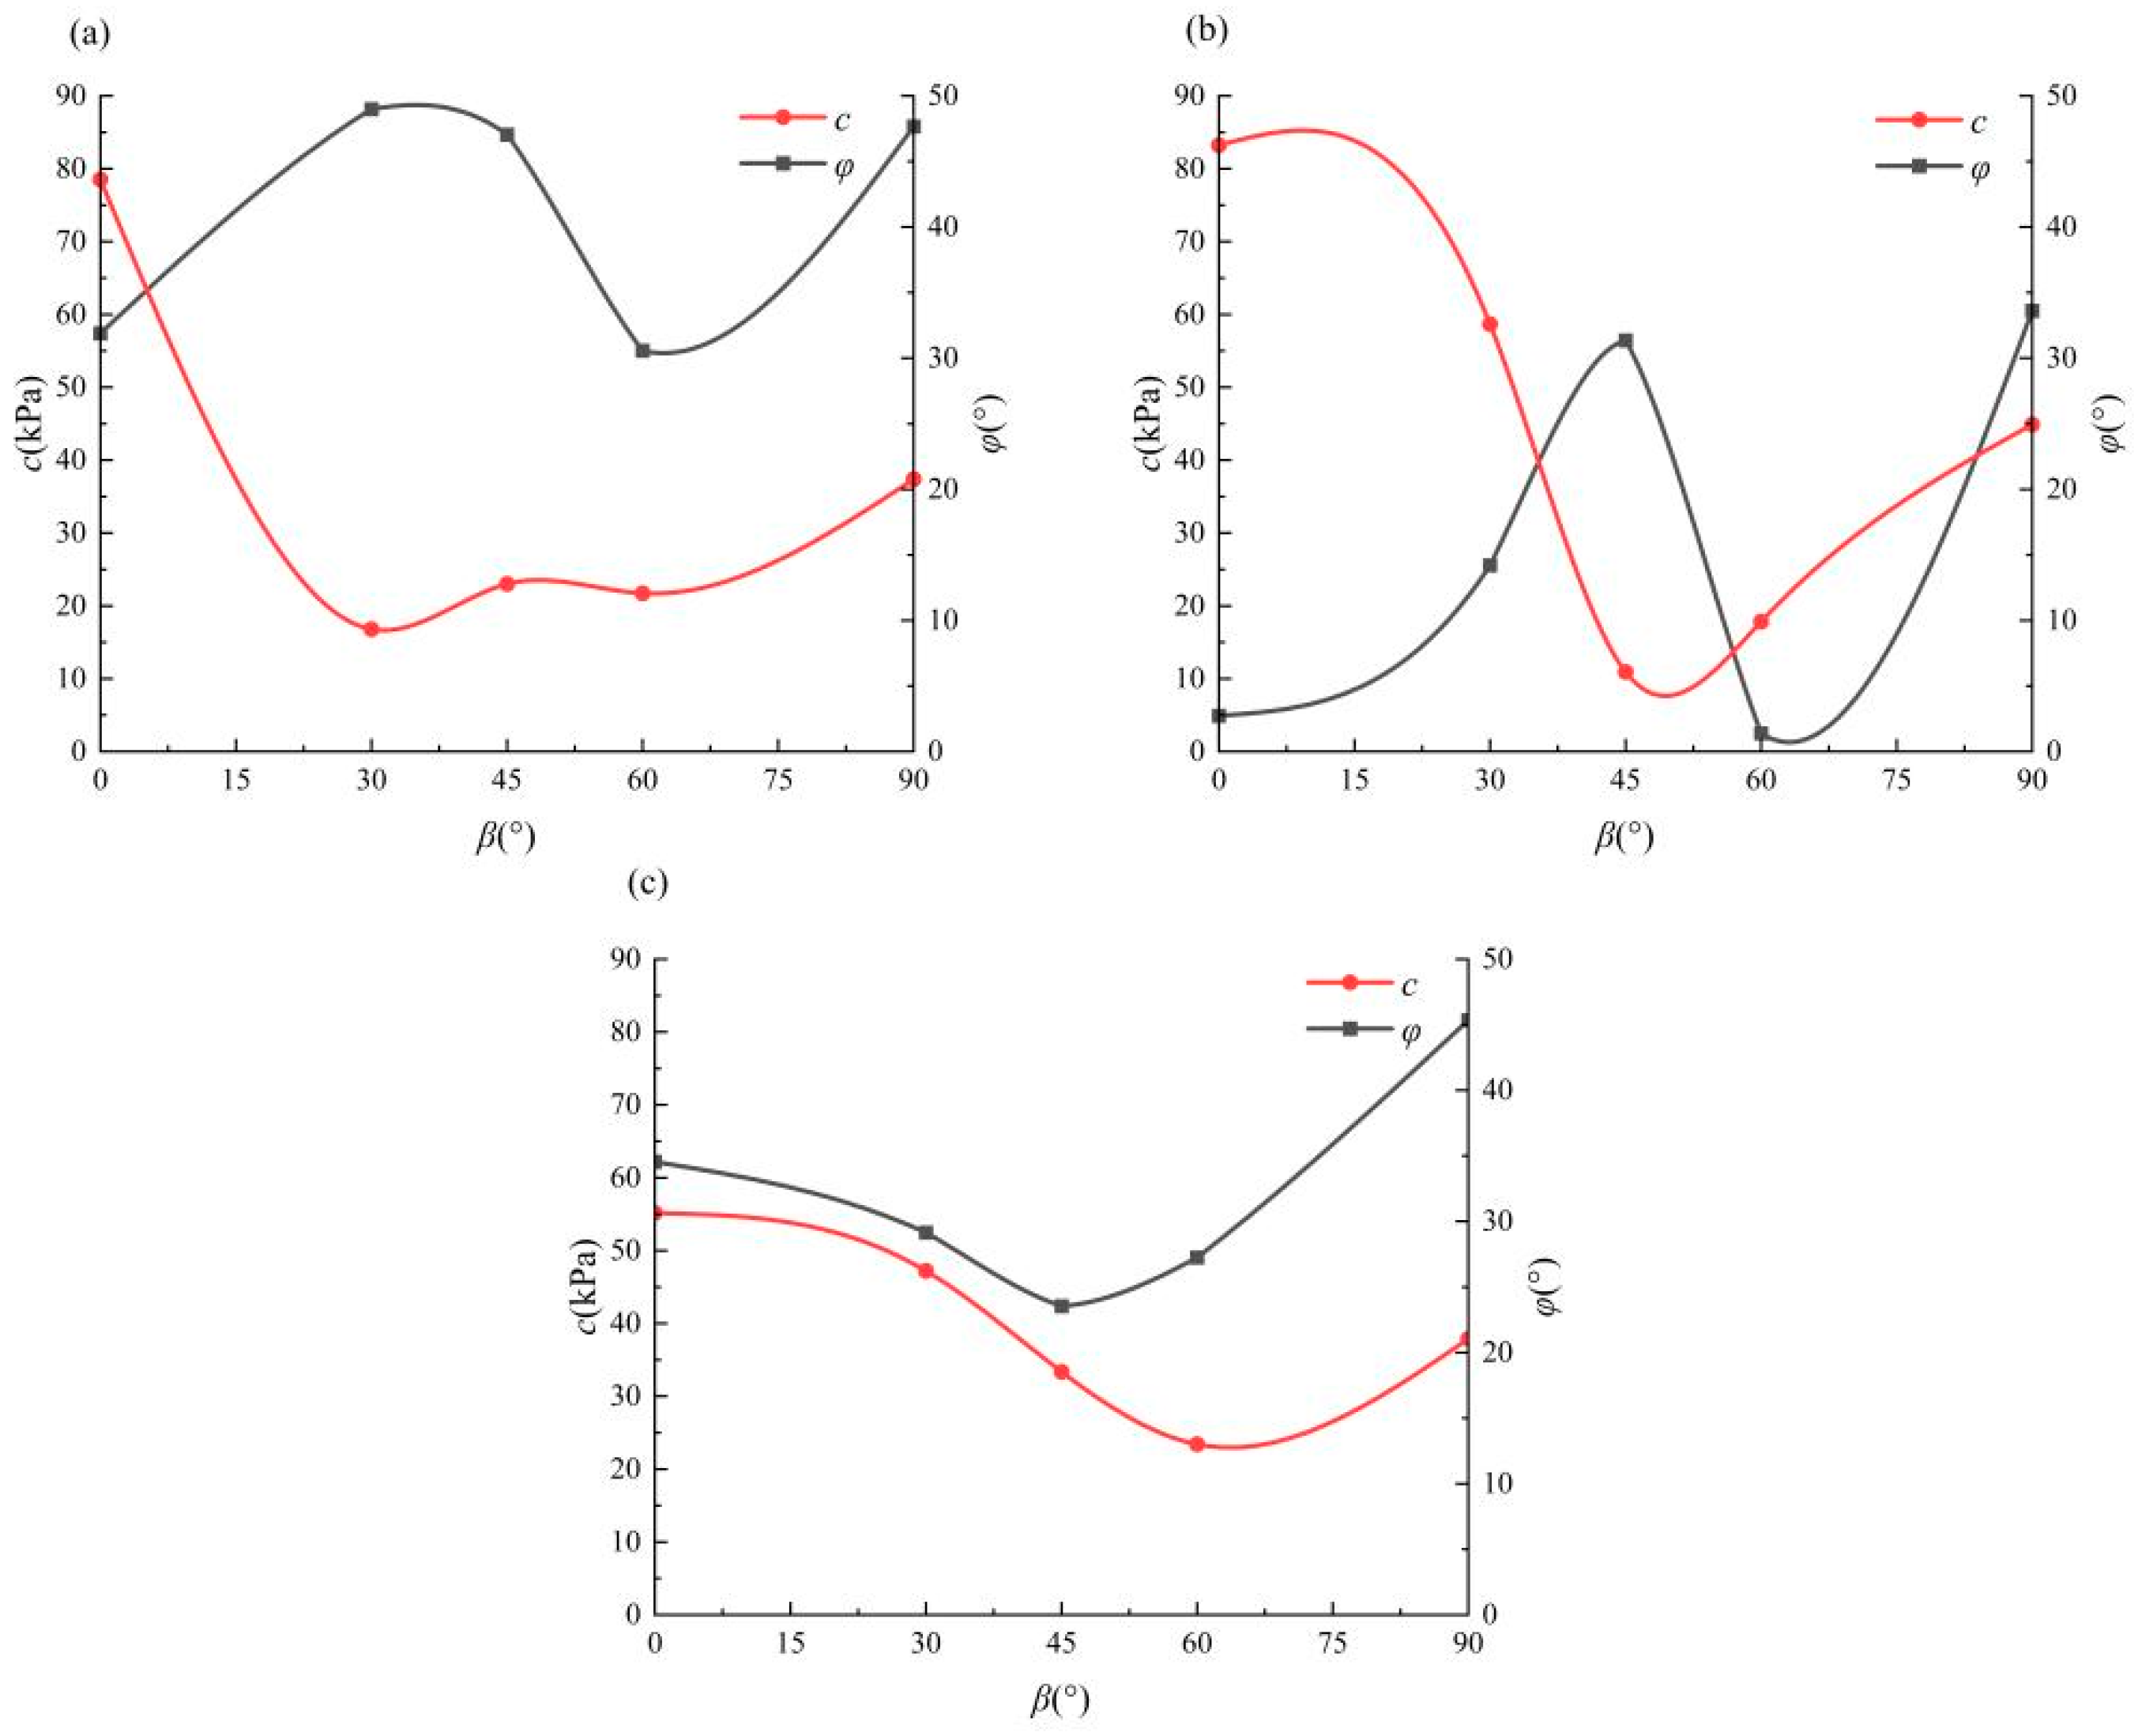
As illustrated in Figure 16, cohesion exhibits a U-shaped pattern as the bedding angle increases, showing significant anisotropy. Cohesion, indicative of the shear resistance of the failure surface, reflects the sample’s shear resistance. At β = 0° or 90°, the fracture surface typically intersects the bedding plane, hindering continuous fracture propagation and making it challenging for shear fractures to develop along this plane, thereby increasing cohesion. The overall variations in dry, natural, and saturated states are 61.73, 31.75, and 72.30 MPa, respectively. Notably, the variation amplitude in dry and saturated states is more pronounced than in the natural state, suggesting that water content significantly influences cohesion. Fluctuations are considerable between 0° and 45°, with decreases in dry, natural, and saturated states being 100%, 68.7%, and 100%, respectively. The internal friction angle in the natural state mirrors the cohesion trend, while in dry and saturated states, it follows an increase–decrease–increase pattern. Excluding two minimum values in saturated samples, the change amplitudes in other states hover around 18°, showing no marked difference, indicating that water content slightly affects the internal friction angle variation but significantly influences its trend.
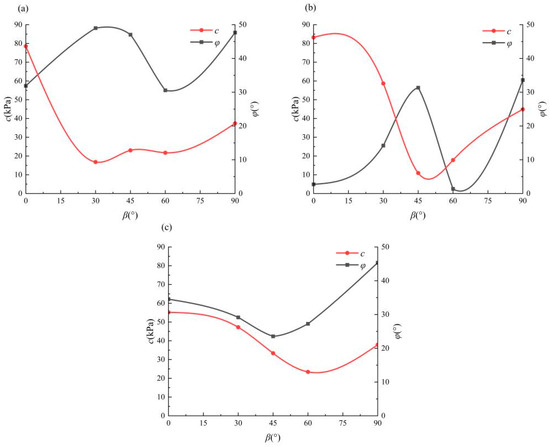
Figure 16.
Cohesive force and internal friction angle of slates with different bedding angles: (a) dry state, (b) natural state, and (c) saturated state.
5. Conclusions
This study conducts uniaxial and triaxial compression experiments on weathered slates from the Proterozoic Banxi Group in Changsha City, China. The analyses of stress-strain curves, deformation and failure modes, and mechanical parameters revealed the anisotropic characteristics of slate under varying water contents, bedding angles, and confining pressure conditions. The following conclusions can be drawn:
- Under uniaxial compression, the compaction stage of microfractures in slate is inconspicuous. The subsequent stable development stage of microelastic fractures is brief. When peak strength is reached, the stress sharply decreases, exhibiting characteristics consistent with brittle fracture. With applied confining pressure, slate compactness increases as confining pressure rises, restricting fracture development under loading and decelerating the failure process. This is macroscopically observed as a reduction in brittleness and an increase in plasticity.
- As water content increases, certain minerals dissolve along the bedding direction, increasing the number and size of microfractures and gradually reducing the peak strength of the sample. In this scenario, the bedding plane deteriorates more than the matrix, making the slate more susceptible to shear failure along the bedding direction. The yield stage becomes more pronounced in the stress–strain curve, and the post-peak stress reduction is slower.
- The failure mode of the slate strongly correlates with the bedding angle. Samples at 0° typically exhibit splitting shear failure through the bedding plane; those at 30° primarily experience shear failure through the matrix; samples at 45° demonstrate both failure along the bedding plane and partial shear failure along it; all failure modes of the 60° samples involve shear failure along the bedding plane; the 90° samples predominantly fail by splitting tension.
- As the bedding angle increases, the compressive strength of the slate displays a U-shaped trend, with higher values at both ends and a lower value in the middle. Incorporating the anisotropic parameter, the Hoek–Brown formula more accurately predicts slates’ uniaxial and triaxial compressive strengths with different bedding angles. The anisotropic properties of slate compressive strength vary with confining pressure and water content: They diminish as confining pressure compacts the microfractures between weak slate bedding planes and intensify as water infiltrates fractures and pores between beddings, exacerbating deterioration responses. The slate in this study exhibits medium to high anisotropy.
- Currently, two trends are observed in the variation of elastic modulus: one is proportional to the bedding angle, and the other follows a U-shaped curve. The elastic modulus of slate in this study forms a U-shaped pattern with the bedding angle; however, the change is minor between 0° and 60° and becomes pronounced at 90°. Utilizing the generalized Hooke’s Law to describe the curve between elastic modulus and bedding angle and comparing R2 under various water contents and confining pressures, it is evident that a lower degree of anisotropy in the elastic modulus indicates better agreement between the calculated and actual values.
- The Poisson’s ratio and internal friction angle of slate remain relatively unchanged at different bedding angles, while cohesion follows a U-shaped pattern with increasing bedding angle. All three are influenced by water content, notably in Poisson’s ratio value, the trend of internal friction angle variation, and the range of cohesion changes. These aspects exhibit significant differences under varying water contents.
Author Contributions
Conceptualization, methodology, software, writing—original draft preparation, X.Y. and J.L. (Jinshan Lei); project administration, supervision, resources, Y.Z.; writing—review and editing, J.L. (Jiahua Li); validation, formal analysis, investigation, X.L., C.X. and X.H. All authors have read and agreed to the published version of the manuscript.
Funding
This article was supported the National Natural Science Foundation of Hunan Province, China (2017JJ2316).
Institutional Review Board Statement
Not applicable.
Informed Consent Statement
Not applicable.
Data Availability Statement
The raw data supporting the conclusions of this article will be made available by the authors on request.
Conflicts of Interest
Author Yongguan Zhang was employed by the company Guangzhou Metro Design & Research Institute Co., Ltd. The remaining authors declare that the research was conducted in the absence of any commercial or financial relationships that could be construed as a potential conflict of interest.
References
- Kuila, U.; Dewhurst, D.N.; Siggins, A.F.; Ravenet, M.D. Stress anisotropy and velocity anisotropy in low porosity shale. Tectonophysics 2011, 503, 34–44. [Google Scholar] [CrossRef]
- Attewell, P. Triaxial anisotropy of wave velocity and elastic moduli in slate and their axial concordance with fabric and tectonic symmetry. Int. J. Rock Mech. Min. Sci. Géoméch. Abstr. 1970, 7, 193–207. [Google Scholar] [CrossRef]
- Homand, F.; Morel, E.; Henry, J.-P.; Cuxac, P.; Hammade, E. Characterization of the moduli of elasticity of an anisotropic rock using dynamic and static methods. Int. J. Rock Mech. Min. Sci. Géoméch. Abstr. 1993, 30, 527–535. [Google Scholar] [CrossRef]
- Cho, J.-W.; Kim, H.; Jeon, S.; Min, K.-B. Deformation and strength anisotropy of Asan gneiss, Boryeong shale, and Yeoncheon schist. Int. J. Rock Mech. Min. Sci. 2012, 50, 158–169. [Google Scholar] [CrossRef]
- Wu, R.; Li, H.; Li, X.; Xia, X.; Liu, L. Experimental study and numerical simulation of the dynamic behavior of transversely isotropic phyllite. Int. J. Géoméch. 2020, 20, 04020105. [Google Scholar] [CrossRef]
- Debecker, B.; Vervoort, A. Experimental observation of fracture patterns in layered slate. Int. J. Fract. 2009, 159, 51–62. [Google Scholar] [CrossRef]
- Tavallali, A.; Vervoort, A. Failure of layered sandstone under brazilian test conditions: Effect of micro-scale parameters on macro-scale behaviour. Rock Mech. Rock Eng. 2010, 43, 641–653. [Google Scholar] [CrossRef]
- Li, Z.; Xu, G.; Dai, Y.; Zhao, X.; Fu, Y. Effects of foliation on deformation and failure mechanism of silty slates. Int. J. Rock Mech. Min. Sci. 2021, 141, 104703. [Google Scholar] [CrossRef]
- Liu, P.; Liu, Q.; Deng, P.; Pan, Y.; Lei, Y.; Du, C.; Xie, X. Anisotropic shearing mechanism of Kangding slate: Experimental investigation and numerical analysis. J. Rock Mech. Geotech. Eng. 2023, in press. [Google Scholar] [CrossRef]
- Hao, X.; Wang, S.; Xu, Q.; Yang, D.; Zhang, Q.; Jin, D.; Wei, Y. Influences of confining pressure and bedding angles on the deformation, fracture and mechanical characteristics of slate. Constr. Build. Mater. 2020, 243, 118255. [Google Scholar] [CrossRef]
- Li, H.; Lai, B.; Qin, S.; Yu, H.; Shao, K.; Li, B.; Konggidinata, M.I. The effects of water content on transversely isotropic properties of organic rich gas shale. J. Nat. Gas Sci. Eng. 2020, 83, 103574. [Google Scholar] [CrossRef]
- Wasantha, P.; Ranjith, P.; Shao, S. Energy monitoring and analysis during deformation of bedded-sandstone: Use of acoustic emission. Ultrasonics 2014, 54, 217–226. [Google Scholar] [CrossRef] [PubMed]
- Mashhadiali, N.; Molaei, F. Theoretical and experimental investigation of a shear failure model for anisotropic rocks using direct shear test. Int. J. Rock Mech. Min. Sci. 2023, 170, 105561. [Google Scholar] [CrossRef]
- Cheng, J.; Wan, Z.; Zhang, Y.; Li, W.; Peng, S.S.; Zhang, P. Experimental study on anisotropic strength and deformation behavior of a coal measure shale under room dried and water saturated conditions. Shock. Vib. 2015, 8, 290293. [Google Scholar] [CrossRef]
- Zhang, Q.; Fan, X.; Chen, P.; Ma, T.; Zeng, F. Geomechanical behaviors of shale after water absorption considering the combined effect of anisotropy and hydration. Eng. Geol. 2020, 269, 105547. [Google Scholar] [CrossRef]
- Zhang, J.; Zhang, X.; Chen, W.; Huang, Z.; Du, R. A constitutive model of freeze–thaw damage to transversely isotropic rock masses and its preliminary application. Comput. Geotech. 2022, 152, 105056. [Google Scholar] [CrossRef]
- Li, D.; Wong, L.N.Y.; Liu, G.; Zhang, X. Influence of water content and anisotropy on the strength and deformability of low porosity meta-sedimentary rocks under triaxial compression. Eng. Geol. 2012, 126, 46–66. [Google Scholar] [CrossRef]
- GB/T 50266-2013; China Electricity Council. Test Method Standard of Engineering Rock Mass. China Planning Press: Beijing, China, 2013.
- Liu, J.; Qiao, L.; Li, Y.; Li, Q.; Fan, D. Experimental study on the quasi-static loading rate dependency of mixed-mode I/II fractures for marble rocks. Theor. Appl. Fract. Mech. 2022, 121, 103431. [Google Scholar] [CrossRef]
- Yang, J.S.; Yang, S.Q.; Zhang, J.S. Rock Mass Mechanics; China Machine Press: Beijing, China, 2008. [Google Scholar]
- Lei, Y.; Liu, Q.; Liu, H.; Chu, Z.; Liu, P.; Wen, J. An updated Lagrangian framework with quadratic element formulations for FDEM. Comput. Geotech. 2023, 164, 105837. [Google Scholar] [CrossRef]
- Lei, Y.; Liu, Q.; Wen, J.; Chu, Z.; Liu, H.; Du, C. An efficient Kriging-based calibration framework for FDEM. Eng. Fract. Mech. 2024, 296, 109857. [Google Scholar] [CrossRef]
- Ren, C.; Yu, J.; Liu, X.; Zhang, Z.; Cai, Y. Cyclic constitutive equations of rock with coupled damage induced by compaction and cracking. Int. J. Min. Sci. Technol. 2022, 32, 1153–1165. [Google Scholar] [CrossRef]
- Brown, E.T.; Hoek, E. Underground Excavations in Rock; The Institute of Mining and Metallurgy: London, UK, 1980; pp. 252–270. [Google Scholar]
- Hoek, E.; Carranza-Torres, C.; Corkum, B. Hoek-Brown failure criterion-2002 edition. In Proceedings of the NARMS-TAC Conference; University of Toronto Press: Toronto, ON, Canada, 2002; pp. 267–273. [Google Scholar]
- Zhang, Q.; Yao, B.; Fan, X.; Li, Y.; Li, M.; Zeng, F.; Zhao, P. A modified Hoek-Brown failure criterion for unsaturated intact shale considering the effects of anisotropy and hydration. Eng. Fract. Mech. 2021, 269, 105547. [Google Scholar] [CrossRef]
- Gomes, G.J.; Forero, J.H.; Vargas, E.A., Jr.; Vrugt, J.A. Bayesian inference of rock strength anisotropy: Uncertainty analysis of the Hoek–Brown failure criterion. Int. J. Rock Mech. Min. Sci. 2021, 148, 104952. [Google Scholar] [CrossRef]
- Heng, S.; Yang, C.H.; Zhang, B.P.; Guo, Y.T.; Wang, L.; Wei, Y.L. Experimental study on anisotropy characteristics of shale. Rock Soil Mech. 2015, 36, 609–616. (In Chinese) [Google Scholar] [CrossRef]
- Ramamurthy, T. Strength and modulus responses of anisotropic rocks. Compressive Rock Eng. 1993, 1, 313–329. [Google Scholar]
- Singh, J.; Ramamurthy, T.; Rao, G.V. Strength anisotropies in rocks. Indian Geotech. J. 1989, 19, 147–166. [Google Scholar]
- Heng, S.; Li, X.; Liu, X.; Chen, Y. Experimental study on the mechanical properties of bedding planes in shale. J. Nat. Gas Sci. Eng. 2020, 76, 103161. [Google Scholar] [CrossRef]
- Jin, Z.; Li, W.; Jin, C.; Hambleton, J.; Cusatis, G. Anisotropic elastic, strength, and fracture properties of Marcellus shale. Int. J. Rock Mech. Min. Sci. 2018, 109, 124–137. [Google Scholar] [CrossRef]
- Duan, X.; Wang, W.; Liu, S.; Cao, Y.; Zheng, Z.; Zhu, Q. Experimental investigation on mechanical behavior, energy evolution and gas permeability of anisotropic phyllite subjected to triaxial compression and cyclic loading. Géoméch. Energy Environ. 2023, 35, 100483. [Google Scholar] [CrossRef]
- Song, F.; González-Fernández, M.A.; Rodriguez-Dono, A.; Alejano, L.R. Numerical analysis of anisotropic stiffness and strength for geomaterials. J. Rock Mech. Geotech. Eng. 2023, 15, 323–338. [Google Scholar] [CrossRef]


Disclaimer/Publisher’s Note: The statements, opinions and data contained in all publications are solely those of the individual author(s) and contributor(s) and not of MDPI and/or the editor(s). MDPI and/or the editor(s) disclaim responsibility for any injury to people or property resulting from any ideas, methods, instructions or products referred to in the content. |
© 2024 by the authors. Licensee MDPI, Basel, Switzerland. This article is an open access article distributed under the terms and conditions of the Creative Commons Attribution (CC BY) license (https://creativecommons.org/licenses/by/4.0/).